comprehensive annual financial report tolleson
TRANSCRIPT

Comprehensive Annual
Financial Report
Fiscal Year Ended June 30, 2019
TOLLESON
CARING· COLLABORATION· EQUITY· INCLUSION· INSPIRE


CITY OF TOLLESON, ARIZONA
COMPREHENSIVE ANNUAL FINANCIAL REPORT
FOR THE FISCAL YEAR ENDED JUNE 30, 2019
Prepared by: City of Tolleson Finance Department
9555 W. Van Buren Tolleson, Arizona 85353


TABLE OF CONTENTS
I. INTRODUCTORY SECTION Page Letter of Transmittal i GFOA Certificate of Achievement vi List of Principal Officials vii Organizational Chart viii II. FINANCIAL SECTION Independent Auditors’ Report 1 Management’s Discussion & Analysis 7
A. Basic Financial Statements Government-wide Financial Statements Statement of Net Position 17 Statement of Activities 18 Fund Financial Statements Governmental Fund Financial Statements Balance Sheet 22 Reconciliation of the Balance Sheet to the Statement of Net Position 25 Statement of Revenues, Expenditures and Changes in Fund Balances 26
Reconciliation of the Statement of Revenues, Expenditures, and Changes in Fund Balances of Governmental Funds to the Statement of Activities 28
General Fund Statement of Revenues, Expenditures, and Changes in Fund Balances- Budget and Actual 29 Public Safety Tax Fund Statement of Revenues, Expenditures, and Changes in Fund Balances – Budget and Actual 30 Proprietary Fund Financial Statements Statement of Net Position 33 Statement of Revenues, Expenses and Changes in Fund Net Position 35 Statement of Cash Flows 36 Notes to Financial Statements 1. Summary of Significant Accounting Policies 41 2. Cash and Investments 49 3. Receivables 55 4. Capital Assets 56 5. Long-Term Debt 58 6. Interfund Receivables, Payables and Transfers 60 7. Pensions 60 8. Commitments 78 9. Risk Management 78 10. Restatement 79

Page B. Required Supplementary Information
Schedule of the City’s Proportionate Share of the Net Pension Liability Cost-Sharing Pension Plan 83 Schedule of Changes in the City’s Net Pension Liability and Related Ratios Agent Pension Plan 84 Schedule of the City Pension Contributions 86 Notes to Pension Plan Schedules 87
C. Other Supplementary Information
Budgetary Comparison Schedules – Major Funds Capital Improvements Fund 91
Debt Service Fund 92
Non-major Government Funds Financial Statements Combining Balance Sheet 95 Combining Statement of Revenues, Expenditures, and Changes in Fund Balances 96 Budgetary Comparison Schedules – Non-major Funds Highway User Revenue Fund 99 Grants Fund 100 III. STATISTICAL SECTION Page 1 Net Position by Component 102 2 Changes in Net Position 104 3 Fund Balances of Governmental Funds 108 4 Changes in Fund Balances of Governmental Funds 110 5 General Government Tax Revenues By Source 115 6 Assess Value and Estimated Actual Value of Taxable Property 116 7 Property Tax Rates Direct and Overlapping Governments 118 8 Principal Property Taxpayers 119 9 Property Tax Levies and Collections 121 10 Taxable Sales by Category 122 11 Direct and Overlapping Sales Tax Rates 125 12 Ratio of Outstanding Debt by Type 126 13 Ratios of General Bonded Debt Outstanding 128 14 Direct and Overlapping Governmental Activities Debt 129 15 Calculation of Legal Debt Margin 131 16 Legal Debt Margin Information 132 17 Pledged-Revenue Coverage 134 18 Demographic and Economic Statistics 136 19 Principal Employers 137 20 Full-Time Equivalent Employee by Function 139 21 Operating Indicators by Function 140 22 Capital Asset Statistics by Function 142 23 Property Valuations 144 24 Secondary Valuations as a Percentage of Estimated Valuations 145 25 Secondary Valuations by Legal Class 146 26 Secondary Valuations by Major Taxpayer 147

IV. COMPLIANCE SECTION Independent Auditors’ Report on Internal Control over Financial Reporting and on Compliance and Other Matters Based on an Audit of Financial Statements Performed in Accordance with Government Auditing Standards 151 Schedule of Findings 153 Corrective Action Plan 155


Introductory Section


October 23, 2019
Honorable Mayor, Members of the City Council, and Citizens of the City of Tolleson, Arizona:
State statutes require that cities and towns publish a complete set of financial statements presented in conformity with accounting principles generally accepted in the United States of America and audited in accordance with auditing standards generally accepted in the United States by a certified public accounting firm licensed in the State of Arizona. Pursuant to that requirement, we hereby issue the annual financial report of the City of Tolleson, Arizona for the fiscal year ended June 30, 2019.
This report consists of senior management’s representations concerning the finances of the City. Consequently, senior management assumes full responsibility for the completeness and reliability of all of the information presented in this report. To provide a reasonable basis for making these representations, management of the City has established a comprehensive internal control framework that is designed to protect both the City’s assets from loss, theft, or misuse and to compile sufficient reliable information for the preparation of the City’s financial statements in conformity with accounting principles generally accepted in the United States of America. Because the cost of internal controls should not outweigh their benefits, the City’s comprehensive framework of internal controls has been designed to provide reasonable rather than absolute assurance that the financial statements will be free from material misstatement. As management, we assert that to the best of our knowledge and belief, this financial report is complete and reliable in all material respects.
The City’s financial statements have been audited by Henry & Horne, LLP, a certified public accounting firm. The goal of the independent audit was to provide reasonable assurance that the financial statements of the City for the fiscal year ended June 30, 2019, are free of material misstatement. The independent audit involved examining, on a test basis, evidence supporting the amounts and disclosures in the financial statements; assessing the accounting principles used and significant estimates made by management; and evaluating the overall financial statement presentation. The independent auditor concluded, based upon the audit, that there was a reasonable basis for rendering an unmodified opinion that the City’s financial statements for the fiscal year ended June 30, 2019, are fairly presented in conformity with accounting principles generally accepted in the United States of America. The independent auditors’ report is presented as the first component of the financial section of this report.
Accounting principles generally accepted in the United States of America require that management provide a narrative introduction, overview, and analysis to accompany the basic financial statements in the form of Management’s Discussion and Analysis (MD&A). This letter of transmittal is designed to complement the MD&A and should be read in conjunction with it. The City’s MD&A can be found immediately following the report of the independent auditors.
i

Profile of the City
The City of Tolleson, founded in 1929, operates under a Council-Manager form of government. The Mayor and six City Council members are elected at large on a non-partisan ballot and serve overlapping four-year terms. The City Council is vested with policy and legislative authority and is responsible for passing ordinances; adopting the budget; appointing commission board members; and appointing the positions of City Manager, City Attorney, and Presiding Judge. The City Manager is responsible for carrying out the policies and ordinances of the City Council, as well as overseeing the day-to-day operations of the City.
The City encompasses approximately 6 square miles. Although small, Tolleson is in the middle of it all, with Phoenix International Raceway 10 minutes south and entertainment venues in Glendale, Peoria, Goodyear and Phoenix 10 minutes north and east. Tolleson is the west valley’s industrial employment center hosting over 20 Fortune 500 companies employing more than 20,000 resulting in one of the most impressive jobs to residents’ ratios in the nation.
The City provides a full range of municipal services including police and fire protection, sanitation service, water and sewer services, construction and maintenance of streets, recreational activities including libraries and cultural events, public transportation, planning and zoning services, and general administrative services.
Economic Condition and Outlook
The local economy continued to improve during the current fiscal year. Revenues in the General Fund grew by approximately 16%. Sales tax grew by $3,314,125 or 19% overall, which demonstrates continued growth and improvement in the economy. The revenue forecast for fiscal year 2019-2020 anticipates a continuation of General Fund revenue growth. Expenditures in the General Fund grew by approximately 24% overall due to two large one-time capital expenditures. The City was able to provide salary increases to employees while maintaining costs in commodities and services in order to stay within budget. The City’s budget is structurally balanced with ongoing revenues supporting ongoing expenditures. One-time revenues like contracting transaction privilege taxes and building permits support one-time expenditures.
Current Condition
As described above sales tax revenues were higher than previous years. Both the current and future programs are measured for alignment with the Strategic Plan. The financial performance of the City as a whole is reflected in its governmental funds.
As of June 30, 2019, the City’s governmental funds reported a combined fund balance of $39,043,030, of which $23,333,773 is unassigned and available for spending at the City’s discretion.
The City, like most municipalities, is significantly dependent upon sales tax revenues which are subject to economic fluctuations. Sales tax revenues comprised 69% of general fund revenues. Sales taxes and revenues related to the residential and commercial construction industry continued to improve during the fiscal year.
Future Economic Outlook
The City of Tolleson has been able to make strategic reinvestments in existing programs and invest in new programs that provide the opportunity to further position the City as the place to live, work and play. The City will continue to facilitate economic growth through capital projects in the coming year, including the construction of a New City Hall.
ii

Accomplishments and Initiatives
During fiscal year 2019, the City had several significant accomplishments and initiatives.
Within one year, the City reinvested over two million dollars from the General Fund into a city owned building and created a new multigenerational facility known as the Tolleson Parks and Recreation center. The new center offers afterschool programs, summer youth programs, summer reading activities, fieldtrips, fitness classes, youth and adult sports leagues, education classes, arts and crafts, meal programs, and cooking classes.
The 91st Avenue widening project was completed to relieve traffic, address safety concerns and provide inviting amenities for residents that was paid entirely in cash from the General Fund. The river walk throughout the walls add character to what could have been only simple walls. Wall seating, instead of benches, found on the west side of the street, offers an opportunity for seating. Light poles inspired by a Santa Fe look add a cohesive look to match downtown Tolleson. Landscaping was added with outlets that will allow for possible holiday lighting throughout the year. The project was filled with features the residents will enjoy for years to come.
City of Tolleson General Obligation Bonds were upgraded to AAA from Fitch Rating Agency and AA from Standard and Poor’s in January 2019.
The Housing and Revitalization Department completed 15 Emergency Home Repairs, one Housing Rehab, and two Residential Demolition projects. Sixteen households were assisted with home repairs and rebab. The total number of people served was 44.
The following new restaurants opened in Tolleson this year: Cole Coffeehouse LLC/Bad Ass Coffee, El Camaron Gigante LLC, Q Tamalazo Mexican Food LLC, Restaurant Oaxaqueno Tierra Del Sol, and the Buffalo Spot.
The City of Tolleson became the first local government in the United States to bring the Happiness Advantage / Orange Frog program to all its employees. The workshop provides a blueprint for increasing employee engagement and tapping into people’s intrinsic motivations. The Happiness Advantage core principles provide a springboard for people at the individual, team and organization levels; showing people how to infuse positive practices in their personal habits, team work routines and the organization’s culture.
Expenditure Limitation
On June 30, 1980 Arizona voters approved general propositions amending the Arizona Constitution to establish expenditure and revenue limitations for local governments. The purpose of the expenditure limitation is to control expenditures and to limit future increases in spending to adjustments for inflation, deflation and population growth of the City.
On November 8, 2016, the voters of the City approved an alternative expenditure limitation, the effect of which is that the total budgeted expenditures of each yearly budget becomes the expenditure limitation for that year on a total budget basis. This alternative expenditure limitation is effective for four years.
iii

Single Audit
As a recipient of Federal, State and County financial assistance, the City is responsible for ensuring that adequate internal controls are in place to ensure compliance with applicable laws, regulations, contracts and grants related to those programs. Internal control is subject to periodic evaluation by management. The Office of Management and Budget (OMB) set the single audit (Uniform Guidance) threshold for federal awards to $750,000. As such, the City did not meet the minimum threshold to have a single audit performed.
Certificate of Achievement
The Government Finance Officers Association of the United States and Canada (GFOA) awarded a Certificate of Achievement for Excellence in Financial Reporting to the City for its comprehensive annual financial report for the fiscal year ended June 30, 2018. This was the third year that the government has achieved this prestigious award. In order to be awarded a Certificate of Achievement, a government must publish an easily readable and efficiently organized comprehensive annual financial report. This report must satisfy both generally accepted accounting principles and applicable legal requirements.
A Certificate of Achievement is valid for a period of one year only. We believe that our current comprehensive annual financial report continues to meet the Certificate of Achievement Program’s requirements, and we are submitting it to the GFOA to determine its eligibility for another certificate.
Acknowledgments
The preparation of this report would not have been possible without the efficient, effective and dedicated services of the entire staff of the Finance Department and the assistance of personnel in the various departments. We would like to express our appreciation to all members who assisted and contributed to the preparation of this report.
We also wish to express our sincere appreciation to the Mayor, Vice Mayor and Council for unfailing support in maintaining the highest standards of professionalism in the management of the City of Tolleson’s finances.
iv

v

CITY OF TOLLESON, ARIZONA
PRINCIPAL OFFICIALS OF THE CITY
YEAR ENDED JUNE 30, 2019
MAYOR AND COUNCIL
Anna Tovar, Mayor
Juan F Rodriguez, Vice Mayor Clorinda Erives, Councilmember
John Carnero, Councilmember Lupe Leyva Bandin, Councilmember
Albert P. Mendoza, Councilmember Linda Laborin, Councilmember
MANAGEMENT STAFF
Reyes Medrano, Jr., City Manager
DEPARTMENT HEADS
John Lamb, Magistrate Wendy Jackson, Human Resources Director
Paul Gilmore, City Engineer Steve Holliday, IT Director
Jamie McCracken, Field Operations Director Wayne Booher, Police Chief
Victoria L. Juvet, Chief Financial Officer Mark Berrelez, Utilities Director
George Good, Fire Chief Jason Earp, Economic Development Director
John Paul Lopez, Community Services Director
vi

CIT
Y O
F TO
LLE
SO
N O
RG
AN
IZA
TIO
NA
L C
HA
RT
May
or a
nd
Cou
ncil
Mag
istr
ate
City
Man
ager
Fina
nce
Util
ities
Fire
Engi
neer
ing
Info
rmat
ion
Tec
hnol
ogy
City
Cle
rkC
omm
unity
Serv
ices
& P
RC
Fiel
d O
pera
tions
Polic
ePu
blic
Affa
irs
Hum
an
Res
ourc
esEc
onom
ic
Dev
elop
men
t
City
Att
orne
y
Boar
ds a
nd
Com
mis
sion
s
Tolle
son
Citi
zens
vii


Financial Section


INDEPENDENT AUDITORS’ REPORT
The Honorable Mayor and City Council City of Tolleson Tolleson, Arizona
Report on the Financial Statements
We have audited the accompanying financial statements of the governmental activities, the business-type activities, each major fund, and the aggregate remaining fund information of City of Tolleson, Arizona, as of and for the year ended June 30, 2019, and the related notes to the financial statements, which collectively comprise the City’s basic financial statements as listed in the table of contents.
Management’s Responsibility for the Financial Statements
Management is responsible for the preparation and fair presentation of these financial statements in accordance with accounting principles generally accepted in the United States of America; this includes the design, implementation, and maintenance of internal control relevant to the preparation and fair presentation of financial statements that are free from material misstatement, whether due to fraud or error.
Auditors’ Responsibility
Our responsibility is to express opinions on these financial statements based on our audit. We conducted our audit in accordance with auditing standards generally accepted in the United States of America and the standards applicable to financial audits contained in Government Auditing Standards, issued by the Comptroller General of the United States. Those standards require that we plan and perform the audit to obtain reasonable assurance about whether the financial statements are free from material misstatement.
An audit involves performing procedures to obtain audit evidence about the amounts and disclosures in the financial statements. The procedures selected depend on the auditors’ judgment, including the assessment of the risks of material misstatement of the financial statements, whether due to fraud or error. In making those risk assessments, the auditor considers internal control relevant to the entity’s preparation and fair presentation of the financial statements in order to design audit procedures that are appropriate in the circumstances, but not for the purpose of expressing an opinion on the effectiveness of the entity’s internal control. Accordingly, we express no such opinion. An audit also includes evaluating the appropriateness of accounting policies used and the reasonableness of significant accounting estimates made by management, as well as evaluating the overall presentation of the financial statements.
We believe that the audit evidence we have obtained is sufficient and appropriate to provide a basis for our audit opinions.
Tempe • Scottsdale • Casa Grande www.hhcpa.com

Opinions In our opinion, the financial statements referred to above present fairly, in all material respects, the respective financial position of the governmental activities, the business-type activities, each major fund, and the aggregate remaining fund information of the City of Tolleson, Arizona, as of June 30, 2019, and the respective changes in financial position and, where applicable, cash flows thereof and the respective budgetary comparison for the General Fund and Public Safety Tax Special Revenue Fund for the year then ended in accordance with accounting principles generally accepted in the United States of America. Emphasis of Matter Change in Accounting Principle As discussed in Note 1 to the financial statements, the Governmental Accounting Standards Board (GASB) issued Statement No. 88, Certain Disclosures Related to Debt, including Direct Borrowings and Direct Placements, that could have a material impact on the financial statements. For the City of Tolleson, GASB Statement No. 88 added disclosures in the notes to the financial statements. Our opinion is not modified with respect to this matter. Other Matters Required Supplementary Information Accounting principles generally accepted in the United States of America require that the management’s discussion and analysis, and the required supplementary information as listed in the table of contents be presented to supplement the basic financial statements. Such information, although not a part of the basic financial statements, is required by the Governmental Accounting Standards Board, who considers it to be an essential part of financial reporting for placing the basic financial statements in an appropriate operational, economic, or historical context. We have applied certain limited procedures to the required supplementary information in accordance with auditing standards generally accepted in the United States of America, which consisted of inquiries of management about the methods of preparing the information and comparing the information for consistency with management’s responses to our inquiries, the basic financial statements, and other knowledge we obtained during our audit of the basic financial statements. We do not express an opinion or provide any assurance on the information because the limited procedures do not provide us with sufficient evidence to express an opinion or provide any assurance. Other Information Our audit was conducted for the purpose of forming opinions on the financial statements that collectively comprise the City of Tolleson, Arizona’s basic financial statements. The introductory section, the financial information listed as other supplementary information in the financial section, and statistical section are presented for purposes of additional analysis and are not a required part of the basic financial statements. The financial information listed as other supplementary information in the financial section is the responsibility of management and were derived from and relate directly to the underlying accounting and other records used to prepare the basic financial statements. Such information has been subjected to the auditing procedures applied in the audit of the basic financial statements and certain additional procedures, including comparing and reconciling such information directly to the underlying accounting and other records used to prepare the basic financial statements or to the basic financial statements themselves, and other additional procedures in accordance with auditing standards generally accepted in the United States of America. In our opinion, the financial information listed as other supplementary information in the financial section, are fairly stated, in all material respects, in relation to the basic financial statements as a whole.

Other Information (Continued)
The introductory and statistical sections have not been subjected to the auditing procedures applied in the audit of the basic financial statements and, accordingly, we do not express an opinion or provide any assurance on them.
Compliance Over the Use of Highway User Revenue Fund and Other Dedicated State Transportation Revenue Monies
In connection with our audit, nothing came to our attention that caused us to believe that the City of Tolleson, Arizona failed to use highway user revenue fund monies received by the City pursuant to Arizona Revised Statutes Title 28, Chapter 18, Article 2, and any other dedicated state transportation revenues received by the City of Tolleson solely for the authorized transportation purposes, insofar as they relate to accounting matters. However, our audit was not directed primarily toward obtaining knowledge of such noncompliance. Accordingly, had we performed additional procedures, other matters may have come to our attention regarding the City of Tolleson’s noncompliance with the use of highway user revenue fund monies and other dedicated state transportation revenues, insofar as they relate to accounting matters.
The communication related to compliance over the use of highway user revenue fund and other dedicated state transportation revenue monies in the preceding paragraph is intended solely for the information and use of the members of the Arizona State Legislature, management, and other responsible parties with the City and is not intended to be and should not be used by anyone other than these specified parties.
Other Reporting Required by Government Auditing Standards
In accordance with Government Auditing Standards, we have also issued our report dated October 23, 2019 on our consideration of the City’s internal control over financial reporting and our tests of its compliance with certain provisions of laws, regulations, contracts and grant agreements and other matters. The purpose of that report is to describe the scope of our testing of internal control over financial reporting and compliance and the results of that testing, and not to provide an opinion on internal control over financial reporting or on compliance. That report is an integral part of an audit performed in accordance with Government Auditing Standards in considering the City of Tolleson, Arizona’s, internal control over financial reporting and compliance.
Tempe, Arizona October 23, 2019


Financial Section
MANAGEMENT’S DISCUSSION & ANALYSIS


CITY OF TOLLESON, ARIZONA MANAGEMENT’S DISCUSSION AND ANALYSIS
For the Year Ended June 30, 2019
As management of the City of Tolleson, we offer readers of the City’s financial statements this narrative overview and analysis of the financial activities of the City for the fiscal year ended June 30, 2019. We encourage readers to consider the information presented here in conjunction with additional information that we have furnished in our letter of transmittal, which can be found on page i of this report.
FINANCIAL ANALYSIS
The assets of the City of Tolleson, Arizona exceeded its liabilities at the close of themost recent fiscal year by $135,025,578 (net position).
At the end of the current fiscal year, unassigned fund balance for the General Fund was$23,333,773 or 78% of total General Fund expenditures.
The General Fund revenues (on a budgetary basis) were more than budgeted revenuesby $4,656,292 for the fiscal year ending June 30, 2019.
General Fund revenues exceeded expenditures by $380,552; a positive variance of$8,542,201 from the original budget.
OVERVIEW OF THE FINANCIAL STATEMENTS
The discussion and analysis provided here are intended to serve as an introduction to the City of Tolleson’s basic financial statements. The City of Tolleson’s basic financial statements consist of three components: 1) government-wide financial statements, 2) fund financial statements, and 3) the notes to financial statements. This report also includes supplementary information intended to furnish additional detail to support the basic financial statements themselves.
Government-wide Financial Statements. The government-wide financial statements are designed to provide readers with a broad overview of the City of Tolleson’s finances, in a manner similar to a private-sector business. The statement of net position presents financial information on all of the City of Tolleson’s assets, liabilities, and deferred inflows/outflows of resources, with the difference reported as net position. Over time, increases or decreases in net position may serve as a useful indicator of whether the financial position of the City of Tolleson is improving or deteriorating.
The statement of activities presents information showing how the City of Tolleson’s net position changed during the most recent fiscal year. All changes in net position are reported as soon as the underlying event giving rise to the change occurs, regardless of the timing of related cash flows. Thus, revenues and expenses are reported for some items that will only result in cash flows in future fiscal periods (e.g., uncollected taxes and earned but unused vacation leave).
7

Both of the government-wide financial statements distinguish functions of the City of Tolleson that are principally supported by taxes and intergovernmental revenues (governmental activities) from other functions that are intended to recover all or a significant portion of their costs through user fees and charges (business-type activities). The governmental activities of the City of Tolleson include general government, public safety, highways and streets, culture and recreation, economic development, and health and welfare. The business-type activities of the City of Tolleson include water, sewer, and sanitation. Fund Financial Statements. A fund is a grouping of related accounts that is used to maintain control over resources that have been segregated for specific activities or objectives. The City of Tolleson, like other state and local governments, uses fund accounting to ensure and demonstrate compliance with finance-related legal requirements. All of the funds of the City of Tolleson can be divided into two categories: governmental funds and proprietary funds. Governmental Funds. Governmental funds are used to account for essentially the same functions reported as governmental activities in the government-wide financial statements. However, unlike the government-wide financial statements, governmental fund financial statements focus on near-term inflows and outflows of spendable resources, as well as on balances of spendable resources available at the end of the fiscal year. Such information may be useful in assessing a government’s near-term financing requirements. Because the focus of governmental funds is narrower than that of the government-wide financial statements, it is useful to compare the information presented for governmental funds with similar information presented for governmental activities in the government-wide financial statements. By doing so, readers may better understand the long-term impact of the government’s near-term financing decisions. Both the governmental fund balance sheet and the governmental fund statement of revenues, expenditures, and changes in fund balances provide a reconciliation to facilitate this comparison between governmental funds and governmental activities. The City of Tolleson maintains six individual governmental funds. Information is presented separately in the governmental fund balance sheet and in the governmental fund statement of revenues, expenditures, and changes in fund balances for the general fund, public safety fund, capital projects, and debt service fund which are considered to be major funds. Data from two additional governmental funds are combined into a single aggregated presentation. Individual fund data for each of the non-major governmental funds is provided in the form of combining statements in the combining and individual fund statements and schedules section of this report. The City of Tolleson adopts an annual appropriated budget for its general fund. A budgetary comparison statement has been provided for the general fund to demonstrate compliance with this budget. Proprietary Funds. The City of Tolleson maintains three different types of proprietary funds. Enterprise funds are used to report the same functions presented as business-type activities in the government-wide financial statements. The City of Tolleson uses enterprise funds to account for its water, sewer, and sanitation operations. Proprietary funds provide the same type of information as the government-wide financial statements, only in more detail. The proprietary fund financial statements provide separate information for the water fund, sewer fund, and sanitation fund, all of which are considered to be major funds of the City of Tolleson.
8

Fiduciary Funds. Fiduciary funds are used to account for resources held for the benefit of parties outside of the government. The City did not have any fiduciary funds to report at year end. Notes to the Financial Statements. The notes provide additional information that is necessary to acquire a full understanding of the data provided in the government-wide and fund financial statements. Other Information. In addition to the basic financial statements and accompanying notes, this report also presents required supplementary information concerning the City of Tolleson’s progress in funding its obligation to provide pension and OPEB benefits to its employees. The combining statements referred to earlier in connection with non-major governmental funds and non-major governmental fund budgetary comparisons are presented immediately following the required supplementary information on pensions and OPEB. GOVERNMENT-WIDE FINANCIAL ANALYSIS Net position may serve over time as a useful indicator of the City’s financial position. The City’s combined assets exceed liabilities by $135,025,578 as of June 30, 2019 as shown in the following condensed statement of net position. The City has chosen to account for its water, sewer and sanitation operations in an enterprise fund which is shown as Business Activities.
Governmental Business-type Total
Activities Activities Government
6/30/2019 6/30/2018 6/30/2019 6/30/2018 6/30/2019 6/30/2018
Current and other assets 40,666,963$ 30,363,118$ 32,951,999$ 28,864,146$ 73,618,962$ 59,227,264$
Capital assets 58,947,005 50,117,879 60,066,752 61,949,097 119,013,757 112,066,976
Total assets 99,613,968 80,480,997 93,018,751 90,813,243 192,632,719 171,294,240
Deferred outflows of resources 6,438,615 7,243,516 715,959 656,704 7,154,574 7,900,220
Long-term liabilities outstanding 45,124,323 33,350,448 14,454,748 18,135,992 59,579,071 51,486,440
Other liabilities 1,552,632 3,335,758 1,208,992 1,024,174 2,761,624 4,359,932
Total liabilities 46,676,955 36,686,206 15,663,740 19,160,166 62,340,695 55,846,372
Deferred inflows of resources 1,971,240 2,064,028 449,780 261,412 2,421,020 2,325,440
Net position:
Net investment in capital assets 43,344,723 35,872,282 50,126,416 48,568,972 93,471,139 84,441,254
Restricted 15,686,162 3,652,102 518,226 506,163 16,204,388 4,158,265
Unrestricted (1,626,497) 9,449,895 26,976,548 22,973,234 25,350,051 32,423,129
Total net position 57,404,388$ 48,974,279$ 77,621,190$ 72,048,369$ 135,025,578$ 121,022,648$
Condensed Statement of Net Position
City of Tolleson, Arizona
Governmental Activities The City has $192,632,719 in total assets, with $93,471,139 invested in capital assets, net of related debt. Funds included in the Business-type activities column are the City’s enterprise funds operation, which are Wastewater, Water, and Sanitation. These operations are capital intensive, using a large portion of their resources to maintain and replace major equipment and facilities.
9

The City’s programs include: General Government, Public Safety, Highways and Streets, Economic Development, Culture and Recreation, and Health and Welfare. Each programs’ net cost (total cost less revenues generated by the activities) is presented below. The net cost shows the extent to which the City’s general taxes support each of the City’s programs.
6/30/2019 6/30/2018 6/30/2019 6/30/2018 6/30/2019 6/30/2018
Revenues:
Program revenues:
Charges for services 1,930,947$ 1,885,949$ 13,152,387$ 13,615,460$ 15,083,334$ 15,501,409$
Operating grants and
contributions 1,355,565 972,700 - - 1,355,565 972,700
Capital grants and
contributions 161,413 69,939 - - 161,413 69,939
General revenues:
Taxes 31,590,756 27,706,214 3,637,831 3,224,893 35,228,587 30,931,107
Urban revenue sharing 872,525 889,064 - - 872,525 889,064
Other revenue/(expense) 991,210 449,458 705,392 169,839 1,696,602 619,297
Total revenues 36,902,416 31,973,324 17,495,610 17,010,192 54,398,026 48,983,516
Expenses:
General government 6,244,732 6,699,834 - - 6,244,732 6,699,834
Public safety 14,014,601 13,256,375 - - 14,014,601 13,256,375
Public works/Streets 2,709,339 2,702,277 - - 2,709,339 2,702,277
Health and welfare 545,600 506,590 - - 545,600 506,590
Culture and recreation 2,907,590 2,382,861 - - 2,907,590 2,382,861
Economic development 1,000,307 794,512 - - 1,000,307 794,512
Interest on long-term debt 727,733 636,533 - - 727,733 636,533
Water - - 5,287,268 5,926,382 5,287,268 5,926,382
Wastewater treatment/sewer - - 6,298,733 6,639,875 6,298,733 6,639,875
Sanitation - - 362,235 373,399 362,235 373,399
Total expenses 28,149,902 26,978,982 11,948,236 12,939,656 40,098,138 39,918,638
Increase / (decrease) in net position
before special items and transfers 8,752,514 4,994,342 5,547,374 4,070,536 14,299,888 9,064,878
Transfers in (out) (25,447) (139,000) 25,447 139,000 - -
Change in net position 8,727,067 4,855,342 5,572,821 4,209,536 14,299,888 9,064,878
Net position, beginning 48,974,279 44,118,937 72,048,369 67,838,833 121,022,648 111,957,770
Restatement (296,958) - - - (296,958) -
Net position, beginning - restated 48,677,321 44,118,937 72,048,369 67,838,833 120,725,690 111,957,770
Ending net position 57,404,388$ 48,974,279$ 77,621,190$ 72,048,369$ 135,025,578$ 121,022,648$
Changes in Net Position
City of Tolleson, Arizona
Total
Government
Governmental
Activities
Business-type
Activities
Total resources available during the year to finance governmental operations were $85.7 million consisting of net position at July 1, 2018 of $48.7 million, program revenues of $3.5 million and General Revenues of $33.5 million. Total Governmental Activities during the year were $28 million; thus Governmental Net position was increased by $8.75 million to $57.4 million before transfers.
10
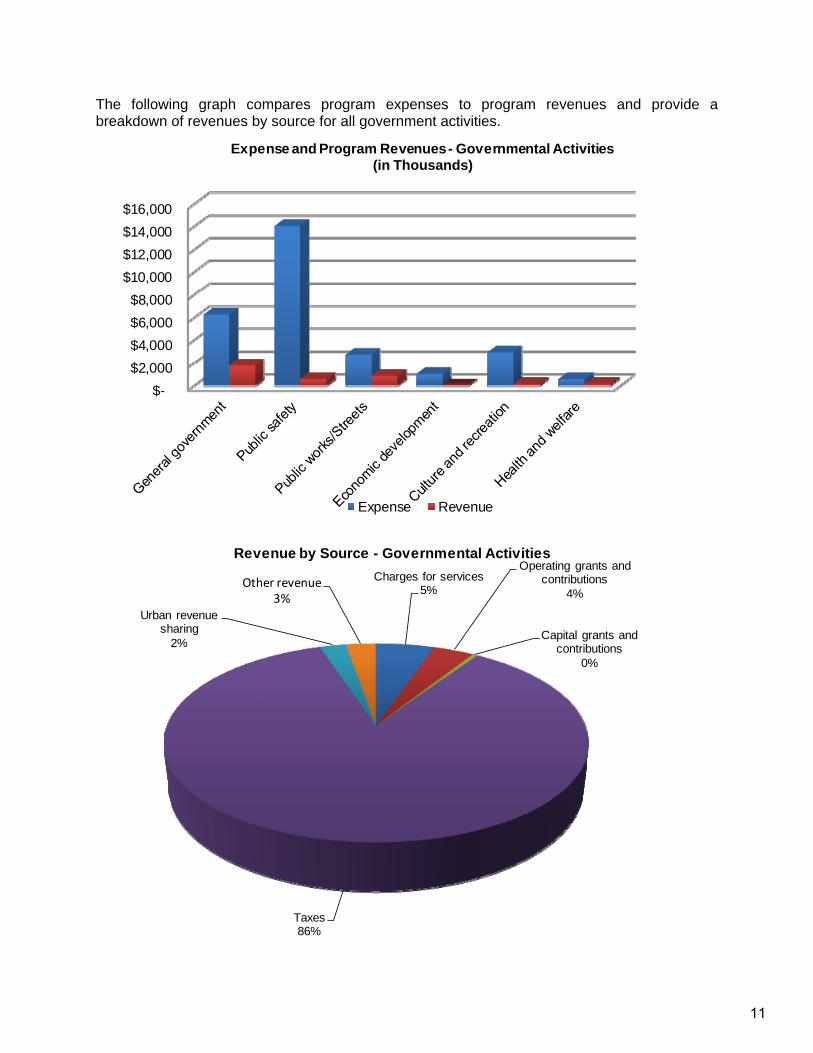
The following graph compares program expenses to program revenues and provide a breakdown of revenues by source for all government activities.
$-
$2,000
$4,000
$6,000
$8,000
$10,000
$12,000
$14,000
$16,000
Expense and Program Revenues - Governmental Activities(in Thousands)
Expense Revenue
Charges for services5%
Operating grants and contributions
4%
Capital grants and contributions
0%
Taxes86%
Urban revenue sharing
2%
Other revenue3%
Revenue by Source - Governmental Activities
11
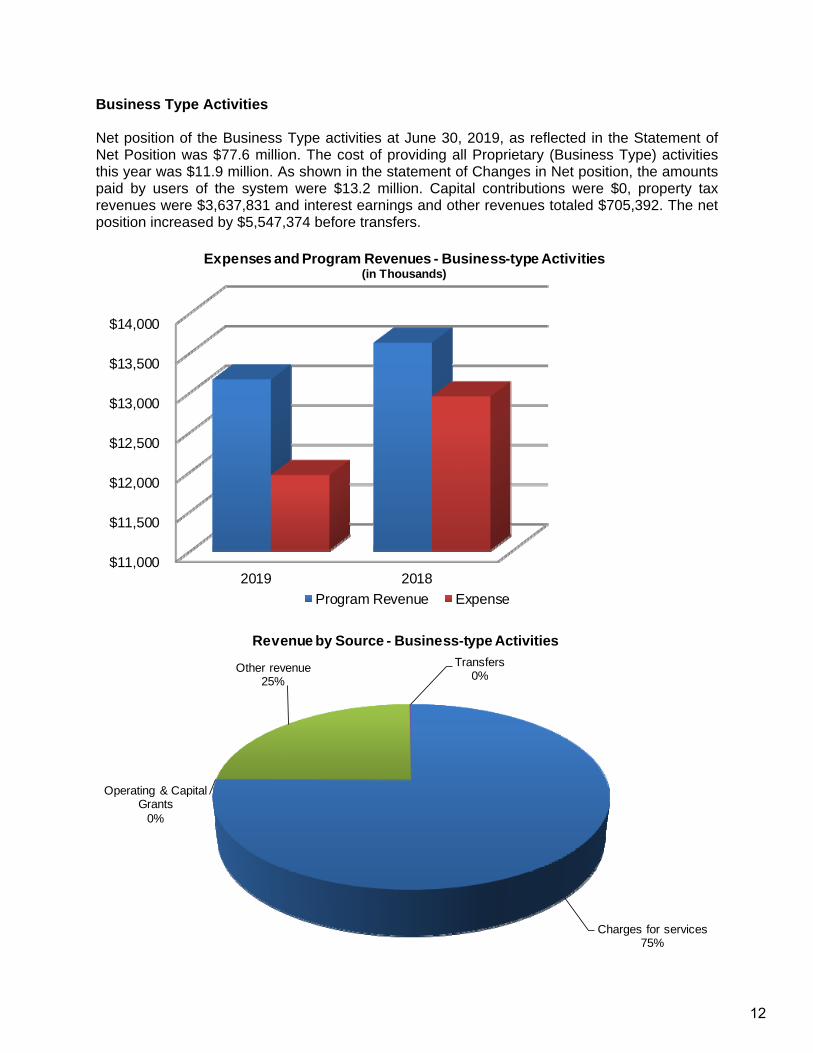
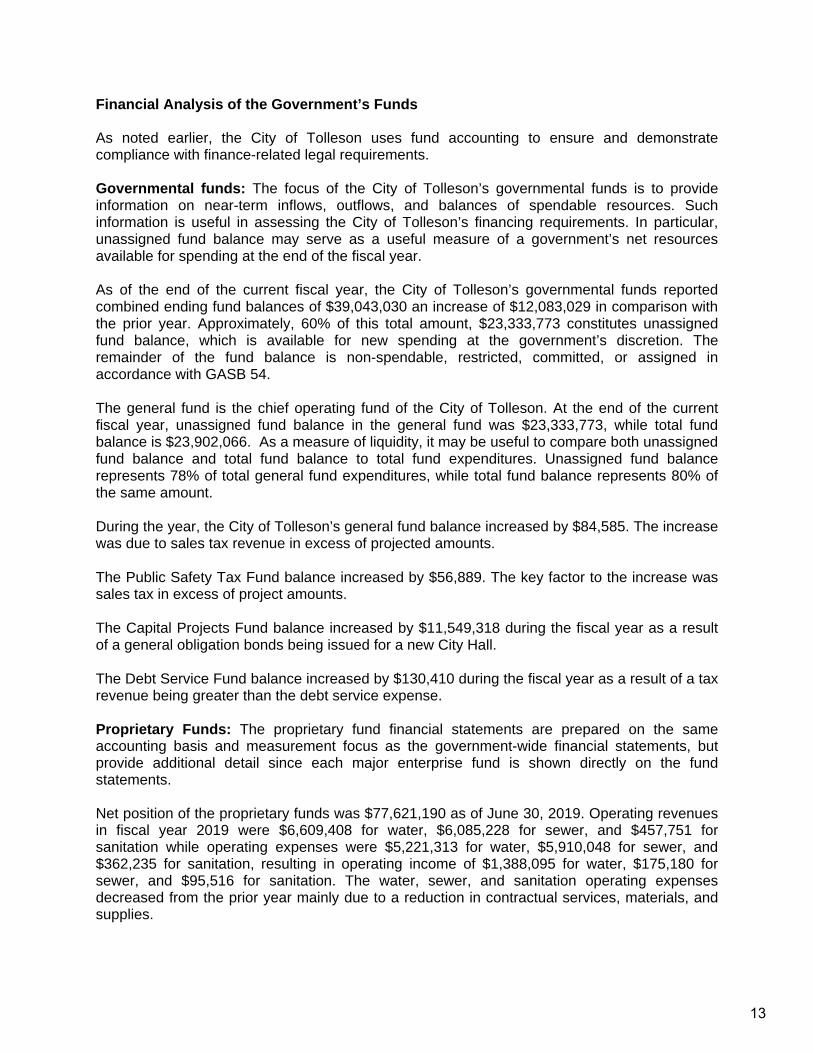
Business Type Activities Net position of the Business Type activities at June 30, 2019, as reflected in the Statement of Net Position was $77.6 million. The cost of providing all Proprietary (Business Type) activities this year was $11.9 million. As shown in the statement of Changes in Net position, the amounts paid by users of the system were $13.2 million. Capital contributions were $0, property tax revenues were $3,637,831 and interest earnings and other revenues totaled $705,392. The net position increased by $5,547,374 before transfers.
$11,000
$11,500
$12,000
$12,500
$13,000
$13,500
$14,000
2019 2018
Expenses and Program Revenues - Business-type Activities(in Thousands)
Program Revenue Expense
Charges for services75%
Operating & Capital Grants
0%
Other revenue25%
Transfers0%
Revenue by Source - Business-type Activities
12
Financial Analysis of the Government’s Funds As noted earlier, the City of Tolleson uses fund accounting to ensure and demonstrate compliance with finance-related legal requirements. Governmental funds: The focus of the City of Tolleson’s governmental funds is to provide information on near-term inflows, outflows, and balances of spendable resources. Such information is useful in assessing the City of Tolleson’s financing requirements. In particular, unassigned fund balance may serve as a useful measure of a government’s net resources available for spending at the end of the fiscal year. As of the end of the current fiscal year, the City of Tolleson’s governmental funds reported combined ending fund balances of $39,043,030 an increase of $12,083,029 in comparison with the prior year. Approximately, 60% of this total amount, $23,333,773 constitutes unassigned fund balance, which is available for new spending at the government’s discretion. The remainder of the fund balance is non-spendable, restricted, committed, or assigned in accordance with GASB 54. The general fund is the chief operating fund of the City of Tolleson. At the end of the current fiscal year, unassigned fund balance in the general fund was $23,333,773, while total fund balance is $23,902,066. As a measure of liquidity, it may be useful to compare both unassigned fund balance and total fund balance to total fund expenditures. Unassigned fund balance represents 78% of total general fund expenditures, while total fund balance represents 80% of the same amount. During the year, the City of Tolleson’s general fund balance increased by $84,585. The increase was due to sales tax revenue in excess of projected amounts. The Public Safety Tax Fund balance increased by $56,889. The key factor to the increase was sales tax in excess of project amounts. The Capital Projects Fund balance increased by $11,549,318 during the fiscal year as a result of a general obligation bonds being issued for a new City Hall. The Debt Service Fund balance increased by $130,410 during the fiscal year as a result of a tax revenue being greater than the debt service expense. Proprietary Funds: The proprietary fund financial statements are prepared on the same accounting basis and measurement focus as the government-wide financial statements, but provide additional detail since each major enterprise fund is shown directly on the fund statements. Net position of the proprietary funds was $77,621,190 as of June 30, 2019. Operating revenues in fiscal year 2019 were $6,609,408 for water, $6,085,228 for sewer, and $457,751 for sanitation while operating expenses were $5,221,313 for water, $5,910,048 for sewer, and $362,235 for sanitation, resulting in operating income of $1,388,095 for water, $175,180 for sewer, and $95,516 for sanitation. The water, sewer, and sanitation operating expenses decreased from the prior year mainly due to a reduction in contractual services, materials, and supplies.
13
General Fund Budgetary Highlights Actual general fund revenues exceeded budgeted amounts by $4,656,292 primarily due to sales tax revenues in excess of projections. The City’s total expenditures in the general fund were less than the budgeted amounts by $3,885,909. There were amendments made during the year between general fund departments to prevent budget overruns and to increase appropriations for unanticipated expenditures after adoption of the original budget. CAPITAL ASSET AND DEBT ADMINISTRATION Capital Assets The capital assets of the City are those assets that are used in performance of City functions including infrastructure assets. Capital assets include equipment, buildings, land, park facilities and roads. At the end of fiscal year 2019, net capital assets of the government activities totaled $59 million and the net capital assets of the business-type activities totaled $60.1 million. Depreciation on capital assets is recognized in the government-wide financial statements. (See note 4 to the financial statements.) Debt At year-end, the City had $45.6 million in governmental type debt, and $14.5 million in business-type debt. During the current fiscal year, the City’s total debt increased by $6,834,529. (See note 5 to the financial statements for detailed descriptions.) NEXT YEAR’S BUDGET AND ECONOMIC FACTORS The City continues to grow in residential and commercial development. The City is committed to provide exceptional services and programs to our citizens. The 2019-2020 budget decreased by $354,213 to $76,796,734. Several large capital projects were completed in the current year, but the City will be starting a New City Hall construction project. Sales Tax revenue increased by 19% this fiscal year and is projected to increase by another 12% in FY 2020. The budget is structurally balanced with ongoing revenues supporting ongoing program expenditures. The budget document is the comprehensive decision-making tool resulting from the annual budget process. Overall, the financial condition of the City is improving and the actions of the City Council will help to ensure this continues. CONTACTING THE CITY’S FINANCIAL MANAGEMENT This financial report is designed to provide our citizens, taxpayers, customers, investors and creditors with a general overview of the City’s finances and to show the City’s accountability for the money it receives. If you have questions about this report or need additional financial information, contact the City’s Chief Financial Officer, City of Tolleson, 9555 West Van Buren, Tolleson, Arizona, 85353 or visit our website at www.tollesonaz.org.
14

Financial Section
BASIC FINANCIAL STATEMENTS
Government-wide Financial Statements - include the Statement of Net Position and Statement of Activities and use the accrual basis of accounting for financial reporting.
Governmental Funds Financial Statements - include the Balance Sheet and Statement of Revenues, Expenditures, and Changes in Fund Balance for the major governmental funds that use the modified accrual basis of reporting. Also includes the reconciliations to the government-wide financial statements and the Budget and Actual statements for the General Fund and all major Special Revenue Funds.
Proprietary Funds Financial Statements - include the Statement of Net Position, Statement of Revenues, Expenses and Changes in Fund Net Position and Statement of Cash Flows for the business-type activities that use the accrual basis of accounting for financial reporting.
Notes to the Financial Statements


CITY OF TOLLESON, ARIZONA
Governmental Business-typeASSETS Activities Activities TotalCash and cash equivalents 10,911,159$ 19,837,534$ 30,748,693$ Investments 13,224,086 9,721,801 22,945,887 Receivables (net of allowances) 4,963,405 2,874,438 7,837,843 Restricted assets 11,545,218 518,226 12,063,444 Prepaid items 23,095 - 23,095 Capital assets:
Nondepreciable capital assets 5,845,523 4,089,111 9,934,634 Depreciable capital assets (net of accumulated
depreciation) 53,101,482 55,977,641 109,079,123 Total assets 99,613,968 93,018,751 192,632,719
DEFERRED OUTFLOWS OF RESOURCESDeferred outflows of resources related to pensions 6,438,615 715,959 7,154,574
Total deferred outflows of resources 6,438,615 715,959 7,154,574
LIABILITIESAccounts payable and other current liabilities 771,709 809,932 1,581,641 Accrued wages and benefits 700,555 162,613 863,168 Deposits payable 5,238 133,932 139,170 Interest payable - 99,739 99,739 Unearned revenue 75,130 2,776 77,906 Noncurrent liabilities:
Due within one year:Compensated absences 579,652 234,836 814,488 Developer agreement payable 425,000 - 425,000 Loans payable - 464,067 464,067 Bonds payable 1,823,715 1,836,285 3,660,000
Due in more than one year:Compensated absences 1,835,567 287,022 2,122,589 Developer agreement payable 927,555 - 927,555 Loans payable - 5,573,343 5,573,343 Bonds payable 23,276,012 2,066,641 25,342,653 Net pension liability 16,256,822 3,992,554 20,249,376
Total liabilities 46,676,955 15,663,740 62,340,695
DEFERRED INFLOWS OF RESOURCESDeferred inflows of resources related to pensions 1,971,240 449,780 2,421,020
Total deferred inflows of resources 1,971,240 449,780 2,421,020
NET POSITIONNet investment in capital assets 43,344,723 50,126,416 93,471,139 Restricted for:
General government 410,556 - 410,556 Public safety 2,432,731 - 2,432,731 Highways and streets 545,458 - 545,458 Debt service 456,077 518,226 974,303 Capital projects and other 11,574,765 - 11,574,765 Grants 266,575 - 266,575
Unrestricted (deficit) (1,626,497) 26,976,548 25,350,051
Total net position 57,404,388$ 77,621,190$ 135,025,578$
Primary Government
STATEMENT OF NET POSITIONJune 30, 2019
See accompanying notes. 17

Operating CapitalCharges for Grants and Grants and
Functions/Programs Expenses Services Contributions ContributionsPrimary governmentGovernmental activities
General government 6,244,732$ 1,562,514$ 187,833$ 15,013$ Public safety 14,014,601 303,551 261,334 - Highways and streets 2,709,339 - 688,185 146,400 Culture and recreation 2,907,590 64,882 63,469 - Economic development 1,000,307 - - - Health and welfare 545,600 - 154,744 - Interest on long-term debt 727,733 - - - Total governmental activities 28,149,902 1,930,947 1,355,565 161,413
Business-type activitiesWater 5,287,268 6,609,408 - - Sewer 6,298,733 6,085,228 - - Sanitation and Trash 362,235 457,751 - - Total business-type activities 11,948,236 13,152,387 - -
Total primary government 40,098,138$ 15,083,334$ 1,355,565$ 161,413$
General revenues Taxes: Sales tax Property tax Auto lieu tax Franchise tax State revenue sharing Urban revenue sharing (unrestricted) Unrestricted investment earnings MiscellaneousTransfers in (out)
Total general revenuesand transfers
Change in net position
Net position, beginning of yearRestatementNet position, beginning of year, restated
Net position, end of year
CITY OF TOLLESON, ARIZONASTATEMENT OF ACTIVITIESYear Ended June 30, 2019
Program Revenues
See accompanying notes. 18
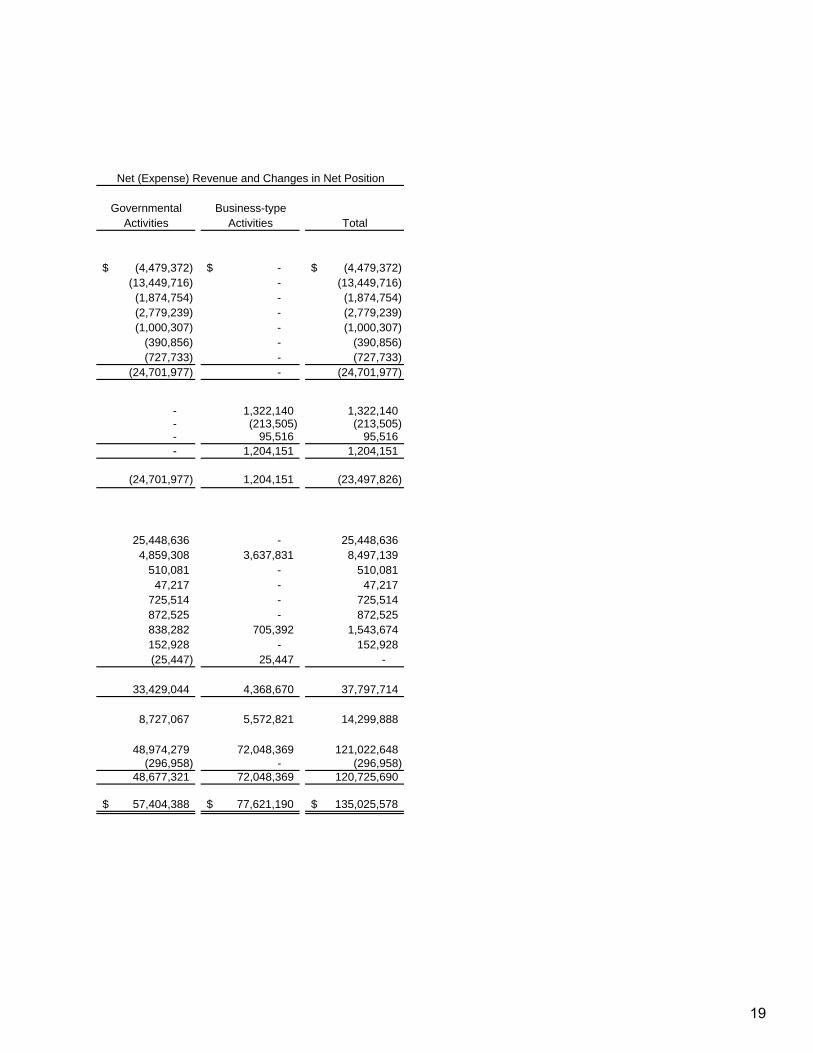
Governmental Business-typeActivities Activities Total
(4,479,372)$ -$ (4,479,372)$ (13,449,716) - (13,449,716)
(1,874,754) - (1,874,754) (2,779,239) - (2,779,239) (1,000,307) - (1,000,307)
(390,856) - (390,856) (727,733) - (727,733)
(24,701,977) - (24,701,977)
- 1,322,140 1,322,140 - (213,505) (213,505) - 95,516 95,516 - 1,204,151 1,204,151
(24,701,977) 1,204,151 (23,497,826)
25,448,636 - 25,448,636 4,859,308 3,637,831 8,497,139
510,081 - 510,081 47,217 - 47,217
725,514 - 725,514 872,525 - 872,525 838,282 705,392 1,543,674 152,928 - 152,928 (25,447) 25,447 -
33,429,044 4,368,670 37,797,714
8,727,067 5,572,821 14,299,888
48,974,279 72,048,369 121,022,648 (296,958) - (296,958)
48,677,321 72,048,369 120,725,690
57,404,388$ 77,621,190$ 135,025,578$
Net (Expense) Revenue and Changes in Net Position
19


Government Funds Financial Statements
Major Funds
General Fund
This fund is the general operating fund of the City. It accounts for all financial resources of the City, except those required to be accounted for in other funds.
Public Safety Tax Fund
This fund accounts for the ½ cent sales tax collected to provide for police and fire services.
Capital Projects Fund
This fund accounts for the government’s major capital improvements projects including the expenditure of impact fees.
Debt Service Fund
This fund accounts for the government’s accumulation of resources for and the payment of long-term debt principal, interest and related costs.
Non - Major Funds
Other governmental funds are the non-major funds and are special revenue and capital project funds.

Public Safety Capital DebtASSETS General Tax Projects ServiceCash and cash equivalents 7,540,287$ 2,299,979$ 21,770$ 412,744$ Investments 13,224,086 - - - Receivables, net:
Accounts receivable 204,908 35,228 - - Interest receivable 85,204 - 25,277 - Taxes receivable 68,390 - - 71,395 Intergovernmental receivable 4,120,187 - - -
Prepaids 23,095 - - - Restricted cash and investments - - 11,545,218 -
Total assets 25,266,157$ 2,335,207$ 11,592,265$ 484,139$
LIABILITIESAccounts payable 648,116$ 18,880$ 17,500$ -$ Accrued wages and benefits 685,736 - - - Deposit payable 5,238 - - - Unearned revenue - - - -
Total liabilities 1,339,090 18,880 17,500 -
DEFERRED INFLOWS OF RESOURCESUnavailable revenue 25,001 18,238 - 28,062
Total deferred inflow of resources 25,001 18,238 - 28,062
FUND BALANCESNonspendable
Prepaid items 23,095 - - - Restricted
General government 410,556 - - - Public safety 134,642 2,298,089 - - Highways and streets - - - - Debt service - - - 456,077 Capital projects - - 11,574,765 - Grants - - - -
Unassigned 23,333,773 - - -
Total fund balances 23,902,066 2,298,089 11,574,765 456,077
Total liabilities, deferred inflow of resources,and fund balances 25,266,157$ 2,335,207$ 11,592,265$ 484,139$
CITY OF TOLLESON, ARIZONABALANCE SHEET
June 30, 2019GOVERNMENTAL FUNDS
See accompanying notes. 22

Non-Major Governmental
Total Governmental
Funds Funds636,379$ 10,911,159$
- 13,224,086
- 240,136 - 110,481 - 139,785
352,816 4,473,003 - 23,095 - 11,545,218
989,195$ 40,666,963$
87,213$ 771,709$ 14,819 700,555
- 5,238 75,130 75,130
177,162 1,552,632
- 71,301
- 71,301
- 23,095
- 410,556 - 2,432,731
545,458 545,458 - 456,077 - 11,574,765
266,575 266,575 - 23,333,773
812,033 39,043,030
989,195$ 40,666,963$
23


Total governmental funds balances 39,043,030$
Amounts reported for governmental activities in the statementof net position are different because:
Capital assets used in governmental activities are notfinancial resources and therefore are not reported in the funds
Governmental capital assets 103,084,190$ Accumulated depreciation (44,137,185) 58,947,005
Some revenues are unavailable in the governmental fundfinancial statements but recognized when earned in the statement of activities 71,301
Some liabilities, including net pension liabilities, capital leases, developer agreement payable, loans payable, and bonds payable, are not due and payable in the current period and therefore are not reported in the funds.
Net pension liability (16,256,822) Developer agreement payable (1,352,555) Bonds payable (25,099,727) Compensated absences (2,415,219) (45,124,323)
Deferred outflows and inflows of resources related to pensionsand deferred charges on debt refundings are applicable to futurereporting periods and, therefore, are not reported in the funds.
Deferred outflows of resources related to pensions 6,438,615 Deferred inflows of resources related to pensions (1,971,240) 4,467,375
Total net position of governmental activities 57,404,388$
CITY OF TOLLESON, ARIZONARECONCILIATION OF THE BALANCE SHEET TO THE STATEMENT OF NET POSITIONGOVERNMENTAL FUNDSJune 30, 2019
See accompanying notes. 25

STATEMENT OF REVENUES, EXPENDITURES, AND CHANGES IN FUND BALANCES
Public Safety Capital DebtREVENUES General Tax Projects ServiceTaxes:
Sales taxes 20,901,399$ 3,590,237$ -$ 957,000$ Property taxes 4,165,401 - - 708,203Franchise taxes 47,217 - - -
Intergovernmental revenues 1,816,983 - - - Fines and forfeitures 283,882 - - - Licenses and permits 644,556 - - - Charges for services 1,361,194 20,746 - - Rents and royalties 47,045 - - - Contributions and donations 66,619 - - - Investment earnings 676,978 19,842 108,396 31,835Other revenues 388,061 16,990 - -
Total revenues 30,399,335 3,647,815 108,396 1,697,038
EXPENDITURESCurrent:
General government 6,692,032 - - - Public safety 10,633,495 2,428,567 - - Highways and streets 1,252,088 - - - Culture and recreation 2,559,148 - - - Economic development 1,284,470 - - Health and welfare - - - -
Capital outlay 7,597,550 1,162,359 - - Debt service:
Principal retirement - - - 958,100Interest and fiscal charges - - 162,342 608,528Bond issuance costs - - 226,656 - Total expenditures 30,018,783 3,590,926 388,998 1,566,628 Excess (deficiency) of revenues
over (under) expenditures 380,552 56,889 (280,602) 130,410
OTHER FINANCING SOURCES (USES)Sale of capital assets 9,272 - - - General obligation bonds issued - - 10,850,000 - Premium on general obligation bonds - - 1,005,367 - Transfers in - - - - Transfers out (305,239) - (25,447) -
Total other financing sourcesand (uses) (295,967) - 11,829,920 -
Net change in fund balances 84,585 56,889 11,549,318 130,410
Fund balances - beginning of year 23,817,481 2,241,200 25,447 325,667
Fund balances - end of year 23,902,066$ 2,298,089$ 11,574,765$ 456,077$
CITY OF TOLLESON, ARIZONA
GOVERNMENTAL FUNDSYear Ended June 30, 2019
See accompanying notes. 26

Non-Major Governmental
Total Governmental
Funds Funds
-$ 25,448,636$ - 4,873,604 - 47,217
1,619,427 3,436,410 - 283,882 - 644,556 - 1,381,940 - 47,045 - 66,619
1,231 838,282 - 405,051
1,620,658 37,473,242
- 6,692,032 261,333 13,323,395 737,670 1,989,758
- 2,559,148 - 1,284,470
518,667 518,667 146,400 8,906,309
- 958,100 - 770,870 - 226,656
1,664,070 37,229,405
(43,412) 243,837
- 9,272 - 10,850,000 - 1,005,367
305,239 305,239 - (330,686)
305,239 11,839,192
261,827 12,083,029
550,206 26,960,001
812,033$ 39,043,030$
27

Amounts reported for governmental activities in the statement of activitiesare different because:
Net change in fund balances - total governmental funds 12,083,029$
Governmental funds report capital outlays as expenditures. However,in the statement of activities the cost of those assets is allocated over their estimated useful lives and reported as depreciation expense. This is the difference between depreciation expense and capital outlay in the current period.
Capital outlay 8,906,308$ Depreciation expense (2,494,412) 6,411,896
In the statement of activities, only gain/loss on the sale of capital assets is reported, whereas in the governmental funds, the proceeds from the sale increase financial resources. Thus, the change in net position differs from the change in fund balance by the book value of the capital asset sold. (7,260)
Governmental funds report the effect of premiums, discounts and similaritems when debt is first issued, whereas these amounts are deferredand amortized in the Statement of Activities.
Amortization of bond premiums and discounts - net 43,137
City pension contributions are reported as expenditures in the governmentalfunds when made. However, they are reported as deferred outflows of
pension liability is measured a year before the City's report date. Pensionexpense, which is the change in the net pension liability adjusted for changes in deferred outflows and inflows of resources related to pensions, is reported in the Statement of Activities.
City pension contributions 3,240,276 City proportionate share of State's appropriation to EORP (31,294) Pension expense (2,541,134) 667,848
Debt proceeds provide current financial resources to governmental funds, but issuing debt increases long-term liabilities in the statement of net position.
General obligation bonds issued (10,850,000) Premium on general obligation bonds (1,005,367) (11,855,367)
Repayment of long-term debt (e.g., bonds, leases, accounts payable) principal is an expenditure in the governmental funds, but the repayment reduces long-term liabilities in the statement of net position.
Bond principal repaid 958,100 Developer agreement principal repaid 407,412 1,365,512
Revenues in the statement of activities that do not provide current financialresources are not reported as revenues in the funds. This the change in deferred inflows in the statement of activities. 3,942
Compensated absences expenses reported in the statement of activitiesdo not require the use of current financial resources and therefore arenot reported as expenditures in governmental funds. 14,330
Change in net position of governmental activities 8,727,067$
resources in the Statement of Net Position because the reported net
CITY OF TOLLESON, ARIZONARECONCILIATION OF THE STATEMENT OF REVENUES,
TO THE STATEMENT OF ACTIVITIESYear Ended June 30, 2019
EXPENDITURES, AND CHANGES IN FUND BALANCES OF GOVERNMENTAL FUNDS
See accompanying notes. 28

BUDGET AND ACTUAL
Variance withFinal Budget-
PositiveREVENUES Original Final Actual Amounts (Negative)Taxes
Sales taxes 17,500,000$ 17,500,000$ 20,901,399$ 3,401,399$ Property taxes 4,144,559 4,144,559 4,165,401 20,842 Franchise taxes 38,000 38,000 47,217 9,217
Intergovernmental revenues 1,812,837 1,812,837 1,816,983 4,146 Fines and forfeitures 246,400 246,400 283,882 37,482 Licenses and permits 460,000 460,000 644,556 184,556 Charges for services 1,272,947 1,272,947 1,361,194 88,247 Rents and royalties 67,000 67,000 47,045 (19,955) Other revenues:Contributions and donations 45,000 45,000 66,619 21,619 Investment earnings 96,200 96,200 676,978 580,778 Other revenues 60,100 60,100 388,061 327,961
TOTAL REVENUES 25,743,043 25,743,043 30,399,335 4,656,292
EXPENDITURESGeneral Government 8,129,252 8,137,252 6,692,032 1,445,220 Public Safety 11,144,660 11,144,660 10,633,495 511,165 Highway & streets 1,268,100 1,268,100 1,252,088 16,012 Culture & recreation 3,597,430 3,436,430 2,559,148 877,282 Economic development 1,456,150 1,321,150 1,284,470 36,680 Capital outlay 7,809,100 8,597,100 7,597,550 999,550
TOTAL EXPENDITURES 33,404,692 33,904,692 30,018,783 3,885,909
Excess (deficiency) of revenues over (under) expenditures (7,661,649) (8,161,649) 380,552 8,542,201
OTHER FINANCING SOURCES (USES)Sale of capital assets 10,000 10,000 9,272 (728) Transfers out (363,583) (363,583) (305,239) 58,344
Total other financing sources (uses) (353,583) (353,583) (295,967) 57,616
Net change in fund balance (8,015,232) (8,515,232) 84,585 8,599,817
Fund balance - beginning of year 23,817,481 23,817,481 23,817,481 -
Fund balance - end of year 15,802,249$ 15,302,249$ 23,902,066$ 8,599,817$
Budgeted Amounts
CITY OF TOLLESON, ARIZONAGENERAL FUNDSTATEMENT OF REVENUES, EXPENDITURES, AND CHANGES IN FUND BALANCE -
Year Ended June 30, 2019
See accompanying notes. 29
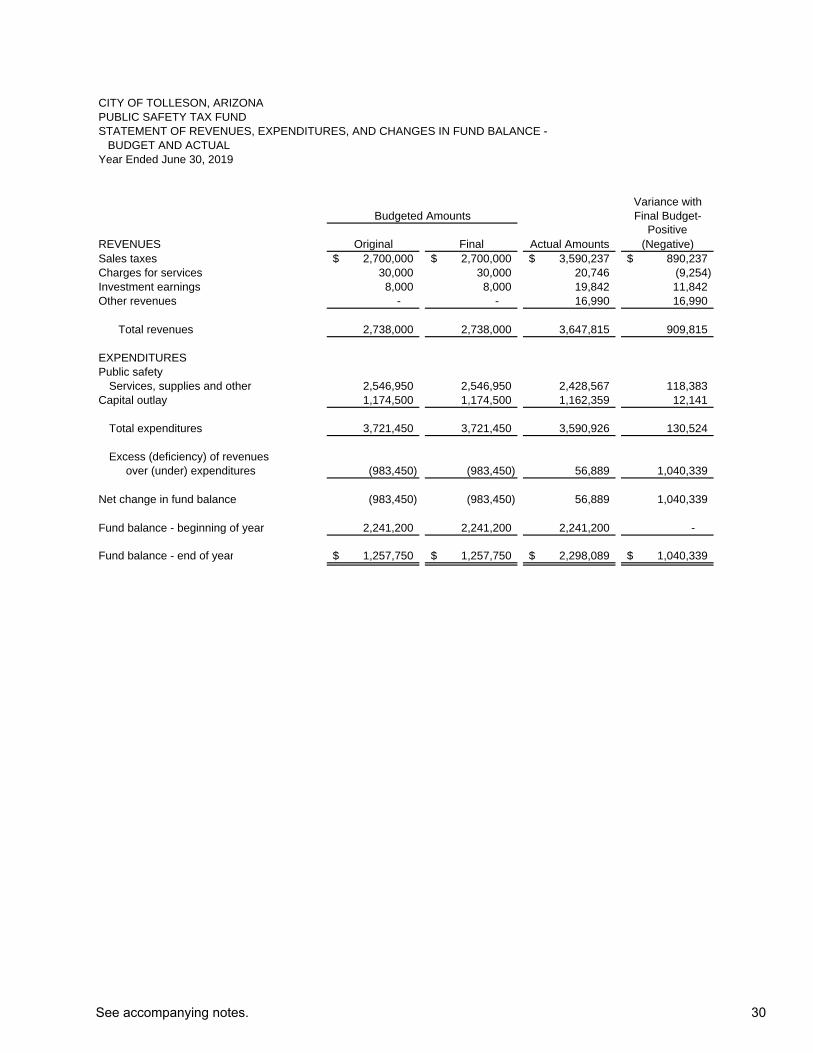
BUDGET AND ACTUAL
Variance withFinal Budget-
PositiveREVENUES Original Final Actual Amounts (Negative)Sales taxes 2,700,000$ 2,700,000$ 3,590,237$ 890,237$ Charges for services 30,000 30,000 20,746 (9,254) Investment earnings 8,000 8,000 19,842 11,842 Other revenues - - 16,990 16,990
Total revenues 2,738,000 2,738,000 3,647,815 909,815
EXPENDITURESPublic safety
Services, supplies and other 2,546,950 2,546,950 2,428,567 118,383 Capital outlay 1,174,500 1,174,500 1,162,359 12,141
Total expenditures 3,721,450 3,721,450 3,590,926 130,524
Excess (deficiency) of revenues over (under) expenditures (983,450) (983,450) 56,889 1,040,339
Net change in fund balance (983,450) (983,450) 56,889 1,040,339
Fund balance - beginning of year 2,241,200 2,241,200 2,241,200 -
Fund balance - end of year 1,257,750$ 1,257,750$ 2,298,089$ 1,040,339$
CITY OF TOLLESON, ARIZONAPUBLIC SAFETY TAX FUNDSTATEMENT OF REVENUES, EXPENDITURES, AND CHANGES IN FUND BALANCE -
Year Ended June 30, 2019
Budgeted Amounts
See accompanying notes. 30

Proprietary Fund Financial Statements
Enterprise Fund
Water Fund
This fund is used to account for the activities of the City’s water utility operations.
Wastewater & Sewer Fund
This fund is used to account for the activities of the City’s sewer utility operations.
Sanitation & Trash Fund
This fund is used to account for the activities of the City’s sanitation & trash utility operations.


CITY OF TOLLESON, ARIZONASTATEMENT OF NET POSITIONPROPRIETARY FUNDSJune 30, 2019
ASSETS Wastewater Sanitation Current assets Water and Sewer and Trash Total
Cash and cash equivalents 7,115,549$ 12,316,258$ 405,727$ 19,837,534$ Investments 4,722,500 4,999,301 - 9,721,801 Receivables (net of allowance):
Accounts receivable 1,130,664 1,527,569 77,289 2,735,522 Interest receivable 31,622 27,266 - 58,888 Taxes receivable 76,419 3,609 - 80,028
Restricted assets - 518,226 - 518,226 Total current assets 13,076,754 19,392,229 483,016 32,951,999
Noncurrent assetsCapital assets:Non-depreciable 1,126,798 2,962,313 - 4,089,111 Depreciable, net 8,668,706 47,294,295 14,640 55,977,641
Total noncurrent assets 9,795,504 50,256,608 14,640 60,066,752
Total assets 22,872,258 69,648,837 497,656 93,018,751
DEFERRED OUTFLOWS OF RESOURCESDeferred outflows of resources related to pensions 209,654 462,668 43,637 715,959
Total deferred outflows of resources 209,654 462,668 43,637 715,959
LIABILITIESCurrent liabilities
Accounts payable 516,435 226,429 5,192 748,056 Accrued wages and benefits 52,382 108,899 1,332 162,613 Interest payable - 99,740 - 99,740 Intergovernmental payable 61,876 - - 61,876 Customer deposits payable 133,931 - - 133,931 Unearned revenue 1,357 1,419 - 2,776 Bonds payable - current portion 336,285 1,500,000 - 1,836,285 Loans payable - current portion - 464,067 - 464,067 Compensated absences 59,173 175,663 - 234,836
Total current liabilities 1,161,439 2,576,217 6,524 3,744,180 Noncurrent liabilities
Compensated absences, net of current portion 72,322 214,700 - 287,022 Bonds payable, net of deferred amounts 1,507,602 559,039 - 2,066,641 Loans payable, net of current portion - 5,573,343 - 5,573,343 Net pension liability 1,106,928 2,546,237 339,389 3,992,554
Total noncurrent liabilities 2,686,852 8,893,319 339,389 11,919,560 Total liabilities 3,848,291 11,469,536 345,913 15,663,740
DEFERRED INFLOWS OF RESOURCESDeferred inflows of resources related to pensions 123,201 291,009 35,570 449,780
NET POSITIONNet investment in capital assets 7,951,617 42,160,159 14,640 50,126,416 Restricted for debt service - 518,226 - 518,226 Unrestricted 11,158,803 15,672,575 145,170 26,976,548
Total net position 19,110,420$ 58,350,960$ 159,810$ 77,621,190$
Business-type Activities-Enterprise Funds
See accompanying notes. 33


STATEMENT OF REVENUES, EXPENSES, AND CHANGES IN FUND NET POSITION
Wastewater Sanitation Operating revenues Water and Sewer and Trash Total
Charges for services 6,609,408$ 6,085,228$ 457,751$ 13,152,387$
Operating expensesSalaries, wages and benefits 1,279,736 2,555,312 28,663 3,863,711 Contractual services, materials and supplies 3,440,446 1,612,351 327,922 5,380,719 Depreciation 501,131 1,742,385 5,650 2,249,166 Total operating expenses 5,221,313 5,910,048 362,235 11,493,596
Operating income (loss) 1,388,095 175,180 95,516 1,658,791
Non-operating Revenues (Expenses)Property taxes 190,951 3,446,880 - 3,637,831 Investment earnings 294,476 406,105 4,811 705,392 Interest expense (65,955) (388,685) - (454,640) Total nonoperating revenue (expense) 419,472 3,464,300 4,811 3,888,583
Income (loss) before transfers 1,807,567 3,639,480 100,327 5,547,374
Transfers in 25,447 - - 25,447
Change in net position 1,833,014 3,639,480 100,327 5,572,821
Net position, beginning of year 17,277,406 54,711,480 59,483 72,048,369
Total net position-end of year 19,110,420$ 58,350,960$ 159,810$ 77,621,190$
Business-type Activities-Enterprise Funds
CITY OF TOLLESON, ARIZONA
PROPRIETARY FUNDSYear Ended June 30, 2019
See accompanying notes. 35
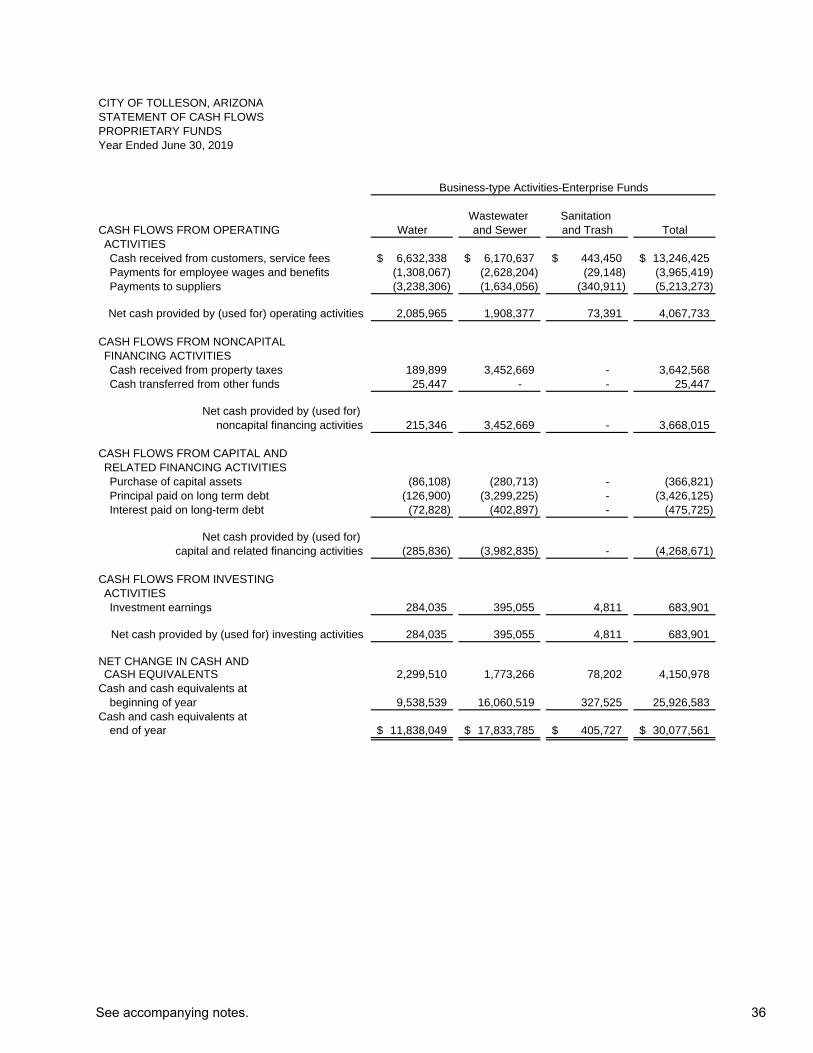
Wastewater Sanitation CASH FLOWS FROM OPERATING Water and Sewer and Trash TotalACTIVITIESCash received from customers, service fees 6,632,338$ 6,170,637$ 443,450$ 13,246,425$ Payments for employee wages and benefits (1,308,067) (2,628,204) (29,148) (3,965,419) Payments to suppliers (3,238,306) (1,634,056) (340,911) (5,213,273)
Net cash provided by (used for) operating activities 2,085,965 1,908,377 73,391 4,067,733
CASH FLOWS FROM NONCAPITALFINANCING ACTIVITIESCash received from property taxes 189,899 3,452,669 - 3,642,568 Cash transferred from other funds 25,447 - - 25,447
Net cash provided by (used for) noncapital financing activities 215,346 3,452,669 - 3,668,015
CASH FLOWS FROM CAPITAL AND RELATED FINANCING ACTIVITIESPurchase of capital assets (86,108) (280,713) - (366,821) Principal paid on long term debt (126,900) (3,299,225) - (3,426,125) Interest paid on long-term debt (72,828) (402,897) - (475,725)
Net cash provided by (used for) capital and related financing activities (285,836) (3,982,835) - (4,268,671)
CASH FLOWS FROM INVESTING ACTIVITIESInvestment earnings 284,035 395,055 4,811 683,901
Net cash provided by (used for) investing activities 284,035 395,055 4,811 683,901
NET CHANGE IN CASH ANDCASH EQUIVALENTS 2,299,510 1,773,266 78,202 4,150,978
Cash and cash equivalents atbeginning of year 9,538,539 16,060,519 327,525 25,926,583
Cash and cash equivalents atend of year 11,838,049$ 17,833,785$ 405,727$ 30,077,561$
Business-type Activities-Enterprise Funds
CITY OF TOLLESON, ARIZONASTATEMENT OF CASH FLOWSPROPRIETARY FUNDSYear Ended June 30, 2019
See accompanying notes. 36

Wastewater SanitationWater and Sewer and Trash Total
Reconciliation of operating income (loss) to net cashprovided by (used for) operating activities:Net operating income (loss) 1,388,095$ 175,180$ 95,516$ 1,658,791$
Adjustments to reconcile operating income (loss) tonet cash provided by (used for) operating activities:Depreciation expense 501,131 1,742,385 5,650 2,249,166 Provision for uncollectible accounts 25,771 6,227 1,792 33,790
Changes in assets, deferred outflows of resources, liabilities, and deferred inflows of resources:(Increase)/decrease in:Accounts receivable (18,718) 80,900 (16,093) 46,089 Deferred outflows of resources related to pensions (22,571) (36,522) (162) (59,255) Increase/(decrease) in:Accounts payable 204,194 (21,705) (12,989) 169,500 Accrued wages and benefits 3,054 7,540 40 10,634 Accrued liabilities (2,054) - - (2,054) Customer deposits 14,520 - - 14,520 Unearned revenue 1,357 (1,718) - (361) Compensated absences 5,206 (14,606) - (9,400) Net pension liability (74,471) (155,653) (1,931) (232,055) Deferred outflows of resources related to pensions 60,451 126,349 1,568 188,368
Net cash provided by (used for) operating activities: 2,085,965$ 1,908,377$ 73,391$ 4,067,733$
Noncash investing, capital, and financing activities:Amortization of bond premium 6,873$ 6,791$ -$ 13,664$
Reconciliation of cash, cash equivalents, and investments to the statement of net positionCash and cash equivalents 7,115,549$ 12,316,258$ 405,727$ 19,837,534$ Investments 4,722,500 4,999,301 - 9,721,801 Restricted assets - 518,226 - 518,226
Total cash, cash equivalents, and investments 11,838,049$ 17,833,785$ 405,727$ 30,077,561$
Business-type Activities-Enterprise Funds
37

38

Notes to the Financial Statements

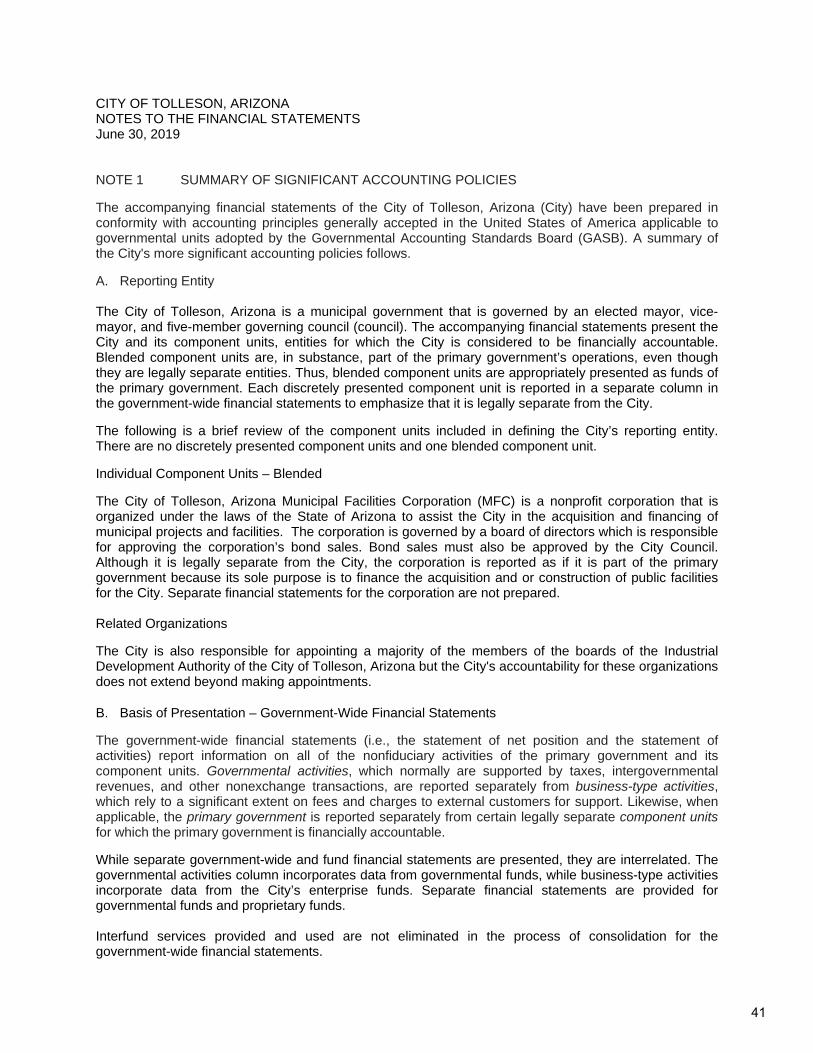
CITY OF TOLLESON, ARIZONA NOTES TO THE FINANCIAL STATEMENTS June 30, 2019
NOTE 1 SUMMARY OF SIGNIFICANT ACCOUNTING POLICIES The accompanying financial statements of the City of Tolleson, Arizona (City) have been prepared in conformity with accounting principles generally accepted in the United States of America applicable to governmental units adopted by the Governmental Accounting Standards Board (GASB). A summary of the City's more significant accounting policies follows. A. Reporting Entity The City of Tolleson, Arizona is a municipal government that is governed by an elected mayor, vice-mayor, and five-member governing council (council). The accompanying financial statements present the City and its component units, entities for which the City is considered to be financially accountable. Blended component units are, in substance, part of the primary government’s operations, even though they are legally separate entities. Thus, blended component units are appropriately presented as funds of the primary government. Each discretely presented component unit is reported in a separate column in the government-wide financial statements to emphasize that it is legally separate from the City. The following is a brief review of the component units included in defining the City’s reporting entity. There are no discretely presented component units and one blended component unit. Individual Component Units – Blended The City of Tolleson, Arizona Municipal Facilities Corporation (MFC) is a nonprofit corporation that is organized under the laws of the State of Arizona to assist the City in the acquisition and financing of municipal projects and facilities. The corporation is governed by a board of directors which is responsible for approving the corporation’s bond sales. Bond sales must also be approved by the City Council. Although it is legally separate from the City, the corporation is reported as if it is part of the primary government because its sole purpose is to finance the acquisition and or construction of public facilities for the City. Separate financial statements for the corporation are not prepared. Related Organizations The City is also responsible for appointing a majority of the members of the boards of the Industrial Development Authority of the City of Tolleson, Arizona but the City's accountability for these organizations does not extend beyond making appointments.
B. Basis of Presentation – Government-Wide Financial Statements The government-wide financial statements (i.e., the statement of net position and the statement of activities) report information on all of the nonfiduciary activities of the primary government and its component units. Governmental activities, which normally are supported by taxes, intergovernmental revenues, and other nonexchange transactions, are reported separately from business-type activities, which rely to a significant extent on fees and charges to external customers for support. Likewise, when applicable, the primary government is reported separately from certain legally separate component units for which the primary government is financially accountable. While separate government-wide and fund financial statements are presented, they are interrelated. The governmental activities column incorporates data from governmental funds, while business-type activities incorporate data from the City’s enterprise funds. Separate financial statements are provided for governmental funds and proprietary funds. Interfund services provided and used are not eliminated in the process of consolidation for the government-wide financial statements.
41

CITY OF TOLLESON, ARIZONA NOTES TO THE FINANCIAL STATEMENTS June 30, 2019
NOTE 1 SUMMARY OF SIGNIFICANT ACCOUNTING POLICIES (Continued) C. Basis of Presentation – Fund Financial Statements The fund financial statements provide information about the City’s funds, including its fiduciary funds and blended component units. Separate statements for each fund category—governmental, proprietary, and fiduciary—are presented. The emphasis of fund financial statements is on major governmental and enterprise funds, each displayed in a separate column. All remaining governmental and enterprise funds are aggregated and reported as nonmajor funds. Major individual governmental and enterprise funds are reported as separate columns in the fund financial statements. The City reports the following major governmental funds: The General Fund is the City’s primary operating fund. It accounts for all financial resources of the general government, except for those required to be accounted for in another fund. The Public Safety Tax Special Revenue Fund accounts for the government’s sales tax revenues set aside for public safety purposes and related expenditures. The Capital Projects Fund is used to account for major capital projects of the government and includes proceeds and expenditures of impact fees. The Debt Service Fund is used to account for the accumulation of resources for and the payment of long-term debt principal, interest and related costs.
The City reports the following major proprietary funds: The Water Fund accounts for the activities of pumping, treating and distribution of water. The Wastewater and Sewer Fund accounts for the activities of wastewater collection and treatment. The Sanitation and Trash Fund is used to account for the activities of the City’s sanitation operations. During the course of operations the City has activity between funds for various purposes. Any residual balances outstanding at year end are reported as due from/to other funds and advances to/from other funds. While these balances are reported in fund financial statements, certain eliminations are made in the preparation of the government-wide financial statements. Balances between the funds included in governmental activities (i.e., the governmental funds) are eliminated so that only the net amount is included as internal balances in the governmental activities column. Similarly, balances between the funds included in business-type activities (i.e., the enterprise funds) are eliminated so that only the net amount is included as internal balances in the business-type activities column. Further, certain activity occurs during the year involving transfers of resources between funds. In fund financial statements these amounts are reported at gross amounts as transfers in/out. While reported in fund financial statements, certain eliminations are made in the preparation of the government-wide financial statements. Transfers between the funds included in governmental activities are eliminated so that only the net amount is included as transfers in the governmental activities column. Similarly, balances between the funds included in business-type activities are eliminated so that only the net amount is included as internal balances in the business-type activities column.
42
CITY OF TOLLESON, ARIZONA NOTES TO THE FINANCIAL STATEMENTS June 30, 2019
NOTE 1 SUMMARY OF SIGNIFICANT ACCOUNTING POLICIES (Continued) D. Measurement Focus and Basis of Accounting The accounting and financial reporting treatment is determined by the applicable measurement focus and basis of accounting. Measurement focus indicates the type of resources being measured such as current financial resources or economic resources. The basis of accounting indicates the timing of transactions or events for recognition in the financial statements. The government-wide and proprietary fund financial statements are reported using the economic resources measurement focus and the accrual basis of accounting. Revenues are recorded when earned and expenses are recorded when a liability is incurred, regardless of the timing of related cash flows. Property taxes are recognized as revenues in the year for which they are levied. Grants and similar items are recognized as revenue as soon as all eligibility requirements imposed by the provider have been met. The governmental fund financial statements are reported using the current financial resources measurement focus and the modified accrual basis of accounting. Under this method, revenues are recognized when they become both measurable and available. The City considers all revenues reported in the governmental funds to be available if the revenues are collected within 60 days after year-end. The City’s major revenue sources that are susceptible to accrual are property taxes, special assessments, intergovernmental, charges for services, and investment earnings. Expenditures are recorded when the related fund liability is incurred, except for principal and interest on general long-term debt, claims and judgments, compensated absences, pollution remediation obligations, and asset retirement obligations, which are recognized as expenditures to the extent they are due and payable. General capital asset acquisitions are reported as expenditures in governmental funds. Issuances of general long-term debt and acquisitions under capital lease agreements are reported as other financing sources. Sales taxes, franchise taxes, intergovernmental grants and aid, and interest associated with the current fiscal period are all considered to be susceptible to accrual and so have been recognized as revenues of the current fiscal period. Entitlements are recorded as revenues when all eligibility requirements are met, including any time requirements, and the amount is received during the period or within the availability period for this revenue source (within 60 days of year-end). Expenditure-driven grants are recognized as revenue when the qualifying expenditures have been incurred and all other eligibility requirements have been met, and the amount is received during the period or within the availability period for this revenue source (within 60 days of year-end). All other revenue items are considered to be measurable and available only when cash is received by the City. The proprietary funds are reported using the economic resources measurement focus and the accrual basis of accounting. E. Deposits and Investments Cash includes cash on hand, demand deposits with banks and other financial institutions, deposits in other types of accounts or cash management pools that have the general characteristics of demand deposit accounts and short-term investments with original maturities of three months or less from the date of acquisition.
43

CITY OF TOLLESON, ARIZONA NOTES TO THE FINANCIAL STATEMENTS June 30, 2019
NOTE 1 SUMMARY OF SIGNIFICANT ACCOUNTING POLICIES (Continued) E. Deposits and Investments (Continued) Cash and investments are pooled except for funds required to be held by fiscal agents or restricted under provisions of bond indentures. Interest earned from investments purchased with such pooled monies is allocated to each of the funds based on the average daily cash balances. State statutes authorize the City to invest in obligations of the U.S. Treasury and U.S. agencies, certificates of the deposit in eligible depositories, repurchase agreements, obligations of the State of Arizona or any of its counties or incorporated cities, towns, or duly organized school districts, improvement districts in this state and the State Treasurer’s Local Government Investment Pool. Investments are stated at fair value. F. Receivables and Payables Activity between funds that are representative of lending/borrowing arrangements outstanding at the end of the fiscal year are referred to as “Internal balances” in the Statement of Net Position and as “Due to” or “Due from” other funds in the fund financial statements. All trade accounts receivable in the proprietary funds are shown net of an allowance for doubtful accounts. G. Inventories and Prepaid Items Purchases of inventory items are recorded at the time of purchase as expenditures in the funds from which the purchases were made; and because the amounts on hand at June 30, 2019, were immaterial, they are not included in the balance sheet. Certain payments to vendors reflect costs applicable to future accounting periods and are recorded as prepaid items in both the government-wide and fund financial statements. H. Restricted Assets Certain proceeds of the City’s bonds and loans are classified as restricted assets on the statement of net position because their use is limited by applicable bond or loan covenants.
44
CITY OF TOLLESON, ARIZONA NOTES TO THE FINANCIAL STATEMENTS June 30, 2019
NOTE 1 SUMMARY OF SIGNIFICANT ACCOUNTING POLICIES (Continued) I. Capital Assets Capital assets, which include property, plant, equipment, and infrastructure assets (e.g., roads, bridges, sidewalks, and similar items), are reported in the applicable governmental or business-type activity columns in the government-wide financial statements and in the proprietary fund financial statements. Capital assets are defined by the City as assets with an individual cost of more than $5,000 and an estimated useful life in excess of one year. Capitalized assets are recorded at actual cost (or historical cost or estimated historical cost if historical records are not available). Donated capital assets are recorded at acquisition value. The costs of normal maintenance and repairs that do not add to the value of the asset or materially extend assets lives are not capitalized. Interest incurred during the construction phase of capital assets of business-type activities is included as part of the capitalized value of the assets constructed. Land, construction in progress, and water rights are not depreciated. The other property, plant, and equipment are depreciated using the straight-line method over the following estimated useful lives:
Building and improvements 40 years
Water plant 50 years
Sewer plant 50 years
Furniture, equipment, and vehicles 5 to 20 years
Infrastructure 50 years J. Deferred Outflows/Inflows of Resources The statement of net position and balance sheet include separate sections for deferred outflows of resources and deferred inflows of resources. Deferred outflows of resources represent a consumption of net position that applies to future periods that will be recognized as an expense or expenditure in future periods. Deferred inflows of resources represent an acquisition of net position or fund balance that applies to future periods and will be recognized as a revenue in future periods. K. Postemployment benefits For purposes of measuring the net pension liability, deferred outflows of resources and deferred inflows of resources related to pensions, and pension expense, information about the pension plan’s fiduciary net position of the Arizona State Retirement System (ASRS), Elected Officials Retirement Plan (EORP), and the Public Safety Personnel Retirement System (PSPRS) and additions to/deductions from the plan’s fiduciary net position have been determined on the same basis as they are reported by ASRS, EORP, and PSPRS. For this purpose, benefit payments (including refunds of employee contributions) are recognized when due and payable in accordance with the benefit terms. Investments are reported at fair value. ASRS, EORP, and PSPRS net OPEB assets/liabilities have not been recorded, or further disclosed, at June 30, 2019 in accordance with GASB Statement 75, due to the relative insignificance to the City's financial statements.
45

CITY OF TOLLESON, ARIZONA NOTES TO THE FINANCIAL STATEMENTS June 30, 2019
NOTE 1 SUMMARY OF SIGNIFICANT ACCOUNTING POLICIES (Continued) L. Net Position Flow Assumption Sometimes the City will fund outlays for a particular purpose from both restricted (e.g., restricted bond or grant proceeds) and unrestricted resources. In order to calculate the amounts to report as restricted – net position and unrestricted – net position in the government-wide and proprietary fund financial statements, a flow assumption must be made about the order in which the resources are considered to be applied. It is the City’s policy to consider restricted – net position to have been depleted before unrestricted – net position is applied. M. Fund Balance Flow Assumptions Sometimes the City will fund outlays for a particular purpose from both restricted and unrestricted resources (the total of committed, assigned, and unassigned fund balance). In order to calculate the amounts to report as restricted, committed, assigned, and unassigned fund balance in the governmental fund financial statements a flow assumption must be made about the order in which the resources are considered to be applied. It is the City’s policy to consider restricted fund balance to have been depleted before using any of the components of unrestricted fund balance. Further, when the components of unrestricted fund balance can be used for the same purpose, committed fund balance is depleted first, followed by assigned fund balance. Unassigned fund balance is applied last. N. Fund Balance Policies Fund balance of governmental funds is reported in various categories based on the nature of any limitations requiring the use of resources for specific purposes. The City itself can establish limitations on the use of resources through either a commitment (committed fund balance) or an assignment (assigned fund balance). The committed fund balance classification includes amounts that can be used only for the specific purposes determined by a formal action of the City’s highest level of decision-making authority. The governing council is the highest level of decision-making authority for the City that can, by adoption of an ordinance prior to the end of the fiscal year, commit fund balance. Once adopted, the limitation imposed by the ordinance remains in place until a similar action is taken (the adoption of another ordinance) to remove or revise the limitation. Amounts in the assigned fund balance classification are intended to be used by the City for specific purposes but do not meet the criteria to be classified as committed. The City Manager is authorized to assign amounts to a specific purpose in accordance with the City’s budget policy. The council may also assign fund balance as it does when appropriating fund balance to cover a gap between estimated revenue and appropriations in the subsequent year’s appropriated budget. Unlike commitments, assignments generally only exist temporarily. In other words, an additional action does not normally have to be taken for the removal of an assignment. Conversely, as discussed above, an additional action is essential to either remove or revise a commitment.
46

CITY OF TOLLESON, ARIZONA NOTES TO THE FINANCIAL STATEMENTS June 30, 2019
NOTE 1 SUMMARY OF SIGNIFICANT ACCOUNTING POLICIES (Continued)
O. Program Revenues
Amounts reported as program revenues include 1) charges to customers or applicants who purchase, use, or directly benefit from goods, services, or privileges provided by a given function or segment and 2) grants and contributions (including special assessments) that are restricted to meeting the operational or capital requirements of a particular function or segment. All taxes, including those dedicated for specific purposes, and other internally dedicated resources are reported as general revenues rather than as program revenues.
P. Property taxes
Property taxes are levied by the City and collected by the Maricopa County Treasurer. Property tax revenues are recognized as revenues in the year collected or if collected within 60 days thereafter unless they are prepaid. Maricopa County levies real property taxes on or before the third Monday in August, which become due and payable in two equal installments on October 1 of the current year and March 1 of the subsequent year. Taxes become delinquent after the first business day of November and May, respectively. Interest attaches on installments after the delinquency date. The County also levies various personal property taxes during the year. A lien against property assessed attaches on the first day of January preceding the assessment and levy.
Q. Compensated Absences
The liability for compensated absences reported in the government-wide statements consists of unpaid, accumulated leave balances. The liability has been calculated using the vesting method, in which leave amounts for both employees who currently are eligible to receive termination payments and other employees who are expected to become eligible in the future to receive such payments upon termination. For governmental funds, amounts of vested or accumulated vacation and sick leave that are not expected to be liquidated with expendable available financial resources are reported as liabilities in the government-wide statement of net position and as expenses in the government-wide statement of activities. No expenditures are reported for these amounts in the fund financial statements unless they have matured, for example, as a result of employee resignations and retirements. Vested or accumulated vacation and sick leave in the proprietary fund are recorded as an expense and a liability of that fund as the benefits accrue to the employees and are thus recorded in both the government-wide financial statements and the individual fund financial statements.
R. Proprietary Funds Operating and Non-operating Revenues and Expenses
Proprietary funds distinguish operating revenues and expenses from non-operating items. Operating revenues and expenses generally result from providing services and producing and delivering goods in connection with a proprietary fund’s principal ongoing operations. The principal operating revenues of proprietary funds are charges to customers for sales and services. Operating expenses for enterprise funds and internal service funds include the cost of sales and services, administrative expenses, and depreciation on capital assets. All revenues and expenses not meeting this definition are reported as non-operating revenues and expenses.
47

CITY OF TOLLESON, ARIZONA NOTES TO THE FINANCIAL STATEMENTS June 30, 2019
NOTE 1 SUMMARY OF SIGNIFICANT ACCOUNTING POLICIES (Continued) S. Use of Estimates The preparation of financial statements in conformity with accounting principles generally accepted in the United States of America requires management to make estimates and assumptions that affect the reported amounts of assets and liabilities and disclosure of contingent assets and liabilities at the date of the financial statements and the reported amounts of revenues and expenditures/expenses during the reporting period. Actual results could differ from those estimates. T. Budgets and Budgetary Accounting Annual budgets are adopted on a basis consistent with generally accepted accounting principles for all governmental funds. All annual appropriations lapse at year end. The City Council follows these procedures in establishing the budgetary data reflected in the financial statements:
1. In accordance with Arizona Revised Statutes, the City Manager submits a proposed budget for the fiscal year commencing the following July 1 to the City Council. The operating budget includes proposed expenditures and the means of financing them for the upcoming year.
2. Public hearings are conducted to obtain taxpayer comment.
3. Prior to the third Monday in August, the expenditure limitation for the City is legally enacted through passage of an ordinance. To ensure compliance with the expenditure limitation, a uniform expenditure report must be filed with the State each year. This report, issued under a separate cover, reconciles total City expenditures from the audited financial statements to total expenditures for reporting in accordance with the State’s uniform expenditure reporting system (A.R.S. §41-1279.07).
4. State law requires that, each year, prior to April 1, the Economic Estimates Commission provides the government with a final expenditure limit for the coming fiscal year.
5. Expenditures may not legally exceed the expenditure limitation of all fund types as a whole. For
management purposes, the City adopts a budget by department for the General Fund and in total by fund for other funds. The City Manager, subject to City Council approval, may at any time, transfer any unencumbered appropriation balance or portion thereof between a department or activity. The adopted budget cannot be amended in any way without City Council approval.
6. The City has adopted budgets in accordance with A.R.S. requirements and utilizes the budgets as a management control device during the year for the General, Special Revenue, Debt Service and Capital Projects Funds. The budgets are prepared on essentially the same modified accrual basis of accounting used to record actual revenues and expenditures.
The City is subject to the State of Arizona’s Spending Limitation Law for Towns and Cities. This law does not permit the City to spend more than budgeted revenues plus the carry-over unrestricted cash balance from the prior fiscal year. The limitation is applied to the total of the combined funds. The City complied with this law during the year. Supplementary budgetary appropriations were necessary during the year.
48

CITY OF TOLLESON, ARIZONA NOTES TO THE FINANCIAL STATEMENTS June 30, 2019
NOTE 1 SUMMARY OF SIGNIFICANT ACCOUNTING POLICIES (Continued)
T. Budgets and Budgetary Accounting (Continued)
Encumbrance accounting, under which purchase orders, contracts, and other commitments for the expenditure of monies are recorded in order to reserve that portion of the applicable appropriation, is not employed by the City.
U. Expenditures over Appropriations
Expenditures may not legally exceed budgeted appropriations at the department level. The individual Statements of Revenues, Expenditures and Changes in Fund Balances - Budget and Actual reports found in the basic financial statements and the other supplementary information present all of the departments which incurred an excess of expenditures/expenses over appropriations for the year ended June 30, 2019, if any.
V. Change in accounting principle
For the year ended June 30, 2019, the City implemented the provisions of Governmental Accounting Standards Board (GASB) Statement No. 88, Certain Disclosures Related to Debt, including Direct Borrowings and Direct Placements. GASB Statement No. 88 requires disclosure of information related to long-term debt. Implementing GASB Statement No. 88 did not have a material effect on the City’s financial statements.
NOTE 2 CASH AND INVESTMENTS
The following table summarizes the City’s cash and investments at June 30, 2019:
Governmental Activities
Business-type Activities Total
Cash and cash equivalents 10,911,159$ 19,837,534$ 30,748,693$
Restricted assets 11,545,218 518,226 12,063,444
Investments 13,224,086 9,721,801 22,945,887
Total 35,680,463$ 30,077,561$ 65,758,024$
Deposits
Cash in bank - At June 30, 2019, the City had $3,750 of cash on hand. The carrying amount of the City’s cash in bank totaled $9,278,604 and the bank balance was $9,836,157. Of the bank balance, $250,000 was covered by Federal Depository Insurance and $9,586,157 was covered by collateral held in the pledging bank’s trust department not in the City’s name.
49

CITY OF TOLLESON, ARIZONA NOTES TO THE FINANCIAL STATEMENTS June 30, 2019
NOTE 2 CASH AND INVESTMENTS (Continued) Investments The City invests in the Local Government Investment Pool 5 (LGIP), an investment pool managed by the State Treasurer’s Office that allows governments within the State to pool their funds for investment purposes. The State Board of Investment provides oversight for the State Treasurer’s investment pools. Investments in the State Treasurer’s investment pools are valued at the pool’s share price multiplied by the number of shares the City held. The fair value of a participant’s position in the pools approximates the value of that participant’s pool shares. Participants in the pool are not required to categorize the value of shares in accordance with the fair value hierarchy. The LGIP is registered with the Securities Exchange Commission under the 1940 Investment Advisors Act and is rated by Standard & Poors with AAAf/S1+. The Arizona State Treasurer issues a publicly available financial report that includes financial statements and required supplementary information. Copies may be obtained by contacting the Arizona State Treasurer, 1700 West Washington, Phoenix, Arizona 85007. Funds held in the State Treasurer’s Local Government Investment Pool represent a proportionate interest in the pool’s portfolio; however, the City’s portion is not identified with specific investments and is not subject to custodial credit risk. At June 30, 2019, the City’s funds invested with the State Treasurer totaled $21,984,565. Restricted assets - At June 30, 2019, the City had restricted cash and cash equivalents of $518,226 which was restricted for debt payments and restricted investments of $11,545,218 which included $10,850,000 of unspent debt proceeds to be used for capital projects and $695,218 for debt reserves.
50

CITY OF TOLLESON, ARIZONA NOTES TO THE FINANCIAL STATEMENTS June 30, 2019
NOTE 2 CASH AND INVESTMENTS (Continued) Interest Rate Risk Interest rate risk is the risk that changes in market interest rates will adversely affect the fair value of an investment. Generally, the longer the maturity of an investment, the greater the sensitivity of its fair value to changes in market interest rates. Information about the sensitivity of the fair values of the City’s investments to market interest rate fluctuations is provided by the following table that shows the distribution of City’s investments by maturity:
2019 12 Months 13 to 24 25 to 60 More Than
Investment Type Amount or Less Months Months 60 Months
U.S. Treasury Notes 18,121,255$ 6,746,325$ 2,689,634$ 8,685,296$ -$
International Bank of Recon 1,188,270 - 487,253 701,017 -
Inter-American Development Bank Note 225,558 - 225,558 - -
Asian Development Bank Note 170,751 - 170,751 - -
International Finance Corporation Note 352,473 - 352,473 - -
African Development Bank Notes 202,447 - 202,447 - - Federal Agency Collateralized Mortgage Obligations 3,300,948 221,394 1,655,943 1,423,611 -
Federal Agency Notes 671,630 - 671,630 - -
Fannie Mae Notes 1,312,291 - 781,492 530,799 -
Freddie Mac Notes 453,897 - 453,897 - -
Federal Home Loan Bank Notes 2,392,459 - - 2,392,459 -
PFM Government Money Market Fund 6,099,126 6,099,126 - - -
State Investment Pool (LGIP) 21,984,565 21,984,565 - - -
56,475,670$ 35,051,410$ 7,691,078$ 13,733,182$ -$
Remaining Maturity (In Months)
51

CITY OF TOLLESON, ARIZONA NOTES TO THE FINANCIAL STATEMENTS June 30, 2019
NOTE 2 CASH AND INVESTMENTS (Continued) Credit Risk Credit risk is the risk that an issuer of an investment will not fulfill its obligation to the holder of the investment. This is measured by the assignment of a rating by a nationally recognized statistical rating organization. The City does not have a formal investment policy regarding credit risk. However, the City is prohibited by State law from investing in investments other than obligations of the U.S. Treasury and U.S. agencies, certificates of deposit in eligible depositories, repurchase agreements, obligations of the State of Arizona or any of its counties or incorporated cities, towns or duly organized school districts, improvement districts in this State and the State Treasurer’s Local Investment Pool. Presented below is the actual rating as of year-end for each investment type.
2019
Investment Type Amount Rating Agency Rating
U.S. Treasury Notes 18,121,255$ Moody's Aaa
International Bank of Recon 1,188,270 Moody's Aaa
Inter-American Development Bank Note 225,558 Moody's Aaa
Asian Development Bank Note 170,751 Moody's Aaa
International Finance Corporation Note 352,473 Moody's Aaa
African Development Bank Notes 202,447 Moody's Aaa
Federal Agency Collateralized Mortgage Obligations 3,300,948 Moody's Aaa
Federal Agency Notes 671,630 Moody's Aaa
Fannie Mae Notes 1,312,291 Moody's Aaa
Freddie Mac Notes 453,897 Moody's Aaa
Federal Home Loan Bank Notes 2,392,459 Moody's Aaa
PFM Government Money Market Fund 6,099,126 Unrated
State Investment Pool (LGIP) 21,984,565 Standard and Poors AAAf/S1+
56,475,670$
52

CITY OF TOLLESON, ARIZONA NOTES TO THE FINANCIAL STATEMENTS June 30, 2019
NOTE 2 CASH AND INVESTMENTS (Continued) Concentration of Credit Risk At June 30, 2019, the City’s investments are included as follows:
Reported
Issuer Amount Concentration
U.S. Treasury Notes 18,121,255$ 32.1%
International Bank of Recon 1,188,270 2.1%
Inter-American Development Bank Note 225,558 0.4%
Asian Development Bank Note 170,751 0.3%
International Finance Corporation Note 352,473 0.6%
African Development Bank Notes 202,447 0.4%
Federal Agency Collateralized Mortgage Obligations 3,300,948 5.8%
Federal Agency Notes 671,630 1.2%
Fannie Mae Notes 1,312,291 2.3%
Freddie Mac Notes 453,897 0.8%
Federal Home Loan Bank Notes 2,392,459 4.2%
PFM Government Money Market Fund 6,099,126 10.8%
State Investment Pool (LGIP) 21,984,565 38.9%
56,475,670$ 100%
53

CITY OF TOLLESON, ARIZONA NOTES TO THE FINANCIAL STATEMENTS June 30, 2019
NOTE 2 CASH AND INVESTMENTS (Continued) Fair value measurement Investments are measured at fair value. Fair value measurements are categorized based on the valuation inputs used to measure an asset’s fair value: Level 1 inputs are quoted prices in active markets for identical assets; Level 2 inputs are significant other observable inputs; Level 3 inputs are significant unobservable inputs. Investments’ fair value measurements are as follows at June 30, 2019:
Investments By Fair Value Level Amount Level 1 Level 2 Level 3
U.S. Treasury Notes 18,121,255$ -$ 18,121,255$ -$
International Bank of Recon 1,188,270 - 1,188,270 -
Inter-American Development Bank Note 225,558 - 225,558 -
Asian Development Bank Note 170,751 - 170,751 -
International Finance Corporation Note 352,473 - 352,473 -
African Development Bank Notes 202,447 - 202,447 - Federal Agency Collateralized Mortgage Obligations 3,300,948 - 3,300,948 -
Federal Agency Notes 671,630 - 671,630 -
Fannie Mae Notes 1,312,291 - 1,312,291 -
Freddie Mac Notes 453,897 - 453,897 -
Federal Home Loan Banks 2,392,459 - 2,392,459 -
Total Investments by Fair Value Level 28,391,979$ -$ 28,391,979$ -$
External Investment Pool Measured
at Fair Value
State Investment Pool (LGIP) 21,984,565$
Total Investments Measured at Fair Value 50,376,544
Investments Measured at Amortized Costs
PFM Government Money Market Fund 6,099,126
Total Investments 56,475,670$
Fair Value Measurement Using
Investments categorized as Level 2 are valued using a matrix pricing technique. Matrix pricing is a method of supplying system-generated prices to assets using yield curves that is defined by SEI Investments Company. Investments in the State Treasurer’s investment pools are valued at the pool’s share price multiplied by the number of shares the City held. The fair value of a participant’s position in the pool approximates the value of that participant’s pool shares. The State Board of Investment provides oversight for the State Treasurer’s investment pools.
54

CITY OF TOLLESON, ARIZONA NOTES TO THE FINANCIAL STATEMENTS June 30, 2019
NOTE 3 RECEIVABLES Intergovernmental receivables consist principally of amounts due from the State of Arizona for various taxes, shared revenues, and highway user revenues. Receivables, net of allowance for uncollectible as of year-end for the City’s individual major governmental funds and nonmajor governmental funds in the aggregate are as follows:
Non-Major Total
Public Capital Debt Gov. Gov.
Receivables: General Safety Tax Projects Service Funds Funds
Accounts receivable 204,908$ 35,228$ -$ -$ -$ 240,136$
Interest receivable 85,204 - 25,277 - - 110,481
Taxes receivable 68,390 - - 71,395 139,785
Intergovernmental receivable 4,120,187 - - - 352,816 4,473,003
4,478,689$ 35,228$ 25,277$ 71,395$ 352,816$ 4,963,405$
Receivables in the proprietary funds are service billings receivable and are shown net of an allowance for doubtful accounts.
Water Sewer Sanitation Total
Receivables: Fund Fund Fund Enterprise
Accounts receivable 1,221,436$ 1,543,032$ 90,386$ 2,854,854$
Interest receivable 31,622 27,266 - 58,888
Taxes receivable 76,419 3,609 - 80,028
Less: Allowance for doubtful accounts (90,772) (15,463) (13,097) (119,332)
Net Receivables 1,238,705$ 1,558,444$ 77,289$ 2,874,438$
55
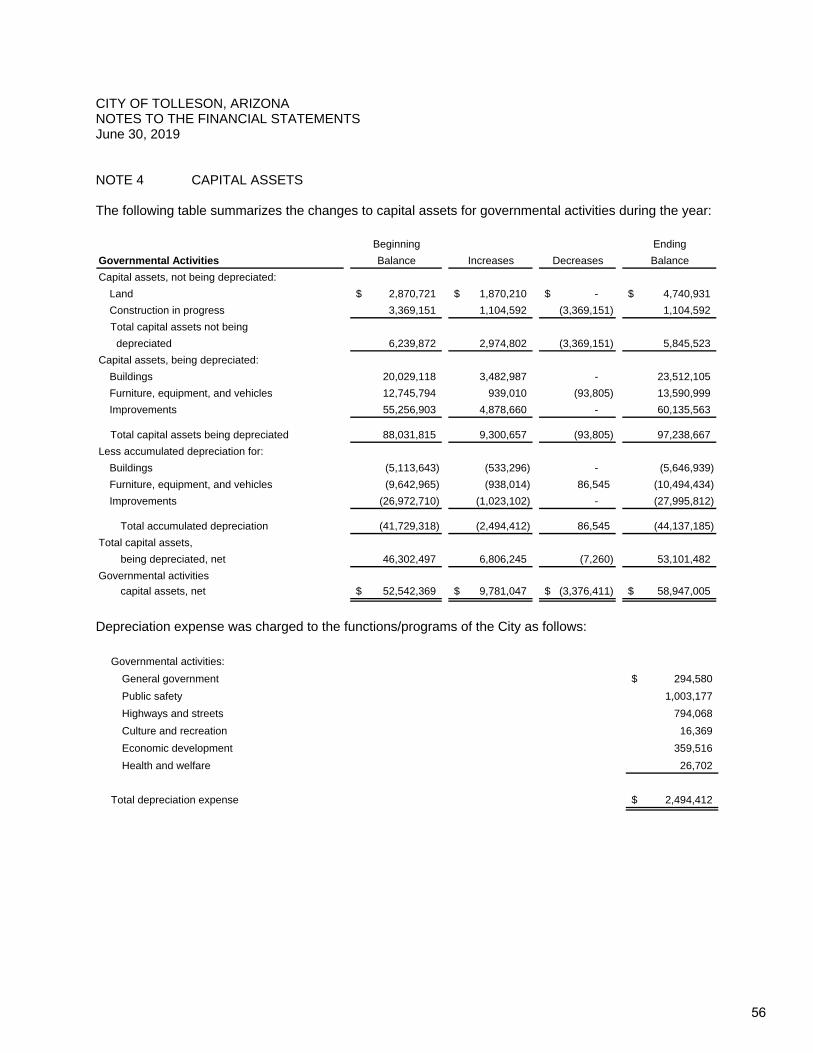
CITY OF TOLLESON, ARIZONA NOTES TO THE FINANCIAL STATEMENTS June 30, 2019
NOTE 4 CAPITAL ASSETS The following table summarizes the changes to capital assets for governmental activities during the year:
Beginning Ending
Governmental Activities Balance Increases Decreases Balance
Capital assets, not being depreciated:
Land 2,870,721$ 1,870,210$ -$ 4,740,931$
Construction in progress 3,369,151 1,104,592 (3,369,151) 1,104,592
Total capital assets not being
depreciated 6,239,872 2,974,802 (3,369,151) 5,845,523
Capital assets, being depreciated:
Buildings 20,029,118 3,482,987 - 23,512,105
Furniture, equipment, and vehicles 12,745,794 939,010 (93,805) 13,590,999
Improvements 55,256,903 4,878,660 - 60,135,563
Total capital assets being depreciated 88,031,815 9,300,657 (93,805) 97,238,667
Less accumulated depreciation for:
Buildings (5,113,643) (533,296) - (5,646,939)
Furniture, equipment, and vehicles (9,642,965) (938,014) 86,545 (10,494,434)
Improvements (26,972,710) (1,023,102) - (27,995,812)
Total accumulated depreciation (41,729,318) (2,494,412) 86,545 (44,137,185)
Total capital assets,
being depreciated, net 46,302,497 6,806,245 (7,260) 53,101,482
Governmental activities
capital assets, net 52,542,369$ 9,781,047$ (3,376,411)$ 58,947,005$
Depreciation expense was charged to the functions/programs of the City as follows:
Governmental activities:
General government 294,580$
Public safety 1,003,177
Highways and streets 794,068
Culture and recreation 16,369
Economic development 359,516
Health and welfare 26,702
Total depreciation expense 2,494,412$
56

CITY OF TOLLESON, ARIZONA NOTES TO THE FINANCIAL STATEMENTS June 30, 2019
NOTE 4 CAPITAL ASSETS (Continued) The following table summarizes the changes to capital assets for business-type activities during the year.
Beginning Ending
Business-Type Activities Balance Increases Decreases Balance
Capital assets, not being depreciated:
Land 3,933,202$ -$ -$ 3,933,202$
Construction in progress - 155,909 - 155,909
Total capital assets not being
depreciated 3,933,202 155,909 - 4,089,111
Capital assets, being depreciated:
Buildings 42,489,756 - - 42,489,756
Improvements other than buildings 17,549,681 40,777 - 17,590,458
Machinery and equipment 41,872,099 83,557 (19,452) 41,936,204
Vehicles 1,596,511 86,578 (21,631) 1,661,458
Total capital assets being depreciated 103,508,047 210,912 (41,083) 103,677,876
Less accumulated depreciation for:
Buildings (14,724,114) (823,713) - (15,547,827)
Improvements other than buildings (7,311,453) (356,939) - (7,668,392)
Machinery and equipment (22,204,966) (1,034,997) 19,452 (23,220,511)
Vehicles (1,251,619) (33,517) 21,631 (1,263,505)
Total accumulated deprecation (45,492,152) (2,249,166) 41,083 (47,700,235)
Total capital assets,
being depreciated, net 58,015,895 (2,038,254) - 55,977,641
Business-Type activities
capital assets, net 61,949,097$ (1,882,345)$ -$ 60,066,752$
Depreciation expense was charged to the functions/programs of the City as follows:
Business-type activities
Wastewater & sewer 1,742,385$
Water 501,131
Sanitation 5,650
Total depreciation expense 2,249,166$
57

CITY OF TOLLESON, ARIZONA NOTES TO THE FINANCIAL STATEMENTS June 30, 2019
NOTE 5 LONG-TERM DEBT
The following is a summary of changes in long-term obligations for the year ended June 30, 2019:
Balance Balance Due Within
6/30/18 Additions Retirements 6/30/19 One Year
Governmental Activities:
Bonds payable $ 14,078,500 $ 10,850,000 $ (958,100) $ 23,970,400 $ 1,823,715
Bond premiums 167,097 1,005,367 (43,137) 1,129,327 -
Total bonds payable 14,245,597 11,855,367 (1,001,237) 25,099,727 1,823,715
Compensated absences 2,429,549 1,041,467 (1,055,797) 2,415,219 579,652
Developer agreement payable 1,759,967 - (407,412) 1,352,555 425,000
Net pension liability 16,675,302 - (418,480) 16,256,822 -
Total other long term debt 20,864,818 1,041,467 (1,881,689) 20,024,596 1,004,652
Total Governmental Activities $ 35,110,415 $ 12,896,834 $ (2,882,926) $ 45,124,323 $ 2,828,367
Business-type Activities:
Bonds payable $ 6,836,500 $ - $ (2,976,900) $ 3,859,600 $ 1,836,285
Premium on bonds 56,990 - (13,664) 43,326 -
Total bonds payable 6,893,490 - (2,990,564) 3,902,926 1,836,285
Loans payable 6,486,635 - (449,225) 6,037,410 464,067
Compensated absences 531,258 201,821 (211,221) 521,858 234,836
Net pension liability 4,224,609 - (232,055) 3,992,554 -
Total other long term debt 11,242,502 201,821 (892,501) 10,551,822 698,903
Total Business-type Activities $ 18,135,992 $ 201,821 $ (3,883,065) $ 14,454,748 $ 2,535,188
Total long-term liabilities $ 53,246,407 $ 13,098,655 $ (6,765,991) $ 59,579,071 $ 5,363,555
Generally, for governmental activities, compensated absences and net pension liabilities are liquidated by the General Fund.
Debt service requirements to maturity for bonds and loans payable are as follows:
Fiscal year ending June 30, Principal Interest Principal Interest
2020 1,823,715$ 1,013,860$ 2,300,352$ 350,497$
2021 2,088,563 947,999 1,375,837 265,075
2022 2,159,604 863,307 855,634 213,379
2023 2,269,376 772,122 887,225 182,600
2024 2,324,142 685,297 919,362 150,672
2025 - 2029 7,030,000 2,325,393 2,916,280 401,432
2029-2030 6,275,000 1,324,750 642,321 21,222
Total 23,970,400$ 7,932,728$ 9,897,011$ 1,584,877$
Governmental Activities Business-type Activities
58
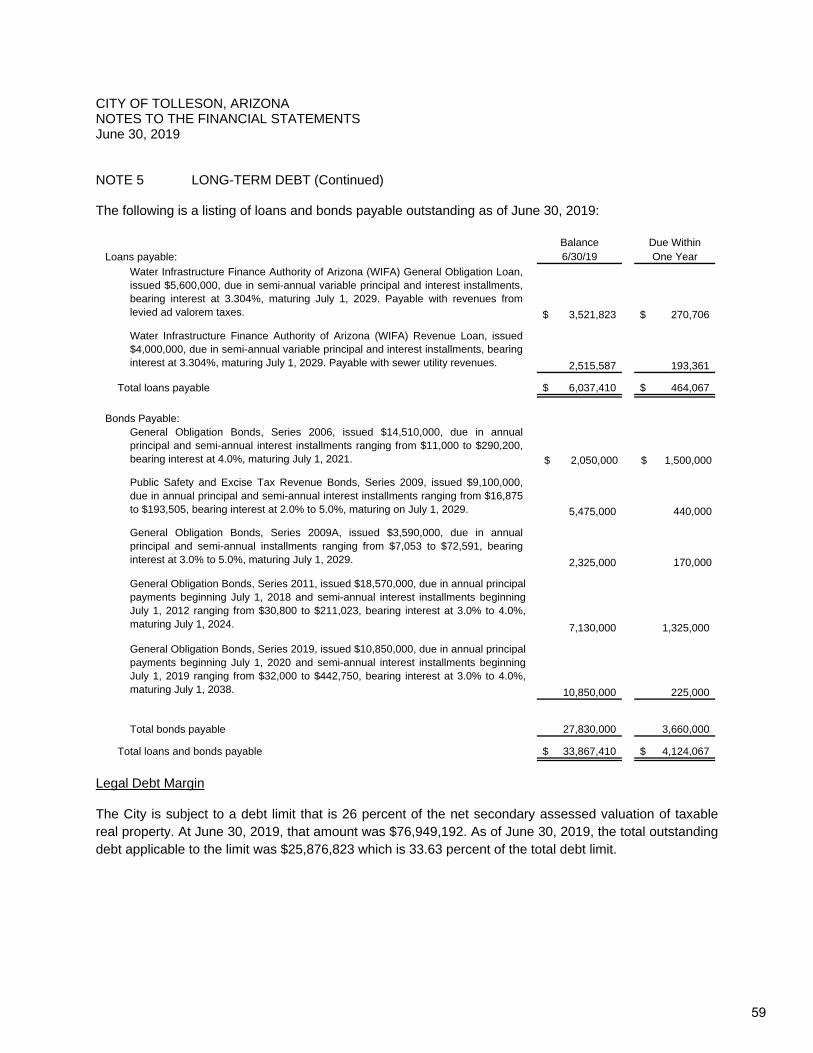
CITY OF TOLLESON, ARIZONA NOTES TO THE FINANCIAL STATEMENTS June 30, 2019
NOTE 5 LONG-TERM DEBT (Continued)
The following is a listing of loans and bonds payable outstanding as of June 30, 2019:
Balance Due WithinLoans payable: 6/30/19 One Year
3,521,823$ 270,706$
2,515,587 193,361
Total loans payable 6,037,410$ 464,067$
Bonds Payable:
$ 2,050,000 $ 1,500,000
5,475,000 440,000
2,325,000 170,000
7,130,000 1,325,000
10,850,000 225,000
27,830,000 3,660,000
Total loans and bonds payable 33,867,410$ 4,124,067$
Water Infrastructure Finance Authority of Arizona (WIFA) General Obligation Loan,issued $5,600,000, due in semi-annual variable principal and interest installments,bearing interest at 3.304%, maturing July 1, 2029. Payable with revenues fromlevied ad valorem taxes.
Water Infrastructure Finance Authority of Arizona (WIFA) Revenue Loan, issued$4,000,000, due in semi-annual variable principal and interest installments, bearinginterest at 3.304%, maturing July 1, 2029. Payable with sewer utility revenues.
General Obligation Bonds, Series 2006, issued $14,510,000, due in annual principal and semi-annual interest installments ranging from $11,000 to $290,200, bearing interest at 4.0%, maturing July 1, 2021.
Public Safety and Excise Tax Revenue Bonds, Series 2009, issued $9,100,000, due in annual principal and semi-annual interest installments ranging from $16,875 to $193,505, bearing interest at 2.0% to 5.0%, maturing on July 1, 2029.
General Obligation Bonds, Series 2009A, issued $3,590,000, due in annual principal and semi-annual installments ranging from $7,053 to $72,591, bearing interest at 3.0% to 5.0%, maturing July 1, 2029.
General Obligation Bonds, Series 2011, issued $18,570,000, due in annual principal payments beginning July 1, 2018 and semi-annual interest installments beginning July 1, 2012 ranging from $30,800 to $211,023, bearing interest at 3.0% to 4.0%, maturing July 1, 2024.
General Obligation Bonds, Series 2019, issued $10,850,000, due in annual principal payments beginning July 1, 2020 and semi-annual interest installments beginning July 1, 2019 ranging from $32,000 to $442,750, bearing interest at 3.0% to 4.0%, maturing July 1, 2038.
Total bonds payable
Legal Debt Margin
The City is subject to a debt limit that is 26 percent of the net secondary assessed valuation of taxable real property. At June 30, 2019, that amount was $76,949,192. As of June 30, 2019, the total outstanding debt applicable to the limit was $25,876,823 which is 33.63 percent of the total debt limit.
59

CITY OF TOLLESON, ARIZONA NOTES TO THE FINANCIAL STATEMENTS June 30, 2019
NOTE 6 INTERFUND RECEIVABLES, PAYABLES AND TRANSFERS
As of June 30, 2019, there were no interfund receivables and payables that resulted from interfund transactions.
Interfund transfers for the fiscal year ended June 30, 2019 are as follows:
Transfers Transfers
Fund Out In
General Fund 305,239$ -$
Capital Projects 25,447 -
Non-Major Governmental Funds - (305,239)
Water Fund - (25,447)
Total 330,686$ (330,686)$
Transfers were made to fund various capital improvements, provide funds for debt service payments due on bonds and loans, local matching requirements on various grants, and to support operations.
NOTE 7 PENSIONS
The City contributes to the plans described below. The plans are component units of the State of Arizona.
At June 30, 2019, the City reported the following aggregate amounts related to pensions for all plans to which it contributes:
Statement of Net Position and Statement of Activities Governmental Activities Business-type Activites Total
Net pension liabilities 16,256,822$ 3,992,554$ 20,249,376$
Deferred outflows of resources 6,438,615 715,959 7,154,574
Deferred inflows of resources 1,971,240 449,780 2,421,020
Pension expense 2,541,134 194,041 2,735,175
The City reported $3,240,276 of pension contributions as expenditures in the governmental funds related to all pension plans to which it contributes.
Net OPEB asset/liabilities have not been recorded, or further disclosed, at June 30, 2019 in accordance with GASB Statement 75, due to the relative insignificance to the City's financial statements.
A. Arizona State Retirement System
Plan Description – City employees not covered by the other pension plan described below participate in the Arizona State Retirement System (ASRS). The ASRS administers a cost-sharing multiple-employer defined benefit pension plan, a cost-sharing multiple-employer defined benefit health insurance premium benefit (OPEB) plan, and a cost-sharing multiple-employer defined benefit long-term disability (OPEB) plan. The Arizona State Retirement System Board governs the ASRS according to the provisions of A.R.S. Title 38, Chapter 5, Articles 2 and 2.1. The ASRS issues a publicly available financial report that includes its financial statements and required supplementary information. The report is available on its Web site at www.azasrs.gov.
60

CITY OF TOLLESON, ARIZONA NOTES TO THE FINANCIAL STATEMENTS June 30, 2019
NOTE 7 PENSIONS (Continued) Benefits Provided - The ASRS provides retirement, health insurance premium supplement, long-term disability, and survivor benefits. State statute establishes benefits terms. Retirement benefits are calculated on the basis of age, average monthly compensation, and service credit as follows:
Retirement
Initial membership date:
ASRS Before July 1, 2011 On or after July 1, 2011
Sum of years and age equals 80 30 years age 55
10 years age 62 25 years age 60
5 years age 50* 10 years age 62
any years age 65 5 years age 50*
any years age 65
*with actuarially reduced benefits.
Benefit percent per year of service 2.1% to 2.3% 2.1% to 2.3%
Years of service and age required to receive benefit
Highest 36 consecutive months of last 120 months
Final average salary is based on
Highest 60 consecutive months of last 120 months
Retirement benefits for members who joined the ASRS prior to September 13, 2013, are subject to automatic cost-of-living adjustments based on excess investment earning. Members with a membership date on or after September 13, 2013, are not eligible for cost-of-living adjustments. Survivor benefits are payable upon a member’s death. For retired members, the survivor benefit is determined by the retirement benefit option chosen. For all other members, the beneficiary is entitled to the member’s account balance that includes the member’s contributions and employer’s contributions, plus interest earned. Contributions - In accordance with state statutes, annual actuarial valuations determine active member and employer contribution requirements. The combined active member and employer contribution rates are expected to finance the costs of benefits employees earn during the year, with an additional amount to finance any unfunded accrued liability. For the year ended June 30, 2019, active ASRS members were required by statute to contribute at the actuarially determined rate of 11.8 percent (11.64 percent for retirement and 0.16 percent for long-term disability) of the members’ annual covered payroll, and the City was required by statute to contribute at the actuarially determined rate of 11.8 percent (11.18 percent for retirement, 0.46 percent for health insurance premium benefit, and 0.16 percent for long-term disability) of the active members’ annual covered payroll. In addition, the City was required by statute to contribute at the actuarially determined rate of 10.53 percent (10.41 percent for retirement, 0.06 percent for health insurance premium benefit, and 0.06 percent for long-term disability) of annual covered payroll of retired members who worked for the City in positions that an employee who contributes to the ASRS would typically fill. The City’s contributions to the pension, health insurance premium benefit, and long-term disability plans for the year ended June 30, 2019 were $989,715, $40,722, and $14,164, respectively. During fiscal year 2019, the City paid for ASRS pension contributions as follows: 67 percent from the General Fund, 2 percent from other Non-Major Funds, 10 percent from the Water Fund, 20 percent from the Sewer Fund and 1 percent from the Sanitation Fund.
61

CITY OF TOLLESON, ARIZONA NOTES TO THE FINANCIAL STATEMENTS June 30, 2019
NOTE 7 PENSIONS (Continued) Pension Liability - At June 30, 2019, the City reported a liability of $11,918,662 for its proportionate share of the ASRS’ net pension liability. The net pension liability was measured as of June 30, 2018. The total pension liability used to calculate the net pension liability was determined using update procedures to roll forward the total pension liability from an actuarial valuation as of June 30, 2017, to the measurement date of June 30, 2018. The total liabilities as of June 30, 2018, reflect changes in actuarial assumptions based on the results of an actuarial experience study for the 5-year period ended June 30, 2016, including decreasing the discount rate from 8 percent to 7.5 percent, changing the projected salary increases from 3–6.75 percent to 2.7–7.2 percent, decreasing the inflation rate from 3 percent to 2.3 percent, and changing the mortality rates. The City’s proportion of the net pension liability was based on the City’s actual contributions to the plan relative to the total of all participating employers’ contributions for the year ended June 30, 2018. The City’s proportion measured as of June 30, 2018, was 0.08546 percent, which was an increase of 0.00383 percent from its proportion measured as of June 30, 2017. Pension Expense and Deferred Outflows/Inflows of Resources - For the year ended June 30, 2019, the City recognized pension expense for ASRS of $667,033. At June 30, 2019, the City reported deferred outflows of resources and deferred inflows of resources related to pensions from the following sources:
ASRS Deferred Deferred
Outflows of Inflows of
Resources Resources
Differences between expected and
actual experience 328,349$ 65,706$
Changes of assumptions or other inputs 315,390 1,056,753
Net difference between projected and actual
earnings on pension plan investments - 286,616
Changes in proportion and differences
between City contributions and
proportionate share of contributions 606,817 -
City contributions subsequent to the
measurement date 989,715 -
Total 2,240,271$ 1,409,075$
The $989,715 reported as deferred outflows of resources related to ASRS pensions resulting from City contributions subsequent to the measurement date will be recognized as a reduction of the net pension liability in the year ended June 30, 2020. Other amounts reported as deferred outflows of resources and deferred inflows of resources related to ASRS pensions will be recognized in pension expense as follows:
2020 468,343$ 2021 (63,551) 2022 (434,775) 2023 (128,536) 2024 -
Thereafter -
Years ending June 30,
62

CITY OF TOLLESON, ARIZONA NOTES TO THE FINANCIAL STATEMENTS June 30, 2019
NOTE 7 PENSIONS (Continued)
Actuarial Assumptions - The significant actuarial assumptions used to measure the total pension liability are as follows:
ASRS
Actuarial valuation date June 30, 2017
Actuarial roll forward date June 20, 2018
Actuarial cost method Entry age normal
Investment rate of return 7.5%
Projected salary increases 2.7 - 7.2% for pensions
Inflation 2.3%
Permanent benefit increase Included for pensions
Mortality rates 2017 SRA Scale U-MP for pensions and health insurance
premium benefit
Recovery rates 2012 GLDT for long-term disability
Healthcare cost trend rate Not Applicable
Actuarial assumptions used in the June 30, 2017, valuation were based on the results of an actuarial experience study for the 5-year period ended June 30, 2016. The long-term expected rate of return on ASRS pension plan investments was determined to be 7.5 percent using a building-block method in which best-estimate ranges of expected future real rates of return (expected returns, net of plan investment expense and inflation) are developed for each major asset class. These ranges are combined to produce the long-term expected rate of return by weighting the expected future real rates of return by the target asset allocation percentage and by adding expected inflation. The target allocation and best estimates of geometric real rates of return for each major asset class are summarized in the following table:
Long-Term
ASRS Target Expected Geometric
Asset Class Allocation Real Rate of Return
Equity 50% 5.50%
Fixed income 30% 3.83%
Real estate 20% 5.85%
Total 100%
Discount Rate - At June 30, 2018, the discount rate used to measure the ASRS total pension liability was 7.5 percent, which was a decrease of 0.5 from the discount rate used as of June 30, 2017. The projection of cash flows used to determine the discount rate assumed that contributions from participating employers will be made based on the actuarially determined rates based on the ASRS Board’s funding policy, which establishes the contractually required rate under Arizona statute. Based on those assumptions, the plans’ fiduciary net position was projected to be available to make all projected future benefit payments of current plan members. Therefore, the long-term expected rate of return on plan investments was applied to all periods of projected benefit payments to determine the total pension liability.
63

CITY OF TOLLESON, ARIZONA NOTES TO THE FINANCIAL STATEMENTS June 30, 2019
NOTE 7 PENSIONS (Continued) Sensitivity of City’s Proportionate Share of the ASRS Net Pension Liability to Changes in the Discount Rate - The following table presents the City’s proportionate share of the net pension liability calculated using the discount rate of 7.5 percent, as well as what the City’s proportionate share of the net pension liability would be if it were calculated using a discount rate that is 1 percentage point lower (6.5 percent) or 1 percentage point higher (8.5 percent) than the current rate:
ASRS Current
1% Decrease Discount Rate 1% increase
(6.5%) (7.5%) (8.5%)
City's proportionate share
of the net pension liability 16,990,328$ 11,918,662$ 7,681,368$
Plan Fiduciary Net Position - Detailed information about the plan’s fiduciary net position is available in the separately issued ASRS financial report. B. Public Safety Personnel Retirement System Plan Description – City police and fire department employees who are regularly assigned hazardous duty participate in the Public Safety Personnel Retirement System (PSPRS) or employees who became members on or after July 1, 2017, may participate in the Public Safety Personnel Defined Contribution Retirement Plan (PSPDCRP). The PSPRS administers an agent and cost-sharing multiple-employer defined benefit pension plan and agent and cost-sharing multiple-employer defined benefit health insurance premium benefit (OPEB) plan. A nine-member board known as the Board of Trustees and the participating local boards govern the PSPRS according to the provisions of A.R.S. Title 38, Chapter 5, Article 4. Employees who are PSPRS members participate in the agent plans. The PSPRS issues a publicly available financial report that include their financial statements and required supplementary information. The reports are available on the PSPRS web site at www.psprs.com.
64

CITY OF TOLLESON, ARIZONA NOTES TO THE FINANCIAL STATEMENTS June 30, 2019
NOTE 7 PENSIONS AND OTHER POSTEMPLOYMENT BENEFITS (Continued) Benefits Provided - The PSPRS provide retirement, health insurance premium supplement, disability, and survivor benefits. State statute establishes benefits terms. Retirement, disability, and survivor benefits are calculated on the basis of age, average monthly compensation, and service credit as follows:
PSPRS
Before January 1, 2012
On or after January 1, 2012 and before July 1, 2017 On or after July 1, 2017
Retirement and
Disability
Years of service 20 years of service, any age 25 years of service or 15 years 15 years of credited service, age 52.5*
and age required 15 years of service, age 62 of credited service, age 52.5 15 or more years of service, age 55
to receive benefit
Final average Highest 36 months Highest 60 months Highest 60 consecutive
salary is based on of last 20 years of last 20 years months of last 15 years
Benefit percent
Normal 50% less 2.0% for each year
Retirement of credited service less than 20
years OR plus 2.0% to 2.5% for
each year of credited service
over 20 years, not to exceed 80%
Accidental Disability
Retirement
Catastrophic Disability
Retirement
Ordinary Disability
Retirement
Survivor Benefits
Retired Members
Active Members
* With actuarially reduced benefits
whichever is greater, mulitiplied by years of credited service (not to exceed 20 years) divided by 20
80% of retired member's pension benefit
80% to 100% of accidental disability retirement benefit or 100% of average monthly compensation if
death was the result of injuries received on the job
1.5% to 2.5% per year of credited service, not to exceed 80%
50% or normal retirement, whichever is greater
90% for the first 60 months then reduced to either 62.5% or normal retirement, whichever is greater
Normal retirement calculated with actual years of credited service or 20 years of credited service,
Initial membership date:
Retirement and survivor benefits are subject to automatic cost-of-living adjustments based on inflation. PSPRS also provides temporary disability benefits of 50 percent of the member’s compensation for up to 12 months.
65

CITY OF TOLLESON, ARIZONA NOTES TO THE FINANCIAL STATEMENTS June 30, 2019
NOTE 7 PENSIONS (Continued) Health insurance premium benefits are available to retired or disabled members with 5 years of credited service. The benefits are payable only with respect to allowable health insurance premiums for which the member is responsible. Benefits range from $100 per month to $260 per month depending on the age of the member and dependents. Employees Covered by Benefit Terms - At June 30, 2019, the following employees were covered by the agent plans’ benefit terms:
PSPRS PSPRS
Police Fire
Inactive employees or beneficiaries
currently receiving benefits 9 5
Inactive employees entitled to
but not yet receiving benefits 4 11
Active employees 25 24
Total 38 40
Contributions - State statutes establish the pension contribution requirements for active PSPRS employees. In accordance with state statutes, annual actuarial valuations determine employer contribution requirements for PSPRS pension and health insurance premium benefits. The combined active member and employer contribution rates are expected to finance the costs of benefits employees earn during the year, with an additional amount to finance any unfunded accrued liability. Contribution rates for the year ended June 30, 2019, are indicated below. Rates are a percentage of active members’ annual covered payroll.
PSPRS PSPRS
Police Fire
Active members - Pension 7.65% - 11.65% 7.65% - 11.65%
City
Pension 28.51% 28.64%
Health insurance permium benefit 0.37% 0.46%
In addition, the City was required by statute to contribute at the actuarially determined rate of 28.51 percent for Police and 28.64 percent for Fire of the PSPRS of annual covered payroll of retired members who worked for the City in positions that would typically fill and employees participating in the PSPRS Tier 3 Risk Pool and PSPDCRP members in addition to the City’s required contributions to the PSPRS Tier 3 Risk Pool and PSPDCRP.
66

CITY OF TOLLESON, ARIZONA NOTES TO THE FINANCIAL STATEMENTS June 30, 2019
NOTE 7 PENSIONS (Continued) For the agent plans, the City’s contributions to the plans for the year ended June 30, 2019, were:
PSPRS PSPRS
Police Fire
Pension
Contributions made 1,107,368$ 1,376,357$
Health Insurance Permium Benefit
Annual OPEB cost contributions made 14,371 22,106
During fiscal year 2019, the City paid 100 percent of the PSPRS pension and OPEB contributions from the General Fund. Pension Liability - At June 30, 2019, the City reported a PSPRS net pension liabilities of $7,688,370. The net pension liability was measured as of June 30, 2018, and the total pension liability used to calculate the net pension liability was determined by an actuarial valuation as of that date. Actuarial Assumptions - The significant actuarial assumptions used to measure the total pension liability are as follows:
PSPRS
Actuarial valuation date June 30, 2018
Actuarial cost method Entry age normal
Investment rate of return 7.4%
Wage inflation 3.5% for pensions
Price inflation 2.5% for pensions
Cost-of-living adjustment Included for pensions
Mortality rates RP-2014 tables using MP-2016 improvement scale with adjustments to match current experience.
Actuarial assumptions used in the June 30, 2018, valuation were based on the results of an actuarial experience study for the 5-year period ended June 30, 2016.
67

CITY OF TOLLESON, ARIZONA NOTES TO THE FINANCIAL STATEMENTS June 30, 2019
NOTE 7 PENSIONS (Continued)
The long-term expected rate of return on PSPRS pension plan investments was determined to be 7.4 percent using a building-block method in which best-estimate ranges of expected future real rates of return (expected returns, net of plan investment expenses and inflation) are developed for each major asset class. The target allocation and best estimates of geometric real rates of return for each major asset class are summarized in the following table:
Long-Term
PSPRS Target Expected Geometric
Asset Class Allocation Rate of Return
Short term investments 2.00% 0.25%
Risk parity 4.00% 5.00%
Fixed income 5.00% 1.25%
Real assets 9.00% 4.52%
GTS 12.00% 3.96%
Private credit 16.00% 6.75%
Real estate 10.00% 3.75%
Private equity 12.00% 5.83%
Non-U.S. equity 14.00% 8.70%
U.S. equity 16.00% 7.60%
Total 100.00%
Discount Rates – At June 30, 2018, the discount rate used to measure the PSPRS total pension liabilities was 7.4 percent, which was the same from the discount rate used as of June 30, 2017. The projection of cash flows used to determine the discount rate assumed that plan member contributions will be made at the current contribution rate and that employer contributions will be made at rates equal to the difference between the actuarially determined contribution rate and the member rate. Based on those assumptions, the plan’s fiduciary net position was projected to be available to make all projected future benefit payments of current plan members. Therefore, the long-term expected rate of return on plan investments was applied to all periods of projected benefit payments to determine the total pension liability.
68

CITY OF TOLLESON, ARIZONA NOTES TO THE FINANCIAL STATEMENTS June 30, 2019
NOTE 7 PENSIONS (Continued) Changes in the Net Pension Liability
PSPRS - Police
Plan
Total Fiduciary Net
Pension Net Pension
Liability Position Liability
(a) (b) (a) - (b)
Balances at June 30, 2018 12,132,772$ 8,112,614$ 4,020,158$
Changes for the year:
Service cost 465,683 - 465,683
Interest on the total liability 892,898 - 892,898
Changes of benefit terms - - -
Differences between expected
and actual experience in the
measurement of the liability 457,983 - 457,983
Changes of assumptions or other inputs - - -
Contributions - employer - 1,922,331 (1,922,331)
Contributions - employee - 185,088 (185,088)
Net investment income - 566,510 (566,510)
Benefit payments, including refunds
of employee contributions (598,856) (598,856) -
Hall/Parker Settlement - (254,140) 254,140
Administrative expense - (9,322) 9,322
Other changes - 99 (99)
Net changes 1,217,708 1,811,710 (594,002)
Balances at June 30, 2019 13,350,480$ 9,924,324$ 3,426,156$
Increase (Decrease)
Pension
69

CITY OF TOLLESON, ARIZONA NOTES TO THE FINANCIAL STATEMENTS June 30, 2019
NOTE 7 PENSIONS (Continued) Changes in the Net Pension Liability (Continued)
PSPRS - Fire
Plan
Total Fiduciary Net
Pension Net Pension
Liability Position Liability
(a) (b) (a) - (b)
Balances at June 30, 2018 15,764,166$ 11,600,767$ 4,163,399$
Changes for the year:
Service cost 512,618 - 512,618
Interest on the total liability 1,176,421 - 1,176,421
Changes of benefit terms - - -
Differences between expected
and actual experience in the
measurement of the liability 138,781 - 138,781
Changes of assumptions or other inputs - - -
Contributions - employer - 1,163,074 (1,163,074)
Contributions - employee - 202,211 (202,211)
Net investment income - 817,294 (817,294)
Benefit payments, including refunds
of employee contributions (245,783) (245,783) -
Hall/Parker Settlement - (440,563) 440,563
Administrative expense - (13,139) 13,139
Other changes - 128 (128)
Net changes 1,582,037 1,483,222 98,815
Balances at June 30, 2019 17,346,203$ 13,083,989$ 4,262,214$
Increase (Decrease)
Pension
70

CITY OF TOLLESON, ARIZONA NOTES TO THE FINANCIAL STATEMENTS June 30, 2019
NOTE 7 PENSIONS (Continued) Sensitivity of the City’s Net Pension Liability to Changes in the Discount Rate - The following table presents the City’s net pension liabilities calculated using the discount rates noted above, as well as what the City’s net pension liability would be if it were calculated using a discount rate that is 1 percentage point lower or 1 percentage point higher than the current rate:
Current
1% Decrease Discount Rate 1% increase
PSPRS - Police (6.40%) (7.40%) (8.40%)
Total pension liability 15,289,125$ 13,350,480$ 11,775,261$
Plan fiduciary net position 9,924,324 9,924,324 9,924,324
Net pension liability 5,364,801$ 3,426,156$ 1,850,937$
Current
1% Decrease Discount Rate 1% increase
PSPRS - Fire (6.40%) (7.40%) (8.40%)
Total pension liability 19,759,104$ 17,346,203$ 15,379,991$
Plan fiduciary net position 13,083,989 13,083,989 13,083,989
Net pension liability 6,675,115$ 4,262,214$ 2,296,002$
Pension Plan Fiduciary Net Position - Detailed information about the plan’s fiduciary net position is available in the separately issued PSPRS financial reports. Pension Expense - For the year ended June 30, 2019, the City recognized $2,217,829 of PSPRS pension expense.
71

CITY OF TOLLESON, ARIZONA NOTES TO THE FINANCIAL STATEMENTS June 30, 2019
NOTE 7 PENSIONS (Continued) Pension Deferred Outflows/Inflows of Resources - At June 30, 2019, the City reported deferred outflows of resources and deferred inflows of resources related to pensions from the following sources: `
Deferred Deferred
Outflows of Inflows of
PSPRS - Police Resources Resources
Differences between expected and actual experience 443,091$ 484,913$
Changes of assumptions or other inputs 665,885 -
Net difference between projected and actual
earnings on pension plan investments 117,941 -
City contributions subsequent to the
measurement date 1,107,368 -
Total 2,334,285$ 484,913$
Deferred Deferred
Outflows of Inflows of
PSPRS - Fire Resources Resources
Differences between expected and actual experience 208,839$ 249,594$
Changes of assumptions or other inputs 720,141 -
Net difference between projected and actual
earnings on pension plan investments 134,158 -
City contributions subsequent to the
measurement date 1,376,357 -
Total 2,439,495$ 249,594$
72

CITY OF TOLLESON, ARIZONA NOTES TO THE FINANCIAL STATEMENTS June 30, 2019
NOTE 7 PENSIONS (Continued)
The amounts reported as deferred outflows of resources related to pensions resulting from City contributions subsequent to the measurement date will be recognized as a reduction of the net pension liability in the year ended June 30, 2020. Other amounts reported as deferred outflows of resources and deferred inflows of resources related to pensions will be recognized in pension expense as follows:
PSPRS
Year ending June 30, Police
2020 293,660$
2021 208,503
2022 66,622
2023 50,033
2024 47,685
Thereafter 75,501
PSPRS
Year ending June 30, Fire
2020 284,634$
2021 218,260
2022 87,995
2023 124,630
2024 65,825
Thereafter 32,200
B. Elected Officials Retirement Plan
Plan description—Elected officials and judges participate in the Elected Officials Retirement Plan (EORP). EORP administers a cost-sharing multiple-employer defined benefit pension plan and a cost-sharing multiple employer defined benefit health insurance premium benefit (OPEB) plan for elected officials and judges who were members of the plan on December 31, 2013. This plan was closed to new members as of January 1, 2014. The PSPRS Board of Trustees governs the EORP according to the provisions of A.R.S. Title 38, Chapter 5, Article 3. The PSPRS issues a publicly available financial report that includes financial statements and required supplementary information for the EORP plans. The report is available on PSPRS’s website at www.psprs.com.
73

CITY OF TOLLESON, ARIZONA NOTES TO THE FINANCIAL STATEMENTS June 30, 2019
NOTE 7 PENSIONS (Continued) Benefits provided - The EORP provides retirement, health insurance premium supplement, disability, and survivor benefits. State statute establishes benefit terms. Retirement, disability, and survivor benefits are calculated on the basis of age, average yearly compensation, and service credit as follows: ` Initial membership date:
Before January 1, 2012 On or after January 1, 2012
Retirement and
Disability
Years of service 20 years, any age 10 years, age 62
and age required 10 years, age 62 5 years, age 65
to receive benefit 5 years, age 65 any years and age if disabled
5 years, any age*
any years and age if disabled
Final average Highest 36 months Highest 60 months
salary is based on of last 10 years of last 10 years
Benefit percent
Normal 4% per year of service, 3% per year of service,
Retirement not to exceed 80% not to exceed 75%
Disability 80% with 10 or more 75% with 10 or more
Retirement years of service years of service
40% with 5-10 years of service 37.5 with 5-10 years of service
20% with less than 5 years 18.75% with less than 5 years
of service of service
Survivor Benefits
Retired Members 75% of retired member's benefit 50% of retired member's benefit
Active Members 75% of disability retirement 50% of disability retirement
and other inactive benefit benefit
members
* With reduced benefits of 0.25% for each month early retirement precedes the member's
normal retirement age, with a maximum reduction of 30%
Retirement and survivor benefits are subject to automatic cost-of-living adjustments based on inflation. In addition, the Legislature may enact permanent one-time benefit increases after a Joint Legislative Budget Committee analysis of the increase’s effects on the plan.
74

CITY OF TOLLESON, ARIZONA NOTES TO THE FINANCIAL STATEMENTS June 30, 2019
NOTE 7 PENSIONS (Continued)
Contributions - State statutes establish active member and employer contribution requirements. Statute also appropriates $5 million annually through fiscal year 2043 for the EORP from the State of Arizona to supplement the normal cost plus an amount to amortize the unfunded accrued liability and designates a portion of certain court fees for the EORP. For the year ended June 30, 2019, statute required active EORP members to contribute 7 or 13 percent of the members’ annual covered payroll and the City to contribute at the actuarially determined rate of 61.5 percent of all active EORP members’ annual covered payroll. Also, statute required the City to contribute 49.86 percent to EORP of the annual covered payroll of elected officials and judges who were ASRS members and 55.5 percent to EORP of the annual covered payroll of elected officials and judges who were EODCRS members, in addition to the City’s required contributions to ASRS and EODCRS for these elected officials and judges.
During fiscal year 2019, the City paid 100 percent of the EORP pension contributions from the General Fund.
Liability - At June 30, 2019, the City reported a liability for its proportionate share of the EORP’s net pension liability that reflected a reduction for the City’s proportionate share of the State’s appropriation for EORP. The amount the City recognized as its proportionate share of the net pension liability, the related state support, and the total portion of the net pension liability that was associated with the City were as follows:
City's proportionate share of the EORP
net pension liability 642,356$
State's proportionate share of the EORP
net pension liability associated with the City 110,064
Total 752,420$
The net liability was measured as of June 30, 2018, and the total liability used to calculate the net liability was determined by an actuarial valuation as of that date. The total liabilities as of June 30, 2018, reflect statutory changes in benefit terms for automatic cost-of-living adjustments. The basis for cost-of-living adjustments was changed from excess investment earnings to the change in the consumer price index, limited to a maximum annual increase of 2 percent.
The City’s proportion of the net pension liability was based on the City’s required contributions to the pension plan relative to the total of all participating employers’ required contributions for the year ended June 30, 2018. The City’s proportion measured as of June 30, 2018, was 0.101939 percent, which was a decrease of 0.008041 percent from its proportion measured as of June 30, 2017.
Expense—For the year ended June 30, 2019, the City recognized pension expense for EORP of $(149,687) and revenue of $(31,294) for the City’s proportionate share of the State’s appropriation to EORP and the designated court fees.
75

CITY OF TOLLESON, ARIZONA NOTES TO THE FINANCIAL STATEMENTS June 30, 2019
NOTE 7 PENSIONS (Continued) Deferred outflows/inflows of resources - At June 30, 2019, the City reported deferred outflows of resources and deferred inflows of resources related to pensions from the following sources:
EORP Deferred Deferred
Outflows of Inflows of
Resources Resources
Differences between expected and
actual experience -$ 10,019$
Changes of assumptions or other inputs 4,002 267,418
Net difference between projected and actual
earnings on pension plan investments 5,574 -
Changes in proportion and differences
between City contributions and
proportionate share of contributions 67,129 -
City contributions subsequent to the
measurement date 63,819 -
Total 140,524$ 277,437$
The $63,819 reported as deferred outflows of resources related to EORP pensions resulting from City contributions subsequent to the measurement date will be recognized as a reduction of the net pension liability in the year ending June 30, 2020. Other amounts reported as deferred outflows of resources and deferred inflows of resources related to EORP pensions will be recognized in pension expense as follows:
EORP2020 (184,227)$ 2021 (14,231) 2022 (2,365) 2023 91 2024 -
Thereafter -
Years ending June 30,
Actuarial assumptions - The significant actuarial assumptions used to measure the total pension liability are as follows:
EORP
Actuarial valuation date June 30, 2018
Actuarial cost method Entry age normal
Investment rate of return 7.4%
Wage inflation 3.5% for pensions
Price inflation 2.5% for pensions
Cost-of-living adjustment Included for pensions
Mortality rates RP-2014 tables using MP-2016 improvement
scale with adjustments to match current experience
Healthcare cost trend rate Not applicable
76

CITY OF TOLLESON, ARIZONA NOTES TO THE FINANCIAL STATEMENTS June 30, 2019
NOTE 7 PENSIONS (Continued) Actuarial assumptions used in the June 30, 2018, valuation were based on the results of an actuarial experience study for the 5-year period ended June 30, 2016. The long-term expected rate of return on EORP plan investments was determined to be 7.4 percent using a building-block method in which best-estimate ranges of expected future real rates of return (expected returns, net of pension plan investment expenses and inflation) are developed for each major asset class. The target allocation and best estimates of geometric real rates of return for each major asset class are summarized in the following table:
Long-Term
EORP Target Expected Arithmetic
Asset Class Allocation Real Rate of Return
Short term investments 2% 0.25%
Risk parity 4% 5.00%
Fixed income 5% 1.25%
Real assets 9% 4.52%
GTS 12% 3.96%
Private credit 16% 6.75%
Real estate 10% 3.75%
Private equity 12% 5.83%
Non-U.S. equity 14% 8.70%
U.S. equity 16% 7.60%
Total 100%
Discount rate - At June 30, 2018, the discount rate used to measure the EORP total pension liability was 7.40 percent, which was an increase of 3.49 from the discount rate used as of June 30, 2017. The projection of cash flows used to determine the discount rate assumed that plan member contributions will be made at the current contribution rate, employer contributions will be made at the actuarial rates, and State contributions will be made as currently required by statute. Based on those assumptions, the pension plan’s fiduciary net position was projected to be available to make all projected future benefit payments of current plan members. Therefore, the long-term expected rate of return on plan investments was applied to all periods of projected benefit payments to determine the total pension liability.
77

CITY OF TOLLESON, ARIZONA NOTES TO THE FINANCIAL STATEMENTS June 30, 2019
NOTE 7 PENSIONS (Continued) Sensitivity of the City’s proportionate share of the EORP net pension liability to changes in the discount rate —The following table presents the City’s proportionate share of the net pension liability calculated using the discount rate of 7.40 percent, as well as what the City’s proportionate share of the net pension liability would be if it were calculated using a discount rate that is 1 percentage point lower (6.40 percent) or 1 percentage point higher (8.40 percent) than the current rate:
EORP Current
1% Decrease Discount Rate 1% increase
(6.40%) (7.40%) (8.40%)
City's proportionate share
of the net pension liability 737,574$ 642,356$ 561,418$
Pension plan fiduciary net position - Detailed information about the pension plan’s fiduciary net position is available in the separately issued EORP financial report. NOTE 8 COMMITMENTS The City has a commitment relating to the purchase of land aggregated approximately $1,309,000 that will be financed from operating funds. These contracts will be paid in future periods. NOTE 9 RISK MANAGEMENT The City is exposed to various risks of loss related to torts; theft of, damage to and destruction of assets; errors and omissions; and natural disasters. The City’s insurance protection is provided by the Arizona Municipal Risk Retention Pool, of which the City is a participating member. The limit for basic coverage is for $2,000,000 per occurrence on a claims made basis. Excess coverage is for an additional $8,000,000 per occurrence on a follow form, claims made basis. No significant reduction in insurance coverage occurred during the year and no settlements exceeded insurance coverage during any of the past three fiscal years. The Arizona Municipal Risk Retention Pool is structured such that members premiums are based on an actuarial review that will provide adequate reserves to allow the pool to meet its expected financial obligations. The pool has the authority to assess its members additional premiums should reserves and annual premiums be insufficient to meet the pool’s obligations. The City is also insured by commercial insurance for potential worker related accidents.
78

CITY OF TOLLESON, ARIZONA NOTES TO THE FINANCIAL STATEMENTS June 30, 2019
NOTE 10 RESTATEMENT
Net position as of July 1, 2018 has been restated as follows due to a correction of an error for the recording of the financial impact of a developer agreement. Additionally, net position has been restated as follows due to the recording of net pension liability for a plan that was previously insignificant to the financial statements. As a result, the effect of fiscal year 2019 is as follows:
Governmental Activities
Net Position as previously
reported at June 30, 2018 $ 48,974,279
Restatement -
Reimbursement of developer
agreement payable 664,523
Pension expense (961,481)
Total restatement (296,958)
Net position as restated,
July 1, 2018 $ 48,677,321
79


Required Supplementary Information


CITY OF TOLLESON, ARIZONAREQUIRED SUPPLEMENTARY INFORMATIONSCHEDULE OF THE CITY'S PROPORTIONATE SHARE OF THE NET PENSION LIABILITYCOST-SHARING PENSION PLAN
Arizona Retirement System
20142019 2018 2017 2016 2015 through
(2018) (2017) (2016) (2015) (2014) 2010
City's proportion of the net pension liability 0.085460% 0.081630% 0.078415% 0.077390% 0.074250% InformationCity's proportionate share of the net pension liability 11,918,662$ 12,716,363$ 12,656,162$ 12,054,148$ 10,986,414$ notCity's covered payroll 8,894,734 7,951,763 7,592,673 6,969,789 6,799,467 available*City's proportionate share of the net pension liability
as a percentage of its covered payroll 134.00% 159.92% 166.69% 172.95% 161.58%Plan fiduciary net position as a percentage of the total
pension liability 69.92% 69.92% 67.06% 68.35% 69.49%
Elected Officials Retirement Plan
20142019 2018 2017 2016 2015 through
(2018) (2017) (2016) (2015) (2014) 2010
City's proportion of the net pension liability 0.101939% 0.093390% 0.069212% 0.060990% 0.081390% InformationCity's proportionate share of the net pension liability 642,356$ 1,144,221$ 653,884$ 476,603$ 545,776$ notState's proportionate share of the net pension liability available*
associated with the City 110,064 237,474 135,009 148,585 167,340
Total 752,420$ 1,381,695$ 788,893$ 625,188$ 713,116$
City's covered payroll 87,413$ 77,094$ 55,562$ 54,621$ 57,464$
City's proportionate share of the net pension liabilityas a percentage of its covered payroll 734.85% 1484.20% 1176.86% 872.56% 949.77%
Plan fiduciary net position as a percentage of the totalpension liability 30.36% 19.66% 23.42% 28.32% 31.91%
* Additional years' information will be displayed as it becomes available
June 30, 2019
(Measurement date)Reporting Fiscal Year
Reporting Fiscal Year(Measurement date)
See accompanying notes to pension plan schedules. 83

CITY OF TOLLESON, ARIZONAREQUIRED SUPPLEMENTARY INFORMATIONSCHEDULE OF CHANGES IN THE CITY'S NET PENSION LIABILITY AND RELATED RATIOSAGENT PENSION PLAN
City of Tolleson Police Public Safety Personnel Retirement System
2019 2018 2017 2016 2015(2018) (2017) (2016) (2015) (2014) 2014-2010
Total pension liabilityService cost 465,683$ 473,995$ 398,983$ 385,782$ 381,895$ InformationInterest on the total pension liability 892,898 863,811 764,905 708,237 606,076 notChanges on benefit terms - 40,808 530,259 - 164,727 available*Differences between expected and actual experience
in the measurement of the pension liability 457,983 (650,605) 28,330 91,845 (166,928) Changes of assumptions or other inputs - 357,571 453,240 - 792,851 Benefit payments, including refunds of employee contributions (598,856) (466,574) (412,948) (528,208) (430,081)
Net change in total pension liability 1,217,708 619,006 1,762,769 657,656 1,348,540 Total pension liability - beginning 12,132,772 11,513,766 9,750,997 9,093,341 7,744,801
Total pension liability - ending (a) 13,350,480$ 12,132,772$ 11,513,766$ 9,750,997$ 9,093,341$
Plan fiduciary net positionContributions - employer 1,922,331$ 1,513,489$ 1,161,744$ 454,309$ 426,364$ Contributions - employee 185,088 230,920 238,489 217,506 201,353 Net investment income 566,510 753,490 31,927 179,481 577,456 Benefit payments, including refunds of employee contributions (598,856) (466,574) (412,948) (528,208) (430,081) Hall/Parker Settlement (254,140) - - - - Administrative expense (9,322) (7,067) (4,993) (4,761) - Other changes 99 78 (34,989) (78,507) (4,650)
Net change in plan fiduciary net position 1,811,710 2,024,336 979,230 239,820 770,442 Plan fiduciary net position - beginning 8,112,614 6,088,278 5,109,048 4,869,228 4,098,786
Plan fiduciary net position - ending (b) 9,924,324 8,112,614 6,088,278 5,109,048$ 4,869,228$
City's net pension liability - ending (a) - (b) 3,426,156$ 4,020,158$ 5,425,488$ 4,641,949$ 4,224,113$
Plan fiduciary net position as a percentage of the total pension liability 74.34% 66.87% 52.88% 52.40% 53.55%
Covered payroll 5,570,442$ 4,457,959$ 2,158,238$ 2,105,501$ 1,057,426$
City's net pension liability as a percentage of payroll 61.51% 90.18% 251.39% 220.47% 215.93%
* Additional years' information will be displayed as it becomes available
June 30, 2019
(Measurement Date)Reporting Fiscal Year
See accompanying notes to pension plan schedules. 84

City of Tolleson Fire Public Safety Personnel Retirement System
2019 2018 2017 2016 2015(2018) (2017) (2016) (2015) (2014) 2014-2010
Total pension liabilityService cost 512,618$ 553,129$ 434,330$ 437,425$ 416,879$ InformationInterest on the total pension liability 1,176,421 1,078,336 902,804 809,086 721,067 not Changes on benefit terms - 107,196 1,210,896 - (63,500) available*Differences between expected and actual experience
in the measurement of the pension liability 138,781 (291,050) (25,025) 179,866 (67,804) Changes of assumptions or other inputs - 336,050 530,950 - 414,674 Benefit payments, including refunds of employee contributions (245,783) (241,485) (230,974) (230,974) (389,667)
Net change in total pension liability 1,582,037 1,542,176 2,822,981 1,195,403 1,031,649 Total pension liability - beginning 15,764,166 14,221,990 11,399,009 10,203,606 9,171,957
Total pension liability - ending (a) 17,346,203$ 15,764,166$ 14,221,990$ 11,399,009$ 10,203,606$
Plan fiduciary net positionContributions - employer 1,163,074$ 833,691$ 751,037$ 401,653$ 360,947$ Contributions - employee 202,211 286,450 295,993 269,101 232,876 Net investment income 817,294 1,157,802 51,108 289,531 913,806 Benefit payments, including refunds of employee contributions (245,783) (241,485) (230,974) (230,974) (389,667)
Hall/Parker Settlement (440,563) - - - - Administrative expense (13,139) (10,645) (7,754) (7,452) - Other changes 128 49,430 243,929 1,330 (12,064)
Net change in plan fiduciary net position 1,483,222 2,075,243 1,103,339 723,189 1,105,898 Plan fiduciary net position - beginning 11,600,767 9,525,524 8,422,185 7,698,996 6,593,098
Plan fiduciary net position - ending (b) 13,083,989$ 11,600,767$ 9,525,524$ 8,422,185$ 7,698,996$
City's net pension liability - ending (a) - (b) 4,262,214$ 4,163,399$ 4,696,466$ 2,976,824$ 2,504,610$
Plan fiduciary net position as a percentage of the total pension liability 75.43% 73.59% 66.98% 73.89% 75.45%
Covered payroll 4,229,787$ 4,011,950$ 2,480,871$ 2,262,991$ 2,462,694$
City's net pension liability as a percentage of covered payroll 100.77% 103.77% 189.31% 131.54% 110.12%
* Additional years' information will be displayed as it becomes available
(Measurement Date)Reporting Fiscal Year
85

CITY OF TOLLESON, ARIZONAREQUIRED SUPPLEMENTARY INFORMATIONSCHEDULE OF CITY PENSION CONTRIBUTIONS
Arizona Retirement System
2019 2018 2017 2016 2015 2014 2013-2010
Statutorily required contribution 989,715$ 969,526$ 857,200$ 823,805$ 758,313$ 727,543$ Information City's contributions in relation to the not available*
statutorily required contribution 989,715 969,526 857,200 823,805 758,313 727,543
City's contribution deficiency (excess) -$ -$ -$ -$ -$ -$
City's covered payroll 8,852,549$ 8,894,734$ 7,951,763$ 7,592,673$ 6,969,789$ 6,799,467$ City's contributions as a percentage of
covered payroll 11.18% 10.90% 10.78% 10.85% 10.88% 10.70%
Elected Officials Retirement Plan
2019 2018 2017 2016 2015 2014 2013-2010
Statutorily required contribution 63,819$ 20,542$ 18,117$ 13,057$ 12,836$ 18,492$ Information City's contributions in relation to the not available*
actuarially determined contribution 63,819 20,542 18,117 13,057 12,836 18,492
City's contribution deficiency (excess) -$ -$ -$ -$ -$ -$
City's covered payroll 103,771$ 87,413$ 77,094$ 55,562$ 54,621$ 57,464$ City's contributions as a percentage of
covered payroll 61.50% 23.50% 23.50% 23.50% 23.50% 32.18%
City of Tolleson PolicePublic Safety Personnel Retirement System
2019 2018 2017 2016 2015 2014 2013-2010
Actuarially determined contribution 1,922,331$ 1,513,489$ 1,161,744$ 454,309$ 426,364$ 207,044$ Information City's contributions in relation to the not available*
actuarially determined contribution 1,922,331 1,513,489 1,161,744 454,309 426,364 207,044
City's contribution deficiency (excess) -$ -$ -$ -$ -$ -$
City's covered payroll 6,009,162$ 5,570,442$ 4,457,959$ 2,158,238$ 2,105,501$ 1,057,426$ City's contributions as a percentage of
covered payroll 31.99% 27.17% 26.06% 21.05% 20.25% 19.58%
City of Tolleson FirePublic Safety Personnel Retirement System
2019 2018 2017 2016 2015 2014 2013-2010
Actuarially determined contribution 1,163,074$ 833,691$ 751,037$ 401,653$ 360,947$ 348,225$ Information City's contributions in relation to the not available*
actuarially determined contribution 1,163,074 833,691 751,037 401,653 360,947 348,225
City's contribution deficiency (excess) -$ -$ -$ -$ -$ -$
City's covered payroll 4,099,662$ 4,229,787$ 4,011,950$ 2,480,871$ 2,262,991$ 2,462,694$ City's contributions as a percentage of
covered payroll 28.37% 19.71% 18.72% 16.19% 15.95% 14.14%
* Additional years' information will be displayed as it becomes available
Reporting Fiscal Year
June 30, 2019
Reporting Fiscal Year
Reporting Fiscal Year
Reporting Fiscal Year
The City was not required and did not contribute to the EORP health insurance premium benefit plan for fiscal years 2019, 2018, or 2017. Information for fiscal years 2016 through 2010 is not available.
See accompanying notes to pension plan schedules. 86

CITY OF TOLLESON REQUIRED SUPPLEMENTARY INFORMATION NOTES TO THE PENSION PLAN SCHEDULE June 30, 2019
NOTE 1 ACTUARIALLY DETERMINED CONTRIBUTION RATES
Actuarial determined contribution rates for PSPRS are calculated as of June 30 two years prior to the end of the fiscal year in which contributions are made. The actuarial methods and assumptions used to establish the contribution requirements are as follows:
Actuarial cost method Entry age normal
Amortization method Level percent-of-pay, closed
Remaining amortization period as 19 years for underfundedof the 2017 actuarial valuation 20 years for overfunded
Asset valuation method 7-year smoothed market value; 80%/120% market corridorActuarial assumptions:
Investment rate of return PSPRS members with initial membership date before July 1,2017:
In the 2017 actuarial valuation, the investment rate of return wasdecreased from 7.5% to 7.4%. In the 2016 actuarial valuation, theinvestment rate of return was decreased from 7.85% to 7.5%. In the2013 actuarial valuation, the investment rate of return wasdecreased from 8.0% to 7.85%. PSPRS members with initial membership on or after July 1, 2017:7%
Projected salary increases In the 2017 actuarial valuation, projected salary increases weredecreased from 4.0% - 8.0% to 3.5% - 7.5% for PSPRS. In the 2014actuarial valuation, projected salary increases were decreased from4.5%-8.5% to 4.0%-8.0% for PSPRS. In the 2013 actuarial valuation,projected salary increases were decreased from 5.0%-9.0% to 4.5%-8.5% for PSPRS.
Wage growth In the 2017 actuarial valuation, wage growth was decreased from 4%to 3.5% for PSPRS. In the 2014 actuarial valuation, wage growthwas decreased from 4.5% to 4.0% for PSPRS. In the 2013 actuarialvaluation, wage growth was decreased from 5.0% to 4.5% forPSPRS.
Retirement age Experience-based table of rates that is specific to the type ofeligibility condition. Last updated for the 2012 valuation pursuant toan experience study of the period July 1, 2006-June 30, 2011.
Mortality In the 2017 actuarial valuation, changed to RP-2014 tables , with75% of MP-2016 fully generational projection scales. RP-2000mortality table (adjusted by 105% for both males and females)
87

CITY OF TOLLESON REQUIRED SUPPLEMENTARY INFORMATION NOTES TO THE PENSION PLAN SCHEDULE June 30, 2019
NOTE 2 FACTORS THAT AFFECT TRENDS Arizona courts have ruled that provisions of a 2011 law that changed the mechanism for funding permanent pension benefit increases and increased employee pension contribution rates were unconstitutional or a breach of contract because those provisions apply to individuals who were members as of the law’s effective date. As a result, the PSPRS changed benefit terms to reflect the prior mechanism for funding permanent benefit increases for those members and revised actuarial assumptions to explicitly value future permanent benefit increases. PSPRS also reduced those members’ employee contribution rates. These changes are reflected in the plan’s pension liabilities for fiscal year 2015 (measurement date 2014) for members who were retired as of the law’s effective date and fiscal year 2018 (measurement date 2017) for members who retired or will retire after the law’s effective date. These changes also increased the PSPRS- required pension contributions beginning in fiscal year 2016 for members who were retired as of the law’s effective date. These changes increased the PSPRS- required contributions beginning in fiscal year 2019 for members who retired or will retire after the law’s effective date. Also, the City refunded excess employee contributions to PSPRS members. PSPRS allowed the City to reduce its actual employer contributions for the refund amounts. As a result, the City’s pension contributions were less than the actuarially or statutorily determined for 2018 and 2019. The fiscal year 2019 (measurement date 2018) pension liabilities for EORP reflect the replacement of the permanent benefit increase (PBI) for retirees based on investment returns with a cost of living adjustment based on inflation. Also, the EORP liability and required pension contributions for fiscal year 2019 reflect a statutory change that requires the employer contribution rate to be actuarially determined. This change increased the discount rate used to calculate the liability thereby reducing the total pension liability.
88
Other SupplementaryInformation
BUDGETARY COMPARISON SCHEDULES
MAJOR GOVERNMENTAL FUND


BUDGET AND ACTUAL
Variance withFinal Budget-
PositiveREVENUES Original Final Actual Amounts (Negative)Investment earnings -$ -$ 108,396$ 108,396$
EXPENDITURESDebt service:
Interest and fiscal charges - - 162,342 (162,342) Bond issuance costs - - 226,656 (226,656) Total expenditures - - 388,998 (388,998)
Excess of revenues over(under) expenditures - - (280,602) (280,602)
OTHER FINANCINGSOURCES (USES)
General obligation bonds issued 11,515,000 11,515,000 10,850,000 (665,000) Premium on general obligation bonds - - 1,005,367 1,005,367 Transfers out (25,212) (25,212) (25,447) (235)
Total other financing sources (uses): 11,489,788 11,489,788 11,829,920 340,132
Net change in fund balance 11,489,788 11,489,788 11,549,318 59,530
Fund balance - beginning of year 25,447 25,447 25,447 -
Fund balance - end of year 11,515,235$ 11,515,235$ 11,574,765$ 59,530$
CITY OF TOLLESON, ARIZONACAPITAL IMPROVEMENTSSCHEDULE OF REVENUES, EXPENDITURES, AND CHANGES IN FUND BALANCE -
Year Ended June 30, 2019
Budgeted Amounts
91
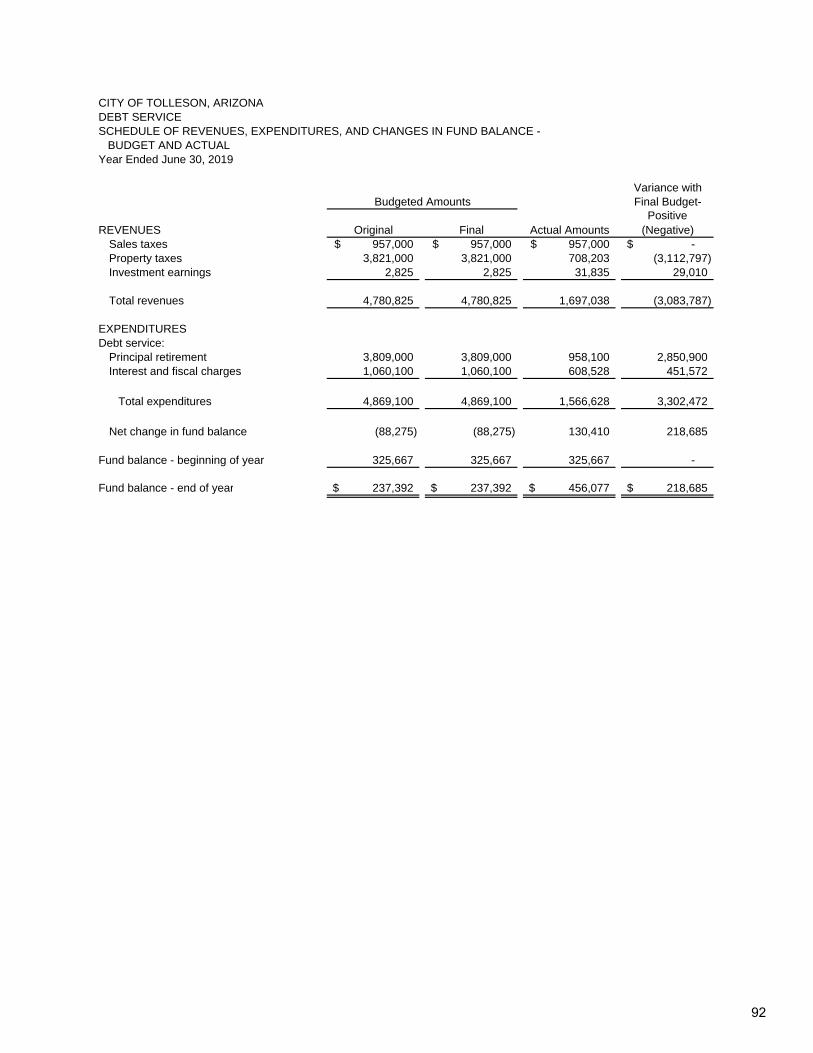
BUDGET AND ACTUAL
Variance withFinal Budget-
PositiveREVENUES Original Final Actual Amounts (Negative)
Sales taxes 957,000$ 957,000$ 957,000$ -$ Property taxes 3,821,000 3,821,000 708,203 (3,112,797) Investment earnings 2,825 2,825 31,835 29,010
Total revenues 4,780,825 4,780,825 1,697,038 (3,083,787)
EXPENDITURESDebt service:
Principal retirement 3,809,000 3,809,000 958,100 2,850,900 Interest and fiscal charges 1,060,100 1,060,100 608,528 451,572
Total expenditures 4,869,100 4,869,100 1,566,628 3,302,472
Net change in fund balance (88,275) (88,275) 130,410 218,685
Fund balance - beginning of year 325,667 325,667 325,667 -
Fund balance - end of year 237,392$ 237,392$ 456,077$ 218,685$
CITY OF TOLLESON, ARIZONADEBT SERVICE SCHEDULE OF REVENUES, EXPENDITURES, AND CHANGES IN FUND BALANCE -
Year Ended June 30, 2019
Budgeted Amounts
92

Other Supplementary Information
BUDGETARY COMPARISON SCHEDULES
NON-MAJOR GOVERNMENTAL FUNDS


Highway UserASSETS Revenue Fund Grants TotalCash and cash equivalents 325,132$ 311,247$ 636,379$ Receivables, net:
Intergovernmental 254,032 98,784 352,816
Total assets 579,164$ 410,031$ 989,195$
LIABILITIESAccounts payable 33,706$ 53,507$ 87,213$ Accrued wages and benefits - 14,819 14,819 Unearned revenue - 75,130 75,130
Total liabilities 33,706 143,456 177,162
FUND BALANCESRestricted
Highways and streets 545,458 - 545,458 Grants - 266,575 266,575
Total fund balances 545,458 266,575 812,033
Total liabilities and fund balances 579,164$ 410,031$ 989,195$
Special Revenue
CITY OF TOLLESON, ARIZONACOMBINING BALANCE SHEETNON-MAJOR GOVERNMENTAL FUNDSJune 30, 2019
95
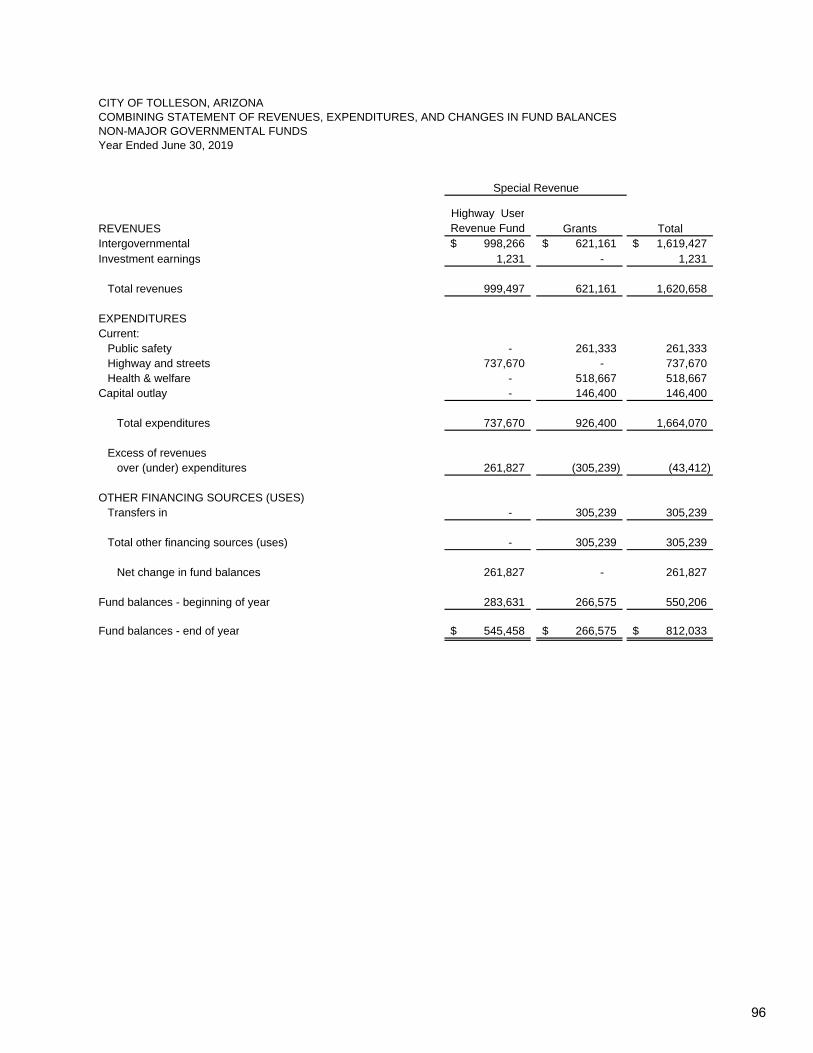
COMBINING STATEMENT OF REVENUES, EXPENDITURES, AND CHANGES IN FUND BALANCES
Year Ended June 30, 2019
Highway UserREVENUES Revenue Fund Grants TotalIntergovernmental 998,266$ 621,161$ 1,619,427$ Investment earnings 1,231 - 1,231
Total revenues 999,497 621,161 1,620,658
EXPENDITURESCurrent:
Public safety - 261,333 261,333 Highway and streets 737,670 - 737,670 Health & welfare - 518,667 518,667
Capital outlay - 146,400 146,400
Total expenditures 737,670 926,400 1,664,070
Excess of revenuesover (under) expenditures 261,827 (305,239) (43,412)
OTHER FINANCING SOURCES (USES)Transfers in - 305,239 305,239
Total other financing sources (uses) - 305,239 305,239
Net change in fund balances 261,827 - 261,827
Fund balances - beginning of year 283,631 266,575 550,206
Fund balances - end of year 545,458$ 266,575$ 812,033$
Special Revenue
NON-MAJOR GOVERNMENTAL FUNDS
CITY OF TOLLESON, ARIZONA
96

Other Supplementary Information
NON-MAJOR GOVERNMENT FUNDS
FINANCIAL STATEMENTS
Special Revenue Funds
Highway User Revenue Fund (HURF) - This fund accounts for the City’s shareof Arizona’s highway user tax revenues and associated expenditures legallyrestricted for road construction and maintenance.
Grants Fund - This fund accounts for miscellaneous federal and state grantsand other contributions that are restricted for specific use.

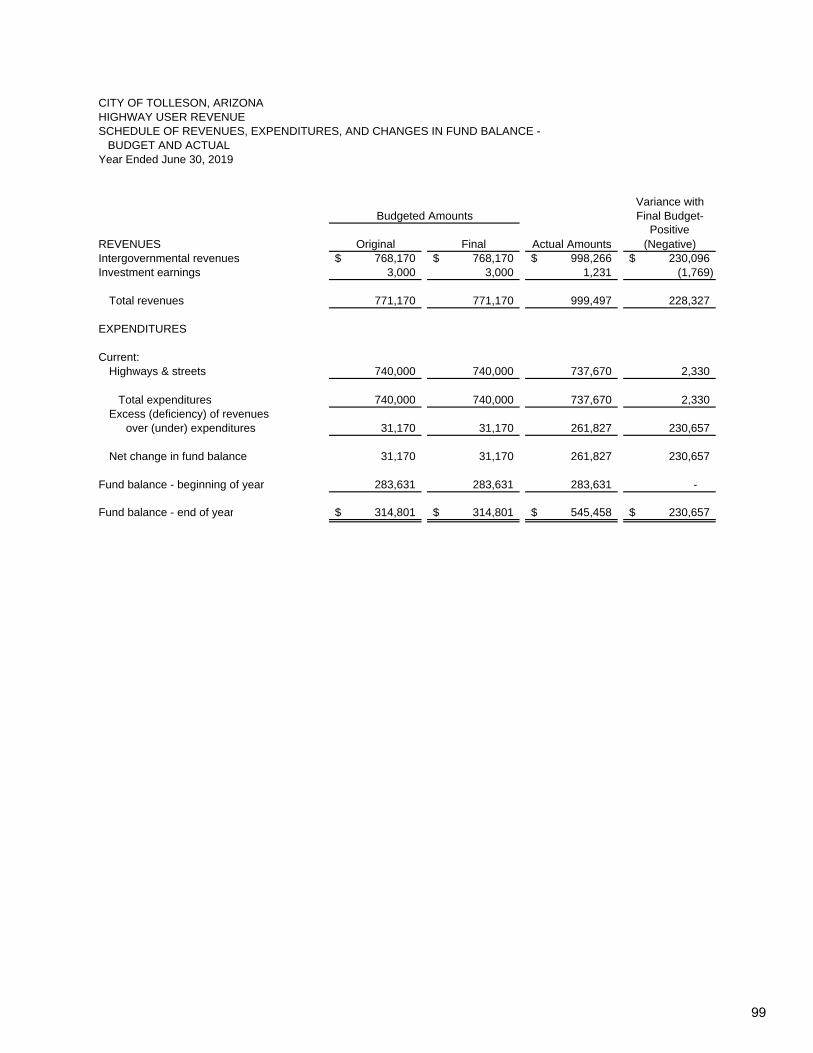
BUDGET AND ACTUAL
Variance withFinal Budget-
PositiveREVENUES Original Final Actual Amounts (Negative)Intergovernmental revenues 768,170$ 768,170$ 998,266$ 230,096$ Investment earnings 3,000 3,000 1,231 (1,769)
Total revenues 771,170 771,170 999,497 228,327
EXPENDITURES
Current:Highways & streets 740,000 740,000 737,670 2,330
Total expenditures 740,000 740,000 737,670 2,330 Excess (deficiency) of revenues
over (under) expenditures 31,170 31,170 261,827 230,657
Net change in fund balance 31,170 31,170 261,827 230,657
Fund balance - beginning of year 283,631 283,631 283,631 -
Fund balance - end of year 314,801$ 314,801$ 545,458$ 230,657$
CITY OF TOLLESON, ARIZONAHIGHWAY USER REVENUESCHEDULE OF REVENUES, EXPENDITURES, AND CHANGES IN FUND BALANCE -
Year Ended June 30, 2019
Budgeted Amounts
99

BUDGET AND ACTUAL
Variance withFinal Budget-
PositiveREVENUES Original Final Actual Amounts (Negative)Intergovernmental revenues 1,168,213$ 1,168,213$ 621,161$ (547,052)$
EXPENDITURESCurrent:
Public safety 474,198 474,198 261,333 212,865 Health and welfare 845,198 845,198 518,667 326,531
Capital outlay 212,400 212,400 146,400 66,000
Total expenditures 1,531,796 1,531,796 926,400 605,396
Excess (deficiency) of revenues over (under) expenditures (363,583) (363,583) (305,239) 58,344
OTHER FINANCINGSOURCES (USES)Transfers in 363,583 363,583 305,239 (58,344)
Total other financing sourcesand (uses) 363,583 363,583 305,239 (58,344)
Net change in fund balance - - - -
Fund balance - beginning of year 266,575 266,575 266,575 -
Fund balance - end of year 266,575$ 266,575$ 266,575$ -$
CITY OF TOLLESON, ARIZONAGRANTSSCHEDULE OF REVENUES, EXPENDITURES, AND CHANGES IN FUND BALANCE -
Year Ended June 30, 2019
Budgeted Amounts
100

Statistical Section
Contents Pages
Financial Trends 102-113
These schedules contain trend information to help the reader understand how the City’s financial performance and well-being have changed over time.
Revenue Capacity 115-125
These schedules contain information to help the reader assess the City’s most significant local revenue sources, property tax and sales and uses taxes.
Debt Capacity 126-135
These schedules present information to help the reader assess the affordability of the City’s current levels of outstanding debt and the City’s ability to issue additional debt in the future.
Demographic and Economic Statistics 136-147
These schedules offer economic and demographic indicators to help the reader understand the environment within which the City’s financial activities take place.
Sources: Unless otherwise noted, the information in these schedules is derived from
the comprehensive annual financial reports for the relevant year.

Governmental ActivitiesNet investment in capital assets 2,984,211$ 24,742,497$ 25,900,750$ 26,194,336$ Restricted 3,474,282 4,420,658 2,971,007 3,426,973 Unrestricted 8,017,638 7,323,480 9,964,703 11,029,738
Total Governmental Activities Net Position 14,476,131$ 36,486,635$ 38,836,460$ 40,651,047$
Business-Type ActivitiesNet investment in capital assets 49,164,298$ 32,661,672$ 31,376,028$ 32,356,074$ Restricted 55,295 276,569 492,978 493,772 Unrestricted 16,670,481 15,531,493 17,720,898 19,174,850
Total Business-Type Activities Net Position 65,890,074$ 48,469,734$ 49,589,904$ 52,024,696$
Primary GovernmentNet investment in capital assets 52,148,509$ 57,404,169$ 57,276,778$ 58,550,410$ Restricted 3,529,577 4,697,227 3,463,985 3,920,745 Unrestricted 24,688,119 22,854,973 27,685,601 30,204,588
Total Primary Government Net Position 80,366,205$ 84,956,369$ 88,426,364$ 92,675,743$
2011 2012
CITY OF TOLLESON, ARIZONATable 1
Net Position By ComponentLast Ten Fiscal Years
(Accrual Basis of Accounting)(Unaudited)
20132010
102

27,534,901$ 30,954,613$ 30,421,590$ 32,215,631$ 35,872,282$ 43,344,723 5,110,928 2,633,181 4,896,402 5,684,881 3,652,102 15,686,162 9,625,353 (373,945) 4,441,397 6,218,425 9,449,895 (1,626,497)
42,271,182$ 33,213,849$ 39,759,389$ 44,118,937$ 48,974,279$ 57,404,388$
34,835,900$ 42,351,199$ 46,812,938$ 47,446,347$ 48,568,972$ 50,126,416$ 494,335 494,852 - 499,179 506,163 518,226
20,708,802 17,740,832 18,087,097 19,893,307 22,973,234 26,976,548
56,039,037$ 60,586,883$ 64,900,035$ 67,838,833$ 72,048,369$ 77,621,190$
62,370,801$ 73,305,812$ 77,234,528$ 79,661,978$ 84,441,254$ 93,471,139$ 5,605,263 3,128,033 4,896,402 6,184,060 4,158,265 16,204,388
30,334,155 17,366,887 22,528,494 26,111,732 32,423,129 25,350,051
98,310,219$ 93,800,732$ 104,659,424$ 111,957,770$ 121,022,648$ 135,025,578$
20192018201720162014 2015
103

ExpensesGovernmental activities:
General Government 3,931,291$ 3,854,836$ 3,554,245$ 4,160,877$ Public Safety 8,145,407 9,227,572 9,590,713 9,921,501 Highways and Streets 3,008,843 3,587,171 2,867,554 2,497,012 Culture and Recreation 1,006,074 1,040,502 1,171,266 562,374 Redevelopment and Housing 45,851 - - - Economic Development 473,105 459,727 545,153 1,175,131 Health and Welfare 516,178 868,049 547,528 343,153 Interest on Long-Term Debt 1,480,666 1,695,159 914,964 864,780
Total Governmental Activities 18,607,415 20,733,016 19,191,423 19,524,828
Business-Type ActivitiesWater 4,357,407 4,314,393 6,095,971 5,021,689 Sanitation 705,856 642,779 491,293 614,402 Wastewater and Sewer 4,829,946 5,424,738 6,644,923 6,579,691
Total Business-Type Activities 9,893,209 10,381,910 13,232,187 12,215,782
Total Primary Government Expenses 28,500,624$ 31,114,926$ 32,423,610$ 31,740,610$
Program RevenuesGovernmental Activities:
Fines, Fees and Charges for Services:General Government 897,801$ 430,661$ 581,769$ 554,874$ Public Safety 163,335 262,145 207,948 226,830 Highways and Streets - - - - Culture and Recreation 11,284 11,542 25,690 16,825 Redevelopment and Housing - - - - Other - - - -
Operating Grants and Contributions 1,235,150 825,410 878,403 830,814 Capital Grants and Contributions 1,059,482 868,296 235,653 171,515
Total Governmental Activities Program Revenues 3,367,052 2,398,054 1,929,463 1,800,858
Business-Type ActivitiesCharges for Services:
Water 4,639,765$ 4,994,285$ 6,394,604$ 6,479,996$ Sanitation 409,697 401,366 347,800 360,618 Wastewater and Sewer 4,881,137 5,000,253 5,500,611 5,535,850
Capital Grants and Contributions 7,966,449 1,901,328 - - Total Business-Type Activities Program Revenues 17,897,048 12,297,232 12,243,015 12,376,464
Total Primary Government Revenues $ 21,264,100 $ 14,695,286 $ 14,172,478 $ 14,177,322
CITY OF TOLLESON, ARIZONATable 2
Changes in Net PositionLast Ten Fiscal Years
(Accrual Basis of Accounting)(Unaudited)
2013201220112010
104

4,069,698$ 5,415,488$ 5,596,149$ 6,057,979$ 6,699,834$ 6,244,732$ 9,342,079 10,820,773 11,510,678 13,703,866 13,256,375 14,014,601 4,278,584 2,155,241 2,146,277 2,158,993 2,702,277 2,709,339
885,714 1,691,577 1,667,220 2,438,231 2,382,861 2,907,590 - - - - - -
1,464,624 715,207 641,130 1,196,079 794,512 1,000,307 378,772 426,259 510,429 455,278 506,590 545,600 812,432 776,981 750,181 717,956 636,533 727,733
21,231,903 22,001,526 22,822,064 26,728,382 26,978,982 28,149,902
5,446,163 5,032,519 5,379,124 5,294,611 5,926,382 5,287,268 630,134 502,305 475,758 418,557 373,399 362,235
6,238,217 6,408,153 6,434,002 6,720,582 6,639,875 6,298,733
12,314,514 11,942,977 12,288,884 12,433,750 12,939,656 11,948,236
33,546,417$ 33,944,503$ 35,110,948$ 39,162,132$ 39,918,638$ 40,098,138$
795,223$ 888,639$ 883,447$ 1,005,417$ 1,527,499$ 1,562,514$ 302,522 273,624 598,221 404,051 321,968 303,551
- - 126,794 - - - 17,292 14,458 122,954 22,316 36,482 64,882 10,978 - - - - -
- 9,250 - - - - 771,285 916,333 759,072 973,563 972,700 1,355,565 370,799 - 21,240 18,472 69,939 161,413
2,268,099 2,102,304 2,511,728 2,423,819 2,928,588 3,447,925
6,666,770$ 6,583,969$ 6,596,501$ 6,460,671$ 6,873,286$ 6,609,408$ 324,197 355,328 352,861 384,453 449,095 457,751
6,713,988 5,420,273 5,899,361 5,743,503 6,293,079 6,085,228 - 4,673,401 150,584 49,811 -
13,704,955 17,032,971 12,999,307 12,638,438 13,615,460 13,152,387
$ 15,973,054 $ 19,135,275 $ 15,511,035 $ 15,062,257 $ 16,544,048 $ 16,600,312
(Continued)
2019201820172014 2015 2016
105

General Revenues and Other Changes in Net PostionGovernmental Activities:
Taxes:Sales Taxes 8,390,330$ 12,209,049$ 13,525,808$ 14,230,041$ Property Taxes 6,421,551 6,812,691 5,343,971 4,478,071 Franchise Taxes 49,523 47,098 39,871 56,905
State Revenue Sharing 838,960 632,468 567,191 668,558 State Income Tax Revenue Sharing 476,855 497,423 511,429 535,720 Auto Lieu Tax Revenue Sharing 218,427 212,480 220,391 208,723 Grants and Contributions Not Restricted - - - - Interest 69,793 25,425 36,451 72,680 Other 115,386 - 5,491 -
Transfers (6,224,014) (235,637) (152,748) - Total Governmental Activities: 10,356,811 20,200,997 20,097,855 20,250,698
Business-type Activities:Property Taxes 518,221 332,735 1,401,895 2,420,551 Impact Fees - - - - Interest 23,957 20,363 35,712 18,325 Litigation Settlement - - - - Other 23,051 129,072 123,917 97,616 Transfers 6,224,014 235,637 152,748 -
Total Business-Type Activities 6,789,243 717,807 1,714,272 2,536,492
Total Primary Government 17,146,054$ 20,918,804$ 21,812,127$ 22,787,190$
Change in Net PositionGovernmental Activities (4,883,552)$ 1,866,035$ 2,835,895$ 2,526,728$ Business-Type Activities 14,793,082 2,633,129 725,100 2,697,174
Total Primary Government 9,909,530$ 4,499,164$ 3,560,995$ 5,223,902$
CITY OF TOLLESON, ARIZONATable 2
Changes in Net Position Last Ten Fiscal Years
(Accrual Basis of Accounting)(Unaudited)
20132010 2011 2012
106

14,360,574$ 17,564,422$ 19,592,713$ 20,910,180$ 21,434,225$ 25,448,636$ 4,481,523 4,508,560 3,917,340 5,615,157 4,955,918 4,859,308
44,393 45,765 44,139 49,514 42,647 47,217 729,523 792,313 1,042,649 1,093,270 689,720 725,514 569,695 598,140 788,017 857,378 889,064 872,525 233,354 249,830 269,956 275,697 583,704 510,081
- - - - - - 56,799 38,073 147,383 162,952 285,082 838,282 30,635 37,376 55,827 119,963 164,376 152,928
110,500 (282,785) (116,962) (420,000) (139,000) (25,447) 20,616,996 23,551,694 25,741,062 28,664,111 28,905,736 33,429,044
2,553,157 2,654,745 3,293,011 2,157,082 3,224,893 3,637,831 - - - - - -
18,924 14,960 96,484 99,441 169,839 705,392 - - - - - -
27,424 77,861 96,272 57,587 - - (110,500) 282,785 116,962 420,000 139,000 25,447
2,489,005 3,030,351 3,602,729 2,734,110 3,533,732 4,368,670
23,106,001$ 26,582,045$ 29,343,791$ 31,398,221$ 32,439,468$ 37,797,714$
1,653,192$ 3,652,472$ 5,430,726$ 4,359,548$ 4,855,342$ 8,727,067$ 3,879,446 8,120,345 4,313,152 2,938,798 4,209,536 5,572,821
5,532,638$ 11,772,817$ 9,743,878$ 7,298,346$ 9,064,878$ 14,299,888$
(Concluded)
201820172015 2016 20192014
107

General FundRestricted $ 95,161 $ 232,134 $ 273,271 $ 376,237 Committed - - - - Nonspendable - 270,698 - 141,648 Assigned - 126,368 1,126,841 1,126,841 Unassigned 2,898,744 5,063,457 6,343,285 7,405,570
Total General Fund 2,993,905$ 5,692,657$ 7,743,397$ 9,050,296$
All Other Governmental FundsRestricted:
Highways and streets $ - $ 24,349 $ 309,630 $ 873,739 Debt service 1,237,552 1,131,283 1,023,296 944,792 Capital projects 3,032,892 7,244,810 6,705,563 Public safety 4,740,852 1,956,348 2,901,442 3,359,496 Other purposes 12,794 - - -
Nonspendable:Prepaid items - 16,590 - 13,117
Committed for:Capital projects 12,748,910 170,124 13,501 -
Assigned for:Public safety - - - - Other purposes - 83,887 91,301 330,144
Total All Other Governmental Funds 18,740,108$ 6,415,473$ 11,583,980$ 12,226,851$
2012
Note: The City began to report fund balance classification per GASB Statement 54 in fiscal year 2011.Prior year balances reported as reserved are reported as restricted and other balances previouslyreported as unreserved are reported as unassigned, restricted, committed, nonspendable or assignedas applicable.
2013
CITY OF TOLLESON, ARIZONATable 3
Fund Balances, Governmental Funds
20112010
Last Ten Fiscal Years(Accrual Basis of Accounting)
(Unaudited)
108

$ 336,340 $ 485,014 $ 563,507 $ 829,648 $ 509,582 $ 545,198 - - - - - - 5,000 4,446 - 1,017 4,505 23,095 - - - - - - 7,556,991 9,879,027 16,564,021 21,220,634 23,303,394 23,333,773
7,898,331$ 10,368,487$ 17,127,528$ 22,051,299$ 23,817,481$ 23,902,066$
$ 871,385 $ 884,657 $ 1,030,489 $ 1,040,487 $ 283,631 $ 545,458 1,133,469 938,131 879,996 609,568 325,667 456,077 3,718,026 474,052 242,592 169,021 25,447 11,574,765 3,118,808 3,821,797 3,773,814 2,810,608 2,241,200 2,298,089 - - 266,943 225,549 - 266,575
- - - - - -
- - - - - -
- - - - - - 382,343 306,810 - - - -
9,224,031$ 6,425,447$ 6,193,834$ 4,855,233$ 2,875,945$ 15,140,964$
2017 201920182014 2015 2016
109

RevenuesTaxes 14,865,486$ 18,664,286$ 18,618,296$ 18,440,757$ Intergovernmental 3,584,672 2,765,087 2,344,955 2,352,598 Fines and Penalties 292,923 260,534 209,436 228,788 Licenses and Permits 343,496 200,816 294,465 250,467 Charges for Services 425,500 333,963 375,380 372,889 Rents and Royalties 10,500 10,500 10,500 11,340 Contributions and Donations 71,441 61,478 83,707 119,578 Impact fees 172,761 337,312 138,117 171,515 Special assessments - - - - Interest 69,793 25,425 36,451 72,682 Other 114,501 144,552 98,533 65,467 Total revenues 19,951,073 22,803,953 22,209,840 22,086,081
ExpendituresGeneral government 3,759,888 3,561,710 3,440,722 3,815,498 Public Safety 7,776,447 8,349,354 8,068,283 8,614,560 Highways and Streets 1,731,442 2,254,695 1,574,097 1,938,342 Culture and Recreation 841,414 891,109 1,017,582 1,003,847 Redevelopment and Housing 45,851 - - - Economic Development 470,138 461,333 543,328 626,154 Health and Welfare 500,477 861,195 535,879 326,804 Capital Outlay 12,843,567 11,321,309 2,443,569 956,887 Debt Service
Principal Retirement 2,765,000 2,925,000 2,366,550 1,730,000 Interest on Long-Term Debt 1,750,350 1,667,519 926,071 903,538 Issuance Costs 100,768 - 86,642 -
Total Expenditures 32,585,342 32,293,224 21,002,723 19,915,630
Excess of RevenuesOver (Under) Expenditures (12,634,269) (9,489,271) 1,207,117 2,170,451
20132010 2011 2012
CITY OF TOLLESON, ARIZONA
Changes in Fund Balances of Governmental FundsLast Ten Fiscal Years
(Modified Accrual Basis of Accounting)(Unaudited)
Table 4
110
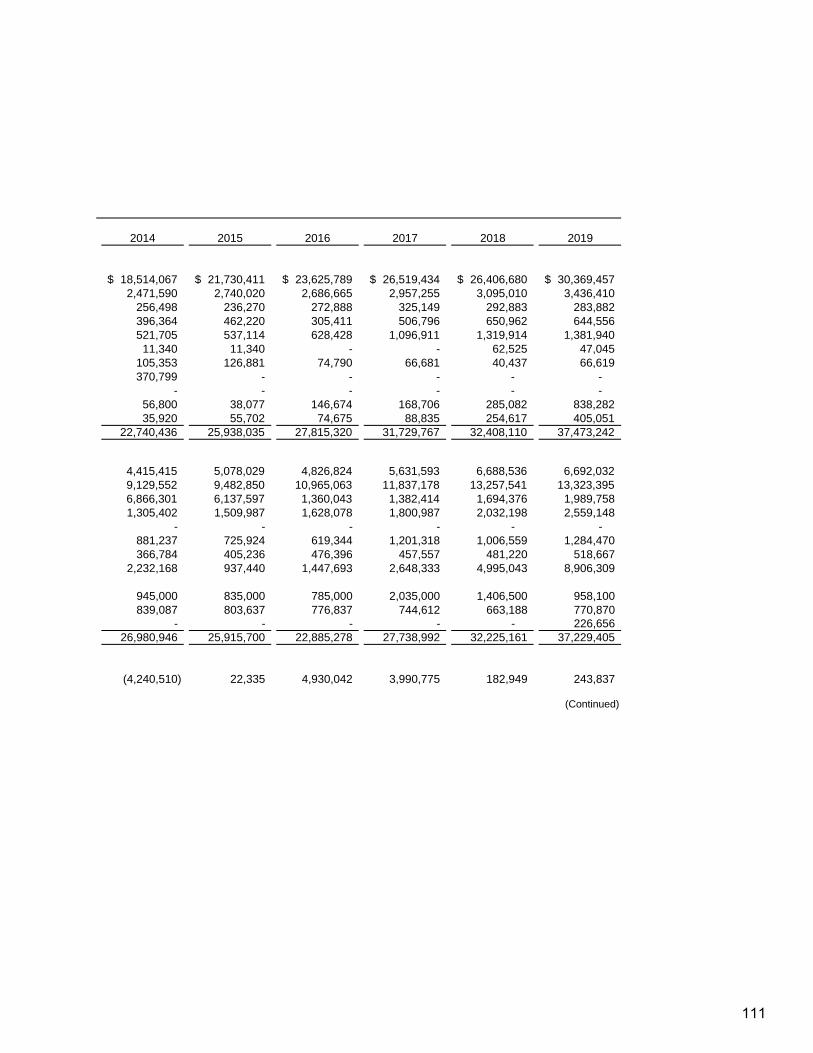
18,514,067$ 21,730,411$ 23,625,789$ 26,519,434$ 26,406,680$ 30,369,457$ 2,471,590 2,740,020 2,686,665 2,957,255 3,095,010 3,436,410
256,498 236,270 272,888 325,149 292,883 283,882 396,364 462,220 305,411 506,796 650,962 644,556 521,705 537,114 628,428 1,096,911 1,319,914 1,381,940
11,340 11,340 - - 62,525 47,045 105,353 126,881 74,790 66,681 40,437 66,619 370,799 - - - - -
- - - - - - 56,800 38,077 146,674 168,706 285,082 838,282 35,920 55,702 74,675 88,835 254,617 405,051
22,740,436 25,938,035 27,815,320 31,729,767 32,408,110 37,473,242
4,415,415 5,078,029 4,826,824 5,631,593 6,688,536 6,692,032 9,129,552 9,482,850 10,965,063 11,837,178 13,257,541 13,323,395 6,866,301 6,137,597 1,360,043 1,382,414 1,694,376 1,989,758 1,305,402 1,509,987 1,628,078 1,800,987 2,032,198 2,559,148
- - - - - - 881,237 725,924 619,344 1,201,318 1,006,559 1,284,470 366,784 405,236 476,396 457,557 481,220 518,667
2,232,168 937,440 1,447,693 2,648,333 4,995,043 8,906,309
945,000 835,000 785,000 2,035,000 1,406,500 958,100 839,087 803,637 776,837 744,612 663,188 770,870
- - - - - 226,656 26,980,946 25,915,700 22,885,278 27,738,992 32,225,161 37,229,405
(4,240,510) 22,335 4,930,042 3,990,775 182,949 243,837
(Continued)
2014 2019201820172015 2016
111

Other Financing Sources (Uses)Transfers In 2,092,220 511,785 801,535 1,763,792 Transfers Out (2,092,220) (747,422) (954,283) (1,763,792) Proceeds of Refunding Debt Issuance - - - - Proceeds of general obligation bond issuance - - - - Premium on general obligation bond issuance - - - - Proceeds of Long-Term Debt Issuance 3,642,923 - 6,159,387 - Payment to Refunded Debt Escrow Agent - - - - Proceeds from Capital Leases - - - - Proceeds from Sale of Capital Assets 9,146 99,025 5,491 14,441 Total other Financing Sources (Uses) 3,652,069 (136,612) 6,012,130 14,441
Net Change in Fund Balance (8,982,200)$ (9,625,883)$ 7,219,247$ 2,184,892$
Debt Service as a Percentage of Noncapital Expenditures 23.4% 21.9% 18.2% 13.9%
Table 4CITY OF TOLLESON, ARIZONA
(Unaudited)(Modified Accrual Basis of Accounting)
Last Ten Fiscal YearsChanges in Fund Balances of Governmental Funds
20112010 20132012
112

3,751,052 3,091,764 3,134,362 2,596,590 1,518,209 305,239 (3,640,552) (3,374,549) (3,251,324) (3,016,589) (1,657,209) (330,686)
- - - - - - - - - - - 10,850,000 - - - - - 1,005,367 - - - - - - - - - - - - - - - - - -
8,282 15,023 17,525 14,394 9,520 9,272 118,782 (267,762) (99,437) (405,605) (129,480) 11,839,192
(4,121,728)$ (245,427)$ 4,830,605$ 3,585,170$ 53,469$ 12,083,029$
7.2% 6.6% 7.3% 10.8% 7.5% 6.9%
(Concluded)
201920182017201620152014
113

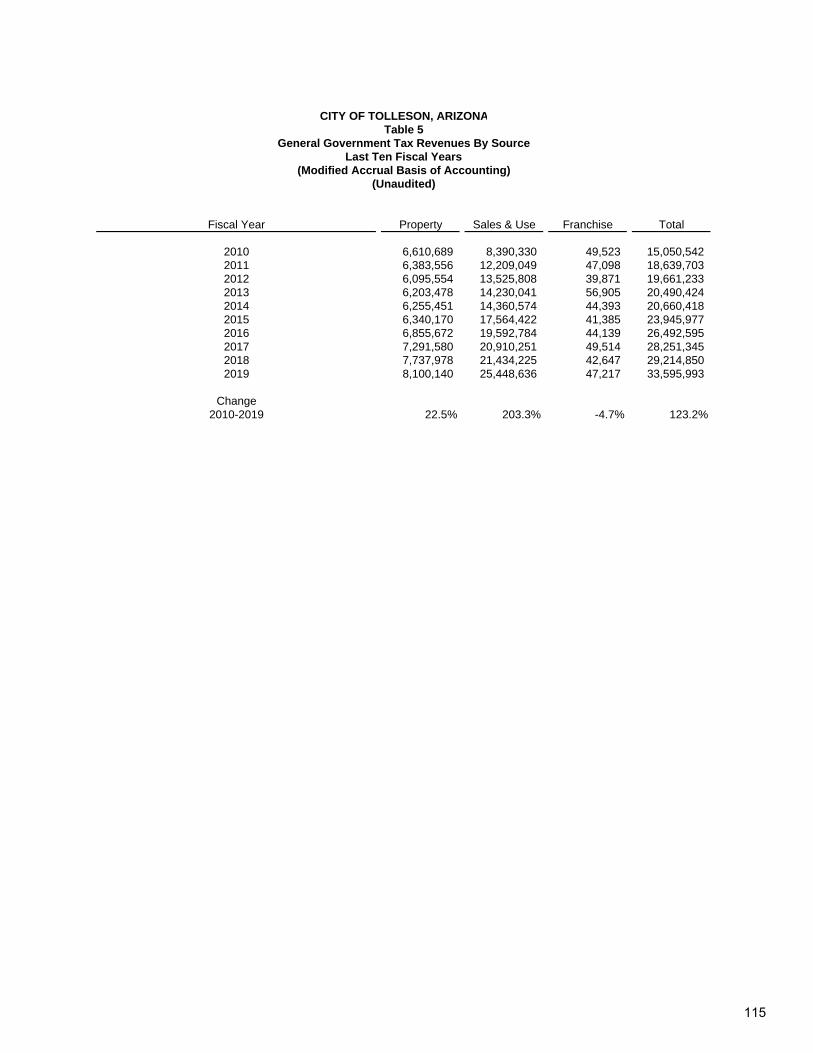
CITY OF TOLLESON, ARIZONATable 5
General Government Tax Revenues By SourceLast Ten Fiscal Years
(Modified Accrual Basis of Accounting)(Unaudited)
Fiscal Year Property Sales & Use Franchise Total
2010 6,610,689 8,390,330 49,523 15,050,542 2011 6,383,556 12,209,049 47,098 18,639,703 2012 6,095,554 13,525,808 39,871 19,661,233 2013 6,203,478 14,230,041 56,905 20,490,424 2014 6,255,451 14,360,574 44,393 20,660,418 2015 6,340,170 17,564,422 41,385 23,945,977 2016 6,855,672 19,592,784 44,139 26,492,595 2017 7,291,580 20,910,251 49,514 28,251,345 2018 7,737,978 21,434,225 42,647 29,214,850 2019 8,100,140 25,448,636 47,217 33,595,993
Change2010-2019 22.5% 203.3% -4.7% 123.2%
115

Industrial & Total TaxableFiscal Commercial Agricultural Residential AssessedYear Property and Vacant Property Others Value
2010 231,012 15,949 17,373 3,170 264,546 2011 231,573 15,934 14,458 2,580 264,545 2012 192,440 11,383 11,455 2,064 217,342 2013 160,559 9,294 8,456 1,759 180,068 2014 143,031 8,901 8,076 2,246 162,254 2015 147,663 9,698 9,009 2,259 168,629 2016 172,787 12,297 12,619 1,958 199,661 2017 210,837 12,818 13,974 1,976 239,605 2018 239,361 13,797 15,834 2,264 271,256 2019 264,312 9,810 20,042 1,794 295,958
CITY OF TOLLESON, ARIZONA
Assess Value and Estimated Actual Value of Taxable PropertyLast Ten Fiscal Years
(Unaudited)(In Thousands of Dollars)
Table 6
116
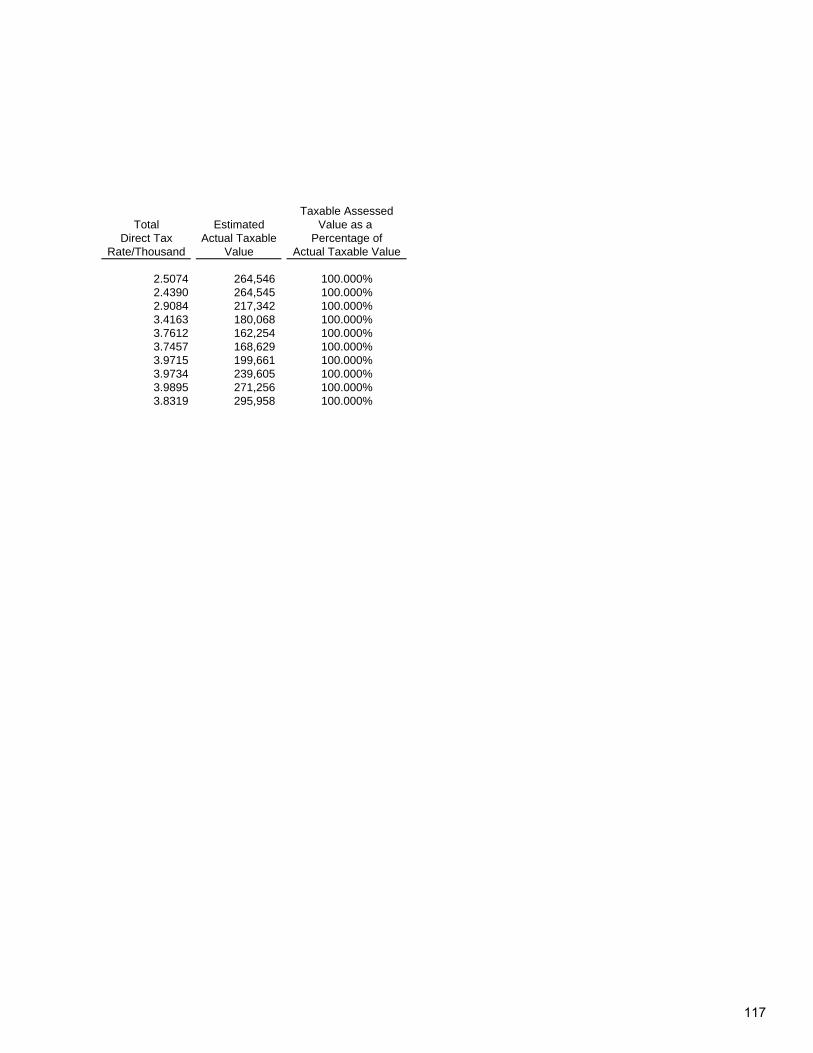
Taxable AssessedTotal Estimated Value as a
Direct Tax Actual Taxable Percentage ofRate/Thousand Value Actual Taxable Value
2.5074 264,546 100.000%2.4390 264,545 100.000%2.9084 217,342 100.000%3.4163 180,068 100.000%3.7612 162,254 100.000%3.7457 168,629 100.000%3.9715 199,661 100.000%3.9734 239,605 100.000%3.9895 271,256 100.000%3.8319 295,958 100.000%
117

CITY OF TOLLESON, ARIZONATable 7
Property Tax RatesDirect and Overlapping Governments
Last Ten Fiscal Years(Unaudited)
(Rate per $1,000 of Assessed Value)
General Flood ControlObligation Total and Water
Fiscal Basic Debt Direct School ConservationYear Rate Service Rate District District County Rate Total
2010 0.9822 1.5901 2.5723 N/A N/A N/A 2.57232011 0.9742 1.4648 2.4390 N/A N/A N/A 2.43902012 1.1232 1.7852 2.9084 N/A N/A N/A 2.90842013 1.2643 2.1520 3.4163 N/A N/A N/A 3.41632014 1.7811 1.9801 3.7612 N/A N/A N/A 3.76122015 1.8309 1.9148 3.7457 N/A N/A N/A 3.74572016 1.8344 2.1371 3.9715 N/A N/A N/A 3.97152017 1.8325 2.1409 3.9734 N/A N/A N/A 3.97342018 1.8325 2.1570 3.9895 N/A N/A N/A 3.98952019 1.8039 2.0280 3.8319 N/A N/A N/A 3.8319
Source: Maricopa County Finance Department
N/A - Not available at the time of printing
Direct Rates Overlapping Rates
118
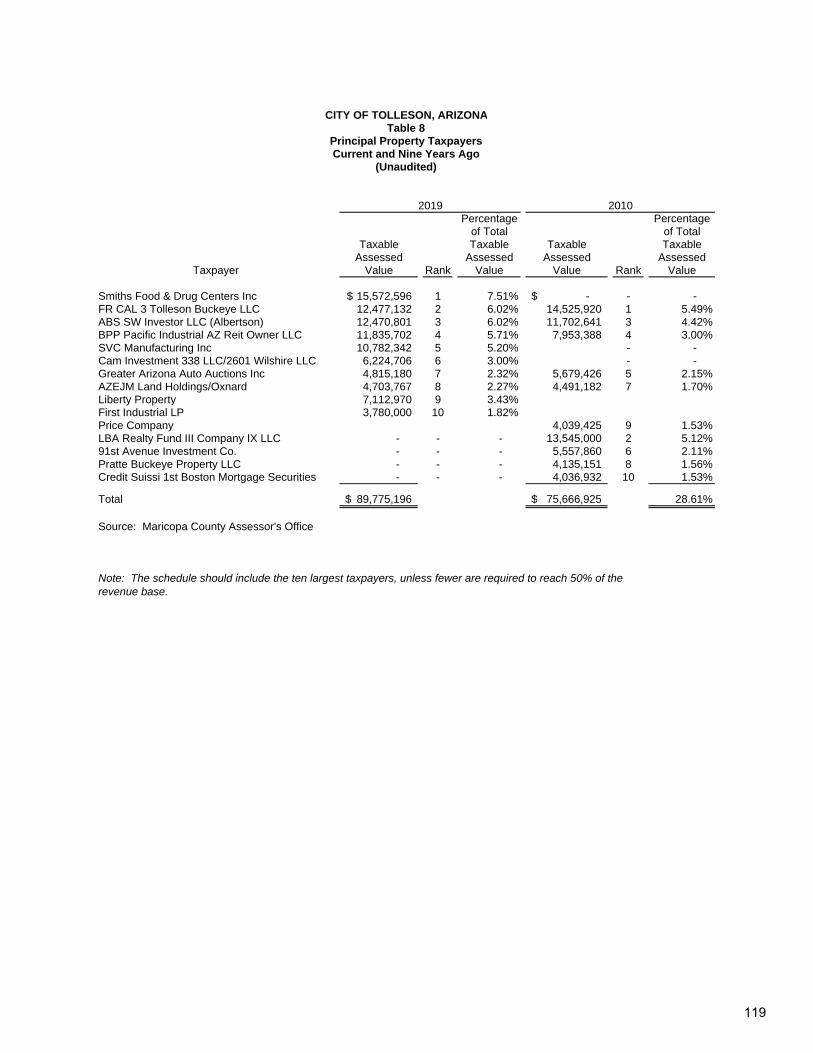
CITY OF TOLLESON, ARIZONATable 8
Principal Property TaxpayersCurrent and Nine Years Ago
(Unaudited)
Percentage Percentageof Total of Total
Taxable Taxable Taxable TaxableAssessed Assessed Assessed Assessed
Value Rank Value Value Rank Value
Smiths Food & Drug Centers Inc 15,572,596$ 1 7.51% -$ - - 12,477,132 2 6.02% 14,525,920 1 5.49%12,470,801 3 6.02% 11,702,641 3 4.42%11,835,702 4 5.71% 7,953,388 4 3.00%
SVC Manufacturing Inc 10,782,342 5 5.20% - - Cam Investment 338 LLC/2601 Wilshire LLC 6,224,706 6 3.00% - - Greater Arizona Auto Auctions Inc 4,815,180 7 2.32% 5,679,426 5 2.15%AZEJM Land Holdings/Oxnard 4,703,767 8 2.27% 4,491,182 7 1.70%Liberty Property 7,112,970 9 3.43%First Industrial LP 3,780,000 10 1.82%Price Company 4,039,425 9 1.53%LBA Realty Fund III Company IX LLC - - - 13,545,000 2 5.12%91st Avenue Investment Co. - - - 5,557,860 6 2.11%Pratte Buckeye Property LLC - - - 4,135,151 8 1.56%Credit Suissi 1st Boston Mortgage Securities - - - 4,036,932 10 1.53%
Total 89,775,196$ 75,666,925$ 28.61%
Source: Maricopa County Assessor's Office
Note: The schedule should include the ten largest taxpayers, unless fewer are required to reach 50% of therevenue base.
BPP Pacific Industrial AZ Reit Owner LLC
2010
FR CAL 3 Tolleson Buckeye LLC
2019
Taxpayer
ABS SW Investor LLC (Albertson)
119

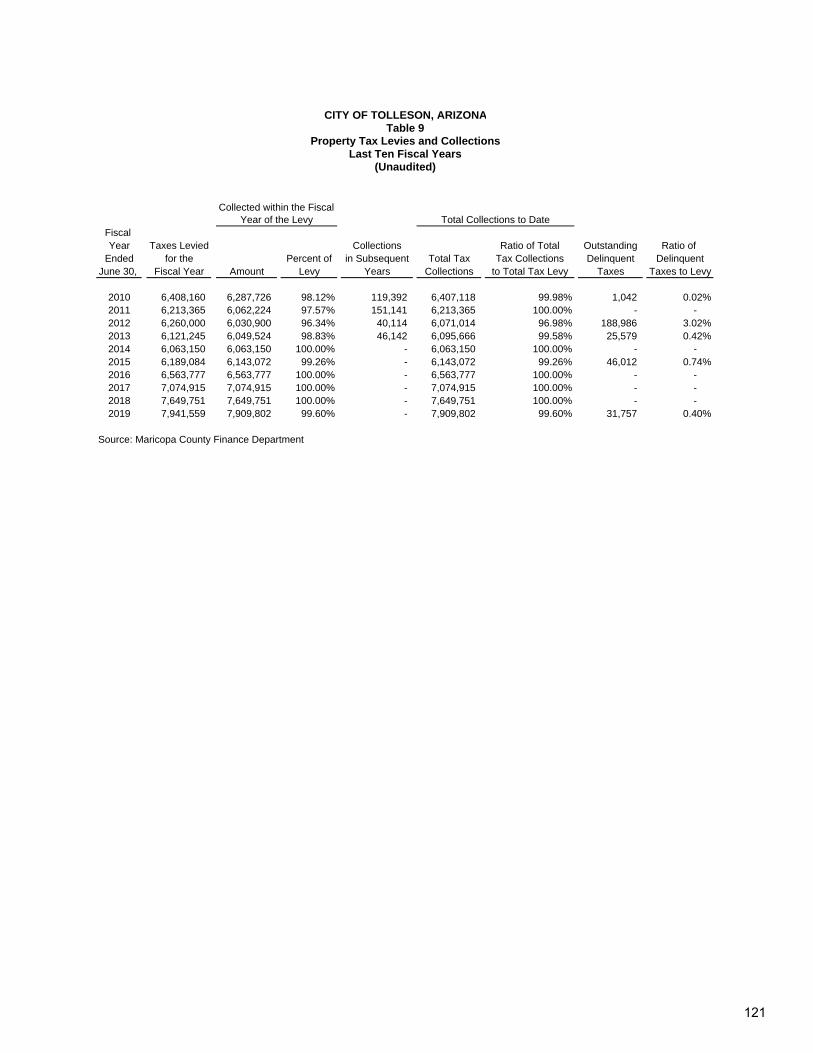
Fiscal Year Taxes Levied Collections Ratio of Total Outstanding Ratio of
Ended for the Percent of in Subsequent Total Tax Tax Collections Delinquent DelinquentJune 30, Fiscal Year Amount Levy Years Collections to Total Tax Levy Taxes Taxes to Levy
2010 6,408,160 6,287,726 98.12% 119,392 6,407,118 99.98% 1,042 0.02%2011 6,213,365 6,062,224 97.57% 151,141 6,213,365 100.00% - - 2012 6,260,000 6,030,900 96.34% 40,114 6,071,014 96.98% 188,986 3.02%2013 6,121,245 6,049,524 98.83% 46,142 6,095,666 99.58% 25,579 0.42%2014 6,063,150 6,063,150 100.00% - 6,063,150 100.00% - - 2015 6,189,084 6,143,072 99.26% - 6,143,072 99.26% 46,012 0.74%2016 6,563,777 6,563,777 100.00% - 6,563,777 100.00% - - 2017 7,074,915 7,074,915 100.00% - 7,074,915 100.00% - - 2018 7,649,751 7,649,751 100.00% - 7,649,751 100.00% - - 2019 7,941,559 7,909,802 99.60% - 7,909,802 99.60% 31,757 0.40%
Source: Maricopa County Finance Department
Last Ten Fiscal Years(Unaudited)
Collected within the Fiscal Year of the Levy Total Collections to Date
CITY OF TOLLESON, ARIZONATable 9
Property Tax Levies and Collections
121

Sales CategoryCommercial & Utilities 1,165,867$ 1,248,634$ 1,305,659$ 1,340,608$ Construction 946,494 1,012,531 870,319 696,757 Manufacturing 205,326 210,445 244,306 273,890 Wholesale 1,250,650 1,546,804 1,717,069 1,739,508 Retail 2,549,657 5,400,145 6,594,272 6,900,851 Real estate 1,319,640 1,487,355 1,776,811 1,843,998 Services 169,887 219,932 154,590 674,710 All other outlets 782,809 1,083,202 862,782 759,719
Total 8,390,330$ 12,209,048$ 13,525,808$ 14,230,041$
City Sales Tax Rate 2.50% 2.50% 2.50% 2.50%
Source: Arizona State Revenue
Note: This schedule requires that governments present revenue information about their most
2010 2011 2012 2013
(Unaudited)Last Ten Fiscal Years
Taxable Sales By CategoryTable 10
CITY OF TOLLESON, ARIZONA
122
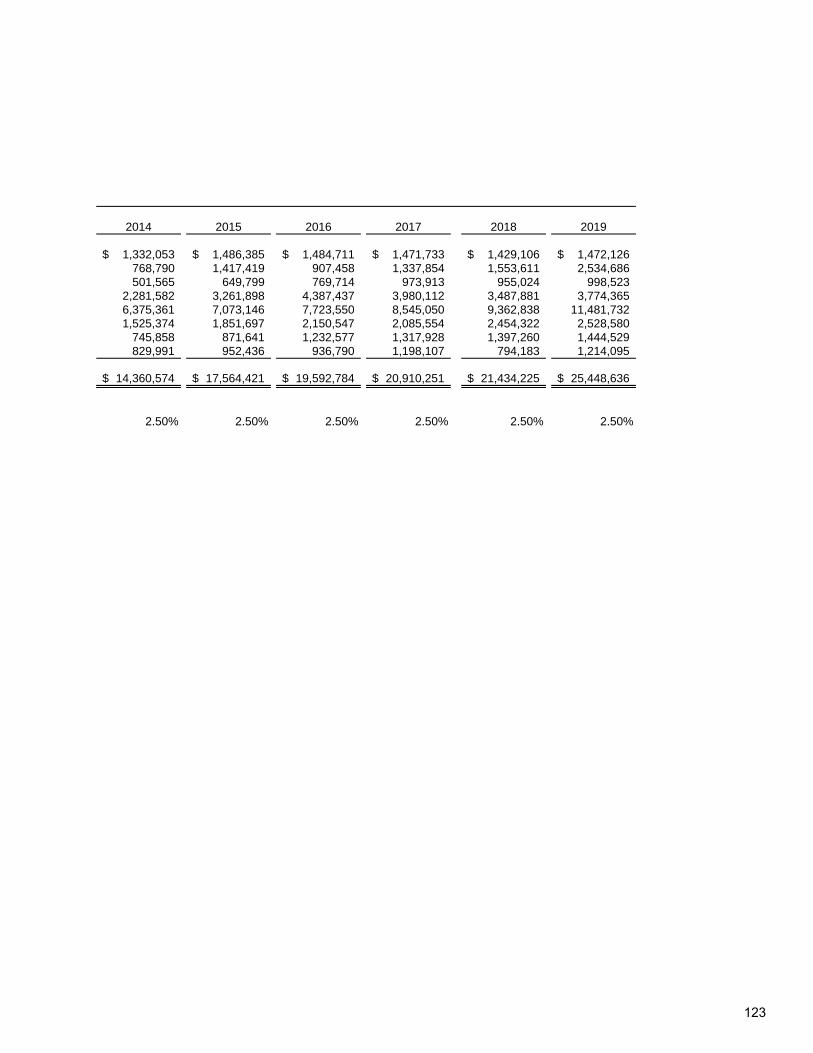
1,332,053$ 1,486,385$ 1,484,711$ 1,471,733$ 1,429,106$ 1,472,126$ 768,790 1,417,419 907,458 1,337,854 1,553,611 2,534,686 501,565 649,799 769,714 973,913 955,024 998,523
2,281,582 3,261,898 4,387,437 3,980,112 3,487,881 3,774,365 6,375,361 7,073,146 7,723,550 8,545,050 9,362,838 11,481,732 1,525,374 1,851,697 2,150,547 2,085,554 2,454,322 2,528,580
745,858 871,641 1,232,577 1,317,928 1,397,260 1,444,529 829,991 952,436 936,790 1,198,107 794,183 1,214,095
14,360,574$ 17,564,421$ 19,592,784$ 20,910,251$ 21,434,225$ 25,448,636$
2.50% 2.50% 2.50% 2.50% 2.50% 2.50%
20192015 2016 2017 20182014
123

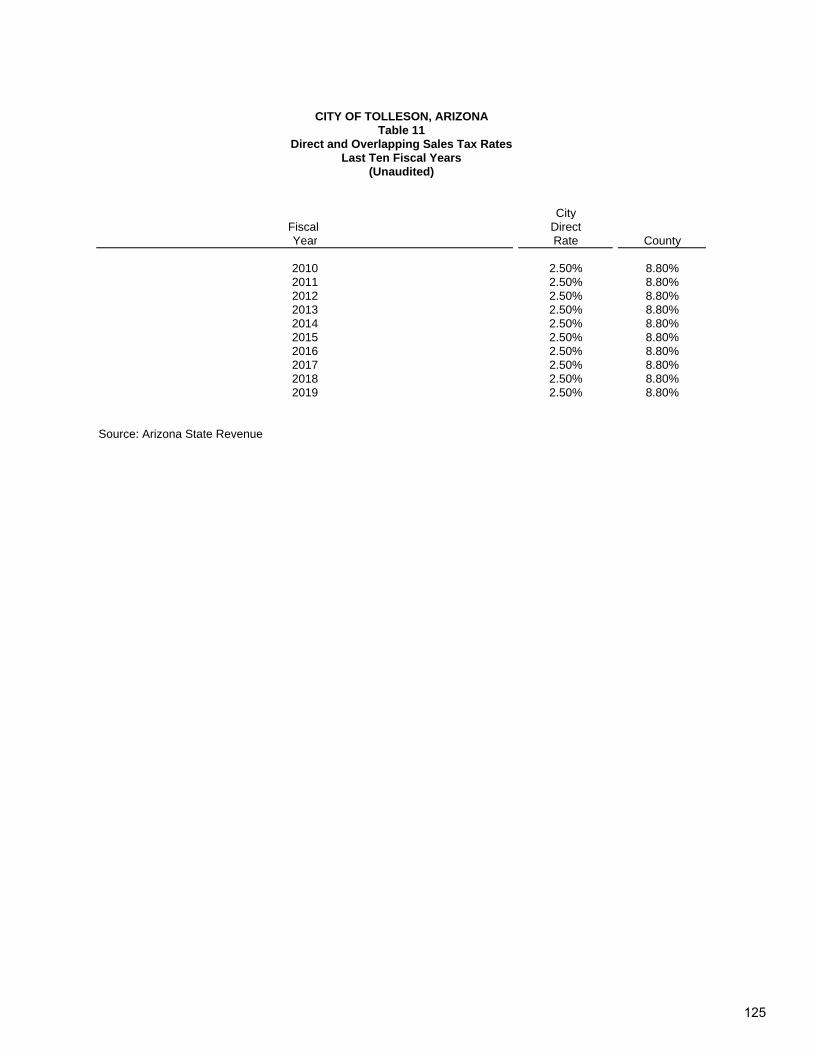
CityFiscal DirectYear Rate County
2010 2.50% 8.80%2011 2.50% 8.80%2012 2.50% 8.80%2013 2.50% 8.80%2014 2.50% 8.80%2015 2.50% 8.80%2016 2.50% 8.80%2017 2.50% 8.80%2018 2.50% 8.80%2019 2.50% 8.80%
Source: Arizona State Revenue
(Unaudited)Last Ten Fiscal Years
Direct and Overlapping Sales Tax RatesTable 11
CITY OF TOLLESON, ARIZONA
125

General Special General WaterFiscal Obligation Revenue Assessment Capital Obligation RevenueYear Bonds Bonds Bonds Leases Bonds Bonds
2010 32,155 8,780 - - - - 2011 34,744 8,399 - - - - 2012 13,694 8,120 - - 20,991 - 2013 12,305 7,780 - - 19,430 - 2014 11,710 7,430 - - 16,930 - 2015 11,235 7,070 - - 14,220 - 2016 10,825 6,929 - - 11,330 - 2017 9,180 6,305 - - 9,485 - 2018 8,179 5,900 - - 6,837 - 2019 18,495 5,475 - - 3,860 -
* Information on personal income from these fiscal years was not available
Notes: Details regarding the City's outstanding debt can be found in the notes to the financial statements.
Governmental Activities Business-type Activities
CITY OF TOLLESON, ARIZONATable 12
Ratio of Outstanding Debt By TypeLast Ten Fiscal Years
(Unaudited)(Dollars in Thousands, Except Per Capita)
126

Waste Water Total PercentageCapital WIFA Primary of Personal PerLeases Loan Government Income Capita
- 6,000 46,935 * 6,862 - 3,856 46,999 * 7,181 - 8,895 51,700 * 7,712 - 8,526 48,041 * 7,166 - 8,144 44,214 * 6,544 - 7,750 40,275 * 5,961 - 7,342 36,426 * 5,257 - 6,921 31,891 * 4,443 - 6,486 27,402 * 3,803 - 6,037 33,867 * 4,640
Business-type Activities
127

Table 13Ratios of General Bonded Debt Outstanding
Last Ten Fiscal Years(Unaudited)
Taxable Percentage ofGeneral Net General Assessed Actual Taxable
Fiscal Obligation Obligation Value of Value of Per Year Bonds Bonded Debt Property Property Population Capita
2010 32,155 32,155 264,546 12.15% 6,840 4,701 2011 34,744 34,744 264,545 13.13% 6,545 5,308 2012 34,685 34,685 217,342 15.96% 6,704 5,174 2013 36,708 36,708 180,068 20.39% 6,704 5,476 2014 33,391 33,391 162,254 20.58% 6,756 4,942 2015 29,976 29,976 168,630 17.78% 6,756 4,437 2016 26,438 26,438 199,661 13.24% 6,929 3,816 2017 22,703 22,703 239,606 9.48% 6,929 3,277 2018 18,799 18,799 271,257 6.93% 6,929 2,713 2019 25,877 25,877 295,958 8.74% 7,299 3,545
Notes:
a See schedule 7 for property value data.
Details regarding the City's outstanding debt can be found in the notes to the financial statements.
CITY OF TOLLESON, ARIZONA
(Dollars in Thousands, Except Per Capita)
128
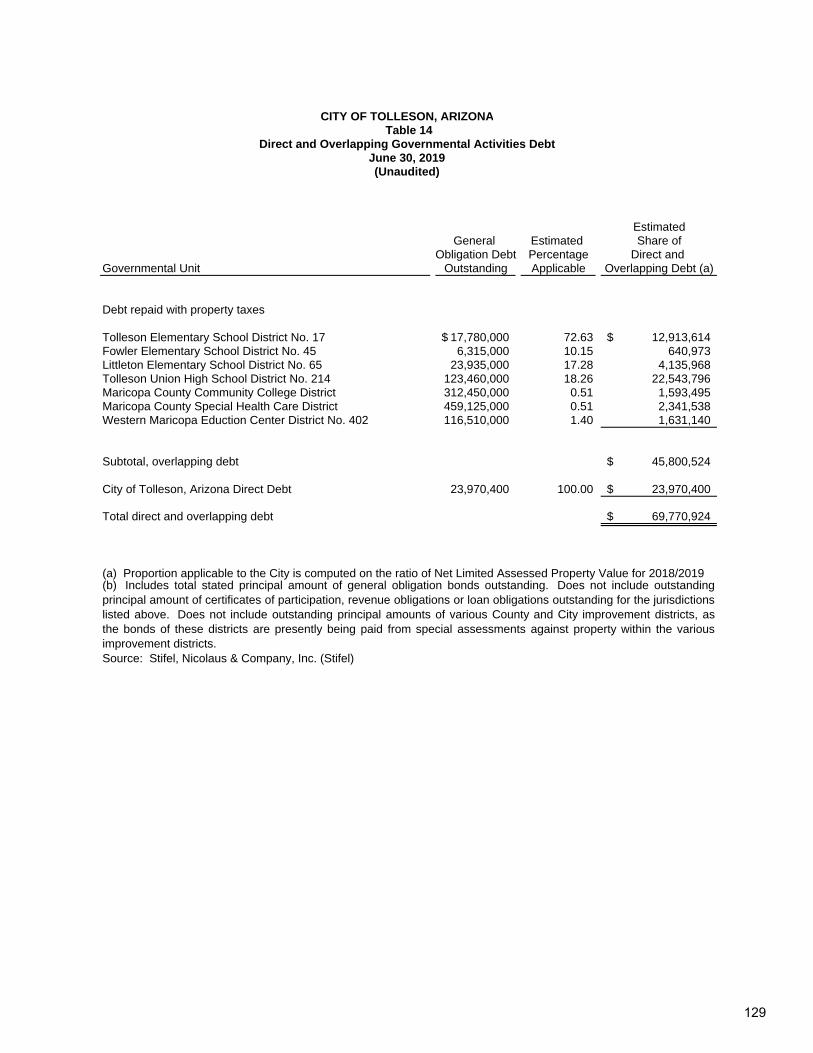
Estimated
General Estimated Share ofObligation Debt Percentage Direct and
Outstanding Applicable Overlapping Debt (a)
17,780,000$ 72.63 12,913,614$ 6,315,000 10.15 640,973
23,935,000 17.28 4,135,968123,460,000 18.26 22,543,796312,450,000 0.51 1,593,495
Maricopa County Special Health Care District 459,125,000 0.51 2,341,538Western Maricopa Eduction Center District No. 402 116,510,000 1.40 1,631,140
45,800,524$
City of Tolleson, Arizona Direct Debt 23,970,400 100.00 23,970,400$
Total direct and overlapping debt 69,770,924$
(a) Proportion applicable to the City is computed on the ratio of Net Limited Assessed Property Value for 2018/2019
CITY OF TOLLESON, ARIZONATable 14
Direct and Overlapping Governmental Activities DebtJune 30, 2019
Governmental Unit
Debt repaid with property taxes
Tolleson Elementary School District No. 17
Source: Stifel, Nicolaus & Company, Inc. (Stifel)
(Unaudited)
Fowler Elementary School District No. 45Littleton Elementary School District No. 65
Subtotal, overlapping debt
Maricopa County Community College DistrictTolleson Union High School District No. 214
(b) Includes total stated principal amount of general obligation bonds outstanding. Does not include outstandingprincipal amount of certificates of participation, revenue obligations or loan obligations outstanding for the jurisdictionslisted above. Does not include outstanding principal amounts of various County and City improvement districts, asthe bonds of these districts are presently being paid from special assessments against property within the variousimprovement districts.
129


CITY OF TOLLESON, ARIZONATable 15
Calculation of Legal Debt MarginJune 30, 2019(Unaudited)
Net Assessed Valuation 295,958,429$
Water, Sewer, Light, Parks, Open Space and Recreational Facility Bonds
Debt Limit - 20% of Secondary Net Assessed Valuation 59,191,686$
Debt Applicable to LimitGeneral Obligation Bonds Outstanding 15,026,823$ Less Amount Set Aside for Repayment of Debt -
Net Debt Applicable to Limit 15,026,823
20% Legal Debt Margin 44,164,863
All Other General Obligation Bonds
Debt Limit - 6% of Secondary Net Assessd Valuation 17,757,506
Debt Applicable to LimitGeneral Obligation Bonds Outstanding 10,850,000 Less Amount Set Aside for Repayment of Debt -
Net Debt Applicable to Limit 10,850,000
All Other General Obligation Bonds Debt Margin 6,907,506
Total Legal Debt Margin 51,072,369$
Source: Mariccopa County Assessor's Office
131

Net Secondary Assessed Valuation 264,544,909$ 264,544,909$ 217,342,534$ 180,067,717$ Debt Limit 68,781,677 68,781,677 56,509,059 46,817,606
Total net debt applicable to limit 32,155,000 29,555,000 34,685,000 31,735,000
Legal debt margin 36,626,677$ 39,226,677$ 21,824,059$ 15,082,606$
Total net debt applicable to the limitas a percentage of debt limit. 46.75% 42.97% 61.38% 67.78%
CITY OF TOLLESON, ARIZONATable 16
Legal Debt Margin InformationLast Ten Fiscal Years
(Unaudited)
2010 2011 2012 2013
132

162,254,481$ 168,629,759$ 199,662,057$ 239,605,939$ 271,256,677$ 295,958,429$ 42,186,165 43,843,737 51,912,135 62,297,544 70,526,736 76,949,192
33,160,790 29,738,090 26,192,537 22,702,537 18,798,871 25,876,823
9,025,375$ 14,105,647$ 25,719,598$ 39,595,007$ 51,727,865$ 51,072,369$
78.61% 67.83% 50.46% 36.44% 26.65% 33.63%
20192018201720162014 2015
133
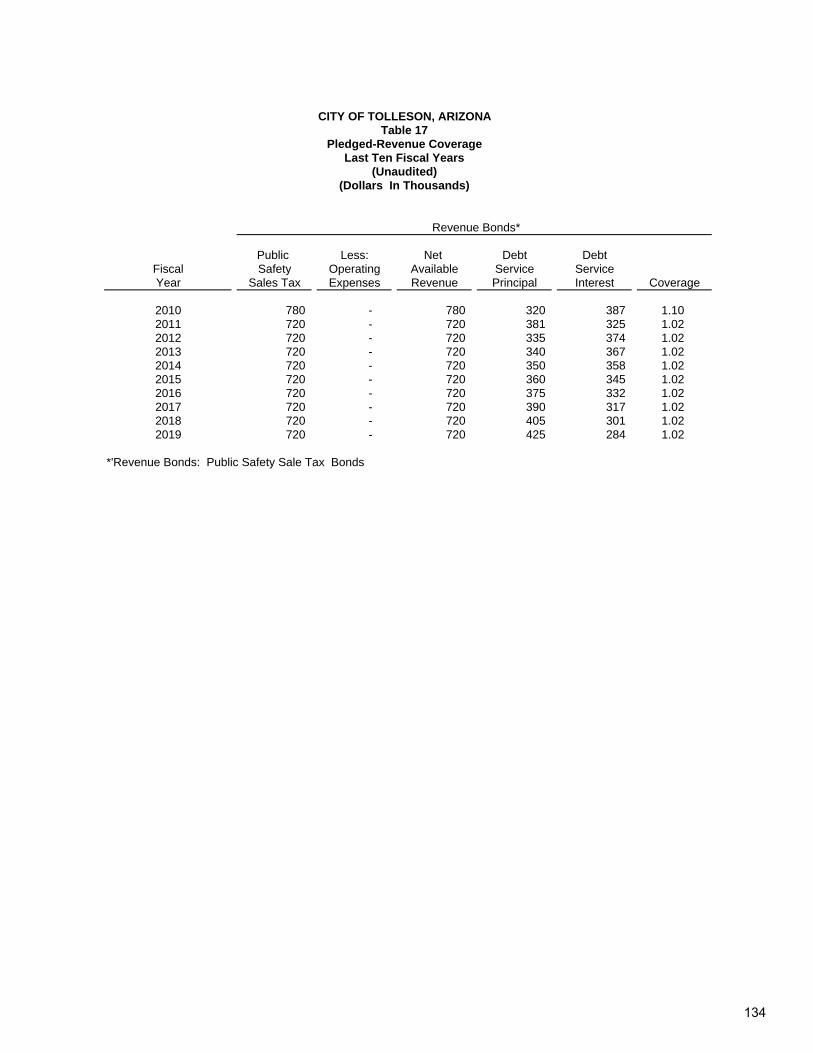
Public Less: Net Debt DebtFiscal Safety Operating Available Service ServiceYear Sales Tax Expenses Revenue Principal Interest Coverage
2010 780 - 780 320 387 1.102011 720 - 720 381 325 1.022012 720 - 720 335 374 1.022013 720 - 720 340 367 1.022014 720 - 720 350 358 1.022015 720 - 720 360 345 1.022016 720 - 720 375 332 1.022017 720 - 720 390 317 1.022018 720 - 720 405 301 1.022019 720 - 720 425 284 1.02
*'Revenue Bonds: Public Safety Sale Tax Bonds
CITY OF TOLLESON, ARIZONATable 17
Pledged-Revenue CoverageLast Ten Fiscal Years
(Unaudited)(Dollars In Thousands)
Revenue Bonds*
134

Special Debt DebtAssessment Service ServiceCollections Principal Interest Coverage
- - - - - - - - - - - - - - - - - - - - - - - - - - - - - - - - - - - - - - - -
Special Assessment Bonds
135

CITY OF TOLLESON, ARIZONATable 18
Demographic and Economic StatisticsLast Ten Fiscal Years
(Unaudited)
PerCapita Education
Calendar Personal Personal Median Level in Years School UnemploymentYear Population Income Income Age of Schooling Enrollment Rate
2010 6,840 N/A N/A N/A N/A N/A 9.80%2011 6,545 N/A N/A N/A N/A N/A 8.40%2012 6,704 37,972 12,285 N/A N/A N/A 8.25%2013 6,704 37,972 12,285 N/A N/A N/A 6.70%2014 6,756 37,972 12,285 N/A N/A N/A 6.40%2015 6,756 32,196 12,934 N/A N/A N/A 4.80%2016 6,929 34,485 13,391 N/A N/A N/A 4.50%2017 7,178 31,388 13,588 N/A N/A N/A 4.50%2018 7,205 39,714 16,267 N/A N/A N/A 4.50%2019 7,299 39,714 16,267 N/A N/A N/A 4.50%
Sources: US Department of Commerce for population and Homefacts (homefacts.com/unemployment/Arizona/Maricopa-County/Tolleson for unemployment rate.
N/A - Information was not available for these fiscal years
Note : GASB Statement 44 requires that general purpose governments present, at a minimum, population, total and per capita personal income, and unemployment rate. Governments may add other demographic and economic statistics that are useful and relevant to the user of their financial reports, either in this or in additional schedules. Median age, education level and school enrollment are optional statistics; however, they are among those most commonly presented by governments.
136

Percentage Percentageof Total City of Total City
Taxpayer Employees Rank Employment Employees Rank EmploymentJ.B. Packerland 1,150 1 8.09% 1,325 1 27.08%Papa Johns Salads Produce 960 2 6.76% - - - Albertson's, Inc. 720 3 5.07% 400 7 8.17%Atlas Retail Services 670 4 4.71% - - - Pepsico 480 5 3.38% 400 5 8.17%Rousseau Farming Co 400 6 2.81% 390 6 7.97%Autozone Ince 380 7 2.67% 290 9 5.93%Tolleson Union High School Dist 214 370 8 2.60% - - - SRP 370 9 2.60% 363 8 7.42%Sysco Food Services 370 10 2.60% 525 2 10.73%Fry's Distribution - - - 450 4 9.20%Greater Auto Auction - - - 500 3 10.22%Landis Plastics - - - 250 10 5.11%
Total 5,870 41.29% 4,893 100.00%
Source: Maricopa Association of Governments (MAG), http://geo.azmag.gov/maps/employment/.
20102019
CITY OF TOLLESON, ARIZONATable 19
Principal Employers
(Unaudited)Current and Nine Years Ago
137


Function/Program
General government 35 35 39 34 45 46.5 41 47 48 60Police 43 45 45 43 42 42 48 49 49 49Fire 31 31 31 31 31 33 33 32 32 33Public Works 14 14 17 20 18.5 18 19 19 21 22Community Services 12 12 6 8 8 8 8.5 8 9 10.5Water 8 8 8 8 8 8 10.5 12 12.6 14Sanitation 3 2 2 2 1.5 1.5 2.5 2 - - Wastewater/Sewer 23 21 20 20 21 24 28 28.5 27.4 28.5
Total 169 168 168 166 175 181 190.5 197.5 199 217
Source: City Records
201920182010 2011 2012 2013 2014 2015 2016 2017
CITY OF TOLLESON, ARIZONATable 20
Full-Time Equivalent Employee By FunctionLast Ten Fiscal Years
(Unaudited)
139
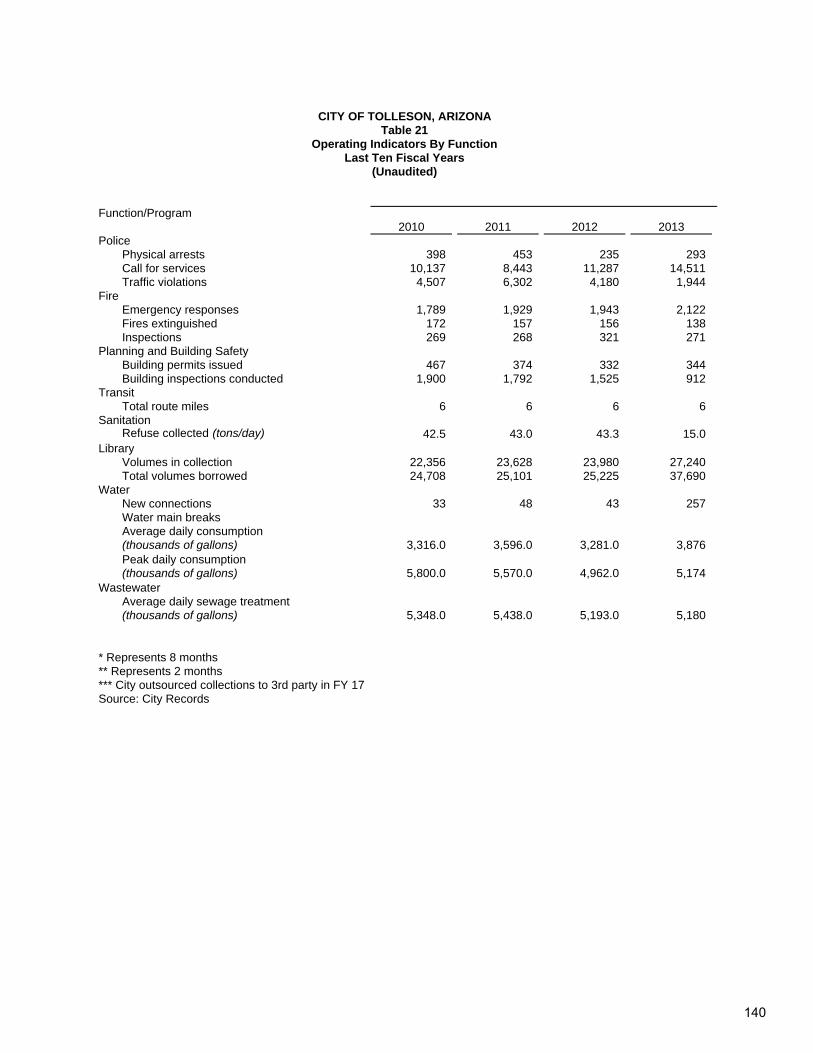
Function/Program
PolicePhysical arrests 398 453 235 293 Call for services 10,137 8,443 11,287 14,511 Traffic violations 4,507 6,302 4,180 1,944
FireEmergency responses 1,789 1,929 1,943 2,122 Fires extinguished 172 157 156 138 Inspections 269 268 321 271
Planning and Building SafetyBuilding permits issued 467 374 332 344 Building inspections conducted 1,900 1,792 1,525 912
TransitTotal route miles 6 6 6 6
SanitationRefuse collected (tons/day) 42.5 43.0 43.3 15.0
LibraryVolumes in collection 22,356 23,628 23,980 27,240 Total volumes borrowed 24,708 25,101 25,225 37,690
WaterNew connections 33 48 43 257 Water main breaksAverage daily consumption(thousands of gallons) 3,316.0 3,596.0 3,281.0 3,876 Peak daily consumption(thousands of gallons) 5,800.0 5,570.0 4,962.0 5,174
WastewaterAverage daily sewage treatment(thousands of gallons) 5,348.0 5,438.0 5,193.0 5,180
* Represents 8 months** Represents 2 months*** City outsourced collections to 3rd party in FY 17Source: City Records
CITY OF TOLLESON, ARIZONATable 21
Operating Indicators By FunctionLast Ten Fiscal Years
(Unaudited)
2010 2011 2012 2013
140

257 248 293 352 330 404 12,484 11,712 14,650 15,428 15,942 16,560
3,582 2,758 3,599 3,433 2,456 1,825
2,212 2,322 2,636 2,915 3,688 3,701 134 135 120 116 1,088 1,099
43 116 633 52** 1 24
386 327 336 383 429 488 1425 1460 694* 860* 1286 1,565
6 6 6 6 6 6
8.45 8.87 8.46 0.42*** 0.54 0.76
26,983 23,172 22,894 24,337 23,809 25,210 36,480 33,183 29,166 34,419 31,110 39,211
44 35 19 26 8 59 5
3,877 3,000 3,823 3,082 3,940 3,774
5,384 6,000 7,100 6,480 5,602 5,721
5,274 8,230 5,347 5,353 5,359 5,490
201920182014 2015 2016 2017
141

Function/Program
PoliceStations 1 1 1 1Patrol Units 22 22 22 23
Fire Stations 1 1 1 1Refuse collection
Collection trucks 2 2 2 2Other public works
Streets (miles) 33 33 34 34Streetlights 770 770 778 778Traffic signals
Parks and recreationAcreage 20 20 20 20Playgrounds 4 4 3 3Baseball/softball diamondsSoccer/football fieldsCommunity/Youth Centers 2 2 2 2
WaterWater mains (miles) 48 48 48 50Fire hydrants 450 450 451 475Storage capacity (thousands of gallons)
WastewaterSanitary sewers (miles) 46 46 46 37.07Storm sewers (miles)Treatment capacity (thousands of gallons) 17,500 17,500 17,500 17,500
Source:City Records
CITY OF TOLLESON, ARIZONATable 22
Capital Asset Statistics By FunctionLast Ten Fiscal Years
(Unaudited)
2010 2011 2012 2013
142
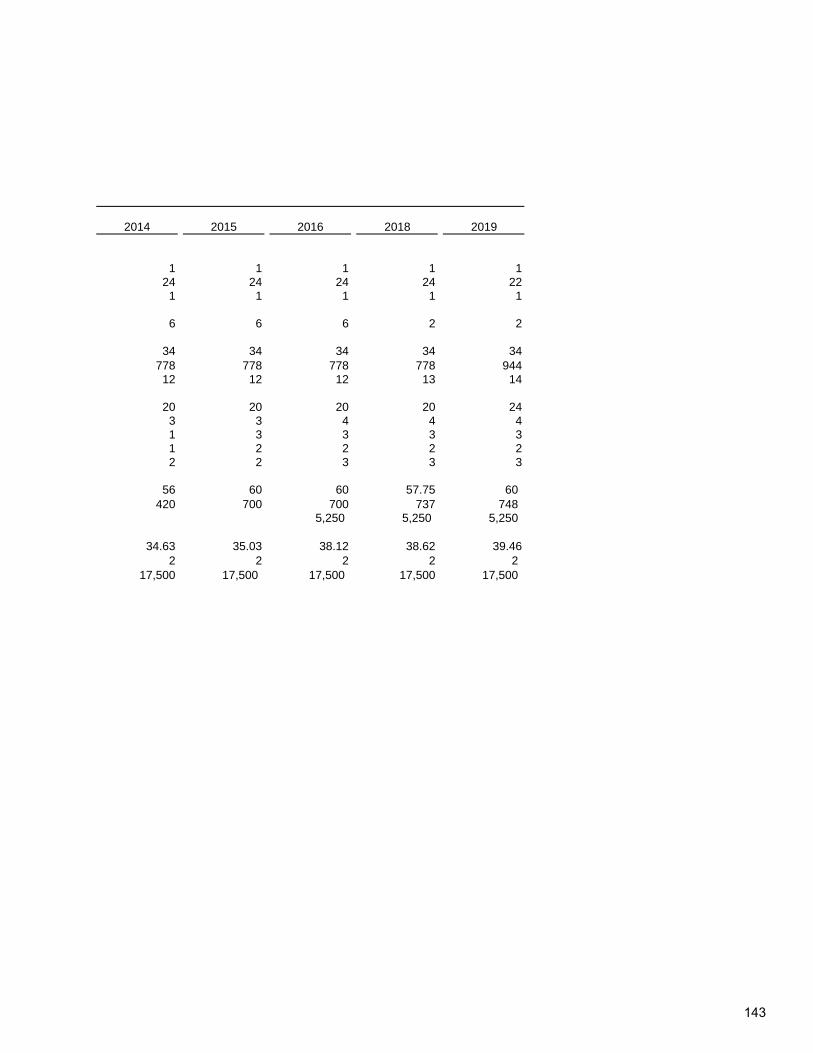
1 1 1 1 124 24 24 24 22
1 1 1 1 1
6 6 6 2 2
34 34 34 34 34778 778 778 778 944
12 12 12 13 14
20 20 20 20 243 3 4 4 41 3 3 3 31 2 2 2 22 2 3 3 3
56 60 60 57.75 60 420 700 700 737 748
5,250 5,250 5,250
34.63 35.03 38.12 38.62 39.462 2 2 2 2
17,500 17,500 17,500 17,500 17,500
201920182014 2015 2016
143

CITY OF TOLLESON, ARIZONATable 23
Property ValuationsFor the Fiscal Year Ended June 30, 2019
(Unaudited)
2018-2019 Fiscal Year
Estimated actual valuation 1,933,298,374$ Net primary assessed valuation 207,248,691
Source: Maricopa County Assessor's Office and Maricopa County Department of Finance
144
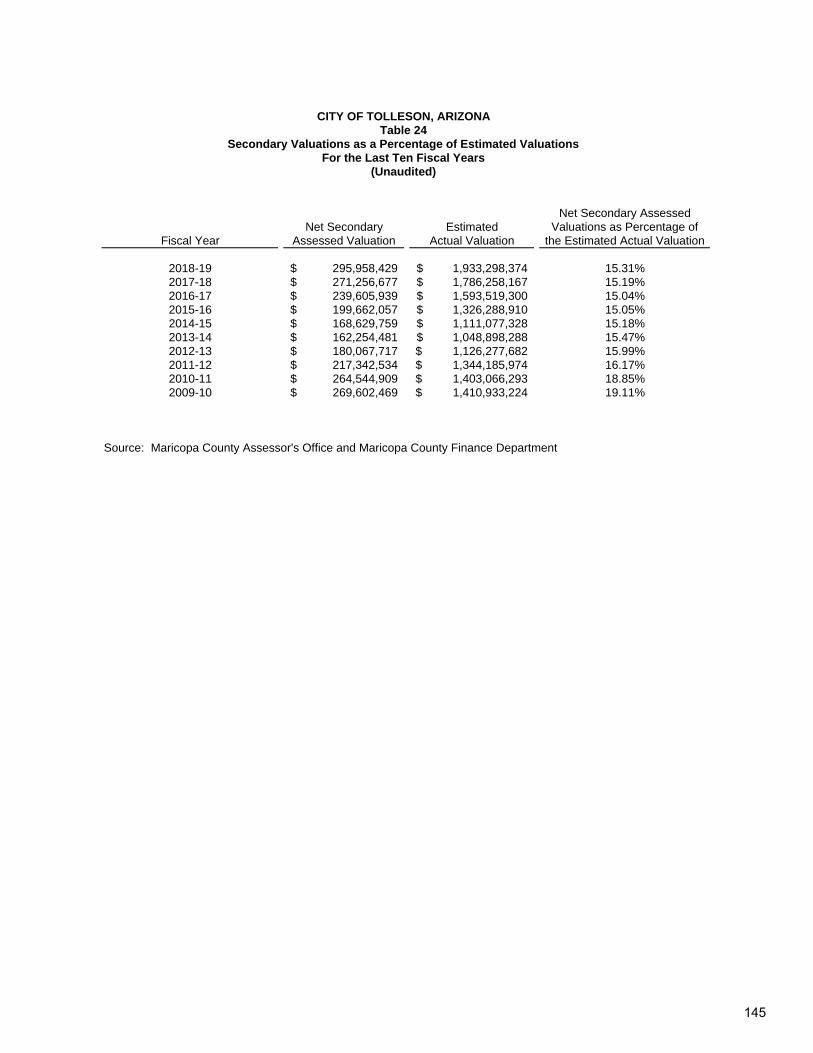
CITY OF TOLLESON, ARIZONATable 24
Secondary Valuations as a Percentage of Estimated ValuationsFor the Last Ten Fiscal Years
(Unaudited)
Net Secondary AssessedNet Secondary Estimated Valuations as Percentage of
Fiscal Year Assessed Valuation Actual Valuation the Estimated Actual Valuation
2018-19 295,958,429$ 1,933,298,374$ 15.31%2017-18 271,256,677$ 1,786,258,167$ 15.19%2016-17 239,605,939$ 1,593,519,300$ 15.04%2015-16 199,662,057$ 1,326,288,910$ 15.05%2014-15 168,629,759$ 1,111,077,328$ 15.18%2013-14 162,254,481$ 1,048,898,288$ 15.47%2012-13 180,067,717$ 1,126,277,682$ 15.99%2011-12 217,342,534$ 1,344,185,974$ 16.17%
2010-11 264,544,909$ 1,403,066,293$ 18.85%2009-10 269,602,469$ 1,410,933,224$ 19.11%
Source: Maricopa County Assessor's Office and Maricopa County Finance Department
145

CITY OF TOLLESON, ARIZONATable 25
Secondary Valuations By Legal ClassAs of June 30, 2018
(Unaudited)
2017-2018 2018-2019Secondary 2018 Secondary 2019
Legal Assessed Percent Assessed PercentClass Description Valuation of Total Valuation of Total
1 Utilities Telecommunication and Commercial and Industrial 239,360,887$ 88.23% 264,311,726$ 89.31%
2 Agricultural and Vacant 13,796,779 5.09% 9,810,497 3.31%3 Residential (Owner occupied) 9,218,283 3.40% 11,867,388 4.01%4 Residential (Rental) 6,615,915 2.44% 8,174,588 2.76%5 Railroad 695,383 0.26% 672,930 0.23%6 Non-commercials 1,569,430 0.58% 1,121,300 0.38%
Total 271,256,677$ 100.00% 295,958,429$ 100.00%
Source: Maricopa County Assessor's Office
146

CITY OF TOLLESON, ARIZONATable 26
Secondary Valuations By Major TaxpayerAs of June 30, 2019
(Unaudited)
Estimated as a PercentEstimated Secondary of the City's
2018-19 2018-19 Net SecondaryTaxpayers Business Assessed Valuation Assessed Valuation
ABS SW Investor Loc (Albertson) Grocery Retailer 9,855,118$ 4.76%Smiths Food & Drugs Grocery Retailer 9,481,137 4.57%FR CAL 3 Tolleson Buckey LLC Indrustrial Property 9,289,004 4.48%BPP Pacific Industrial AZ Reit Owner LLC Indrustrial Property 7,155,222 3.45%SVC Manufacturing INC Food Manufacture 6,922,559 3.34%CAM Investment 338 LLC Indrustrial Property 5,045,579 2.43%Greater Arizona Auto Auctions Inc. Auto auctions 4,705,700 2.27%AZEJM Land Holdings/Oxnard Commerceplex Commercial Property 3,969,968 1.92%Liberty Property LP Real Estate 3,902,105 1.88%First Industrial LP Real Estate 3,214,890 1.55%
Total 63,541,282$ 30.66%
Source: Maricopa County Assessor's Office
147


Compliance Section


INDEPENDENT AUDITOR’S REPORT ON INTERNAL CONTROL OVER FINANCIAL REPORTING AND ON COMPLIANCE AND OTHER MATTERS BASED ON AN AUDIT OF FINANCIAL STATEMENTS
PERFORMED IN ACCORDANCE WITH GOVERNMENT AUDITING STANDARDS
To the Honorable Mayor and City Council City of Tolleson, Arizona
We have audited, in accordance with the auditing standards generally accepted in the United States of America and the standards applicable to financial audits contained in Government Auditing Standards issued by the Comptroller General of the United States, the financial statements of the governmental activities, the business-type activities, each major fund, and the aggregate remaining fund information of the City of Tolleson, Arizona, as of and for the year ended June 30, 2019, and the related notes to the financial statements, which collectively comprise the City of Tolleson, Arizona’s basic financial statements, and have issued our report thereon dated October 23, 2019.
Internal Control over Financial Reporting
In planning and performing our audit of the financial statements, we considered the City of Tolleson, Arizona’s internal control over financial reporting (internal control) to determine the audit procedures that are appropriate in the circumstances for the purpose of expressing our opinions on the financial statements, but not for the purpose of expressing an opinion on the effectiveness of the City of Tolleson, Arizona’s internal control. Accordingly, we do not express an opinion on the effectiveness of the City of Tolleson, Arizona’s internal control.
A deficiency in internal control exists when the design or operation of a control does not allow management or employees, in the normal course of performing their assigned functions, to prevent, or detect and correct, misstatements on a timely basis. A material weakness is a deficiency, or a combination of deficiencies, in internal control such that there is a reasonable possibility that a material misstatement of the entity’s financial statements will not be prevented, or detected and corrected, on a timely basis. A significant deficiency is a deficiency, or a combination of deficiencies, in internal control that is less severe than a material weakness, yet important enough to merit attention by those charged with governance.
Our consideration of internal control was for the limited purpose described in the first paragraph of this section and was not designed to identify all deficiencies in internal control that might be material weaknesses or significant deficiencies and therefore, material weaknesses or significant deficiencies may exist that have not been identified. We did identify a certain deficiency in internal control, described in the accompanying schedule of findings as item 2019-001 that we consider to be a material weakness.
Compliance and Other Matters
As part of obtaining reasonable assurance about whether the City of Tolleson, Arizona’s financial statements are free from material misstatement, we performed tests of its compliance with certain provisions of laws, regulations, contracts, and grant agreements, noncompliance with which could have a direct and material effect on the determination of financial statement amounts. However, providing an opinion on compliance with those provisions was not an objective of our audit, and accordingly, we do not express such an opinion. The results of our tests disclosed no instances of noncompliance or other matters that are required to be reported under Government Auditing Standards.
Tempe • Scottsdale • Casa Grande www.hhcpa.com

City of Tolleson, Arizona’s Response to Finding
City of Tolleson, Arizona’s response to the finding identified in our audit is described in the accompanying Corrective Action Plan. City of Tolleson, Arizona’s response was not subjected to the auditing procedures applied in the audit of the financial statements and, accordingly, we express no opinion on it.
Purpose of this Report
The purpose of this report is solely to describe the scope of our testing of internal control and compliance and the results of that testing, and not to provide an opinion on the effectiveness of the entity’s internal control or on compliance. This report is an integral part of an audit performed in accordance with Government Auditing Standards in considering the entity’s internal control and compliance. Accordingly, this communication is not suitable for any other purpose.
Tempe, Arizona October 23, 2019

CITY OF TOLLESON SCHEDULE OF FINDINGS June 30, 2019
FINDINGS RELATED TO FINANCIAL STATEMENTS REPORTED IN ACCORDANCE WITH GOVERNMENT AUDITING STANDARDS
FINDING: 2019-001: Financial Impact of a Developer Agreement
CRITERIA
Management is responsible for establishing and maintaining internal controls and designating individuals who possess suitable skill, knowledge, and experience to execute these controls and carry out their duties to ensure that all developer agreements are recorded and reported in accordance with generally accepted accounting principles (GAAP).
CONDITION/CONTEXT
Management reviews and evaluates agreements and contracts to determine the proper accounting treatment. However, the review and evaluation for a material developer agreement was not properly completed resulting in a material adjustment necessary to properly reflect the financial statements.
EFFECT
A prior period adjustment was required to properly report the beginning balances for capital assets, long-term liabilities, and net position for the Governmental Activities on the Government-Wide Statements.
CAUSE
The City did not have an effective process in place to capture the financial effects of developer agreements.
RECOMMENDATION
It is recommended that all assets being provided and sold to the City through developer agreements are formally accepted by City Council. We also recommend developer agreements exceeding a predetermined threshold are reviewed and signed as approved by the Chief Financial Officer of the City.
VIEWS OF RESPONSIBLE OFFICIALS AND PLANNED CORRECTIVE ACTION
The City concurs with the finding. See Corrective Action Plan.
153


October 23, 2019
155

156