tolleson elementary school district no. 17
TRANSCRIPT

TOLLESON ELEMENTARY SCHOOL DISTRICT NO. 17
Comprehensive Annual Financial Report
Fiscal Year Ended June 30, 2016
9261 West Van Buren Street ▪ Tolleson, Arizona 85353

TOLLESON ELEMENTARY SCHOOL DISTRICT NO. 17
TOLLESON, ARIZONA
COMPREHENSIVE ANNUAL FINANCIAL REPORT FOR THE FISCAL YEAR ENDED JUNE 30, 2016
Issued by: Business and Finance Department

TOLLESON ELEMENTARY SCHOOL DISTRICT NO. 17
TABLE OF CONTENTS
INTRODUCTORY SECTION Page Letter of Transmittal 1 ASBO Certificate of Excellence 6 GFOA Certificate of Achievement 7 Organizational Chart 8 List of Principal Officials 9 FINANCIAL SECTION INDEPENDENT AUDITOR’S REPORT 13 MANAGEMENT’S DISCUSSION AND ANALYSIS (MD&A) 17 BASIC FINANCIAL STATEMENTS
Government-Wide Financial Statements:
Statement of Net Position 30 Statement of Activities 31
Fund Financial Statements: Balance Sheet - Governmental Funds 34 Reconciliation of the Balance Sheet -
Governmental Funds to the Statement of Net Position 37 Statement of Revenues, Expenditures and Changes in Fund Balances -
Governmental Funds 38 Reconciliation of the Statement of Revenues, Expenditures and
Changes in Fund Balances - Governmental Funds to the Statement of Activities 40
Statement of Net Position – Proprietary Funds 41 Statement of Revenues, Expenses and Changes in Fund Net Position – Proprietary Funds 42

TOLLESON ELEMENTARY SCHOOL DISTRICT NO. 17
TABLE OF CONTENTS
FINANCIAL SECTION Page
BASIC FINANCIAL STATEMENTS
Statement of Cash Flows – Proprietary Funds 43
Statement of Assets and Liabilities – Fiduciary Funds 44
Notes to Financial Statements 45
REQUIRED SUPPLEMENTARY INFORMATION
Schedule of Revenues Expenditures and Changes in Fund Balances – Budget and Actual:
General Fund 68
Classroom Site Fund 69
E-Rate Fund 70
Other Federal Projects Fund 71
Food Service Fund 72
Schedule of Proportionate Share of the Net Pension Liability 73
Schedule of Contributions 73
Notes to Required Supplementary Information 74
COMBINING AND INDIVIDUAL FUND FINANCIAL STATEMENTS AND SCHEDULES
Governmental Funds:
Combining Balance Sheet - All Non-Major Governmental Funds - By Fund Type 78
Combining Statement of Revenues, Expenditures and Changes in Fund Balances - All Non-Major Governmental Funds - By Fund Type 79
Special Revenue Funds:
Combining Balance Sheet 82

TOLLESON ELEMENTARY SCHOOL DISTRICT NO. 17
TABLE OF CONTENTS
FINANCIAL SECTION Page
COMBINING AND INDIVIDUAL FUND FINANCIAL STATEMENTS AND SCHEDULES
Special Revenue Funds:
Combining Statement of Revenues, Expenditures and Changes in Fund Balances 86
Combining Schedule of Revenues, Expenditures and Changes in Fund Balances - Budget and Actual 90
Debt Service Fund:
Schedule of Revenues, Expenditures and Changes in 106 Fund Balance – Budget and Actual
Capital Projects Funds:
Combining Balance Sheet 108
Combining Statement of Revenues, Expenditures and Changes in Fund Balances 110
Combining Schedule of Revenues, Expenditures and Changes in Fund Balances - Budget and Actual 112
Agency Funds:
Combining Statement of Assets and Liabilities 120
Combining Statement of Changes in Assets and Liabilities 122
STATISTICAL SECTION
Financial Trends:
Net Position by Component 124
Expenses, Program Revenues, and Net (Expense)/Revenue 125
General Revenues and Total Changes in Net Position 127

TOLLESON ELEMENTARY SCHOOL DISTRICT NO. 17
TABLE OF CONTENTS
STATISTICAL SECTION Page Fund Balances - Governmental Funds 129 Governmental Funds Revenues 131 Governmental Funds Expenditures and Debt Service Ratio 133 Other Financing Sources and Uses and Net Changes in Fund Balances - Governmental Funds 135
Revenue Capacity:
Net Limited Assessed Value and Full Cash Value of Taxable Property by Class 136 Net Full Cash Assessed Value of Taxable Property by Class 137 Property Tax Assessment Ratios 138 Direct and Overlapping Property Tax Rates 139 Principal Property Taxpayers 140 Property Tax Levies and Collections 141
Debt Capacity:
Outstanding Debt by Type 142 Direct and Overlapping Governmental Activities Debt 143 Direct and Overlapping General Bonded Debt Ratios 143 Legal Debt Margin Information 144
Demographic and Economic Information:
County-Wide Demographic and Economic Statistics 145 Principal Employers 146

TOLLESON ELEMENTARY SCHOOL DISTRICT NO. 17
TABLE OF CONTENTS
STATISTICAL SECTION Page
Operating Information:
Full-Time Equivalent District Employees by Type 147
Operating Statistics 149
Capital Assets Information 150

INTRODUCTORY SECTION

(This page intentionally left blank)

December 12, 2016
Citizens and Governing Board Tolleson Elementary School District No. 17 9261 West Van Buren Street Tolleson, Arizona 85353
State law mandates that school districts required to undergo an annual single audit publish a complete set of financial statements presented in conformity with accounting principles generally accepted in the United States of America and audited in accordance with auditing standards generally accepted in the United States by a certified public accounting firm licensed in the State of Arizona. Pursuant to that requirement, we hereby issue the comprehensive annual financial report of the Tolleson Elementary School District No. 17 (District) for the fiscal year ended June 30, 2016.
This report consists of management’s representations concerning the finances of the District. Consequently, management assumes full responsibility for the completeness and reliability of all of the information presented in this report. To provide a reasonable basis for making these representations, management of the District has established a comprehensive internal control framework that is designed both to protect the District’s assets from loss, theft, or misuse and to compile sufficient reliable information for the preparation of the District’s financial statements in conformity with accounting principles generally accepted in the United States of America. Because the cost of internal controls should not outweigh their benefits, the District’s comprehensive framework of internal controls has been designed to provide reasonable rather than absolute assurance that the financial statements will be free of material misstatement. As management, we assert that, to the best of our knowledge and belief, this financial report is complete and reliable in all material respects.
The District’s financial statements have been audited by Heinfeld, Meech & Co., P.C., a certified public accounting firm. The goal of the independent audit was to provide reasonable assurance that the financial statements of the District for the fiscal year ended June 30, 2016, are free of material misstatement. The independent audit involved examining, on a test basis, evidence supporting the amounts and disclosures in the financial statements; assessing the accounting principles used and significant estimates made by management; and evaluating the overall financial statement presentation. The independent auditors concluded, based upon the audit, that there was a reasonable basis for rendering an unmodified opinion that the District’s financial statements for the fiscal year ended June 30, 2016, are fairly presented in conformity with accounting principles generally accepted in the United States of America. The independent auditor’s report is presented as the first component of the financial section of this report.
Page 1

The independent audit of the financial statements of the District was part of a broader, federally mandated Single Audit as required by the provisions of the Single Audit Act Amendments of 1996 and Title 2 U.S. Code of Federal Regulations Part 200, Uniform Administrative Requirements, Cost Principles, and Audit Requirements for Federal Awards (Uniform Guidance). The standards governing Single Audit engagements require the independent auditor to report not only on the fair presentation of the financial statements, but also on the District’s internal controls and compliance with legal requirements, with special emphasis on internal controls and legal requirements involving the administration of federal awards. These reports are available in a separately issued Single Audit Reporting Package.
Accounting principles generally accepted in the United States of America require that management provide a narrative introduction, overview, and analysis to accompany the basic financial statements in the form of Management’s Discussion and Analysis (MD&A). This letter of transmittal is designed to complement the MD&A and should be read in conjunction with it. The District’s MD&A can be found immediately following the report of the independent auditors.
PROFILE OF THE DISTRICT
The District is one of 58 public school districts located in Maricopa County, Arizona. It provides a program of public education from kindergarten through grade 8, with a fiscal year 2014-15 average daily membership of 2,804. The projected enrollment for fiscal year 2016-17 is 2,967 students.
The District’s Governing Board is organized under Section 15-321 of the Arizona Revised Statutes (A.R.S.). Management of the District is independent of other state or local governments. The County Treasurer collects taxes for the District, but exercises no control over its expenditures/expenses.
The membership of the Governing Board consists of five members elected by the public. Under existing statutes, the Governing Board’s duties and powers include, but are not limited to, the acquisition, maintenance and disposition of school property; the development and adoption of a school program; and the establishment, organization and operation of schools. The Board also has broad financial responsibilities, including the approval of the annual budget, and the establishment of a system of accounting and budgetary controls.
The financial reporting entity consists of a primary government and its component units. A component unit is a legally separate entity that must be included in the reporting entity in conformity with generally accepted accounting principles. The District is a primary government because it is a special-purpose government that has a separately elected governing body, is legally separate, and is fiscally independent of other state or local governments. Furthermore, there are no component units combined with the District for financial statement presentation purposes, and the District is not included in any other governmental reporting entity. Consequently, the District’s financial statements include only the funds of those organizational entities for which its elected governing board is financially accountable. The District’s major operations include education, student transportation, construction and maintenance of District facilities and food services.
Page 2
The Tolleson Elementary School District No. 17 is located 10 miles west of downtown Phoenix. The City of Tolleson, a portion of southwest Phoenix and the northeast section of the City of Avondale are included within the area served by the District. The District encompasses an area of approximately 6.25 square miles. The annual expenditure budget serves as the foundation for the District’s financial planning and control. The objective of these budgetary controls is to ensure compliance with legal provisions embodied in the annual expenditure budget approved by the District’s Governing Board. The expenditure budget is prepared by fund for all Governmental Funds, and includes function and object code detail for the General Fund and some Special Revenue and Capital Projects Funds. The legal level of budgetary control (that is, the level at which expenditures cannot exceed the appropriated amount) is established at the individual fund level for all funds. Funds that are not required to legally adopt a budget may have over expenditures of budgeted funds. The budget for these funds is simply an estimate and does not prevent the District from exceeding the budget as long as the necessary revenue is earned. The District is not required to prepare an annual budget of revenue, therefore a deficit budgeted fund balance may be presented. However, this does not affect the District’s ability to expend monies. FACTORS AFFECTING FINANCIAL CONDITION The information presented in the financial statements is perhaps best understood when it is considered from the broader perspective of the specific environment within which the District operates. Local Economy. The economy of the cities of Tolleson and Avondale and of Maricopa County, in general, is a mixture of farming, commercial enterprises, light manufacturing and food processing. The largest employers in the Tolleson area are JBS USA, SYSCO Food Service, Frys/Kroger, Greater Auto Auction and Rousseau Farming. In recent years, the City of Tolleson has been successful in attracting businesses to locate their warehouse facilities in the City due to the freeway, railroad and airline accessibility. This has been and will continue to be a positive contributing factor to the District’s potential economic growth for many years to come. However, with the economic downturn, the District’s assessed valuation has dropped considerably. A few of the major firms represented in the Phoenix metropolitan area include Honeywell International, Inc., Banner Health Systems, Wal-Mart Stores, Inc., Wells Fargo Company, Bank of America, Raytheon Corporation and Apollo Group, Inc.. In addition, the metropolitan area provides excellent educational and training opportunities through seven community colleges, four private colleges and graduate schools, and one state university.
Page 3

Maricopa County is located in the south-central portion of Arizona and encompasses an area of approximately 9,226 square miles. Its boundaries encompass the cities of Phoenix, Scottsdale, Mesa, Tempe, Glendale, Chandler, and such towns as Gilbert, Paradise Valley and Fountain Hills. Maricopa County is currently the nation’s fourth largest county in terms of population size and the 14th in land area. The County’s 2014 population was estimated at 4.0 million and despite the current economic woes is still expected to reach 6 million by 2030. Maricopa County continues to have a very wide range of economic sectors supporting its potential growth and recovery. Maricopa County has, for some time, enjoyed an unemployment rate that was somewhat lower than the national average, however, the current rate of unemployment hovers around 5.9 percent. Service is the largest employment sector in the County, partly fueled by the tourism industry. The County has excellent accommodations, diverse cultural and recreational activities, and a favorable climate attracting millions to the area annually. Wholesale and retail trade is the second largest employment category. Long-term Financial Planning. In November 2006 the District’s voters approved $22.1 million in general obligation bonds. As of June 30, 2015, the Bond Building Fund had $169,516 in fund balance which is expected to be utilized during the next fiscal year. The average age of District school buildings is 16 years. In November of 2012, the District’s voters approved a seven year $750,000 per year capital override. The funds will be used to provide 21st Century classroom technology, paint and refurbish schools, purchase transportation equipment and to provide instructional materials. AWARDS AND ACKNOWLEDGMENTS Awards. The Association of School Business Officials (ASBO) awarded a Certificate of Excellence in Financial Reporting to the District for its comprehensive annual financial report for the fiscal year ended June 30, 2015. This was the 19th consecutive year that the District has received this prestigious award. In addition, the Government Finance Officers Association (GFOA) awarded a Certificate of Achievement for Excellence in Financial Reporting to the District for its comprehensive annual financial report for the fiscal year ended June 30, 2015. In order to be awarded these certificates, the District published an easily readable and efficiently organized comprehensive annual financial report. This report satisfied both accounting principles generally accepted in the United States of America and applicable legal requirements. These certificates are valid for a period of one year only. We believe that our current comprehensive annual financial report continues to meet the programs’ requirements and we are submitting it to ASBO and GFOA to determine its eligibility for the fiscal year ended June 30, 2016 certificates.
Page 4
Acknowledgments. The preparation of the comprehensive annual financial report on a timely basis was made possible by the dedicated service of the entire staff of the business and finance department. Each member of the department has our sincere appreciation for the contributions made in the preparation of this report. In closing, without the leadership and support of the Governing Board of the District, preparation of this report would not have been possible. Respectfully submitted,
Dr. Lupita Hightower James S. Serbin, CPA Superintendent Executive Director of Business Services
Page 5

Page 6

Page 7

Page 8
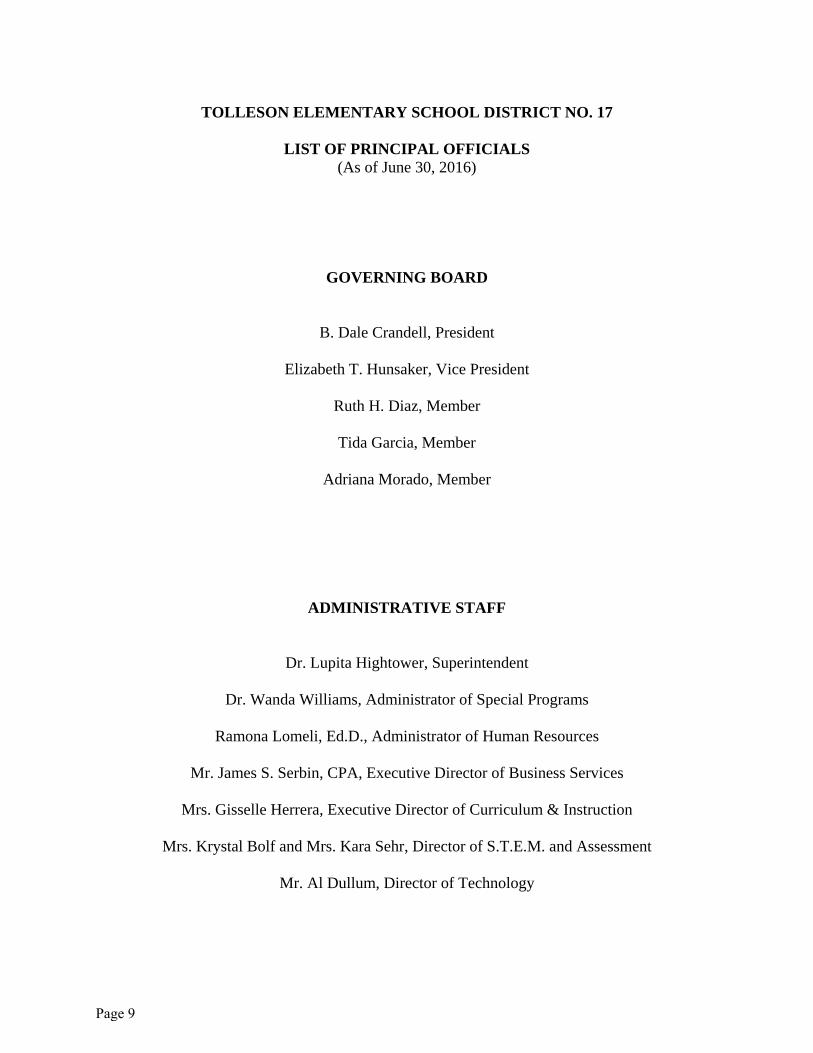
TOLLESON ELEMENTARY SCHOOL DISTRICT NO. 17
LIST OF PRINCIPAL OFFICIALS (As of June 30, 2016)
GOVERNING BOARD
B. Dale Crandell, President
Elizabeth T. Hunsaker, Vice President
Ruth H. Diaz, Member
Tida Garcia, Member
Adriana Morado, Member
ADMINISTRATIVE STAFF
Dr. Lupita Hightower, Superintendent
Dr. Wanda Williams, Administrator of Special Programs
Ramona Lomeli, Ed.D., Administrator of Human Resources
Mr. James S. Serbin, CPA, Executive Director of Business Services
Mrs. Gisselle Herrera, Executive Director of Curriculum & Instruction
Mrs. Krystal Bolf and Mrs. Kara Sehr, Director of S.T.E.M. and Assessment
Mr. Al Dullum, Director of Technology
Page 9

(This page intentionally left blank)
Page 10

FINANCIAL SECTION
Page 11

(This page intentionally left blank)
Page 12

INDEPENDENT AUDITOR’S REPORT Governing Board Tolleson Elementary School District No. 17 Report on the Financial Statements We have audited the accompanying financial statements of the governmental activities, each major fund, and the aggregate remaining fund information of Tolleson Elementary School District No. 17 (District), as of and for the year ended June 30, 2016, and the related notes to the financial statements, which collectively comprise the District’s basic financial statements as listed in the table of contents. Management’s Responsibility for the Financial Statements Management is responsible for the preparation and fair presentation of these financial statements in accordance with accounting principles generally accepted in the United States of America; this includes the design, implementation, and maintenance of internal control relevant to the preparation and fair presentation of financial statements that are free from material misstatement, whether due to fraud or error. Auditor’s Responsibility Our responsibility is to express opinions on these financial statements based on our audit. We conducted our audit in accordance with auditing standards generally accepted in the United States of America and the standards applicable to financial audits contained in Government Auditing Standards, issued by the Comptroller General of the United States. Those standards require that we plan and perform the audit to obtain reasonable assurance about whether the financial statements are free from material misstatement. An audit involves performing procedures to obtain audit evidence about the amounts and disclosures in the financial statements. The procedures selected depend on the auditor’s judgment, including the assessment of the risks of material misstatement of the financial statements, whether due to fraud or error. In making those risk assessments, the auditor considers internal control relevant to the entity’s preparation and fair presentation of the financial statements in order to design audit procedures that are appropriate in the circumstances, but not for the purpose of expressing an opinion on the effectiveness of the entity’s internal control. Accordingly, we express no such opinion. An audit also includes evaluating the appropriateness of accounting policies used and the reasonableness of significant accounting estimates made by management, as well as evaluating the overall presentation of the financial statements. We believe that the audit evidence we have obtained is sufficient and appropriate to provide a basis for our audit opinions. Opinions In our opinion, the financial statements referred to above present fairly, in all material respects, the respective financial position of the governmental activities, each major fund, and the aggregate remaining fund information of the Tolleson Elementary School District No. 17, as of June 30, 2016, and the respective changes in financial position and, where applicable, cash flows thereof for the year then ended in accordance with accounting principles generally accepted in the United States of America. Change in Accounting Principle As described in Note 1, the District implemented the provisions of the Governmental Accounting Standards Board (GASB) Statement No. 72, Fair Value Measurement and Application, for the year ended June 30, 2016, which represents a change in accounting principle. Our opinion is not modified with respect to this matter.
Page 13

Other Matters Required Supplementary Information Accounting principles generally accepted in the United States of America require that the Management’s Discussion and Analysis, budgetary comparison information, and net pension liability information, as listed in the table of contents, be presented to supplement the basic financial statements. Such information, although not a part of the basic financial statements, is required by the Governmental Accounting Standards Board, who considers it to be an essential part of financial reporting for placing the basic financial statements in an appropriate operational, economic, or historical context. We have applied certain limited procedures to the required supplementary information in accordance with auditing standards generally accepted in the United States of America, which consisted of inquiries of management about the methods of preparing the information and comparing the information for consistency with management’s responses to our inquiries, the basic financial statements, and other knowledge we obtained during our audit of the basic financial statements. We do not express an opinion or provide any assurance on the information because the limited procedures do not provide us with sufficient evidence to express an opinion or provide any assurance.
Other Information Our audit was conducted for the purpose of forming opinions on the financial statements that collectively comprise the District’s basic financial statements. The Introductory Section, Combining and Individual Fund Financial Statements and Schedules, and Statistical Section are presented for purposes of additional analysis and are not a required part of the basic financial statements.
The Combining and Individual Fund Financial Statements and Schedules are the responsibility of management and were derived from and relate directly to the underlying accounting and other records used to prepare the basic financial statements. Such information has been subjected to the auditing procedures applied in the audit of the basic financial statements and certain additional procedures, including comparing and reconciling such information directly to the underlying accounting and other records used to prepare the basic financial statements or to the basic financial statements themselves, and other additional procedures in accordance with auditing standards generally accepted in the United States of America. In our opinion, the Combining and Individual Fund Financial Statements and Schedules information is fairly stated in all material respects in relation to the basic financial statements as a whole.
The Introductory Section and Statistical Section have not been subjected to the auditing procedures applied in the audit of the basic financial statements and, accordingly, we do not express an opinion or provide any assurance on them.
Other Reporting Required by Government Auditing Standards In accordance with Government Auditing Standards, we have also issued our report dated December 12, 2016, on our consideration of Tolleson Elementary School District No. 17’s internal control over financial reporting and on our tests of its compliance with certain provisions of laws, regulations, contracts, and grant agreements and other matters. The purpose of that report is to describe the scope of our testing of internal control over financial reporting and compliance and the results of that testing, and not to provide an opinion on the internal control over financial reporting or on compliance. That report is an integral part of an audit performed in accordance with Government Auditing Standards in considering Tolleson Elementary School District No. 17’s internal control over financial reporting and compliance.
Heinfeld, Meech & Co., P.C. Phoenix, Arizona December 12, 2016
Page 14

MANAGEMENT’S DISCUSSION AND ANALYSIS (MD&A) (Required Supplementary Information)
Page 15

(This page intentionally left blank)
Page 16
TOLLESON ELEMENTARY SCHOOL DISTRICT NO. 17 MANAGEMENT’S DISCUSSION AND ANALYSIS (MD&A)
YEAR ENDED JUNE 30, 2016
As management of the Tolleson Elementary School District No. 17 (District), we offer readers of the District’s financial statements this narrative overview and analysis of the financial activities of the District for the fiscal year ended June 30, 2016. The management’s discussion and analysis is presented as required supplementary information to supplement the basic financial statements. We encourage readers to consider the information presented here in conjunction with additional information that we have furnished in our letter of transmittal, which can be found in the introductory section of this report. FINANCIAL HIGHLIGHTS
The District’s total net position of governmental activities increased $1.4 million which
represents a four percent increase from the prior fiscal year primarily due to an increase in state aid, property tax revenues, and capital grants and contributions for a future E-rate project.
General revenues accounted for $19.4 million in revenue, or 74 percent of all current
fiscal year revenues. Program specific revenues in the form of charges for services and grants and contributions accounted for $6.7 million or 26 percent of total current fiscal year revenues.
The District had approximately $24.8 million in expenses related to governmental
activities, an increase of four percent from the prior fiscal year primarily due to costs related to student growth.
Among major funds, the General Fund had $16.1 million in current fiscal year revenues,
which primarily consisted of state aid and property taxes, and $15.6 million in expenditures. The General Fund’s fund balance increased from $3.0 million at the prior fiscal year end to $3.3 million at the end of the current fiscal year primarily due to an increase in property tax revenues and state aid.
Net position for the Internal Service Fund increased $381,614 from the prior fiscal year. Operating revenues of $1.7 million exceeded operating expenses of $1.3 million at the end of the current fiscal year.
OVERVIEW OF FINANCIAL STATEMENTS This discussion and analysis are intended to serve as an introduction to the District’s basic financial statements. The District’s basic financial statements comprise three components: 1) government-wide financial statements, 2) fund financial statements, and 3) notes to the financial statements. This report also contains other supplementary information in addition to the basic financial statements themselves.
Page 17

TOLLESON ELEMENTARY SCHOOL DISTRICT NO. 17 MANAGEMENT’S DISCUSSION AND ANALYSIS (MD&A)
YEAR ENDED JUNE 30, 2016
OVERVIEW OF FINANCIAL STATEMENTS Government-wide financial statements. The government-wide financial statements are designed to provide readers with a broad overview of the District’s finances, in a manner similar to a private-sector business. The accrual basis of accounting is used for the government-wide financial statements. The statement of net position presents information on all of the District’s assets, liabilities, and deferred inflows/outflows of resources with the difference reported as net position. Over time, increases or decreases in net position may serve as a useful indicator of whether the financial position of the District is improving or deteriorating. The statement of activities presents information showing how the District’s net position changed during the most recent fiscal year. All changes in net position are reported as soon as the underlying event giving rise to the change occurs, regardless of the timing of related cash flows. Thus, revenues and expenses are reported in this statement for some items that will only result in cash flows in future fiscal periods (e.g., uncollected taxes and earned but unused compensated absences). The government-wide financial statements outline functions of the District that are principally supported by property taxes and intergovernmental revenues. The governmental activities of the District include instruction, support services, operation and maintenance of plant services, student transportation services, operation of non-instructional services, and interest on long-term debt. Fund financial statements. A fund is a grouping of related accounts that is used to maintain control over resources that have been segregated for specific activities or objectives. The District uses fund accounting to ensure and demonstrate compliance with finance-related legal requirements. All of the funds of the District can be divided into three categories: governmental funds, proprietary funds, and fiduciary funds.
Governmental funds. Governmental funds are used to account for essentially the same functions reported as governmental activities in the government-wide financial statements. However, unlike the government-wide financial statements, governmental fund financial statements use the modified accrual basis of accounting and focus on near-term inflows of spendable resources, as well as on balances of spendable resources available at the end of the fiscal year. Such information may be useful in evaluating the District’s near-term financing requirements.
Page 18

TOLLESON ELEMENTARY SCHOOL DISTRICT NO. 17 MANAGEMENT’S DISCUSSION AND ANALYSIS (MD&A)
YEAR ENDED JUNE 30, 2016
OVERVIEW OF FINANCIAL STATEMENTS
Because the focus of governmental funds is narrower than that of the government-wide financial statements, it is useful to compare the information presented for governmental funds with similar information presented for governmental activities in the government-wide financial statements. By doing so, readers may better understand the long-term impact of the District’s near-term financing decision. Both the governmental fund balance sheet and the governmental fund statement of revenues, expenditures and changes in fund balances provide a reconciliation to facilitate this comparison between governmental funds and governmental activities. Information is presented separately in the governmental fund balance sheet and in the governmental fund statement of revenues, expenditures and changes in fund balances for the General, Classroom Site, E-Rate, Other Federal Projects, Food Service, and Debt Service Funds, all of which are considered to be major funds. Data from the other governmental funds are combined into a single, aggregated presentation. Individual fund data for each of these non-major governmental funds is provided in the form of combining statements and schedules. Proprietary funds. The District maintains one type of proprietary fund. The internal service fund is an accounting device used to accumulate and allocate costs internally among the District’s various functions. The District uses its internal service fund to account for its employee benefit fund. Because this service predominantly benefits governmental functions, it has been included within governmental activities in the government-wide financial statements. Fiduciary funds. Fiduciary funds are used to account for resources held for the benefit of parties outside the District. Fiduciary funds are not reflected in the government-wide financial statements because the resources of those funds are not available to support the District’s own programs. Due to their custodial nature, fiduciary funds do not have a measurement focus.
Notes to the financial statements. The notes provide additional information that is essential to a full understanding of the data provided in the government-wide and fund financial statements. The notes to the financial statements can be found immediately following the basic financial statements. Other information. In addition to the basic financial statements and accompanying notes, this report also presents certain required supplementary information concerning the District’s budget process and pension plan. The District adopts an annual expenditure budget for all governmental funds. A schedule of revenues, expenditures and changes in fund balances - budget and actual has been provided for the General Fund and Major Special Revenue Funds as required supplementary information. Schedules for the pension plan have been provided as required supplementary information.
Page 19

TOLLESON ELEMENTARY SCHOOL DISTRICT NO. 17 MANAGEMENT’S DISCUSSION AND ANALYSIS (MD&A)
YEAR ENDED JUNE 30, 2016
GOVERNMENT-WIDE FINANCIAL ANALYSIS Net position may serve over time as a useful indicator of a government’s financial position. In the case of the District, assets exceeded liabilities by $38.1 million at the current fiscal year end. The largest portion of the District’s net position reflects its investment in capital assets (e.g., land and improvements, buildings and improvements, vehicles, furniture and equipment and construction in progress), less any related outstanding debt used to acquire those assets. The District uses these capital assets to provide services to its students; consequently, these assets are not available for future spending. Although the District’s investment in its capital assets is reported net of related debt, it should be noted that the resources needed to repay this debt must be provided from other sources, since the capital assets themselves cannot be used to liquidate these liabilities. In addition, a portion of the District’s net position represents resources that are subject to external restrictions on how they may be used. The following table presents a summary of the District’s net position for the fiscal years ended June 30, 2016 and June 30, 2015.
As of
June 30, 2016 As of
June 30, 2015 Current and other assets $ 13,491,208 $ 10,834,642 Capital assets, net 53,271,124 53,867,125
Total assets 66,762,332 64,701,767
Deferred outflows 2,759,482 2,314,668
Current and other liabilities 803,119 1,354,462 Long-term liabilities 28,873,492 27,705,012
Total liabilities 29,676,611 29,059,474
Deferred inflows 1,732,002 3,227,158
Net position: Net investment in capital assets 45,544,136 45,246,641 Restricted 5,781,261 5,232,083 Unrestricted (13,212,196) (15,748,921)
Total net position $ 38,113,201 $ 34,729,803 At the end of the current fiscal year, the District reported positive balances in two categories of net position while unrestricted net position reported a deficit of $13.2 million. The deficit is due to the District’s proportionate share of the state pension plan’s unfunded liability. The same situation held true for the prior fiscal year.
Page 20

TOLLESON ELEMENTARY SCHOOL DISTRICT NO. 17 MANAGEMENT’S DISCUSSION AND ANALYSIS (MD&A)
YEAR ENDED JUNE 30, 2016
GOVERNMENT-WIDE FINANCIAL ANALYSIS The District’s financial position is the product of several financial transactions including the net results of activities, the acquisition and payment of debt, the acquisition and disposal of capital assets, and the depreciation of capital assets. The following are significant current year transactions that had an impact on the Statement of Net Position.
The increase in prepaids by $1.0 million for health benefits. The principal retirement of $960,000 of school improvement bonds. The increase of $2.1 million in pension liabilities.
Changes in net position. The District’s total revenues for the current fiscal year were $26.2 million. The total cost of all programs and services was $24.8 million. The following table presents a summary of the changes in net position for the fiscal years ended June 30, 2016 and June 30, 2015.
Fiscal Year Ended June 30, 2016
Fiscal Year Ended June 30, 2015
Revenues: Program revenues: Charges for services $ 492,302 $ 425,547 Operating grants and contributions 5,293,621 5,243,843 Capital grants and contributions 947,506 274,952
General revenues: Property taxes 7,102,925 6,659,941 Investment income 33,787 29,948 Unrestricted county aid 1,065,587 980,201 Unrestricted state aid 11,171,443 10,282,770 Unrestricted federal aid 58,536 60,202 Total revenues 26,165,707 23,957,404
Expenses: Instruction 13,044,242 12,211,924 Support services – students and staff 3,273,374 3,284,905 Support services – administration 2,947,487 2,753,821 Operation and maintenance of plant services 2,427,054 2,550,585 Student transportation services 681,123 581,706 Operation of non-instructional services 2,064,539 2,102,998 Interest on long-term debt 333,032 373,458
Total expenses 24,770,851 23,859,397 Changes in net position 1,394,856 98,007
Net position, beginning 34,729,803 34,631,796 Net effect of prior period adjustments 1,988,542 Net position beginning restated 36,718,345 Net position, ending $ 38,113,201 $ 34,729,803
Page 21

TOLLESON ELEMENTARY SCHOOL DISTRICT NO. 17 MANAGEMENT’S DISCUSSION AND ANALYSIS (MD&A)
YEAR ENDED JUNE 30, 2016
GOVERNMENT-WIDE FINANCIAL ANALYSIS
The following are significant current year transactions that had an impact on the change in net position.
An increase of $672,554 in capital grants and contributions due to an increase in approved E-rate funding for school site technology upgrades.
An increase of $442,984 in property tax revenue due to an increase in tax rates.
An increase in unrestricted state aid of $888,673 due to an increase in enrollment and an increase in the base support level.
An increase in instruction expense by $832,318 primarily due to an increase in enrollment.
The following table presents the cost of the District’s major functional activities. The table also shows each function’s net cost (total cost less charges for services generated by the activities and intergovernmental aid provided for specific programs). The net cost shows the financial burden that was placed on the state and District’s taxpayers by each of these functions.
$0
$2
$4
$6
$8
$10
$12
$14
Mil
lion
sExpenses
FY2015-16
FY2014-15
Page 22

TOLLESON ELEMENTARY SCHOOL DISTRICT NO. 17 MANAGEMENT’S DISCUSSION AND ANALYSIS (MD&A)
YEAR ENDED JUNE 30, 2016
GOVERNMENT-WIDE FINANCIAL ANALYSIS
Year Ended June 30, 2016 Year Ended June 30, 2015 Total
Expenses Net (Expense)/
Revenue Total
Expenses Net (Expense)/
Revenue Instruction $ 13,044,242 $ (10,050,649) $ 12,211,924 $ (9,547,555)Support services – students and staff 3,273,374 (2,517,627) 3,284,905 (2,702,824)Support services – administration 2,947,487 (2,806,772) 2,753,821 (2,753,821)Operation and maintenance of plant services 2,427,054 (2,255,725) 2,550,585 (2,289,153)Student transportation services 681,123 (669,755) 581,706 (581,706)Operation of non-instructional services 2,064,539 596,138 2,102,998 333,462 Interest on long-term debt 333,032 (333,032) 373,458 (373,458)
Total $ 24,770,851 $ (18,037,422) $ 23,859,397 $ (17,915,055)
The cost of all governmental activities this year was $24.8 million. Federal and state governments and charges for services subsidized certain programs with
grants and contributions and other local revenues of $6.7 million.
Net cost of governmental activities of $18.0 million was financed by general revenues, which are made up of primarily property taxes of $7.1 million and state aid of $11.2 million.
FINANCIAL ANALYSIS OF THE DISTRICT’S FUNDS As noted earlier, the District uses fund accounting to ensure and demonstrate compliance with finance-related legal requirements. Governmental funds. The focus of the District’s governmental funds is to provide information on near-term inflows, outflows, and balances of spendable resources. Such information is useful in assessing the District’s financing requirements. In particular, unassigned fund balance may serve as a useful measure of the District’s net resources available for spending at the end of the fiscal year. The financial performance of the District as a whole is reflected in its governmental funds. As the District completed the year, its governmental funds reported a combined fund balance of $8.8 million, an increase of $817,768 due primarily to an increase in property tax revenues and state aid.
Page 23

TOLLESON ELEMENTARY SCHOOL DISTRICT NO. 17 MANAGEMENT’S DISCUSSION AND ANALYSIS (MD&A)
YEAR ENDED JUNE 30, 2016
FINANCIAL ANALYSIS OF THE DISTRICT’S FUNDS The General fund comprises 38 percent of the total fund balance of which all is unassigned. The General Fund is the principal operating fund of the District. The fund balance increased $329,400 in the General Fund to $3.3 million as of fiscal year end as a result of increased property tax revenues and state aid. General Fund revenues increased $1.8 million as a result of an increase in students and an increase in the property tax rates. General Fund expenditures increased $255,505. The fund balance of the Classroom Site Fund increased by $351,979 due to revenues exceeding expenditures. The fund balance in the E-Rate Fund increased $240,843 due to the timing of the receipt of funding. The fund balance of the Food Service Fund increased $393,305 due to additional federal revenue. The fund balance of the Debt Service Fund increased by $58,499 primarily due to an increase in property tax revenues. Proprietary Fund. Unrestricted net position of the Internal Service Fund at the end of the fiscal year amounted to $2.4 million. The increase of $381,614 from the prior fiscal year was primarily due to an increase in contributions during the year. BUDGETARY HIGHLIGHTS Over the course of the year, the District revised the General Fund annual expenditure budget for changes in student population. The difference between the original budget and the final amended budget was a $496,631 increase, or three percent due to voters approving Proposition 123. Significant variances for the final amended budget and actual revenues resulted from the District not being required by the State of Arizona to prepare a revenue budget. A schedule showing the original and final budget amounts compared to the District’s actual financial activity for the General Fund is provided in this report as required supplementary information. The significant expenditure variance is summarized as follows.
The favorable variance of $567,436 in instruction expenditures was a result of voters approving Proposition 123.
Page 24
TOLLESON ELEMENTARY SCHOOL DISTRICT NO. 17 MANAGEMENT’S DISCUSSION AND ANALYSIS (MD&A)
YEAR ENDED JUNE 30, 2016
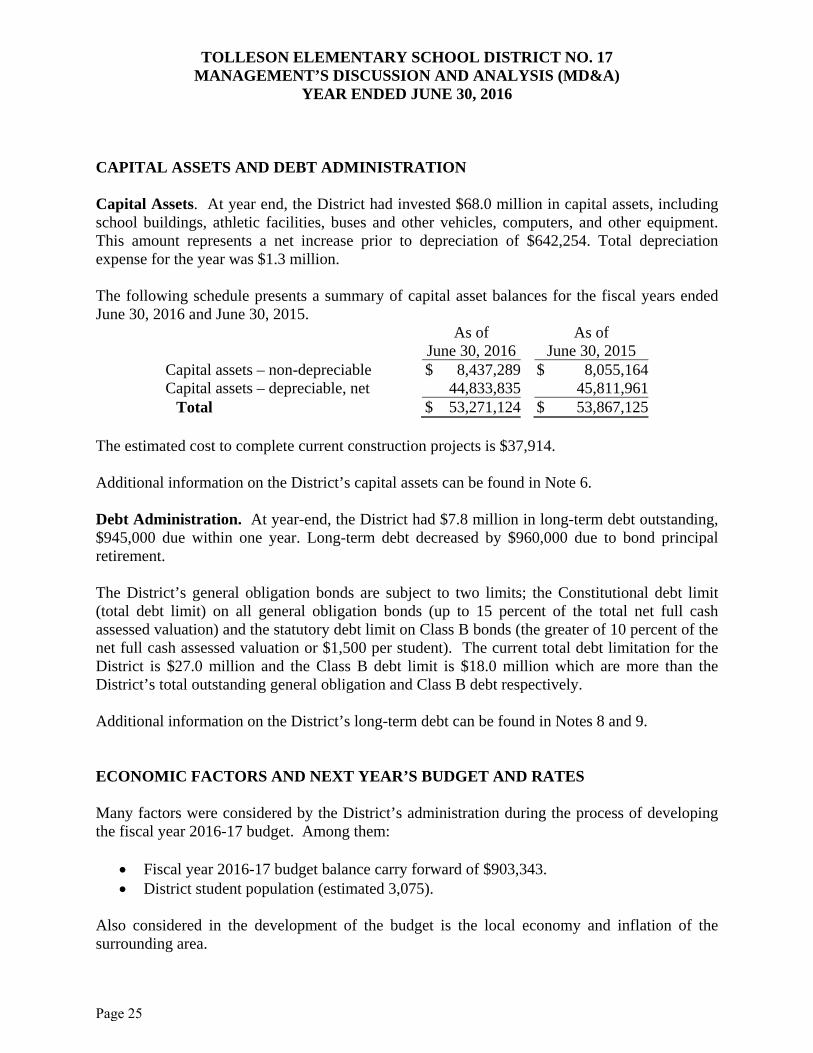
CAPITAL ASSETS AND DEBT ADMINISTRATION Capital Assets. At year end, the District had invested $68.0 million in capital assets, including school buildings, athletic facilities, buses and other vehicles, computers, and other equipment. This amount represents a net increase prior to depreciation of $642,254. Total depreciation expense for the year was $1.3 million. The following schedule presents a summary of capital asset balances for the fiscal years ended June 30, 2016 and June 30, 2015.
As of June 30, 2016
As of June 30, 2015
Capital assets – non-depreciable $ 8,437,289 $ 8,055,164 Capital assets – depreciable, net 44,833,835 45,811,961
Total $ 53,271,124 $ 53,867,125 The estimated cost to complete current construction projects is $37,914. Additional information on the District’s capital assets can be found in Note 6. Debt Administration. At year-end, the District had $7.8 million in long-term debt outstanding, $945,000 due within one year. Long-term debt decreased by $960,000 due to bond principal retirement. The District’s general obligation bonds are subject to two limits; the Constitutional debt limit (total debt limit) on all general obligation bonds (up to 15 percent of the total net full cash assessed valuation) and the statutory debt limit on Class B bonds (the greater of 10 percent of the net full cash assessed valuation or $1,500 per student). The current total debt limitation for the District is $27.0 million and the Class B debt limit is $18.0 million which are more than the District’s total outstanding general obligation and Class B debt respectively. Additional information on the District’s long-term debt can be found in Notes 8 and 9. ECONOMIC FACTORS AND NEXT YEAR’S BUDGET AND RATES Many factors were considered by the District’s administration during the process of developing the fiscal year 2016-17 budget. Among them:
Fiscal year 2016-17 budget balance carry forward of $903,343. District student population (estimated 3,075).
Also considered in the development of the budget is the local economy and inflation of the surrounding area.
Page 25
TOLLESON ELEMENTARY SCHOOL DISTRICT NO. 17 MANAGEMENT’S DISCUSSION AND ANALYSIS (MD&A)
YEAR ENDED JUNE 30, 2016
ECONOMIC FACTORS AND NEXT YEAR’S BUDGET AND RATES Budgeted expenditures in the General Fund increased two percent to $16.5 million in fiscal year 2016-17. State aid and property taxes are expected to be the primary funding sources. No new programs were added to the 2016-17 budget. CONTACTING THE DISTRICT’S FINANCIAL MANAGEMENT This financial report is designed to provide our citizens, taxpayers, and investors and creditors with a general overview of the District’s finances and to demonstrate the District’s accountability for the resources it receives. If you have questions about this report or need additional information, contact the Business and Finance Department, Tolleson Elementary School District No. 17, 9261 West Van Buren Street, Tolleson, Arizona 85353.
Page 26

BASIC FINANCIAL STATEMENTS
Page 27

(This page intentionally left blank)
Page 28

GOVERNMENT-WIDE FINANCIAL STATEMENTS
Page 29
ASSETSCurrent assets:
Cash and investmentsProperty taxes receivableAccounts receivableDue from governmental entitiesPrepaid items
Total current assets
Noncurrent assets:Capital assets not being depreciatedCapital assets, net of accumulated depreciation
Total noncurrent assetsTotal assets
DEFERRED OUTFLOWS OF RESOURCESPension plan items
LIABILITIESCurrent liabilities:
Accounts payableConstruction contracts payableAccrued payroll and employee benefitsCompensated absences payableAccrued interest payableBonds payable
Total current liabilities
Noncurrent liabilities:Non-current portion of long-term obligations
Total noncurrent liabilitiesTotal liabilities
DEFERRED INFLOWS OF RESOURCESPension plan items
NET POSITIONNet investment in capital assetsRestricted for:
Voter approved initiativesFederal and state projectsFood serviceCivic centerExtracurricular activitiesGifts and donationsInsurance refundOther local initiativesDebt serviceCapital outlay
UnrestrictedTotal net position
Governmental Activities
$ 7,156,404197,37356,482
5,080,9491,000,000
13,491,208
8,437,28944,833,83553,271,12466,762,332
2,759,482
342,774181,081113,74875,000
165,516945,000
1,823,119
27,853,49227,853,49229,676,611
1,732,002
45,544,136
2,778,973650,069
1,103,930233,78870,90971,26134,70746,03369,265
722,326(13,212,196)
$ 38,113,201
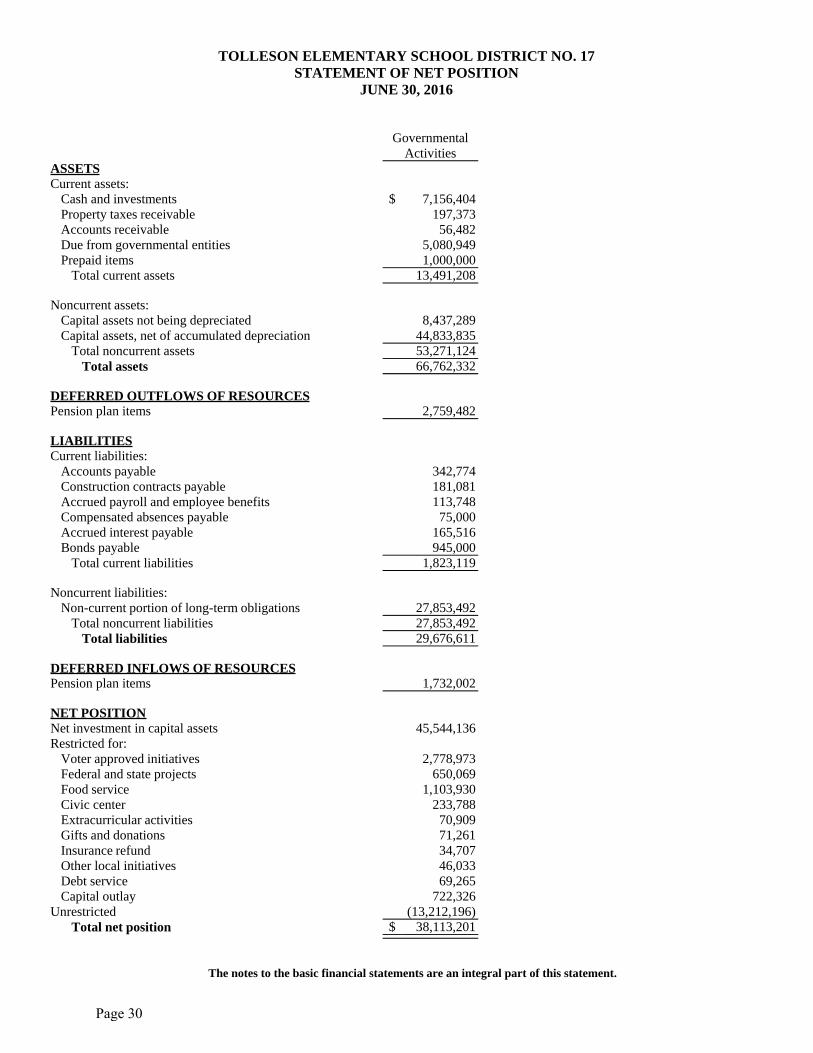
TOLLESON ELEMENTARY SCHOOL DISTRICT NO. 17STATEMENT OF NET POSITION
JUNE 30, 2016
The notes to the basic financial statements are an integral part of this statement.
Page 30

Program Revenues
Net (Expense) Revenue and
Changes in Net Position
Functions/ProgramsGovernmental activities:
InstructionSupport services - students and staffSupport services - administrationOperation and maintenance of plant servicesStudent transportation servicesOperation of non-instructional servicesInterest on long-term debt
Total governmental activities
Expenses
$ 13,044,2423,273,3742,947,4872,427,054
681,1232,064,539
333,032$ 24,770,851
Charges for Services
$ 170,20191,578
230,523
$ 492,302
Operating Grants and
Contributions
$ 1,875,886664,169140,715171,329
11,3682,430,154
$ 5,293,621
Capital Grants and
Contributions
$ 947,506
$ 947,506
Governmental Activities
$ (10,050,649)(2,517,627)(2,806,772)(2,255,725)
(669,755)596,138
(333,032)(18,037,422)
General revenues:Taxes:
Property taxes, levied for general purposesProperty taxes, levied for debt serviceProperty taxes, levied for capital outlay
Investment incomeUnrestricted county aidUnrestricted state aidUnrestricted federal aid
Total general revenues
Changes in net position
Net position, beginning of year, as restated
Net position, end of year
4,920,1181,327,471
855,33633,787
1,065,58711,171,443
58,53619,432,278
1,394,856
36,718,345
$ 38,113,201
TOLLESON ELEMENTARY SCHOOL DISTRICT NO. 17STATEMENT OF ACTIVITIESYEAR ENDED JUNE 30, 2016
The notes to the basic financial statements are an integral part of this statement.
Page 31

(This page intentionally left blank)
Page 32

FUND FINANCIAL STATEMENTS
Page 33
ASSETSCash and investmentsProperty taxes receivableAccounts receivableDue from governmental entitiesDue from other funds
Total assets
LIABILITIES, DEFERRED INFLOWS OF RESOURCES AND FUND BALANCESLiabilities:
Accounts payableConstruction contracts payableDue to other fundsAccrued payroll and employee benefitsBonds payableBond interest payable
Total liabilities
Deferred inflows of resources:Unavailable revenues - property taxesUnavailable revenues - intergovernmental
Total deferred inflows of resources
Fund balances (deficits):RestrictedUnassigned
Total fund balances
Total liabilities, deferred inflows of resourcesand fund balances
General
$ 42,833167,834
3,561,618
$ 3,772,285
$ 214,656
68,969
283,625
151,949
151,949
3,336,7113,336,711
$ 3,772,285
Classroom Site
$ 2,474,180
86,349
$ 2,560,529
$
4,460
4,460
2,556,069
2,556,069
$ 2,560,529
E-Rate
$ 134,054
535,654
$ 669,708
$ 19,639
19,639
396,339396,339
253,730
253,730
$ 669,708
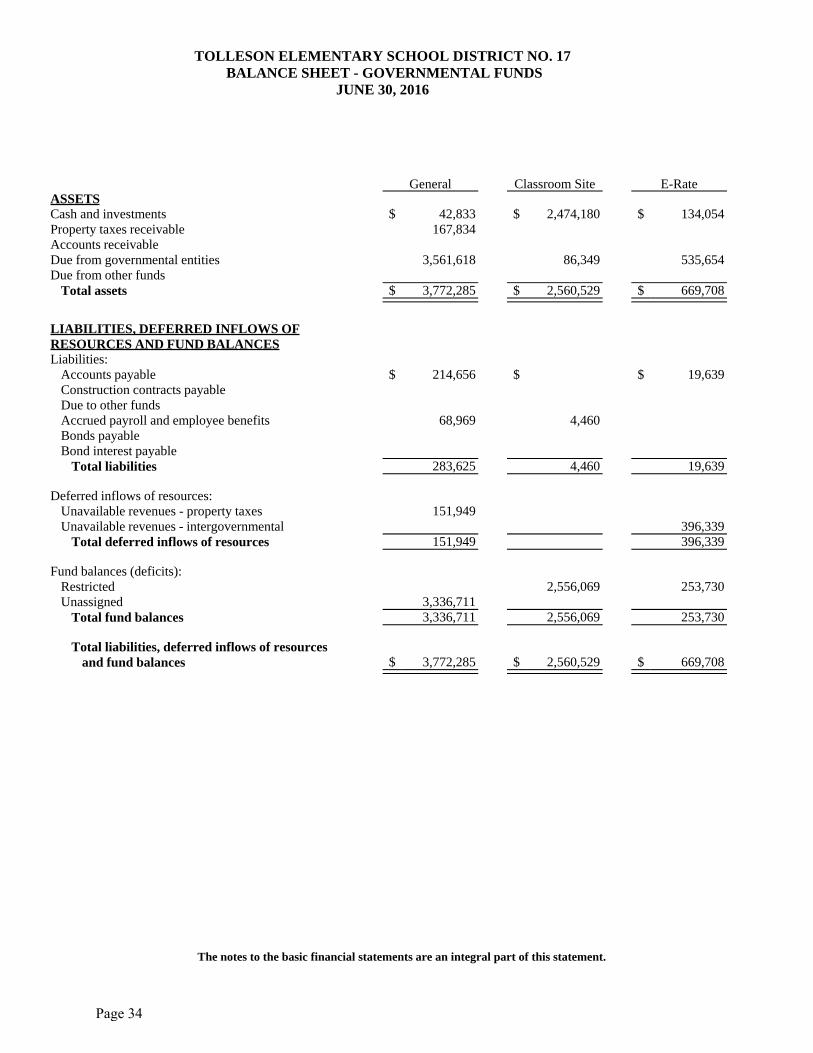
TOLLESON ELEMENTARY SCHOOL DISTRICT NO. 17 BALANCE SHEET - GOVERNMENTAL FUNDS
JUNE 30, 2016
The notes to the basic financial statements are an integral part of this statement.
Page 34

Other Federal Projects
$
288,868
$ 288,868
$
288,868
288,868
$ 288,868
Food Service
$ 497,306
48,072562,581
$ 1,107,959
$
4,029
4,029
1,103,930
1,103,930
$ 1,107,959
Debt Service
$ 1,165,00514,776
$ 1,179,781
$
945,000165,516
1,110,516
10,348
10,348
58,917
58,917
$ 1,179,781
Non-Major Governmental
Funds
$ 1,472,87014,76356,482
560,388
$ 2,104,503
$ 108,479181,081273,713
36,290
599,563
11,751
11,751
1,493,189
1,493,189
$ 2,104,503
Total Governmental
Funds
$ 5,786,248197,37356,482
5,080,949562,581
$ 11,683,633
$ 342,774181,081562,581113,748945,000165,516
2,310,700
174,048396,339570,387
5,465,8353,336,7118,802,546
$ 11,683,633
Page 35

(This page intentionally left blank)
Page 36

Total governmental fund balances 8,802,546
Amounts reported for governmental activities in the Statement of Net Position are different because:
Capital assets used in governmental activities are not financial resources and, therefore, are not reported in the funds.
Governmental capital assets $ 68,009,625Less accumulated depreciation (14,738,501) 53,271,124
Some revenues will not be available to pay for current period expenditures and, therefore, are reported as unavailable revenues in the funds.
Property taxes 174,048 Intergovernmental 396,339 570,387
Deferred outflows and inflows of resources related to pensions are applicable to future periods and, therefore, are not reported in the funds.
Deferred outflows of resources related to pensions 2,759,482 Deferred inflows of resources related to pensions (1,732,002) 1,027,480
The Internal Service Fund is used by management to charge the cost of insurance to the individual funds. The assets andliabilities of the Internal Service Fund are included in theStatement of Net Position. 2,370,156
Long-term liabilities are not due and payable in the current period and, therefore, are not reported in the funds.
Compensated absences payable (534,005)Net pension liability (20,509,487)Bonds payable (6,885,000) (27,928,492)
Net position of governmental activities 38,113,201
TOLLESON ELEMENTARY SCHOOL DISTRICT NO. 17RECONCILIATION OF THE BALANCE SHEET - GOVERNMENTAL FUNDS
TO THE STATEMENT OF NET POSITIONJUNE 30, 2016
The notes to the basic financial statements are an integral part of this statement.
Page 37

Revenues:Other localProperty taxesState aid and grantsFederal aid, grants and reimbursements
Total revenues
Expenditures:Current -
InstructionSupport services - students and staffSupport services - administrationOperation and maintenance of plant servicesStudent transportation servicesOperation of non-instructional services
Capital outlayDebt service -
Principal retirementInterest and fiscal charges
Total expenditures
Excess (deficiency) of revenues over expenditures
Other financing sources (uses):Transfers inTransfers out
Total other financing sources (uses):
Changes in fund balances
Fund balances (deficits), beginning of year
Increase (decrease) in reserve for prepaid items
Fund balances (deficits), end of year
General
$ 1,131,4974,933,669
10,014,02358,536
16,137,725
8,943,7472,146,0462,409,4211,469,229
449,81945,924
131,630
15,595,816
541,909
251,187
251,187
793,096
3,007,311
(463,696)
$ 3,336,711
Classroom Site
$ 11,768
1,036,192
1,047,960
549,319146,662
695,981
351,979
351,979
2,204,090
$ 2,556,069
E-Rate
$
485,639485,639
232,422
12,374
244,796
240,843
240,843
12,887
$ 253,730
TOLLESON ELEMENTARY SCHOOL DISTRICT NO. 17STATEMENT OF REVENUES, EXPENDITURES AND CHANGES IN FUND BALANCES -
GOVERNMENTAL FUNDSYEAR ENDED JUNE 30, 2016
The notes to the basic financial statements are an integral part of this statement.
Page 38

Other Federal Projects
$
465,305465,305
382,09333,356
593
416,042
49,263
(6,439)(6,439)
42,824
(42,824)
$
Food Service
$ 234,028
2,430,1542,664,182
5,775
1,946,572112,852
2,065,199
598,983
(205,678)(205,678)
393,305
710,625
$ 1,103,930
Debt Service
$ 3,7521,332,335
1,336,087
945,000333,032
1,278,032
58,055
444
444
58,499
418
$ 58,917
Non-Major Governmental
Funds
$ 259,021896,339
1,155,8531,680,1793,991,392
1,540,996753,008194,054
3,4719,2744,450
2,045,707
4,550,960
(559,568)
(39,514)(39,514)
(599,082)
2,092,271
$ 1,493,189
Total Governmental
Funds
$ 1,640,0667,162,343
12,206,0685,119,813
26,128,290
11,416,1553,079,0722,603,4751,710,897
459,0931,996,9462,303,156
945,000333,032
24,846,826
1,281,464
251,631(251,631)
1,281,464
7,984,778
(463,696)
$ 8,802,546
Page 39
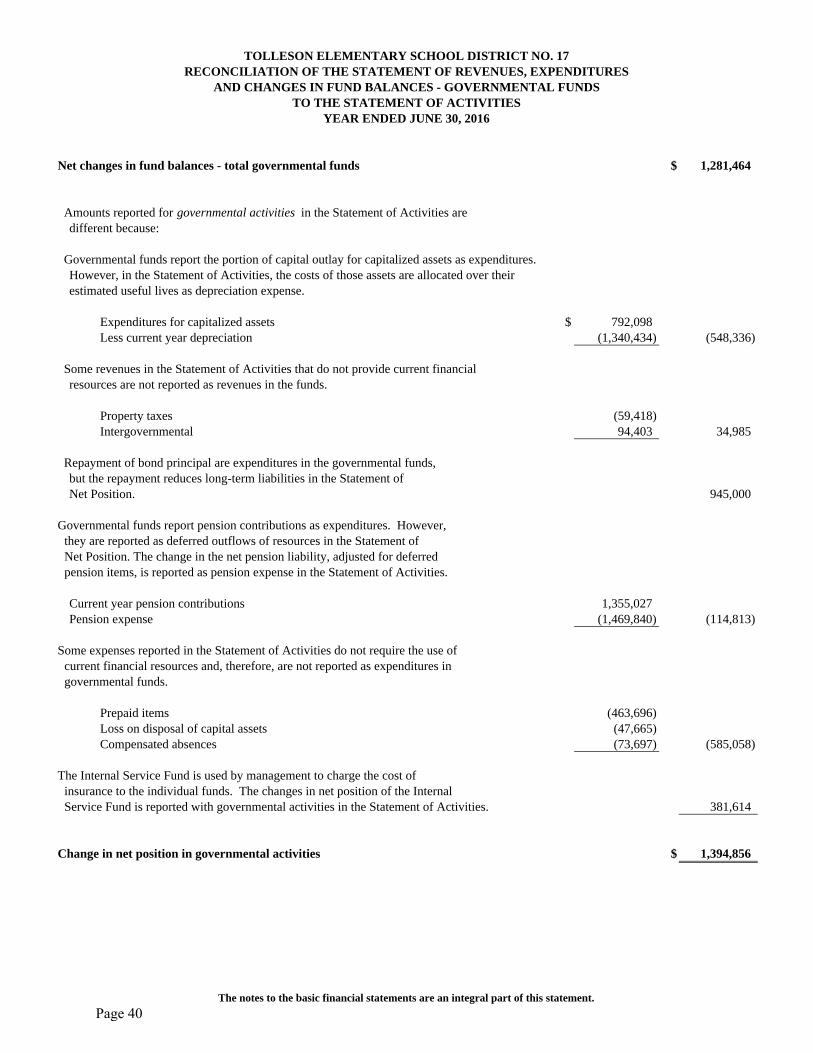
Net changes in fund balances - total governmental funds $ 1,281,464
Amounts reported for governmental activities in the Statement of Activities aredifferent because:
Governmental funds report the portion of capital outlay for capitalized assets as expenditures. However, in the Statement of Activities, the costs of those assets are allocated over their estimated useful lives as depreciation expense.
Expenditures for capitalized assets $ 792,098Less current year depreciation (1,340,434) (548,336)
Some revenues in the Statement of Activities that do not provide current financialresources are not reported as revenues in the funds.
Property taxes (59,418)Intergovernmental 94,403 34,985
Repayment of bond principal are expenditures in the governmental funds,but the repayment reduces long-term liabilities in the Statement ofNet Position. 945,000
Governmental funds report pension contributions as expenditures. However,they are reported as deferred outflows of resources in the Statement ofNet Position. The change in the net pension liability, adjusted for deferred pension items, is reported as pension expense in the Statement of Activities.
Current year pension contributions 1,355,027Pension expense (1,469,840) (114,813)
Some expenses reported in the Statement of Activities do not require the use ofcurrent financial resources and, therefore, are not reported as expenditures in governmental funds.
Prepaid items (463,696)Loss on disposal of capital assets (47,665)Compensated absences (73,697) (585,058)
The Internal Service Fund is used by management to charge the cost of insurance to the individual funds. The changes in net position of the Internal Service Fund is reported with governmental activities in the Statement of Activities. 381,614
Change in net position in governmental activities $ 1,394,856
TOLLESON ELEMENTARY SCHOOL DISTRICT NO. 17RECONCILIATION OF THE STATEMENT OF REVENUES, EXPENDITURES
AND CHANGES IN FUND BALANCES - GOVERNMENTAL FUNDS
YEAR ENDED JUNE 30, 2016TO THE STATEMENT OF ACTIVITIES
The notes to the basic financial statements are an integral part of this statement.
Page 40

ASSETSCurrent assets:
Cash and investmentsTotal current assets
Noncurrent assets:Prepaid items
Total noncurrent assetsTotal assets
NET POSITIONUnrestricted
Total net position
Governmental Activities:
Internal Service Funds
$ 1,370,1561,370,156
1,000,0001,000,0002,370,156
2,370,156$ 2,370,156
TOLLESON ELEMENTARY SCHOOL DISTRICT NO. 17STATEMENT OF NET POSITION
PROPRIETARY FUNDSJUNE 30, 2016
The notes to the basic financial statements are an integral part of this statement.
Page 41
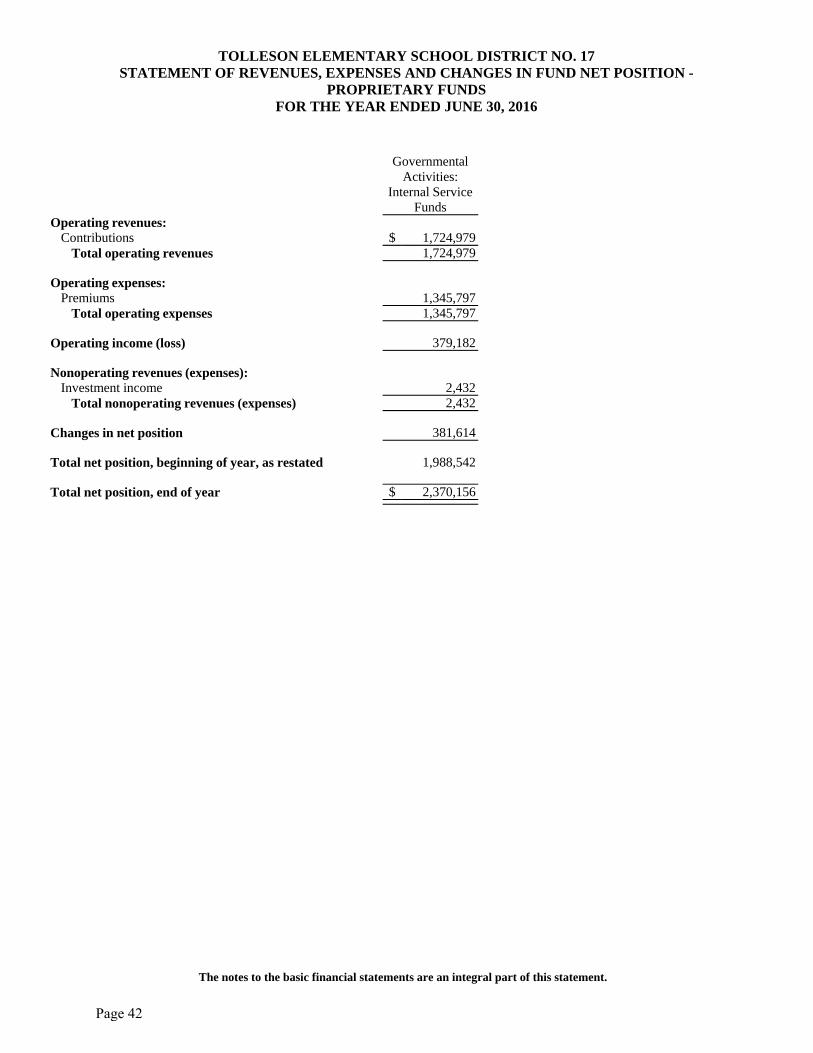
Operating revenues:Contributions
Total operating revenues
Operating expenses:Premiums
Total operating expenses
Operating income (loss)
Nonoperating revenues (expenses):Investment income
Total nonoperating revenues (expenses)
Changes in net position
Total net position, beginning of year, as restated
Total net position, end of year
Governmental Activities:
Internal Service Funds
$ 1,724,9791,724,979
1,345,7971,345,797
379,182
2,4322,432
381,614
1,988,542
$ 2,370,156
TOLLESON ELEMENTARY SCHOOL DISTRICT NO. 17STATEMENT OF REVENUES, EXPENSES AND CHANGES IN FUND NET POSITION -
PROPRIETARY FUNDSFOR THE YEAR ENDED JUNE 30, 2016
The notes to the basic financial statements are an integral part of this statement.
Page 42

GovernmentalActivities:Internal
Service FundDecrease in Cash and Cash Equivalents
Cash flows from operating activities:Cash received from charges for services $ 1,724,979 Cash payments to suppliers for goods and services (2,345,797)
Net cash used for operating activities (620,818)
Cash flows from investing activities:Investment income 2,432
Net cash provided by investing activities 2,432
Net decrease in cash and cash equivalents (618,386)
Cash and cash equivalents, beginning of year, as restated 1,988,542
Cash and cash equivalents, end of year $ 1,370,156
Reconciliation of Operating Income to Net Cash Used for Operating Activities
Operating income $ 379,182
Adjustments to reconcile operating incometo net cash used for operating activities:
Changes in assets and liabilities:Increase in prepaid items (1,000,000)
Total adjustments (1,000,000)
Net cash used for operating activities $ (620,818)
TOLLESON ELEMENTARY SCHOOL DISTRICT NO. 17STATEMENT OF CASH FLOWS - PROPRIETARY FUNDS
YEAR ENDED JUNE 30, 2016
The notes to the basic financial statements are an integral part of this statement.
Page 43

ASSETSCash and investments
Total assets
LIABILITIESDeposits held for othersDue to governmental entitiesDue to student groups
Total liabilities
Agency
$ 139,846$ 139,846
$ 26,93986,26526,642
$ 139,846
TOLLESON ELEMENTARY SCHOOL DISTRICT NO. 17STATEMENT OF ASSETS AND LIABILITIES
FIDUCIARY FUNDSJUNE 30, 2016
The notes to the basic financial statements are an integral part of this statement.
Page 44

TOLLESON ELEMENTARY SCHOOL DISTRICT NO. 17 NOTES TO FINANCIAL STATEMENTS
JUNE 30, 2016
NOTE 1 – SUMMARY OF SIGNIFICANT ACCOUNTING POLICIES The financial statements of the Tolleson Elementary School District No. 17 (District) have been prepared in conformity with accounting principles generally accepted in the United States of America as applied to government units. The Governmental Accounting Standards Board (GASB) is the accepted standard-setting body for establishing governmental accounting and financial reporting principles. During the year ended June 30, 2016, the District implemented the provisions of GASB Statement No. 72, Fair Value Measurement and Application. This Statement addresses accounting and financial reporting issues related to fair value measurements and establishes a hierarchy of inputs to valuation techniques used to measure fair value. This Statement also enhances accountability and transparency through revised note disclosures. The more significant of the District’s accounting policies are described below. A. Reporting Entity The Governing Board is organized under Section 15-321 of the Arizona Revised Statutes (A.R.S.). Management of the District is independent of other state or local governments. The County Treasurer collects taxes for the District, but exercises no control over its expenditures/expenses. The membership of the Governing Board consists of five members elected by the public. Under existing statutes, the Governing Board’s duties and powers include, but are not limited to, the acquisition, maintenance and disposition of school property; the development and adoption of a school program; and the establishment, organization and operation of schools. The Board also has broad financial responsibilities, including the approval of the annual budget, and the establishment of a system of accounting and budgetary controls. The financial reporting entity consists of a primary government and its component units. A component unit is a legally separate entity that must be included in the reporting entity in conformity with generally accepted accounting principles. The District is a primary government because it is a special-purpose government that has a separately elected governing body, is legally separate, and is fiscally independent of other state or local governments. Furthermore, there are no component units combined with the District for financial statement presentation purposes, and the District is not included in any other governmental reporting entity. Consequently, the District’s financial statements include only the funds of those organizational entities for which its elected governing board is financially accountable. The District’s major operations include education, student transportation, construction and maintenance of District facilities, and food services.
Page 45

TOLLESON ELEMENTARY SCHOOL DISTRICT NO. 17 NOTES TO FINANCIAL STATEMENTS
JUNE 30, 2016
NOTE 1 – SUMMARY OF SIGNIFICANT ACCOUNTING POLICIES B. Government-Wide and Fund Financial Statements The government-wide financial statements (i.e., the statement of net position and the statement of activities) present financial information about the District as a whole. The reported information includes all of the nonfiduciary activities of the District. For the most part, the effect of internal activity has been removed from these statements. These statements are to distinguish between the governmental and business-type activities of the District. Governmental activities normally are supported by taxes and intergovernmental revenues, and are reported separately from business-type activities, which rely to a significant extent on fees and charges for support. The District does not have any business-type activities. The statement of activities demonstrates the degree to which the direct expenses of a given function or segment are offset by program revenues. Direct expenses are those that are clearly identifiable with a specific function or segment. Program revenues include 1) charges to customers or applicants who purchase, use, or directly benefit from goods, services, or privileges provided by a given function or segment and 2) grants and contributions that are restricted to meeting the operational or capital requirements of a particular function or segment. Taxes, unrestricted state, county and federal aid, and other items not included among program revenues are reported instead as general revenues. Separate financial statements are provided for governmental funds, proprietary funds and fiduciary funds, even though the latter are excluded from the government-wide financial statements. Major individual governmental funds are reported as separate columns in the fund financial statements. C. Measurement Focus, Basis of Accounting, and Financial Statement Presentation Government-Wide Financial Statements – The government-wide financial statements are reported using the economic resources measurement focus and the accrual basis of accounting. Revenues are recorded when earned and expenses are recorded when a liability is incurred, regardless of the timing of related cash flows. Property taxes are recognized as revenues in the year for which they are levied. Grants and similar items are recognized as revenue as soon as all eligibility requirements imposed by the grantor or provider have been met. As a general rule, the effect of internal activity has been eliminated from the government-wide financial statements; however, the effects of interfund services provided and used between functions are reported as expenses and program revenues at amounts approximating their external exchange value.
Page 46

TOLLESON ELEMENTARY SCHOOL DISTRICT NO. 17 NOTES TO FINANCIAL STATEMENTS
JUNE 30, 2016
NOTE 1 – SUMMARY OF SIGNIFICANT ACCOUNTING POLICIES Fund Financial Statements – Governmental fund financial statements are reported using the current financial resources measurement focus and the modified accrual basis of accounting. Revenues are recognized as soon as they are both measurable and available. Revenues are considered to be available when they are collectible within the current period or soon enough thereafter to pay liabilities of the current period. For this purpose, the District considers revenues to be available if they are collected within 60 days of the end of the current fiscal period. Expenditures generally are recorded when a liability is incurred, as under accrual accounting. However, debt service expenditures, as well as expenditures related to compensated absences, and claims and judgments, are recorded only when payment is due. As permitted by generally accepted accounting principles the District applies the “early recognition” option for debt service payments. Property tax resources are provided in the Debt Service Fund during the current year for the payment of debt service principal and interest due early in the following year (less than one month). Therefore, the expenditures and related liabilities have been recognized in the current period. Property taxes, federal, state and county aid, and investment income associated with the current fiscal period are all considered to be susceptible to accrual and have been recognized as revenues of the current fiscal period. Food services and miscellaneous revenues are not susceptible to accrual because generally they are not measurable until received in cash. Grants and similar awards are recognized as revenue as soon as all eligibility requirements imposed by the grantor or provider have been met. Unearned revenues arise when resources are received by the District before it has legal claim to them, as when grant monies are received prior to meeting all eligibility requirements imposed by the provider. Delinquent property taxes and other receivables that will not be collected within the available period have been reported as unavailable revenues on the governmental fund financial statements. The focus of governmental fund financial statements is on major funds rather than reporting funds by type. Each major fund is presented in a separate column. Non-major funds are aggregated and presented in a single column. Fiduciary funds are reported by fund type.
The District reports the following major governmental funds:
General Fund – The General Fund is the District’s primary operating fund. It accounts for all resources used to finance District maintenance and operation except those required to be accounted for in other funds. The General Fund includes the District’s Maintenance and Operation Fund as well as certain activities budgeted in separate funds in accordance with A.R.S. These funds are maintained as separate funds for budgetary purposes but do not meet the criteria for separate reporting in the financial statements.
Page 47

TOLLESON ELEMENTARY SCHOOL DISTRICT NO. 17 NOTES TO FINANCIAL STATEMENTS
JUNE 30, 2016
NOTE 1 – SUMMARY OF SIGNIFICANT ACCOUNTING POLICIES Classroom Site Fund – The Classroom Site Fund accounts for the financial activity for the portion of state sales tax collections and permanent state school fund earnings as approved by the voters in 2000. E-Rate Fund – The E-Rate Fund accounts for financial assistance received for broadband internet and telecommunication costs. Other Federal Projects – The Other Federal Projects Funds accounts for financial assistance received for supplemental federal projects. Food Service Fund – The Food Service Fund accounts for the financial activity of school activities that have as their purpose the preparation and serving of regular and incidental meals and snacks in connection with school functions. Debt Service Fund – The Debt Service Fund accounts for the accumulation of resources for, and the payment of, long-term debt principal, interest and related costs.
Additionally, the District reports the following fund types: Proprietary Fund – The Proprietary Fund is an internal service fund that accounts for activities related to the District’s self-insurance program. Fiduciary Funds – The Fiduciary Funds are Agency Funds which account for resources held by the District on behalf of others. This fund type includes 1) the Student Activities Fund which accounts for monies raised by students to finance student clubs and organizations held by the District as an agent, 2) funds that account for employee withholdings before the monies are remitted to the appropriate entities, and 3) activities related to agreements with other governments where the District is the fiscal agent.
The Proprietary Fund financial statements are reported using the economic resources measurement focus and accrual basis of accounting and are presented in a single column.
Proprietary funds distinguish operating revenues and expenses from nonoperating items. Operating revenues and expenses generally result from providing services and producing and delivering goods in connection with a proprietary fund’s principal ongoing operations. The principal operating revenues of the District’s internal service funds are charges for health and welfare benefits and charges to District departments for goods and services. Operating expenses for internal service funds include the cost of goods and services and administrative expenses. All revenues and expenses not meeting this definition are reported as nonoperating revenues and expenses.
The Agency Funds are custodial in nature and do not have a measurement focus and are reported using the accrual basis of accounting. The Agency Funds are reported by fund type.
Page 48
TOLLESON ELEMENTARY SCHOOL DISTRICT NO. 17 NOTES TO FINANCIAL STATEMENTS
JUNE 30, 2016
NOTE 1 – SUMMARY OF SIGNIFICANT ACCOUNTING POLICIES D. Cash and Investments For purposes of the Statement of Cash Flows, the District considers all highly liquid investments with a maturity of three months or less when purchased to be cash equivalents. Cash and cash equivalents at year end were cash and investments held by the County Treasurer. A.R.S. require the District to deposit all cash with the County Treasurer, except as discussed below. Cash with the County Treasurer is pooled for investment purposes, except for cash of the Debt Service and Bond Building Funds that may be invested separately. Interest earned from investments purchased with pooled monies is allocated to each of the District’s funds based on their average balances. As required by statute, interest earnings of the Bond Building Fund are recorded initially in that fund, but then transferred to the Debt Service Fund. All investments are stated at fair value. Statute authorizes the District to separately invest monies of the Bond Building and Debt Service Funds in the State Treasurer’s investment pools; obligations issued and guaranteed by the United States or any of its agencies or instrumentalities; specified state and local government bonds and notes; and interest bearing savings accounts or certificates of deposit. Statute authorizes the District to deposit monies of the Auxiliary Operations and Student Activities Funds in bank accounts. Monies in these funds may also be invested. In addition, statute authorizes the District to maintain various bank accounts such as clearing accounts to temporarily deposit receipts before they are transmitted to the County Treasurer; revolving accounts to pay minor disbursements; and withholdings accounts for taxes and employee insurance programs. Some of these bank accounts may be interest bearing. Statute does not include any requirements for credit risk, concentration of credit risk, interest rate risk, or foreign currency risk. Statute requires collateral for deposits of Bond Building and Debt Service Funds monies in interest bearing savings accounts and certificates of deposit at 101 percent of all deposits not covered by federal depository insurance. Arizona statute requires a pooled collateral program for public deposits and a Statewide Collateral Pool Administrator (Administrator) in the State Treasurer’s Office. The purpose of the pooled collateral program is to ensure that governmental entities’ public deposits placed in participating depositories are secured with collateral of 102 percent of the public deposits, less any applicable deposit insurance. An eligible depository may not retain or accept any public deposit unless it has deposited the required collateral with a qualified escrow agent or the Administrator. The Administrator manages the pooled collateral program, including reporting on each depository’s compliance with the program.
Page 49

TOLLESON ELEMENTARY SCHOOL DISTRICT NO. 17 NOTES TO FINANCIAL STATEMENTS
JUNE 30, 2016
NOTE 1 – SUMMARY OF SIGNIFICANT ACCOUNTING POLICIES
E. Investment Income Investment income is composed of interest, dividends and net changes in the fair value of applicable investments. Investment income is included in other local revenue in the fund financial statements. F. Receivables and Payables Activity between funds that is representative of lending/borrowing arrangements outstanding at the end of the fiscal year is referred to as either “due to/from other funds” (i.e., the current portion of interfund loans) or “advances to/from other funds” (i.e., the non-current portion of interfund loans). All other outstanding balances between funds are reported as “due to/from other funds.” Interfund balances between governmental funds are eliminated on the Statement of Net Position. All receivables, including property taxes receivable, are shown net of an allowance for uncollectibles. G. Property Tax Calendar The County Treasurer is responsible for collecting property taxes for all governmental entities within the county. The county levies real property taxes on or before the third Monday in August that become due and payable in two equal installments. The first installment is due on the first day of October and becomes delinquent after the first business day of November. The second installment is due on the first day of March of the next year and becomes delinquent after the first business day of May. Pursuant to A.R.S., a lien against assessed real and personal property attaches on the first day of January preceding assessment and levy; however according to case law, an enforceable legal claim to the asset does not arise. H. Prepaid Items Certain payments to vendors reflect costs applicable to future accounting periods and are recorded as prepaid items in both the government-wide and fund financial statements. Prepaid items are recorded as expenses when consumed in the government-wide financial statements and as expenditures when purchased in the fund financial statements.
Page 50

TOLLESON ELEMENTARY SCHOOL DISTRICT NO. 17 NOTES TO FINANCIAL STATEMENTS
JUNE 30, 2016
NOTE 1 – SUMMARY OF SIGNIFICANT ACCOUNTING POLICIES I. Capital Assets Capital assets, which include land and improvements; buildings and improvements; vehicles, furniture, and equipment; and construction in progress, are reported in the government-wide financial statements. Capital assets are defined by the District as assets with an initial, individual cost in excess of $5,000 and an estimated useful life of more than one year. Such assets are recorded at historical cost, or estimated historical cost if actual historical cost is not available. Donated capital assets are recorded at the estimated fair market value at the date of donation. The costs of normal maintenance and repairs that do not add to the value of the asset or materially extend the life of the asset are not capitalized. Capital assets are depreciated using the straight-line method over the following estimated useful lives:
Land improvements 5 – 60 years Buildings and improvements 5 – 100 years Vehicles, furniture and equipment 5 – 25 years
J. Deferred Outflows/Inflows of Resources In addition to assets, the statement of financial position may report a separate section for deferred outflows of resources. This separate financial statement element, deferred outflows of resources, represents a consumption of net position that applies to a future period and so will not be recognized as an outflow of resources (expense/expenditure) until then. In addition to liabilities, the statement of financial position may report a separate section for deferred inflows of resources. This separate financial statement element, deferred inflows of resources, represents an acquisition of net position that applies to a future period and so will not be recognized as an inflow of resources (revenue) until that time. K. Compensated Absences The District’s employee vacation and sick leave policies generally provide for granting vacation and sick leave with pay in varying amounts. Only benefits considered vested are recognized in the financial statements. The liability for vacation and sick leave is reported in the government-wide financial statements. A liability for these amounts is reported in governmental funds only if they have matured, for example, as a result of employee leave, resignations and retirements. Generally, resources from the General Fund are used to pay for compensated absences.
Page 51

TOLLESON ELEMENTARY SCHOOL DISTRICT NO. 17 NOTES TO FINANCIAL STATEMENTS
JUNE 30, 2016
NOTE 1 – SUMMARY OF SIGNIFICANT ACCOUNTING POLICIES L. Pensions
For purposes of measuring the net pension liability, deferred outflows of resources and deferred inflows of resources related to pensions, and pension expense, information about the pension plan’s fiduciary net position and additions to/deductions from the plan’s fiduciary net position have been determined on the same basis as they are reported by the plan. For this purpose, benefit payments (including refunds of employee contributions) are recognized when due and payable in accordance with the benefit terms. Investments are reported at fair value. M. Long-term Obligations In the government-wide financial statements, long-term debt and other long-term obligations are reported as liabilities on the statement of net position. Bond premiums and discounts are amortized over the life of the bonds using the straight-line method. Deferred amounts on refunding result from the difference between the carrying value of refunded debt and its reacquisition price. This amount is deferred and amortized over the shorter of the life of the refunded or refunding debt. In the fund financial statements, governmental fund types recognize bond premiums and discounts, as well as bond issuance costs, during the current period. The face amount of debt issued is reported as other financing sources. Premiums received on debt issuances are reported as other financing sources while discounts on debt issuances are reported as other financing uses. Issuance costs, whether or not withheld from the actual debt proceeds received, are reported as debt service expenditures. N. Interfund Activity Flows of cash from one fund to another without a requirement for repayment are reported as interfund transfers. Interfund transfers between governmental funds are eliminated in the Statement of Activities. Interfund transfers in the fund financial statements are reported as other financing sources/uses in governmental funds and after nonoperating revenues/expenses in proprietary funds. O. Net Position Flow Assumption In the government-wide and proprietary fund financial statements the District applies restricted resources first when outlays are incurred for purposes for which either restricted or unrestricted amounts are available.
Page 52

TOLLESON ELEMENTARY SCHOOL DISTRICT NO. 17 NOTES TO FINANCIAL STATEMENTS
JUNE 30, 2016
NOTE 1 – SUMMARY OF SIGNIFICANT ACCOUNTING POLICIES P. Estimates The preparation of the financial statements in conformity with accounting principles generally accepted in the United States of America requires management to make estimates and assumptions that affect the amounts reported in the financial statements and accompanying notes. Actual results may differ from those estimates.
NOTE 2 – FUND BALANCE CLASSIFICATIONS
Fund balances of the governmental funds are reported separately within classifications based on a hierarchy of the constraints placed on the use of those resources. The classifications are based on the relative strength of the constraints that control how the specific amounts can be spent. The classifications are nonspendable, restricted, and unrestricted, which includes committed, assigned, and unassigned fund balance classifications. Nonspendable. The nonspendable fund balance classification includes amounts that cannot be spent because they are not in spendable form, or legally or contractually required to be maintained intact. Restricted. Fund balance is reported as restricted when constraints placed on the use of resources are either externally imposed by creditors (such as through debt covenants), grantors, contributors, or laws or regulations of other governments or is imposed by law through constitutional provisions or enabling legislation. Committed. The committed fund balance classification includes amounts that can be used only for the specific purposes imposed by formal action of the Governing Board. Those committed amounts cannot be used for any other purpose unless the Governing Board removes or changes the specified use by taking the same type of action it employed to previously commit those amounts. The District does not have a formal policy or procedures for the utilization of committed fund balance, accordingly, no committed fund balance amounts are reported. Assigned. Amounts in the assigned fund balance classification are intended to be used by the District for specific purposes but do not meet the criteria to be classified as restricted or committed. In governmental funds other than the General Fund, assigned fund balance represents the remaining amount that is not restricted or committed. In the General Fund, assigned amounts represent intended uses established by the Governing Board or the Executive Director of Business Services, who has been delegated that authority by formal Governing Board action. No assigned fund balance amounts are reported.
Page 53

TOLLESON ELEMENTARY SCHOOL DISTRICT NO. 17 NOTES TO FINANCIAL STATEMENTS
JUNE 30, 2016
NOTE 2 – FUND BALANCE CLASSIFICATIONS Unassigned. Unassigned fund balance is the residual classification for the General Fund and includes all spendable amounts not contained in the other classifications. In other governmental funds, the unassigned classification is used only to report a deficit balance resulting from overspending for specific purposes for which amounts had been restricted, committed, or assigned.
The District applies restricted resources first when outlays are incurred for purposes for which either restricted or unrestricted (committed, assigned, and unassigned) amounts are available. Similarly, within unrestricted fund balance, committed amounts are reduced first followed by assigned, and then unassigned amounts when expenditures are incurred for purposes for which amounts in any of the unrestricted fund balance classifications could be used. The table below provides detail of the major components of the District’s fund balance classifications at year end. Voter approved initiatives include monies restricted in the Classroom Site and Instructional Improvement Funds.
General
Fund Classroom Site Fund
E-Rate Fund
Food Service Fund
Debt Service Fund
Non-Major Governmental
Funds Fund Balances:
Restricted: Debt service $ $ $ $ $ 58,917 $ Capital projects 710,575 Bond building projects 103,012 Voter approved initiatives 2,556,069 222,904 Federal and state projects 253,730 Food service 1,103,930 Civic center 233,788 Extracurricular activities 70,909 Gifts and donations 71,261 Insurance refund 34,707 Other purposes 46,033
Unassigned 3,336,711Total fund balances $ 3,336,711 $ 2,556,069 $ 253,730 $1,103,930 $ 58,917 $ 1,493,189
Page 54

TOLLESON ELEMENTARY SCHOOL DISTRICT NO. 17 NOTES TO FINANCIAL STATEMENTS
JUNE 30, 2016
NOTE 3 – STEWARDSHIP, COMPLIANCE AND ACCOUNTABILITY Excess Expenditures Over Budget – At year end, the District had expenditures in a fund that exceeded the budget, however this does not constitute a violation of any legal provisions.
NOTE 4 – CASH AND INVESTMENTS
Custodial Credit Risk – Deposits. Custodial credit risk is the risk that in the event of bank failure the District’s deposits may not be returned to the District. The District does not have a deposit policy for custodial credit risk. At year end, the carrying amount of the District’s deposits was $61,873 and the bank balance was $70,091. At year end, all of the District’s deposits were covered by federal depository insurance. Fair Value Measurements. The District categorizes its fair value measurements within the fair value hierarchy established by generally accepted accounting principles. The hierarchy is based on the valuation inputs used to measure the fair value of the asset.
Level 1 inputs are quoted prices in active markets for identical assets Level 2 inputs are significant other observable inputs Level 3 inputs are significant unobservable inputs
The County Treasurer’s pool is an external investment pool with no regulatory oversight. The pool is not required to register (and is not registered) with the Securities and Exchange Commission. The fair value of each participant’s position in the County Treasurer investment pool approximates the value of the participant’s shares in the pool and the participants’ shares are not identified with specific investments. Participants in the pool are not required to categorize the value of shares in accordance with the fair value hierarchy. At year end, the District’s investments consisted of the following:
Average Maturities Fair Value County Treasurer’s investment pool 342 days $ 7,234,377 Total $ 7,234,377
Page 55

TOLLESON ELEMENTARY SCHOOL DISTRICT NO. 17 NOTES TO FINANCIAL STATEMENTS
JUNE 30, 2016
NOTE 4 – CASH AND INVESTMENTS Interest Rate Risk. The District does not have a formal investment policy that limits investment maturities as a means of managing its exposure to fair value losses arising from increasing interest rates. Credit Risk. The District has no investment policy that would further limit its investment choices. As of year end, the District’s investment in the County Treasurer’s investment pool did not receive a credit quality rating from a national rating agency. Custodial Credit Risk – Investments. The District’s investment in the County Treasurer’s investment pool represents a proportionate interest in the pool’s portfolio; however, the District’s portion is not identified with specific investments and is not subject to custodial credit risk.
NOTE 5 – RECEIVABLES Receivable balances, net of allowance for uncollectibles, have been disaggregated by type and presented separately in the financial statements with the exception of due from governmental entities. Due from governmental entities, net of allowance for uncollectibles, as of year end for the District’s individual major funds and non-major governmental funds in the aggregate, were as follows:
General
Fund
Classroom Site Fund
E-Rate Fund
Other Federal Projects
Fund
Food
Service Fund
Non-Major
Governmental Funds
Due from other governmental entities:
Due from federal government $ $ $ 535,654 $ 288,868 $ 48,072 $ 326,772Due from state government 3,561,618 86,349 233,616
Net due from governmental entities $ 3,561,618 $ 86,349 $ 535,654 $ 288,868 $ 48,072 $ 560,388
Page 56

TOLLESON ELEMENTARY SCHOOL DISTRICT NO. 17 NOTES TO FINANCIAL STATEMENTS
JUNE 30, 2016
NOTE 6 – CAPITAL ASSETS A summary of capital asset activity for the current fiscal year follows:
Governmental Activities Beginning Balance Increase Decrease
Ending Balance
Capital assets, not being depreciated: Land $ 7,870,817 $ $ $ 7,870,817 Construction in progress 184,347 591,185 209,060 566,472
Total capital assets, not being depreciated 8,055,164 591,185 209,060 8,437,289
Capital assets, being depreciated: Land improvements 4,563,273 216,407 4,779,680 Buildings and improvements 52,357,477 67,142 37,375 52,387,244 Vehicles, furniture and equipment 2,391,457 126,424 112,469 2,405,412
Total capital assets being depreciated 59,312,207 409,973 149,844 59,572,336 Less accumulated depreciation for:
Land improvements (1,147,283) (188,599) (1,335,882)Buildings and improvements (10,867,698) (971,839) (7,475) (11,832,062)Vehicles, furniture and equipment (1,485,265) (179,996) (94,704) (1,570,557)
Total accumulated depreciation (13,500,246) (1,340,434) (102,179) (14,738,501)
Total capital assets, being depreciated, net 45,811,961 (930,461) 47,665 44,833,835 Governmental activities capital assets, net $ 53,867,125 $ (339,276) $ 256,725 $ 53,271,124
Depreciation expense was charged to governmental functions as follows:
Instruction $ 789,201 Support services – students and staff 28,461 Support services – administration 202,269 Operation and maintenance of plant services 194,373 Student transportation services 85,461 Operation of non-instructional services 40,669 Total depreciation expense – governmental activities $ 1,340,434
Construction Commitments – At year end, the District had contractual commitments related to a re-roofing project of a school site. At year end, the District had spent $566,472 on the project and had estimated remaining contractual commitments of $37,914. This project is being funded with Building Renewal Grant and Bond Building monies.
Page 57

TOLLESON ELEMENTARY SCHOOL DISTRICT NO. 17 NOTES TO FINANCIAL STATEMENTS
JUNE 30, 2016
NOTE 7 – OBLIGATIONS UNDER OPERATING LEASES
The District leases various technology equipment under the provisions of a long-term lease agreement classified as an operating lease for accounting purposes. There were no rental expenditures under the terms of the operating lease for the current fiscal year. The operating lease has a remaining noncancelable lease term of one year. The future minimum rental payment required under the operating lease at year end was $146,007 for the year ended June 30, 2017.
NOTE 8 – GENERAL OBLIGATION BONDS PAYABLE
Bonds payable at year end, consisted of the following outstanding general obligation bonds. The bonds are both callable and noncallable with interest payable semiannually. Property taxes from the Debt Service Fund are used to pay bonded debt.
Purpose
Original Amount Issued
Interest Rates
Remaining Maturities
Outstanding Principal
June 30, 20156 Due Within One Year
Governmental activities: School Improvement Bonds Project of 2006, Series A (2007) $ 4,545,000
4.00-4.50% 7/1/16-22 $ 2,960,000 $ 370,000
School Improvement Bonds Project of 2006, Series B (2008) 5,045,000
4.00-5.00% 7/1/16-28 2,210,000 125,000
School Improvement Bonds, Project of 2006, Series E (2011) 2,960,000
3.50-4.25% 7/1/16-21 2,660,000 450,000
Total $ 7,830,000 $ 945,000 Annual debt service requirements to maturity on general obligation bonds at year end are summarized as follows:
Governmental Activities Year ending June 30: Principal Interest
2017 $ 945,000 $ 312,332 2018 930,000 274,382 2019 970,000 235,032 2020 1,005,000 194,107 2021 1,045,000 151,632 2022-26 2,300,000 304,095 2027-29 635,000 44,748
Total $ 7,830,000 $ 1,516,328
Page 58
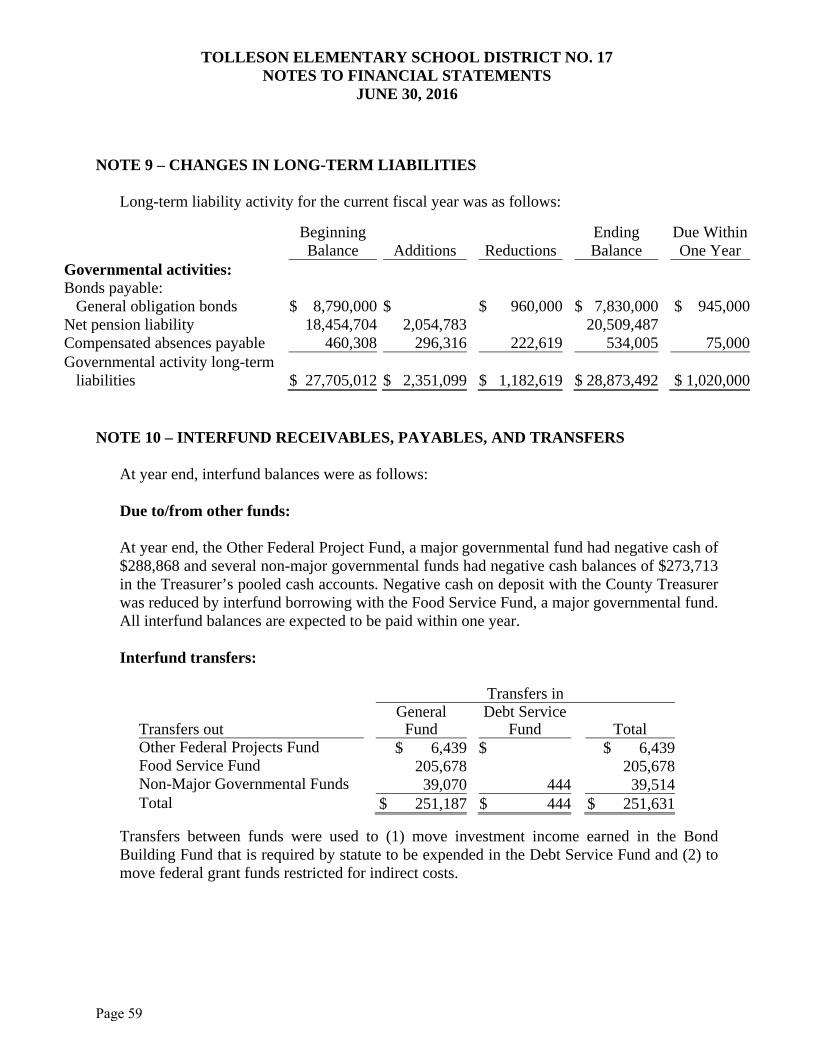
TOLLESON ELEMENTARY SCHOOL DISTRICT NO. 17 NOTES TO FINANCIAL STATEMENTS
JUNE 30, 2016
NOTE 9 – CHANGES IN LONG-TERM LIABILITIES Long-term liability activity for the current fiscal year was as follows:
Beginning Balance Additions Reductions
Ending Balance
Due Within One Year
Governmental activities: Bonds payable: General obligation bonds $ 8,790,000 $ $ 960,000 $ 7,830,000 $ 945,000 Net pension liability 18,454,704 2,054,783 20,509,487 Compensated absences payable 460,308 296,316 222,619 534,005 75,000 Governmental activity long-term
liabilities $ 27,705,012 $ 2,351,099 $ 1,182,619 $ 28,873,492 $ 1,020,000 NOTE 10 – INTERFUND RECEIVABLES, PAYABLES, AND TRANSFERS
At year end, interfund balances were as follows: Due to/from other funds: At year end, the Other Federal Project Fund, a major governmental fund had negative cash of $288,868 and several non-major governmental funds had negative cash balances of $273,713 in the Treasurer’s pooled cash accounts. Negative cash on deposit with the County Treasurer was reduced by interfund borrowing with the Food Service Fund, a major governmental fund. All interfund balances are expected to be paid within one year. Interfund transfers:
Transfers in
Transfers out General
Fund Debt Service
Fund Total Other Federal Projects Fund $ 6,439 $ $ 6,439Food Service Fund 205,678 205,678Non-Major Governmental Funds 39,070 444 39,514Total $ 251,187 $ 444 $ 251,631
Transfers between funds were used to (1) move investment income earned in the Bond Building Fund that is required by statute to be expended in the Debt Service Fund and (2) to move federal grant funds restricted for indirect costs.
Page 59

TOLLESON ELEMENTARY SCHOOL DISTRICT NO. 17 NOTES TO FINANCIAL STATEMENTS
JUNE 30, 2016
NOTE 11 – CONTINGENT LIABILITIES Compliance – Amounts received or receivable from grantor agencies are subject to audit and adjustment by grantor agencies, principally the federal government. Any disallowed claims, including amounts already collected, may constitute a liability of the applicable funds. The amount, if any, of expenditures/expenses that may be disallowed by the grantor cannot be determined at this time, although the District expects such amounts, if any, to be immaterial.
NOTE 12 – PRIOR PERIOD ADJUSTMENT
The July 1, 2015, government-wide net position and the fund balance of the Internal Service Fund do not agree to the prior year financial statements due to a correction of an error. The District presented the Employee Benefits Fund, a proprietary fund, as an agency fund in the prior year.
Statement of
Activities Internal
Service Fund Net position, June 30, 2015, as
previously reported $ 34,729,803 $ Reclassification of the Employee
Benefits Fund 1,988,542 1,988,542 Net position, July 1, 2015, as restated $ 36,718,345 $ 1,988,542
NOTE 13 – RISK MANAGEMENT
The District is exposed to various risks of loss related to torts; theft of, damage to, and destruction of assets; errors and omissions; injuries to employees; and natural disasters. The District was unable to obtain general property and liability insurance at a cost it considered to be economically justifiable. Therefore, the District joined the Arizona School Risk Retention Trust, Inc. (ASRRT). ASRRT is a public entity risk pool currently operating as a common risk management and insurance program for school districts and community colleges in the State. The District pays an annual premium to ASRRT for its general insurance coverage. The agreement provides that ASRRT will be self-sustaining through member premiums and will reinsure through commercial companies for claims in excess of specified amounts.
Page 60

TOLLESON ELEMENTARY SCHOOL DISTRICT NO. 17 NOTES TO FINANCIAL STATEMENTS
JUNE 30, 2016
NOTE 13 – RISK MANAGEMENT The District joined the Arizona School Alliance for Workers’ Compensation, Inc. (Alliance) together with other school districts in the state for risks of loss related to workers’ compensation claims. The Alliance is a public entity risk pool currently operating as a common risk management and insurance program for school districts in the State. The District pays quarterly premiums to the Alliance for its employee workers’ compensation coverage. The agreement provides that the Alliance will be self-sustaining through members’ premiums and will reinsure through commercial companies for claims in excess of specified amounts for each insured event. The District’s employees have health and accident insurance coverage with the Valley Schools Employee Benefit Trust (VSEBT). VSEBT is a public entity risk pool currently operating as a common risk management and insurance program for school districts in the State. The District pays a monthly premium to VSEBT for employees’ health and accident insurance coverage. The agreement provides that VSEBT will be self-sustaining through members’ premiums and will reinsure through commercial companies for claims in excess of specified amounts for each insured event.
NOTE 14 – PENSIONS AND OTHER POSTEMPLOYMENT BENEFITS
Plan Description. District employees participate in the Arizona State Retirement System (ASRS). The ASRS administers a cost-sharing multiple-employer defined benefit pension plan, a cost-sharing multiple-employer defined benefit health insurance premium benefit (OPEB) plan, and a cost-sharing multiple-employer defined benefit long-term disability (OPEB) plan. The Arizona State Retirement System Board governs the ASRS according to the provisions of A.R.S. Title 38, Chapter 5, Articles 2 and 2.1. ASRS is a component unit of the State of Arizona. The ASRS issues a publicly available financial report that includes its financial statements and required supplementary information. The report is available on the ASRS website at www.azasrs.gov.
Page 61

TOLLESON ELEMENTARY SCHOOL DISTRICT NO. 17 NOTES TO FINANCIAL STATEMENTS
JUNE 30, 2016
NOTE 14 – PENSIONS AND OTHER POSTEMPLOYMENT BENEFITS Benefits Provided. The ASRS provides retirement, health insurance premium supplement, long-term disability, and survivor benefits. State statute establishes benefit terms. Retirement benefits are calculated on the basis of age, average monthly compensation, and service credit as follows:
Retirement Initial Membership Date:
Before July 1, 2011 On or After July 1, 2011 Years of service and
age required to receive benefit
Sum of years and age equals 80 10 years age 62 5 years age 50* Any years age 65
30 years age 55 25 years age 60 10 years age 62 5 years age 50* Any years age 65
Final average salary is
based on Highest 36 months of last
120 months Highest 60 months of last
120 months Benefit percent per
year of service 2.1% to 2.3% 2.1% to 2.3%
*With actuarially reduced benefits
Retirement benefits for members who joined the ASRS prior to September 13, 2013, are subject to automatic cost-of-living adjustments based on excess investment earnings. Members with a membership date on or after September 13, 2013, are not eligible for cost-of-living adjustments. Survivor benefits are payable upon a member’s death. For retired members, the survivor benefit is determined by the retirement benefit option chosen. For all other members, the beneficiary is entitled to the member’s account balance that includes the member’s contributions and employer’s contributions, plus interest earned. Contributions. In accordance with state statutes, annual actuarial valuations determine active member and employer contribution requirements. The combined active member and employer contribution rates are expected to finance the costs of benefits employees earn during the year, with an additional amount to finance any unfunded accrued liability. For the current fiscal year, active ASRS members were required by statute to contribute at the actuarially determined rate of 11.47 percent (11.35 percent for retirement and 0.12 percent for long-term disability) of the members’ annual covered payroll, and the District was required by statute to contribute at the actuarially determined rate of 11.47 percent (10.85 percent for retirement, 0.50 percent for health insurance premium benefit, and 0.12 percent for long-term disability) of the active members’ annual covered payroll. The District’s contributions to the pension plan for the year ended June 30, 2016 were $1,355,027.
Page 62

TOLLESON ELEMENTARY SCHOOL DISTRICT NO. 17 NOTES TO FINANCIAL STATEMENTS
JUNE 30, 2016
NOTE 14 – PENSIONS AND OTHER POSTEMPLOYMENT BENEFITS In addition, the District was required by statute to contribute at the actuarially determined rate of 9.36 percent (9.17 for retirement and 0.13 percent for health insurance premium benefit, and 0.06 percent for long-term disability) of annual covered payroll of retired members who worked in positions that would typically be filled by an employee who contributes to ASRS.
The District’s contributions for the current and two preceding years for OPEB, all of which were equal to the required contributions, were as follows:
Health Benefit Supplement
Fund
Long-Term Disability
Fund Year ending June 30:
2016 $ 62,444 $ 14,4812015 69,610 14,158 2014 65,720 26,288
Pension Liability. At June 30, 2016, the District reported a liability of $20,509,487 for its proportionate share of the net pension liability of the ASRS. The net pension liability was measured as of June 30, 2015. The total pension liability used to calculate the net pension liability was determined using update procedures to roll forward the total pension liability from an actuarial valuation as of June 30, 2014, to the measurement date of June 30, 2015. The District’s proportion of the net pension liability was based on a projection of the District’s long-term share of contributions to the pension plan relative to the projected contributions of all participating employers, actuarially determined. At June 30, 2015, the District’s proportion was 0.13 percent which was an increase of 0.01 from its proportion measured as of June 30, 2014.
Pension Expense and Deferred Outflows/Inflows of Resources. For the year ended June 30, 2016, the District recognized pension expense of $1,469,840 and reported deferred outflows of resources and deferred inflows of resources related to pensions from the following sources:
Deferred Outflows of Resources
Deferred Inflows of Resources
Differences between expected and actual experience $ 559,659 $ 1,074,718Net difference between projected and actual earnings on
pension plan investments 657,284 Changes in proportion and differences between
contributions and proportionate share of contributions 844,796 Contributions subsequent to the measurement date 1,355,027
Total $ 2,759,482 $ 1,732,002
Page 63

TOLLESON ELEMENTARY SCHOOL DISTRICT NO. 17 NOTES TO FINANCIAL STATEMENTS
JUNE 30, 2016
NOTE 14 – PENSIONS AND OTHER POSTEMPLOYMENT BENEFITS The deferred outflows of resources related to pensions resulting from contributions subsequent to the measurement date as reported in the table above will be recognized as a reduction of the net pension liability in the year ended June 30, 2017. Other amounts reported as deferred outflows of resources and deferred inflows of resources related to pensions will be recognized in pension expense as follows:
Year Ending June 30: 2017 $ (34,908)2018 (364,236)2019 (402,878)2020 474,475
Actuarial Assumptions. The significant actuarial assumptions used to measure the total pension liability are as follows:
Actuarial valuation date June 30, 2014 Actuarial roll forward date June 30, 2015 Actuarial cost method Entry age normal Investment rate of return 8.0% Projected salary increases 3.0-6.75% Inflation 3.0% Permanent base increases Included Mortality rates 1994 GAM Scale BB
The actuarial assumptions used in the June 30, 2014 valuation were based on the results of an actuarial experience study for the five-year period ended June 30, 2012. The purpose of the experience study was to review actual experience in relation to the actuarial assumptions in effect. The ASRS Board adopted the experience study recommended changes which were applied to the June 30, 2013, actuarial valuation. The study did not include an analysis of the assumed investment rate of return. The long-term expected rate of return on ASRS pension plan investments was determined to be 8.79 percent using a building-block method in which best-estimate ranges of expected future real rates of return (expected returns, net of pension plan investment expense and inflation) are developed for each major asset class. These ranges are combined to produce the long-term expected rate of return by weighting the expected future real rates of return by the target asset allocation percentage and by adding expected inflation.
Page 64
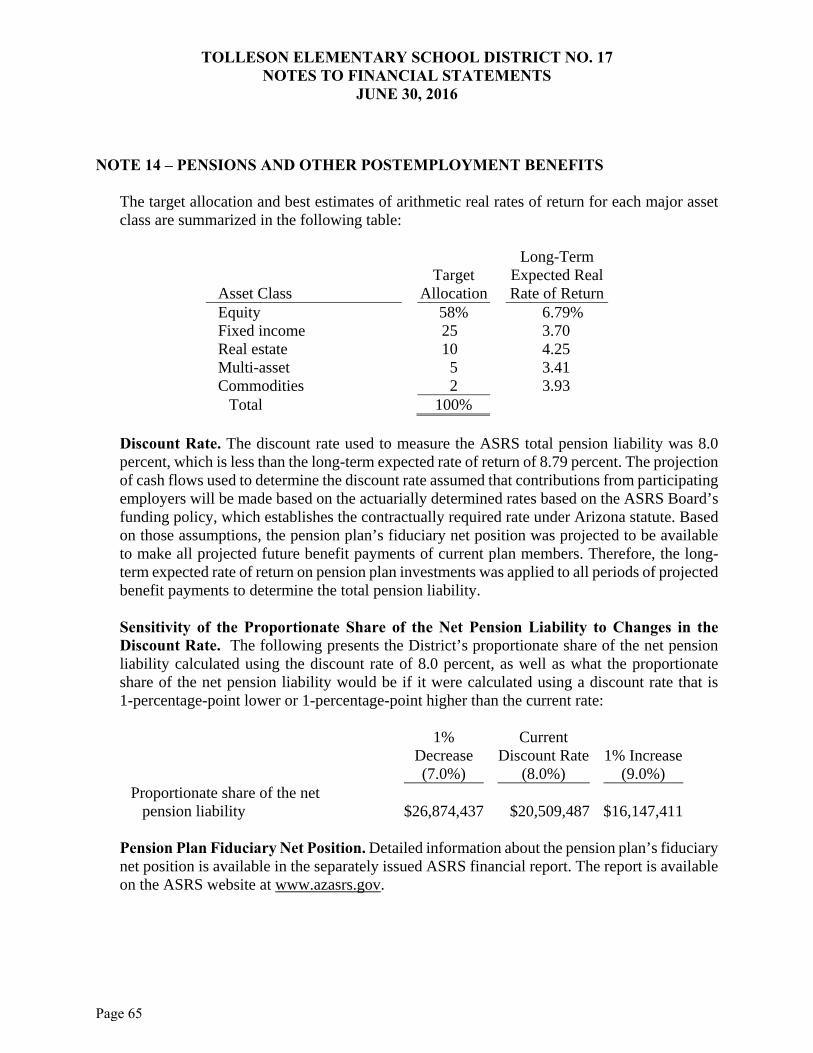
TOLLESON ELEMENTARY SCHOOL DISTRICT NO. 17 NOTES TO FINANCIAL STATEMENTS
JUNE 30, 2016
NOTE 14 – PENSIONS AND OTHER POSTEMPLOYMENT BENEFITS
The target allocation and best estimates of arithmetic real rates of return for each major asset class are summarized in the following table:
Asset Class Target
Allocation
Long-Term Expected Real Rate of Return
Equity 58% 6.79% Fixed income 25 3.70 Real estate 10 4.25 Multi-asset 5 3.41 Commodities 2 3.93
Total 100%
Discount Rate. The discount rate used to measure the ASRS total pension liability was 8.0 percent, which is less than the long-term expected rate of return of 8.79 percent. The projection of cash flows used to determine the discount rate assumed that contributions from participating employers will be made based on the actuarially determined rates based on the ASRS Board’s funding policy, which establishes the contractually required rate under Arizona statute. Based on those assumptions, the pension plan’s fiduciary net position was projected to be available to make all projected future benefit payments of current plan members. Therefore, the long-term expected rate of return on pension plan investments was applied to all periods of projected benefit payments to determine the total pension liability.
Sensitivity of the Proportionate Share of the Net Pension Liability to Changes in the Discount Rate. The following presents the District’s proportionate share of the net pension liability calculated using the discount rate of 8.0 percent, as well as what the proportionate share of the net pension liability would be if it were calculated using a discount rate that is 1-percentage-point lower or 1-percentage-point higher than the current rate:
1% Decrease (7.0%)
Current Discount Rate
(8.0%) 1% Increase
(9.0%) Proportionate share of the net
pension liability $26,874,437 $20,509,487 $16,147,411
Pension Plan Fiduciary Net Position. Detailed information about the pension plan’s fiduciary net position is available in the separately issued ASRS financial report. The report is available on the ASRS website at www.azasrs.gov.
Page 65

(This page intentionally left blank)
Page 66

REQUIRED SUPPLEMENTARY INFORMATION
Page 67
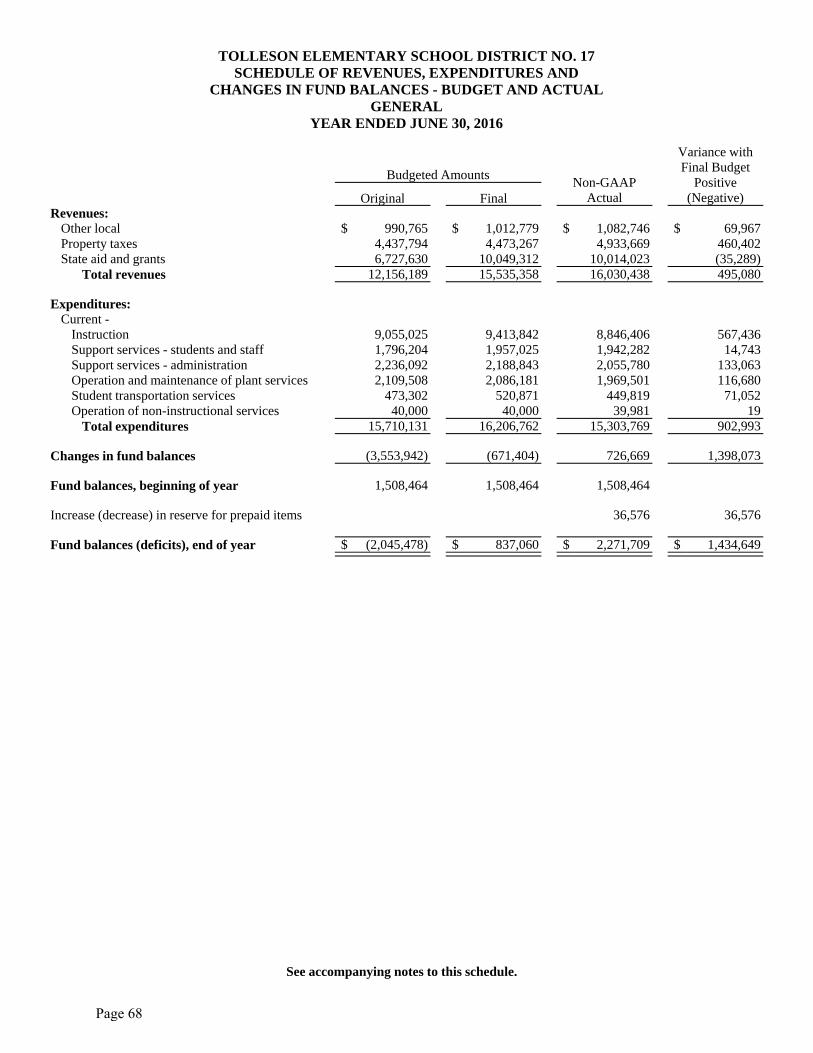
Revenues:Other localProperty taxesState aid and grants
Total revenues
Expenditures:Current -
InstructionSupport services - students and staffSupport services - administrationOperation and maintenance of plant servicesStudent transportation servicesOperation of non-instructional services
Total expenditures
Changes in fund balances
Fund balances, beginning of year
Increase (decrease) in reserve for prepaid items
Fund balances (deficits), end of year
Budgeted Amounts
Original
$ 990,7654,437,7946,727,630
12,156,189
9,055,0251,796,2042,236,0922,109,508
473,30240,000
15,710,131
(3,553,942)
1,508,464
$ (2,045,478)
Final
$ 1,012,7794,473,267
10,049,31215,535,358
9,413,8421,957,0252,188,8432,086,181
520,87140,000
16,206,762
(671,404)
1,508,464
$ 837,060
Non-GAAP Actual
$ 1,082,7464,933,669
10,014,02316,030,438
8,846,4061,942,2822,055,7801,969,501
449,81939,981
15,303,769
726,669
1,508,464
36,576
$ 2,271,709
Variance with Final Budget
Positive (Negative)
$ 69,967460,402(35,289)495,080
567,43614,743
133,063116,68071,052
19902,993
1,398,073
36,576
$ 1,434,649
TOLLESON ELEMENTARY SCHOOL DISTRICT NO. 17SCHEDULE OF REVENUES, EXPENDITURES AND
CHANGES IN FUND BALANCES - BUDGET AND ACTUALGENERAL
YEAR ENDED JUNE 30, 2016
See accompanying notes to this schedule.
Page 68

Revenues:Other localState aid and grants
Total revenues
Expenditures:Current -
InstructionSupport services - students and staff
Total expenditures
Changes in fund balances
Fund balances, beginning of year
Fund balances (deficits), end of year
Budgeted Amounts
Original
$677,458677,458
3,589,094146,569
3,735,663
(3,058,205)
2,204,090
$ (854,115)
Final
$ 7,494690,795698,289
3,589,094146,569
3,735,663
(3,037,374)
2,204,090
$ (833,284)
Actual
$ 11,7681,036,1921,047,960
549,319146,662695,981
351,979
2,204,090
$ 2,556,069
Variance with Final Budget
Positive (Negative)
$ 4,274345,397349,671
3,039,775(93)
3,039,682
3,389,353
$ 3,389,353
TOLLESON ELEMENTARY SCHOOL DISTRICT NO. 17SCHEDULE OF REVENUES, EXPENDITURES AND
CHANGES IN FUND BALANCES - BUDGET AND ACTUALCLASSROOM SITE
YEAR ENDED JUNE 30, 2016
See accompanying notes to this schedule.
Page 69

Revenues:Federal aid, grants and reimbursements
Total revenues
Expenditures:Current -
Operation and maintenance of plant servicesCapital outlay
Total expenditures
Changes in fund balances
Fund balances, beginning of year
Fund balances (deficits), end of year
Budgeted Amounts
Original
$ 44,83944,839
401,15321,357
422,510
(377,671)
12,887
$ (364,784)
Final
$ 313,303313,303
301,32416,042
317,366
(4,063)
12,887
$ 8,824
Actual
$ 485,639485,639
232,42212,374
244,796
240,843
12,887
$ 253,730
Variance with Final Budget
Positive (Negative)
$ 172,336172,336
68,9023,668
72,570
244,906
$ 244,906
TOLLESON ELEMENTARY SCHOOL DISTRICT NO. 17SCHEDULE OF REVENUES, EXPENDITURES AND
CHANGES IN FUND BALANCES - BUDGET AND ACTUALE-RATE
YEAR ENDED JUNE 30, 2016
See accompanying notes to this schedule.
Page 70

Revenues:Federal aid, grants and reimbursements
Total revenues
Expenditures:Current -
InstructionSupport services - students and staff
Capital outlayTotal expenditures
Excess (deficiency) of revenues over expenditures
Other financing sources (uses):Transfers out
Total other financing sources (uses):
Changes in fund balances
Fund balances (deficits), beginning of year
Fund balances (deficits), end of year
Budgeted Amounts
Original
$
382,04633,352
593415,991
(415,991)
(415,991)
(42,804)
$ (458,795)
Final
$ 88,00188,001
370,03732,304
574402,915
(314,914)
(314,914)
(42,804)
$ (357,718)
Actual
$ 465,305465,305
382,09333,356
593416,042
49,263
(6,439)(6,439)
42,824
(42,824)
$
Variance with Final Budget
Positive (Negative)
$ 377,304377,304
(12,056)(1,052)
(19)(13,127)
364,177
(6,439)(6,439)
357,738
(20)
$ 357,718
TOLLESON ELEMENTARY SCHOOL DISTRICT NO. 17SCHEDULE OF REVENUES, EXPENDITURES AND
CHANGES IN FUND BALANCES - BUDGET AND ACTUALOTHER FEDERAL PROJECTSYEAR ENDED JUNE 30, 2016
See accompanying notes to this schedule.
Page 71

Revenues:Other localFederal aid, grants and reimbursements
Total revenues
Expenditures:Current -
Operation and maintenance of plant servicesOperation of non-instructional services
Capital outlayTotal expenditures
Excess (deficiency) of revenues over expenditures
Other financing sources (uses):Transfers out
Total other financing sources (uses):
Changes in fund balances
Fund balances, beginning of year
Fund balances (deficits), end of year
Budgeted Amounts
Original
$ 158,0141,873,6182,031,632
7,8302,639,165
153,0052,800,000
(768,368)
(768,368)
710,625
$ (57,743)
Final
$ 207,2391,873,6182,080,857
8,6482,914,829
168,9863,092,463
(1,011,606)
(1,011,606)
710,625
$ (300,981)
Actual
$ 234,0282,430,1542,664,182
5,7751,946,572
112,8522,065,199
598,983
(205,678)(205,678)
393,305
710,625
$ 1,103,930
Variance with Final Budget
Positive (Negative)
$ 26,789556,536583,325
2,873968,25756,134
1,027,264
1,610,589
(205,678)(205,678)
1,404,911
$ 1,404,911
TOLLESON ELEMENTARY SCHOOL DISTRICT NO. 17SCHEDULE OF REVENUES, EXPENDITURES AND
CHANGES IN FUND BALANCES - BUDGET AND ACTUALFOOD SERVICE
YEAR ENDED JUNE 30, 2016
See accompanying notes to this schedule.
Page 72

2016 2015 2014 2013
District's proportion of the net pensionliability (asset) 0.00% 0.00% 0.00% 0.00%
District's proportionate share of the netpension liability (asset) 20,509,487$ 18,454,704$ $ $
District's covered payroll 11,798,310$ 10,953,271$ $ $
District's proportionate share of the net pension liability (asset) as a percentageof its covered payroll 173.83% 168.49% #DIV/0! #DIV/0!
Plan fiduciary net position as a percentage of the total pension liability 68.35% 69.49% 0.00% 0.00%
2016 2015 2014 2013
Actuarially determined contribution 1,355,027$ 1,284,836$ $ $
Contributions in relation to the actuarially determined contribution 1,355,027 1,284,836
Contribution deficiency (excess) $ $
District's covered payroll 12,488,728$ 11,798,310$ $ $
Contributions as a percentageof covered payroll 10.85% 10.89% #DIV/0! #DIV/0!
NOTE:
TOLLESON ELEMENTARY SCHOOL DISTRICT NO. 17SCHEDULE OF THE PROPORTIONATE SHARE OF THE NET PENSION LIABILITY
ARIZONA STATE RETIREMENT SYSTEMLAST TWO FISCAL YEARS
The pension schedules in the required supplementary information are intended to show information for ten years, and additional information will be displayed as it becomes available.
SCHEDULE OF CONTRIBUTIONSARIZONA STATE RETIREMENT SYSTEM
LAST TWO FISCAL YEARS
See accompanying notes to this schedule.Page 73

TOLLESON ELEMENTARY SCHOOL DISTRICT NO. 17 NOTES TO REQUIRED SUPPLEMENTARY INFORMATION
JUNE 30, 2016
NOTE 1 – BUDGETARY BASIS OF ACCOUNTING The District budget is prepared on a basis consistent with accounting principles generally accepted in the United States of America, except for the following items.
Certain activities reported in the General Fund are budgeted in separate funds in accordance with Arizona Revised Statutes.
Prepaid items are budgeted in the year prepaid. The following schedule reconciles expenditures and fund balances at the end of year:
Total
Expenditures Fund Balances
End of Year Statement of Revenues, Expenditures and Changes in
Fund Balances – Governmental Funds $ 15,595,816 $ 3,336,711 Activity budgeted as special revenue funds (792,319) (1,065,002)Current-year prepaid items 500,272
Schedule of Revenues, Expenditures and Changes in Fund Balances – Budget and Actual – General Fund $ 15,303,769 $ 2,271,709
NOTE 2 – PENSION PLAN SCHEDULES Change in Accounting Principle. For the year ended June 30, 2016, the District implemented the provisions of GASB Statement No. 82, Pension Issues. The statement changed the measure of payroll that is required to be presented in required supplementary information from covered-employee payroll to covered payroll. Accordingly, payroll amounts presented in the pension plan schedules and related ratios for prior periods have been restated. Actuarial Assumptions for Valuations Performed. The information presented in the required supplementary schedules was determined as part of the actuarial valuations at the dates indicated, which is the most recent actuarial valuation. The actuarial assumptions used are disclosed in the notes to the financial statements. Factors that Affect Trends. The actuarial assumptions used in the June 30, 2014, valuation were based on the results of an actuarial experience study for the five-year period ended June 30, 2012. The purpose of the experience study was to review actual experience in relation to the actuarial assumptions in effect. The ASRS Board adopted the experience study recommended changes which were applied to the June 30, 2014, actuarial valuation. The study did not include an analysis of the assumed investment rate of return.
Page 74

COMBINING AND INDIVIDUAL FUND FINANCIAL STATEMENTS
AND SCHEDULES
Page 75

(This page intentionally left blank)
Page 76
GOVERNMENTAL FUNDS
Page 77

ASSETSCash and investmentsProperty taxes receivableAccounts receivableDue from governmental entities
Total assets
LIABILITIES, DEFERRED INFLOWS OF RESOURCES AND FUND BALANCESLiabilities:
Accounts payableConstruction contracts payableDue to other fundsAccrued payroll and employee benefits
Total liabilities
Deferred inflows of resources:Unavailable revenues - property taxes
Fund balances:Restricted
Total fund balances
Total liabilities, deferred inflows of resourcesand fund balances
Special Revenue
$ 616,386
56,482389,364
$ 1,062,232
$ 72,627
273,71336,290
382,630
679,602679,602
$ 1,062,232
Capital Projects
$ 856,48414,763
171,024$ 1,042,271
$ 35,852181,081
216,933
11,751
813,587813,587
$ 1,042,271
Total Non-Major
Governmental Fund
$ 1,472,87014,76356,482
560,388$ 2,104,503
$ 108,479181,081273,713
36,290599,563
11,751
1,493,1891,493,189
$ 2,104,503
TOLLESON ELEMENTARY SCHOOL DISTRICT NO. 17COMBINING BALANCE SHEET - ALL NON-MAJOR GOVERNMENTAL FUNDS - BY FUND TYPE
JUNE 30, 2016
Page 78

Revenues:Other localProperty taxesState aid and grantsFederal aid, grants and reimbursements
Total revenues
Expenditures:Current -
InstructionSupport services - students and staffSupport services - administrationOperation and maintenance of plant servicesStudent transportation servicesOperation of non-instructional services
Capital outlayTotal expenditures
Excess (deficiency) of revenues over expenditures
Other financing sources (uses):Transfers out
Total other financing sources (uses):
Changes in fund balances
Fund balances, beginning of year
Fund balances, end of year
Special Revenue
$ 203,045
620,2221,680,1792,503,446
1,540,996753,008194,054
9,2744,450
26,0662,527,848
(24,402)
(39,070)(39,070)
(63,472)
743,074
$ 679,602
Capital Projects
$ 55,976896,339535,631
1,487,946
3,471
2,019,6412,023,112
(535,166)
(444)(444)
(535,610)
1,349,197
$ 813,587
Total Non-Major
Governmental Funds
$ 259,021896,339
1,155,8531,680,1793,991,392
1,540,996753,008194,054
3,4719,2744,450
2,045,7074,550,960
(559,568)
(39,514)(39,514)
(599,082)
2,092,271
$ 1,493,189
TOLLESON ELEMENTARY SCHOOL DISTRICT NO. 17COMBINING STATEMENT OF REVENUES, EXPENDITURES AND CHANGES IN FUND BALANCES -
ALL NON-MAJOR GOVERNMENTAL FUNDS - BY FUND TYPEYEAR ENDED JUNE 30, 2016
Page 79

SPECIAL REVENUE FUNDS Instructional Improvement - to account for the activity of monies received from gaming revenue. County, City and Town Grants - to account for monies received from county, city and town grants. Title I Grants - to account for financial assistance received for the purpose of improving the teaching and learning of children failing, or most at-risk of failing, to meet challenging state academic standards. Professional Development and Technology Grants - to account for financial assistance received to increase student academic achievement through improving teacher quality. Title IV Grants - to account for financial assistance received for chemical abuse awareness programs and expanding projects that benefit educational and health needs of the communities. Limited English and Immigrant Students - to account for financial assistance received for educational services and costs for limited English and immigrant children. Special Education Grants - to account for supplemental financial assistance received to provide a free, appropriate public education to disabled children. Homeless Education - to account for financial assistance received for the education of homeless students. Medicaid Reimbursement - to account for reimbursements related to specific health services provided to eligible students. Other State Projects - to account for financial assistance received for other state projects. School Plant - to account for proceeds from the sale or lease of school property. Civic Center - to account for monies received from the rental of school facilities for civic activities. Community School - to account for activity related to academic and skill development for all citizens. Auxiliary Operations - to account for activity arising from bookstore, athletic and miscellaneous District related operations. Extracurricular Activities Fees Tax Credit - to account for activity related to monies collected in support of extracurricular activities to be taken as a tax credit by the tax payer in accordance with A.R.S. §43-1089.01.
Page 80

Gifts and Donations - to account for activity related to gifts, donations, bequests and private grants made to the District. Fingerprint - to account for activity of fingerprinting employees as mandated by the State. Textbooks - to account for monies received from students to replace or repair lost or damaged textbooks. Indirect Costs - to account for monies received from federal projects for administrative costs. Insurance Refund - to account for insurance premium payments that are refunded to the District. Grants and Gifts to Teachers - to account for grants and gifts under $1,500 received from private sources that are restricted for use by a teacher for instructional purposes.
Page 81

ASSETSCash and investmentsAccounts receivableDue from governmental entities
Total assets
LIABILITIES AND FUND BALANCESLiabilities:
Accounts payableDue to other fundsAccrued payroll and employee benefits
Total liabilities
Fund balances:Restricted
Total fund balances
Total liabilities and fund balances
Instructional Improvement
$ 200,603
29,857$ 230,460
$
7,5567,556
222,904222,904
$ 230,460
County, City, and Town
Grants
$ 132
$ 132
$
132132
$ 132
Title I Grants
$
52,402$ 52,402
$ 30,69321,709
52,402
$ 52,402
TOLLESON ELEMENTARY SCHOOL DISTRICT NO. 17COMBINING BALANCE SHEET - NON-MAJOR SPECIAL REVENUE FUNDS
JUNE 30, 2016
Page 82

Professional Development
and Technology Grants
$
18,608$ 18,608
$ 8,08810,520
18,608
$ 18,608
Title IV Grants
$
110,603$ 110,603
$ 10,67180,82719,105
110,603
$ 110,603
Limited English and Immigrant
Students
$
20,535$ 20,535
$ 4,6568,9986,881
20,535
$ 20,535
Special Education
Grants
$
115,456$ 115,456
$115,456
115,456
$ 115,456
Homeless Education
$
9,168$ 9,168
$ 6,8002,368
9,168
$ 9,168
Other State Projects
$
32,735$ 32,735
$32,735
32,735
$ 32,735
(Continued)
Page 83
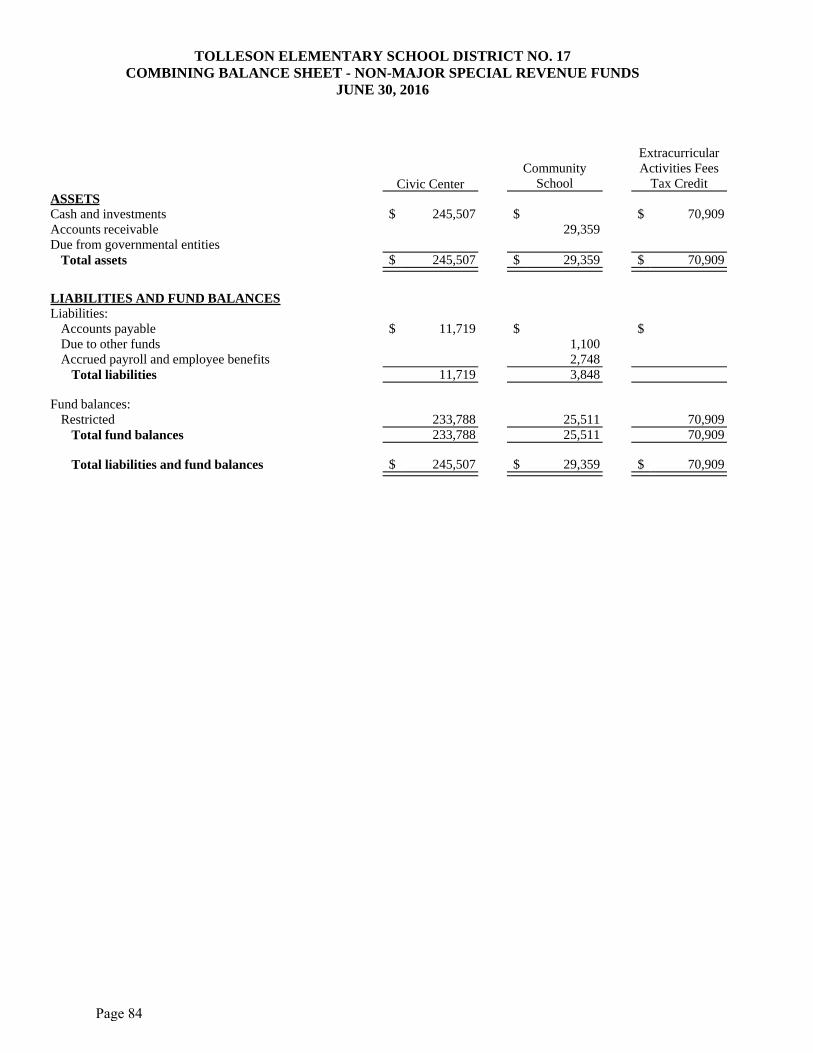
ASSETSCash and investmentsAccounts receivableDue from governmental entities
Total assets
LIABILITIES AND FUND BALANCESLiabilities:
Accounts payableDue to other fundsAccrued payroll and employee benefits
Total liabilities
Fund balances:Restricted
Total fund balances
Total liabilities and fund balances
Civic Center
$ 245,507
$ 245,507
$ 11,719
11,719
233,788233,788
$ 245,507
Community School
$29,359
$ 29,359
$1,1002,7483,848
25,51125,511
$ 29,359
Extracurricular Activities Fees
Tax Credit
$ 70,909
$ 70,909
$
70,90970,909
$ 70,909
TOLLESON ELEMENTARY SCHOOL DISTRICT NO. 17COMBINING BALANCE SHEET - NON-MAJOR SPECIAL REVENUE FUNDS
JUNE 30, 2016
Page 84

Gifts and Donations
$ 44,13827,123
$ 71,261
$
71,26171,261
$ 71,261
Fingerprint
$ 1,372
$ 1,372
$
1,3721,372
$ 1,372
Textbooks
$ 13,629
$ 13,629
$
13,62913,629
$ 13,629
Insurance Refund
$ 34,707
$ 34,707
$
34,70734,707
$ 34,707
Grants and Gifts to Teachers
$ 5,389
$ 5,389
$
5,3895,389
$ 5,389
Totals
$ 616,38656,482
389,364$ 1,062,232
$ 72,627273,71336,290
382,630
679,602679,602
$ 1,062,232
Page 85

Revenues:Other localState aid and grantsFederal aid, grants and reimbursements
Total revenues
Expenditures:Current -
InstructionSupport services - students and staffSupport services - administrationStudent transportation servicesOperation of non-instructional services
Capital outlayTotal expenditures
Excess (deficiency) of revenues over expenditures
Other financing sources (uses):Transfers out
Total other financing sources (uses):
Changes in fund balances
Fund balances, beginning of year
Fund balances, end of year
Instructional Improvement
$ 1,317116,312
117,629
144,12017,5261,516
163,162
(45,533)
(45,533)
268,437
$ 222,904
County, City, and Town
Grants
$
132
$ 132
Title I Grants
$
755,122755,122
275,209434,587
23,926
733,722
21,400
(21,400)(21,400)
$
TOLLESON ELEMENTARY SCHOOL DISTRICT NO. 17COMBINING STATEMENT OF REVENUES, EXPENDITURES AND CHANGES IN FUND BALANCES -
NON-MAJOR SPECIAL REVENUE FUNDSYEAR ENDED JUNE 30, 2016
Page 86

Professional Development
and Technology Grants
$
75,56375,563
58,64915,214
73,863
1,700
(1,700)(1,700)
$
Title IV Grants
$
342,216342,216
269,8161,635
53,101918
6,735332,205
10,011
(10,011)(10,011)
$
Limited English and Immigrant
Students
$
78,71378,713
61,18716,042
835
78,064
649
(649)(649)
$
Special Education
Grants
$
408,457408,457
380,32712,13411,292
403,753
4,704
(4,704)(4,704)
$
Homeless Education
$
20,10820,108
15,754
3,748
19,502
606
(606)(606)
$
Other State Projects
$503,160
503,160
341,08287,50074,578
503,160
$
(Continued)
Page 87

Revenues:Other localState aid and grantsFederal aid, grants and reimbursements
Total revenues
Expenditures:Current -
InstructionSupport services - students and staffSupport services - administrationStudent transportation servicesOperation of non-instructional services
Capital outlayTotal expenditures
Excess (deficiency) of revenues over expenditures
Other financing sources (uses):Transfers out
Total other financing sources (uses):
Changes in fund balances
Fund balances, beginning of year
Fund balances, end of year
Civic Center
$ 28,947
28,947
1,1331,3542,623
17,16322,273
6,674
6,674
227,114
$ 233,788
Community School
$ 117,912750
118,662
56,97690,524
4,4502,168
154,118
(35,456)
(35,456)
60,967
$ 25,511
Extracurricular Activities Fees
Tax Credit
$ 21,090
21,090
3,478
3,883
7,361
13,729
13,729
57,180
$ 70,909
TOLLESON ELEMENTARY SCHOOL DISTRICT NO. 17COMBINING STATEMENT OF REVENUES, EXPENDITURES AND CHANGES IN FUND BALANCES -
NON-MAJOR SPECIAL REVENUE FUNDSYEAR ENDED JUNE 30, 2016
Page 88

Gifts and Donations
$ 30,398
30,398
5,40617,21010,485
535
33,636
(3,238)
(3,238)
74,499
$ 71,261
Fingerprint
$ 546
546
484
484
62
62
1,310
$ 1,372
Textbooks
$ 875
875
93
93
782
782
12,847
$ 13,629
Insurance Refund
$ 426
426
426
426
34,281
$ 34,707
Grants and Gifts to Teachers
$ 1,534
1,534
2,262
190
2,452
(918)
(918)
6,307
$ 5,389
Totals
$ 203,045620,222
1,680,1792,503,446
1,540,996753,008194,054
9,2744,450
26,0662,527,848
(24,402)
(39,070)(39,070)
(63,472)
743,074
$ 679,602
Page 89

Total revenues
Revenues:Other localState aid and grantsFederal aid, grants and reimbursements
Expenditures:Current -
InstructionSupport services - students and staffSupport services - administrationStudent transportation servicesOperation of non-instructional services
Capital outlayTotal expenditures
Excess (deficiency) of revenues over expenditures
Other financing sources (uses):Transfers inTransfers out
Total other financing sources (uses):
Changes in fund balances
Fund balances, beginning of year
Fund balances (deficits), end of year
Instructional Improvement
Budget
$ 835131,398
132,233
314,21338,2103,305
355,728
(223,495)
(223,495)
268,437
$ 44,942
Actual
$ 1,317116,312
117,629
144,12017,526
1,516
163,162
(45,533)
(45,533)
268,437
$ 222,904
Variance - Positive
(Negative)
$ 482(15,086)
(14,604)
170,09320,6841,789
192,566
177,962
177,962
$ 177,962
TOLLESON ELEMENTARY SCHOOL DISTRICT NO. 17COMBINING SCHEDULE OF REVENUES, EXPENDITURES AND CHANGES IN FUND BALANCES -
BUDGET AND ACTUALNON-MAJOR SPECIAL REVENUE FUNDS
YEAR ENDED JUNE 30, 2016
Page 90

County, City, and Town Grants
Budget
$
132
132
(132)
(132)
$ (132)
Actual
$
132
$ 132
Variance - Positive
(Negative)
$
132
132
132
132
132
$ 264
Title I Grants
Budget
$
1,181,4711,181,471
327,149516,607
28,442
872,198
309,273
309,273
$ 309,273
Actual
$
755,122755,122
275,209434,58723,926
733,722
21,400
(21,400)(21,400)
$
Variance - Positive
(Negative)
$
(426,349)(426,349)
51,94082,0204,516
138,476
(287,873)
(21,400)(21,400)
(309,273)
$ (309,273)
(Continued)
Page 91

Total revenues
Revenues:Other localState aid and grantsFederal aid, grants and reimbursements
Expenditures:Current -
InstructionSupport services - students and staffSupport services - administrationStudent transportation servicesOperation of non-instructional services
Capital outlayTotal expenditures
Excess (deficiency) of revenues over expenditures
Other financing sources (uses):Transfers inTransfers out
Total other financing sources (uses):
Changes in fund balances
Fund balances, beginning of year
Fund balances (deficits), end of year
Professional Development and Technology Grants
Budget
$
34,52234,522
77,30620,054
97,360
(62,838)
(62,838)
$ (62,838)
Actual
$
75,56375,563
58,64915,214
73,863
1,700
(1,700)(1,700)
$
Variance - Positive
(Negative)
$
41,04141,041
18,6574,840
23,497
64,538
(1,700)(1,700)
62,838
$ 62,838
TOLLESON ELEMENTARY SCHOOL DISTRICT NO. 17COMBINING SCHEDULE OF REVENUES, EXPENDITURES AND CHANGES IN FUND BALANCES -
BUDGET AND ACTUALNON-MAJOR SPECIAL REVENUE FUNDS
YEAR ENDED JUNE 30, 2016
Page 92
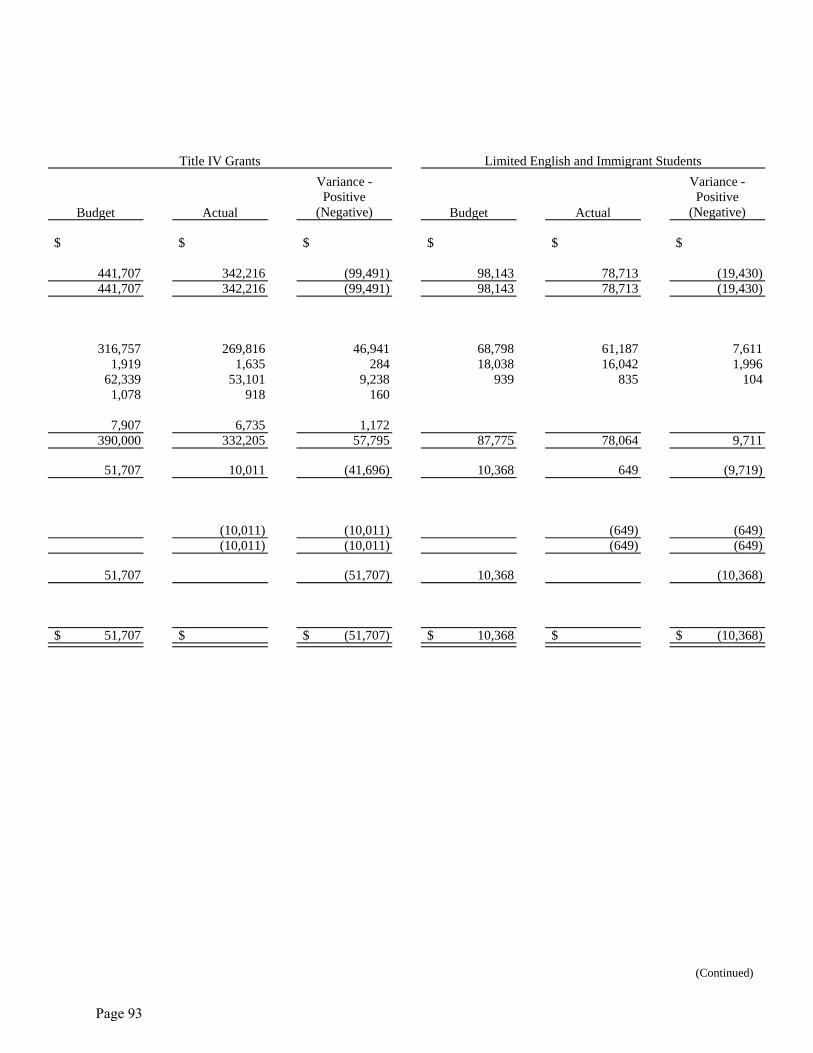
Title IV Grants
Budget
$
441,707441,707
316,7571,919
62,3391,078
7,907390,000
51,707
51,707
$ 51,707
Actual
$
342,216342,216
269,8161,635
53,101918
6,735332,205
10,011
(10,011)(10,011)
$
Variance - Positive
(Negative)
$
(99,491)(99,491)
46,941284
9,238160
1,17257,795
(41,696)
(10,011)(10,011)
(51,707)
$ (51,707)
Limited English and Immigrant Students
Budget
$
98,14398,143
68,79818,038
939
87,775
10,368
10,368
$ 10,368
Actual
$
78,71378,713
61,18716,042
835
78,064
649
(649)(649)
$
Variance - Positive
(Negative)
$
(19,430)(19,430)
7,6111,996
104
9,711
(9,719)
(649)(649)
(10,368)
$ (10,368)
(Continued)
Page 93

Total revenues
Revenues:Other localState aid and grantsFederal aid, grants and reimbursements
Expenditures:Current -
InstructionSupport services - students and staffSupport services - administrationStudent transportation servicesOperation of non-instructional services
Capital outlayTotal expenditures
Excess (deficiency) of revenues over expenditures
Other financing sources (uses):Transfers inTransfers out
Total other financing sources (uses):
Changes in fund balances
Fund balances, beginning of year
Fund balances (deficits), end of year
Special Education Grants
Budget
$
362,983362,983
396,03212,63511,758
420,425
(57,442)
(57,442)
$ (57,442)
Actual
$
408,457408,457
380,32712,13411,292
403,753
4,704
(4,704)(4,704)
$
Variance - Positive
(Negative)
$
45,47445,474
15,705501466
16,672
62,146
(4,704)(4,704)
57,442
$ 57,442
TOLLESON ELEMENTARY SCHOOL DISTRICT NO. 17COMBINING SCHEDULE OF REVENUES, EXPENDITURES AND CHANGES IN FUND BALANCES -
BUDGET AND ACTUALNON-MAJOR SPECIAL REVENUE FUNDS
YEAR ENDED JUNE 30, 2016
Page 94
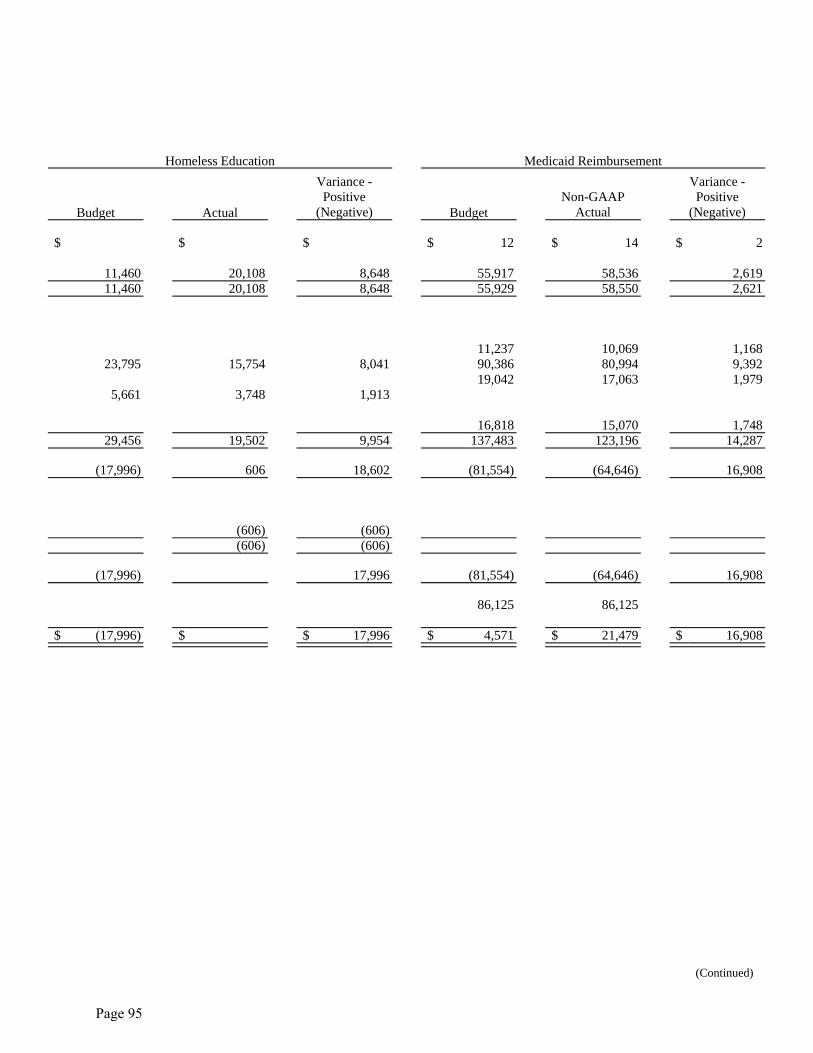
Homeless Education
Budget
$
11,46011,460
23,795
5,661
29,456
(17,996)
(17,996)
$ (17,996)
Actual
$
20,10820,108
15,754
3,748
19,502
606
(606)(606)
$
Variance - Positive
(Negative)
$
8,6488,648
8,041
1,913
9,954
18,602
(606)(606)
17,996
$ 17,996
Medicaid Reimbursement
Budget
$ 12
55,91755,929
11,23790,38619,042
16,818137,483
(81,554)
(81,554)
86,125
$ 4,571
Non-GAAP Actual
$ 14
58,53658,550
10,06980,99417,063
15,070123,196
(64,646)
(64,646)
86,125
$ 21,479
Variance - Positive
(Negative)
$ 2
2,6192,621
1,1689,3921,979
1,74814,287
16,908
16,908
$ 16,908
(Continued)
Page 95

Total revenues
Revenues:Other localState aid and grantsFederal aid, grants and reimbursements
Expenditures:Current -
InstructionSupport services - students and staffSupport services - administrationStudent transportation servicesOperation of non-instructional services
Capital outlayTotal expenditures
Excess (deficiency) of revenues over expenditures
Other financing sources (uses):Transfers inTransfers out
Total other financing sources (uses):
Changes in fund balances
Fund balances, beginning of year
Fund balances (deficits), end of year
Other State Projects
Budget
$385,642
385,642
368,60194,56080,595
543,756
(158,114)
(158,114)
$ (158,114)
Actual
$503,160
503,160
341,08287,50074,578
503,160
$
Variance - Positive
(Negative)
$117,518
117,518
27,5197,0606,017
40,596
158,114
158,114
$ 158,114
TOLLESON ELEMENTARY SCHOOL DISTRICT NO. 17COMBINING SCHEDULE OF REVENUES, EXPENDITURES AND CHANGES IN FUND BALANCES -
BUDGET AND ACTUALNON-MAJOR SPECIAL REVENUE FUNDS
YEAR ENDED JUNE 30, 2016
Page 96

School Plant
Budget
$ 27,052
27,052
42,83521,259
109,275
25,699199,068
(172,016)
(172,016)
173,955
$ 1,939
Non-GAAP Actual
$ 30,201
30,201
14,0066,951
35,730
8,40365,090
(34,889)
(34,889)
173,955
$ 139,066
Variance - Positive
(Negative)
$ 3,149
3,149
28,82914,30873,545
17,296133,978
137,127
137,127
$ 137,127
Civic Center
Budget
$ 32,182
32,182
12,89115,40529,844
195,275253,415
(221,233)
(221,233)
227,114
$ 5,881
Actual
$ 28,947
28,947
1,1331,3542,623
17,16322,273
6,674
6,674
227,114
$ 233,788
Variance - Positive
(Negative)
$ (3,235)
(3,235)
11,75814,05127,221
178,112231,142
227,907
227,907
$ 227,907
(Continued)
Page 97

Total revenues
Revenues:Other localState aid and grantsFederal aid, grants and reimbursements
Expenditures:Current -
InstructionSupport services - students and staffSupport services - administrationStudent transportation servicesOperation of non-instructional services
Capital outlayTotal expenditures
Excess (deficiency) of revenues over expenditures
Other financing sources (uses):Transfers inTransfers out
Total other financing sources (uses):
Changes in fund balances
Fund balances, beginning of year
Fund balances (deficits), end of year
Community School
Budget
$ 86,997750
87,747
67,479107,212
5,2702,568
182,529
(94,782)
(94,782)
$ (94,782)
Actual
$ 117,912750
118,662
56,97690,524
4,4502,168
154,118
(35,456)
(35,456)
60,967
$ 25,511
Variance - Positive
(Negative)
$ 30,915
30,915
10,50316,688
820400
28,411
59,326
59,326
60,967
$ 120,293
TOLLESON ELEMENTARY SCHOOL DISTRICT NO. 17COMBINING SCHEDULE OF REVENUES, EXPENDITURES AND CHANGES IN FUND BALANCES -
BUDGET AND ACTUALNON-MAJOR SPECIAL REVENUE FUNDS
YEAR ENDED JUNE 30, 2016
Page 98

Auxiliary Operations
Budget
$ 16,335
16,335
4,336
13,657
17,993
(1,658)
(1,658)
6,274
$ 4,616
Non-GAAP Actual
$ 15,625
15,625
1,887
5,943
7,830
7,795
7,795
6,274
$ 14,069
Variance - Positive
(Negative)
$ (710)
(710)
2,449
7,714
10,163
9,453
9,453
$ 9,453
Extracurricular Activities Fees Tax Credit
Budget
$ 23,186
23,186
36,179
40,392
76,571
(53,385)
(53,385)
57,180
$ 3,795
Actual
$ 21,090
21,090
3,478
3,883
7,361
13,729
13,729
57,180
$ 70,909
Variance - Positive
(Negative)
$ (2,096)
(2,096)
32,701
36,509
69,210
67,114
67,114
$ 67,114
(Continued)
Page 99
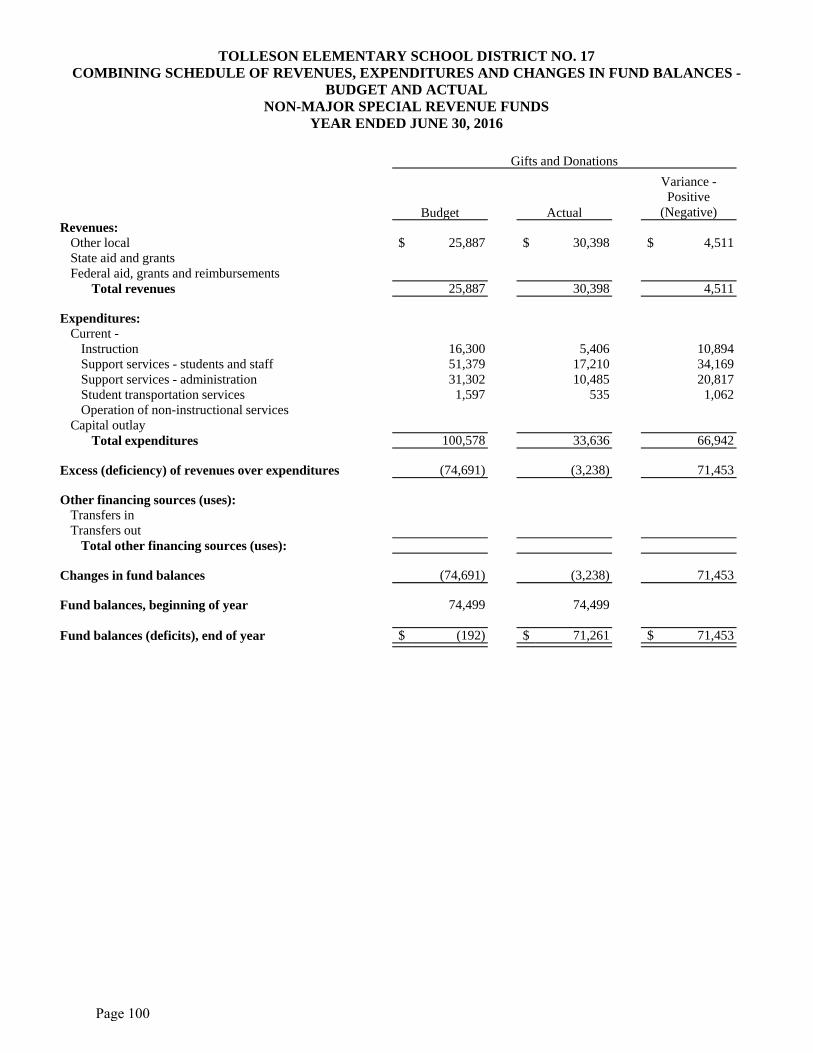
Total revenues
Revenues:Other localState aid and grantsFederal aid, grants and reimbursements
Expenditures:Current -
InstructionSupport services - students and staffSupport services - administrationStudent transportation servicesOperation of non-instructional services
Capital outlayTotal expenditures
Excess (deficiency) of revenues over expenditures
Other financing sources (uses):Transfers inTransfers out
Total other financing sources (uses):
Changes in fund balances
Fund balances, beginning of year
Fund balances (deficits), end of year
Gifts and Donations
Budget
$ 25,887
25,887
16,30051,37931,3021,597
100,578
(74,691)
(74,691)
74,499
$ (192)
Actual
$ 30,398
30,398
5,40617,21010,485
535
33,636
(3,238)
(3,238)
74,499
$ 71,261
Variance - Positive
(Negative)
$ 4,511
4,511
10,89434,16920,817
1,062
66,942
71,453
71,453
$ 71,453
TOLLESON ELEMENTARY SCHOOL DISTRICT NO. 17COMBINING SCHEDULE OF REVENUES, EXPENDITURES AND CHANGES IN FUND BALANCES -
BUDGET AND ACTUALNON-MAJOR SPECIAL REVENUE FUNDS
YEAR ENDED JUNE 30, 2016
Page 100

Fingerprint
Budget
$ 478
478
1,831
1,831
(1,353)
(1,353)
1,310
$ (43)
Actual
$ 546
546
484
484
62
62
1,310
$ 1,372
Variance - Positive
(Negative)
$ 68
68
1,347
1,347
1,415
1,415
$ 1,415
Textbooks
Budget
$ 466
466
13,384
13,384
(12,918)
(12,918)
12,847
$ (71)
Actual
$ 875
875
93
93
782
782
12,847
$ 13,629
Variance - Positive
(Negative)
$ 409
409
13,291
13,291
13,700
13,700
$ 13,700
(Continued)
Page 101

Total revenues
Revenues:Other localState aid and grantsFederal aid, grants and reimbursements
Expenditures:Current -
InstructionSupport services - students and staffSupport services - administrationStudent transportation servicesOperation of non-instructional services
Capital outlayTotal expenditures
Excess (deficiency) of revenues over expenditures
Other financing sources (uses):Transfers inTransfers out
Total other financing sources (uses):
Changes in fund balances
Fund balances, beginning of year
Fund balances (deficits), end of year
Indirect Costs
Budget
$ 3,441
3,441
169,875275,638715,991
257,4031,418,907
(1,415,466)
200,000
200,000
(1,215,466)
1,230,949
$ 15,483
Non-GAAP Actual
$ 2,911
2,911
71,379115,819300,848
108,157596,203
(593,292)
251,187
251,187
(342,105)
1,232,493
$ 890,388
Variance - Positive
(Negative)
$ (530)
(530)
98,496159,819415,143
149,246822,704
822,174
51,187
51,187
873,361
1,544
$ 874,905
TOLLESON ELEMENTARY SCHOOL DISTRICT NO. 17COMBINING SCHEDULE OF REVENUES, EXPENDITURES AND CHANGES IN FUND BALANCES -
BUDGET AND ACTUALNON-MAJOR SPECIAL REVENUE FUNDS
YEAR ENDED JUNE 30, 2016
Page 102

Insurance Refund
Budget
$ 362
362
34,642
34,642
(34,280)
(34,280)
34,281
$ 1
Actual
$ 426
426
426
426
34,281
$ 34,707
Variance - Positive
(Negative)
$ 64
64
34,642
34,642
34,706
34,706
$ 34,706
Grants and Gifts to Teachers
Budget
$ 1,524
1,524
7,225
607
7,832
(6,308)
(6,308)
6,307
$ (1)
Actual
$ 1,534
1,534
2,262
190
2,452
(918)
(918)
6,307
$ 5,389
Variance - Positive
(Negative)
$ 10
10
4,963
417
5,380
5,390
5,390
$ 5,390
(Continued)
Page 103

Total revenues
Revenues:Other localState aid and grantsFederal aid, grants and reimbursements
Expenditures:Current -
InstructionSupport services - students and staffSupport services - administrationStudent transportation servicesOperation of non-instructional services
Capital outlayTotal expenditures
Excess (deficiency) of revenues over expenditures
Other financing sources (uses):Transfers inTransfers out
Total other financing sources (uses):
Changes in fund balances
Fund balances, beginning of year
Fund balances, end of year
Totals
Budget
$ 218,757517,790
2,186,2032,922,750
2,194,6811,357,7331,114,717
49,33518,927
505,6705,241,063
(2,318,313)
200,000
200,000
(2,118,313)
2,179,278
$ 60,965
Non-GAAP Actual
$ 251,796620,222
1,738,7152,610,733
1,638,337956,772547,695
9,27410,393
157,6963,320,167
(709,434)
251,187(39,070)212,117
(497,317)
2,241,921
$ 1,744,604
Variance - Positive
(Negative)
$ 33,039102,432
(447,488)(312,017)
556,344400,961567,02240,061
8,534347,974
1,920,896
1,608,879
51,187(39,070)
12,117
1,620,996
62,643
$ 1,683,639
TOLLESON ELEMENTARY SCHOOL DISTRICT NO. 17COMBINING SCHEDULE OF REVENUES, EXPENDITURES AND CHANGES IN FUND BALANCES -
BUDGET AND ACTUALNON-MAJOR SPECIAL REVENUE FUNDS
YEAR ENDED JUNE 30, 2016
Page 104

DEBT SERVICE FUND Debt Service - to account for the accumulation of resources for, and the payment of, long-term debt principal, interest and related costs.
Page 105

Total revenues
Revenues:Other localProperty taxes
Expenditures:Debt service -
Principal retirementInterest and fiscal charges
Total expenditures
Excess (deficiency) of revenues over expenditures
Other financing sources (uses):Transfers in
Total other financing sources (uses):
Changes in fund balances
Fund balances, beginning of year
Fund balances, end of year
Debt Service
Budget
$ 2,0331,676,2011,678,234
945,0001,541,9932,486,993
(808,759)
(808,759)
1,139,099
$ 330,340
Actual
$ 3,7521,332,3351,336,087
945,000333,032
1,278,032
58,055
444444
58,499
418
$ 58,917
Variance - Positive
(Negative)
$ 1,719(343,866)(342,147)
1,208,9611,208,961
866,814
444444
867,258
(1,138,681)
$ (271,423)
TOLLESON ELEMENTARY SCHOOL DISTRICT NO. 17COMBINING SCHEDULE OF REVENUES, EXPENDITURES AND CHANGES IN FUND BALANCES -
BUDGET AND ACTUALALL DEBT SERVICE FUNDSYEAR ENDED JUNE 30, 2016
Page 106

CAPITAL PROJECTS FUNDS Insurance Proceeds - to account for the monies received from insurance claims. Litigation Recovery - to account for monies received for and derived from litigation. Unrestricted Capital Outlay - to account for transactions relating to the acquisition of capital items. Adjacent Ways - to account for monies received to finance improvements of public ways adjacent to school property. Bond Building - to account for proceeds from District bond issues that are expended on the acquisition or lease of sites; construction or renovation of school buildings; supplying school buildings with furniture, equipment and technology; improving school grounds; or purchasing pupil transportation vehicles. Gifts and Donations - Capital - to account for gifts and donations to be expended for capital acquisitions. Building Renewal Grant - to account for building renewal grant monies requested from the School Facilities Board that are used for infrastructure or for major upgrades, repairs, or renovations to areas, systems, or buildings that will maintain or extend their useful life.
Page 107

ASSETSCash and investmentsProperty taxes receivableDue from governmental entities
Total assets
LIABILITIES, DEFERRED INFLOWS OF RESOURCES AND FUND BALANCESLiabilities:
Accounts payableConstruction contracts payable
Total liabilities
Deferred inflows of resources:Unavailable revenues - property taxes
Fund balances:Restricted
Total fund balances
Total liabilities, deferred inflows of resourcesand fund balances
Insurance Proceeds
$ 36,785
$ 36,785
$
36,78536,785
$ 36,785
Litigation Recovery
$ 7,807
$ 7,807
$
7,8077,807
$ 7,807
Unrestricted Capital Outlay
$ 439,53414,316
124$ 453,974
$ 35,852
35,852
11,331
406,791406,791
$ 453,974
TOLLESON ELEMENTARY SCHOOL DISTRICT NO. 17COMBINING BALANCE SHEET - NON-MAJOR CAPITAL PROJECTS FUNDS
JUNE 30, 2016
Page 108

Adjacent Ways
$ 254,632447
$ 255,079
$2,8232,823
420
251,836251,836
$ 255,079
Bond Building
$ 103,012
$ 103,012
$
103,012103,012
$ 103,012
Gifts and Donations -
Capital
$ 87
$ 87
$
8787
$ 87
Building Renewal Grant
$ 14,627
170,900$ 185,527
$178,258178,258
7,2697,269
$ 185,527
Totals
$ 856,48414,763
171,024$ 1,042,271
$ 35,852181,081216,933
11,751
813,587813,587
$ 1,042,271
Page 109

Revenues:Other localProperty taxesState aid and grants
Total revenues
Expenditures:Current -
Operation and maintenance of plant servicesCapital outlay
Total expenditures
Excess (deficiency) of revenues over expenditures
Other financing sources (uses):Transfers out
Total other financing sources (uses):
Changes in fund balances
Fund balances (deficits), beginning of year
Fund balances (deficits), end of year
Insurance Proceeds
$ 29,559
29,559
3,47131,63335,104
(5,545)
(5,545)
42,330
$ 36,785
Litigation Recovery
$ 5,991
5,991
22,41422,414
(16,423)
(16,423)
24,230
$ 7,807
Unrestricted Capital Outlay
$ 1,693886,002
4,916892,611
1,312,1911,312,191
(419,580)
(419,580)
826,371
$ 406,791
TOLLESON ELEMENTARY SCHOOL DISTRICT NO. 17COMBINING STATEMENT OF REVENUES, EXPENDITURES AND CHANGES IN FUND BALANCES -
NON-MAJOR CAPITAL PROJECTS FUNDSYEAR ENDED JUNE 30, 2016
Page 110

Adjacent Ways
$ 1,57810,337
11,915
58,14858,148
(46,233)
(46,233)
298,069
$ 251,836
Bond Building
$ 17,155
17,155
83,21583,215
(66,060)
(444)(444)
(66,504)
169,516
$ 103,012
Gifts and Donations -
Capital
$
87
$ 87
Building Renewal Grant
$
530,715530,715
512,040512,040
18,675
18,675
(11,406)
$ 7,269
Totals
$ 55,976896,339535,631
1,487,946
3,4712,019,6412,023,112
(535,166)
(444)(444)
(535,610)
1,349,197
$ 813,587
Page 111
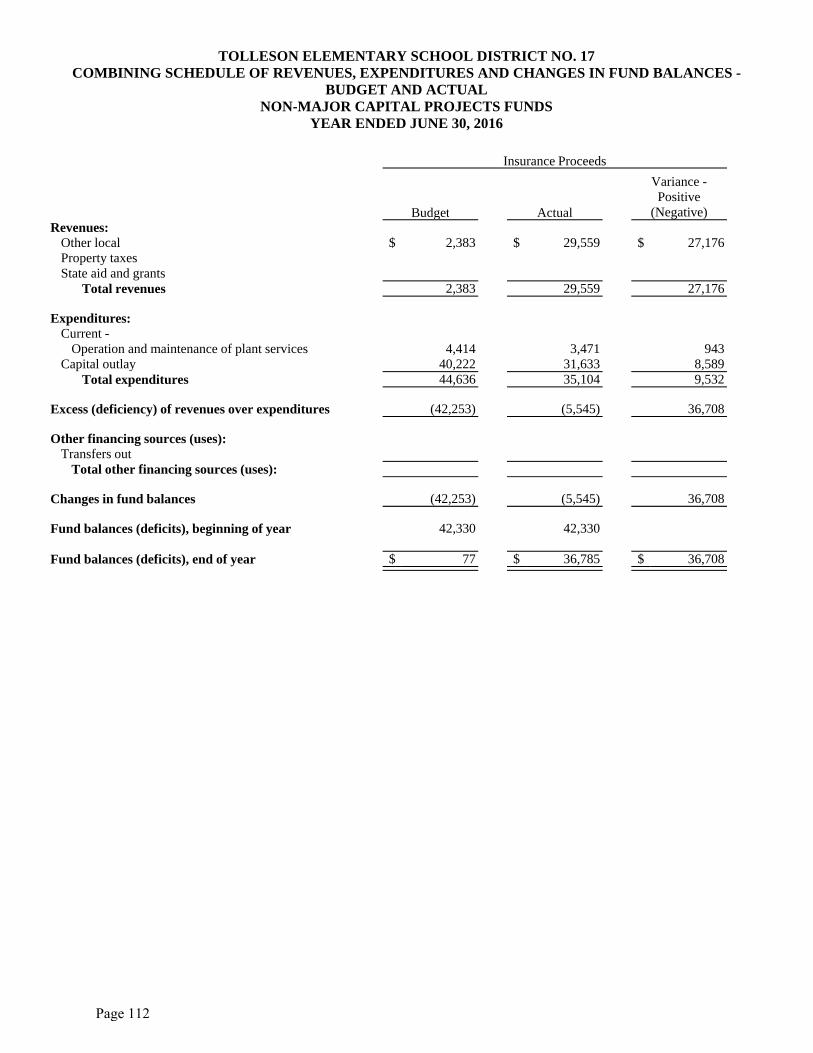
Total revenues
Revenues:Other localProperty taxesState aid and grants
Expenditures:Current -
Operation and maintenance of plant servicesCapital outlay
Total expenditures
Excess (deficiency) of revenues over expenditures
Other financing sources (uses):Transfers out
Total other financing sources (uses):
Changes in fund balances
Fund balances (deficits), beginning of year
Fund balances (deficits), end of year
Insurance Proceeds
Budget
$ 2,383
2,383
4,41440,22244,636
(42,253)
(42,253)
42,330
$ 77
Actual
$ 29,559
29,559
3,47131,63335,104
(5,545)
(5,545)
42,330
$ 36,785
Variance - Positive
(Negative)
$ 27,176
27,176
9438,5899,532
36,708
36,708
$ 36,708
TOLLESON ELEMENTARY SCHOOL DISTRICT NO. 17COMBINING SCHEDULE OF REVENUES, EXPENDITURES AND CHANGES IN FUND BALANCES -
BUDGET AND ACTUALNON-MAJOR CAPITAL PROJECTS FUNDS
YEAR ENDED JUNE 30, 2016
Page 112

Litigation Recovery
Budget
$ 5,409
5,409
29,69529,695
(24,286)
(24,286)
24,230
$ (56)
Actual
$ 5,991
5,991
22,41422,414
(16,423)
(16,423)
24,230
$ 7,807
Variance - Positive
(Negative)
$ 582
582
7,2817,281
7,863
7,863
$ 7,863
Unrestricted Capital Outlay
Budget
$ 1,0131,069,454
3,5941,074,061
1,972,9991,972,999
(898,938)
(898,938)
826,371
$ (72,567)
Non-GAAP Actual
$ 1,693886,002
4,916892,611
1,279,7931,279,793
(387,182)
(387,182)
793,973
$ 406,791
Variance - Positive
(Negative)
$ 680(183,452)
1,322(181,450)
693,206693,206
511,756
511,756
(32,398)
$ 479,358
(Continued)
Page 113

Total revenues
Revenues:Other localProperty taxesState aid and grants
Expenditures:Current -
Operation and maintenance of plant servicesCapital outlay
Total expenditures
Excess (deficiency) of revenues over expenditures
Other financing sources (uses):Transfers out
Total other financing sources (uses):
Changes in fund balances
Fund balances (deficits), beginning of year
Fund balances, end of year
Adjacent Ways
Budget
$ 1,078310,923
312,001
309,359309,359
2,642
2,642
298,068
$ 300,710
Actual
$ 1,57810,337
11,915
58,14858,148
(46,233)
(46,233)
298,069
$ 251,836
Variance - Positive
(Negative)
$ 500(300,586)
(300,086)
251,211251,211
(48,875)
(48,875)
1
$ (48,874)
TOLLESON ELEMENTARY SCHOOL DISTRICT NO. 17COMBINING SCHEDULE OF REVENUES, EXPENDITURES AND CHANGES IN FUND BALANCES -
BUDGET AND ACTUALNON-MAJOR CAPITAL PROJECTS FUNDS
YEAR ENDED JUNE 30, 2016
Page 114

Bond Building
Budget
$ 16,711
16,711
186,227186,227
(169,516)
(169,516)
169,516
$
Actual
$ 17,155
17,155
83,21583,215
(66,060)
(444)(444)
(66,504)
169,516
$ 103,012
Variance - Positive
(Negative)
$ 444
444
103,012103,012
103,456
(444)(444)
103,012
$ 103,012
Gifts and Donations - Capital
Budget
$
$
Actual
$
87
$ 87
Variance - Positive
(Negative)
$
87
$ 87
(Continued)
Page 115

Total revenues
Revenues:Other localProperty taxesState aid and grants
Expenditures:Current -
Operation and maintenance of plant servicesCapital outlay
Total expenditures
Excess (deficiency) of revenues over expenditures
Other financing sources (uses):Transfers out
Total other financing sources (uses):
Changes in fund balances
Fund balances (deficits), beginning of year
Fund balances (deficits), end of year
Building Renewal Grant
Budget
$
454,985454,985
732,986732,986
(278,001)
(278,001)
(11,406)
$ (289,407)
Actual
$
530,715530,715
512,040512,040
18,675
18,675
(11,406)
$ 7,269
Variance - Positive
(Negative)
$
75,73075,730
220,946220,946
296,676
296,676
$ 296,676
TOLLESON ELEMENTARY SCHOOL DISTRICT NO. 17COMBINING SCHEDULE OF REVENUES, EXPENDITURES AND CHANGES IN FUND BALANCES -
BUDGET AND ACTUALNON-MAJOR CAPITAL PROJECTS FUNDS
YEAR ENDED JUNE 30, 2016
Page 116

Totals
Budget
$ 26,5941,380,377
458,5791,865,550
4,4143,271,4883,275,902
(1,410,352)
(1,410,352)
1,349,109
$ (61,243)
Non-GAAP Actual
$ 55,976896,339535,631
1,487,946
3,4711,987,2431,990,714
(502,768)
(444)(444)
(503,212)
1,316,799
$ 813,587
Variance - Positive
(Negative)
$ 29,382(484,038)
77,052(377,604)
9431,284,2451,285,188
907,584
(444)(444)
907,140
(32,310)
$ 874,830
Page 117

(This page intentionally left blank)
Page 118

AGENCY FUNDS Student Activities - to account for monies raised by students to finance student clubs and organizations but held by the District as an agent. Employee Withholding - to account for voluntary deductions temporarily held by the District as an agent. Intergovernmental Agreements - to account for the financial activities relating to agreements with other governments not required to be accounted for elsewhere.
Page 119

ASSETSCash and investments
Total assets
LIABILITIESDue to student groupsDeposits held for othersDue to governmental entities
Total liabilities
Student Activities
$ 26,642$ 26,642
$ 26,642
$ 26,642
Employee Withholding
$ 26,939$ 26,939
$26,939
$ 26,939
Intergovernmental Agreements
$ 86,265$ 86,265
$
86,265$ 86,265
TOLLESON ELEMENTARY SCHOOL DISTRICT NO. 17COMBINING STATEMENT OF ASSETS AND LIABILITIES
AGENCY FUNDSJUNE 30, 2016
Page 120

Totals
$ 139,846$ 139,846
$ 26,64226,93986,265
$ 139,846
Page 121

Beginning Ending Balance, as restated Additions Deductions Balance
STUDENT ACTIVITIES FUND
AssetsCash and investments $ 8,069 $ 71,322 $ 52,749 $ 26,642
Total assets $ 8,069 $ 71,322 $ 52,749 $ 26,642
LiabilitiesDue to student groups $ 8,069 $ 71,322 $ 52,749 $ 26,642
Total liabilities $ 8,069 $ 71,322 $ 52,749 $ 26,642
EMPLOYEE WITHOLDING FUND
AssetsCash and investments $ 26,448 $ 34,402 $ 33,911 $ 26,939
Total assets $ 26,448 $ 34,402 $ 33,911 $ 26,939
LiabilitiesDeposits held for others $ 26,448 $ 34,402 $ 33,911 $ 26,939
Total liabilities $ 26,448 $ 34,402 $ 33,911 $ 26,939
INTERGOVERNMENTAL AGREEMENTS
AssetsCash and investments $ 85,825 $ 440 $ $ 86,265
Total assets $ 85,825 $ 440 $ $ 86,265
LiabilitiesDue to governmental entities $ 85,825 $ 440 $ $ 86,265
Total liabilities $ 85,825 $ 440 $ $ 86,265
TOTAL AGENCY FUNDS
AssetsCash and investments $ 120,342 $ 106,164 $ 86,660 $ 139,846
Total assets $ 120,342 $ 106,164 $ 86,660 $ 139,846
LiabilitiesDue to student groups $ 8,069 $ 71,322 $ 52,749 $ 26,642Deposits held for others 26,448 34,402 33,911 26,939Due to governmental entities 85,825 440 86,265
Total liabilities $ 120,342 $ 106,164 $ 86,660 $ 139,846
TOLLESON ELEMENTARY SCHOOL DISTRICT NO. 17COMBINING STATEMENT OF CHANGES IN ASSETS AND LIABILITIES
AGENCY FUNDSYEAR ENDED JUNE 30, 2016
Page 122
STATISTICAL SECTION
The statistical section presents financial statement trends as well as detailed financial and operational information not available elsewhere in the report. The statistical section is intended to enhance the reader’s understanding of the information presented in the financial statements, notes to the financial statements, and other supplementary information presented in this report. The statistical section is comprised of the five categories of statistical information presented below.
Financial Trends
These schedules contain information on financial trends to help the reader understand how the District’s financial position and financial activities have changed over time.
Revenue Capacity
These schedules contain information to help the reader assess the factors affecting the District’s ability to generate revenue.
Debt Capacity
These schedules present information to help the reader evaluate the District’s current levels of outstanding debt as well as assess the District’s ability to make debt payments and/or issue additional debt in the future.
Demographic and Economic Information These schedules present various demographic and economic indicators to help the reader understand the environment in which the District’s financial activities take place and to help make comparisons with other school districts.
Operating Information
These schedules contain information about the District’s operations and various resources to help the reader draw conclusions as to how the District’s financial information relates to the services provided by the District.
Note: For locally assessed property (i.e., excluding mines, utilities, etc.) Proposition 117, approved by voters in 2012, amended the Arizona Constitution to require that all property taxes after fiscal year 2014-15 be based upon property values limited to 5 percent in annual growth. The aggregate assessed value of all taxable properties within a taxing jurisdiction (i.e., after applying assessment ratios based on the use of a property), including property values with a growth limit, is currently referred to as net limited assessed value and formerly as primary assessed value. In accordance with Proposition 117, this value is used for all taxing purposes beginning fiscal year 2015-16. Aggregate assessed value without a growth limit is currently referred to as net full cash assessed value and formerly as secondary assessed value. This remains the value utilized for determining debt capacity limits.
Page 123

2016 2015 2014 2013 2012Net Position:
Net investment in capital assets 45,544,136$ 45,246,641$ 45,354,673$ 44,097,255$ 42,966,411$ Restricted 5,781,261 5,232,083 4,661,075 6,932,887 7,770,335 Unrestricted (13,212,196) (15,748,921) 4,013,699 2,753,258 2,253,280
Total net position 38,113,201$ 34,729,803$ 54,029,447$ 53,783,400$ 52,990,026$
2011 2010 2009 2008 2007Net Position:
Net investment in capital assets 41,035,544$ 35,858,240$ 34,776,373$ 32,149,707$ 31,560,835$ Restricted 6,163,771 4,310,070 3,817,549 2,282,707 1,686,828 Unrestricted 5,406,126 7,529,214 6,410,968 6,490,338 4,663,861
Total net position 52,605,441$ 47,697,524$ 45,004,890$ 40,922,752$ 37,911,524$
The source of this information is the District's financial records.Source:
TOLLESON ELEMENTARY SCHOOL DISTRICT NO. 17NET POSITION BY COMPONENT
LAST TEN FISCAL YEARS
Fiscal Year Ended June 30
(Accrual basis of accounting)
Page 124
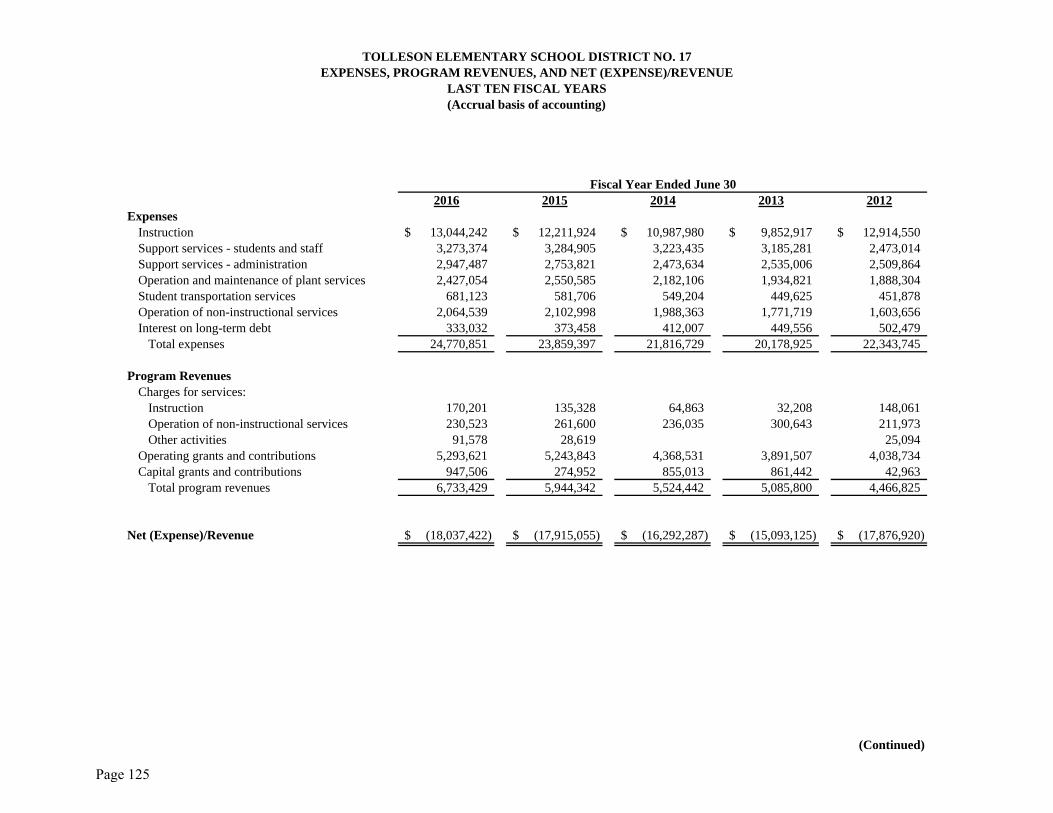
2016 2015 2014 2013 2012
Instruction 13,044,242$ 12,211,924$ 10,987,980$ 9,852,917$ 12,914,550$ Support services - students and staff 3,273,374 3,284,905 3,223,435 3,185,281 2,473,014 Support services - administration 2,947,487 2,753,821 2,473,634 2,535,006 2,509,864 Operation and maintenance of plant services 2,427,054 2,550,585 2,182,106 1,934,821 1,888,304 Student transportation services 681,123 581,706 549,204 449,625 451,878 Operation of non-instructional services 2,064,539 2,102,998 1,988,363 1,771,719 1,603,656 Interest on long-term debt 333,032 373,458 412,007 449,556 502,479
Total expenses 24,770,851 23,859,397 21,816,729 20,178,925 22,343,745
Program RevenuesCharges for services:
Instruction 170,201 135,328 64,863 32,208 148,061 Operation of non-instructional services 230,523 261,600 236,035 300,643 211,973 Other activities 91,578 28,619 25,094
Operating grants and contributions 5,293,621 5,243,843 4,368,531 3,891,507 4,038,734 Capital grants and contributions 947,506 274,952 855,013 861,442 42,963
Total program revenues 6,733,429 5,944,342 5,524,442 5,085,800 4,466,825
Net (Expense)/Revenue (18,037,422)$ (17,915,055)$ (16,292,287)$ (15,093,125)$ (17,876,920)$
The source of this information is the District's financial records.The provisions of the Governmental Accounting Standards Board (GASB) Statement No. 34 were adopted in fiscal year 2001 therefore
only six years are shown.
(Continued)
Note:
LAST TEN FISCAL YEARS(Accrual basis of accounting)
Fiscal Year Ended June 30
Expenses
TOLLESON ELEMENTARY SCHOOL DISTRICT NO. 17EXPENSES, PROGRAM REVENUES, AND NET (EXPENSE)/REVENUE
Source:
Page 125
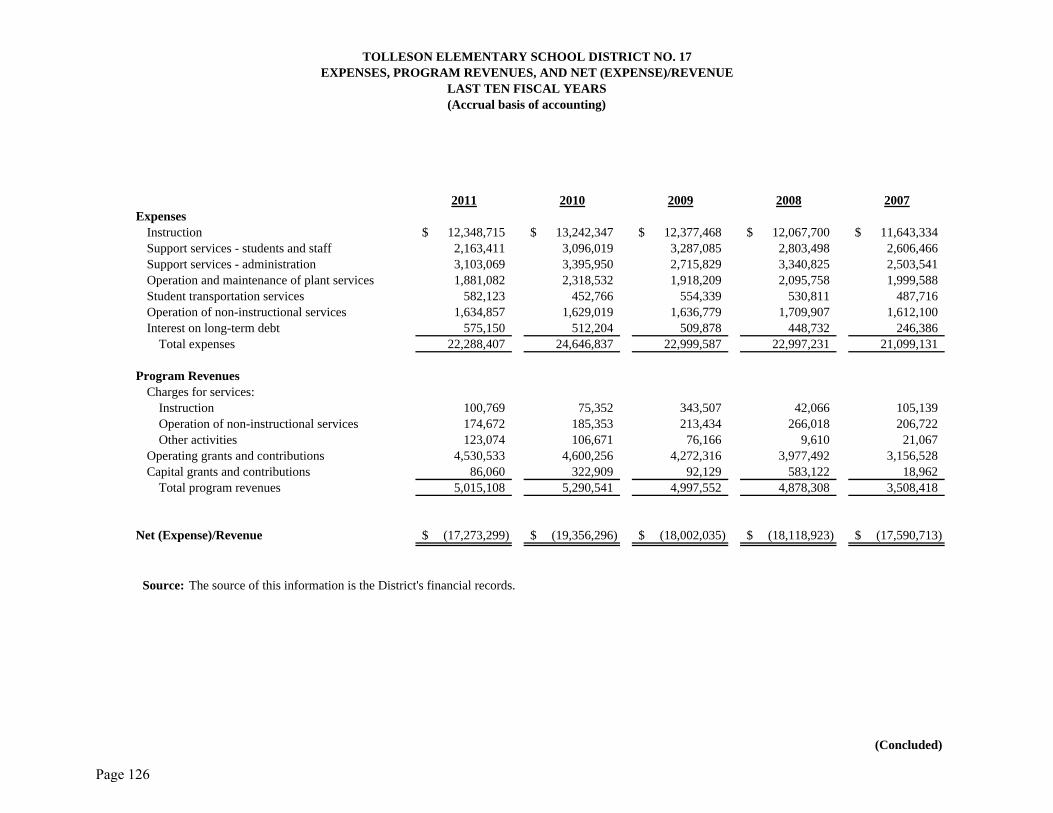
2011 2010 2009 2008 2007Expenses
Instruction 12,348,715$ 13,242,347$ 12,377,468$ 12,067,700$ 11,643,334$ Support services - students and staff 2,163,411 3,096,019 3,287,085 2,803,498 2,606,466 Support services - administration 3,103,069 3,395,950 2,715,829 3,340,825 2,503,541 Operation and maintenance of plant services 1,881,082 2,318,532 1,918,209 2,095,758 1,999,588 Student transportation services 582,123 452,766 554,339 530,811 487,716 Operation of non-instructional services 1,634,857 1,629,019 1,636,779 1,709,907 1,612,100 Interest on long-term debt 575,150 512,204 509,878 448,732 246,386
Total expenses 22,288,407 24,646,837 22,999,587 22,997,231 21,099,131
Program RevenuesCharges for services:
Instruction 100,769 75,352 343,507 42,066 105,139 Operation of non-instructional services 174,672 185,353 213,434 266,018 206,722 Other activities 123,074 106,671 76,166 9,610 21,067
Operating grants and contributions 4,530,533 4,600,256 4,272,316 3,977,492 3,156,528 Capital grants and contributions 86,060 322,909 92,129 583,122 18,962
Total program revenues 5,015,108 5,290,541 4,997,552 4,878,308 3,508,418
Net (Expense)/Revenue (17,273,299)$ (19,356,296)$ (18,002,035)$ (18,118,923)$ (17,590,713)$
(Concluded)
(Accrual basis of accounting)LAST TEN FISCAL YEARS
Fiscal Year Ended June 30
Source: The source of this information is the District's financial records.
TOLLESON ELEMENTARY SCHOOL DISTRICT NO. 17EXPENSES, PROGRAM REVENUES, AND NET (EXPENSE)/REVENUE
Page 126

2016 2015 2014 2013 2012
Net (Expense)/Revenue (18,037,422)$ (17,915,055)$ (16,292,287)$ (15,093,125)$ (17,876,920)$
General Revenues: Taxes:
Property taxes, levied for general purposes 4,920,118 3,936,020 4,029,371 5,212,610 5,917,475 Property taxes, levied for debt service 1,327,471 1,320,185 654,691 701,890 2,741,424 Property taxes, levied for capital outlay 855,336 1,403,736 1,146,878 103,852 194,829
Investment income 33,787 29,948 34,086 37,739 70,272 Unrestricted county aid 1,065,587 980,201 905,894 858,246 878,815 Unrestricted state aid 11,171,443 10,282,770 9,737,432 8,944,928 8,410,653 Unrestricted federal aid 58,536 60,202 29,982 27,234 48,037
Total general revenues 19,432,278 18,013,062 16,538,334 15,886,499 18,261,505
Changes in Net Position 1,394,856$ 98,007$ 246,047$ 793,374$ 384,585$
Source: The source of this information is the District's financial records.
Note: The provisions of the Governmental Accounting Standards Board (GASB) Statement No. 34 were adopted in fiscal year 2001 therefore only six years are shown.
(Continued)
Fiscal Year Ended June 30
TOLLESON ELEMENTARY SCHOOL DISTRICT NO. 17GENERAL REVENUES AND TOTAL CHANGES IN NET POSITION
LAST TEN FISCAL YEARS(Accrual basis of accounting)
Page 127

2011 2010 2009 2008 2007
Net (Expense)/Revenue (17,273,299)$ (19,356,296)$ (18,002,035)$ (18,118,923)$ (17,590,713)$
General Revenues: Taxes:
Property taxes, levied for general purposes 5,620,663 3,145,217 4,149,555 4,710,025 4,741,581 Property taxes, levied for debt service 5,231,260 5,690,850 2,256,538 1,786,383 1,283,205 Property taxes, levied for capital outlay 1,367,233 1,510,083 2,361,148 878,730 1,092,385
Investment income 114,652 141,283 379,371 400,312 241,734 Unrestricted county aid 933,379 936,891 8,981 Unrestricted state aid 8,903,392 9,259,126 12,937,561 13,354,701 12,507,021 Gain on sale of capital assets
Total general revenues 22,293,864 22,048,930 22,084,173 21,130,151 19,874,907
Changes in Net Position 5,020,565$ 2,692,634$ 4,082,138$ 3,011,228$ 2,284,194$
The Arizona State Legislature suspended county equalization payments to school districts for fiscal years 2006-07 through 2008-09.
(Concluded)
GENERAL REVENUES AND TOTAL CHANGES IN NET POSITIONLAST TEN FISCAL YEARS
TOLLESON ELEMENTARY SCHOOL DISTRICT NO. 17
(Accrual basis of accounting)
The source of this information is the District's financial records.
Fiscal Year Ended June 30
Source: Note:
Page 128

2016 2015 2014 2013 2012General Fund:
Nonspendable $ 463,696$ 342,713$ 570,498$ 386,525$ Unassigned 3,336,711 2,543,615 3,168,455 1,513,917 841,638 Reserved Unreserved
Total General Fund 3,336,711$ 3,007,311$ 3,511,168$ 2,084,415$ 1,228,163$
All Other Governmental Funds:Nonspendable $ $ 79,512$ 47,125$ 68,686$ Restricted 5,465,835 5,031,697 4,899,616 9,158,537 11,025,906 Unassigned (54,230) (67,050) Reserved Unreserved, reported in:
Special revenue funds Capital projects funds Debt service fund
Total all other governmental funds 5,465,835$ 4,977,467$ 4,912,078$ 9,205,662$ 11,094,592$
(Continued)
TOLLESON ELEMENTARY SCHOOL DISTRICT NO. 17FUND BALANCES - GOVERNMENTAL FUNDS
Fiscal Year Ended June 30
LAST TEN FISCAL YEARS(Modified accrual basis of accounting)
Page 129

2011 2010 2009 2008 2007General Fund:
Nonspendable 105,765$ $ $ $ $ Unassigned 942,268 Reserved 145,092 155,953 550,484 140,342 Unreserved (897,767) 1,622,890 2,716,830 2,524,756
Total General Fund 1,048,033$ (752,675)$ 1,778,843$ 3,267,314$ 2,665,098$
All Other Governmental Funds:Nonspendable 61,891$ $ $ $ $ Restricted 10,143,062 Reserved 55,874 29,246 29,044 28,928 Unreserved, reported in:
Special revenue funds 3,339,064 2,155,428 1,900,968 1,070,022 Capital projects funds 9,217,480 4,714,909 3,585,437 3,801,149 Debt service fund 569,753 622,112 920,855 748,814
Total all other governmental funds 10,204,953$ 13,182,171$ 7,521,695$ 6,436,304$ 5,648,913$
Source:Note:
(Concluded)
The provisions of the Governmental Accounting Standards Board (GASB) Statement No. 54 were adopted in fiscal year 2011. The standard replaces the previous reserved and unreserved fund balance categories with the following five fund balance classifications: nonspendable, restricted, committed, assigned, and unassigned fund balance.
The source of this information is the District's financial records.
TOLLESON ELEMENTARY SCHOOL DISTRICT NO. 17FUND BALANCES - GOVERNMENTAL FUNDS
LAST TEN FISCAL YEARS(Modified accrual basis of accounting)
Page 130

2016 2015 2014 2013 2012Federal sources:
Federal grants 2,689,659$ 2,256,413$ 2,174,902$ 2,316,127$ 1,974,922$ Education Jobs 17,255 National School Lunch Program 2,430,154 2,202,048 1,957,967 1,820,542 1,671,198 Total federal sources 5,119,813 4,458,461 4,132,869 4,136,669 3,663,375
State sources:State equalization assistance 10,018,939 9,232,515 8,724,191 8,181,417 7,653,635 State grants 503,160 803,487 783,829 488,803 419,969 School Facilities Board 530,715 109,104 235,495 12,225 Other revenues 1,153,254 1,051,005 1,013,241 763,511 757,018 Total state sources 12,206,068 11,196,111 10,756,756 9,445,956 8,830,622
Local sources:Property taxes 7,162,343 6,648,839 5,830,514 6,059,209 9,029,927 County aid 1,065,587 980,201 905,894 858,246 883,315 Food service sales 230,523 208,471 179,099 169,828 188,644 Investment income 31,354 29,948 34,086 37,739 70,272 Other revenues 312,602 255,812 162,394 232,770 238,374 Total local sources 8,802,409 8,123,271 7,111,987 7,357,792 10,410,532 Total revenues 26,128,290$ 23,777,843$ 22,001,612$ 20,940,417$ 22,904,529$
(Continued)
TOLLESON ELEMENTARY SCHOOL DISTRICT NO. 17GOVERNMENTAL FUNDS REVENUES
LAST TEN FISCAL YEARS
Fiscal Year Ended June 30
(Modified accrual basis of accounting)
Page 131

2011 2010 2009 2008 2007Federal sources:
Federal grants 2,127,345$ 3,180,403$ 2,336,714$ 2,718,144$ 1,597,157$ State Fiscal Stabilization (ARRA) 123,285 1,582,445 Education Jobs 487,069 National School Lunch Program 1,598,818 1,640,251 1,562,355 1,509,782 1,427,262 Total federal sources 4,336,517 6,403,099 3,899,069 4,227,926 3,024,419
State sources:State equalization assistance 8,220,113 8,507,494 11,935,102 11,929,424 11,163,237 State grants 356,614 231,646 581,763 132,644 151,071 School Facilities Board 33,257 247,753 Other revenues 683,748 751,632 1,002,459 1,392,020 1,096,031 Total state sources 9,260,475 9,490,772 13,519,324 13,487,345 12,658,092
Local sources:Property taxes 12,139,723 10,307,157 8,620,437 7,338,515 7,044,197 County aid 937,376 936,891 8,981 Food service sales 165,954 184,485 212,959 209,386 206,722 Investment income 104,759 141,283 396,495 400,423 241,734 Other revenues 284,735 384,638 420,148 326,271 157,206 Total local sources 13,632,547 11,954,454 9,650,039 8,274,595 7,658,840 Total revenues 27,229,539$ 27,848,325$ 27,068,432$ 25,989,866$ 23,341,351$
The Arizona State Legislature suspended county equalization payments to school districts for fiscal years 2006-07 through 2008-09.
(Concluded)
Note:Source: The source of this information is the District's financial records.
TOLLESON ELEMENTARY SCHOOL DISTRICT NO. 17GOVERNMENTAL FUNDS REVENUES
LAST TEN FISCAL YEARS(Modified accrual basis of accounting)
Page 132

2016 2015 2014 2013 2012
Expenditures:Current -
Instruction 11,416,155$ 10,838,256$ 9,807,769$ 8,912,255$ 10,133,630$ Support services - students and staff 3,079,072 3,213,204 2,979,511 3,236,118 2,333,645 Support services - administration 2,603,475 2,526,726 2,259,584 2,232,514 2,312,360 Operation and maintenance of plant services 1,710,897 2,476,051 1,799,211 1,922,817 2,031,235 Student transportation services 459,093 407,610 429,017 337,382 345,487 Operation of non-instructional services 1,996,946 1,963,340 1,976,357 1,701,185 1,570,926
Capital outlay 2,303,156 1,499,137 4,064,589 2,248,680 1,468,423 Debt service -
Interest and fiscal charges 333,032 373,458 412,007 449,556 502,479 Principal retirement 945,000 960,000 945,000 1,095,000 1,424,130 Bond issuance costs
Total expenditures 24,846,826$ 24,257,782$ 24,673,045$ 22,135,507$ 22,122,315$
Expenditures for capitalized assets 792,098$ 588,474$ 3,517,739$ 1,945,626$ 1,158,407$
Debt service as a percentage ofnoncapital expenditures 5% 6% 6% 8% 9%
Source: The source of this information is the District's financial records.Notes:
(Continued)
TOLLESON ELEMENTARY SCHOOL DISTRICT NO. 17GOVERNMENTAL FUNDS EXPENDITURES AND DEBT SERVICE RATIO
Fiscal Year Ended June 30
LAST TEN FISCAL YEARS(Modified accrual basis of accounting)
Page 133

2011 2010 2009 2008 2007
Expenditures:Current -
Instruction 10,862,945$ 11,362,447$ 10,798,527$ 10,522,071$ 10,084,052$ Support services - students and staff 1,992,982 2,773,280 3,251,634 2,776,484 2,448,491 Support services - administration 2,762,827 2,817,817 2,712,710 3,040,061 2,380,363 Operation and maintenance of plant services 1,821,318 1,827,175 1,737,699 2,006,035 1,882,546 Student transportation services 445,660 419,243 380,053 438,620 403,007 Operation of non-instructional services 1,579,750 1,612,144 1,607,402 1,668,947 1,557,329
Capital outlay 6,390,398 7,321,026 8,366,841 2,844,385 4,357,080 Debt service -
Interest and fiscal charges 551,415 541,327 509,878 448,732 252,629 Principal retirement 4,789,061 5,732,190 2,666,701 1,760,179 1,144,948 Bond issuance costs 85,812 191,640 71,351 92,232
Total expenditures 31,282,168$ 34,598,289$ 32,102,796$ 25,505,514$ 24,602,677$
Expenditures for capitalized assets 5,542,378$ 4,886,872$ 7,448,289$ 1,174,801$ 3,304,936$
Debt service as a percentage ofnoncapital expenditures 21% 21% 13% 9% 7%
Source:
(Concluded)
TOLLESON ELEMENTARY SCHOOL DISTRICT NO. 17GOVERNMENTAL FUNDS EXPENDITURES AND DEBT SERVICE RATIO
The source of this information is the District's financial records.
Fiscal Year Ended June 30
LAST TEN FISCAL YEARS(Modified accrual basis of accounting)
Page 134

2016 2015 2014 2013 2012
Excess (deficiency) of revenues over expenditures 1,281,464$ (479,939)$ (2,671,433)$ (1,195,090)$ 782,214$
Other financing sources (uses):Transfers in 251,631 357,587 2,232,268 436,190 238,171 Transfers out (251,631) (357,587) (2,232,268) (436,190) (238,171)
Total other financing sources (uses)
Changes in fund balances 1,281,464$ (479,939)$ (2,671,433)$ (1,195,090)$ 782,214$
2011 2010 2009 2008 2007
Excess (deficiency) of revenues over expenditures (4,052,629)$ (6,749,964)$ (5,034,364)$ 484,352$ (1,261,326)$
Other financing sources (uses):General obligation bonds issued 2,960,000 9,600,000 5,045,000 4,545,000 Premium on sale of bonds 62,077 220,763 54,227 98,475 Proceeds from sale of capital assets 42,392 Capital lease agreements 494,997 Transfers in 147,950 420,422 319,216 263,518 297,167 Transfers out (147,950) (420,422) (319,216) (263,518) (297,167)
Total other financing sources (uses) 3,022,077 9,863,155 5,099,227 494,997 4,643,475
Changes in fund balances (1,030,552)$ 3,113,191$ 64,863$ 979,349$ 3,382,149$
Source: The source of this information is the District's financial records.
TOLLESON ELEMENTARY SCHOOL DISTRICT NO. 17OTHER FINANCING SOURCES AND USES AND NET CHANGES IN FUND BALANCES - GOVERNMENTAL FUNDS
LAST TEN FISCAL YEARS
Fiscal Year Ended June 30
(Modified accrual basis of accounting)
Page 135
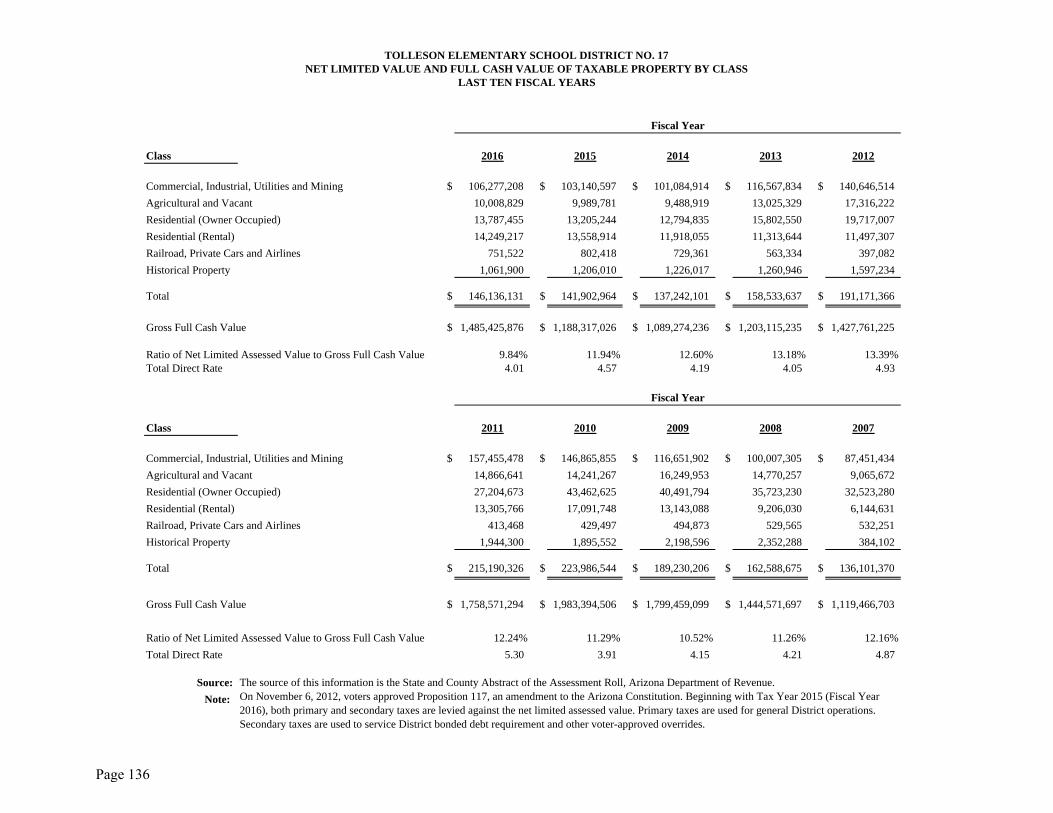
Class 2016 2015 2014 2013 2012
Commercial, Industrial, Utilities and Mining $ 106,277,208 $ 103,140,597 $ 101,084,914 $ 116,567,834 $ 140,646,514
Agricultural and Vacant 10,008,829 9,989,781 9,488,919 13,025,329 17,316,222
Residential (Owner Occupied) 13,787,455 13,205,244 12,794,835 15,802,550 19,717,007
Residential (Rental) 14,249,217 13,558,914 11,918,055 11,313,644 11,497,307
Railroad, Private Cars and Airlines 751,522 802,418 729,361 563,334 397,082
Historical Property 1,061,900 1,206,010 1,226,017 1,260,946 1,597,234
Total $ 146,136,131 $ 141,902,964 $ 137,242,101 $ 158,533,637 $ 191,171,366
Gross Full Cash Value $ 1,485,425,876 $ 1,188,317,026 $ 1,089,274,236 $ 1,203,115,235 $ 1,427,761,225
Ratio of Net Limited Assessed Value to Gross Full Cash Value 9.84% 11.94% 12.60% 13.18% 13.39%Total Direct Rate 4.01 4.57 4.19 4.05 4.93
Class 2011 2010 2009 2008 2007
Commercial, Industrial, Utilities and Mining $ 157,455,478 $ 146,865,855 $ 116,651,902 $ 100,007,305 $ 87,451,434
Agricultural and Vacant 14,866,641 14,241,267 16,249,953 14,770,257 9,065,672
Residential (Owner Occupied) 27,204,673 43,462,625 40,491,794 35,723,230 32,523,280
Residential (Rental) 13,305,766 17,091,748 13,143,088 9,206,030 6,144,631
Railroad, Private Cars and Airlines 413,468 429,497 494,873 529,565 532,251
Historical Property 1,944,300 1,895,552 2,198,596 2,352,288 384,102
Total $ 215,190,326 $ 223,986,544 $ 189,230,206 $ 162,588,675 $ 136,101,370
Gross Full Cash Value $ 1,758,571,294 $ 1,983,394,506 $ 1,799,459,099 $ 1,444,571,697 $ 1,119,466,703
Ratio of Net Limited Assessed Value to Gross Full Cash Value 12.24% 11.29% 10.52% 11.26% 12.16%
Total Direct Rate 5.30 3.91 4.15 4.21 4.87
Source:
Note: On November 6, 2012, voters approved Proposition 117, an amendment to the Arizona Constitution. Beginning with Tax Year 2015 (Fiscal Year 2016), both primary and secondary taxes are levied against the net limited assessed value. Primary taxes are used for general District operations. Secondary taxes are used to service District bonded debt requirement and other voter-approved overrides.
The source of this information is the State and County Abstract of the Assessment Roll, Arizona Department of Revenue.
TOLLESON ELEMENTARY SCHOOL DISTRICT NO. 17NET LIMITED VALUE AND FULL CASH VALUE OF TAXABLE PROPERTY BY CLASS
LAST TEN FISCAL YEARS
Fiscal Year
Fiscal Year
Page 136
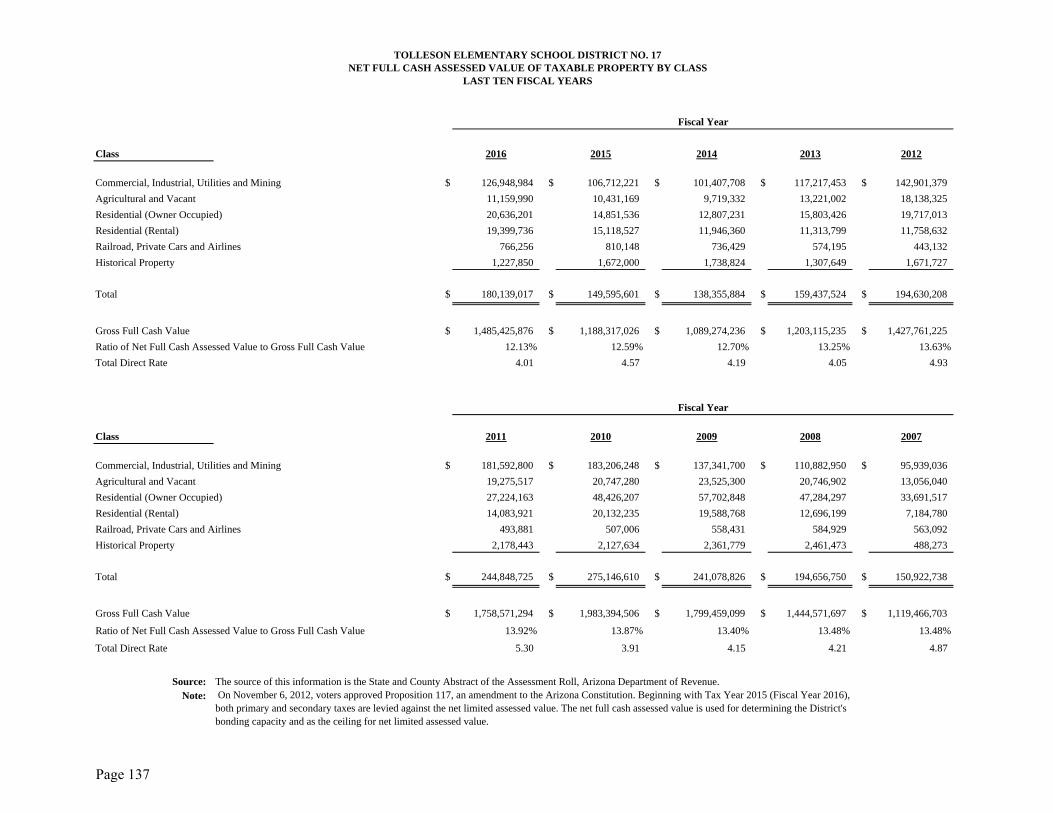
Class 2016 2015 2014 2013 2012
Commercial, Industrial, Utilities and Mining $ 126,948,984 $ 106,712,221 $ 101,407,708 $ 117,217,453 $ 142,901,379
Agricultural and Vacant 11,159,990 10,431,169 9,719,332 13,221,002 18,138,325
Residential (Owner Occupied) 20,636,201 14,851,536 12,807,231 15,803,426 19,717,013
Residential (Rental) 19,399,736 15,118,527 11,946,360 11,313,799 11,758,632
Railroad, Private Cars and Airlines 766,256 810,148 736,429 574,195 443,132
Historical Property 1,227,850 1,672,000 1,738,824 1,307,649 1,671,727
Total $ 180,139,017 $ 149,595,601 $ 138,355,884 $ 159,437,524 $ 194,630,208
Gross Full Cash Value $ 1,485,425,876 $ 1,188,317,026 $ 1,089,274,236 $ 1,203,115,235 $ 1,427,761,225
Ratio of Net Full Cash Assessed Value to Gross Full Cash Value 12.13% 12.59% 12.70% 13.25% 13.63%
Total Direct Rate 4.01 4.57 4.19 4.05 4.93
Class 2011 2010 2009 2008 2007
Commercial, Industrial, Utilities and Mining $ 181,592,800 $ 183,206,248 $ 137,341,700 $ 110,882,950 $ 95,939,036
Agricultural and Vacant 19,275,517 20,747,280 23,525,300 20,746,902 13,056,040
Residential (Owner Occupied) 27,224,163 48,426,207 57,702,848 47,284,297 33,691,517
Residential (Rental) 14,083,921 20,132,235 19,588,768 12,696,199 7,184,780
Railroad, Private Cars and Airlines 493,881 507,006 558,431 584,929 563,092
Historical Property 2,178,443 2,127,634 2,361,779 2,461,473 488,273
Total $ 244,848,725 $ 275,146,610 $ 241,078,826 $ 194,656,750 $ 150,922,738
Gross Full Cash Value $ 1,758,571,294 $ 1,983,394,506 $ 1,799,459,099 $ 1,444,571,697 $ 1,119,466,703
Ratio of Net Full Cash Assessed Value to Gross Full Cash Value 13.92% 13.87% 13.40% 13.48% 13.48%
Total Direct Rate 5.30 3.91 4.15 4.21 4.87
Source: Note: On November 6, 2012, voters approved Proposition 117, an amendment to the Arizona Constitution. Beginning with Tax Year 2015 (Fiscal Year 2016),
both primary and secondary taxes are levied against the net limited assessed value. The net full cash assessed value is used for determining the District's bonding capacity and as the ceiling for net limited assessed value.
The source of this information is the State and County Abstract of the Assessment Roll, Arizona Department of Revenue.
TOLLESON ELEMENTARY SCHOOL DISTRICT NO. 17NET FULL CASH ASSESSED VALUE OF TAXABLE PROPERTY BY CLASS
LAST TEN FISCAL YEARS
Fiscal Year
Fiscal Year
Page 137

Class 2016 2015 2014 2013 2012
Commercial, Industrial, Utilities and Mining 19 % 19 % 20 % 20 % 20 %
Agricultural and Vacant 16 16 16 16 16
Residential (Owner Occupied) 10 10 10 10 10
Residential (Rental) 10 10 10 10 10
Railroad, Private Cars and Airlines 15 16 15 15 15
Class 2011 2010 2009 2008 2007
Commercial, Industrial, Utilities and Mining 21 % 22 % 23 % 24 % 25 %
Agricultural and Vacant 16 16 16 16 16
Residential (Owner Occupied) 10 10 10 10 10
Residential (Rental) 10 10 10 10 10
Railroad, Private Cars and Airlines 17 18 20 21 22
Source: The source of this information is the State and County Abstract of the Assessment Roll, Arizona Department of Revenue.Note: Additional classes of property exist, but do not amount to a significant portion of the District's total valuation, therefore they are not
included on this schedule.
TOLLESON ELEMENTARY SCHOOL DISTRICT NO. 17PROPERTY TAX ASSESSMENT RATIOS
LAST TEN FISCAL YEARS
Fiscal Year
Fiscal Year
Page 138

Fiscal Year City
Ended ofJune 30 County Avondale Primary Secondary Total
2016 0.51 1.36 0.16 1.49 0.14 1.82 3.97 1.75 4.01 2.40 1.61 4.01 2015 0.51 1.32 0.14 1.52 0.14 1.82 3.75 1.75 4.53 1.98 2.59 4.57 2014 0.51 1.28 0.14 1.53 0.14 1.82 3.76 1.81 5.49 1.92 2.27 4.19 2013 0.47 1.24 0.18 1.38 0.10 1.82 3.42 1.33 4.85 2.38 1.67 4.05 2012 0.43 1.24 0.18 1.21 0.10 1.82 2.91 1.33 4.07 2.47 2.46 4.93 2011 N/A 1.05 0.15 0.97 0.10 1.82 2.44 1.11 2.72 2.19 3.11 5.30 2010 N/A 0.99 0.14 0.88 0.10 1.82 2.51 1.11 2.10 0.98 2.93 3.91 2009 N/A 1.03 0.14 0.94 0.10 1.82 2.30 1.11 2.61 2.46 1.69 4.15 2008 N/A 1.10 0.15 0.98 0.10 1.82 2.67 1.11 2.86 2.06 2.15 4.21 2007 N/A 1.18 0.20 1.06 0.12 1.82 2.97 1.17 4.26 2.64 2.23 4.87
Note: N/A indicates that the information is not available.
TOLLESON ELEMENTARY SCHOOL DISTRICT NO. 17DIRECT AND OVERLAPPING PROPERTY TAX RATES
LAST TEN FISCAL YEARS
Source:
District Direct Rates
The source of this information is the Property Tax Rates and Assessed Values, Arizona Tax Research Foundation.
Overlapping Rates
State Equalization
Flood Control District
Community College District
Central Arizona Water
City of Phoenix
City of Tolleson
Tolleson Union High School
District No. 214
Page 139

Net Limited Assessed Valuation
Net Full Cash Assessed Valuation
LBA Realty Fund III Company IX LLC 8,081,328$ 5.53 % $ %ABS SW Investor LLC 4,720,197 3.23Raintree Pad 2 LLC 3,741,085 2.5691st Avenue Investments LLC 3,317,290 2.27Banner Health Systems 2,922,723 2.00Pratte Buckeye Property LLC 2,469,701 1.69The Prince Company 2,411,246 1.65Credit Suisse 1st Boston Mortgage Securities 2,411,246 1.65BRY PL LP 2,104,360 1.44Quiktrip Corporation 2,060,519 1.41Stokely Van Kamp 20,555,677 13.62 Smith's Food & Drug 17,371,207 11.51 Continental Pet Tech. 13,296,293 8.81 Albertson's Inc. 11,032,452 7.31 Willamette Industries Inc. 8,828,980 5.85 Landis Plastics, Inc. 7,033,000 4.66 Holsum Bakery 5,689,787 3.77 Cabot Industrial Properties 5,448,311 3.61 Reckitt&Coleman Inc. 4,874,804 3.23 Autozone 4,784,251 3.17
Total 34,239,695$ 23.43 % 98,914,763$ 65.54 %
Source:Note: On November 6, 2012, voters approved Proposition 117, an amendment to the Arizona Constitution. Beginning
with Tax Year 2015 (Fiscal Year 2016), both primary and secondary taxes are levied against the net limited assessed value.
The source of this information is the Maricopa County Assessor's records.
TOLLESON ELEMENTARY SCHOOL DISTRICT NO. 17PRINCIPAL PROPERTY TAXPAYERS
CURRENT FISCAL YEAR AND FISCAL YEAR NINE YEARS PRIOR
Percentage of District's Net
Limited Assessed Valuation
Percentage of District's Net
Full Cash Assessed Valuation
2007
Taxpayer
2016
Page 140

FiscalYear Taxes Levied Collections in
Ended for the Subsequent June 30 Fiscal Year Amount Fiscal Years Amount(2)
2016 7,174,735$ 7,103,412$ 99.01 % $ 7,103,412$ 99.01 %2015 6,712,294 6,569,985 97.88 139,441 6,709,426 99.962014 5,875,068 5,758,897 98.02 113,206 5,872,103 99.952013 6,248,122 6,115,586 97.88 128,333 6,243,919 99.932012 9,517,820 8,917,804 93.70 578,149 9,495,953 99.772011 12,320,281 11,882,138 96.44 436,628 12,318,766 99.992010 10,372,359 9,976,501 96.18 328,031 10,304,532 99.352009 8,880,739 8,570,904 96.51 278,008 8,848,912 99.642008 7,606,016 7,317,560 96.21 278,521 7,596,081 99.872007 7,461,004 7,305,362 97.91 155,168 7,460,530 99.99
Source:Notes: 1)
2)
Fiscal Year of the LevyCollected within the
of the Current Fiscal Year
TOLLESON ELEMENTARY SCHOOL DISTRICT NO. 17PROPERTY TAX LEVIES AND COLLECTIONS
LAST TEN FISCAL YEARS
Collected to the End
Unsecured personal property taxes are not included in this schedule because the dates of the monthly rollsvary each year. On the average, 90% of unsecured property taxes are collected within 90 days after thedue date.
Amounts collected are on a cash basis.The source of this information is the 2014 Maricopa County Treasurer's records.
of LevyPercentage
of LevyPercentage
Page 141

Fiscal Less: Percentage of Percentage of Year Estimated Estimated Percentage of
Ended Actual Value Per Actual Value Per Personal June 30 Total (Full Cash Value) Capita Total (Full Cash Value) Capita Income
2016 7,830,000$ 69,265$ 7,760,735$ 0.52 % 1,145$ $ 7,830,000$ 0.53 % 1,145$ 0.00 %2015 8,790,000 15,630 8,774,370 0.74 1,302 8,790,000 0.74 1,302 0.01 2014 9,735,000 17,443 9,717,557 0.89 1,452 9,735,000 0.89 1,452 0.01 2013 10,830,000 707,157 10,122,843 0.84 1,615 10,830,000 0.90 1,615 0.01 2012 12,240,000 1,503,489 10,736,511 0.75 1,871 12,240,000 0.86 1,871 0.01 2011 17,015,000 535,314 16,479,686 0.94 2,589 14,130 17,029,130 0.97 2,591 0.01 2010 19,355,000 569,753 18,785,247 0.95 2,987 28,191 19,383,191 0.98 2,991 0.01 2009 12,040,000 622,112 11,417,888 0.63 1,847 417,989 12,457,989 0.69 1,911 0.01 2008 8,365,000 920,855 7,444,145 0.52 1,252 799,690 9,164,690 0.63 1,372 0.01 2007 9,300,000 748,814 8,551,186 0.76 1,661 694,872 9,994,872 0.89 1,785 0.01
Source: The source of this information is the District's financial records.
General Obligation Bonds
TOLLESON ELEMENTARY SCHOOL DISTRICT NO. 17OUTSTANDING DEBT BY TYPE
LAST TEN FISCAL YEARS
Total Outstanding Debt
General Obligation
Bonds
Amounts Restricted
for PrincipalCapital Leases
Page 142

Estimated EstimatedPercentage Amount
Debt Applicable to Applicable toOutstanding School District School District
Overlapping:Maricopa Community College District 654,190,000$ 0.49 % 3,205,531$ City of Tolleson 19,413,720 62.23 12,081,158 City of Avondale 28,560,000 5.52 1,576,512 City of Phoenix 1,526,775,000 0.31 4,733,003 Tolleson Union High School District No. 214 43,628,307 17.40 7,591,325
Subtotal, Overlapping Debt 29,187,529
Direct:Tolleson Elementary School District No. 17 7,830,000
Total Direct and Overlapping Governmental Activities Debt 37,017,529$
Net Direct General Obligation Bonded DebtAs a Percentage of Net Limited Assessed Valuation 5.31 %
Net Direct and Overlapping General Bonded DebtPer Capita 2,245$ As a Percentage of Net Limited Assessed Valuation 25.28 %As a Percentage of Estimated Gross Full Cash Value 2.49 %
Source:
Notes: 1)
2)
DIRECT AND OVERLAPPING GENERAL BONDED DEBT RATIOS
TOLLESON ELEMENTARY SCHOOL DISTRICT NO. 17DIRECT AND OVERLAPPING GOVERNMENTAL ACTIVITIES DEBT
JUNE 30, 2015
Governmental Unit
Estimated percentage of debt outstanding applicable to the District is calculated based on the District's secondary assessed valuation as a percentage of the secondary assessed valuation of the overlapping jurisdiction.Outstanding debt as of June 30, 2015 is presented for the overlapping governments as this is the most recent available information.
The source of this information is the District's records and the State and County Abstract of theAssessment Roll, Arizona Department of Revenue and the applicable governmental unit.
Page 143

Class B Bond Legal Debt Margin Calculation for Fiscal Year 2016: Total Legal Debt Margin Calculation for Fiscal Year 2016:Net full cash assessed valuation 180,139,017$ Net full cash assessed valuation 180,139,017$ Debt limit (10% of assessed value) 18,013,902 Debt limit (15% of assessed value) 27,020,853 Debt applicable to limit 7,830,000 Debt applicable to limit 7,830,000 Legal debt margin 10,183,902$ Legal debt margin 19,190,853$
2016 2015 2014 2013 2012
Debt Limit 27,020,853$ 22,439,340$ 20,753,383$ 23,915,629$ 29,194,531$
Total net debt applicable to limit 7,830,000 8,790,000 9,735,000 10,830,000 12,240,000
Legal debt margin 19,190,853$ 13,649,340$ 11,018,383$ 13,085,629$ 16,954,531$
Total net debt applicable to the limit as a percentage of debt limit 29% 39% 47% 45% 42%
2011 2010 2009 2008 2007
Debt Limit 36,727,309$ 41,271,992$ 36,161,824$ 29,198,513$ 22,638,411$
Total net debt applicable to limit 17,015,000 19,355,000 12,040,000 8,365,000 9,300,000
Legal debt margin 19,712,309$ 21,916,992$ 24,121,824$ 20,833,513$ 13,338,411$
Total net debt applicable to the limit as a percentage of debt limit 46% 47% 33% 29% 41%
Source:Notes: 1)
2) Bond premium is not subject to the statutory debt limit.
The District’s general obligation bonds are subject to two limits; the Constitutional debt limit (total debt limit) on all general obligationbonds and the statutory debt limit on Class B bonds. The calculations of the debt margins are presented in detail for the current fiscal yearonly.
TOLLESON ELEMENTARY SCHOOL DISTRICT NO. 17LEGAL DEBT MARGIN INFORMATION
LAST TEN FISCAL YEARS
Fiscal Year Ended June 30
The source of this information is the District's financial records.
Page 144

Estimated
Year Population (thousands)
2015 4,076,439 $ 184,784,917 $ 42,092 % 6,837 2014 4,087,191 168,483,421 41,222 6,750 2013 4,009,412 147,700,000 27,552 6,704 2012 3,942,000 147,724,392 37,474 6,704 2011 3,843,370 142,864,275 37,352 6,541 2010 3,817,117 142,091,618 35,319 6,573 2009 4,023,331 147,122,078 37,168 6,480 2008 3,987,942 139,665,253 36,135 6,520 2007 3,907,492 132,423,154 35,046 6,680 2006 3,792,675 120,716,738 33,178 5,600
Sources: The source of the "Personal Income" and "Per Capita" information is the Bureau of Economic Analysis.
The source of the "Population" and "Unemployment Rate" information from 2004 through 2010 is theUniversity of Arizona, Eller College of Management, Economic and Business Research Center. For 2011through 2015, the source of the information is the Arizona Office of Employment and Population Statistics.
5.5 5.9 6.2 7.1 8.4 8.3 8.3 4.9 3.2 3.5
TOLLESON ELEMENTARY SCHOOL DISTRICT NO. 17COUNTY-WIDE DEMOGRAPHIC AND ECONOMIC STATISTICS
LAST TEN CALENDAR YEARS
Personal Income Per Capita
IncomeUnemployment
RateDistrict
Population
Page 145

Percentage Percentageof Total of Total
Employees Employment Employees Employment
State of Arizona 31,800 1.69 % 34,600 1.88 %Banner Health Systems 27,200 1.45 16,000 0.87 Wal-Mart Stores Inc. 21,000 1.12 29,500 1.60 City of Phoenix 14,421 0.77 16,318 0.89 Maricopa County 12,800 0.68 13,000 0.71 Arizona State University 12,200 0.65 11,200 0.61 Wells Fargo Company 12,000 0.64 Fry's Food and Drug Stores 11,000 0.58 Intel Corp. 10,800 0.57 10,000 0.54 Honor Health 10,500 0.56 Bashas 14,000 0.76 Honeywell International 12,000 0.65 US Airways 9,900 0.54
Total 163,721 8.71 % 166,518 9.05 %
Total employment 1,880,900 1,838,500
Source: Note: The principal employer data is presented for the Greater Phoenix Area.
The source of this information is Business Journal Book of Lists.
TOLLESON ELEMENTARY SCHOOL DISTRICT NO. 17PRINCIPAL EMPLOYERS
CURRENT FISCAL YEAR AND FISCAL YEAR NINE YEARS PRIOR
Employer
2016 2007
Page 146

2016 2015 2014 2013 2012
SupervisoryPrincipals 4 4 4 4 4 Assistant principals 3 3 3 3 3
Total supervisory 7 7 7 7 7 Instruction
Teachers 148 144 136 140 127 Other professionals (instructional) 12 12 9 13 17 Aides 31 30 26 28 16
Total instruction 191 186 171 181 160 Student Services
Nurses 3 3 2 Health services 2 2 3 4 5 Librarians 3 3 3 3 4 Technicians 9 9 8 2 2
Total student services 17 17 16 9 11 Support and Administration
Office staff 8 8 8 9 12 Secretaries and clerical 10 10 10 6 5 Maintenance and custodial 10 10 10 9 8 Transportation 10 9 9 9 9 Technology 3 3 4 4 3 Food service 7 7 9 9 8 Other 7 7 8 5 4
Total support and administration 55 54 58 51 49
Total 270 264 252 248 227
(Continued)
Full-time Equivalent Employees as of June 30
LAST TEN FISCAL YEARS
TOLLESON ELEMENTARY SCHOOL DISTRICT NO. 17FULL-TIME EQUIVALENT DISTRICT EMPLOYEES BY TYPE
Page 147

2011 2010 2009 2008 2007
SupervisoryPrincipals 4 4 4 4 4 Assistant principals 3 3 3 3 2
Total supervisory 7 7 7 7 6 Instruction
Teachers 143 146 148 119 115 Other professionals (instructional) 23 15 19 40 39 Aides 18 18 17 19 15
Total instruction 184 179 184 178 169 Student Services
Nurses Health services 3 3 4 4 4 Librarians 2 1 8 4 4 Technicians 2 2 3 3
Total student services 5 6 14 11 11 Support and Administration
Office staff 8 9 11 10 9 Secretaries and clerical 8 8 9 11 12 Maintenance and custodial 8 9 19 20 20 Transportation 9 9 6 7 7 Technology 3 3 3 3 1 Food service 9 9 10 11 12 Other 4 4 12 2 3
Total support and administration 49 51 70 64 64
Total 245 243 275 260 250
Source:
(Concluded)
TOLLESON ELEMENTARY SCHOOL DISTRICT NO. 17FULL-TIME EQUIVALENT DISTRICT EMPLOYEES BY TYPE
LAST TEN FISCAL YEARS
The source of this information is District personnel records.
Page 148

FiscalYear Cost Cost Pupil-
Ended per Percentage per Percentage Teaching TeacherJune 30 Pupil Change Expenses Pupil Change Staff Ratio
2016 2,804 21,265,638$ 7,584$ (2.97) % 24,770,851$ 8,834$ 1.49 % 144 19.5 81.0 %2015 2,741 21,425,187 7,817 6.87 23,859,397 8,705 5.01 144 19.0 80.0 2014 2,632 19,251,449 7,314 1.41 21,816,729 8,289 4.46 136 19.4 80.0 2013 2,543 18,342,271 7,213 (1.13) 20,178,925 7,935 (8.84) 140 18.2 84.3 2012 2,567 18,727,283 7,295 (5.10) 22,343,745 8,704 (1.12) 127 20.2 81.0 2011 2,532 19,465,482 7,688 (2.48) 22,288,407 8,803 (5.71) 143 17.7 79.2 2010 2,640 20,812,106 7,883 4.78 24,646,837 9,336 10.53 146 18.1 80.3 2009 2,723 20,488,025 7,524 2.31 22,999,587 8,446 2.14 148 18.4 80.5 2008 2,781 20,452,218 7,354 7.71 22,997,231 8,269 7.66 119 23.4 76.6 2007 2,747 18,755,788 6,828 1.06 21,099,131 7,681 2.60 115 23.9 75.6 2004 1,898 12,822,810 6,756 15.41 14,208,500 7,486 N/A 85 22.3 74.8
Operating expenditures are total expenditures less debt service and capital outlay.The source of this information is the District's financial records.Source:
Note:
Average Daily
MembershipOperating
Expenditures
TOLLESON ELEMENTARY SCHOOL DISTRICT NO. 17OPERATING STATISTICSLAST TEN FISCAL YEARS
Percentage of
StudentsFree/Reduced
Page 149

2016 2015 2014 2013 2012 2011 2010 2009 2008 2007
SchoolsElementary
Buildings 25 25 25 30 30 30 30 28 26 26 Square feet 365,648 365,648 365,648 283,857 283,857 283,857 283,857 257,857 329,532 329,532 Capacity 3,500 3,500 3,500 3,300 3,300 3,300 3,300 3,300 3,300 3,300 Enrollment 2,991 3,193 2,813 2,796 2,700 2,700 2,750 2,750 2,900 2,900
AdministrativeBuildings 1 1 1 1 1 1 1 1 1 1 Square feet 12,000 12,000 12,000 12,000 12,000 12,000 12,000 12,000 12,000 12,000
TransportationGarages 1 1 1 1 1 1 1 1 1 1 Square feet (2) 14,665 14,665 14,665 11,860 11,860 11,860 11,860 11,860 11,860 11,860
AthleticsSoccer fields 3 3 3 3 2 2 2 2 2 2 Baseball/softball 4 4 4 4 4 4 4 4 4 4 Playgrounds 9 9 9 9 10 10 10 10 10 10
Source: The source of this information is the District's facilities records.
TOLLESON ELEMENTARY SCHOOL DISTRICT NO. 17CAPITAL ASSETS INFORMATION
LAST TEN FISCAL YEARS
Fiscal Year Ended June 30
Page 150