consumption of energy survey
TRANSCRIPT
Summary Report
2008 Commercial & Institutional Consumption of Energy Survey
Recycled paper
Cat. No. M141-17/1-2008 (Print) ISBN 978-1-100-53065-9
Cat No. M141-17/1-2008E-PDF (On-line) ISBN 978-1-100-18095-3
© Her Majesty the Queen in Right of Canada, 2011
Natural Resources Canada’s Office of Energy EfficiencyLeading Canadians to Energy Efficiency at Home, at Work and on the Road
Information contained in this publication or product may be reproduced, in part or in whole, and by any means, for personal or public non-commercial purposes, without charge or further permission, unless otherwise specified.
You are asked to:
‐ Exercise due diligence in ensuring the accuracy of the materials reproduced;
‐ Indicate both the complete title of the materials reproduced, as well as the author organization; and
‐ Indicate that the reproduction is a copy of an official work that is published by the Government of Canada and that the reproduction has not been produced in affiliation with, or with the endorsement of the Government of Canada.
Commercial reproduction and distribution is prohibited except with written permission from the Government of Canada’s copyright administrator, Public Works and Government Services of Canada (PWGSC). For more information, please contact PWGSC at: 613-996-6886 or at: [email protected].
2008 Commercial & Institutional Consumption of Energy Survey i
■■ ForEwordIn 2009, Statistics Canada conducted a fifth Commercial and Institutional Consumption of Energy Survey (CICES) for the Office of Energy Efficiency (OEE) of Natural Resources Canada (NRCan). This report presents the results of this survey, which are based on data gathered for 2008. CICES delivers on OEE’s mandate to strengthen and expand Canada's commitment to energy efficiency by improving our understanding of how and where energy is used, which in turn helps to identify energy efficiency opportunities and progress towards a more energy efficient economy.
The first survey in this series, entitled Consumption of Energy Survey, covered only universities, colleges and hospitals for 2003. The next survey, which collected data for 2004, covered nearly all segments of the Commercial and Institutional (C&I) sector. CICES 2005 and 2007 maintained the scope of CICES 2004, but added questions on the type of equipment used, the age of the building occupied by the establishment and the type of energy used for space heating, space cooling and water heating.
In the same vein, CICES 2008 was designed to collect data on the energy consumption of C&I sector establishments. The data collected is used to monitor energy consumption in the C&I sector and assist in the development and assessment of NRCan’s energy consumption reduction programs designed to support institutions and businesses. An example of such a program is the ecoENERGY for Buildings initiative, which encourages the construction of more energy-efficient buildings and retrofit to improve the efficiency of existing buildings.
This report on CICES 2008 was prepared by François Le Morvan. The project manager was Glen Ewaschuk, while overall direction was provided by Andrew Kormylo, of the Demand Policy and Analysis Division of the OEE. An electronic version of the publication is available on the OEE Web site at oee.nrcan.gc.ca/statistics.
For more information on this publication or the OEE’s services, please visit the Web site at oee.nrcan.gc.ca. You can also contact the OEE by e-mail at [email protected] or by writing to
Office of Energy Efficiency Natural Resources Canada 580 Booth Street Ottawa, Ontario K1A 0E4

2008 Commercial & Institutional Consumption of Energy Survey
ii
2008 Commercial & Institutional Consumption of Energy Survey
iii
■■ oTHEr oFFICE oF ENErGY EFFICIENCY SUrVEYS ANd PUBLICATIoNS
Over the past few years, the OEE has implemented several initiatives to collect energy data and estimate energy consumption in the C&I sector.
�� The Commercial and Institutional Building Energy Use Survey (CIBEUS) was the first survey of its kind in Canada. This survey gathered year 2000 data on energy consumption, energy intensity, and the physical and energy-efficient characteristics of C&I buildings located in Canada’s major urban centres.
�� As stated in the Foreword, the first Consumption of Energy Survey (CES) was based on year 2003 data. This survey focused exclusively on Canada's universities, colleges and hospitals. Unlike CIBEUS 2000, which only surveyed major urban centres, CES 2003 covered all ten Canadian provinces. Moreover, CES 2003 was based on the establishments as defined by the North American Industry Classification System (NAICS), while the CIBEUS 2000 defined its own building categories based on their usage and physical characteristics.
�� For the 2004 survey, the scope of CES was increased to cover a much broader cross-section of the C&I sector. To reflect this change, the survey was renamed the Commercial and Institutional Consumption of Energy Survey (CICES). The CICES survey was updated in 2005, 2007 and now 2008.
�� Each year, the OEE publishes its Energy Use Data Handbook. This handbook provides, among other items, data on energy consumption by activity type for the C&I sector, and various indicators that impact energy use. This database draws from diverse sources of information, including the above mentioned surveys and the Report on Energy Supply-Demand in Canada (described below).
�� Energy Efficiency Trends in Canada is a yearly publication that presents analysis based on data from the Energy Use Data Handbook. This report provides an overview of energy use and related greenhouse gas emissions in the C&I sector. In addition to providing detailed information about current energy intensity and energy efficiency, this report also analyses trends starting from 1990.
�� Through various other programs, the OEE has also published sectoral studies based on comparative analyses. These studies have centred on, among other subjects, the hospitality sector, the retail sector and schools. Owners of commercial buildings can use these studies to compare their facility’s energy consumption with that of similar facilities.
All of the above mentioned publications are available upon request from the OEE's Web site (oee.nrcan.gc.ca/statistics/publications).
The report on Energy Supply-demand in Canada (RESD), a yearly publication from Statistics Canada, also contains energy data from the C&I sector. The RESD presents data on the production, sale, inter-provincial transfer, and consumption of energy by sector. The estimates in the present document vary from those published in the RESD, as the two initiatives define the C&I sector differently, with the RESD’s definition being somewhat broader. Furthermore, there are several differences in methodology as the RESD estimates Canada’s energy supply and demand figures using supply and distribution models based on data from several annual surveys on energy availability (energy sales and distribution information reported by suppliers), as well as from many other data sources.
Note to readers:
All these surveys, handbooks and studies are fundamentally different in that there are important conceptual and methodological differences between them. Caution must therefore be exercised when directly comparing data from these sources.

2008 Commercial & Institutional Consumption of Energy Survey
iv
■■ TABLE oF CoNTENTS
2008 Commercial & Institutional Consumption of Energy Survey
v
ForEword ����������������������������������������������������������������������� i
oTHEr oFFICE oF ENErGY EFFICIENCY SUrVEYS ANd PUBLICATIoNS �������������������� iii
HIGHLIGHTS ��������������������������������������������������������������������� 1
dATA qUALITY �������������������������������������������������������������������� 1
1 Statistics on the Commercial & Institutional Sector in Canada ������������������������� 31.1 Number of establishments and floor area ������������������������������������������� 4
1.2 Energy consumption ���������������������������������������������������������� 6
1.3 Energy intensity ������������������������������������������������������������� 6
2 Energy Consumption and Energy Intensity in the regions ����������������������������� 92.1 Number of establishments ������������������������������������������������������ 9
2.2 Floor area ������������������������������������������������������������������ 11
2.3 Energy consumption ���������������������������������������������������������� 13
2.4 Energy intensity ������������������������������������������������������������ 15
3 Energy Consumption by Energy Source ������������������������������������������� 18
4 Floor Area �������������������������������������������������������������������� 204.1 Key variables by floor area category ���������������������������������������������� 20
4.2 Key variables by floor area category and by activity grouping ��������������������������� 21
4.3 Energy intensity by floor area category and by activity grouping ������������������������� 24
5 Building Age ������������������������������������������������������������������ 27
6 Energy Sources Used for Space Heating, Space Cooling and water Heating ������������� 306.1 Space heating �������������������������������������������������������������� 30
6.2 Space cooling �������������������������������������������������������������� 31
6.3 Water heating �������������������������������������������������������������� 32
7 Use of Auxiliary Equipment ������������������������������������������������������ 33
APPENdIX A — CLASSIFICATIoN oF CommErCIAL & INSTITUTIoNAL ESTABLISHmENTS ��� 35
APPENdIX B — mETHodoLoGY���������������������������������������������������� 37
APPENdIX C — GLoSSArY ��������������������������������������������������������� 41
APPENdIX d — qUESTIoNNAIrE ��������������������������������������������������� 45
APPENdIX E — BACKGroUNd dATA ������������������������������������������������ 52
APPENdIX F — SUmmArY oF 2007 CommErCIAL & INSTITUTIoNAL CoNSUmPTIoN oF ENErGY SUrVEY ��������������������������������������������������� 53

vi 2008 Commercial & Institutional Consumption of Energy Survey

2008 Commercial & Institutional Consumption of Energy Survey 1
■■ HIGHLIGHTS�� CICES 2008 estimated that the Canadian C&I sector in 2008 comprised almost 470 thousand establishments occupying 705 million square meters of floor area.
�� In 2008 CICES estimated the total energy consumption of C&I establishments at 866 million gigajoules (GJ). This is equivalent to the annual energy consumption of over 8 million Canadian households1, or close to two thirds of the Canadian housing sector.2
�� CICES found that the total energy intensity of establishments in the C&I sector was 1.23 GJ per square metre (m2) of floor area.
�� Based on establishment activity groupings, Religious Organizations had the lowest energy intensity (0.72 GJ/m2), followed by Elementary and Secondary Schools for which the energy intensity was 0.86 GJ/m2. Food Services and Drinking Places had the highest energy intensity (3.20 GJ/m2), followed by Hospitals (2.68 GJ/m2).
�� A regional comparison revealed that Ontario and Quebec had the lowest intensity levels among the C&I establishments, with rates of 1.02 GJ/m2 and 1.11 GJ/m2 respectively. On the other hand, the Prairie region had the highest intensity rate at 1.69 GJ/m2.
�� The main primary energy source for space heating was natural gas (52% of establishments). Electricity was the primary energy source used for space cooling (86% of establishments) and water heating (60% of establishments).
■■ dATA qUALITYThis report presents representative data estimates from CICES 2008 for C&I establishments in all Canadian provinces.
Certain rules established by Statistics Canada ensure the reliability of CICES 2008 data estimates for purposes of publication. The letters used in the tables of this report indicate the quality of each data estimate based on the degree of sampling error, as represented by the coefficient of variation.
The letter coding is as follows:
a — Very good
B — Acceptable
C — Use with caution
F — Too unreliable to be published or suppressed for reasons of confidentiality
Further detail on how the coefficient of variation is used to determine data quality is given in Appendix B, which describes the methodology used to conduct this survey.
1 Natural Resources Canada, 2007 Survey of Household Energy Use, Section 11 – Energy consumption and intensity, Table 11.2 – Total energy intensity, p.162. http://oee.nrcan.gc.ca/corporate/statistics/neud/dpa/data_e/sheu07/sheu_047_1.cfm?attr=0
2 Calculated with the data from 2007 Survey of Household Energy Use, Section 1 – Characteristics of households, Table 1.1 – General characteristics, p.2. http://oee.nrcan.gc.ca/corporate/statistics/neud/dpa/data_e/sheu07/sheu_001_1.cfm?attr=0
2008 Commercial & Institutional Consumption of Energy Survey
2
Limits oN the aNaLysis oF these resuLts
survey versus census results
It is important to note that CICES is a survey, not a census, of C&I sector establishments. Despite the best efforts of Statistics Canada to maintain a high level of quality for each of the survey’s various phases, the data estimates produced are inevitably subject to variance in the level of confidence, as is the case with any survey.
The data presented in this report are estimates. The real values differ from the estimates by less than two times the co-efficient of variation 19 times out of 20. The methodology used to calculate estimates, as well as to collect data, is summarized in Appendix B.
2008 Commercial & Institutional Consumption of Energy Survey
1 Statistics on the Commercial and Institutional Sector in Canada
3
1 Statistics on the Commercial & Institutional Sector in Canada
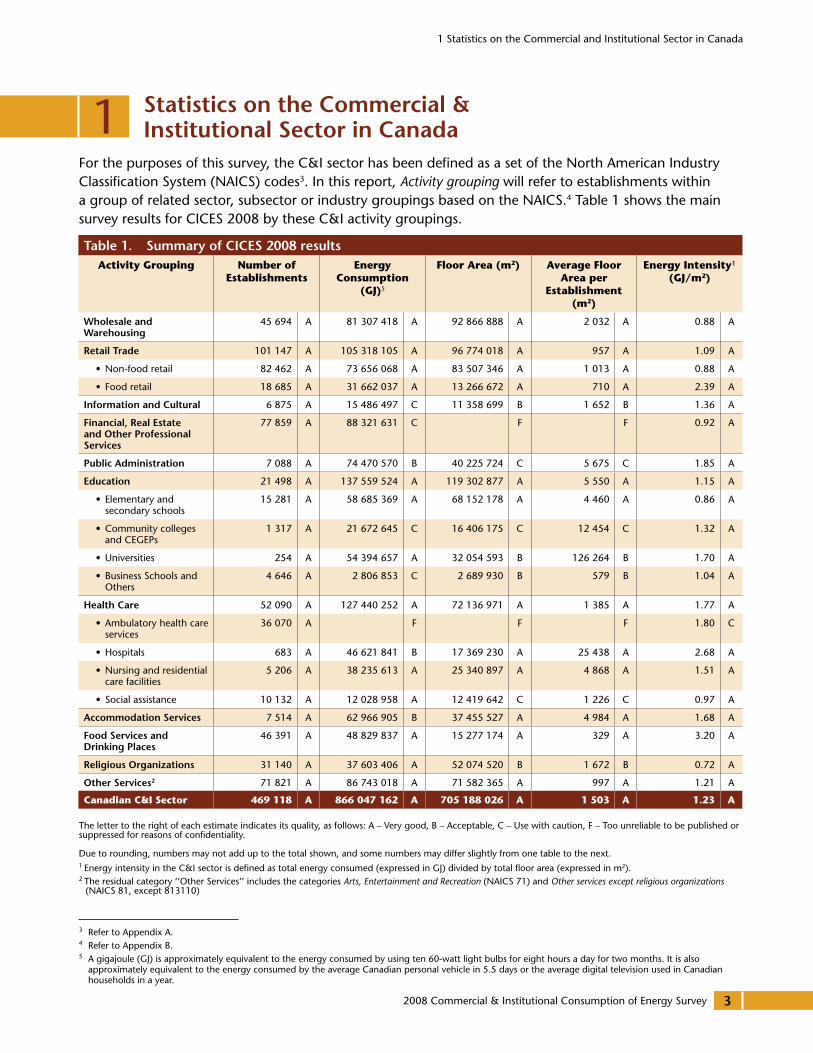
For the purposes of this survey, the C&I sector has been defined as a set of the North American Industry Classification System (NAICS) codes3. In this report, Activity grouping will refer to establishments within a group of related sector, subsector or industry groupings based on the NAICS.4 Table 1 shows the main survey results for CICES 2008 by these C&I activity groupings.5
The letter to the right of each estimate indicates its quality, as follows: A – Very good, B – Acceptable, C – Use with caution, F – Too unreliable to be published or suppressed for reasons of confidentiality.
Due to rounding, numbers may not add up to the total shown, and some numbers may differ slightly from one table to the next.1 Energy intensity in the C&I sector is defined as total energy consumed (expressed in GJ) divided by total floor area (expressed in m2).2 The residual category ‘‘Other Services’’ includes the categories Arts, Entertainment and Recreation (NAICS 71) and Other services except religious organizations
(NAICS 81, except 813110)
3 Refer to Appendix A.4 Refer to Appendix B.5 A gigajoule (GJ) is approximately equivalent to the energy consumed by using ten 60-watt light bulbs for eight hours a day for two months. It is also
approximately equivalent to the energy consumed by the average Canadian personal vehicle in 5.5 days or the average digital television used in Canadian households in a year.
Table 1. Summary of CICES 2008 results activity Grouping Number of
establish mentsenergy
Consumption (GJ)5
Floor area (m2) average Floor area per
establishment (m2)
energy intensity1(GJ/m2)
wholesale and warehousing
45 694 A 81 307 418 A 92 866 888 A 2 032 A 0.88 A
retail Trade 101 147 A 105 318 105 A 96 774 018 A 957 A 1.09 A
• Non-food retail 82 462 A 73 656 068 A 83 507 346 A 1 013 A 0.88 A
• Food retail 18 685 A 31 662 037 A 13 266 672 A 710 A 2.39 A
Information and Cultural 6 875 A 15 486 497 C 11 358 699 B 1 652 B 1.36 A
Financial, real Estate and other Professional Services
77 859 A 88 321 631 C F F 0.92 A
Public Administration 7 088 A 74 470 570 B 40 225 724 C 5 675 C 1.85 A
Education 21 498 A 137 559 524 A 119 302 877 A 5 550 A 1.15 A
• Elementary and secondary schools
15 281 A 58 685 369 A 68 152 178 A 4 460 A 0.86 A
• Community colleges and CEGEPs
1 317 A 21 672 645 C 16 406 175 C 12 454 C 1.32 A
• Universities 254 A 54 394 657 A 32 054 593 B 126 264 B 1.70 A
• Business Schools and Others
4 646 A 2 806 853 C 2 689 930 B 579 B 1.04 A
Health Care 52 090 A 127 440 252 A 72 136 971 A 1 385 A 1.77 A
• Ambulatory health care services
36 070 A F F F 1.80 C
• Hospitals 683 A 46 621 841 B 17 369 230 A 25 438 A 2.68 A
• Nursing and residential care facilities
5 206 A 38 235 613 A 25 340 897 A 4 868 A 1.51 A
• Social assistance 10 132 A 12 028 958 A 12 419 642 C 1 226 C 0.97 A
Accommodation Services 7 514 A 62 966 905 B 37 455 527 A 4 984 A 1.68 A
Food Services and drinking Places
46 391 A 48 829 837 A 15 277 174 A 329 A 3.20 A
religious organizations 31 140 A 37 603 406 A 52 074 520 B 1 672 B 0.72 A
other Services2 71 821 A 86 743 018 A 71 582 365 A 997 A 1.21 A
Canadian C&i sector 469 118 a 866 047 162 a 705 188 026 a 1 503 a 1.23 a
2008 Commercial & Institutional Consumption of Energy Survey
1 Statistics on the Commercial and Institutional Sector in Canada
4
1.1 Number of establishments and floor area
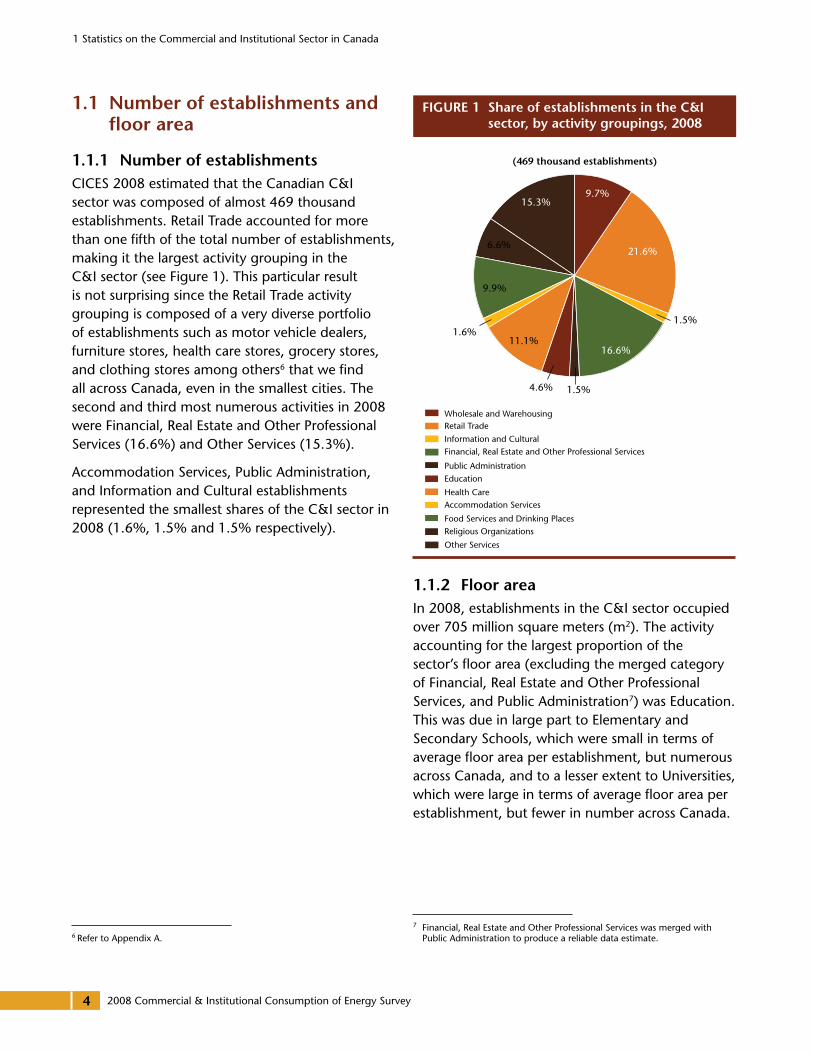
1.1.1 Number of establishmentsCICES 2008 estimated that the Canadian C&I sector was composed of almost 469 thousand establishments. Retail Trade accounted for more than one fifth of the total number of establishments, making it the largest activity grouping in the C&I sector (see Figure 1). This particular result is not surprising since the Retail Trade activity grouping is composed of a very diverse portfolio of establishments such as motor vehicle dealers, furniture stores, health care stores, grocery stores, and clothing stores among others6 that we find all across Canada, even in the smallest cities. The second and third most numerous activities in 2008 were Financial, Real Estate and Other Professional Services (16.6%) and Other Services (15.3%).
Accommodation Services, Public Administration, and Information and Cultural establishments represented the smallest shares of the C&I sector in 2008 (1.6%, 1.5% and 1.5% respectively).
6 Refer to Appendix A.
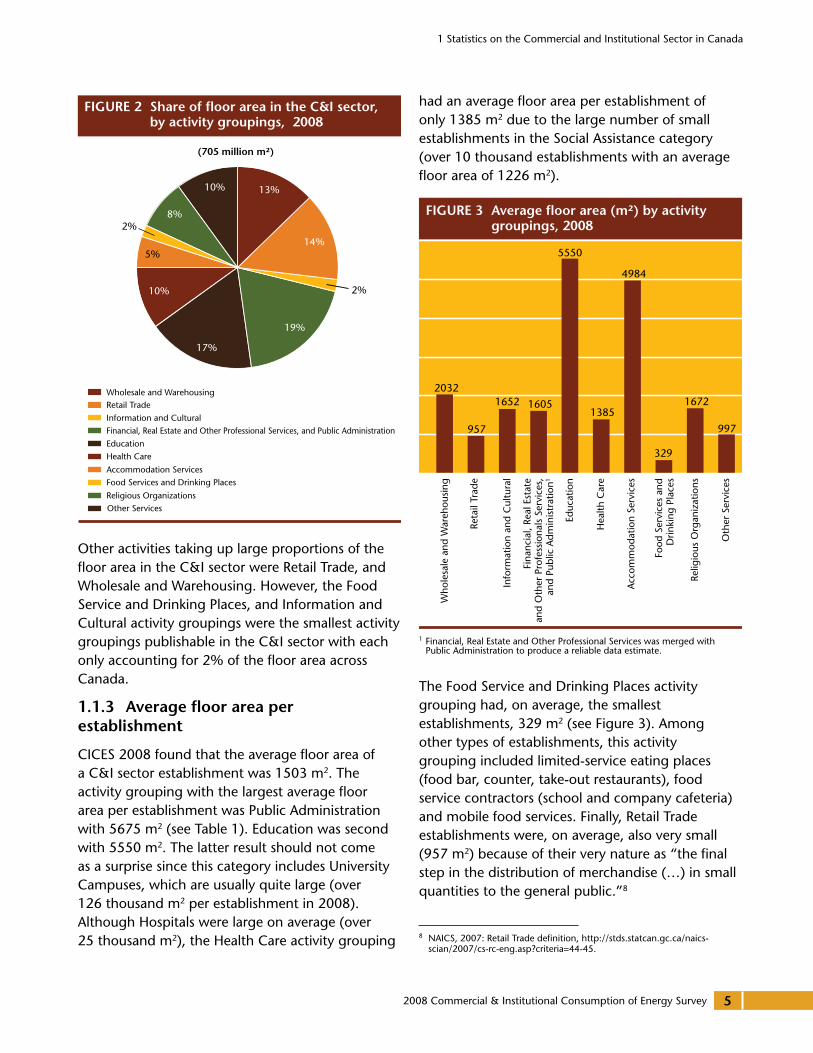
1.1.2 Floor areaIn 2008, establishments in the C&I sector occupied over 705 million square meters (m2). The activity accounting for the largest proportion of the sector’s floor area (excluding the merged category of Financial, Real Estate and Other Professional Services, and Public Administration7) was Education. This was due in large part to Elementary and Secondary Schools, which were small in terms of average floor area per establishment, but numerous across Canada, and to a lesser extent to Universities, which were large in terms of average floor area per establishment, but fewer in number across Canada.
7 Financial, Real Estate and Other Professional Services was merged with Public Administration to produce a reliable data estimate.
Wholesale and WarehousingRetail Trade
Information and CulturalFinancial, Real Estate and Other Professional Services
Public AdministrationEducation
Health CareAccommodation Services
Food Services and Drinking PlacesReligious Organizations
Other Services
15.3%9.7%
16.6%
21.6%6.6%
9.9%
1.6%11.1%
1.5%
4.6% 1.5%
(469 thousand establishments)
FIGURE 1 Share of establishments in the C&I sector, by activity groupings, 2008
2008 Commercial & Institutional Consumption of Energy Survey
1 Statistics on the Commercial and Institutional Sector in Canada
5
Other activities taking up large proportions of the floor area in the C&I sector were Retail Trade, and Wholesale and Warehousing. However, the Food Service and Drinking Places, and Information and Cultural activity groupings were the smallest activity groupings publishable in the C&I sector with each only accounting for 2% of the floor area across Canada.
1.1.3 Average floor area per establishment
CICES 2008 found that the average floor area of a C&I sector establishment was 1503 m2. The activity grouping with the largest average floor area per establishment was Public Administration with 5675 m2 (see Table 1). Education was second with 5550 m2. The latter result should not come as a surprise since this category includes University Campuses, which are usually quite large (over 126 thousand m2 per establishment in 2008). Although Hospitals were large on average (over 25 thousand m2), the Health Care activity grouping
had an average floor area per establishment of only 1385 m2 due to the large number of small establishments in the Social Assistance category (over 10 thousand establishments with an average floor area of 1226 m2).
1 Financial, Real Estate and Other Professional Services was merged with Public Administration to produce a reliable data estimate.
The Food Service and Drinking Places activity grouping had, on average, the smallest establishments, 329 m2 (see Figure 3). Among other types of establishments, this activity grouping included limited-service eating places (food bar, counter, take-out restaurants), food service contractors (school and company cafeteria) and mobile food services. Finally, Retail Trade establishments were, on average, also very small (957 m2) because of their very nature as “the final step in the distribution of merchandise (�) in small quantities to the general public.”8
8 NAICS, 2007: Retail Trade definition, http://stds.statcan.gc.ca/naics-scian/2007/cs-rc-eng.asp?criteria=44-45.
Wholesale and WarehousingRetail Trade
Information and CulturalFinancial, Real Estate and Other Professional Services, and Public Administration
EducationHealth Care
Accommodation ServicesFood Services and Drinking Places
Religious OrganizationsOther Services
10%
8%
13%
14%
19%
17%
10%
(705 million m²)
2%
2%
5%
FIGURE 2 Share of �oor area in the C&I sector, by activity groupings, 2008
FIGURE 3 Average �oor area (m²) by activity groupings, 2008
2032
957
1652 1605
5550
1385
4984
1672
997
329
Oth
er S
ervi
ces
Relig
ious
Org
aniz
atio
ns
Food
Ser
vice
s an
dD
rinki
ng P
lace
s
Acc
omm
odat
ion
Serv
ices
Hea
lth C
are
Educ
atio
n
Fina
ncia
l, Re
al E
stat
ean
d O
ther
Pro
fess
iona
ls S
ervi
ces,
and
Publ
ic A
dmin
istr
atio
n1
Info
rmat
ion
and
Cul
tura
l
Reta
il Tr
ade
Who
lesa
le a
nd W
areh
ousi
ng
2008 Commercial & Institutional Consumption of Energy Survey
1 Statistics on the Commercial and Institutional Sector in Canada
6
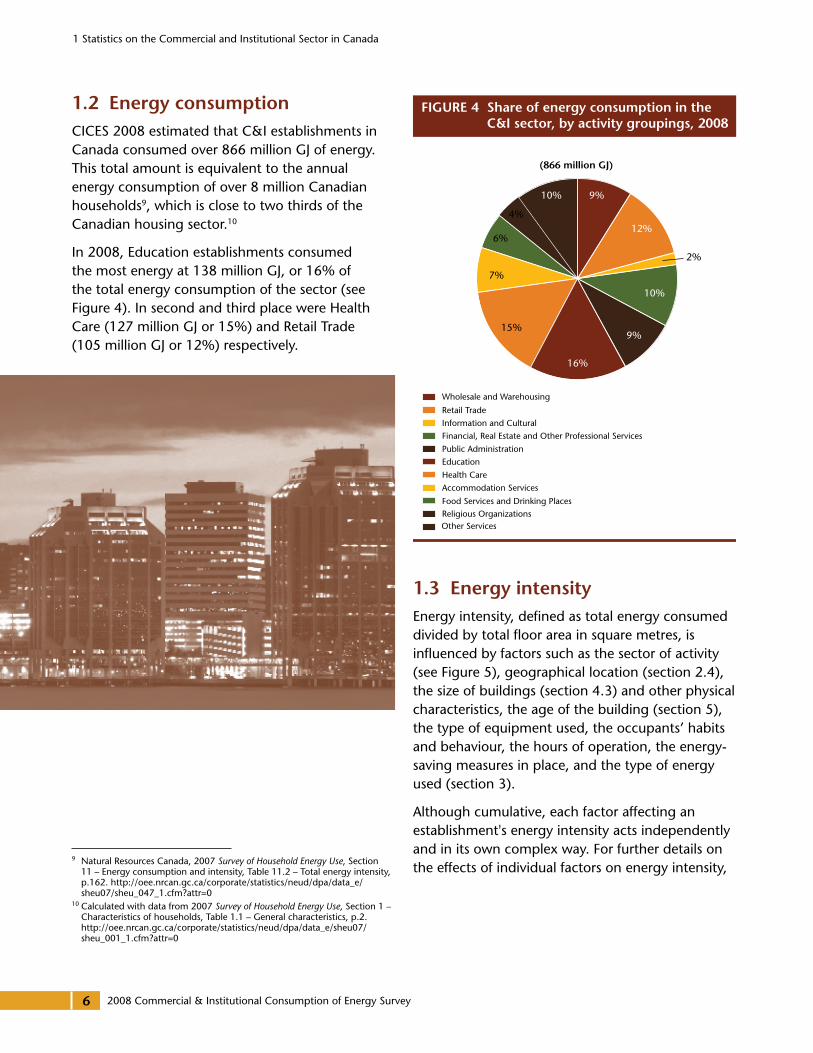
1.2 Energy consumptionCICES 2008 estimated that C&I establishments in Canada consumed over 866 million GJ of energy. This total amount is equivalent to the annual energy consumption of over 8 million Canadian households9, which is close to two thirds of the Canadian housing sector.10
In 2008, Education establishments consumed the most energy at 138 million GJ, or 16% of the total energy consumption of the sector (see Figure 4). In second and third place were Health Care (127 million GJ or 15%) and Retail Trade (105 million GJ or 12%) respectively.
9 Natural Resources Canada, 2007 Survey of Household Energy Use, Section 11 – Energy consumption and intensity, Table 11.2 – Total energy intensity, p.162. http://oee.nrcan.gc.ca/corporate/statistics/neud/dpa/data_e/sheu07/sheu_047_1.cfm?attr=0
10 Calculated with data from 2007 Survey of Household Energy Use, Section 1 – Characteristics of households, Table 1.1 – General characteristics, p.2. http://oee.nrcan.gc.ca/corporate/statistics/neud/dpa/data_e/sheu07/sheu_001_1.cfm?attr=0
1.3 Energy intensityEnergy intensity, defined as total energy consumed divided by total floor area in square metres, is influenced by factors such as the sector of activity (see Figure 5), geographical location (section 2.4), the size of buildings (section 4.3) and other physical characteristics, the age of the building (section 5), the type of equipment used, the occupants’ habits and behaviour, the hours of operation, the energy-saving measures in place, and the type of energy used (section 3).
Although cumulative, each factor affecting an establishment's energy intensity acts independently and in its own complex way. For further details on the effects of individual factors on energy intensity,
Wholesale and Warehousing
Retail TradeInformation and CulturalFinancial, Real Estate and Other Professional Services
Public AdministrationEducation
Health Care
Accommodation Services
Food Services and Drinking PlacesReligious OrganizationsOther Services
(866 million GJ)
10% 9%
12%
10%
9%
16%
15%
7%
6%
4%
FIGURE 4 Share of energy consumption in the C&I sector, by activity groupings, 2008
2%
2008 Commercial & Institutional Consumption of Energy Survey
1 Statistics on the Commercial and Institutional Sector in Canada
7
please refer to the Energy Efficiency Trends in Canada, which describes how energy use is affected by the level of activity, weather, structure, level of service and energy efficiency.11
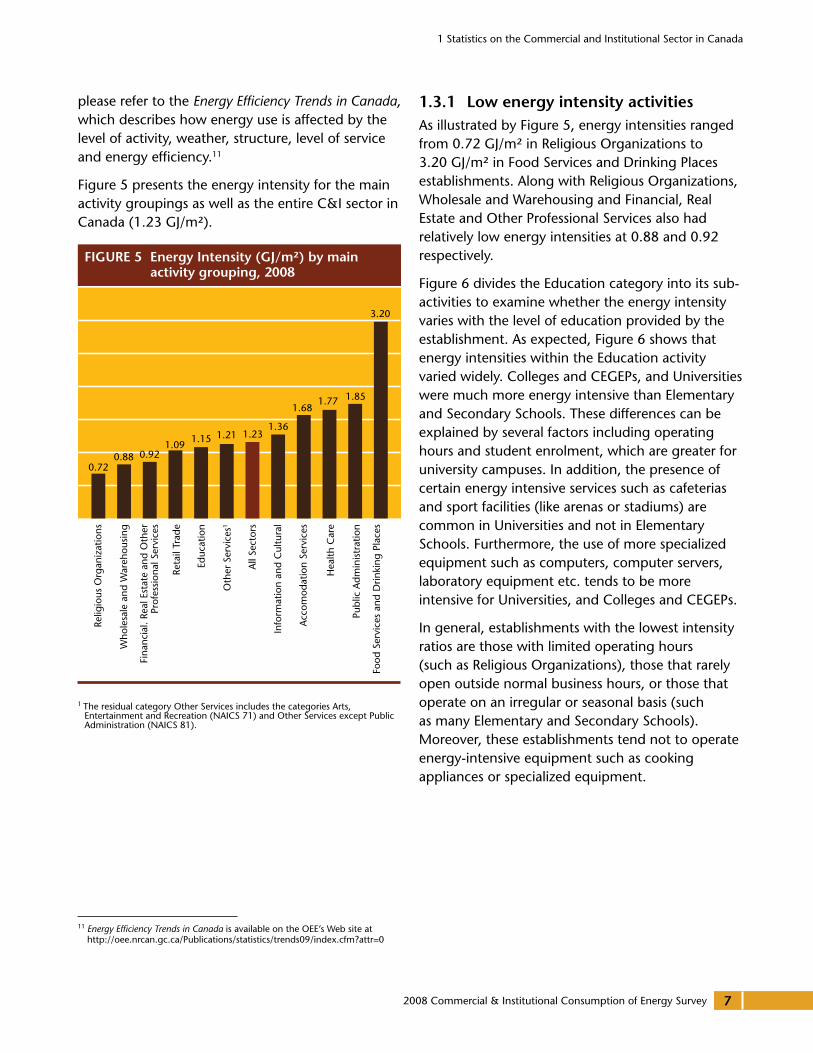
Figure 5 presents the energy intensity for the main activity groupings as well as the entire C&I sector in Canada (1.23 GJ/m²).
1 The residual category Other Services includes the categories Arts, Entertainment and Recreation (NAICS 71) and Other Services except Public Administration (NAICS 81).
11 Energy Efficiency Trends in Canada is available on the OEE’s Web site at http://oee.nrcan.gc.ca/Publications/statistics/trends09/index.cfm?attr=0
1.3.1 Low energy intensity activitiesAs illustrated by Figure 5, energy intensities ranged from 0.72 GJ/m² in Religious Organizations to 3.20 GJ/m² in Food Services and Drinking Places establishments. Along with Religious Organizations, Wholesale and Warehousing and Financial, Real Estate and Other Professional Services also had relatively low energy intensities at 0.88 and 0.92 respectively.
Figure 6 divides the Education category into its sub-activities to examine whether the energy intensity varies with the level of education provided by the establishment. As expected, Figure 6 shows that energy intensities within the Education activity varied widely. Colleges and CEGEPs, and Universities were much more energy intensive than Elementary and Secondary Schools. These differences can be explained by several factors including operating hours and student enrolment, which are greater for university campuses. In addition, the presence of certain energy intensive services such as cafeterias and sport facilities (like arenas or stadiums) are common in Universities and not in Elementary Schools. Furthermore, the use of more specialized equipment such as computers, computer servers, laboratory equipment etc. tends to be more intensive for Universities, and Colleges and CEGEPs.
In general, establishments with the lowest intensity ratios are those with limited operating hours (such as Religious Organizations), those that rarely open outside normal business hours, or those that operate on an irregular or seasonal basis (such as many Elementary and Secondary Schools). Moreover, these establishments tend not to operate energy-intensive equipment such as cooking appliances or specialized equipment.
FIGURE 5 Energy Intensity (GJ/m²) by main activity grouping, 2008
Food
Ser
vice
s an
d D
rinki
ng P
lace
s
Publ
ic A
dmin
istr
atio
n
Hea
lth C
are
Acc
omod
atio
n Se
rvic
es
Info
rmat
ion
and
Cul
tura
l
All
Sect
ors
Oth
er S
ervi
ces1
Educ
atio
n
Reta
il Tr
ade
Fina
ncia
l. Re
al E
stat
e an
d O
ther
Prof
essi
onal
Ser
vice
s
Who
lesa
le a
nd W
areh
ousi
ng
Relig
ious
Org
aniz
atio
ns
0.720.88 0.92
1.091.15 1.21 1.23
1.36
1.681.77 1.85
3.20

2008 Commercial & Institutional Consumption of Energy Survey
1 Statistics on the Commercial and Institutional Sector in Canada
8
1.3.2 High energy intensity activitiesThe Information and Cultural activity, which includes Broadcasting and Telecommunications industries, had a high energy intensity (1.36 GJ/m²). This could be, in part, due to the intensive utilization of electronics for broadcasting and telecommunication operations. Moreover, these industries tend to have longer hours of operation.
As expected, Health Care was one of the most energy intensive activities at 1.77 GJ/m² (see Figure 7). Like the Education activity grouping, the Health Care activity is composed of four broad categories of establishments that are expected to have various energy intensities. The Hospitals component with its very high energy intensity (2.68 GJ/m²) pulled the energy intensity of the entire Health Care activity upward, largely because of the high concentration of medical equipment, the extended business hours and the servicing of patients round the clock.
Finally, the Food Services and Drinking Places activity was the most energy intensive activity at 3.20 GJ/m2 (see Figure 5). This result might be caused by the extensive use of high energy-using appliances such as freezers, refrigerators and cooking equipment in a relatively compact floor area.
FIGURE 7 Energy intensity (GJ/m²) in the Health Care activity grouping, 2008
Hos
pita
ls
Am
bula
tory
Hea
lth C
are
Hea
lth C
are
Nur
sing
and
Resi
dent
ial C
are
Soci
al A
ssis
tanc
e
1.51
1.77 1.80
2.68
0.97Uni
vers
itite
s
Col
lege
s an
dC
EGEP
s
Educ
atio
n
Busi
ness
Sch
ools
and
Oth
er
Elem
enta
ry a
ndSe
cond
ary
Scho
ols
0.86
1.041.15
1.32
1.70
FIGURE 6 Energy intensity (GJ/m²) in the Education activity, 2008
2008 Commercial & Institutional Consumption of Energy Survey
2 Energy Consumption and Energy Intensity in the Regions
9
This section examines the survey's overall regional results. Since the number of establishments, the energy consumption, the floor area and the energy intensity are all functions of the sector’s structure, this report breaks down the regional results by
activity grouping.
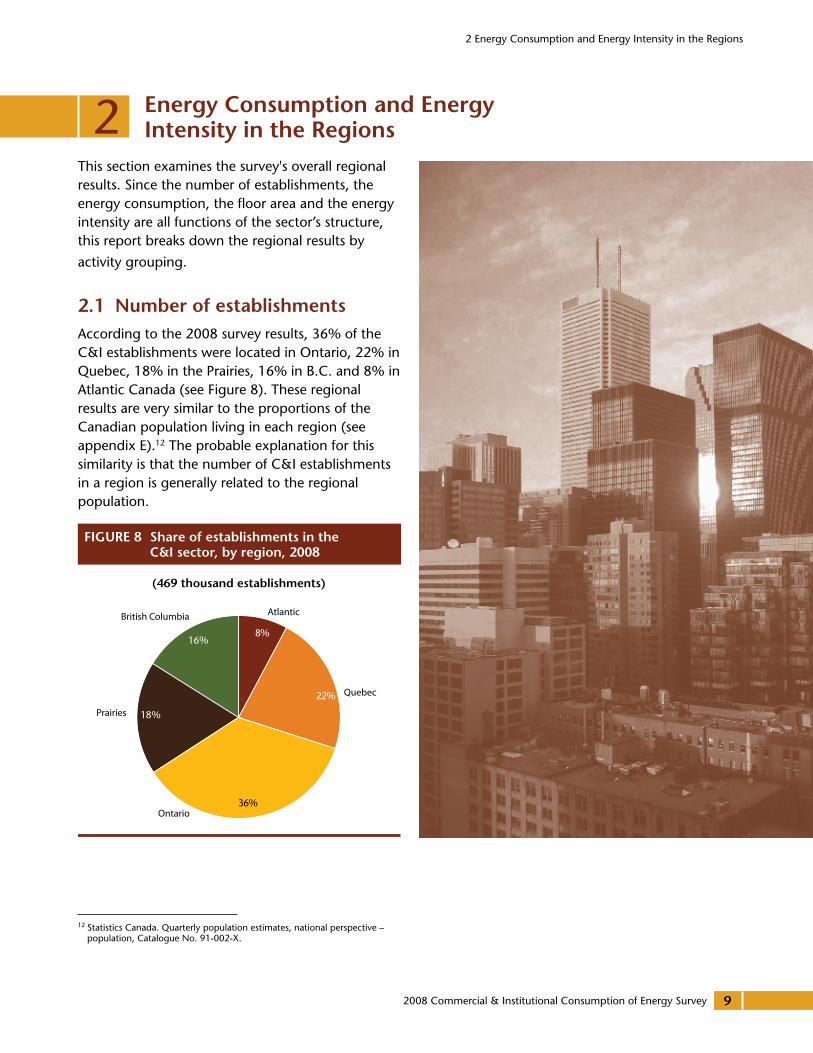
2.1 Number of establishmentsAccording to the 2008 survey results, 36% of the C&I establishments were located in Ontario, 22% in Quebec, 18% in the Prairies, 16% in B.C. and 8% in Atlantic Canada (see Figure 8). These regional results are very similar to the proportions of the Canadian population living in each region (see appendix E).12 The probable explanation for this similarity is that the number of C&I establishments in a region is generally related to the regional population.
12 Statistics Canada. Quarterly population estimates, national perspective – population, Catalogue No. 91-002-X.
FIGURE 8 Share of establishments in the C&I sector, by region, 2008
(469 thousand establishments)
British Columbia
Prairies
Ontario
Quebec
Atlantic
16%
18%
22%
36%
8%
2 Energy Consumption and Energy Intensity in the regions
2008 Commercial & Institutional Consumption of Energy Survey
2 Energy Consumption and Energy Intensity in the Regions
10
The letter to the right of each estimate indicates its quality, as follows: A – Very good, B – Acceptable, C – Use with caution, F – Too unreliable to be published or suppressed for reasons of confidentiality.
Due to rounding, numbers may not add up to the total shown, and some numbers may differ slightly from one table to the next.1 The residual category ‘‘Other Services’’ includes the categories Arts, Entertainment and Recreation (NAICS 71) and Other services except religious organizations
(NAICS 81, except 813110).
Table 2. Number of establishments by activity grouping, by region, 2008activity Grouping Number of establishments
Canada atlantic Quebec ontario Prairies British Columbia
wholesale and warehousing
45 694 A 2 787 A 9 592 A 18 518 A 7 956 A 6 842 A
retail Trade 101 147 A 8 114 A 25 344 A 33 657 A 18 531 A 15 502 A
• Non-food retail 82 462 A 6 499 A 20 838 A 27 074 A 15 103 A 12 947 A
• Food retail 18 685 A 1 615 A 4 505 A 6 583 A 3 428 A 2 554 A
Information and Cultural
6 875 A 482 A 1 588 A 2 246 A 1 096 A 1 462 A
Financial, real Estate and other Professional Services
77 859 A 4 840 A 17 804 A 31 968 A 11 349 A 11 899 A
Public Administration 7 088 A 1 287 A 1 736 A 1 151 A 2 349 A 565 A
Education 21 498 A 1 707 A 4 403 A 8 033 A 4 298 A 3 057 A
• Elementary and secondary schools
15 281 A 1 104 A 3 215 A 5 772 A 3 252 A 1 937 A
• Community colleges and CEGEPs
1 317 A 199 A 192 A 366 B 308 A 252 B
• Universities 254 A 34 A 36 A 94 A 47 A 43 A
• Business Schools and Others
4 646 A 369 A 960 A 1 802 A 690 A 824 A
Health Care 52 090 A 3 856 A 10 369 A 18 638 A 10 500 A 8 729 A
• Ambulatory health care services
36 070 A 2 324 B 5 808 A 13 928 A 7 157 B 6 853 A
• Hospitals 683 A 99 A 89 A 162 A 241 A 92 A
• Nursing and residential care facilities
5 206 A 556 A 1 630 A 1 514 A 924 A 582 A
• Social assistance 10 132 A 877 A 2 842 A 3 034 A 2 178 A 1 202 A
Accommodation Services
7 514 A 958 A 1 549 A 2 251 A 1 552 A 1 204 A
Food Services and drinking Places
46 391 A 3 240 A 10 870 A 17 540 A 7 317 A 7 425 A
religious organizations 31 140 A 3 502 A 4 593 A 11 680 A 7 530 A 3 835 A
other Services1 71 821 A 5 988 A 15 885 A 24 438 A 12 518 A 12 991 A
total 469 118 a 36 760 a 103 732 a 170 120 a 84 996 a 73 510 a
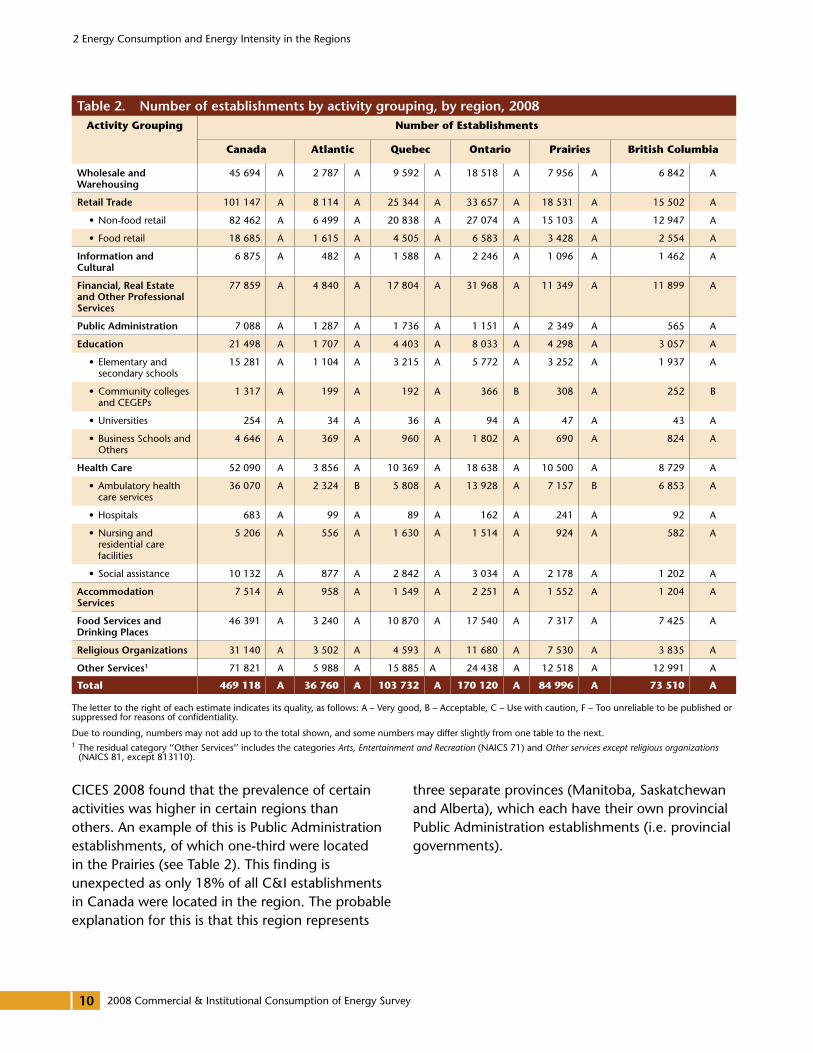
CICES 2008 found that the prevalence of certain activities was higher in certain regions than others. An example of this is Public Administration establishments, of which one-third were located in the Prairies (see Table 2). This finding is unexpected as only 18% of all C&I establishments in Canada were located in the region. The probable explanation for this is that this region represents
three separate provinces (Manitoba, Saskatchewan and Alberta), which each have their own provincial Public Administration establishments (i.e. provincial governments).
2008 Commercial & Institutional Consumption of Energy Survey
2 Energy Consumption and Energy Intensity in the Regions
11
A similar situation is observed in the Atlantic region (which represents four provincial jurisdictions), which had only 8% of the C&I sector establishments in Canada, but 18% of the Public Administration establishments. It follows that this was not the case in the single-jurisdiction regions of Ontario, Quebec and British Columbia. For instance, though 36% of the country's C&I establishments were located in Ontario, the province had only 16% of all Public Administration establishments.
Although Health Care establishments were evenly distributed across the regions, that was not the case for the sub-activities associated with Health Care. For instance, Quebec, which had 20% of all Health Care establishments in Canada, possessed 31% of Nursing and Residential Care and 28% of the Social Assistance establishments. Also, more than one third (35%) of all Canadian hospitals were located in the Prairies region. Again, the probable explanation for this is that this region consists of three distinct and geographically large jurisdictions.
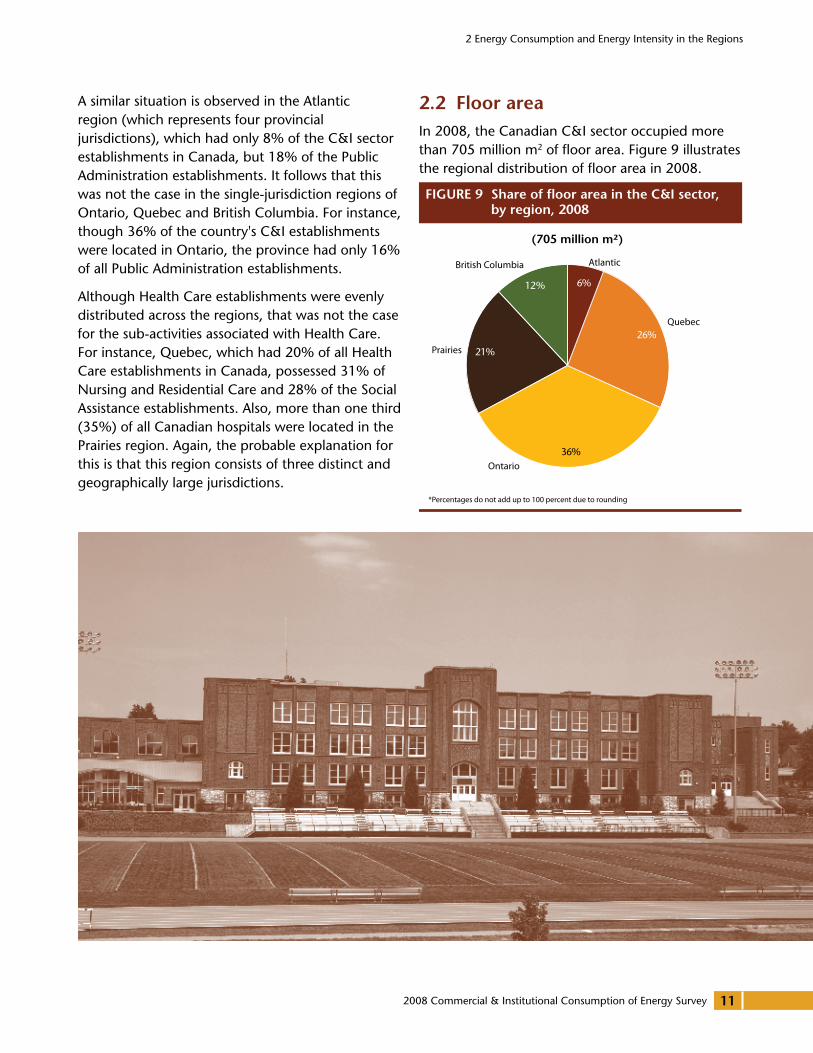
2.2 Floor areaIn 2008, the Canadian C&I sector occupied more than 705 million m2 of floor area. Figure 9 illustrates the regional distribution of floor area in 2008.
FIGURE 9 Share of �oor area in the C&I sector, by region, 2008
(705 million m²)
British Columbia Atlantic
Quebec
Ontario
Prairies
*Percentages do not add up to 100 percent due to rounding
12%
21%
26%
36%
6%

2008 Commercial & Institutional Consumption of Energy Survey
2 Energy Consumption and Energy Intensity in the Regions
12
The letter to the right of each estimate indicates its quality, as follows: A – Very good, B – Acceptable, C – Use with caution, F – Too unreliable to be published or suppressed for reasons of confidentiality.
Due to rounding, numbers may not add up to the total shown, and some numbers may differ slightly from one table to the next.1 The residual category ‘‘Other Services’’ includes the categories Arts, Entertainment and Recreation (NAICS 71) and Other services except religious organizations
(NAICS 81, except 813110).
Table 3. Floor area of establishments by activity grouping, by region, 2008
activity GroupingFloor area (m2)
Canada atlantic Quebec ontario PrairiesBritish
Columbia
wholesale and warehousing
92 866 888 A 5 077 692 B 12 976 815 A 37 986 817 A 25 708 779 C 11 116 785 A
retail Trade 96 774 018 A 8 041 264 B 18 071 638 A 34 037 465 C 18 469 360 A 18 154 291 B
• Non-food retail 83 507 346 A 6 841 028 C 14 518 265 A F 15 788 873 A 16 205 237 C
• Food retail 13 266 672 A 1 200 236 A 3 553 373 A 3 883 522 A 2 680 488 A 1 949 053 C
Information and Cultural
11 358 699 B 1 084 371 B F 3 248 015 B F 681 830 B
Financial, real Estate and other Professional Services
F 1 664 026 A F 15 412 250 B 7 703 213 C F
Public Administration 40 225 724 C F F 21 999 738 C 8 546 367 B F
Education 119 302 877 A 10 034 771 A 23 759 029 A 35 352 268 A 32 683 164 B 17 473 645 A
• Elementary and secondary schools
68 152 178 A 5 228 991 A 14 130 207 B 21 669 274 A 17 281 675 B 9 842 032 A
• Community colleges and CEGEPs
16 406 175 C 1 676 018 C 3 357 013 C F F F
• Universities 32 054 593 B 2 921 120 A 5 604 391 B F 8 853 118 B F
• Business Schools and Others
2 689 930 B 208 643 B F 879 765 A F 413 172 C
Health Care 72 136 971 A 4 823 636 A 17 858 046 B 27 216 907 B F F
• Ambulatory health care services
F 464 296 B F F F F
• Hospitals 17 369 230 A 1 774 177 A 4 075 575 A 5 543 735 A F 2 387 802 B
• Nursing and residential care facilities
25 340 897 A 1 669 368 B 8 957 578 C 7 717 613 A 5 916 637 C 1 079 701 B
• Social assistance 12 419 642 C 915 795 C 2 092 943 A F 2 339 395 C 756 700 C
Accommodation Services
37 455 527 A 2 262 858 A F 11 556 600 B F 4 387 735 B
Food Services and drinking Places
15 277 174 A 827 236 A 4 247 061 B 5 567 853 A 2 014 240 A 2 620 784 B
religious organizations
52 074 520 B 3 446 770 A 10 115 062 A F 8 445 465 A 3 870 422 A
other Services1 71 582 365 A 3 408 887 A 16 973 967 C 31 993 010 B 11 030 250 B 8 176 252 B
total 705 188 026 a 42 740 303 a 180 826 204 B 250 567 723 a 147 710 570 a 83 343 225 a
Ontario represented 55% of Canada’s Public Administration’s floor area, yet only 36% of the C&I sector floor area (see Table 3). This result was somewhat surprising as this province has only 16% of the Public Administration establishments. One
potential explanation could be that provincial public institutions in Ontario are centralized, therefore using fewer, but larger establishments. This region also includes the city of Ottawa, which contains very large federal government establishments.
2008 Commercial & Institutional Consumption of Energy Survey
2 Energy Consumption and Energy Intensity in the Regions
13
Although the province of Quebec represented more than a quarter of all floor area in the C&I sector, only small proportions of the floor area of the Wholesale and Warehousing, and the Social Assistance activities were located in this province, 14% and 17% respectively. On the other hand, Nursing and Residential Care had a disproportionate share of its floor area in Quebec (35%), where 23% of the Canadian population lives.
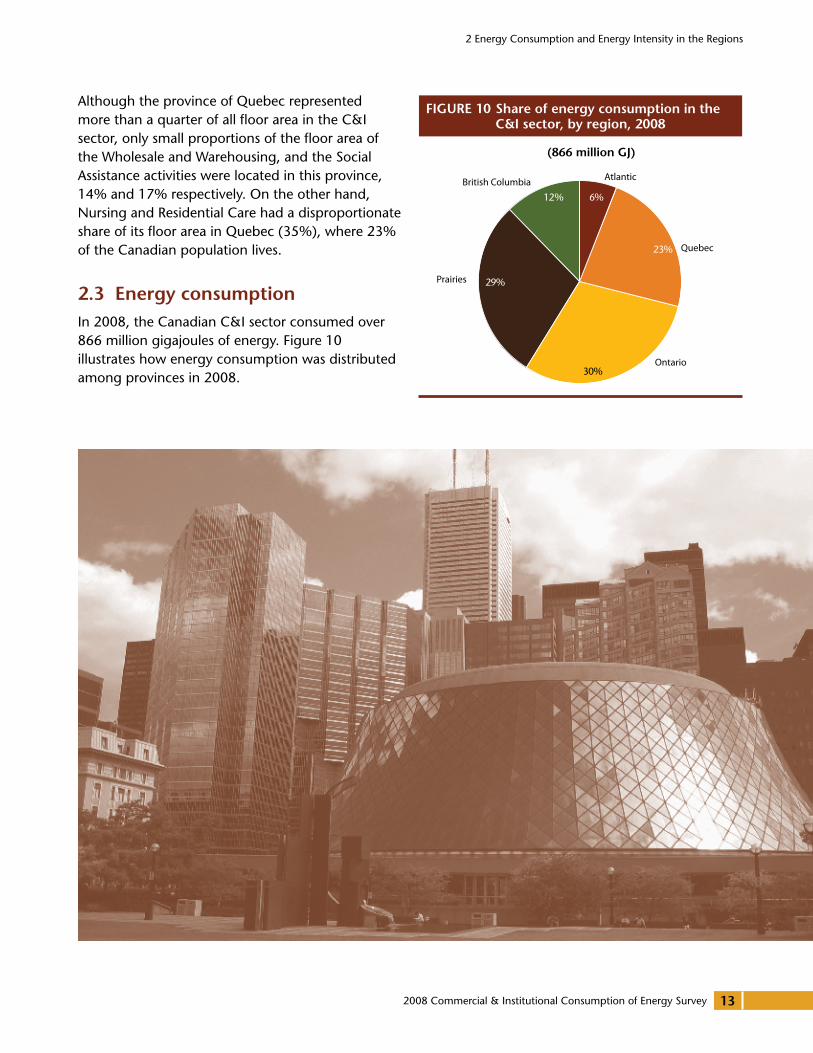
2.3 Energy consumptionIn 2008, the Canadian C&I sector consumed over 866 million gigajoules of energy. Figure 10 illustrates how energy consumption was distributed among provinces in 2008.
FIGURE 10 Share of energy consumption in the C&I sector, by region, 2008
(866 million GJ)
British Columbia Atlantic
Prairies
Ontario
Quebec
12%
29%
23%
30%
6%
2008 Commercial & Institutional Consumption of Energy Survey
2 Energy Consumption and Energy Intensity in the Regions
14
The letter to the right of each estimate indicates its quality, as follows: A – Very good, B – Acceptable, C – Use with caution, F – Too unreliable to be published or suppressed for reasons of confidentiality.
Due to rounding, numbers may not add up to the total shown, and some numbers may differ slightly from one table to the next.1 The residual category ‘‘Other Services’’ includes the categories Arts, Entertainment and Recreation (NAICS 71) and Other services except religious organizations
(NAICS 81, except 813110).
Table 4. Energy consumption of establishments by activity grouping, by region, 2008
activity Groupingenergy Consumption (GJ)
Canada atlantic Quebec ontario PrairiesBritish
Columbia
wholesale and warehousing
81 307 418 A 7 069 275 B 8 867 677 A 33 191 760 A F 10 233 821 B
retail Trade 105 318 105 A 7 994 741 B 24 436 603 A 26 897 570 A 25 417 912 A 20 571 278 B
• Non-food retail 73 656 068 A 6 410 376 C 14 341 804 A 17 800 202 B 18 297 777 A 16 805 909 C
• Food retail 31 662 037 A 1 584 365 A 10 094 798 B 9 097 368 A 7 120 135 A 3 765 370 A
Information and Cultural
15 486 497 C F F 2 349 007 A F 670 772 B
Financial, real Estate and other Professional Services
88 321 631 C 1 696 556 C F 14 149 520 B F F
Public Administration
74 470 570 B F F 29 250 543 C 30 289 727 C F
Education 137 559 524 A 11 194 379 A 20 962 913 A 32 239 512 A 52 005 791 B 21 156 929 B
• Elementary and secondary schools
58 685 369 A 3 501 832 B 9 831 303 B 16 345 855 A 19 334 471 C 9 671 908 B
• Community colleges and CEGEPs
21 672 645 C F 3 156 833 C F F F
• Universities 54 394 657 A 5 585 520 B 7 220 205 B F 20 863 847 C F
• Business Schools and Others
2 806 853 C 239 839 B F 768 967 B F 254 929 C
Health Care 127 440 252 A 7 821 027 A 33 452 364 B 39 844 066 A F F
• Ambulatory health care services
F 555 019 C F F F F
• Hospitals 46 621 841 B 4 702 764 A 7 718 775 A 14 157 781 A F 4 474 961 B
• Nursing and residential care facilities
38 235 613 A 1 933 236 B 16 381 772 C 11 019 078 A 7 736 196 B 1 165 332 B
• Social assistance 12 028 958 A 630 008 C 2 258 661 B 5 078 925 C 3 553 162 C 508 201 C
Accommodation Services
62 966 905 A 2 039 993 A F 12 365 603 B F 6 792 901 A
Food Services and drinking Places
48 829 837 A 2 439 926 A 11 577 600 A 16 170 737 A 9 138 978 B 9 502 596 B
religious organizations
37 603 406 A 2 395 570 A 7 433 048 A 19 114 607 A 6 168 303 A 2 491 878 A
other Services1 86 743 018 A 3 423 988 B 24 115 785 C 31 109 517 B 18 061 879 B 10 031 849 C
total 866 047 162 a 52 968 665 a 201 253 253 a 256 682 441 a 249 509 033 a 105 633 770 a
2008 Commercial & Institutional Consumption of Energy Survey
2 Energy Consumption and Energy Intensity in the Regions
15
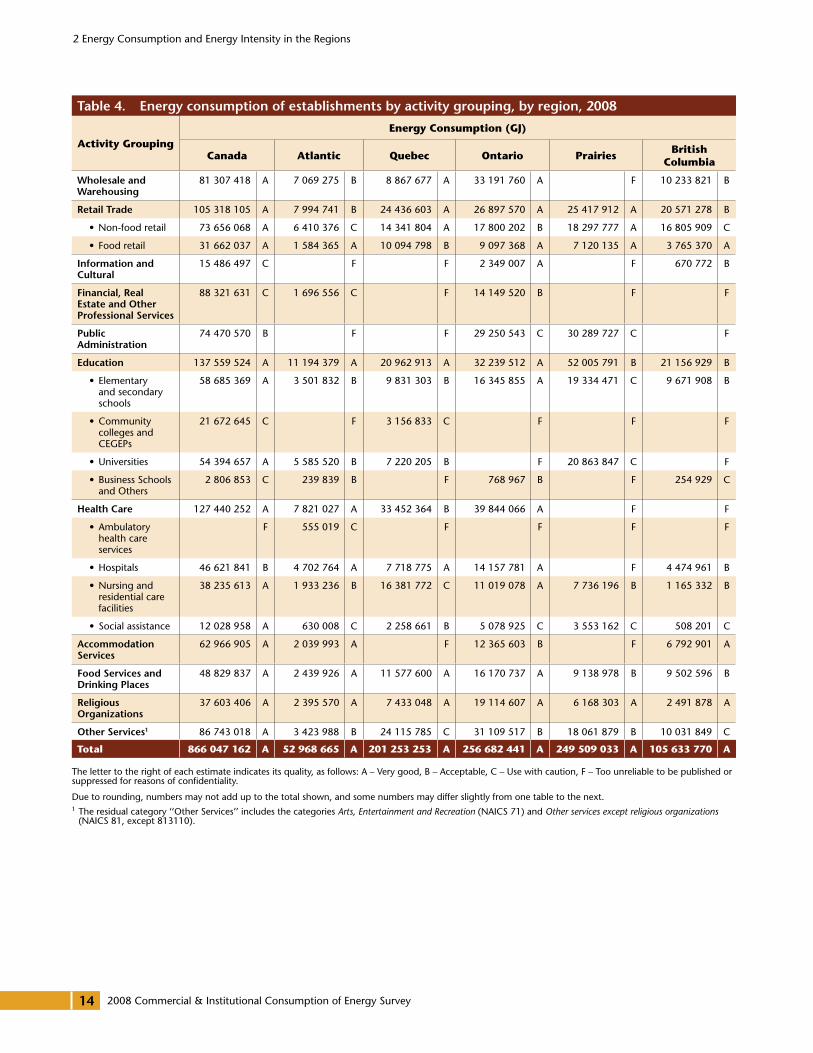
The Nursing and Residential Care establishments in Quebec consumed 43% of the activity grouping’s energy for all of Canada (see Table 4). This high level of consumption was mainly caused by the high proportion of Nursing and Residential Care establishments (31%) and their associated floor area (35%) located in the province compared to the rest of the country.
In 2008, Education establishments located in the Prairies used 38% of the energy consumed by this activity grouping in Canada. This is despite the fact that the region only had 27% of this activity’s floor area and 20% of its establishments.
Another activity grouping that consumed a significant proportion of its energy in the Prairies was Public Administration. This result can be explained by the fact that a large portion of Public Administration establishments were located in the region (see Table 2).
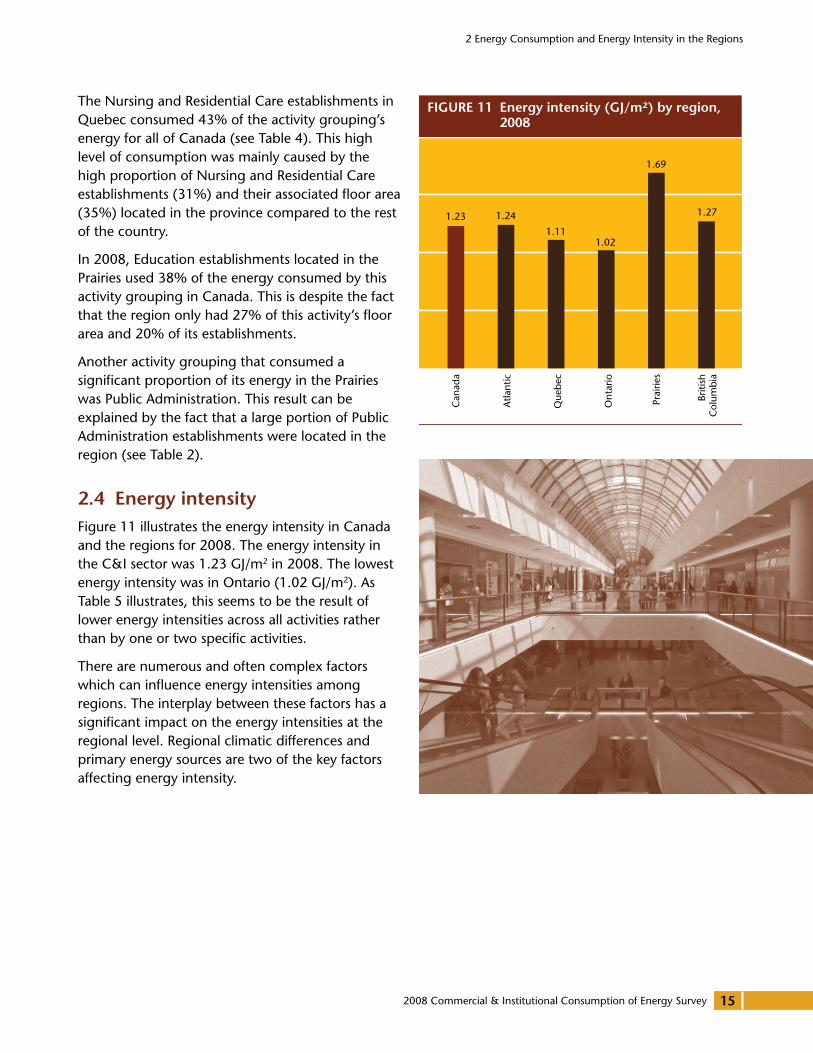
2.4 Energy intensity Figure 11 illustrates the energy intensity in Canada and the regions for 2008. The energy intensity in the C&I sector was 1.23 GJ/m2 in 2008. The lowest energy intensity was in Ontario (1.02 GJ/m2). As Table 5 illustrates, this seems to be the result of lower energy intensities across all activities rather than by one or two specific activities.
There are numerous and often complex factors which can influence energy intensities among regions. The interplay between these factors has a significant impact on the energy intensities at the regional level. Regional climatic differences and primary energy sources are two of the key factors affecting energy intensity.
Briti
shC
olum
bia
Prai
ries
Ont
ario
Que
bec
Atla
ntic
Can
ada
1.23 1.24
1.111.02
1.69
1.27
FIGURE 11 Energy intensity (GJ/m²) by region, 2008
2008 Commercial & Institutional Consumption of Energy Survey
2 Energy Consumption and Energy Intensity in the Regions
16
The letter to the right of each estimate indicates its quality, as follows: A – Very good, B – Acceptable, C – Use with caution, F – Too unreliable to be published or suppressed for reasons of confidentiality.
Due to rounding, numbers may not add up to the total shown, and some numbers may differ slightly from one table to the next.1 The residual category ‘‘Other Services’’ includes the categories Arts, Entertainment and Recreation (NAICS 71) and Other services except religious organizations
(NAICS 81, except 813110).
Table 5. Energy intensity of establishments by activity grouping, by region, 2008
activity Groupingenergy intensity (GJ/m2)
Canada atlantic Quebec ontario PrairiesBritish
Columbia
wholesale and warehousing
0.88 A 1.39 B 0.68 A 0.87 A 0.85 C 0.92 A
retail Trade 1.09 A 0.99 A 1.35 A 0.79 C 1.38 A 1.13 A
• Non-food retail 0.88 A 0.94 A 0.99 A 0.59 C 1.16 A 1.04 B
• Food retail 2.39 A 1.32 A 2.84 A 2.34 A 2.66 A 1.93 C
Information and Cultural
1.36 A 2.34 C 1.30 A 0.72 A 1.77 A 0.98 A
Financial, real Estate and other Professional Services
0.92 A 1.02 B 0.84 A 0.92 A 1.65 A 0.79 C
Public Administration 1.85 A F F 1.33 A 3.54 A 1.74 A
Education 1.15 A 1.12 A 0.88 A 0.91 A 1.59 A 1.21 A
• Elementary and secondary schools
0.86 A 0.67 A 0.70 A 0.75 A 1.12 A 0.98 A
• Community colleges and CEGEPs
1.32 A 1.11 A 0.94 A 0.95 A 1.83 A 1.14 A
• Universities 1.70 A 1.91 A 1.29 A 1.24 B 2.36 A 1.83 A
• Business Schools and Others
1.04 A 1.15 B 1.13 B 0.87 A 1.51 B 0.62 B
Health Care 1.77 A 1.62 A 1.87 B 1.46 A 2.12 B F
• Ambulatory health care services
1.80 C 1.20 A F 1.25 B F F
• Hospitals 2.68 A 2.65 A 1.89 A 2.55 A 4.34 B 1.87 A
• Nursing and residential care facilities
1.51 A 1.16 A 1.83 A 1.43 A 1.31 B 1.08 A
• Social assistance 0.97 A 0.69 A 1.08 A 0.80 B 1.52 A 0.67 A
Accommodation Services
1.68 A 0.90 A 1.17 B 1.07 A 2.44 A 1.55 A
Food Services and drinking Places
3.20 A 2.95 A 2.73 A 2.90 A 4.54 A 3.63 A
religious organizations
0.72 A 0.70 A 0.73 A 0.73 C 0.73 A 0.64 A
other Services1 1.21 A 1.00 A 1.42 B 0.97 B 1.64 A 1.23 C
Canadian C&i sector 1.23 a 1.24 a 1.11 a 1.02 a 1.69 a 1.27 a
2008 Commercial & Institutional Consumption of Energy Survey
2 Energy Consumption and Energy Intensity in the Regions
17
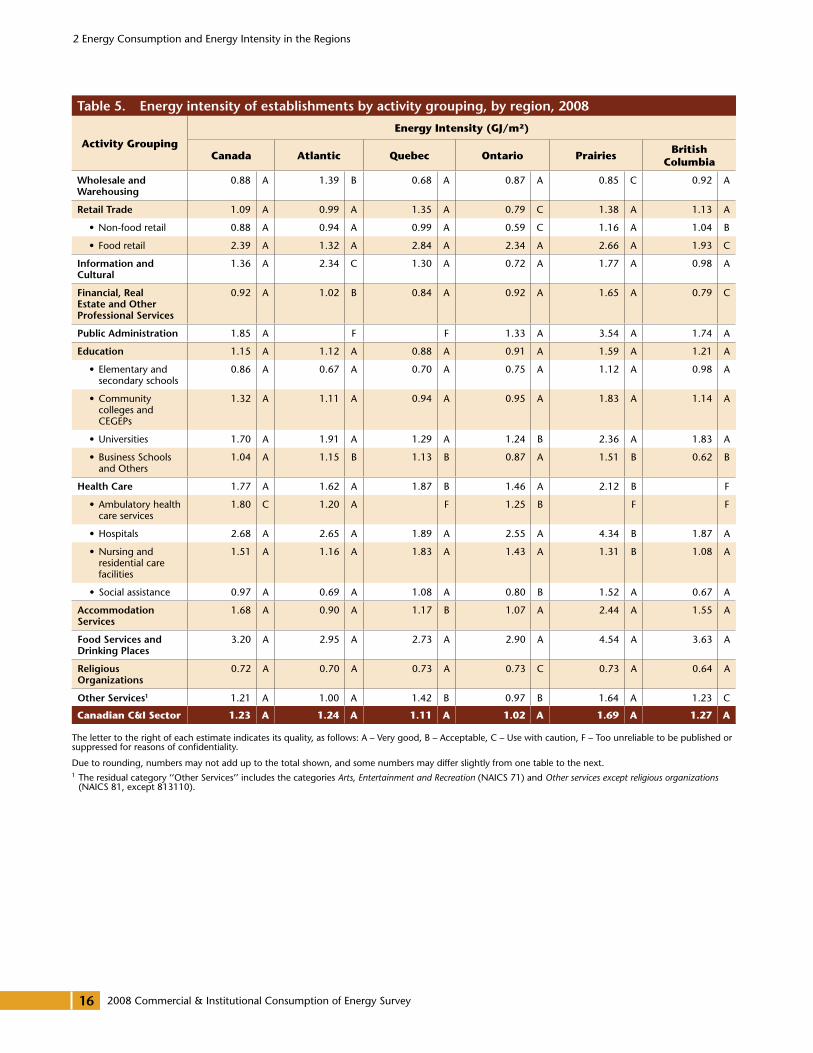
An analysis of the energy intensity for each activity grouping by region highlights certain regional differences (see Table 5).
The two highest energy intensities recorded in CICES 2008 were in the Food Services and Drinking Places, and Hospitals, both in the Prairies, at levels of 4.54 GJ/m2 and 4.34 GJ/m2, respectively. Indeed, the Prairies had the highest observed energy
intensities in almost every activity grouping. This is likely due to a combination of a relatively heavier reliance on fossil fuels (discussed in Section 3 on page 18) and a colder climate13 in this region compared with the other regions during 2008.
13 Natural Resources Canada, Office of Energy Efficiency, Energy End-Use Model database.
2008 Commercial & Institutional Consumption of Energy Survey
3 Energy Consumption by Energy Source
18
3 Energy Consumption by Energy Source
CICES 2008 gathered data on the energy consumption of C&I establishments by the specific energy sources consumed.
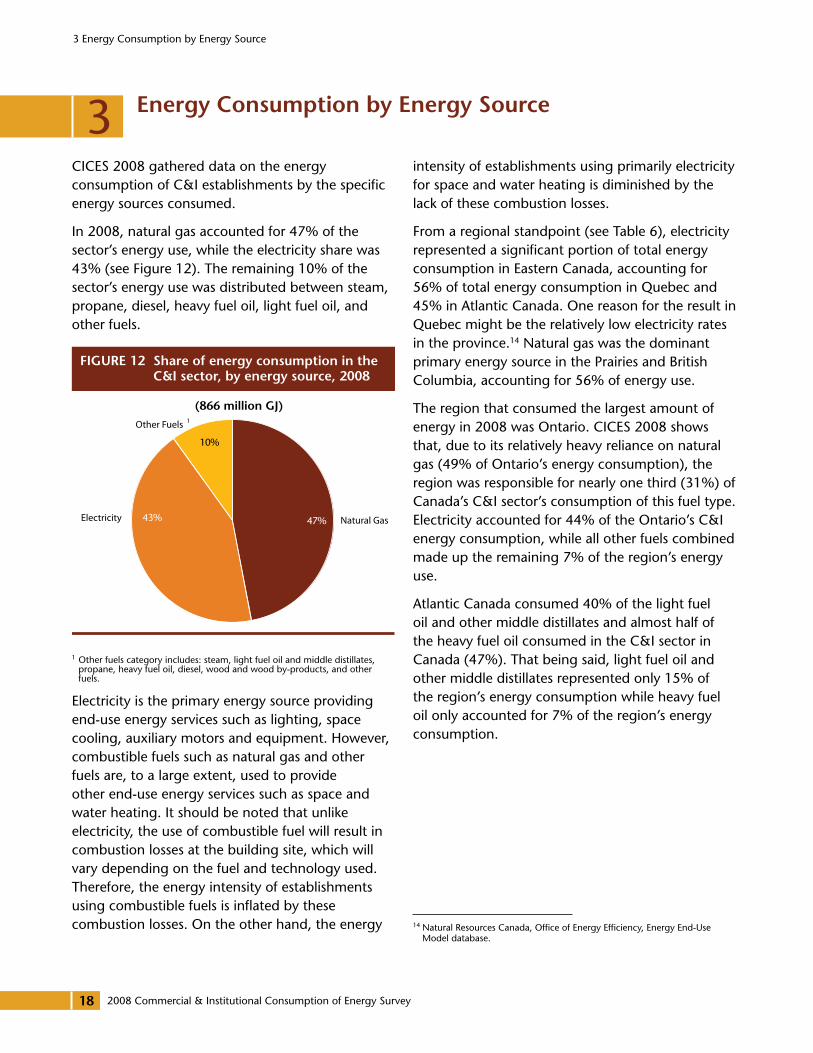
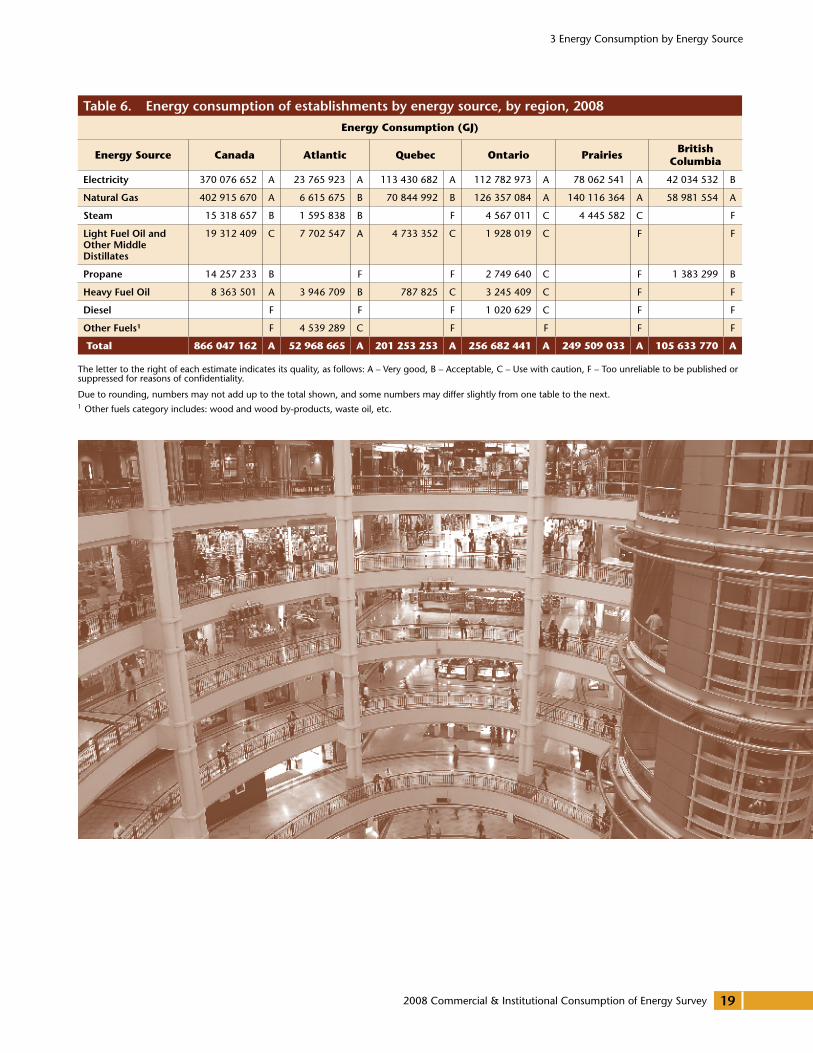
In 2008, natural gas accounted for 47% of the sector’s energy use, while the electricity share was 43% (see Figure 12). The remaining 10% of the sector’s energy use was distributed between steam, propane, diesel, heavy fuel oil, light fuel oil, and other fuels.
1 Other fuels category includes: steam, light fuel oil and middle distillates, propane, heavy fuel oil, diesel, wood and wood by-products, and other fuels.
Electricity is the primary energy source providing end-use energy services such as lighting, space cooling, auxiliary motors and equipment. However, combustible fuels such as natural gas and other fuels are, to a large extent, used to provide other end-use energy services such as space and water heating. It should be noted that unlike electricity, the use of combustible fuel will result in combustion losses at the building site, which will vary depending on the fuel and technology used. Therefore, the energy intensity of establishments using combustible fuels is inflated by these combustion losses. On the other hand, the energy
intensity of establishments using primarily electricity for space and water heating is diminished by the lack of these combustion losses.
From a regional standpoint (see Table 6), electricity represented a significant portion of total energy consumption in Eastern Canada, accounting for 56% of total energy consumption in Quebec and 45% in Atlantic Canada. One reason for the result in Quebec might be the relatively low electricity rates in the province.14 Natural gas was the dominant primary energy source in the Prairies and British Columbia, accounting for 56% of energy use.
The region that consumed the largest amount of energy in 2008 was Ontario. CICES 2008 shows that, due to its relatively heavy reliance on natural gas (49% of Ontario’s energy consumption), the region was responsible for nearly one third (31%) of Canada’s C&I sector’s consumption of this fuel type. Electricity accounted for 44% of the Ontario’s C&I energy consumption, while all other fuels combined made up the remaining 7% of the region’s energy use.
Atlantic Canada consumed 40% of the light fuel oil and other middle distillates and almost half of the heavy fuel oil consumed in the C&I sector in Canada (47%). That being said, light fuel oil and other middle distillates represented only 15% of the region’s energy consumption while heavy fuel oil only accounted for 7% of the region’s energy consumption.
14 Natural Resources Canada, Office of Energy Efficiency, Energy End-Use Model database.
Electricity Natural Gas
FIGURE 12 Share of energy consumption in the C&I sector, by energy source, 2008
(866 million GJ)
Other Fuels 1
47%43%
10%
2008 Commercial & Institutional Consumption of Energy Survey
3 Energy Consumption by Energy Source
19
The letter to the right of each estimate indicates its quality, as follows: A – Very good, B – Acceptable, C – Use with caution, F – Too unreliable to be published or suppressed for reasons of confidentiality.
Due to rounding, numbers may not add up to the total shown, and some numbers may differ slightly from one table to the next.1 Other fuels category includes: wood and wood by-products, waste oil, etc.
Table 6. Energy consumption of establishments by energy source, by region, 2008
energy Consumption (GJ)
energy source Canada atlantic Quebec ontario PrairiesBritish
Columbia
Electricity 370 076 652 A 23 765 923 A 113 430 682 A 112 782 973 A 78 062 541 A 42 034 532 B
Natural Gas 402 915 670 A 6 615 675 B 70 844 992 B 126 357 084 A 140 116 364 A 58 981 554 A
Steam 15 318 657 B 1 595 838 B F 4 567 011 C 4 445 582 C F
Light Fuel oil and other middle distillates
19 312 409 C 7 702 547 A 4 733 352 C 1 928 019 C F F
Propane 14 257 233 B F F 2 749 640 C F 1 383 299 B
Heavy Fuel oil 8 363 501 A 3 946 709 B 787 825 C 3 245 409 C F F
diesel F F F 1 020 629 C F F
other Fuels1 F 4 539 289 C F F F F
total 866 047 162 a 52 968 665 a 201 253 253 a 256 682 441 a 249 509 033 a 105 633 770 a
2008 Commercial & Institutional Consumption of Energy Survey
4 Floor Area
20
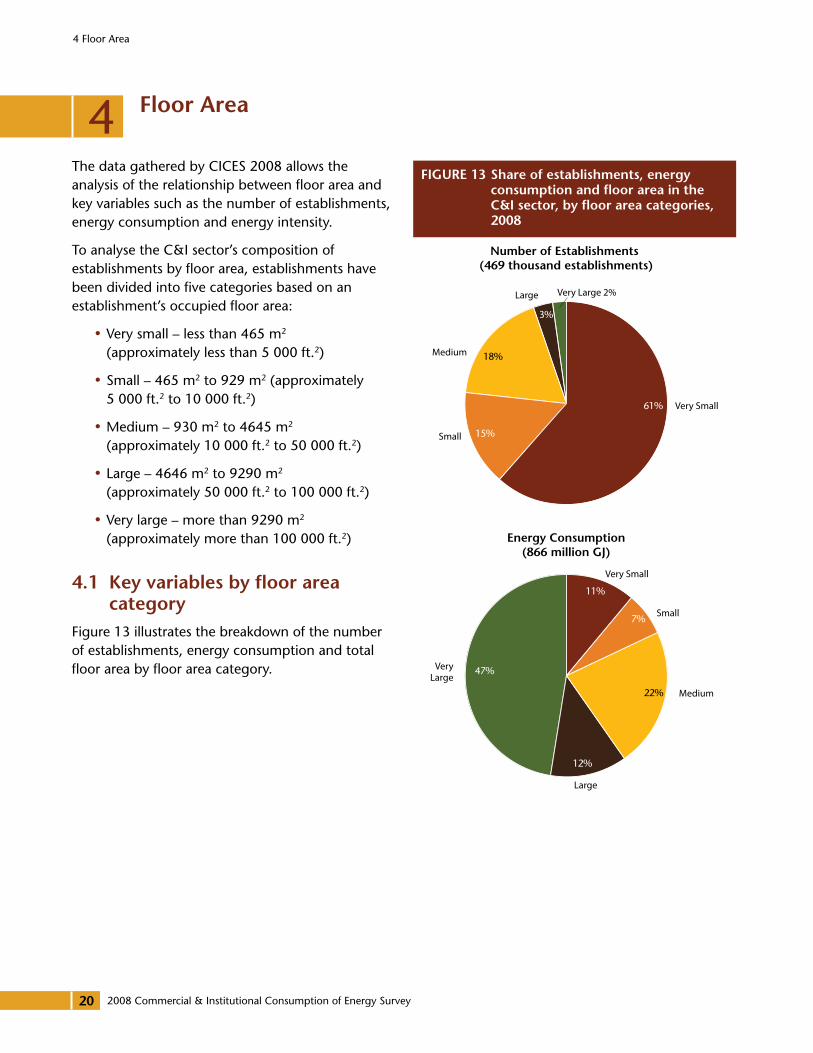
4 Floor Area
The data gathered by CICES 2008 allows the analysis of the relationship between floor area and key variables such as the number of establishments, energy consumption and energy intensity.
To analyse the C&I sector’s composition of establishments by floor area, establishments have been divided into five categories based on an establishment’s occupied floor area:
�� Very small – less than 465 m2 (approximately less than 5 000 ft.2)
�� Small – 465 m2 to 929 m2 (approximately 5 000 ft.2 to 10 000 ft.2)
�� Medium – 930 m2 to 4645 m2 (approximately 10 000 ft.2 to 50 000 ft.2)
�� Large – 4646 m2 to 9290 m2 (approximately 50 000 ft.2 to 100 000 ft.2)
�� Very large – more than 9290 m2 (approximately more than 100 000 ft.2)
4.1 Key variables by floor area category
Figure 13 illustrates the breakdown of the number of establishments, energy consumption and total floor area by floor area category.
Very Large 2%Large
Medium
Small
Very Small
FIGURE 13 Share of establishments, energy consumption and �oor area in the C&I sector, by �oor area categories, 2008
Number of Establishments (469 thousand establishments)
VeryLarge
Large
Medium
Small
Very Small
Energy Consumption(866 million GJ)
VeryLarge
Large
Medium
Small
Very Small
Floor Area(705 million square meters)
61%
3%
15%
18%
47%
11%
12%
22%
7%
46%
8%
14%
25%
7%
2008 Commercial & Institutional Consumption of Energy Survey
4 Floor Area
21
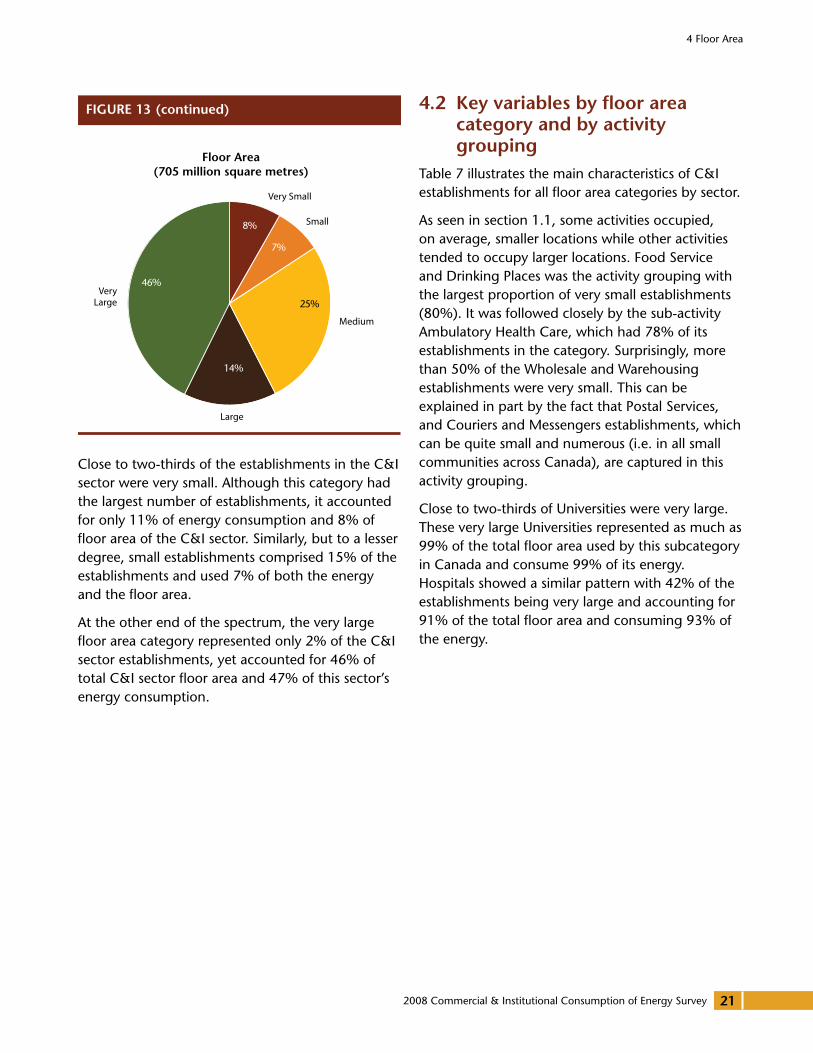
Close to two-thirds of the establishments in the C&I sector were very small. Although this category had the largest number of establishments, it accounted for only 11% of energy consumption and 8% of floor area of the C&I sector. Similarly, but to a lesser degree, small establishments comprised 15% of the establishments and used 7% of both the energy and the floor area.
At the other end of the spectrum, the very large floor area category represented only 2% of the C&I sector establishments, yet accounted for 46% of total C&I sector floor area and 47% of this sector’s energy consumption.
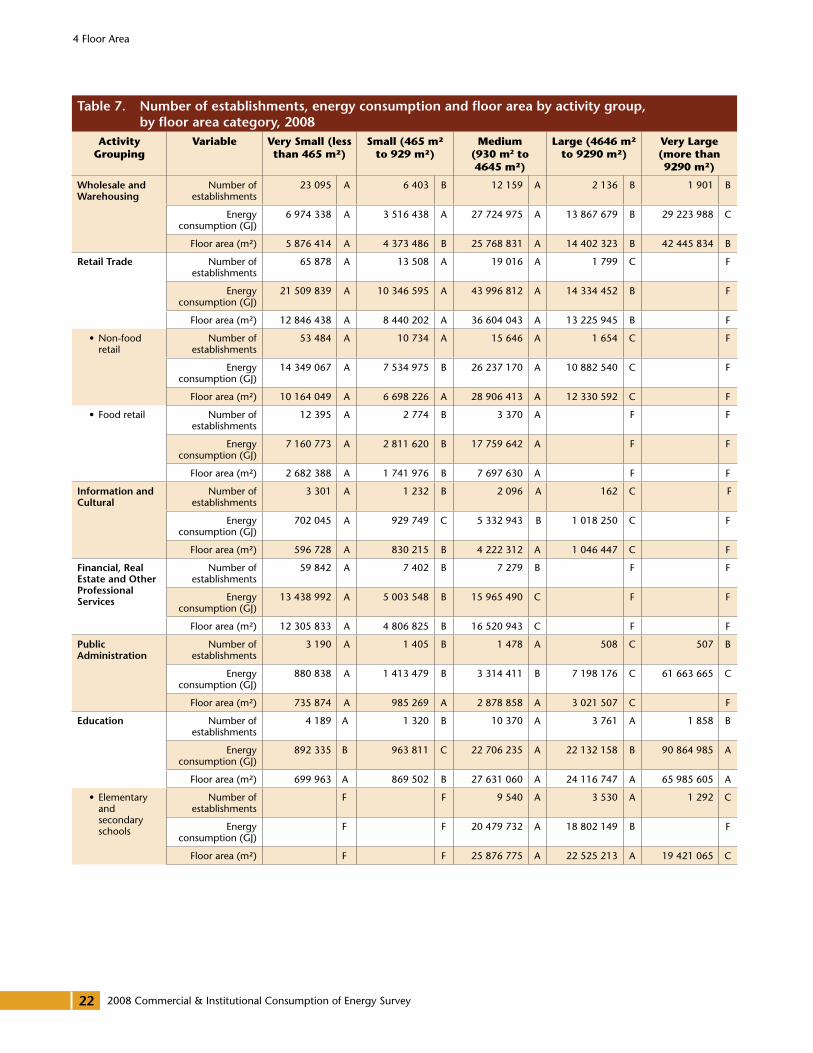
4.2 Key variables by floor area category and by activity grouping
Table 7 illustrates the main characteristics of C&I establishments for all floor area categories by sector.
As seen in section 1.1, some activities occupied, on average, smaller locations while other activities tended to occupy larger locations. Food Service and Drinking Places was the activity grouping with the largest proportion of very small establishments (80%). It was followed closely by the sub-activity Ambulatory Health Care, which had 78% of its establishments in the category. Surprisingly, more than 50% of the Wholesale and Warehousing establishments were very small. This can be explained in part by the fact that Postal Services, and Couriers and Messengers establishments, which can be quite small and numerous (i.e. in all small communities across Canada), are captured in this activity grouping.
Close to two-thirds of Universities were very large. These very large Universities represented as much as 99% of the total floor area used by this subcategory in Canada and consume 99% of its energy. Hospitals showed a similar pattern with 42% of the establishments being very large and accounting for 91% of the total floor area and consuming 93% of the energy.
FIGURE 13 (continued)
VeryLarge
Large
Medium
Small
Very Small
Floor Area(705 million square metres)
46%
8%
14%
25%
7%
2008 Commercial & Institutional Consumption of Energy Survey
4 Floor Area
22
Table 7. Number of establishments, energy consumption and floor area by activity group, by floor area category, 2008
activity Grouping
Variable Very small (less than 465 m2)
small (465 m2 to 929 m2)
medium (930 m2 to 4645 m2)
Large (4646 m2 to 9290 m2)
Very Large (more than 9290 m2)
wholesale and warehousing
Number of establishments
23 095 A 6 403 B 12 159 A 2 136 B 1 901 B
Energy consumption (GJ)
6 974 338 A 3 516 438 A 27 724 975 A 13 867 679 B 29 223 988 C
Floor area (m2) 5 876 414 A 4 373 486 B 25 768 831 A 14 402 323 B 42 445 834 B
retail Trade Number of establishments
65 878 A 13 508 A 19 016 A 1 799 C F
Energy consumption (GJ)
21 509 839 A 10 346 595 A 43 996 812 A 14 334 452 B F
Floor area (m2) 12 846 438 A 8 440 202 A 36 604 043 A 13 225 945 B F
• Non-food retail
Number of establishments
53 484 A 10 734 A 15 646 A 1 654 C F
Energy consumption (GJ)
14 349 067 A 7 534 975 B 26 237 170 A 10 882 540 C F
Floor area (m2) 10 164 049 A 6 698 226 A 28 906 413 A 12 330 592 C F
• Food retail Number of establishments
12 395 A 2 774 B 3 370 A F F
Energy consumption (GJ)
7 160 773 A 2 811 620 B 17 759 642 A F F
Floor area (m2) 2 682 388 A 1 741 976 B 7 697 630 A F F
Information and Cultural
Number of establishments
3 301 A 1 232 B 2 096 A 162 C F
Energy consumption (GJ)
702 045 A 929 749 C 5 332 943 B 1 018 250 C F
Floor area (m2) 596 728 A 830 215 B 4 222 312 A 1 046 447 C F
Financial, real Estate and other Professional Services
Number of establishments
59 842 A 7 402 B 7 279 B F F
Energy consumption (GJ)
13 438 992 A 5 003 548 B 15 965 490 C F F
Floor area (m2) 12 305 833 A 4 806 825 B 16 520 943 C F F
Public Administration
Number of establishments
3 190 A 1 405 B 1 478 A 508 C 507 B
Energy consumption (GJ)
880 838 A 1 413 479 B 3 314 411 B 7 198 176 C 61 663 665 C
Floor area (m2) 735 874 A 985 269 A 2 878 858 A 3 021 507 C F
Education Number of establishments
4 189 A 1 320 B 10 370 A 3 761 A 1 858 B
Energy consumption (GJ)
892 335 B 963 811 C 22 706 235 A 22 132 158 B 90 864 985 A
Floor area (m2) 699 963 A 869 502 B 27 631 060 A 24 116 747 A 65 985 605 A
• Elementary and secondary schools
Number of establishments
F F 9 540 A 3 530 A 1 292 C
Energy consumption (GJ)
F F 20 479 732 A 18 802 149 B F
Floor area (m2) F F 25 876 775 A 22 525 213 A 19 421 065 C

2008 Commercial & Institutional Consumption of Energy Survey
4 Floor Area
23
Table 7. Number of establishments, energy consumption and floor area by activity group, by floor area category, 2008
activity Grouping
Variable Very small (less than 465 m2)
small (465 m2 to 929 m2)
medium (930 m2 to 4645 m2)
Large (4646 m2 to 9290 m2)
Very Large (more than 9290 m2)
• Community colleges and CEGEPs
Number of establishments
304 B 206 C 272 B F F
Energy consumption (GJ)
F 116 830 C 813 580 C F F
Floor area (m2) 70 451 B 146 128 C 580 305 B F F
• Universities Number of establishments
F F 29 B 42 B 164 A
Energy consumption (GJ)
1 053 C F F 309 041 B 53 946 566 A
Floor area (m2) F F 84 600 C 296 292 B 31 668 696 B
• Business Schools and Others
Number of establishments
3 302 A 760 B 528 B F F
Energy consumption (GJ)
507 610 A 408 028 C 1 276 487 C F F
Floor area (m2) 535 984 A 482 772 B 1 089 380 B F F
Health Care Number of establishments
33 935 A 7 134 A 8 534 B 1 013 C 1 475 B
Energy consumption (GJ)
6 516 795 A 4 286 481 A 21 785 240 B F 81 581 513 B
Floor area (m2) 6 116 736 A 4 671 877 A 16 409 291 B F 38 269 098 B
• Ambulatory health care services
Number of establishments
28 206 A 3 009 C 4 673 C F F
Energy consumption (GJ)
4 988 879 B F F F F
Floor area (m2) 4 786 782 A 1 845 729 C F F F
• Hospitals Number of establishments
F F 203 A 158 B 290 A
Energy consumption (GJ)
F F 1 112 655 B 2 121 646 B 43 257 635 B
Floor area (m2) F F 519 819 A 1 028 191 B 15 798 596 A
• Nursing and residential care facilities
Number of establishments
F F 1 913 A 678 B 752 A
Energy consumption (GJ)
F F 6 140 489 A 4 372 867 B 26 761 417 B
Floor area (m2) F F 4 573 296 A 4 589 365 B 15 353 730 B
• Social assistance
Number of establishments
4 901 A 3 057 A 1 745 A F F
Energy consumption (GJ)
1 326 899 A 2 229 321 B 3 683 737 A F F
Floor area (m2) 1 158 851 A 2 150 120 B 3 286 801 A F F
Accommodation Services
Number of establishments
1 480 B 2 432 A 2 088 A 737 B 777 B
Energy consumption (GJ)
781 549 C 3 066 115 B 6 521 076 A 6 294 083 C 46 304 082 C
Floor area (m2) 353 990 B 1 851 698 A 4 429 861 A 4 660 110 B 26 159 869 B
(continued)
2008 Commercial & Institutional Consumption of Energy Survey
4 Floor Area
24
The letter to the right of each estimate indicates its quality, as follows: A – Very good, B – Acceptable, C – Use with caution, F – Too unreliable to be published or suppressed for reasons of confidentiality.
Due to rounding, numbers may not add up to the total shown, and some numbers may differ slightly from one table to the next.1 The residual category ‘‘Other Services’’ includes the categories Arts, Entertainment and Recreation (NAICS 71) and Other services except religious organizations
(NAICS 81, except 813110).
Table 7. Number of establishments, energy consumption and floor area by activity group, by floor area category, 2008
activity Grouping
Variable Very small (less than 465 m2)
small (465 m2 to 929 m2)
medium (930 m2 to 4645 m2)
Large (4646 m2 to 9290 m2)
Very Large (more than 9290 m2)
Food Services and drinking Places
Number of establishments
37 340 A 7 977 B 1 067 C F F
Energy consumption (GJ)
28 260 803 A 15 202 434 B F F F
Floor area (m2) 7 816 604 A 5 120 220 B 2 254 177 C F F
religious organizations
Number of establishments
8 179 A 10 290 A 11 181 A 875 C F
Energy consumption (GJ)
3 539 038 B 7 226 823 A 18 545 913 A 4 310 499 C F
Floor area (m2) 2 560 483 A 7 141 317 A 21 562 464 A 6 340 413 C F
other Services1 Number of establishments
46 714 A 12 165 A 9 798 A F 418 B
Energy consumption (GJ)
14 675 287 A 11 405 559 A 23 879 563 B F F
Floor area (m2) 9 487 759 A 8 331 928 A 18 263 619 A F 19 474 469 C
total Number of establishments
287 142 a 71 269 a 85 066 a 15 271 a 10 370 a
energy consumption
(GJ)
98 171 860 a 63 361 032 a 194 784 499 a 105 529 038 a 404 200 733 a
Floor area (m2) 59 396 821 a 47 422 537 a 176 545 460 a 98 587 372 a 323 235 836 a
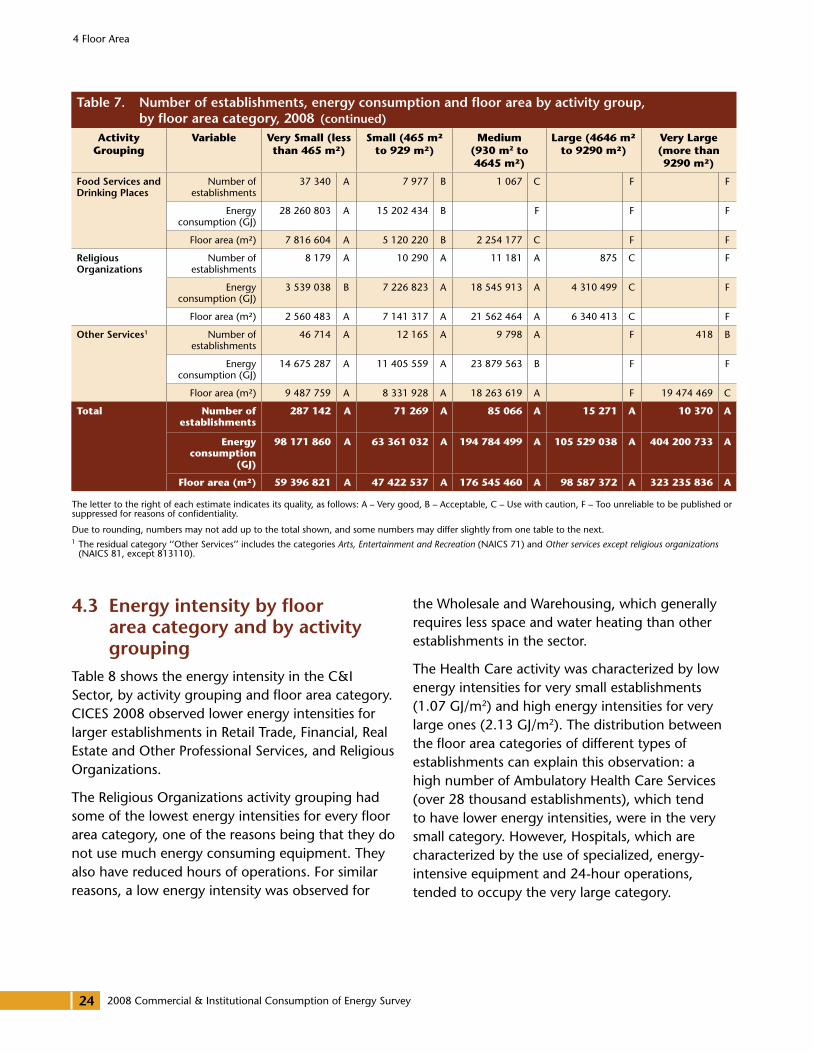
4.3 Energy intensity by floor area category and by activity grouping
Table 8 shows the energy intensity in the C&I Sector, by activity grouping and floor area category. CICES 2008 observed lower energy intensities for larger establishments in Retail Trade, Financial, Real Estate and Other Professional Services, and Religious Organizations.
The Religious Organizations activity grouping had some of the lowest energy intensities for every floor area category, one of the reasons being that they do not use much energy consuming equipment. They also have reduced hours of operations. For similar reasons, a low energy intensity was observed for
the Wholesale and Warehousing, which generally requires less space and water heating than other establishments in the sector.
The Health Care activity was characterized by low energy intensities for very small establishments (1.07 GJ/m2) and high energy intensities for very large ones (2.13 GJ/m2). The distribution between the floor area categories of different types of establishments can explain this observation: a high number of Ambulatory Health Care Services (over 28 thousand establishments), which tend to have lower energy intensities, were in the very small category. However, Hospitals, which are characterized by the use of specialized, energy-intensive equipment and 24-hour operations, tended to occupy the very large category.
(continued)
2008 Commercial & Institutional Consumption of Energy Survey
4 Floor Area
25
The letter to the right of each estimate indicates its quality, as follows: A – Very good, B – Acceptable, C – Use with caution, F – Too unreliable to be published or suppressed for reasons of confidentiality.
Due to rounding, numbers may not add up to the total shown, and some numbers may differ slightly from one table to the next.1 The residual category ‘‘Other Services’’ includes the categories Arts, Entertainment and Recreation (NAICS 71) and Other services except religious organizations
(NAICS 81, except 813110).
Table 8. Energy intensity of establishments by activity grouping, by floor area category, 2008energy intensity (GJ/m2)
activity Grouping Very small (less than 465 m2)
small (465 m2 to
929 m2)
medium (930 m2 to 4645 m2)
Large (4646 m2 to
9290 m2)
Very Large (more than 9290 m2)
Canada
wholesale and warehousing
1.19 A 0.80 A 1.08 A 0.96 A 0.69 B 0.88 A
retail Trade 1.67 A 1.23 A 1.20 A 1.08 B F 1.09 A
• Non-food retail 1.41 A 1.12 A 0.91 A 0.88 B F 0.88 A
• Food retail 2.67 A 1.61 A 2.31 A F 1.92 A 2.39 A
Information and Cultural 1.18 A 1.12 B 1.26 B 0.97 B 1.61 A 1.36 A
Financial, real Estate and other Professional Services
1.09 A 1.04 A 0.97 B 0.87 B 0.86 A 0.92 A
Public Administration 1.20 A 1.43 A 1.15 A 2.38 B 1.89 B 1.85 A
Education 1.27 B 1.11 B 0.82 A 0.92 A 1.38 A 1.15 A
• Elementary and secondary schools
F F 0.79 A 0.83 A 0.96 A 0.86 A
• Community colleges and CEGEPs
1.78 C 0.80 A 1.40 B 2.81 C 1.21 A 1.32 A
• Universities 0.50 A 0.54 A 1.61 C 1.04 A 1.70 A 1.70 A
• Business Schools and Others
0.95 A 0.85 A 1.17 A 0.40 A 1.58 B 1.04 A
Health Care 1.07 A 0.92 A 1.33 A 1.99 C 2.13 A 1.77 A
• Ambulatory health care services
1.04 A 0.63 C 1.35 A F F 1.80 C
• Hospitals 2.71 B 5.97 A 2.14 A 2.06 A 2.74 A 2.68 A
• Nursing and residential care facilities
1.16 A 1.17 A 1.34 A 0.95 A 1.74 A 1.51 A
• Social assistance 1.15 A 1.04 A 1.12 A 1.86 C 0.76 B 0.97 A
Accommodation Services 2.21 B 1.66 A 1.47 A 1.35 A 1.77 A 1.68 A
Food Services and drinking Places
3.62 A 2.97 A 2.22 B 5.21 A 3.22 C 3.20 A
religious organizations 1.38 B 1.01 A 0.86 A 0.68 A F 0.72 A
other Services1 1.55 A 1.37 A 1.31 A F 1.12 B 1.21 A
Canadian C&i sector 1.65 a 1.34 a 1.10 a 1.07 a 1.25 a 1.23 a
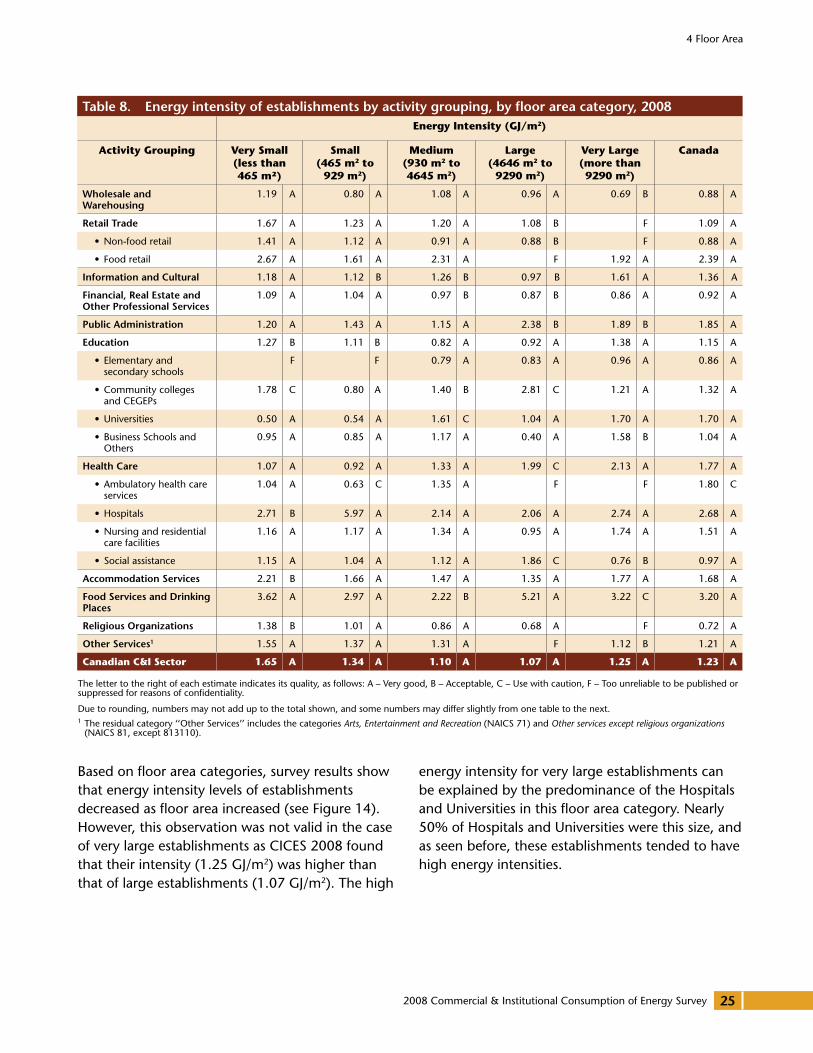
Based on floor area categories, survey results show that energy intensity levels of establishments decreased as floor area increased (see Figure 14). However, this observation was not valid in the case of very large establishments as CICES 2008 found that their intensity (1.25 GJ/m2) was higher than that of large establishments (1.07 GJ/m2). The high
energy intensity for very large establishments can be explained by the predominance of the Hospitals and Universities in this floor area category. Nearly 50% of Hospitals and Universities were this size, and as seen before, these establishments tended to have high energy intensities.
2008 Commercial & Institutional Consumption of Energy Survey
4 Floor Area
26
The most energy intensive establishments based on floor area categories were the very small establishments in 2008 (1.65 GJ/m2). One factor
contributing to this result is the prevalence of Food Service and Drinking Places establishments in this floor area category. These establishments were the most energy intensive, based on activity grouping in the C&I sector in 2008 (see Figure 5). While these establishments accounted for only 13% of the total floor area of establishments in this floor area category, they also accounted for 29% of the floor area category’s energy consumption. The result of this relatively small amount of floor area along with high energy consumption was a high energy intensity (3.62 GJ/m2) for these establishments. This result, in turn, contributed to the high intensity level for all very small establishments.
Finally, large establishments had the lowest energy intensity at 1.07 GJ/ m2 in 2008. As can be observed in Table 7, almost 50% of large establishments were in three activities with relatively low energy intensities: Non-Food Retail, Elementary and Secondary Schools, and Wholesale and Warehousing.
Very
Lar
ge
Larg
e
Med
ium
Smal
l
Very
Sm
all
1.65
1.34
1.10 1.07
1.25
FIGURE 14 Energy intensity (GJ/m²) by �oor area category, 2008
2008 Commercial & Institutional Consumption of Energy Survey
5 Building Age
27
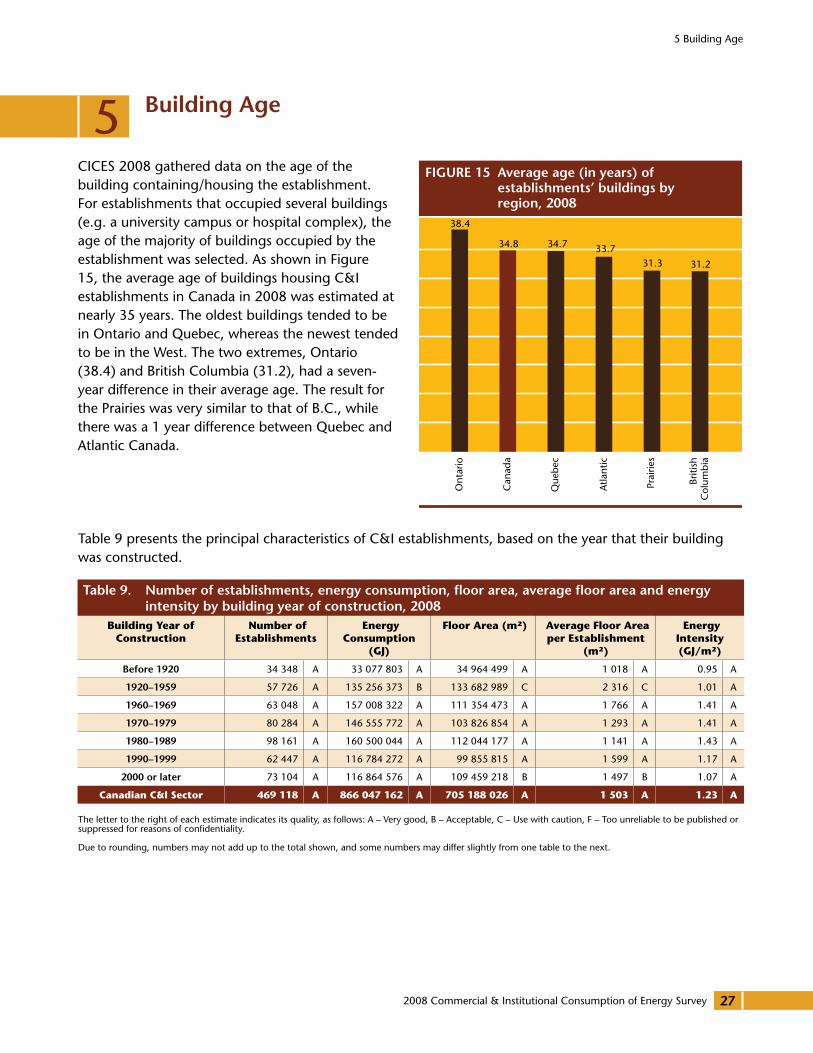
5 Building Age
CICES 2008 gathered data on the age of the building containing/housing the establishment. For establishments that occupied several buildings (e.g. a university campus or hospital complex), the age of the majority of buildings occupied by the establishment was selected. As shown in Figure 15, the average age of buildings housing C&I establishments in Canada in 2008 was estimated at nearly 35 years. The oldest buildings tended to be in Ontario and Quebec, whereas the newest tended to be in the West. The two extremes, Ontario (38.4) and British Columbia (31.2), had a seven-year difference in their average age. The result for the Prairies was very similar to that of B.C., while there was a 1 year difference between Quebec and Atlantic Canada.
Briti
shC
olum
bia
Prai
ries
Atla
ntic
Que
bec
Can
ada
Ont
ario
FIGURE 15 Average age (in years) of establishments’ buildings by region, 2008
31.231.333.734.734.8
38.4
Table 9 presents the principal characteristics of C&I establishments, based on the year that their building was constructed.
The letter to the right of each estimate indicates its quality, as follows: A – Very good, B – Acceptable, C – Use with caution, F – Too unreliable to be published or suppressed for reasons of confidentiality.
Due to rounding, numbers may not add up to the total shown, and some numbers may differ slightly from one table to the next.
Table 9. Number of establishments, energy consumption, floor area, average floor area and energy intensity by building year of construction, 2008
Building year of Construction
Number of establishments
energy Consumption
(GJ)
Floor area (m2) average Floor area per establishment
(m2)
energy intensity (GJ/m2)
Before 1920 34 348 A 33 077 803 A 34 964 499 A 1 018 A 0.95 A
1920–1959 57 726 A 135 256 373 B 133 682 989 C 2 316 C 1.01 A
1960–1969 63 048 A 157 008 322 A 111 354 473 A 1 766 A 1.41 A
1970–1979 80 284 A 146 555 772 A 103 826 854 A 1 293 A 1.41 A
1980–1989 98 161 A 160 500 044 A 112 044 177 A 1 141 A 1.43 A
1990–1999 62 447 A 116 784 272 A 99 855 815 A 1 599 A 1.17 A
2000 or later 73 104 A 116 864 576 A 109 459 218 B 1 497 B 1.07 A
Canadian C&i sector 469 118 a 866 047 162 a 705 188 026 a 1 503 a 1.23 a
2008 Commercial & Institutional Consumption of Energy Survey
5 Building Age
28
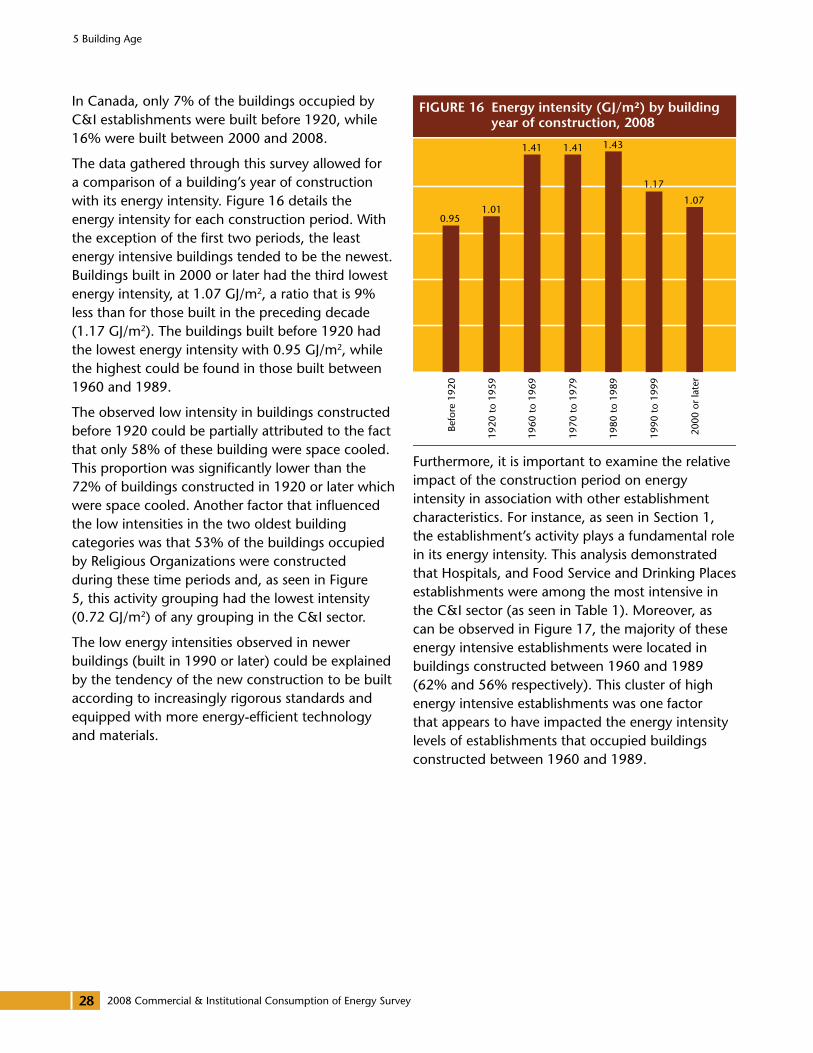
In Canada, only 7% of the buildings occupied by C&I establishments were built before 1920, while 16% were built between 2000 and 2008.
The data gathered through this survey allowed for a comparison of a building’s year of construction with its energy intensity. Figure 16 details the energy intensity for each construction period. With the exception of the first two periods, the least energy intensive buildings tended to be the newest. Buildings built in 2000 or later had the third lowest energy intensity, at 1.07 GJ/m2, a ratio that is 9% less than for those built in the preceding decade (1.17 GJ/m2). The buildings built before 1920 had the lowest energy intensity with 0.95 GJ/m2, while the highest could be found in those built between 1960 and 1989.
The observed low intensity in buildings constructed before 1920 could be partially attributed to the fact that only 58% of these building were space cooled. This proportion was significantly lower than the 72% of buildings constructed in 1920 or later which were space cooled. Another factor that influenced the low intensities in the two oldest building categories was that 53% of the buildings occupied by Religious Organizations were constructed during these time periods and, as seen in Figure 5, this activity grouping had the lowest intensity (0.72 GJ/m2) of any grouping in the C&I sector.
The low energy intensities observed in newer buildings (built in 1990 or later) could be explained by the tendency of the new construction to be built according to increasingly rigorous standards and equipped with more energy-efficient technology and materials.
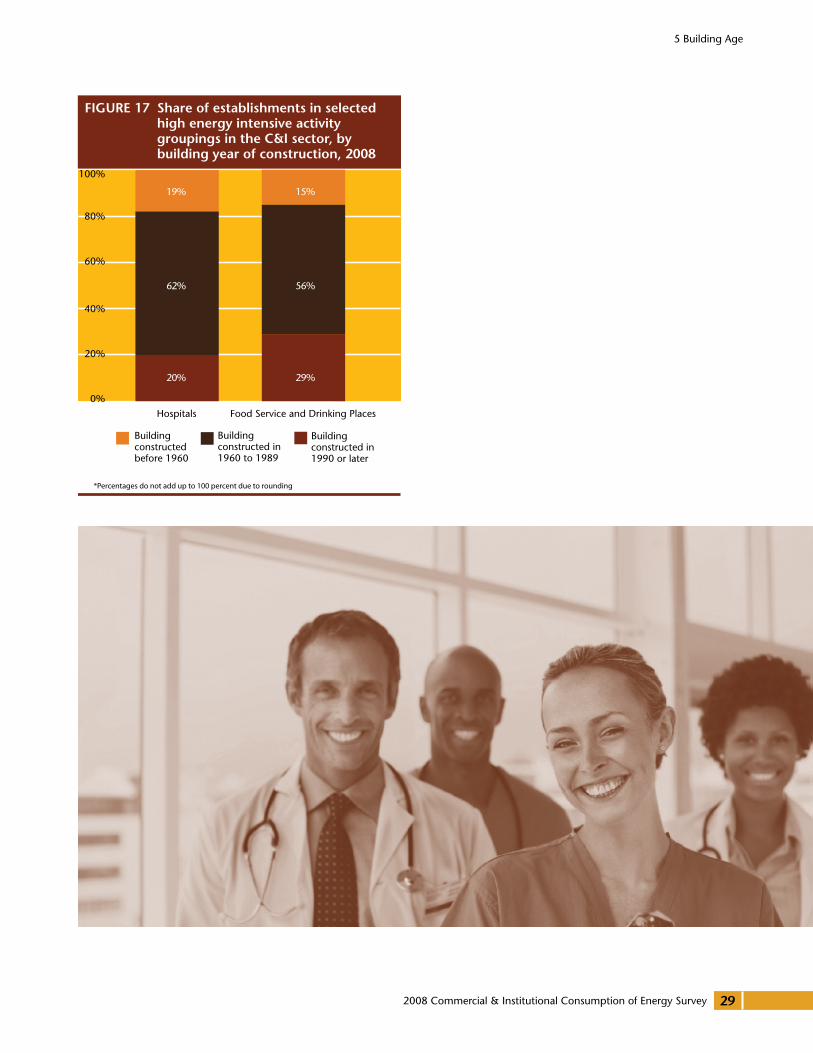
Furthermore, it is important to examine the relative impact of the construction period on energy intensity in association with other establishment characteristics. For instance, as seen in Section 1, the establishment’s activity plays a fundamental role in its energy intensity. This analysis demonstrated that Hospitals, and Food Service and Drinking Places establishments were among the most intensive in the C&I sector (as seen in Table 1). Moreover, as can be observed in Figure 17, the majority of these energy intensive establishments were located in buildings constructed between 1960 and 1989 (62% and 56% respectively). This cluster of high energy intensive establishments was one factor that appears to have impacted the energy intensity levels of establishments that occupied buildings constructed between 1960 and 1989.
FIGURE 16 Energy intensity (GJ/m²) by building year of construction, 2008
2000
or
late
r
1990
to
1999
1980
to
1989
1970
to
1979
1960
to
1969
1920
to
1959
Befo
re 1
920
1.17
1.07
1.431.411.41
1.010.95
2008 Commercial & Institutional Consumption of Energy Survey
5 Building Age
29
FIGURE 17 Share of establishments in selected high energy intensive activity groupings in the C&I sector, by building year of construction, 2008
Building constructed before 1960
Building constructed in1960 to 1989
Building constructed in1990 or later
Food Service and Drinking PlacesHospitals
100%
80%
60%
40%
20%
0%
19%
62%
20%
15%
56%
29%
*Percentages do not add up to 100 percent due to rounding
2008 Commercial & Institutional Consumption of Energy Survey
6 Energy Sources used for Space Heating, Space Cooling and Water Heating
30
CICES 2008 collected data on the type of energy used for space heating, space cooling and water heating. In the case of space heating and cooling, a distinction between primary and secondary energy sources was made.
6.1 Space heatingAlmost all C&I establishments (more than 99.5%) were at least partially space heated.
Table 10 shows the number of establishments that used a given energy source for space heating, by region, focusing on the primary energy source used.
In Canada, 88% of the C&I sector establishments used either natural gas (52%) or electricity (36%) as their primary energy source for space heating.
From a regional perspective, electricity was the most widely used primary energy source in Quebec and the Atlantic region where 66% and 57% of establishments, respectively, used it as their primary heating energy. Natural gas was most popular in Ontario, the Prairies and British Columbia, with usage rates of 73%, 74% and 52% respectively. The lowest rate of natural gas use was in the Atlantic region at 5%. However, this region had the highest percentage of users of light fuel oil and other fuels in Canada (38%).
These observed variations in regional energy sources used for space heating in the C&I sector are consistent with variations seen in the residential sector.15 Therefore, it can be concluded that the type of energy source used is primarily based on regional location of the user.
15 Natural Resources Canada, 2007 Survey of Household Energy Use – Summary Report, p.26. http://oee.nrcan.gc.ca/Publications/statistics/sheu-summary07/index.cfm?attr=0
6 Energy Sources Used for Space Heating, Space Cooling and water Heating
Table 10. Number of establishments by primary energy source for space heating, by region, 2008
Number of establishments
energy source Canada atlantic Quebec ontario PrairiesBritish
Columbia
Electricity 170 393 A 20 672 A 68 834 A 33 705 A 16 272 A 30 910 A
Natural Gas 243 604 A 1 884 B 18 350 A 123 261 A 62 607 A 37 503 A
other* 53 009 A 13 782 A 16 425 A 12 799 B 6 116 B 3 887 B
total 467 006 a 36 338 a 103 609 a 169 764 a 84 996 a 72 300 a
*Other fuels include light fuel oil, propane, heavy fuel oil, diesel, steam, wood and other types.
The letter to the right of each estimate indicates its quality, as follows: A – Very good, B – Acceptable, C – Use with caution, F – Too unreliable to be published or suppressed for reasons of confidentiality.
Due to rounding, numbers may not add up to the total shown, and some numbers may differ slightly from one table to the next.
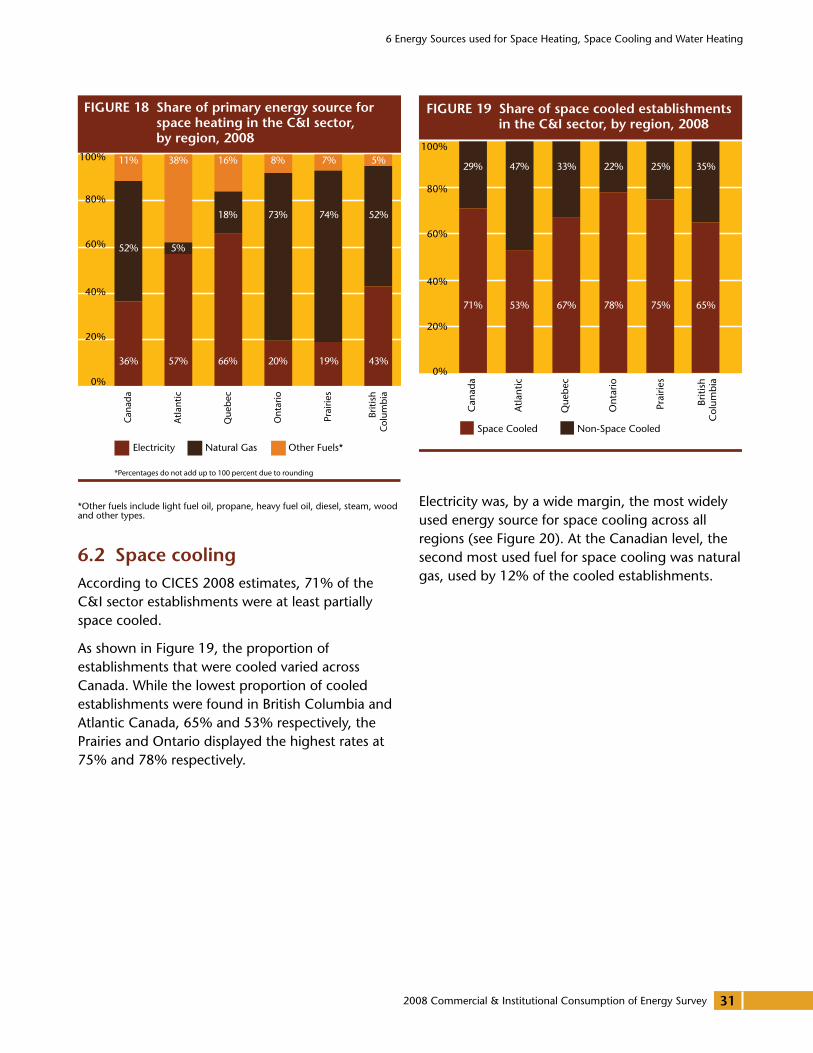
2008 Commercial & Institutional Consumption of Energy Survey
6 Energy Sources used for Space Heating, Space Cooling and Water Heating
31
*Other fuels include light fuel oil, propane, heavy fuel oil, diesel, steam, wood and other types.
6.2 Space coolingAccording to CICES 2008 estimates, 71% of the C&I sector establishments were at least partially space cooled.
As shown in Figure 19, the proportion of establishments that were cooled varied across Canada. While the lowest proportion of cooled establishments were found in British Columbia and Atlantic Canada, 65% and 53% respectively, the Prairies and Ontario displayed the highest rates at 75% and 78% respectively.
Electricity was, by a wide margin, the most widely used energy source for space cooling across all regions (see Figure 20). At the Canadian level, the second most used fuel for space cooling was natural gas, used by 12% of the cooled establishments.
FIGURE 18 Share of primary energy source for space heating in the C&I sector, by region, 2008
Other Fuels*Natural GasElectricity
Briti
shCo
lum
bia
Prai
ries
Ont
ario
Que
bec
Atla
ntic
Cana
da
*Percentages do not add up to 100 percent due to rounding
11%
52%
36%
38%
5%
57%
16%
18%
66%
5%
52%
43%
7%
74%
19%
8%
73%
20%
100%
80%
60%
40%
20%
0%
FIGURE 19 Share of space cooled establishments in the C&I sector, by region, 2008
Non-Space CooledSpace Cooled
Briti
shC
olum
bia
Prai
ries
Ont
ario
Que
bec
Atla
ntic
Can
ada
100%
80%
60%
40%
20%
0%
29%
71%
47%
53%
33%
67%
22%
78%
25%
75%
35%
65%
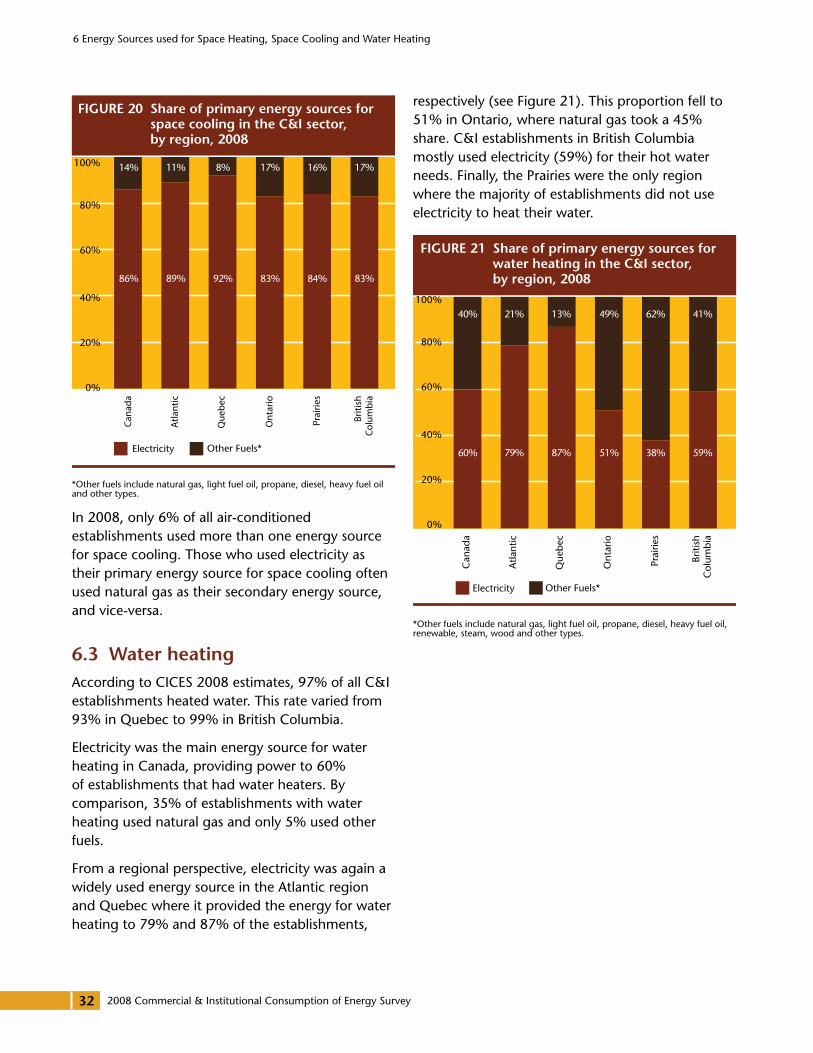
2008 Commercial & Institutional Consumption of Energy Survey
6 Energy Sources used for Space Heating, Space Cooling and Water Heating
32
*Other fuels include natural gas, light fuel oil, propane, diesel, heavy fuel oil and other types.
In 2008, only 6% of all air-conditioned establishments used more than one energy source for space cooling. Those who used electricity as their primary energy source for space cooling often used natural gas as their secondary energy source, and vice-versa.
6.3 water heatingAccording to CICES 2008 estimates, 97% of all C&I establishments heated water. This rate varied from 93% in Quebec to 99% in British Columbia.
Electricity was the main energy source for water heating in Canada, providing power to 60% of establishments that had water heaters. By comparison, 35% of establishments with water heating used natural gas and only 5% used other fuels.
From a regional perspective, electricity was again a widely used energy source in the Atlantic region and Quebec where it provided the energy for water heating to 79% and 87% of the establishments,
respectively (see Figure 21). This proportion fell to 51% in Ontario, where natural gas took a 45% share. C&I establishments in British Columbia mostly used electricity (59%) for their hot water needs. Finally, the Prairies were the only region where the majority of establishments did not use electricity to heat their water.
*Other fuels include natural gas, light fuel oil, propane, diesel, heavy fuel oil, renewable, steam, wood and other types.
FIGURE 20 Share of primary energy sources for space cooling in the C&I sector, by region, 2008
Other Fuels*Electricity
Briti
shCo
lum
bia
Prai
ries
Ont
ario
Que
bec
Atla
ntic
Cana
da
100%
80%
60%
40%
20%
0%
86%
14%
92%
8%
89%
11%
83%
17%
84%
16%
83%
17%
FIGURE 21 Share of primary energy sources for water heating in the C&I sector, by region, 2008
Other Fuels*Electricity
Briti
shC
olum
bia
Prai
ries
Ont
ario
Que
bec
Atla
ntic
Can
ada
100%
80%
60%
40%
20%
0%
40%
60%
21%
79%
13%
87%
49%
51%
62%
38%
41%
59%
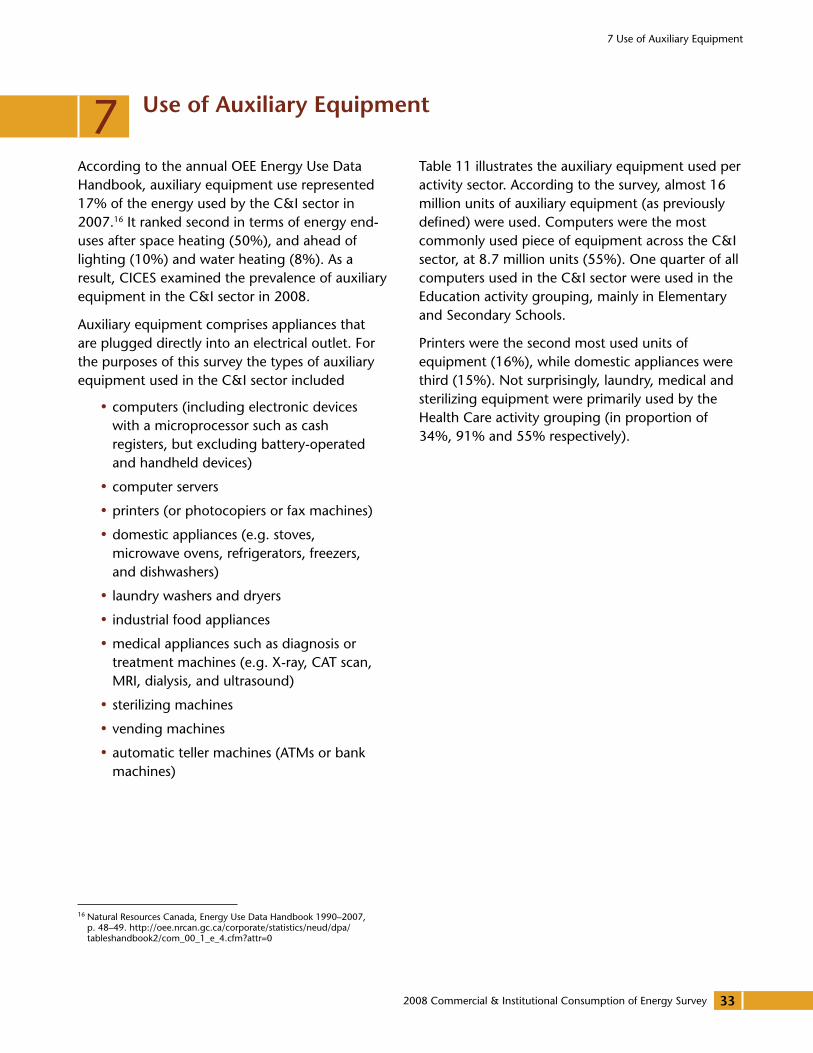
2008 Commercial & Institutional Consumption of Energy Survey
7 Use of Auxiliary Equipment
33
7 Use of Auxiliary Equipment
According to the annual OEE Energy Use Data Handbook, auxiliary equipment use represented 17% of the energy used by the C&I sector in 2007.16 It ranked second in terms of energy end-uses after space heating (50%), and ahead of lighting (10%) and water heating (8%). As a result, CICES examined the prevalence of auxiliary equipment in the C&I sector in 2008.
Auxiliary equipment comprises appliances that are plugged directly into an electrical outlet. For the purposes of this survey the types of auxiliary equipment used in the C&I sector included
�� computers (including electronic devices with a microprocessor such as cash registers, but excluding battery-operated and handheld devices)
�� computer servers
�� printers (or photocopiers or fax machines)
�� domestic appliances (e.g. stoves, microwave ovens, refrigerators, freezers, and dishwashers)
�� laundry washers and dryers
�� industrial food appliances
�� medical appliances such as diagnosis or treatment machines (e.g. X-ray, CAT scan, MRI, dialysis, and ultrasound)
�� sterilizing machines
�� vending machines
�� automatic teller machines (ATMs or bank machines)
16 Natural Resources Canada, Energy Use Data Handbook 1990–2007, p. 48–49. http://oee.nrcan.gc.ca/corporate/statistics/neud/dpa/tableshandbook2/com_00_1_e_4.cfm?attr=0
Table 11 illustrates the auxiliary equipment used per activity sector. According to the survey, almost 16 million units of auxiliary equipment (as previously defined) were used. Computers were the most commonly used piece of equipment across the C&I sector, at 8.7 million units (55%). One quarter of all computers used in the C&I sector were used in the Education activity grouping, mainly in Elementary and Secondary Schools.
Printers were the second most used units of equipment (16%), while domestic appliances were third (15%). Not surprisingly, laundry, medical and sterilizing equipment were primarily used by the Health Care activity grouping (in proportion of 34%, 91% and 55% respectively).
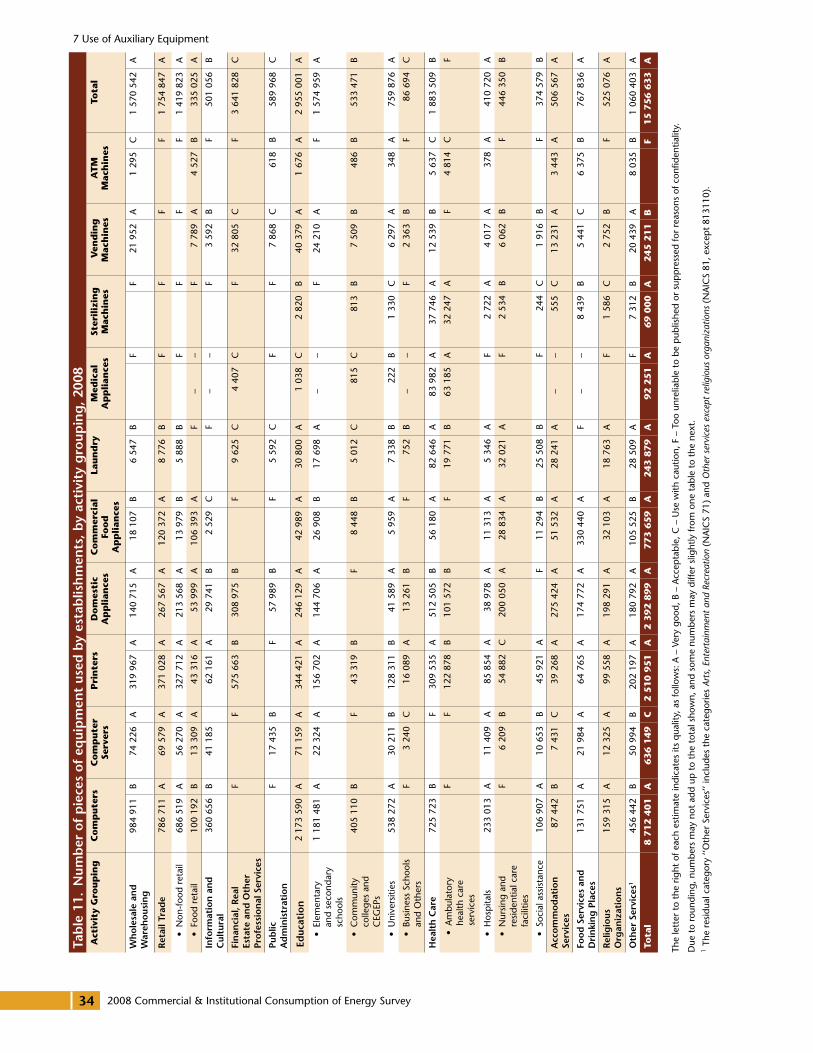
2008 Commercial & Institutional Consumption of Energy Survey
7 Use of Auxiliary Equipment
34
Tab
le 1
1. N
umb
er o
f p
iece
s o
f eq
uip
men
t us
ed b
y es
tab
lish
men
ts, b
y ac
tivi
ty g
roup
ing
, 200
8a
ctiv
ity
Gro
up
ing
Co
mp
ute
rsC
om
pu
ter
serv
ers
Pri
nte
rsd
om
esti
c a
pp
lian
ces
Co
mm
erci
al
Foo
d
ap
pli
ance
s
Lau
nd
rym
edic
al
ap
pli
ance
sst
eril
izin
g
mac
hin
es V
end
ing
m
ach
ines
a
tm
m
ach
ines
tota
l
wh
ole
sale
an
d
war
eho
usin
g98
4 91
1B
74 2
26A
319
967
A14
0 71
5A
18 1
07B
6 54
7B
FF
21 9
52A
1 29
5C
1 57
0 54
2A
ret
ail T
rad
e78
6 71
1A
69 5
79A
371
028
A26
7 56
7A
120
372
A8
776
BF
FF
F1
754
847
A
•N
on-f
ood
reta
il68
6 51
9A
56 2
70A
327
712
A21
3 56
8A
13 9
79B
5 88
8B
FF
FF
1 41
9 82
3A
•Fo
od r
etai
l 10
0 19
2B
13 3
09A
43 3
16A
53 9
99A
106
393
AF
––
F7
789
A4
527
B33
5 02
5A
Info
rmat
ion
an
d
Cul
tura
l36
0 65
6B
41 1
8562
161
A29
741
B2
529
CF
––
F3
592
BF
501
056
B
Fin
anci
al, r
eal
Esta
te a
nd
oth
er
Pro
fess
ion
al S
ervi
ces
FF
575
663
B30
8 97
5B
F9
625
C4
407
CF
32 8
05C
F3
641
828
C
Pub
lic
Ad
min
istr
atio
nF
17 4
35B
F57
989
BF
5 59
2C
FF
7 86
8C
618
B58
9 96
8C
Educ
atio
n2
173
590
A71
159
A34
4 42
1A
246
129
A42
989
A30
800
A1
038
C2
820
B40
379
A1
676
A2
955
001
A
•El
emen
tary
an
d se
cond
ary
scho
ols
1 18
1 48
1A
22 3
24A
156
702
A14
4 70
6A
26 9
08B
17 6
98A
––
F24
210
AF
1 57
4 95
9A
•C
omm
unity
co
llege
s an
d C
EGEP
s
405
110
BF
43 3
19B
F8
448
B5
012
C81
5C
813
B7
509
B48
6B
533
471
B
•U
nive
rsiti
es53
8 27
2A
30 2
11B
128
311
B41
589
A5
959
A7
338
B22
2B
1 33
0C
6 29
7A
348
A75
9 87
6A
•Bu
sine
ss S
choo
ls
and
Oth
ers
F3
240
C16
089
A13
261
BF
752
B–
–F
2 36
3B
F86
694
C
Hea
lth
Car
e72
5 72
3B
F30
9 53
5A
512
505
B56
180
A82
646
A83
982
A37
746
A12
539
B5
637
C1
883
509
B
•A
mbu
lato
ry
heal
th c
are
serv
ices
FF
122
878
B10
1 57
2B
F19
771
B63
185
A32
247
AF
4 81
4C
F
•H
osp
itals
233
013
A11
409
A85
854
A38
978
A11
313
A5
346
AF
2 72
2A
4 01
7A
378
A41
0 72
0A
•N
ursi
ng a
nd
resi
dent
ial c
are
faci
litie
s
F6
209
B54
882
C20
0 05
0A
28 8
34A
32 0
21A
F2
534
B6
062
BF
446
350
B
•So
cial
ass
ista
nce
106
907
A10
653
B45
921
AF
11 2
94B
25 5
08B
F24
4C
1 91
6B
F37
4 57
9B
Acc
om
mo
dat
ion
Se
rvic
es87
442
B7
431
C39
268
A27
5 42
4A
51 5
32A
28 2
41A
––
555
C13
231
A3
443
A50
6 56
7A
Foo
d S
ervi
ces
and
d
rin
kin
g P
lace
s13
1 75
1A
21 9
84A
64 7
65A
174
772
A33
0 44
0A
F–
–8
439
B5
441
C6
375
B76
7 83
6A
rel
igio
us
org
aniz
atio
ns
159
315
A12
325
A99
558
A19
8 29
1A
32 1
03A
18 7
63A
F1
586
C2
752
BF
525
076
A
oth
er S
ervi
ces1
456
442
B50
994
B20
2 19
7A
180
792
A10
5 52
5B
28 5
09A
F7
312
B20
439
A8
035
B1
060
403
A
tota
l8
71
2 4
01
a6
36
14
9C
2 5
10
95
1a
2 3
92
89
9a
77
3 6
59
a2
43
87
9a
92
25
1a
69 0
00
a245 2
11
BF
15 7
56 6
33
a
The
lett
er t
o th
e rig
ht o
f eac
h es
timat
e in
dica
tes
its q
ualit
y, a
s fo
llow
s: A
– V
ery
good
, B –
Acc
epta
ble,
C –
Use
with
cau
tion,
F –
Too
unr
elia
ble
to b
e p
ublis
hed
or s
upp
ress
ed fo
r re
ason
s of
con
fiden
tialit
y.
Due
to
roun
ding
, num
bers
may
not
add
up
to
the
tota
l sho
wn,
and
som
e nu
mbe
rs m
ay d
iffer
slig
htly
from
one
tab
le t
o th
e ne
xt.
1 Th
e re
sidu
al c
ateg
ory
‘‘Oth
er S
ervi
ces’
’ inc
lude
s th
e ca
tego
ries
Arts
, Ent
erta
inm
ent
and
Recr
eatio
n (N
AIC
S 71
) an
d O
ther
ser
vice
s ex
cept
rel
igio
us o
rgan
izat
ions
(N
AIC
S 81
, exc
ept
8131
10).

2008 Commercial & Institutional Consumption of Energy Survey
APPENDIX A — CLASSIFICATION OF COMMERCIAL & INSTITUTIONAL ESTABLISHMENTS
35
For the purposes of CICES 2008, the establishments were classified in accordance with the 2007 North America Industry Classification System (NAICS).17
Wholesale and Warehousing (NaiCs 41, 49)
�� Farm Product Wholesaler-Distributors; Petroleum Product Wholesaler-Distributors; Food, Beverage and Tobacco Wholesaler-Distributors; Personal and Household Goods Wholesaler-Distributors; Motor Vehicle and Parts Wholesaler-Distributors; Building Material and Supplies Wholesaler-Distributors; Machinery, Equipment and Supplies Wholesaler-Distributors; Miscellaneous Wholesaler-Distributors; Wholesale Electronic Markets, and Agents and Brokers;
�� Postal Service; Couriers and Messengers; Warehousing and Storage
retail trade (NaiCs 44, 45)
Non-Food Retail Trade (NAICS 44 (except 445), 45)
�� Motor Vehicle and Parts Dealers; Furniture and Home Furnishings Stores; Electronics and Appliance Stores; Building Material and Garden Equipment and Supplies Dealers; Health and Personal Care Stores; Gasoline Stations; Clothing and Clothing Accessories Stores
�� Sporting Goods, Hobby, Book and Music Stores; General Merchandise Stores; Miscellaneous Store Retailers; Non-Store Retailers
Food Retail (NAICS 445)
�� Grocery Stores; Specialty Food Stores; Beer, Wine and Liquor Stores
17 Statistics Canada, http://www.statcan.gc.ca/subjects-sujets/standard-norme/naics-scian/2007/index-indexe-eng.htm.
information and Cultural industries (NaiCs 51)
�� Publishing Industries (except Internet); Motion Picture and Sound Recording Industries; Broadcasting (except Internet); Telecommunications; Data Processing, Hosting, and Related Services; Other Information Services
Financial, real estate and other Professional services (NaiCs 52, 53, 54)
�� Monetary Authorities - Central Bank; Credit Intermediation and Related Activities; Securities, Commodity Contracts, and Other Financial Investment and Related Activities; Insurance Carriers and Related Activities; Funds and Other Financial Vehicles
�� Real Estate; Rental and Leasing Services; Lessors of Non-Financial Intangible Assets (except Copyrighted Works)
�� Professional, Scientific and Technical Services
Public administration (NaiCs 91)
�� Federal Government Public Administration; Provincial and Territorial Public Administration; Local, Municipal and Regional Public Administration; Aboriginal Public Administration; International and Other Extra-Territorial Public Administration
education (NaiCs 61)
Elementary and Secondary Schools (NAICS 6111)
Community Colleges and C.E.G.E.P.s (NAICS 6112)
Universities (NAICS 6113)
Business Schools and Others (NAICS 6114 to 6117)
�� Business Schools and Computer Management Training; Technical and Trade Schools; Other Schools and Instruction; Educational Support Services
■■ APPENdIX A — CLASSIFICATIoN oF CommErCIAL & INSTITUTIoNAL ESTABLISHmENTS
2008 Commercial & Institutional Consumption of Energy Survey
APPENDIX A — CLASSIFICATION OF COMMERCIAL & INSTITUTIONAL ESTABLISHMENTS
36
health Care (NaiCs 62)
Ambulatory Health Care Services (NAICS 621)
�� Offices of Physicians; Offices of Dentists; Offices of Other Health Practitioners; Out-Patient Care Centres; Medical and Diagnostic Laboratories; Home Health Care Services; Other Ambulatory Health Care Services
Hospitals (NAICS 622)
�� General Medical and Surgical Hospitals; Psychiatric and Substance Abuse Hospitals; Specialty (except Psychiatric and Substance Abuse) Hospitals
Nursing and Residential Care Facilities (NAICS 623)
�� Nursing Care Facilities; Residential Developmental Handicap, Mental Health and Substance Abuse Facilities; Community Care Facilities for the Elderly; Other Residential Care Facilities
Social Assistance (NAICS 624)
�� Individual and Family Services; Community Food and Housing, and Emergency and Other Relief Services; Vocational Rehabilitation Services; Child Day-Care Services
accommodation services (NaiCs 721)
�� Traveller Accommodation; RV (Recreational Vehicle) Parks and Recreational Camps; Rooming and Boarding Houses
Food services and drinking Places (NaiCs 722)
�� Full-Service Restaurants; Limited-Service Eating Places; Special Food Services; Drinking Places (Alcoholic Beverages)
religious organizations (NaiCs 8131)
other services (NaiCs 71, 81 (except 8131, 814))
�� Performing Arts Companies; Spectator Sports; Promoters (Presenters) of Performing Arts, Sports and Similar Events; Agents and Managers for Artists, Athletes, Entertainers and Other Public Figures; Independent Artists, Writers and Performers; Heritage Institutions; Amusement Parks and Arcades; Gambling Industries; Other Amusement and Recreation Industries
�� Automotive Repair and Maintenance; Electronic and Precision Equipment Repair and Maintenance; Commercial and Industrial Machinery and Equipment (except Automotive and Electronic) Repair and Maintenance; Personal and Household Goods Repair and Maintenance; Personal Care Services; Funeral Services; Dry Cleaning and Laundry Services; Other Personal Services; Grant-Making and Giving Services; Social Advocacy Organizations; Civic and Social Organizations; Business, Professional, Labour and Other Membership Organizations
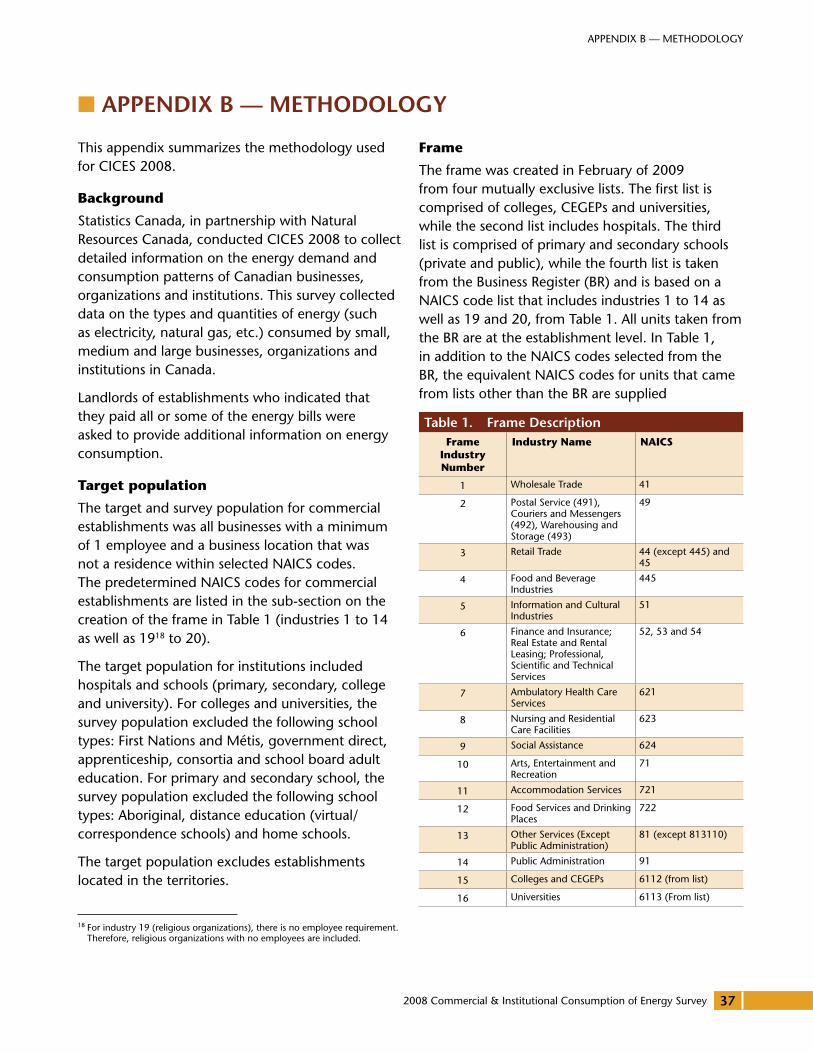
2008 Commercial & Institutional Consumption of Energy Survey
APPENDIX B — METHODOLOGY
37
This appendix summarizes the methodology used for CICES 2008.
Background
Statistics Canada, in partnership with Natural Resources Canada, conducted CICES 2008 to collect detailed information on the energy demand and consumption patterns of Canadian businesses, organizations and institutions. This survey collected data on the types and quantities of energy (such as electricity, natural gas, etc.) consumed by small, medium and large businesses, organizations and institutions in Canada.
Landlords of establishments who indicated that they paid all or some of the energy bills were asked to provide additional information on energy consumption.
target population
The target and survey population for commercial establishments was all businesses with a minimum of 1 employee and a business location that was not a residence within selected NAICS codes. The predetermined NAICS codes for commercial establishments are listed in the sub-section on the creation of the frame in Table 1 (industries 1 to 14 as well as 1918 to 20).
The target population for institutions included hospitals and schools (primary, secondary, college and university). For colleges and universities, the survey population excluded the following school types: First Nations and Métis, government direct, apprenticeship, consortia and school board adult education. For primary and secondary school, the survey population excluded the following school types: Aboriginal, distance education (virtual/ correspondence schools) and home schools.
The target population excludes establishments located in the territories.
18 For industry 19 (religious organizations), there is no employee requirement. Therefore, religious organizations with no employees are included.
Frame
The frame was created in February of 2009 from four mutually exclusive lists. The first list is comprised of colleges, CEGEPs and universities, while the second list includes hospitals. The third list is comprised of primary and secondary schools (private and public), while the fourth list is taken from the Business Register (BR) and is based on a NAICS code list that includes industries 1 to 14 as well as 19 and 20, from Table 1. All units taken from the BR are at the establishment level. In Table 1, in addition to the NAICS codes selected from the BR, the equivalent NAICS codes for units that came from lists other than the BR are supplied
■■ APPENdIX B — mETHodoLoGY
Table 1. Frame descriptionFrame
industry Number
industry Name NaiCs
1 Wholesale Trade 41
2 Postal Service (491), Couriers and Messengers (492), Warehousing and Storage (493)
49
3 Retail Trade 44 (except 445) and 45
4 Food and Beverage Industries
445
5 Information and Cultural Industries
51
6 Finance and Insurance; Real Estate and Rental Leasing; Professional, Scientific and Technical Services
52, 53 and 54
7 Ambulatory Health Care Services
621
8 Nursing and Residential Care Facilities
623
9 Social Assistance 624
10 Arts, Entertainment and Recreation
71
11 Accommodation Services 721
12 Food Services and Drinking Places
722
13 Other Services (Except Public Administration)
81 (except 813110)
14 Public Administration 91
15 Colleges and CEGEPs 6112 (from list)
16 Universities 6113 (From list)
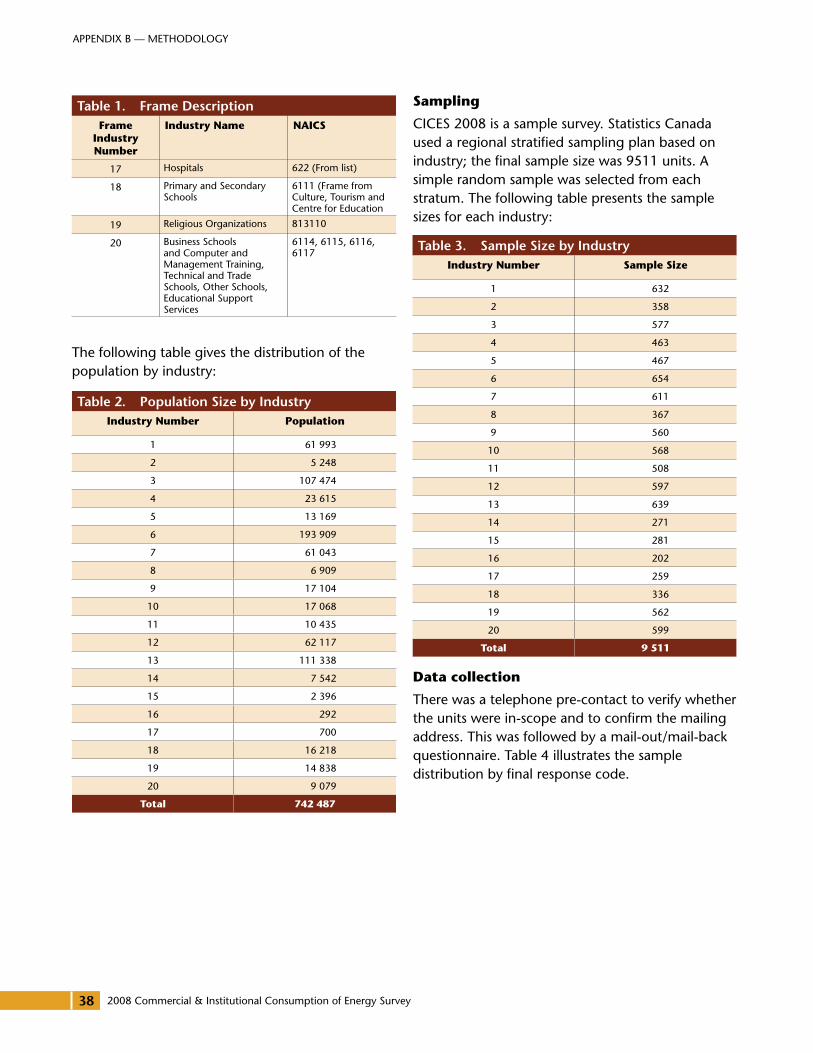
2008 Commercial & Institutional Consumption of Energy Survey
APPENDIX B — METHODOLOGY
38
The following table gives the distribution of the population by industry:
sampling
CICES 2008 is a sample survey. Statistics Canada used a regional stratified sampling plan based on industry; the final sample size was 9511 units. A simple random sample was selected from each stratum. The following table presents the sample sizes for each industry:
data collection
There was a telephone pre-contact to verify whether the units were in-scope and to confirm the mailing address. This was followed by a mail-out/mail-back questionnaire. Table 4 illustrates the sample distribution by final response code.
Table 1. Frame descriptionFrame
industry Number
industry Name NaiCs
17 Hospitals 622 (From list)
18 Primary and Secondary Schools
6111 (Frame from Culture, Tourism and Centre for Education
19 Religious Organizations 813110
20 Business Schools and Computer and Management Training, Technical and Trade Schools, Other Schools, Educational Support Services
6114, 6115, 6116, 6117
Table 2. Population Size by Industryindustry Number Population
1 61 993
2 5 248
3 107 474
4 23 615
5 13 169
6 193 909
7 61 043
8 6 909
9 17 104
10 17 068
11 10 435
12 62 117
13 111 338
14 7 542
15 2 396
16 292
17 700
18 16 218
19 14 838
20 9 079
total 742 487
Table 3. Sample Size by Industryindustry Number sample size
1 632
2 358
3 577
4 463
5 467
6 654
7 611
8 367
9 560
10 568
11 508
12 597
13 639
14 271
15 281
16 202
17 259
18 336
19 562
20 599
total 9 511
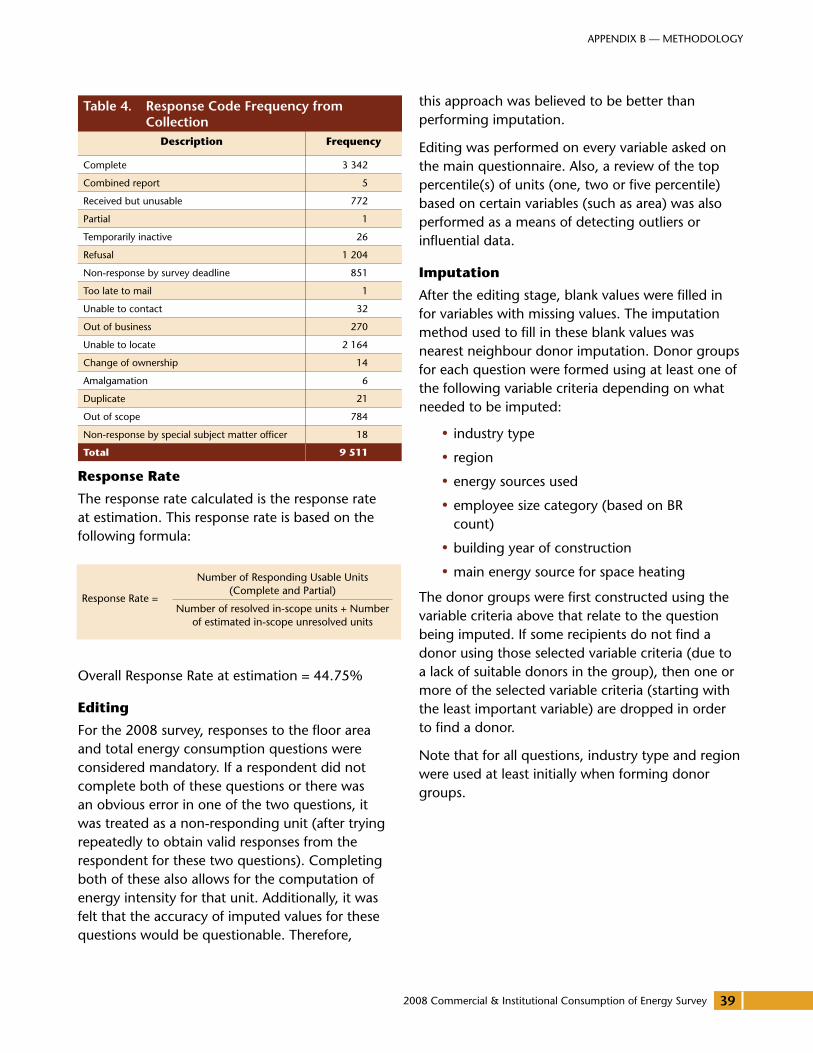
2008 Commercial & Institutional Consumption of Energy Survey
APPENDIX B — METHODOLOGY
39
response rate
The response rate calculated is the response rate at estimation. This response rate is based on the following formula:
Overall Response Rate at estimation = 44.75%
editing
For the 2008 survey, responses to the floor area and total energy consumption questions were considered mandatory. If a respondent did not complete both of these questions or there was an obvious error in one of the two questions, it was treated as a non-responding unit (after trying repeatedly to obtain valid responses from the respondent for these two questions). Completing both of these also allows for the computation of energy intensity for that unit. Additionally, it was felt that the accuracy of imputed values for these questions would be questionable. Therefore,
this approach was believed to be better than performing imputation.
Editing was performed on every variable asked on the main questionnaire. Also, a review of the top percentile(s) of units (one, two or five percentile) based on certain variables (such as area) was also performed as a means of detecting outliers or influential data.
imputation
After the editing stage, blank values were filled in for variables with missing values. The imputation method used to fill in these blank values was nearest neighbour donor imputation. Donor groups for each question were formed using at least one of the following variable criteria depending on what needed to be imputed:
�� industry type
�� region
�� energy sources used
�� employee size category (based on BR count)
�� building year of construction
�� main energy source for space heating
The donor groups were first constructed using the variable criteria above that relate to the question being imputed. If some recipients do not find a donor using those selected variable criteria (due to a lack of suitable donors in the group), then one or more of the selected variable criteria (starting with the least important variable) are dropped in order to find a donor.
Note that for all questions, industry type and region were used at least initially when forming donor groups.
Table 4. response Code Frequency from Collection
description Frequency
Complete 3 342
Combined report 5
Received but unusable 772
Partial 1
Temporarily inactive 26
Refusal 1 204
Non-response by survey deadline 851
Too late to mail 1
Unable to contact 32
Out of business 270
Unable to locate 2 164
Change of ownership 14
Amalgamation 6
Duplicate 21
Out of scope 784
Non-response by special subject matter officer 18
total 9 511
Response Rate =
Number of Responding Usable Units (Complete and Partial)
Number of resolved in-scope units + Number of estimated in-scope unresolved units
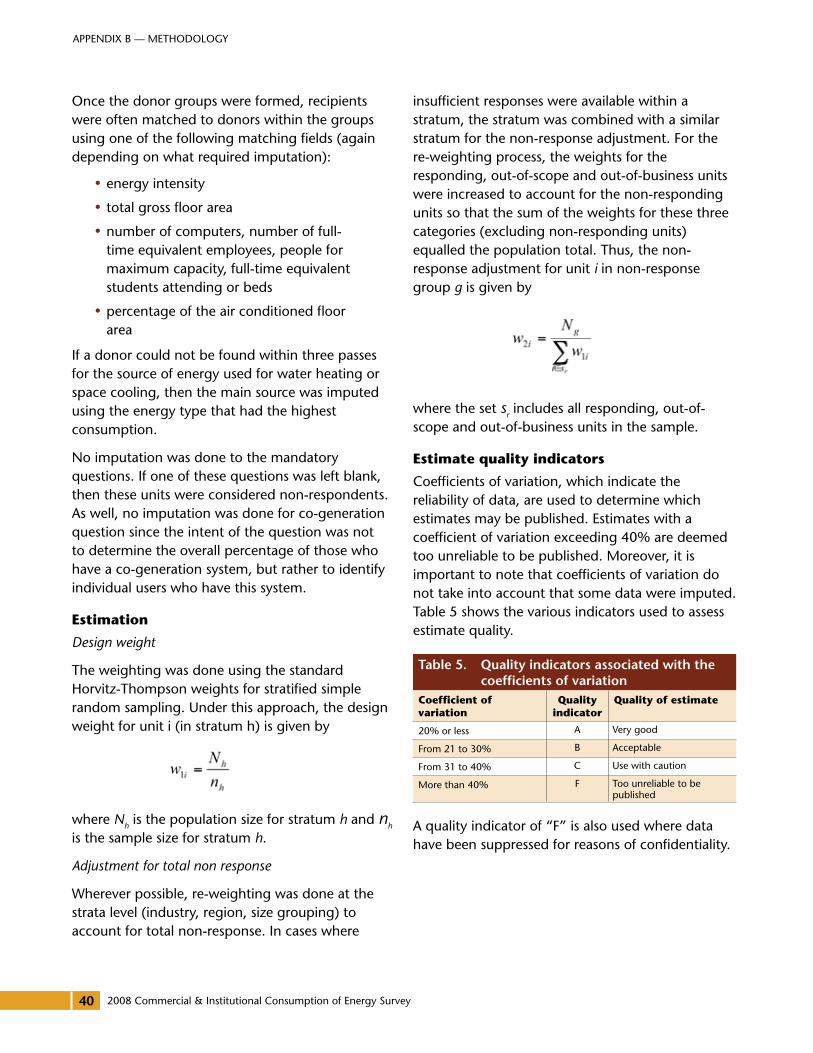
2008 Commercial & Institutional Consumption of Energy Survey
APPENDIX B — METHODOLOGY
40
Once the donor groups were formed, recipients were often matched to donors within the groups using one of the following matching fields (again depending on what required imputation):
�� energy intensity
�� total gross floor area
�� number of computers, number of full-time equivalent employees, people for maximum capacity, full-time equivalent students attending or beds
�� percentage of the air conditioned floor area
If a donor could not be found within three passes for the source of energy used for water heating or space cooling, then the main source was imputed using the energy type that had the highest consumption.
No imputation was done to the mandatory questions. If one of these questions was left blank, then these units were considered non-respondents. As well, no imputation was done for co-generation question since the intent of the question was not to determine the overall percentage of those who have a co-generation system, but rather to identify individual users who have this system.
estimation
Design weight
The weighting was done using the standard Horvitz-Thompson weights for stratified simple random sampling. Under this approach, the design weight for unit i (in stratum h) is given by
where Nh is the population size for stratum h and nh is the sample size for stratum h.
Adjustment for total non response
Wherever possible, re-weighting was done at the strata level (industry, region, size grouping) to account for total non-response. In cases where
insufficient responses were available within a stratum, the stratum was combined with a similar stratum for the non-response adjustment. For the re-weighting process, the weights for the responding, out-of-scope and out-of-business units were increased to account for the non-responding units so that the sum of the weights for these three categories (excluding non-responding units) equalled the population total. Thus, the non-response adjustment for unit i in non-response group g is given by
where the set sr includes all responding, out-of-scope and out-of-business units in the sample.
estimate quality indicators
Coefficients of variation, which indicate the reliability of data, are used to determine which estimates may be published. Estimates with a coefficient of variation exceeding 40% are deemed too unreliable to be published. Moreover, it is important to note that coefficients of variation do not take into account that some data were imputed. Table 5 shows the various indicators used to assess estimate quality.
A quality indicator of “F” is also used where data have been suppressed for reasons of confidentiality.
Table 5. quality indicators associated with the coefficients of variation
Coefficient of variation
Quality indicator
Quality of estimate
20% or less A Very good
From 21 to 30% B Acceptable
From 31 to 40% C Use with caution
More than 40% F Too unreliable to be published
2008 Commercial & Institutional Consumption of Energy Survey
APPENDIX C — GLOSSARY
41
automated teller machine:
A computerized telecommunications device that provides the clients of a financial institution with access to financial transactions in a public space without the need for a cashier, human clerk or bank teller.
auxiliary equipment:
Stand-alone equipment powered directly from an electrical outlet such as computers, photocopiers, refrigerators and desktop lamps. It also includes equipment that can be powered by natural gas, propane or other fuels, such as clothes dryers and cooking appliances. See Section 7 for the types of auxiliary equipment covered by CICES 2008.
Building:
A structure totally enclosed by walls extending from the foundation to the roof.
Census:
Collection of information from all units of the population.
Co-generation:
The simultaneous generation of electricity and useful thermal energy (e.g. steam) in one process and from the same fuel source. Types of co-generation units/systems include condensing steam turbines, combined cycle gas turbines, etc.
Computer:
For the purpose of CICES 2008 the definition of a computer includes other electronic devices with a micro-processor (e.g. cash register) and excludes battery-operated and handheld devices.
Computer server:
A computer system that provides essential services over a computer network. This excludes personal computers and laptops.
diesel:
All grades of low-sulphur (lower than 0.05%) distillate fuel used as an energy source for diesel engines. For the purpose of CICES 2008 diesel does not include diesel used for transportation.
domestic appliances:
Appliances that are typically found in a residential setting (e.g. stoves, microwave ovens, refrigerators, freezers and dishwashers).
electricity:
A form of energy emanating from electric charges at rest or in movement. For the purpose of CICES 2008 electricity includes purchased electricity and self-generated electricity kept for on-site usage.
electricity generation:
The production of electricity in an establishment using a generator, solar panels, fuel cells, aerogenerators, etc.
energy consumption:
For CICES 2008, the sum of establishment electricity (purchased), natural gas, light fuel oil and other middle distillates, propane, diesel, heavy fuel oil, wood and wood by-products, steam (purchased) and other fuels (as specified by respondent) consumption in terms of energy (gigajoules) during 2008. Establishment energy consumption only accounts for energy consumed at the building level or physical location of the establishment and excludes energy consumed for transportation.
energy-efficient lighting system:
The use of an energy-efficient ballast which requires a lower power input than a conventional ballast to operate fluorescent and high-intensity discharge lamps. Also included are compact fluorescent light bulbs (CFL), LED lights, up-lighting, timers and motion detectors.
■■ APPENdIX C — GLoSSArY
2008 Commercial & Institutional Consumption of Energy Survey
APPENDIX C — GLOSSARY
42
energy intensity:
CICES 2008 measures the energy intensity as the total amount of energy used by a group of establishments, divided by the total floor area of the same group.
energy source(s):
Type(s) of energy used by an establishment. For CICES 2008, energy sources include electricity, natural gas, light fuel oil and other middle distillates, propane, diesel, heavy fuel oil, wood and wood by-products, steam, renewable and other fuels (as specified by respondent).
establishment:
Establishment is the statistical unit used for survey purposes. In the case of colleges and universities, the establishment is the campus. In the case of hospitals, it is the entire set of facilities of the hospital complex. For all other activity sectors, it is the enterprise or institution. An establishment may include more than one building (e.g. a university campus). Conversely, a building may house more than one establishment (e.g. a shopping centre).
Floor area:
Total gross floor area is all the area enclosed above or below ground by the exterior walls of a building, including hallways, lobbies, stairways, penthouses and elevator shafts, but excluding indoor parking and mechanical areas.
Full-time equivalent employee:
A full-time employee is a person who works at an establishment for 30 or more hours a week. This employee is considered to be one full-time equivalent employee. Part-time employees are converted to full-time equivalent employees by taking the total hours per week worked by the part-time employees and dividing by the typical hours per week worked by a full-time employee of the establishment. This definition includes contract workers and volunteers.
Gigajoule (GJ):
A unit of measure for energy consumption equal to 1 billion joules.
heat recovery system:
A heating, ventilation, and air-conditioning (HVAC) conservation feature that recovers heat from exhaust air.
heavy fuel oil:
All grades of residual type fuels, including low-sulphur fuels, used mainly as an energy source for steam and electric power generation and diesel motors. The term includes fuel oil grade numbers 4, 5 and 6.
high-efficiency boiler:
A type of space-heating equipment used to generate hot water or steam, with energy efficiencies of 90 to 96%.
operating hours:
For CICES 2008, normal operating hours are considered to be the hours an establishment is operating during a typical week. This excludes any time period in which maintenance, house-keeping, or security staff are working outside of the normal operating hours. If the hours vary for different parts of the building or complex, respondents report for the area which is open the longest.
hVaC:
Heating, ventilation, and air conditioning.
industrial food preparation appliances:
Appliances that are typically found in a cafeteria or restaurant such as industrial stoves, ovens, refrigerators, freezers and dishwashers.
insulation:
Material that reduces unwanted heat loss or gain and can decrease the energy demands of heating and cooling systems.
2008 Commercial & Institutional Consumption of Energy Survey
APPENDIX C — GLOSSARY
43
Light fuel oil and other middle distillates:
A category of energy sources that includes home fuel, light fuel oil (numbers 1, 2 and 3), kerosene, mineral lamp oil, gas oils and light industrial fuel.
medical diagnosis or treatment machines:
Machines typically found in Health Care establishments. For CICES 2008, the definition includes, but is not limited to, X-ray, CAT scan, MRI, dialysis, and ultrasound machines.
Laundry washers and dryers:
Appliances used to wash and dry clothing.
Natural gas:
An energy source that is a mixture of hydrocarbons (principally methane) and small quantities of various hydrocarbons existing in the gaseous phase or in solution with crude oil in underground reservoirs. It is delivered directly to buildings by pipelines.
North american industrial Classification system (NaiCs):
A classification system that categorizes establishments into groups with similar economic activities. The structure of NAICS, adopted by Statistics Canada in 1997 to replace the 1980 Standard Industrial Classification (SIC), was developed by the statistical agencies of Canada, Mexico and the United States.
outdoor-air economizer:
An HVAC conservation feature that uses outside air for air conditioning.
Printers, photocopiers and/or fax machines:
Equipment used to print, copy, and/or transmit a visual rendering either from a computer to a piece of paper or from a piece of paper onto another piece of paper.
Programmable thermostat:
A thermostat which is designed to adjust the temperature according to a series of programed settings that take effect at different times of the day.
Propane:
An energy source that is normally a gaseous straight-chain hydrocarbon (C3H8) extracted from natural gas or refinery gas streams. It can also take a liquid form.
renewable energy source:
An energy source which comes from natural resources such as sunlight, wind, rain, tides, and geothermal heat, which are renewable (naturally replenished).
solar electricity:
Electricity created by using photovoltaic (PV) technology by converting solar energy into electricity from sunlight.
solar hot water heater:
Heating systems that are composed of solar thermal collectors and are used to heat domestic hot water and swimming pool water, or for space heating.
space cooling:
As an energy end-use, conditioning of room air for human comfort by a refrigeration unit (e.g. air conditioner or heat pump) or by the circulation of chilled water through a central- or district-cooling system. The use of fans or venting only, without air or water cooling, is excluded.
space heating:
As an energy end-use, the use of mechanical equipment to heat all or part of a building. Includes the principal space heating unit and any supplementary equipment.
steam:
An energy source that is a gas resulting from the vaporization of a liquid or the sublimation of a solid, generated by condensing or non-condensing turbines.
sterilizing equipment:
Equipment used to sanitize medical instruments or other devices.
2008 Commercial & Institutional Consumption of Energy Survey
APPENDIX C — GLOSSARY
44
survey:
Collection of information from some (a sample) units of the population. CICES 2008 was a survey of establishments in the C&I sector. Results from this survey were used to produce representative data estimates for all establishments in the C&I sector. These estimates are presented in this report.
useful thermal energy:
Includes high-pressure steam (greater than 30 psi), low-pressure steam (less than 30 psi), high-temperature water (greater than 80°C), and low-temperature water (less than 80°C). Useful thermal energy can be used for heating or cooling.
Variable air-volume system:
A HVAC conservation feature that supplies varying quantities of conditioned (heated or cooled) air to different parts of a building according to the heating and cooling needs of those specific areas.
Vending machine:
A self-contained device that dispenses a product when the user makes a product selection, often after the deposit of legal tender.
Water heating:
As an energy end-use, the use of energy to heat water for purposes other than space heating.
Wind-powered electric generator:
Electricity generated by converting the rotation of turbine blades into electrical current by means of an electrical generator.
Window enhancements:
Improvements over standard windows, such as reflective shading (whereby a special metallic film has been applied to glass to block and reduce harmful aspects of the sun) and low-E coat (a thin, invisible metallic layer applied directly to glazing surfaces of windows to retain heat in the winter and keep out radiated heat in the summer).
Wood and wood by-products:
An energy source that includes round wood (sold by the cord), lignin, wood scraps (chips) from furniture and window frame manufacturing, bark, sawdust, forestry residues, charcoal and pulp waste.
year of construction:
For CICES 2008, the year in which the major portion of an establishment’s building(s) was (were) built. If two or more portions/buildings of equal size were constructed at different times, then the oldest was reported.
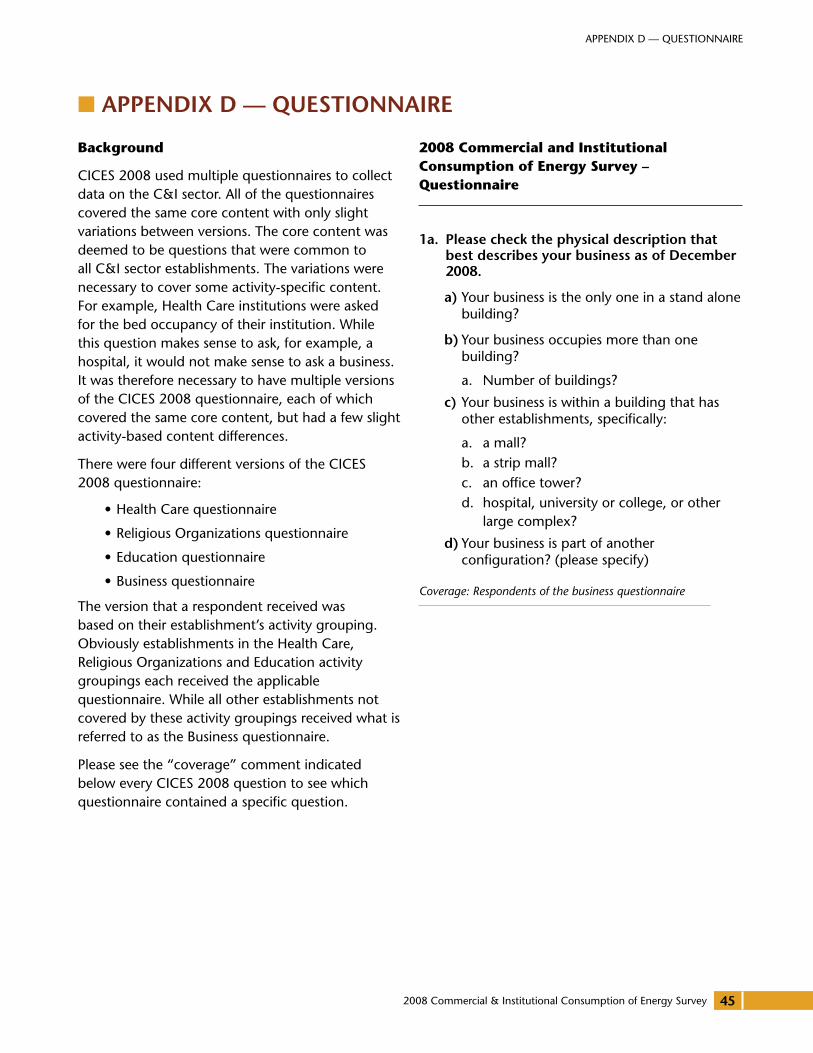
2008 Commercial & Institutional Consumption of Energy Survey
APPENDIX D — QUESTIONNAIRE
45
Background
CICES 2008 used multiple questionnaires to collect data on the C&I sector. All of the questionnaires covered the same core content with only slight variations between versions. The core content was deemed to be questions that were common to all C&I sector establishments. The variations were necessary to cover some activity-specific content. For example, Health Care institutions were asked for the bed occupancy of their institution. While this question makes sense to ask, for example, a hospital, it would not make sense to ask a business. It was therefore necessary to have multiple versions of the CICES 2008 questionnaire, each of which covered the same core content, but had a few slight activity-based content differences.
There were four different versions of the CICES 2008 questionnaire:
• Health Care questionnaire
• Religious Organizations questionnaire
• Education questionnaire
• Business questionnaire
The version that a respondent received was based on their establishment’s activity grouping. Obviously establishments in the Health Care, Religious Organizations and Education activity groupings each received the applicable questionnaire. While all other establishments not covered by these activity groupings received what is referred to as the Business questionnaire.
Please see the “coverage” comment indicated below every CICES 2008 question to see which questionnaire contained a specific question.
2008 Commercial and institutional Consumption of energy survey – Questionnaire
1a. Please check the physical description that best describes your business as of december 2008.
a) Your business is the only one in a stand alone building?
b) Your business occupies more than one building?
a. Number of buildings?
c) Your business is within a building that has other establishments, specifically:
a. a mall?b. a strip mall?c. an office tower?d. hospital, university or college, or other
large complex?
d) Your business is part of another configuration? (please specify)
Coverage: Respondents of the business questionnaire
■■ APPENdIX d — qUESTIoNNAIrE
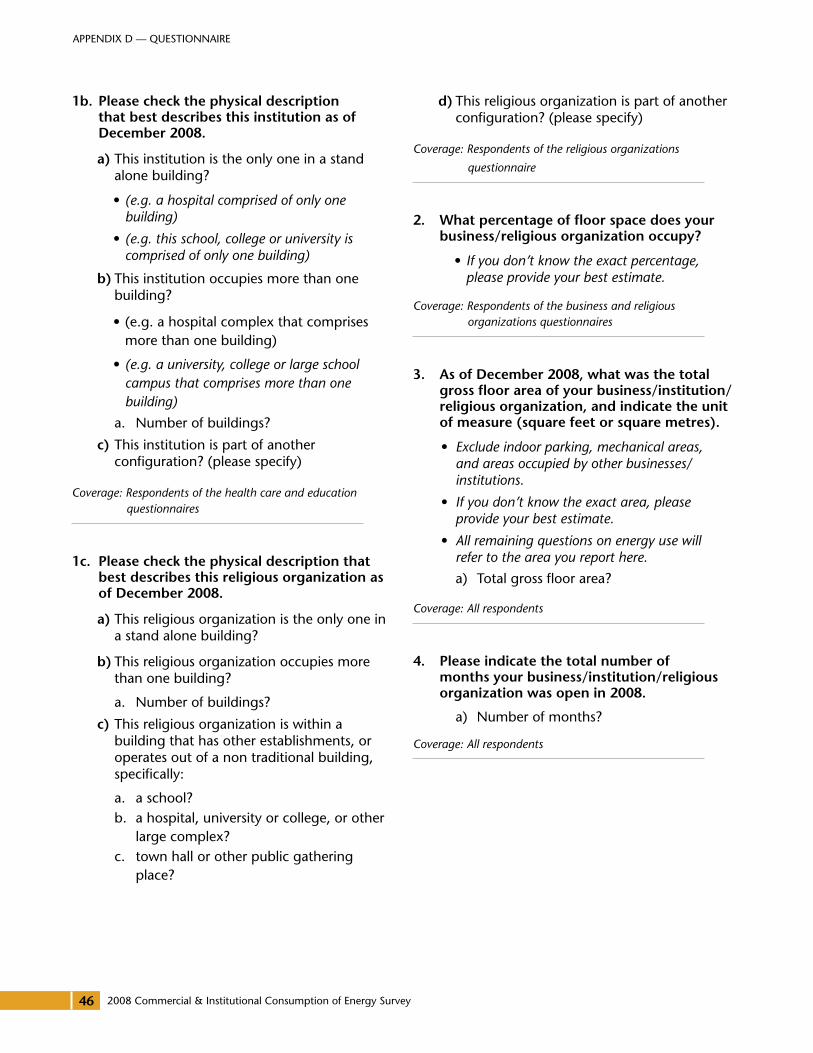
2008 Commercial & Institutional Consumption of Energy Survey
APPENDIX D — QUESTIONNAIRE
46
1b. Please check the physical description that best describes this institution as of december 2008.
a) This institution is the only one in a stand alone building?
• (e.g. a hospital comprised of only one building)
• (e.g. this school, college or university is comprised of only one building)
b) This institution occupies more than one building?
• (e.g. a hospital complex that comprises more than one building)
• (e.g. a university, college or large school campus that comprises more than one building)
a. Number of buildings?
c) This institution is part of another configuration? (please specify)
Coverage: Respondents of the health care and education questionnaires
1c. Please check the physical description that best describes this religious organization as of december 2008.
a) This religious organization is the only one in a stand alone building?
b) This religious organization occupies more than one building?
a. Number of buildings?
c) This religious organization is within a building that has other establishments, or operates out of a non traditional building, specifically:
a. a school?b. a hospital, university or college, or other
large complex?c. town hall or other public gathering
place?
d) This religious organization is part of another configuration? (please specify)
Coverage: Respondents of the religious organizations
questionnaire
2. what percentage of floor space does your business/religious organization occupy?
• If you don’t know the exact percentage, please provide your best estimate.
Coverage: Respondents of the business and religious organizations questionnaires
3. As of december 2008, what was the total gross floor area of your business/institution/religious organization, and indicate the unit of measure (square feet or square metres).
• Exclude indoor parking, mechanical areas, and areas occupied by other businesses/institutions.
• If you don’t know the exact area, please provide your best estimate.
• All remaining questions on energy use will refer to the area you report here.
a) Total gross floor area?
Coverage: All respondents
4. Please indicate the total number of months your business/institution/religious organization was open in 2008.
a) Number of months?
Coverage: All respondents
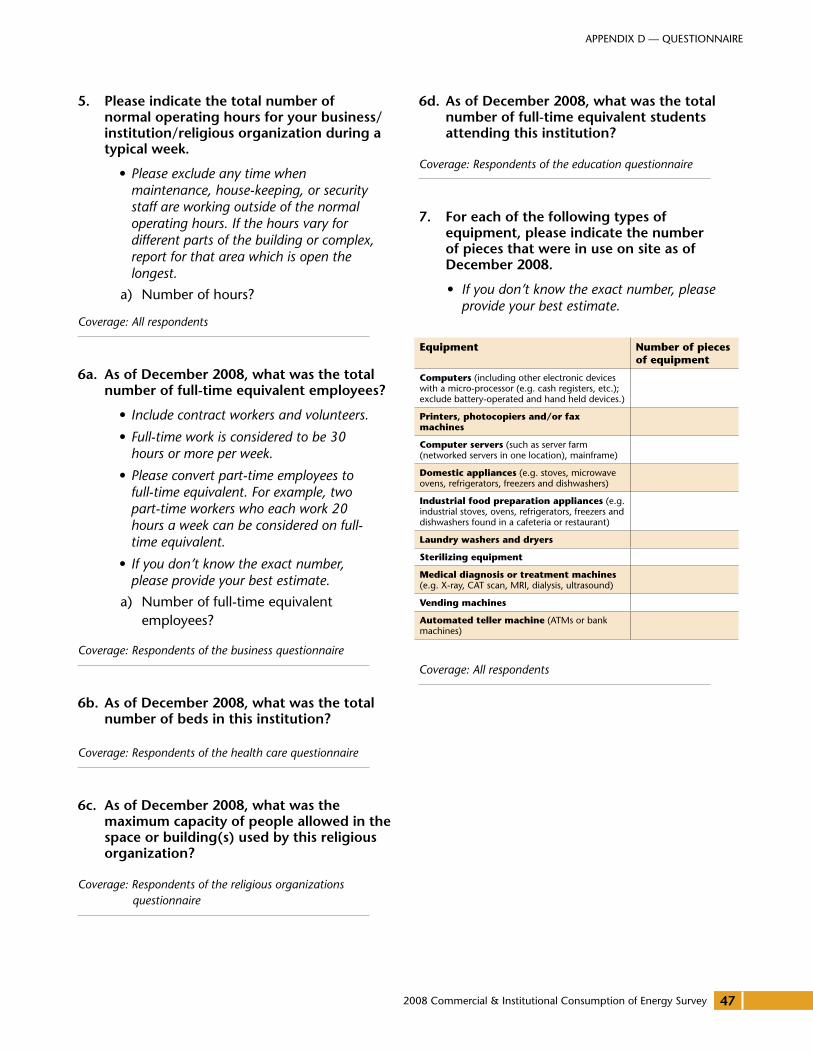
2008 Commercial & Institutional Consumption of Energy Survey
APPENDIX D — QUESTIONNAIRE
47
5. Please indicate the total number of normal operating hours for your business/institution/religious organization during a typical week.
• Please exclude any time when maintenance, house-keeping, or security staff are working outside of the normal operating hours. If the hours vary for different parts of the building or complex, report for that area which is open the longest.
a) Number of hours?
Coverage: All respondents
6a. As of december 2008, what was the total number of full-time equivalent employees?
• Include contract workers and volunteers.
• Full-time work is considered to be 30 hours or more per week.
• Please convert part-time employees to full-time equivalent. For example, two part-time workers who each work 20 hours a week can be considered on full-time equivalent.
• If you don’t know the exact number, please provide your best estimate.
a) Number of full-time equivalent employees?
Coverage: Respondents of the business questionnaire
6b. As of december 2008, what was the total number of beds in this institution?
Coverage: Respondents of the health care questionnaire
6c. As of december 2008, what was the maximum capacity of people allowed in the space or building(s) used by this religious organization?
Coverage: Respondents of the religious organizations questionnaire
6d. As of december 2008, what was the total number of full-time equivalent students attending this institution?
Coverage: Respondents of the education questionnaire
7. For each of the following types of equipment, please indicate the number of pieces that were in use on site as of december 2008.
• If you don’t know the exact number, please provide your best estimate.
Coverage: All respondents
equipment Number of pieces of equipment
Computers (including other electronic devices with a micro-processor (e.g. cash registers, etc.); exclude battery-operated and hand held devices.)
Printers, photocopiers and/or fax machines
Computer servers (such as server farm (networked servers in one location), mainframe)
domestic appliances (e.g. stoves, microwave ovens, refrigerators, freezers and dishwashers)
industrial food preparation appliances (e.g. industrial stoves, ovens, refrigerators, freezers and dishwashers found in a cafeteria or restaurant)
Laundry washers and dryers
sterilizing equipment
medical diagnosis or treatment machines (e.g. X-ray, CAT scan, MRI, dialysis, ultrasound)
Vending machines
automated teller machine (ATMs or bank machines)
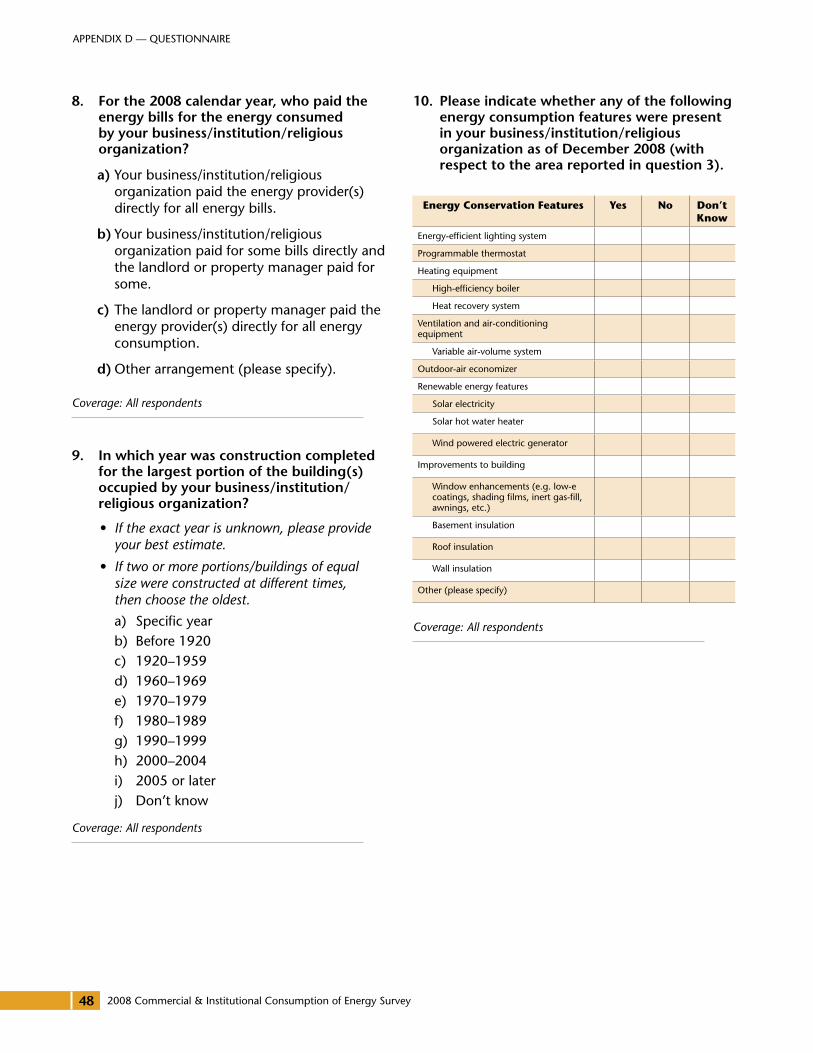
2008 Commercial & Institutional Consumption of Energy Survey
APPENDIX D — QUESTIONNAIRE
48
8. For the 2008 calendar year, who paid the energy bills for the energy consumed by your business/institution/religious organization?
a) Your business/institution/religious organization paid the energy provider(s) directly for all energy bills.
b) Your business/institution/religious organization paid for some bills directly and the landlord or property manager paid for some.
c) The landlord or property manager paid the energy provider(s) directly for all energy consumption.
d) Other arrangement (please specify).
Coverage: All respondents
9. In which year was construction completed for the largest portion of the building(s) occupied by your business/institution/religious organization?
• If the exact year is unknown, please provide your best estimate.
• If two or more portions/buildings of equal size were constructed at different times, then choose the oldest.
a) Specific yearb) Before 1920 c) 1920–1959 d) 1960–1969 e) 1970–1979 f) 1980–1989 g) 1990–1999 h) 2000–2004 i) 2005 or laterj) Don’t know
Coverage: All respondents
10. Please indicate whether any of the following energy consumption features were present in your business/institution/religious organization as of december 2008 (with respect to the area reported in question 3).
Coverage: All respondents
energy Conservation Features yes No don’t Know
Energy-efficient lighting system
Programmable thermostat
Heating equipment
High-efficiency boiler
Heat recovery system
Ventilation and air-conditioning equipment
Variable air-volume system
Outdoor-air economizer
Renewable energy features
Solar electricity
Solar hot water heater
Wind powered electric generator
Improvements to building
Window enhancements (e.g. low-e coatings, shading films, inert gas-fill, awnings, etc.)
Basement insulation
Roof insulation
Wall insulation
Other (please specify)
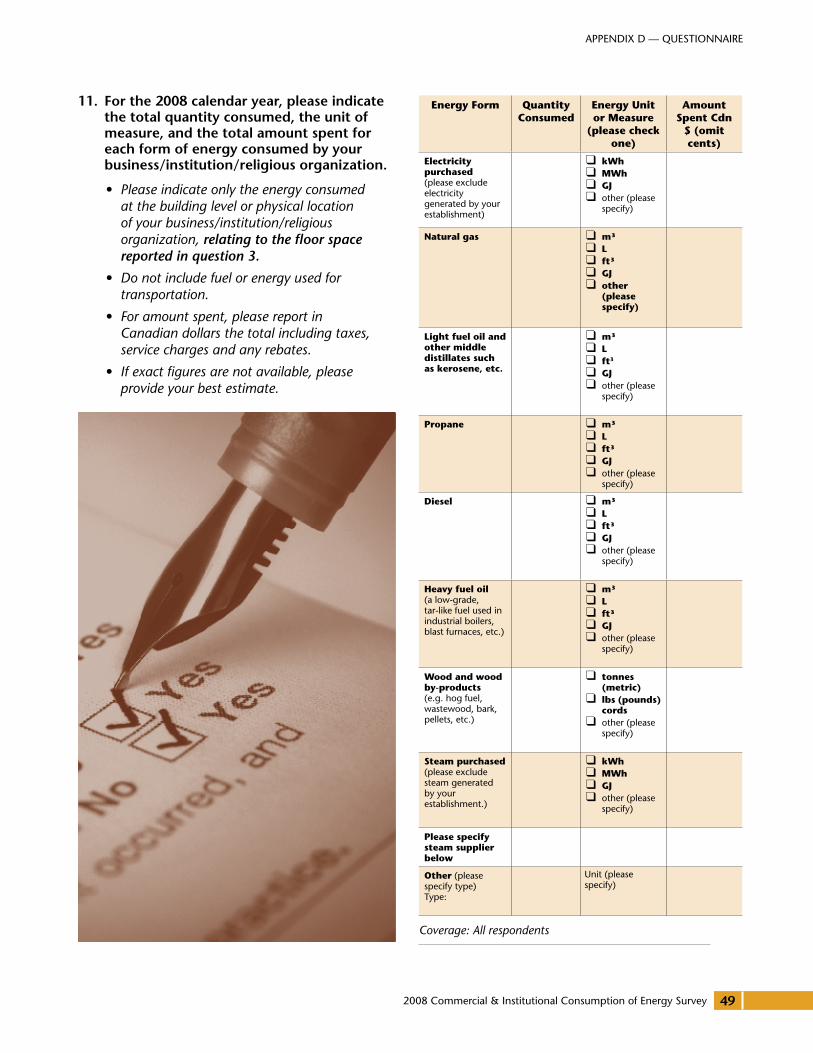
2008 Commercial & Institutional Consumption of Energy Survey
APPENDIX D — QUESTIONNAIRE
49
11. For the 2008 calendar year, please indicate the total quantity consumed, the unit of measure, and the total amount spent for each form of energy consumed by your business/institution/religious organization.
• Please indicate only the energy consumed at the building level or physical location of your business/institution/religious organization, relating to the floor space reported in question 3.
• Do not include fuel or energy used for transportation.
• For amount spent, please report in Canadian dollars the total including taxes, service charges and any rebates.
• If exact figures are not available, please provide your best estimate.
Coverage: All respondents
energy Form Quantity Consumed
energy unit or measure
(please check one)
amount spent Cdn
$ (omit cents)
electricity purchased(please exclude electricity generated by your establishment)
■❑ kWh■❑ mWh ■❑ GJ■❑ other (please specify)
Natural gas ■❑ m3 ■❑ L ■❑ ft3 ■❑ GJ ■❑ other (please specify)
Light fuel oil and other middle distillates such as kerosene, etc.
■❑ m3 ■❑ L■❑ ft3 ■❑ GJ ■❑ other (please specify)
Propane ■❑ m3 ■❑ L■❑ ft3■❑ GJ ■❑ other (please specify)
diesel ■❑ m3 ■❑ L ■❑ ft3 ■❑ GJ ■❑ other (please specify)
heavy fuel oil(a low-grade, tar-like fuel used in industrial boilers, blast furnaces, etc.)
■❑ m3■❑ L ■❑ ft3 ■❑ GJ ■❑ other (please specify)
Wood and wood by-products(e.g. hog fuel, wastewood, bark, pellets, etc.)
■❑ tonnes (metric)
■❑ lbs (pounds) cords
■❑ other (please specify)
steam purchased(please exclude steam generated by your establishment.)
■❑ kWh ■❑ mWh ■❑ GJ■❑ other (please specify)
Please specify steam supplier below
other (please specify type)Type:
Unit (please specify)
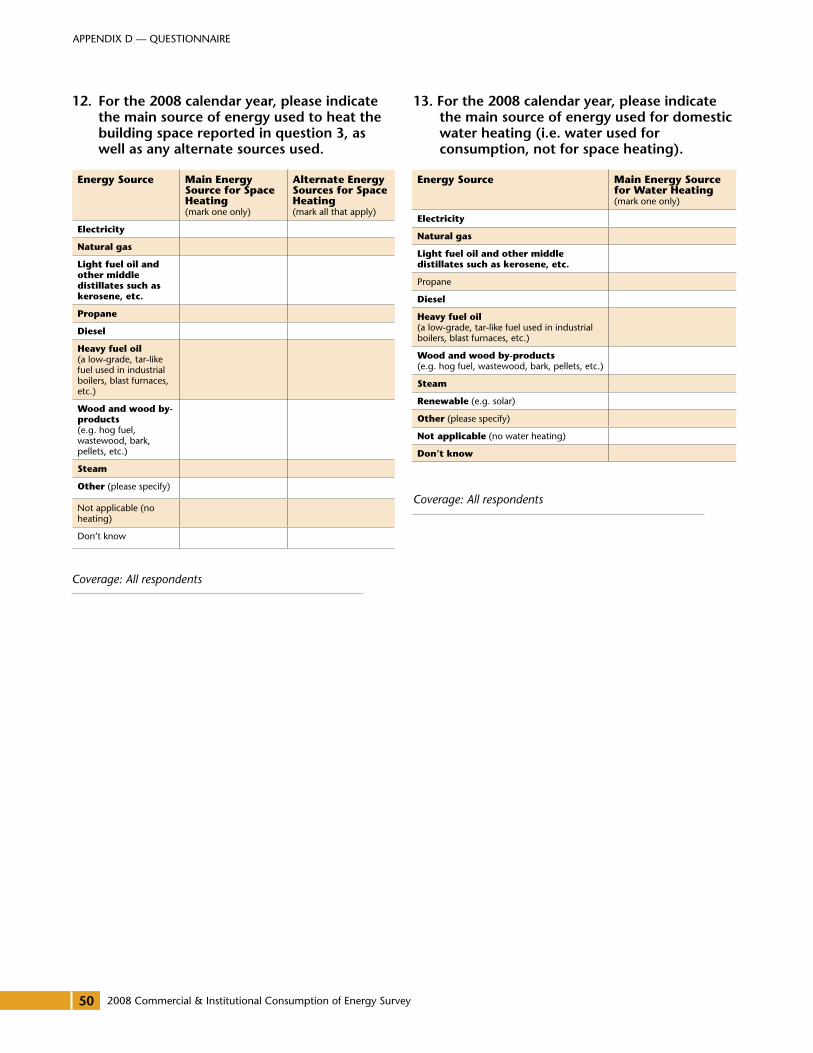
2008 Commercial & Institutional Consumption of Energy Survey
APPENDIX D — QUESTIONNAIRE
50
12. For the 2008 calendar year, please indicate the main source of energy used to heat the building space reported in question 3, as well as any alternate sources used.
Coverage: All respondents
13. For the 2008 calendar year, please indicate the main source of energy used for domestic water heating (i.e. water used for consumption, not for space heating).
Coverage: All respondents
energy source main energy source for Water heating(mark one only)
electricity
Natural gas
Light fuel oil and other middle distillates such as kerosene, etc.
Propane
diesel
heavy fuel oil(a low-grade, tar-like fuel used in industrial boilers, blast furnaces, etc.)
Wood and wood by-products(e.g. hog fuel, wastewood, bark, pellets, etc.)
steam
renewable (e.g. solar)
other (please specify)
Not applicable (no water heating)
don’t know
energy source main energy source for space heating(mark one only)
alternate energy sources for space heating(mark all that apply)
electricity
Natural gas
Light fuel oil and other middle distillates such as kerosene, etc.
Propane
diesel
heavy fuel oil(a low-grade, tar-like fuel used in industrial boilers, blast furnaces, etc.)
Wood and wood by-products(e.g. hog fuel, wastewood, bark, pellets, etc.)
steam
other (please specify)
Not applicable (no heating)
Don’t know
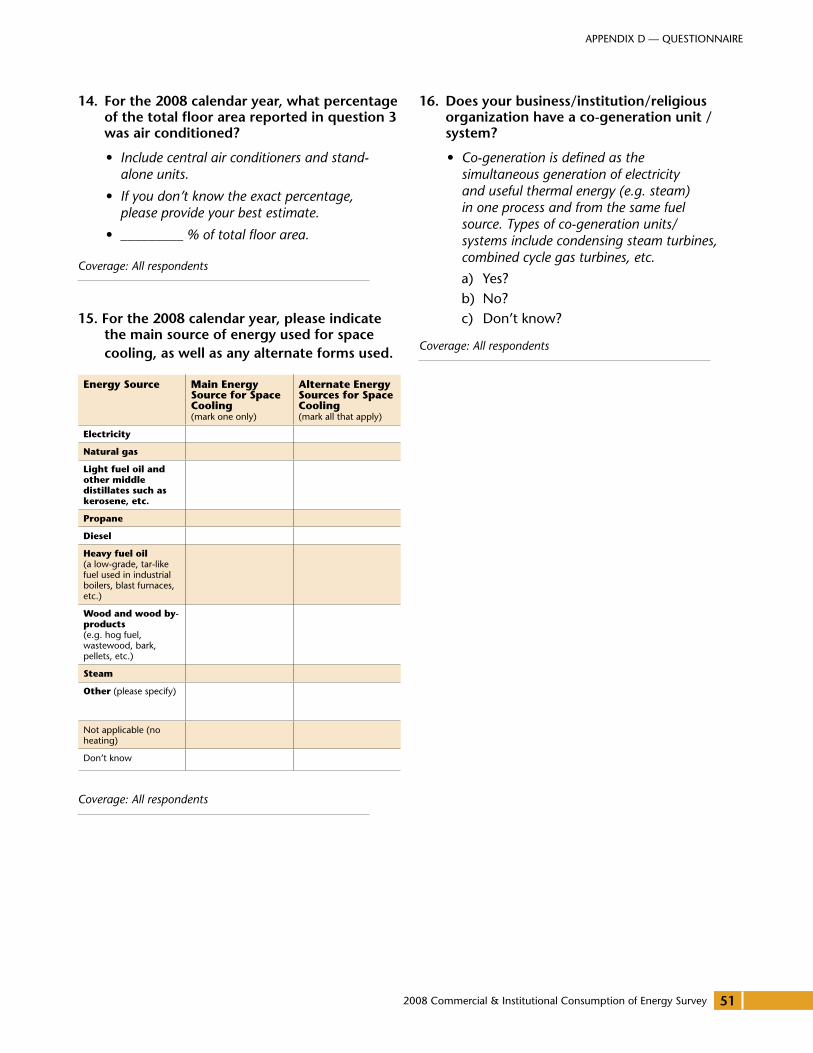
2008 Commercial & Institutional Consumption of Energy Survey
APPENDIX D — QUESTIONNAIRE
51
14. For the 2008 calendar year, what percentage of the total floor area reported in question 3 was air conditioned?
• Include central air conditioners and stand-alone units.
• If you don’t know the exact percentage, please provide your best estimate.
• _________ % of total floor area.
Coverage: All respondents
15. For the 2008 calendar year, please indicate the main source of energy used for space cooling, as well as any alternate forms used.
Coverage: All respondents
16. does your business/institution/religious organization have a co-generation unit / system?
• Co-generation is defined as the simultaneous generation of electricity and useful thermal energy (e.g. steam) in one process and from the same fuel source. Types of co-generation units/systems include condensing steam turbines, combined cycle gas turbines, etc.
a) Yes?b) No?c) Don’t know?
Coverage: All respondents
energy source main energy source for space Cooling(mark one only)
alternate energy sources for space Cooling(mark all that apply)
electricity
Natural gas
Light fuel oil and other middle distillates such as kerosene, etc.
Propane
diesel
heavy fuel oil(a low-grade, tar-like fuel used in industrial boilers, blast furnaces, etc.)
Wood and wood by-products(e.g. hog fuel, wastewood, bark, pellets, etc.)
steam
other (please specify)
Not applicable (no heating)
Don’t know
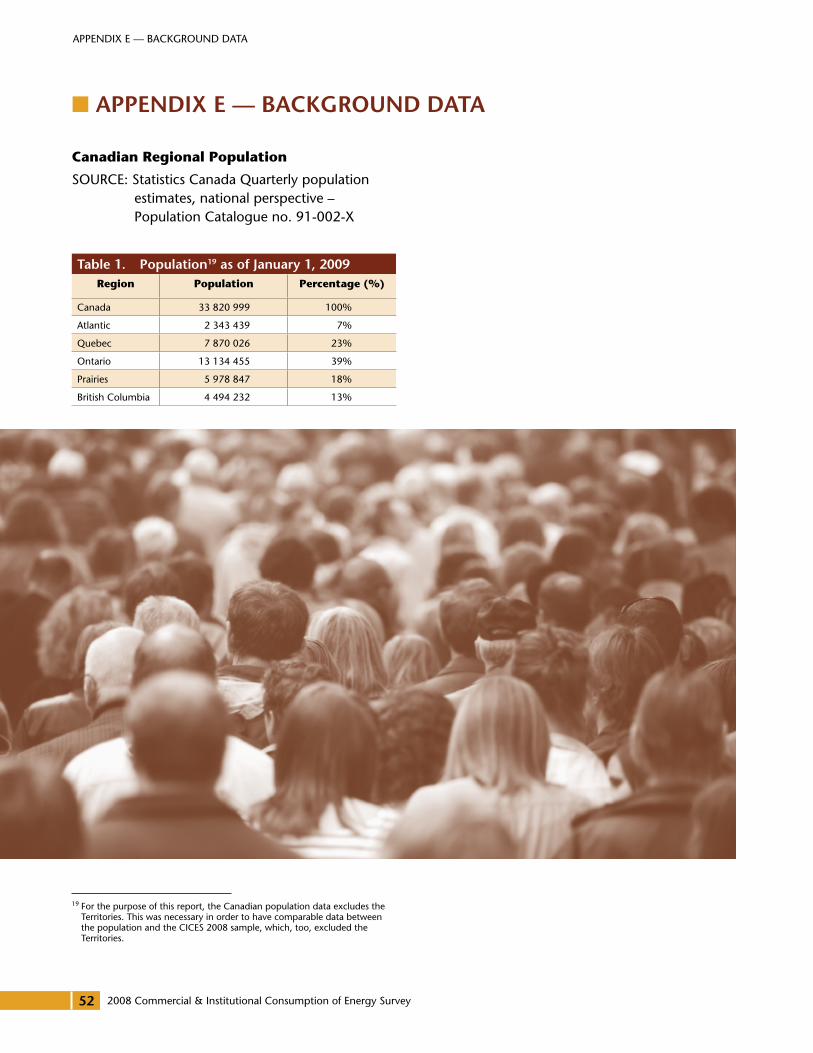
2008 Commercial & Institutional Consumption of Energy Survey
APPENDIX E — BACKGROUND DATA
52
Canadian regional Population
SOURCE: Statistics Canada Quarterly population estimates, national perspective – Population Catalogue no. 91-002-X19
19 For the purpose of this report, the Canadian population data excludes the Territories. This was necessary in order to have comparable data between the population and the CICES 2008 sample, which, too, excluded the Territories.
■■ APPENdIX E — BACKGroUNd dATA
Table 1. Population19 as of January 1, 2009region Population Percentage (%)
Canada 33 820 999 100%
Atlantic 2 343 439 7%
Quebec 7 870 026 23%
Ontario 13 134 455 39%
Prairies 5 978 847 18%
British Columbia 4 494 232 13%
2008 Commercial & Institutional Consumption of Energy Survey
APPENDIX F — SUMMARY OF 2007 COMMERCIAL & INSTITUTIONAL CONSUMPTION OF ENERGY SURVEY
53
Cautionary Note
As mentioned in this report's foreword, CICES has evolved from a survey in 2003 of only universities, colleges and hospitals to a survey in 2008 covering nearly all segments of the C&I sector. Consequently, each iteration of CICES has seen some methodological changes, which were all adopted in an effort to improve the CICES data estimates of the Canadian C&I sector. Some of the methodological changes include increased C&I sector coverage, refinement of establishment sampling methodology and questionnaire modifications to minimize non-response.
Additionally, CICES is not designed to be a longitudinal study where the same respondents, i.e. establishments, are surveyed for each survey
iteration. While such a design would enable a perfect trend analysis of the same establishments over time, it would not enable a trend analysis of the entire C&I sector as it would fail to capture changes in the composition of all C&I establishments over time. For this reason, each CICES has been designed as a cross sectional survey that examines the C&I sector in a defined time period.
As a result of the methodological changes and the cross sectional survey design, trend comparisons between data estimates for each iteration of CICES are not advisable.
■■ APPENdIX F — SUmmArY oF 2007 CommErCIAL & INSTITUTIoNAL CoNSUmPTIoN oF ENErGY SUrVEY
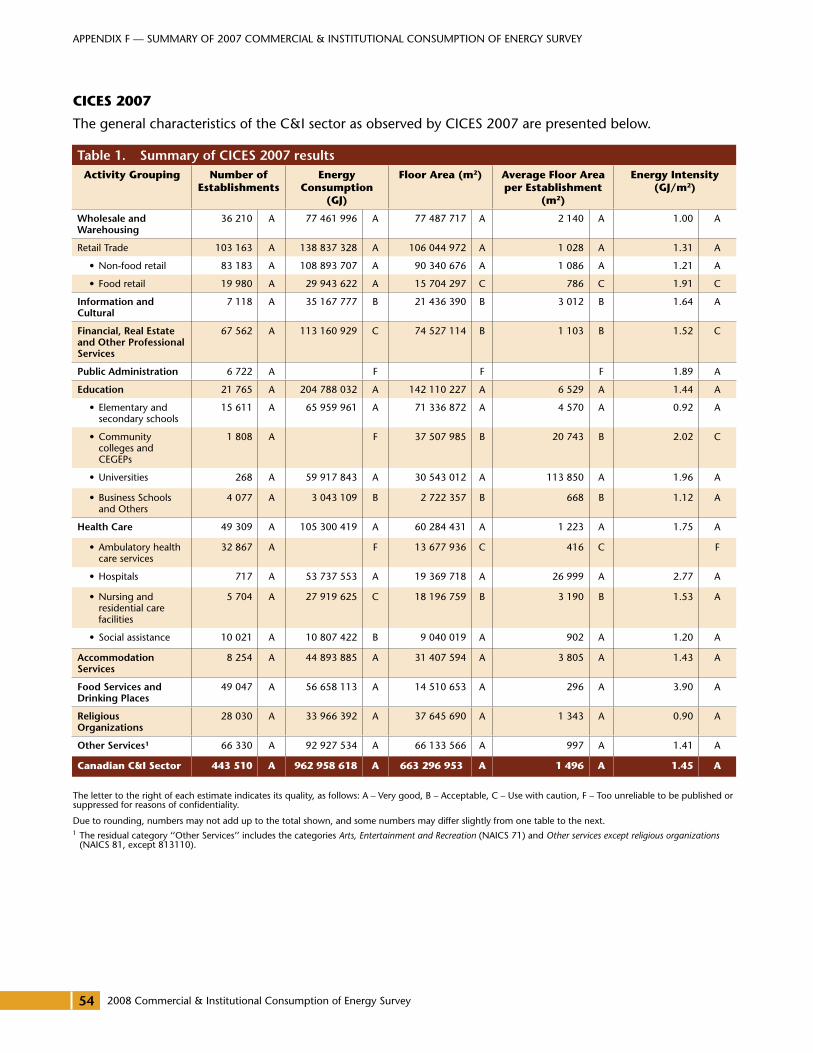
2008 Commercial & Institutional Consumption of Energy Survey
APPENDIX F — SUMMARY OF 2007 COMMERCIAL & INSTITUTIONAL CONSUMPTION OF ENERGY SURVEY
54
CiCes 2007
The general characteristics of the C&I sector as observed by CICES 2007 are presented below.
The letter to the right of each estimate indicates its quality, as follows: A – Very good, B – Acceptable, C – Use with caution, F – Too unreliable to be published or suppressed for reasons of confidentiality.
Due to rounding, numbers may not add up to the total shown, and some numbers may differ slightly from one table to the next.1 The residual category ‘‘Other Services’’ includes the categories Arts, Entertainment and Recreation (NAICS 71) and Other services except religious organizations
(NAICS 81, except 813110).
Table 1. Summary of CICES 2007 resultsactivity Grouping Number of
establishmentsenergy
Consumption(GJ)
Floor area (m2) average Floor area per establishment
(m2)
energy intensity(GJ/m2)
wholesale and warehousing
36 210 A 77 461 996 A 77 487 717 A 2 140 A 1.00 A
Retail Trade 103 163 A 138 837 328 A 106 044 972 A 1 028 A 1.31 A
• Non-food retail 83 183 A 108 893 707 A 90 340 676 A 1 086 A 1.21 A
• Food retail 19 980 A 29 943 622 A 15 704 297 C 786 C 1.91 C
Information and Cultural
7 118 A 35 167 777 B 21 436 390 B 3 012 B 1.64 A
Financial, real Estate and other Professional Services
67 562 A 113 160 929 C 74 527 114 B 1 103 B 1.52 C
Public Administration 6 722 A F F F 1.89 A
Education 21 765 A 204 788 032 A 142 110 227 A 6 529 A 1.44 A
• Elementary and secondary schools
15 611 A 65 959 961 A 71 336 872 A 4 570 A 0.92 A
• Community colleges and CEGEPs
1 808 A F 37 507 985 B 20 743 B 2.02 C
• Universities 268 A 59 917 843 A 30 543 012 A 113 850 A 1.96 A
• Business Schools and Others
4 077 A 3 043 109 B 2 722 357 B 668 B 1.12 A
Health Care 49 309 A 105 300 419 A 60 284 431 A 1 223 A 1.75 A
• Ambulatory health care services
32 867 A F 13 677 936 C 416 C F
• Hospitals 717 A 53 737 553 A 19 369 718 A 26 999 A 2.77 A
• Nursing and residential care facilities
5 704 A 27 919 625 C 18 196 759 B 3 190 B 1.53 A
• Social assistance 10 021 A 10 807 422 B 9 040 019 A 902 A 1.20 A
Accommodation Services
8 254 A 44 893 885 A 31 407 594 A 3 805 A 1.43 A
Food Services and drinking Places
49 047 A 56 658 113 A 14 510 653 A 296 A 3.90 A
religious organizations
28 030 A 33 966 392 A 37 645 690 A 1 343 A 0.90 A
other Services1 66 330 A 92 927 534 A 66 133 566 A 997 A 1.41 A
Canadian C&i sector 443 510 a 962 958 618 a 663 296 953 a 1 496 a 1.45 a