croatian macro sd model (ppt; © sinisa sovilj)
TRANSCRIPT
National System Dynamics Model of Croatian Economy
Siniša Sovilj, Ph.D.
Marina Tkalec, Ph.D.
Zvonko Kostanjčar, Ph.D.
Dominik Pripužić, M.Econ.
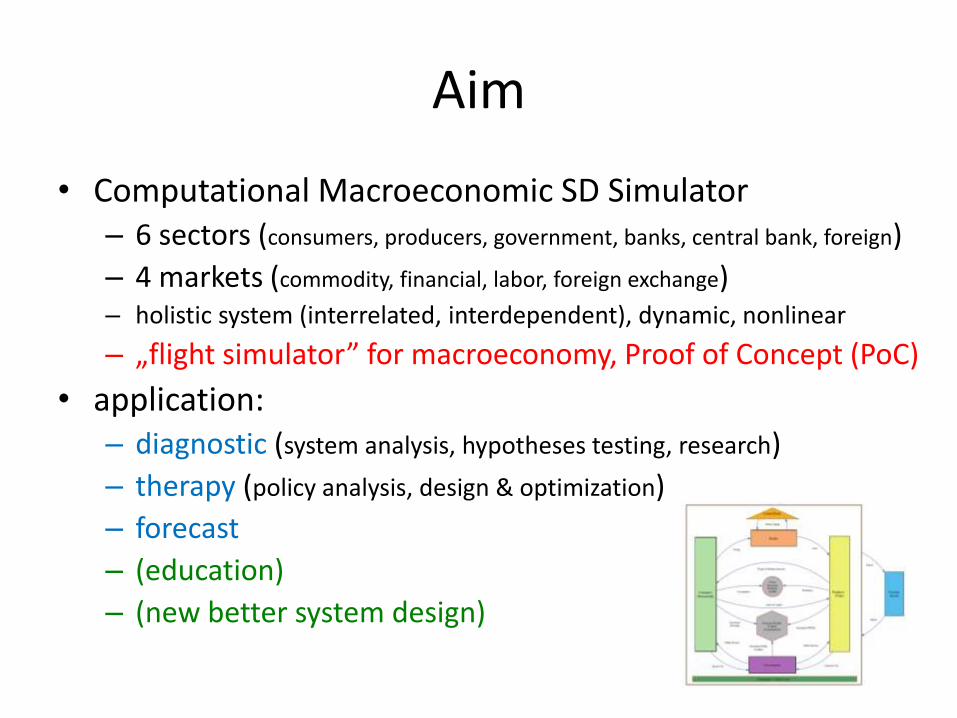
Aim
• Computational Macroeconomic SD Simulator – 6 sectors (consumers, producers, government, banks, central bank, foreign)
– 4 markets (commodity, financial, labor, foreign exchange) – holistic system (interrelated, interdependent), dynamic, nonlinear
– „flight simulator” for macroeconomy, Proof of Concept (PoC)
• application: – diagnostic (system analysis, hypotheses testing, research)
– therapy (policy analysis, design & optimization)
– forecast
– (education)
– (new better system design)
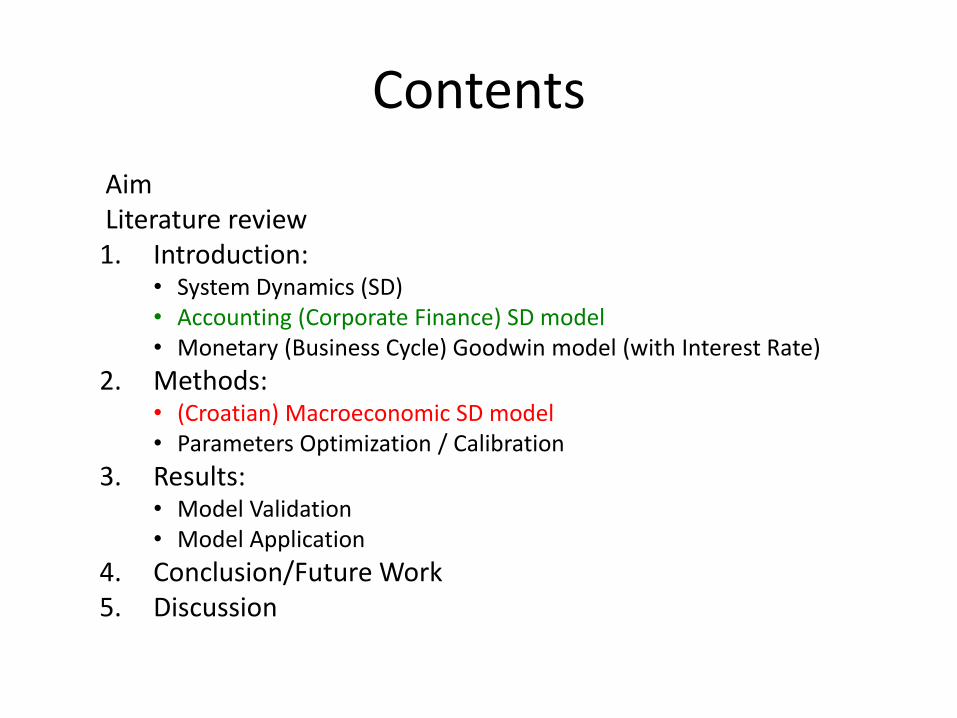
Contents
Aim Literature review 1. Introduction:
• System Dynamics (SD) • Accounting (Corporate Finance) SD model • Monetary (Business Cycle) Goodwin model (with Interest Rate)
2. Methods: • (Croatian) Macroeconomic SD model • Parameters Optimization / Calibration
3. Results: • Model Validation • Model Application
4. Conclusion/Future Work 5. Discussion
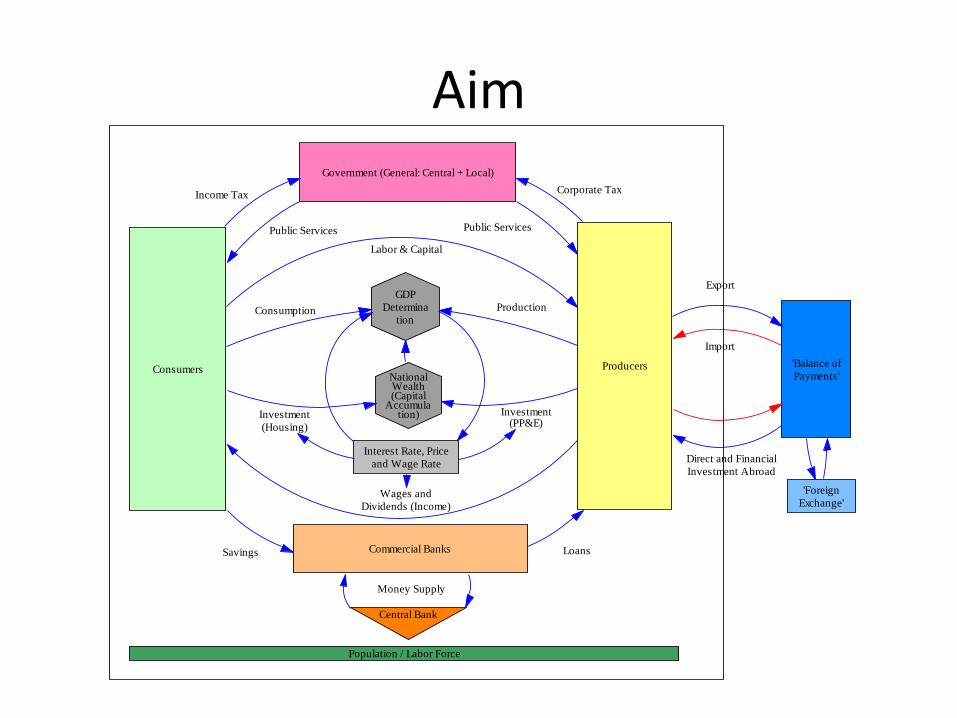
Aim
Income TaxCorporate Tax
Consumers
Government (General: Central + Local)
Producers
Consumption Production
Wages and
Dividends (Income)
Labor & Capital
Savings LoansCommercial Banks
Central Bank
Money Supply
NationalWealth(Capital
Accumulation) Investment
(PP&E)Investment
(Housing)
GDP
Determina
tion
Interest Rate, Price
and Wage Rate
'Balance of
Payments'
'Foreign
Exchange'
Population / Labor Force
Public Services Public Services
Export
Import
Direct and Financial
Investment Abroad
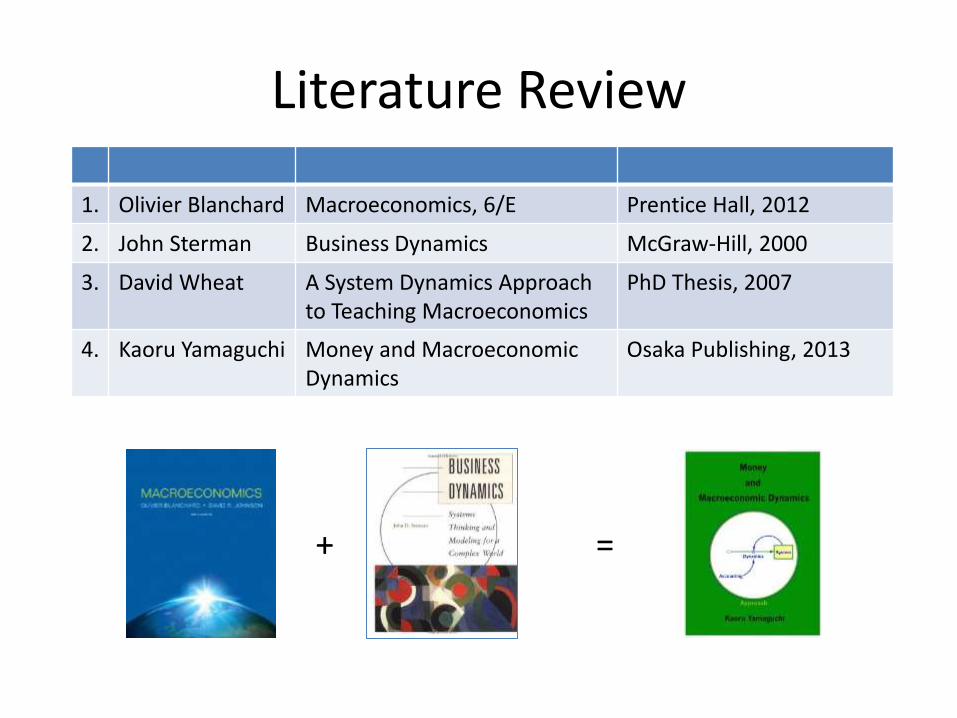
Literature Review
1. Olivier Blanchard Macroeconomics, 6/E Prentice Hall, 2012
2. John Sterman Business Dynamics McGraw-Hill, 2000
3. David Wheat A System Dynamics Approach to Teaching Macroeconomics
PhD Thesis, 2007
4. Kaoru Yamaguchi Money and Macroeconomic Dynamics
Osaka Publishing, 2013
+ =
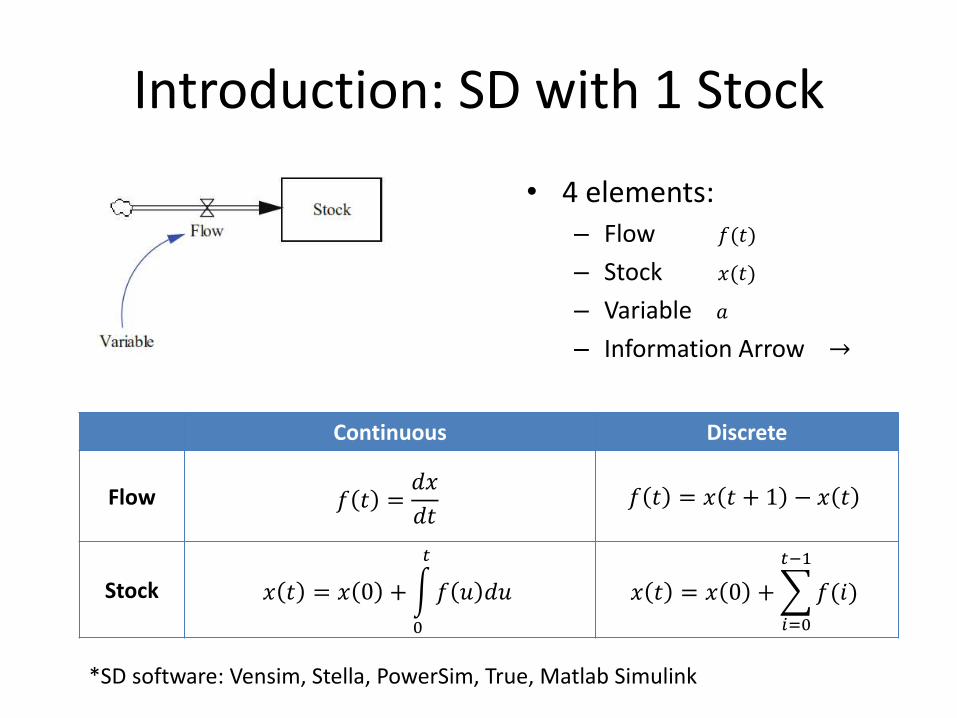
Introduction: SD with 1 Stock
• 4 elements: – Flow 𝑓(𝑡)
– Stock 𝑥(𝑡)
– Variable 𝑎
– Information Arrow →
Continuous Discrete
Flow 𝑓 𝑡 =𝑑𝑥
𝑑𝑡 𝑓 𝑡 = 𝑥 𝑡 + 1 − 𝑥 𝑡
Stock 𝑥 𝑡 = 𝑥 0 + 𝑓 𝑢 𝑑𝑢
𝑡
0
𝑥 𝑡 = 𝑥 0 + 𝑓(𝑖)
𝑡−1
𝑖=0
*SD software: Vensim, Stella, PowerSim, True, Matlab Simulink
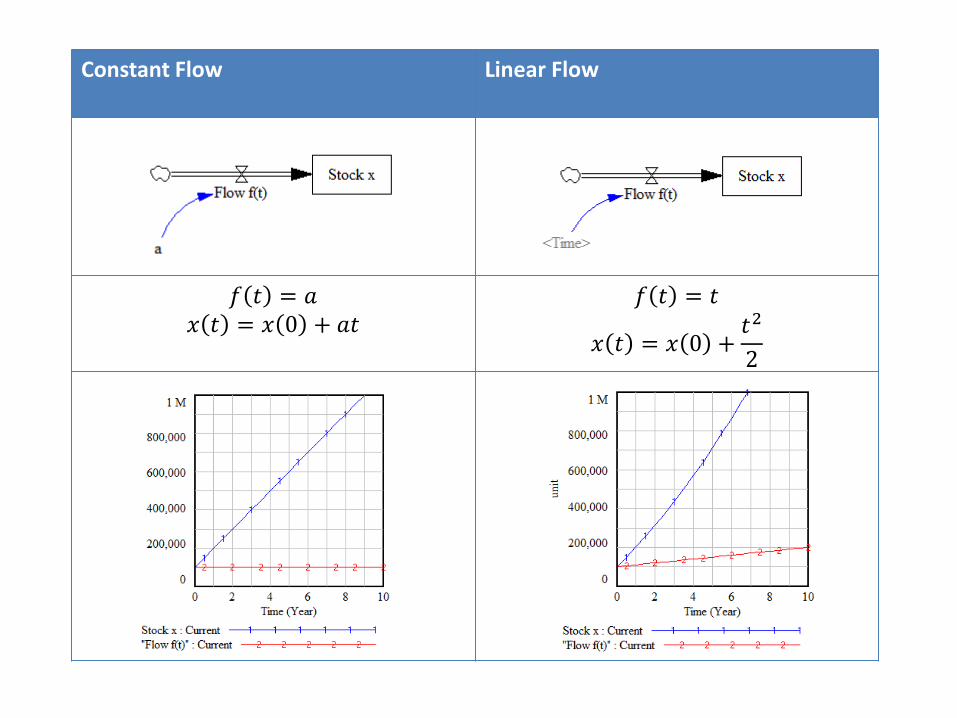
Constant Flow Linear Flow
𝑓 𝑡 = 𝑎 𝑥 𝑡 = 𝑥 0 + 𝑎𝑡
𝑓 𝑡 = 𝑡
𝑥 𝑡 = 𝑥 0 +𝑡2
2
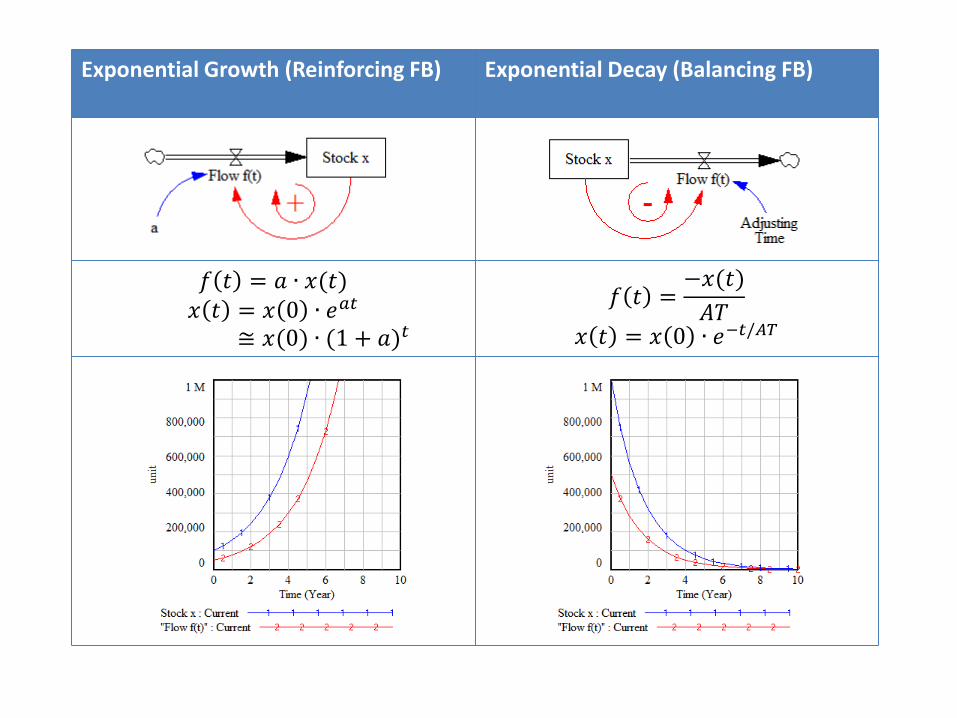
Exponential Growth (Reinforcing FB)
Exponential Decay (Balancing FB)
𝑓 𝑡 = 𝑎 ∙ 𝑥(𝑡) 𝑥 𝑡 = 𝑥 0 ∙ 𝑒𝑎𝑡
≅ 𝑥(0) ∙ (1 + 𝑎)𝑡
𝑓 𝑡 =−𝑥(𝑡)
𝐴𝑇
𝑥 𝑡 = 𝑥 0 ∙ 𝑒−𝑡/𝐴𝑇

Goal-Seeking (Balancing FB) S-Shaped Growth (Logistic Growth)
𝑓 𝑡 =𝑥∗ − 𝑥(𝑡)
𝐴𝑇
𝑥 𝑡 = 𝑥∗ − (𝑥∗ − 𝑥 0 ) ∙ 𝑒−𝑡/𝐴𝑇
𝑓 𝑡 = 𝑎 ∙ 𝑥(𝑡) ∙𝑥∗ − 𝑥(𝑡)
𝑥∗
𝑥 𝑡 =𝑥∗
1 + (𝑥∗ − 𝑥(0)𝑥(0)
) ∙ 𝑒−𝑎𝑡
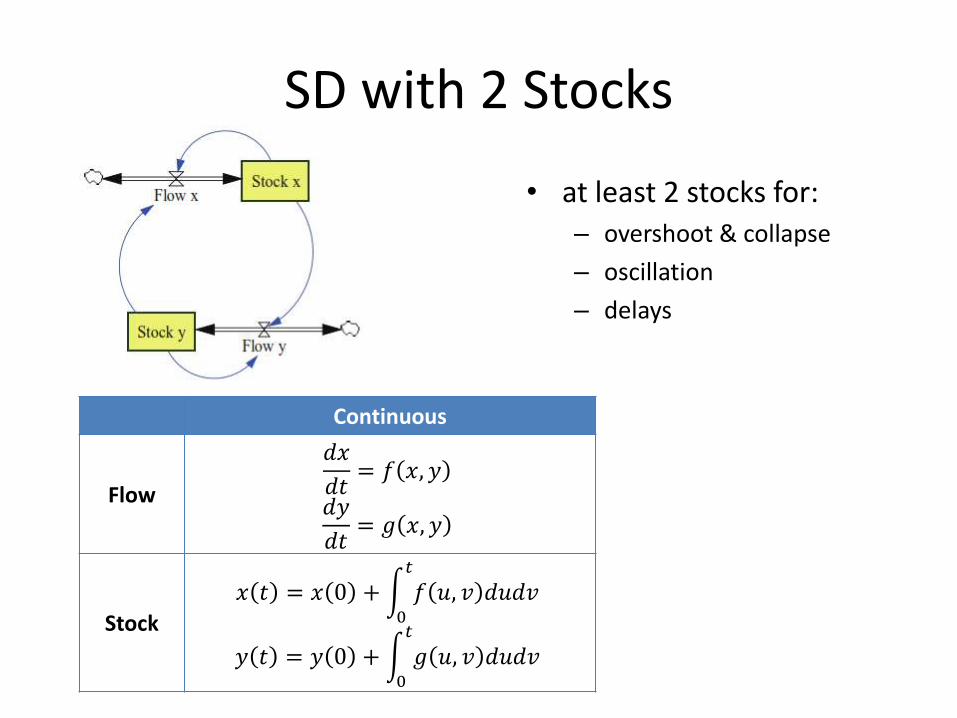
SD with 2 Stocks
• at least 2 stocks for: – overshoot & collapse
– oscillation
– delays
Continuous
Flow
𝑑𝑥
𝑑𝑡= 𝑓 𝑥, 𝑦
𝑑𝑦
𝑑𝑡= 𝑔 𝑥, 𝑦
Stock
𝑥 𝑡 = 𝑥 0 + 𝑓 𝑢, 𝑣 𝑑𝑢𝑑𝑣𝑡
0
𝑦 𝑡 = 𝑦 0 + 𝑔 𝑢, 𝑣 𝑑𝑢𝑑𝑣𝑡
0
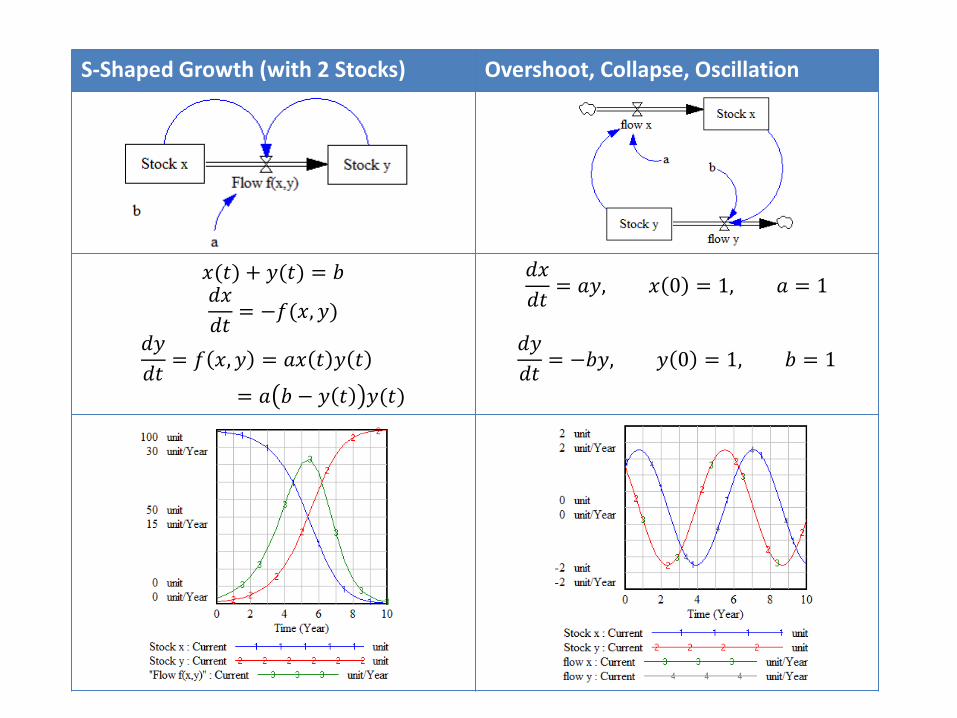
S-Shaped Growth (with 2 Stocks) Overshoot, Collapse, Oscillation
𝑥(𝑡) + 𝑦(𝑡) = 𝑏 𝑑𝑥
𝑑𝑡= −𝑓(𝑥, 𝑦)
𝑑𝑦
𝑑𝑡= 𝑓 𝑥, 𝑦 = 𝑎𝑥 𝑡 𝑦 𝑡
= 𝑎 𝑏 − 𝑦 𝑡 𝑦(𝑡)
𝑑𝑥
𝑑𝑡= 𝑎𝑦, 𝑥 0 = 1, 𝑎 = 1
𝑑𝑦
𝑑𝑡= −𝑏𝑦, 𝑦 0 = 1, 𝑏 = 1
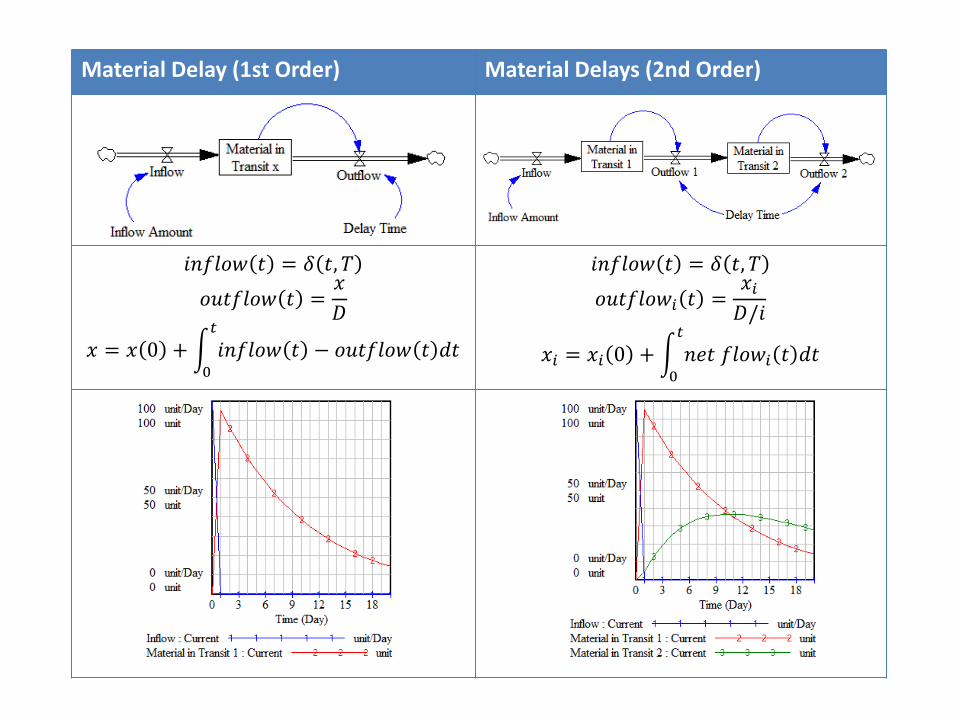
Material Delay (1st Order) Material Delays (2nd Order)
𝑖𝑛𝑓𝑙𝑜𝑤 𝑡 = 𝛿 𝑡, 𝑇
𝑜𝑢𝑡𝑓𝑙𝑜𝑤 𝑡 =𝑥
𝐷
𝑥 = 𝑥 0 + 𝑖𝑛𝑓𝑙𝑜𝑤 𝑡 − 𝑜𝑢𝑡𝑓𝑙𝑜𝑤 𝑡 𝑑𝑡𝑡
0
𝑖𝑛𝑓𝑙𝑜𝑤 𝑡 = 𝛿 𝑡, 𝑇
𝑜𝑢𝑡𝑓𝑙𝑜𝑤𝑖 𝑡 =𝑥𝑖𝐷/𝑖
𝑥𝑖 = 𝑥𝑖 0 + 𝑛𝑒𝑡 𝑓𝑙𝑜𝑤𝑖 𝑡 𝑑𝑡𝑡
0
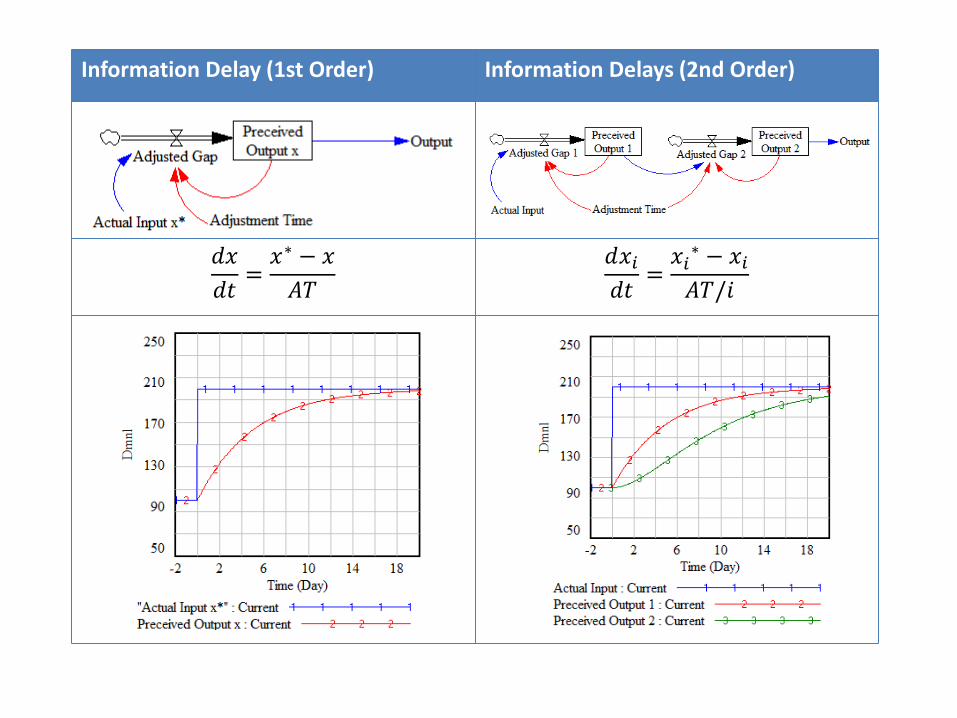
Information Delay (1st Order) Information Delays (2nd Order)
𝑑𝑥
𝑑𝑡=𝑥∗ − 𝑥
𝐴𝑇
𝑑𝑥𝑖𝑑𝑡=𝑥𝑖∗ − 𝑥𝑖𝐴𝑇/𝑖
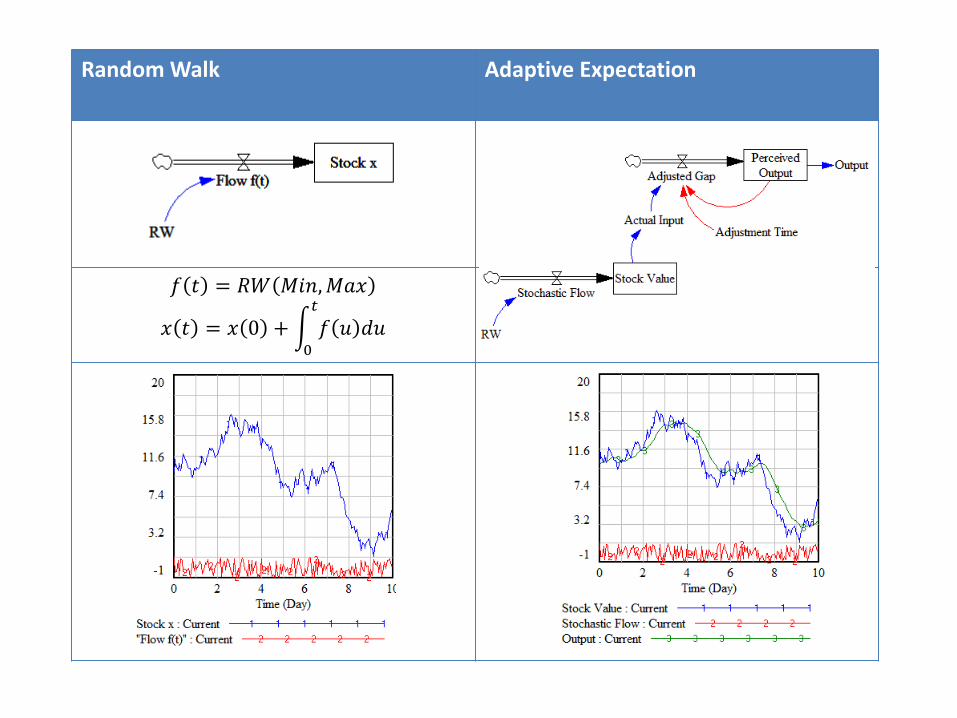
Random Walk Adaptive Expectation
𝑓 𝑡 = 𝑅𝑊 𝑀𝑖𝑛,𝑀𝑎𝑥
𝑥 𝑡 = 𝑥 0 + 𝑓 𝑢 𝑑𝑢𝑡
0
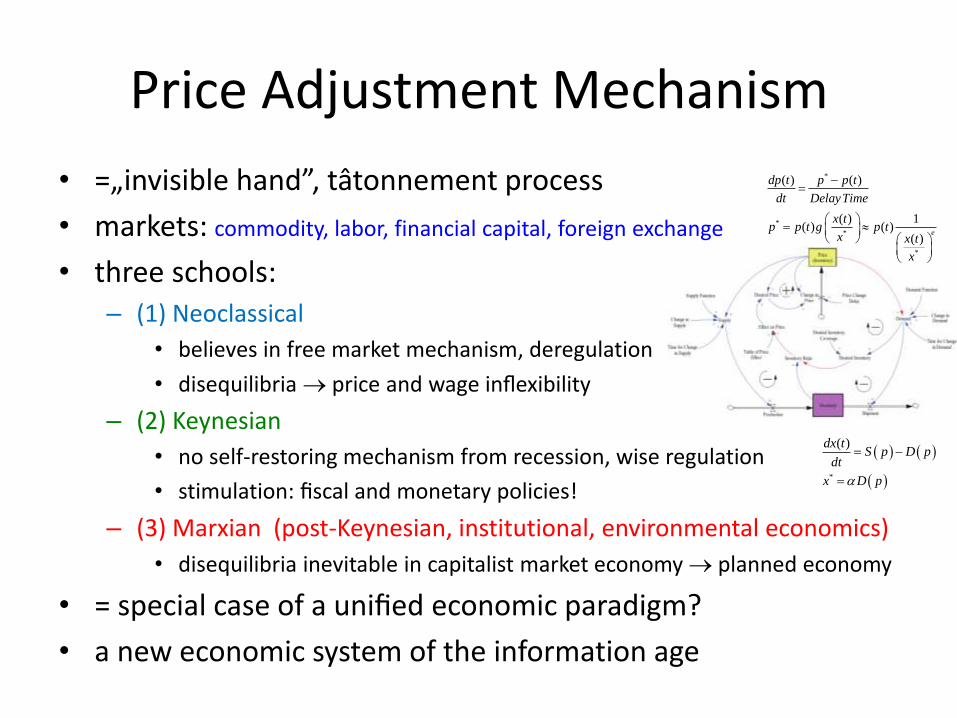
Price Adjustment Mechanism
• =„invisible hand”, tâtonnement process
• markets: commodity, labor, financial capital, foreign exchange
• three schools: – (1) Neoclassical
• believes in free market mechanism, deregulation
• disequilibria price and wage inflexibility
– (2) Keynesian
• no self-restoring mechanism from recession, wise regulation
• stimulation: fiscal and monetary policies!
– (3) Marxian (post-Keynesian, institutional, environmental economics)
• disequilibria inevitable in capitalist market economy planned economy
• = special case of a unified economic paradigm?
• a new economic system of the information age
*
*
*
*
( ) ( )
( ) 1( ) ( )
( )e
dp t p p t
dt DelayTime
x tp p t g p t
x x t
x
*
( )dx tS p D p
dt
x D p
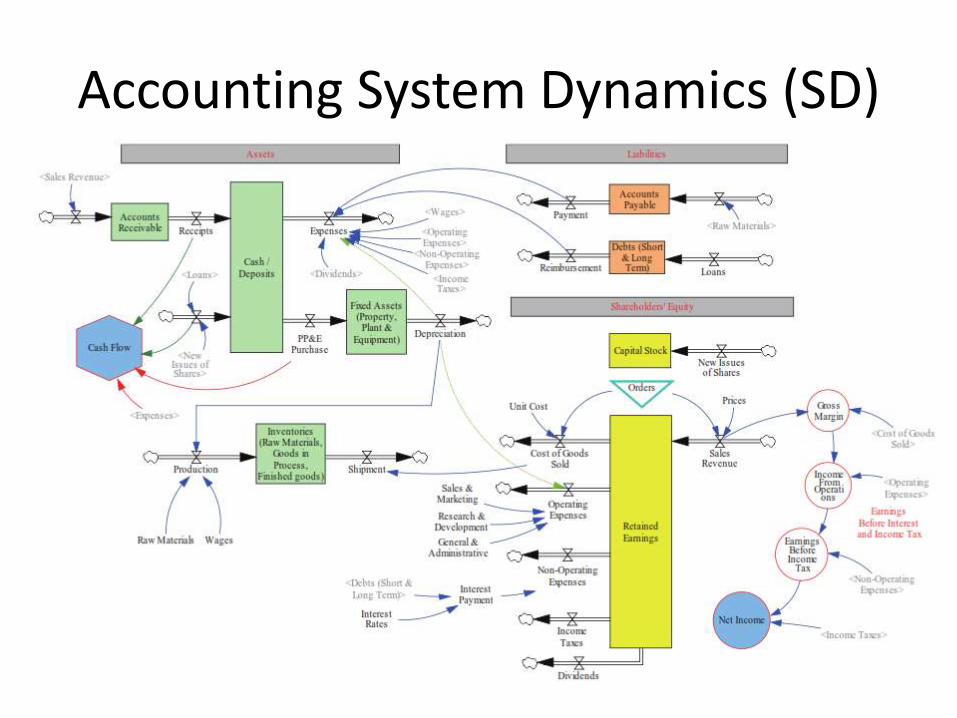
Accounting System Dynamics (SD)
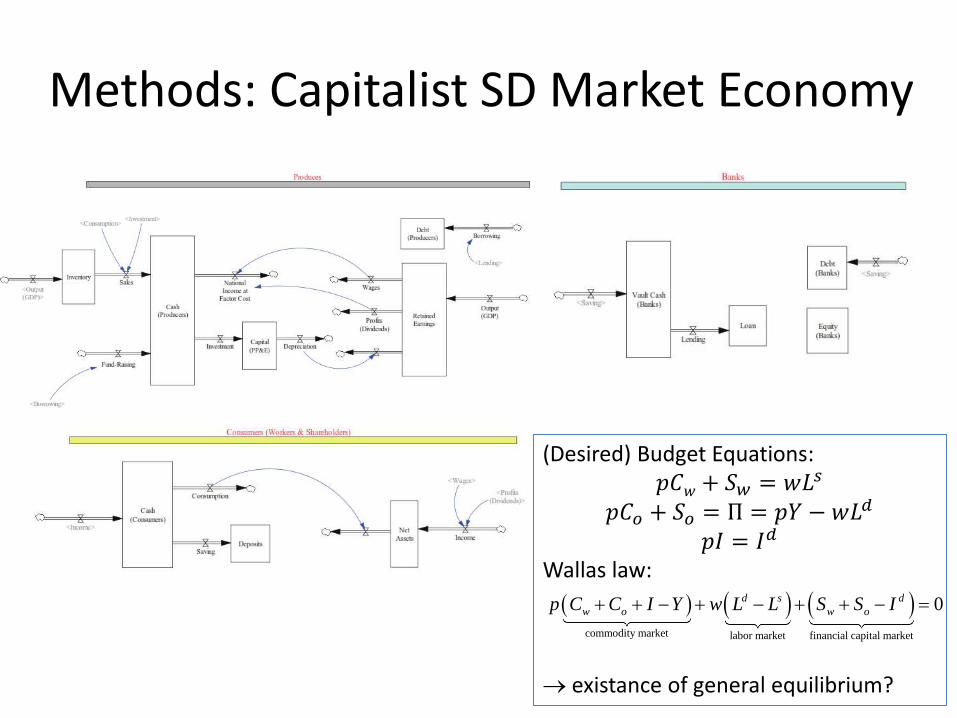
Methods: Capitalist SD Market Economy
(Desired) Budget Equations: 𝑝𝐶𝑤 + 𝑆𝑤 = 𝑤𝐿
𝑠 𝑝𝐶𝑜 + 𝑆𝑜 = Π = 𝑝𝑌 − 𝑤𝐿
𝑑 𝑝𝐼 = 𝐼𝑑
Wallas law: existance of general equilibrium?
commodity market labor market financial capital market
0d s d
w o w op C C I Y w L L S S I
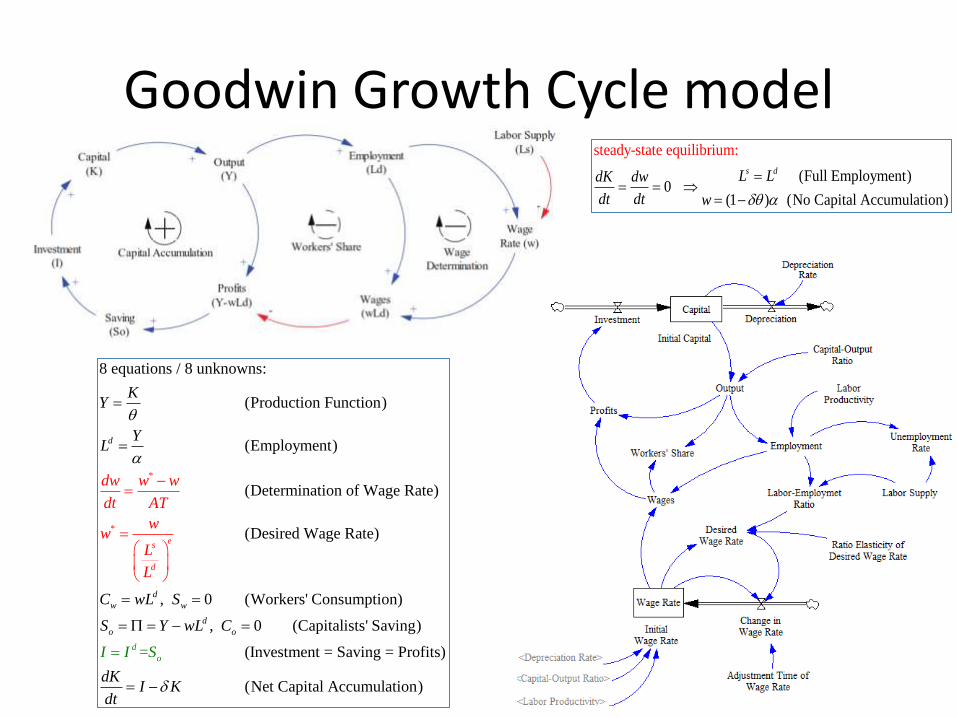
Goodwin Growth Cycle model
*
*
8 equations / 8 unknowns:
(Production Function)
(Employment)
(Determination of Wage Rate)
(Desired Wage Rate)
, 0 (Workers' Consumption)
, 0 (Capitalists
d
d
w w
d
o
e
o
s
d
d
KY
w w w
dt AT
ww
YL
C wL S
w
L
L
S Y L C
' Saving)
(Investment = Saving = Profits)
(Net Capital Accumula ion)
=
t
d
o
dKI K
dt
I I S
(Full Empl
steady-sta
oymen
te equilibriu
t)0
(1 ) (No Capital Accumulat
m
ion)
:
s dL LdK dw
dt dt w
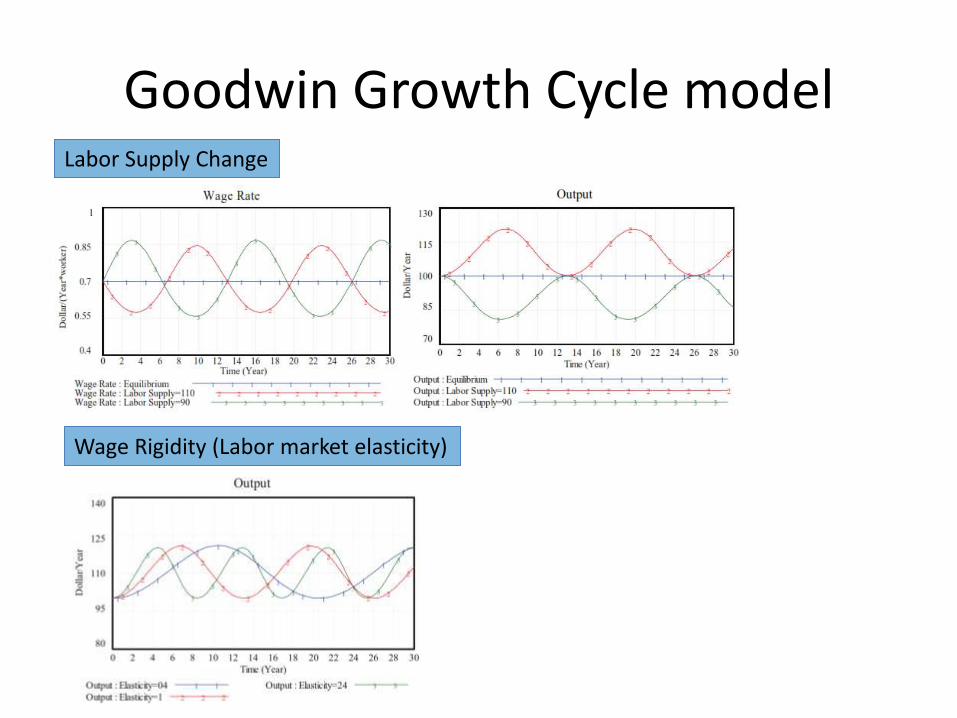
Goodwin Growth Cycle model Labor Supply Change
Wage Rigidity (Labor market elasticity)
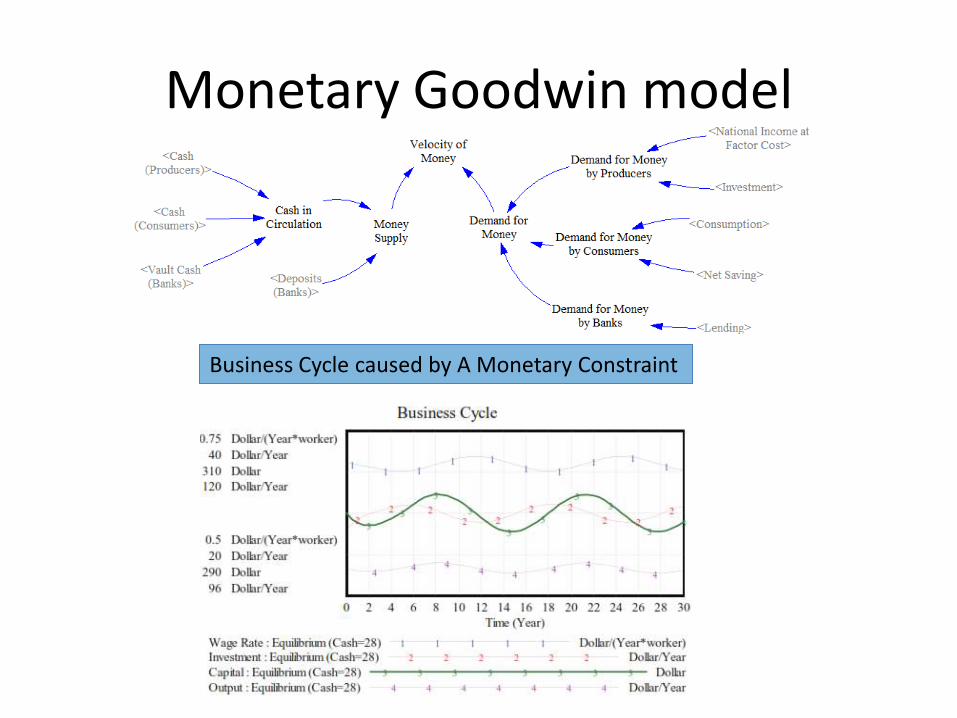
Monetary Goodwin model
Business Cycle caused by A Monetary Constraint
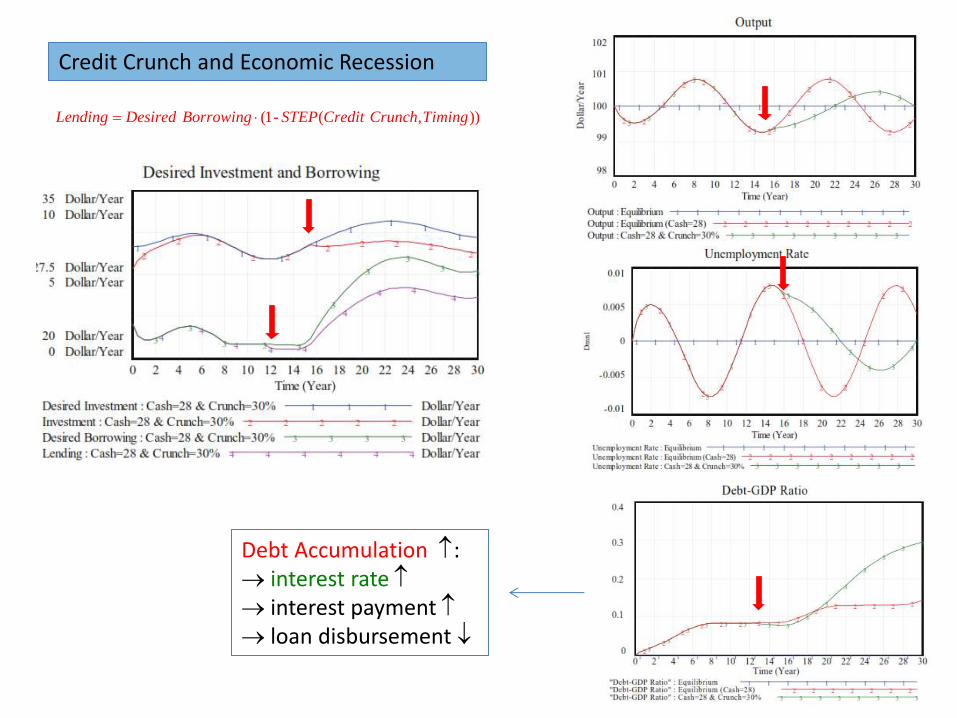
Credit Crunch and Economic Recession
Debt Accumulation : interest rate interest payment loan disbursement
(1- ( , ))Lending Desired Borrowing STEP Credit Crunch Timing
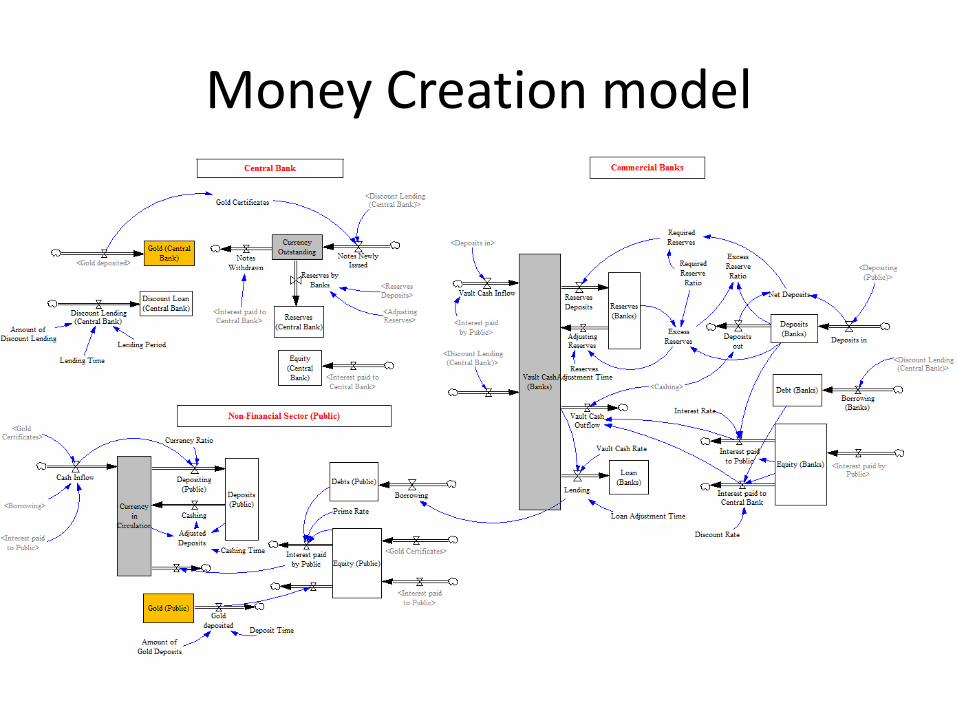
Money Creation model
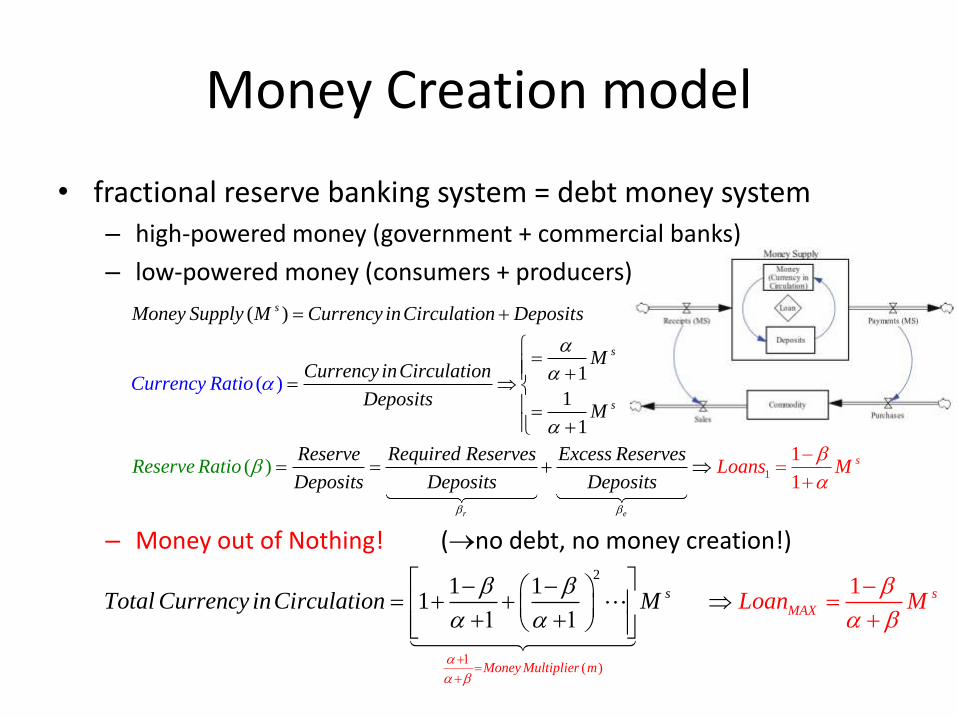
• fractional reserve banking system = debt money system – high-powered money (government + commercial banks)
– low-powered money (consumers + producers)
– Money out of Nothing! (no debt, no money creation!)
( )
1
1
1
(
( )
)
r
s
s
s
Money Supply M Currency inCirculation Deposits
MCurrency inCirculation
DepositsM
Reserve
Currency Rat
Required Reserves Excess Reserves
DeposiRes
ts Deposits Depoerve R
io
atio
1
1
1
e
sLoansi
Ms ts
)
2
(
111 1 s
MAX
Money Multipli r m
s
e
Total Currency inCi Lorculation M an M
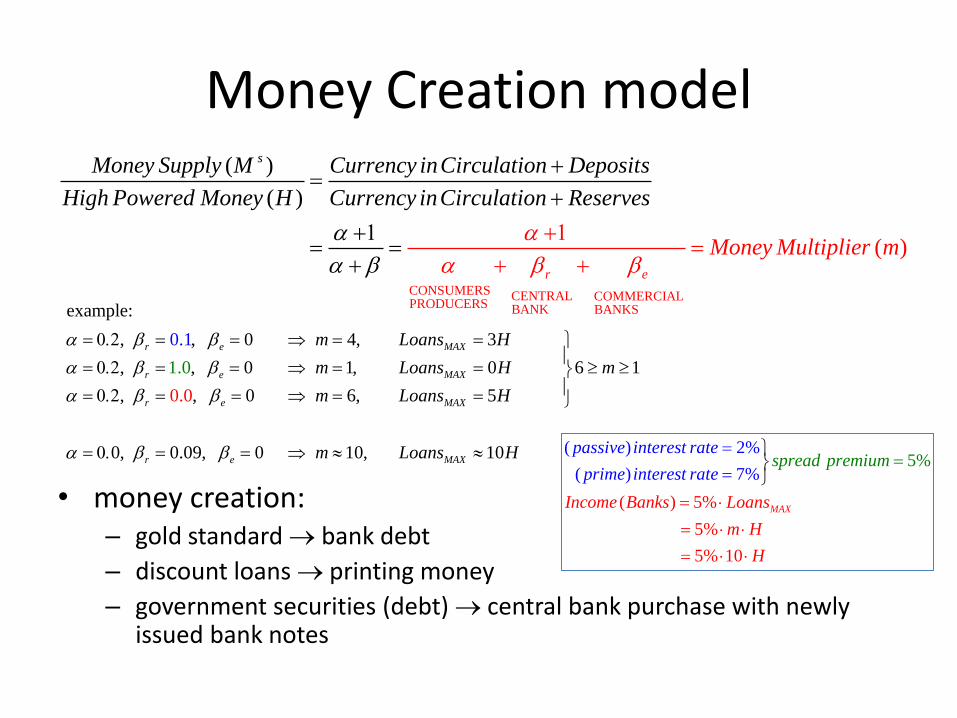
Money Creation model
CONSUMERS CENTRAL COMMERCIALPRODUCERS BANK BANKS
(
( )
( )
)
s
r e
Money Supply M Currency inCirculation Deposits
High Powered Money H Currency inCirculation Res
Money Mul
erves
tiplier m
example:
, , 0 4, 3
, , 0 1, 0 6 1
, , 0 6, 5
0, 0.09
1.
0.
0
, 0 10, 10
.0
0
1r e MAX
r e MAX
r e MAX
r e MAX
m Loans H
m Loans H m
m Loans H
m Loans H
• money creation: – gold standard bank debt
– discount loans printing money
– government securities (debt) central bank purchase with newly issued bank notes
( ) 5%
5%
5% 10
(5%
) 2%
( ) 7%
MAX
spre
Inc
passive interest rate
prime interest rat
ome Banks Loan
ad premiu
s
m
H
em
H
Money Creation model
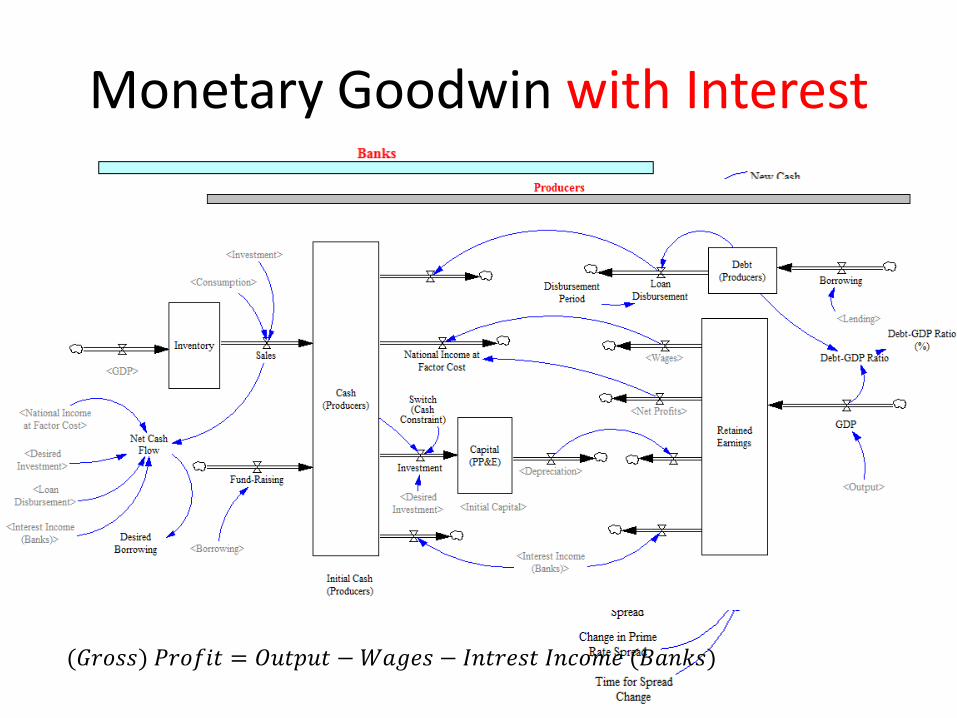
Monetary Goodwin with Interest
(𝐺𝑟𝑜𝑠𝑠) 𝑃𝑟𝑜𝑓𝑖𝑡 = 𝑂𝑢𝑡𝑝𝑢𝑡 −𝑊𝑎𝑔𝑒𝑠 − 𝐼𝑛𝑡𝑟𝑒𝑠𝑡 𝐼𝑛𝑐𝑜𝑚𝑒 (𝐵𝑎𝑛𝑘𝑠)
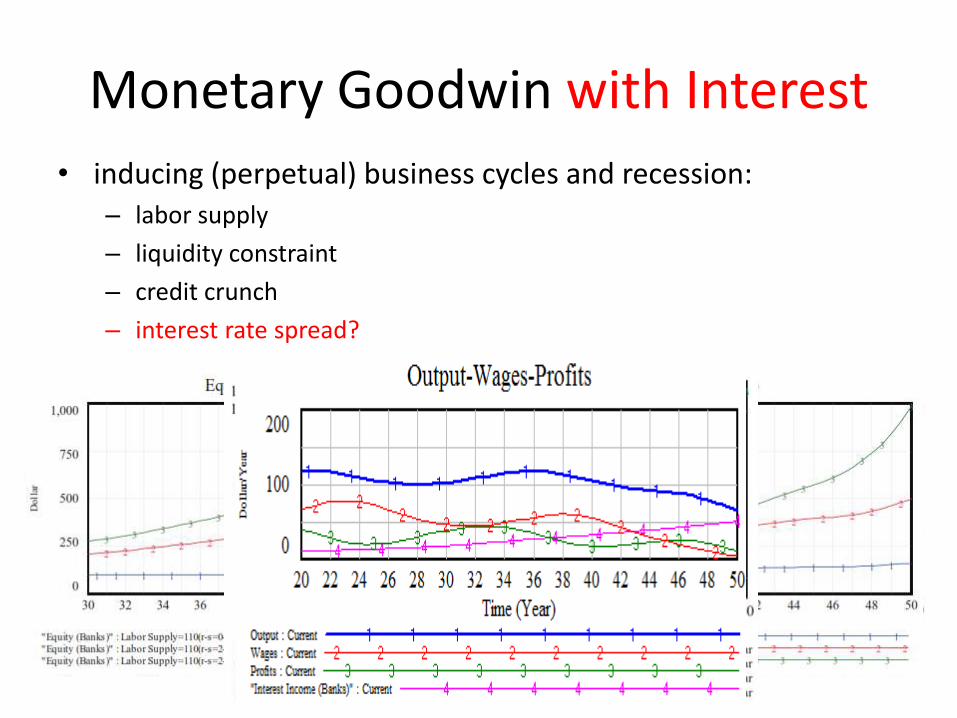
Monetary Goodwin with Interest
• inducing (perpetual) business cycles and recession: – labor supply
– liquidity constraint
– credit crunch
– interest rate spread?
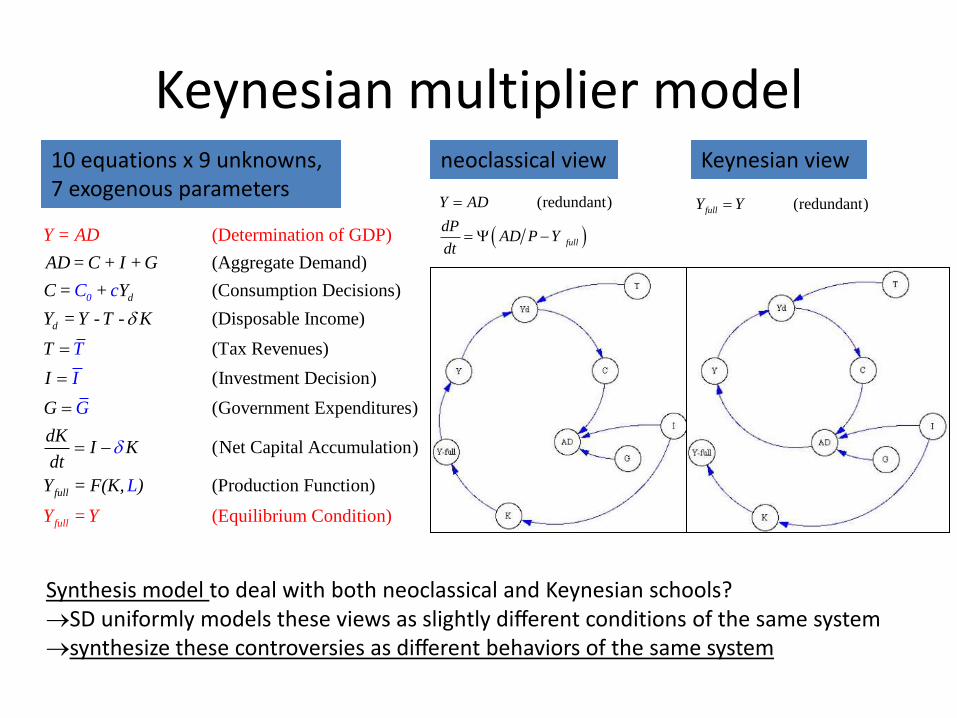
Keynesian multiplier model
(Aggregate Demand)
(Consumption Decisions)
(Disposable Income)
(Tax Revenues)
(Investment Decision)
(Government Exp
(Determination of
endit
GD
e
P)
ur
d
d
0
AD = C + I + G
C = + Y
Y = Y - T
C c
T
I
G
- K
T
I
G
Y = AD
s)
(Net Capital Accumulation)
(Production Functi
(Equilibrium Conditio
on)
n) ful
ful
l
l
Y = Y
dKI K
dt
Y = F(K, )L
10 equations x 9 unknowns, 7 exogenous parameters
neoclassical view
(redundant)
full
Y AD
dPAD P Y
dt
Keynesian view
(redundant)fullY Y
Synthesis model to deal with both neoclassical and Keynesian schools? SD uniformly models these views as slightly different conditions of the same system synthesize these controversies as different behaviors of the same system
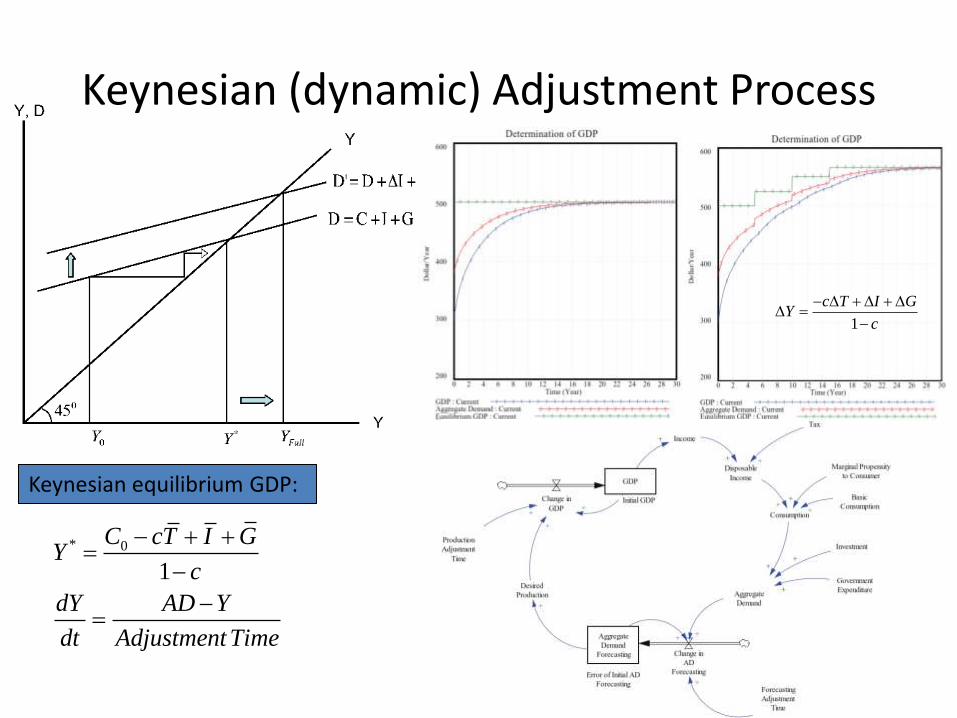
Keynesian (dynamic) Adjustment Process
Keynesian equilibrium GDP:
* 0
1
C cT I GY
c
dY AD Y
dt Adjustment Time
1
c T I GY
c
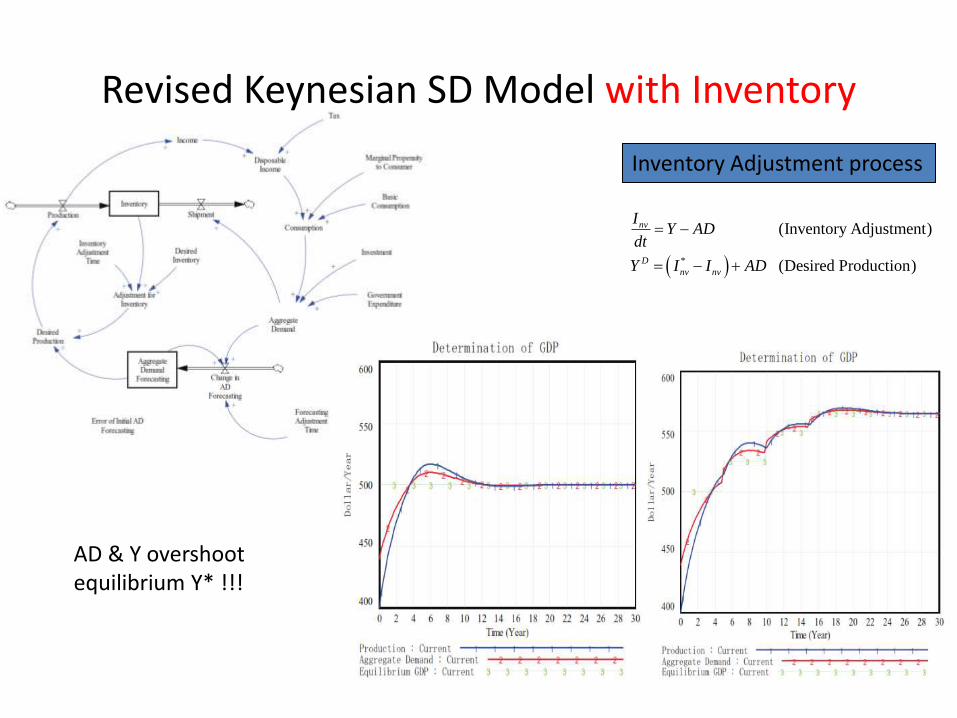
Revised Keynesian SD Model with Inventory
Inventory Adjustment process
*
(Inventory Adjustment)
(Desired Production)
nv
D
nv nv
IY AD
dt
Y I I AD
AD & Y overshoot equilibrium Y* !!!
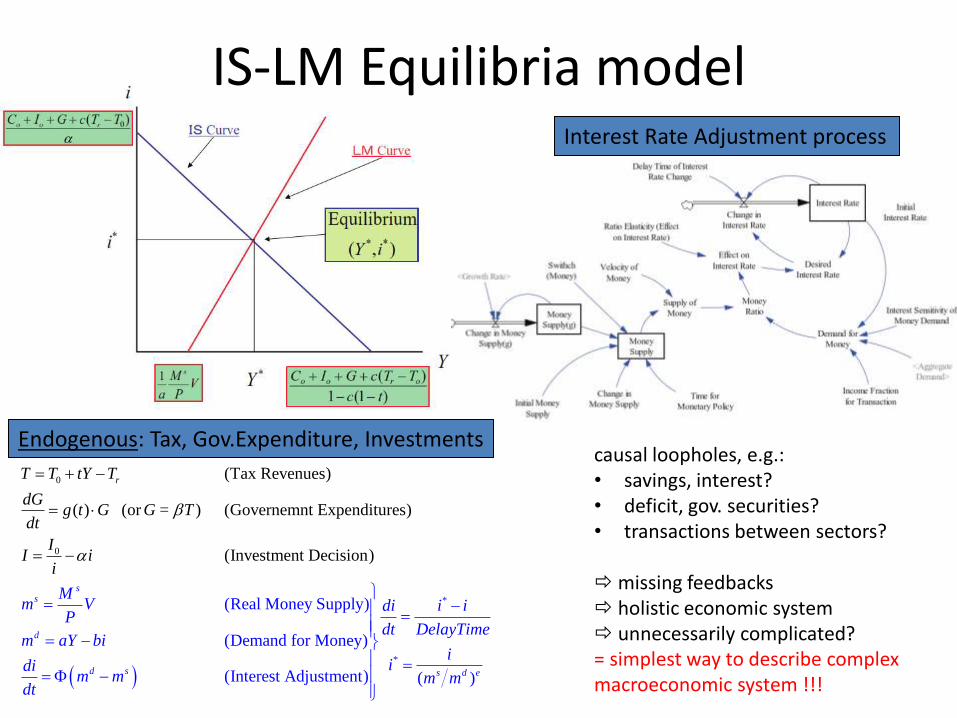
IS-LM Equilibria model
Endogenous: Tax, Gov.Expenditure, Investments
0
*
0
(Tax Revenues)
( ) (or ) (Governemnt Expenditures)
(Investment Decision
(Real Money Supply)
(Demand for Money)
(Interest Adjustme )
)
nt
ss
d
r
d s
Mm V di
T T tY T
dGg t G G = T
dt
I
i iP
dt Dm aY bi
dim m
dt
I ii
*
( )s d e
elayTime
ii
m m
Interest Rate Adjustment process
causal loopholes, e.g.: • savings, interest? • deficit, gov. securities? • transactions between sectors?
missing feedbacks holistic economic system unnecessarily complicated? = simplest way to describe complex macroeconomic system !!!
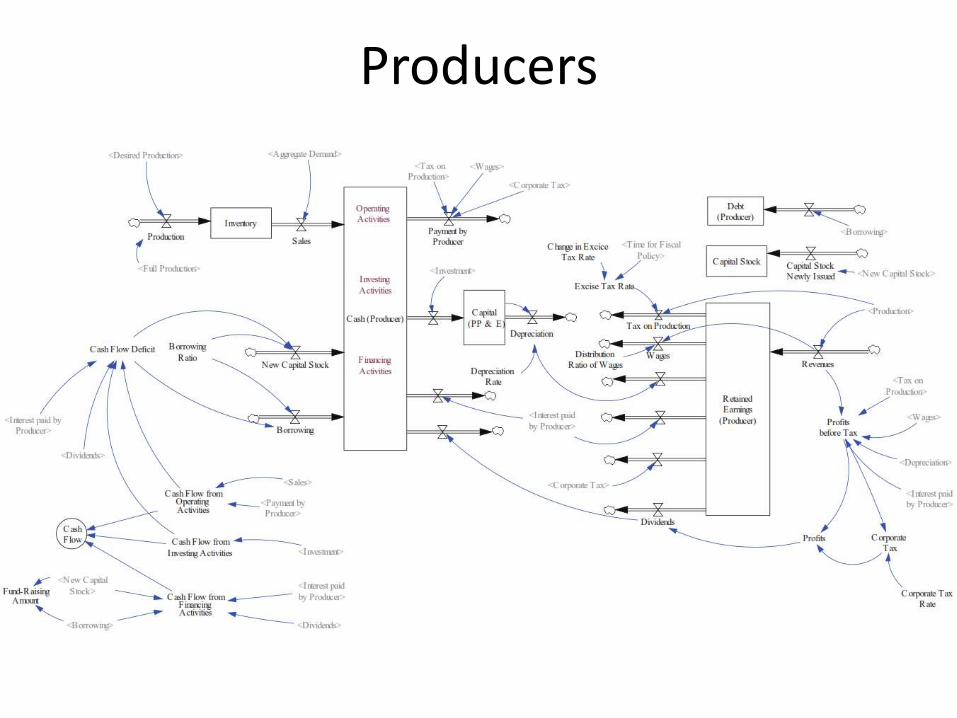
Producers
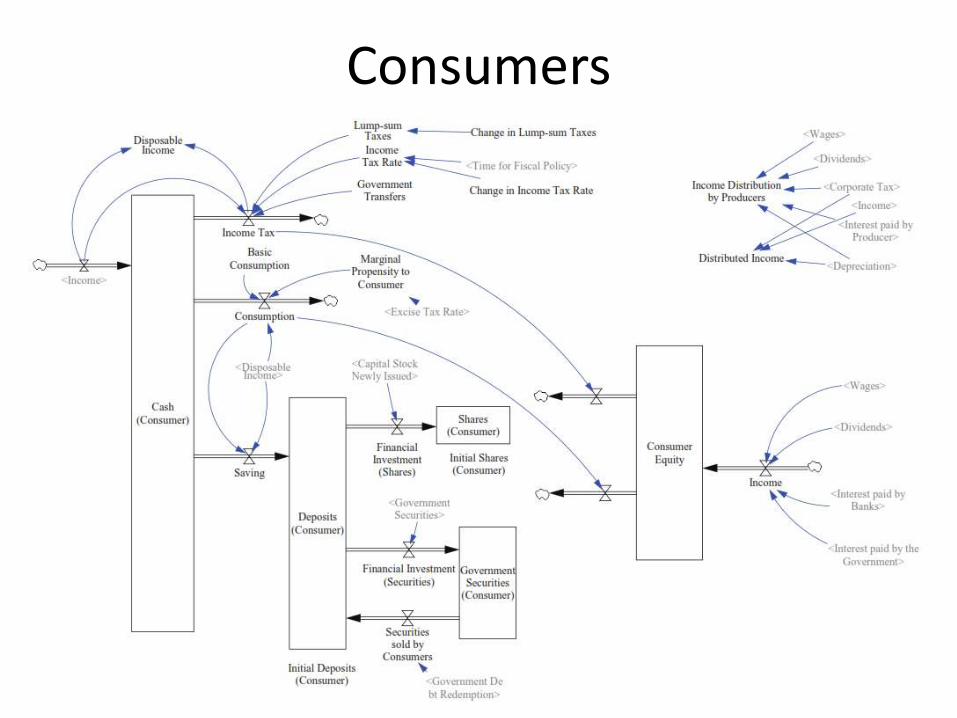
Consumers
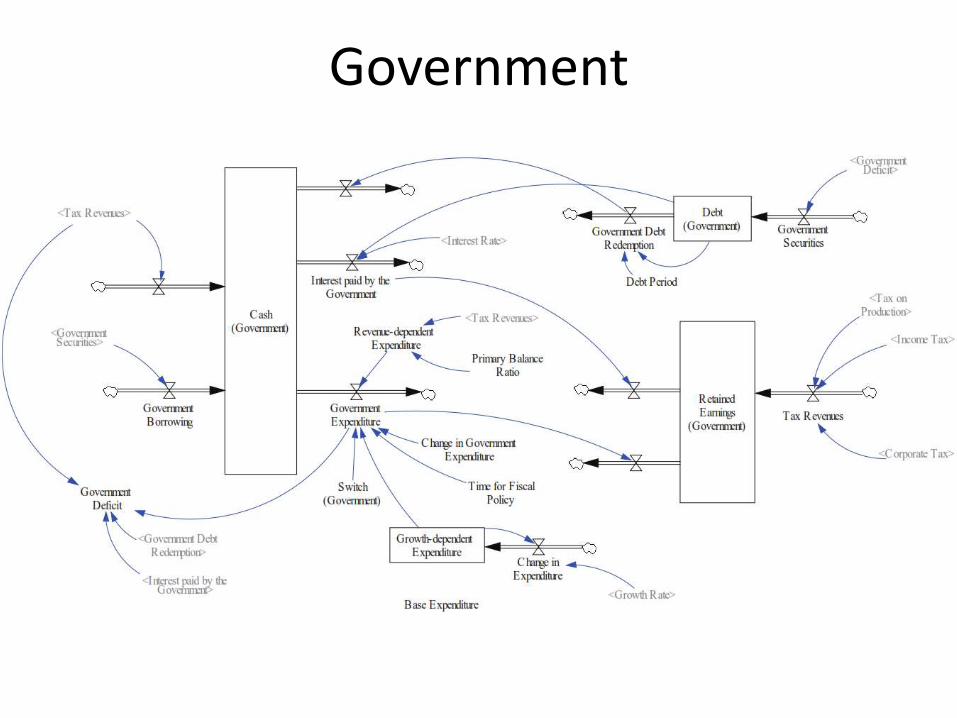
Government
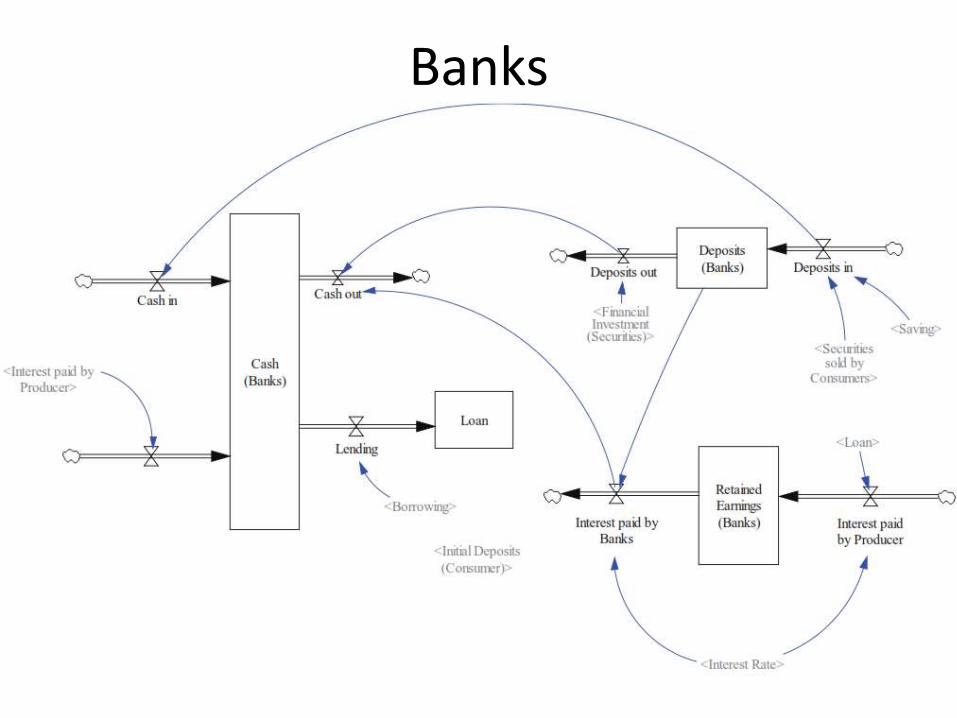
Banks
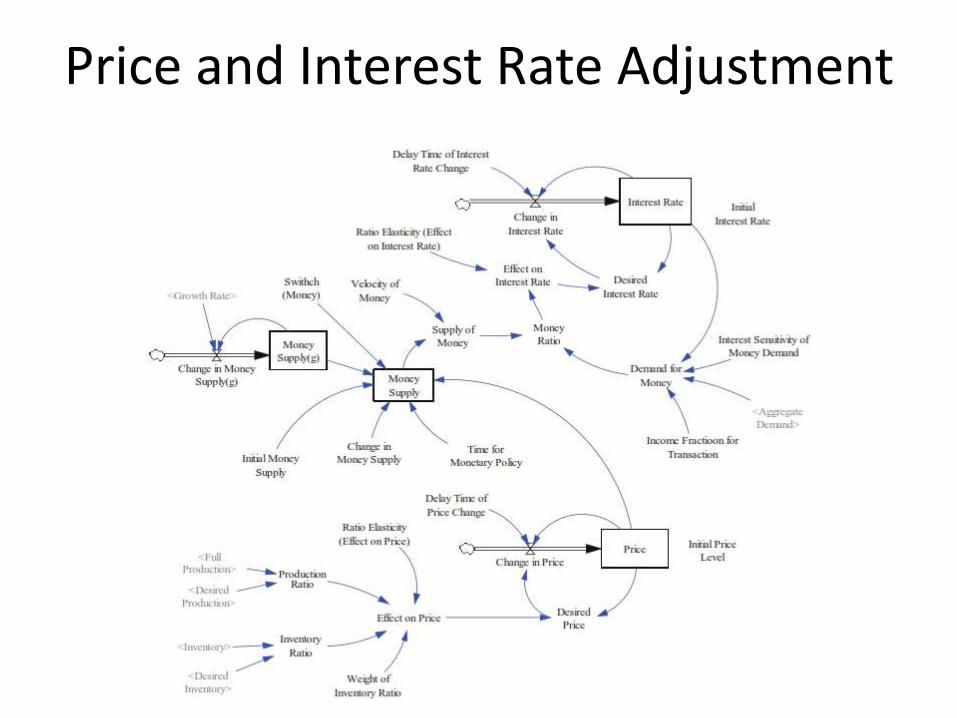
Price and Interest Rate Adjustment
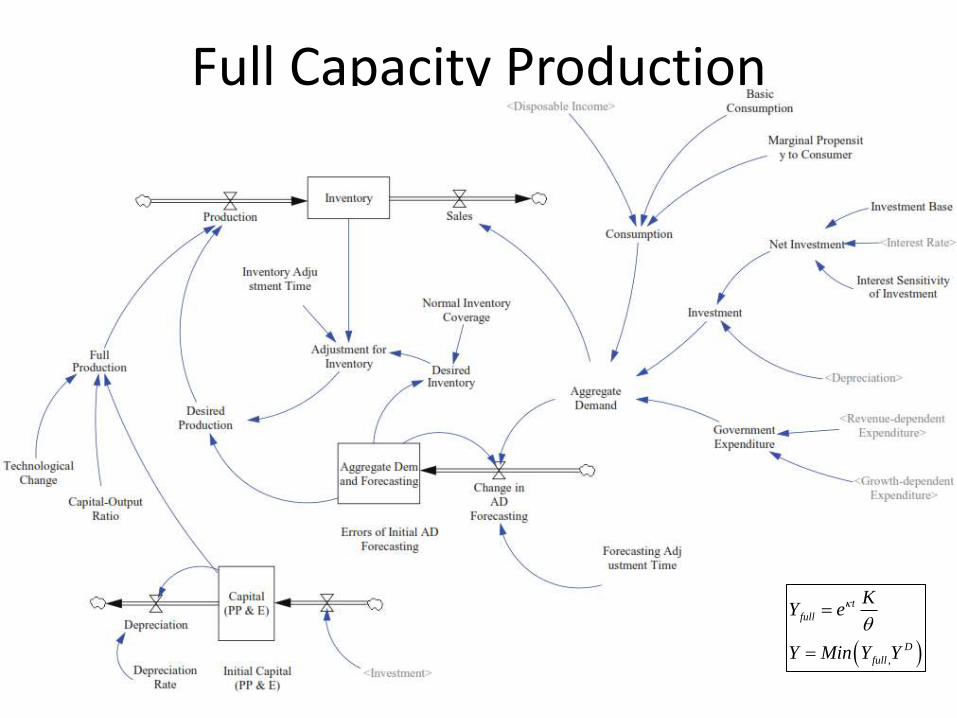
Full Capacity Production
,
t
full
D
full
KY e
Y Min Y Y
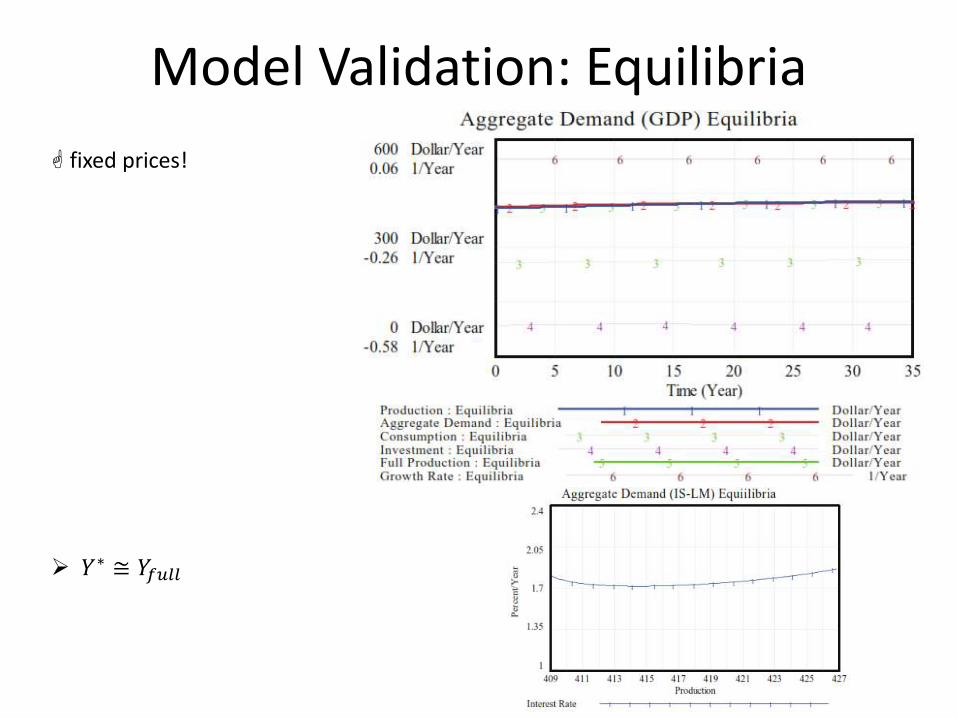
Model Validation: Equilibria
fixed prices!
𝑌∗ ≅ 𝑌𝑓𝑢𝑙𝑙
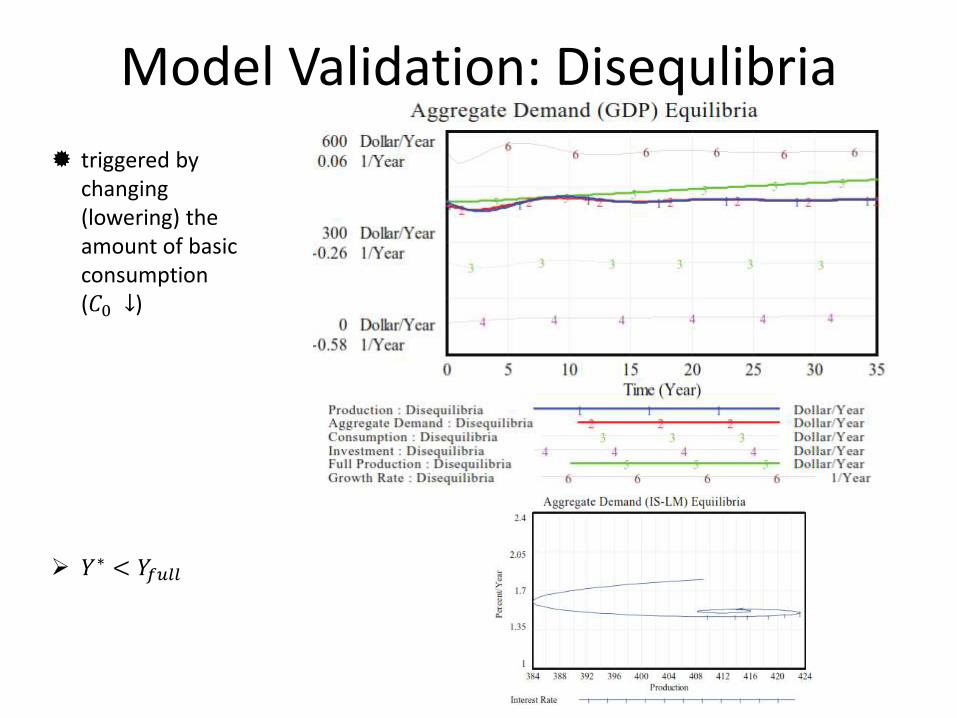
Model Validation: Disequlibria
triggered by changing (lowering) the amount of basic consumption (𝐶0 ↓)
𝑌∗ < 𝑌𝑓𝑢𝑙𝑙
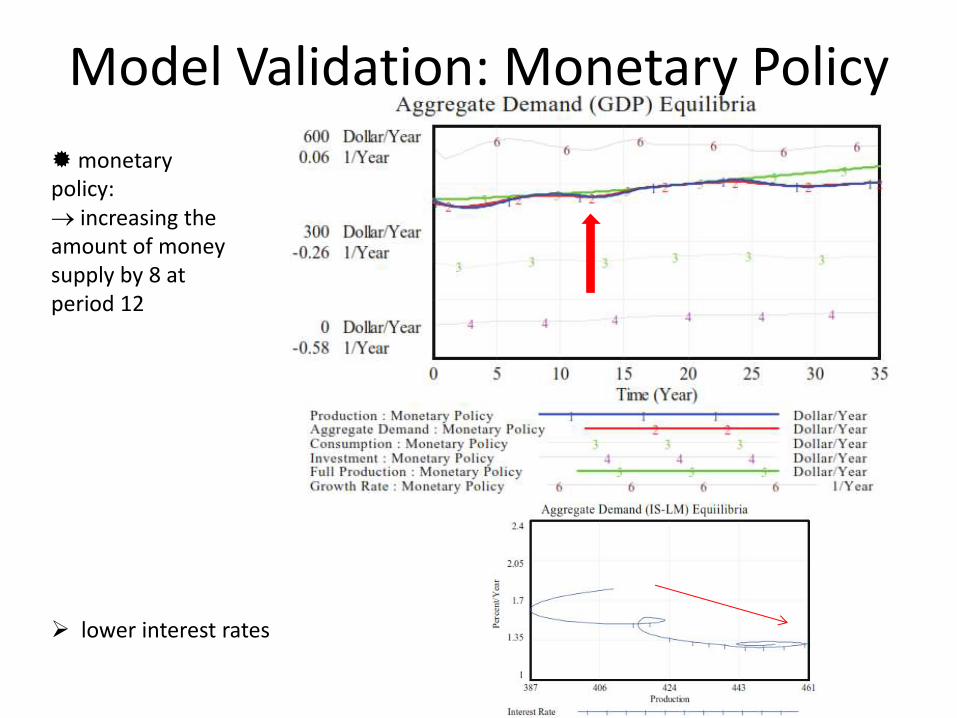
Model Validation: Monetary Policy
monetary policy: increasing the amount of money supply by 8 at period 12
lower interest rates
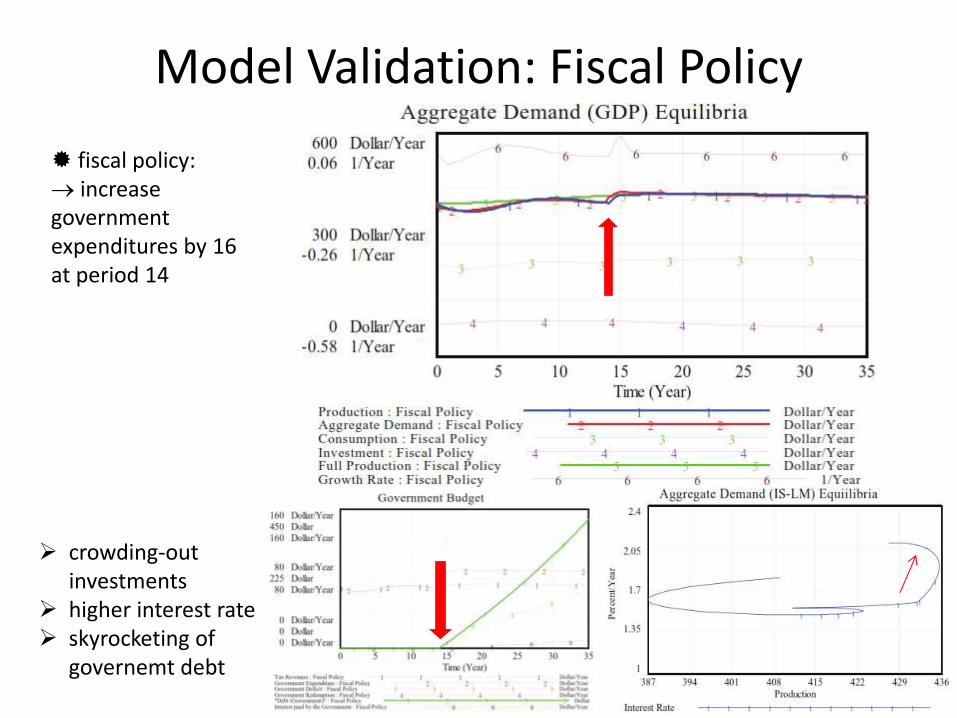
Model Validation: Fiscal Policy
fiscal policy: increase government expenditures by 16 at period 14
crowding-out investments
higher interest rate skyrocketing of
governemt debt
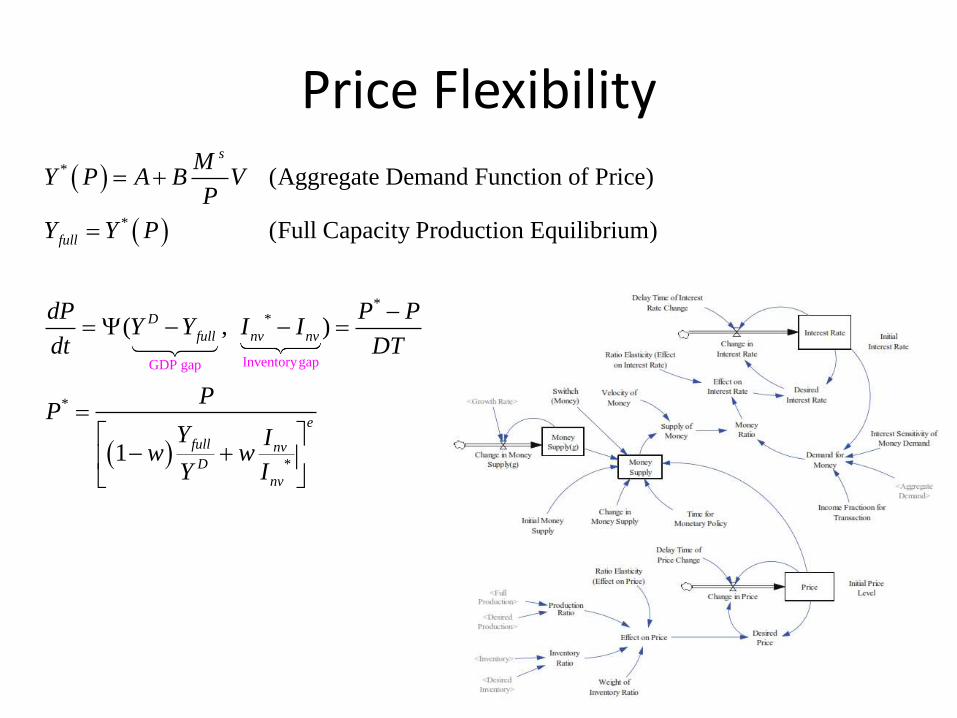
Price Flexibility
Inve
*
*
**
*
*
ntorygapGDP gap
(Aggregate Demand Function of Price)
(Full Capacity Production Equilibrium)
( , ) (Price Adjustment)
1
s
full
D
full nv nv
full nv
D
nv
MY P A B V
P
Y Y P
dP P PY Y I I
dt DT
PP
Y Iw w
Y I
(Desired Price)e
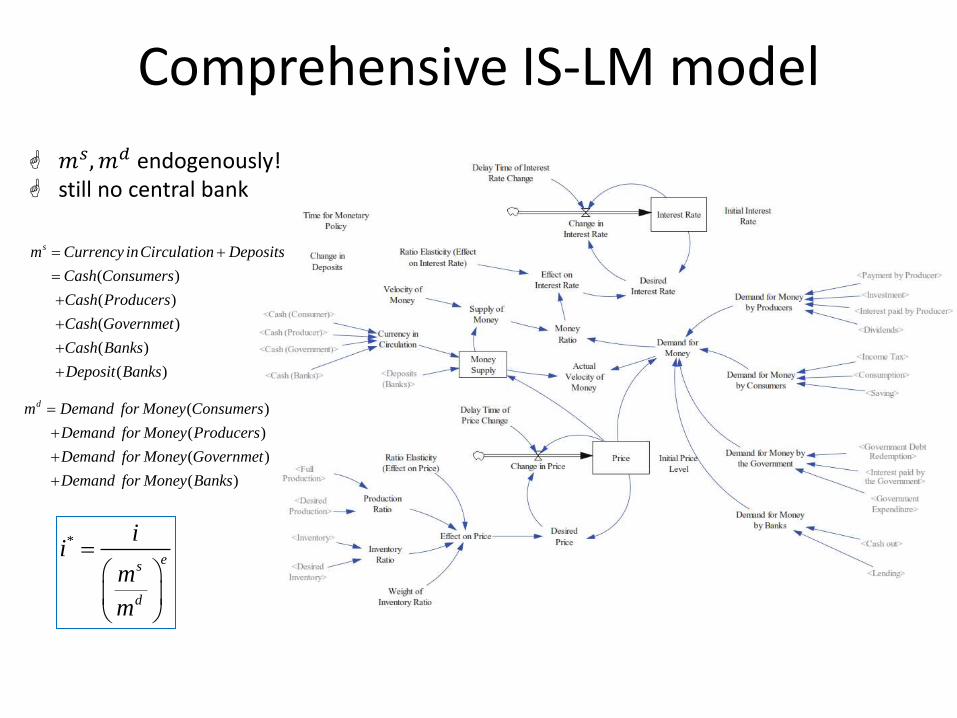
Comprehensive IS-LM model
𝑚𝑠, 𝑚𝑑 endogenously! still no central bank
( )
( )
( )
( )
( )
sm Currency inCirculation Deposits
Cash Consumers
Cash Producers
Cash Governmet
Cash Banks
Deposit Banks
( )
( )
( )
( )
dm Demand for Money Consumers
Demand for Money Producers
Demand for Money Governmet
Demand for Money Banks
*
es
d
ii
m
m
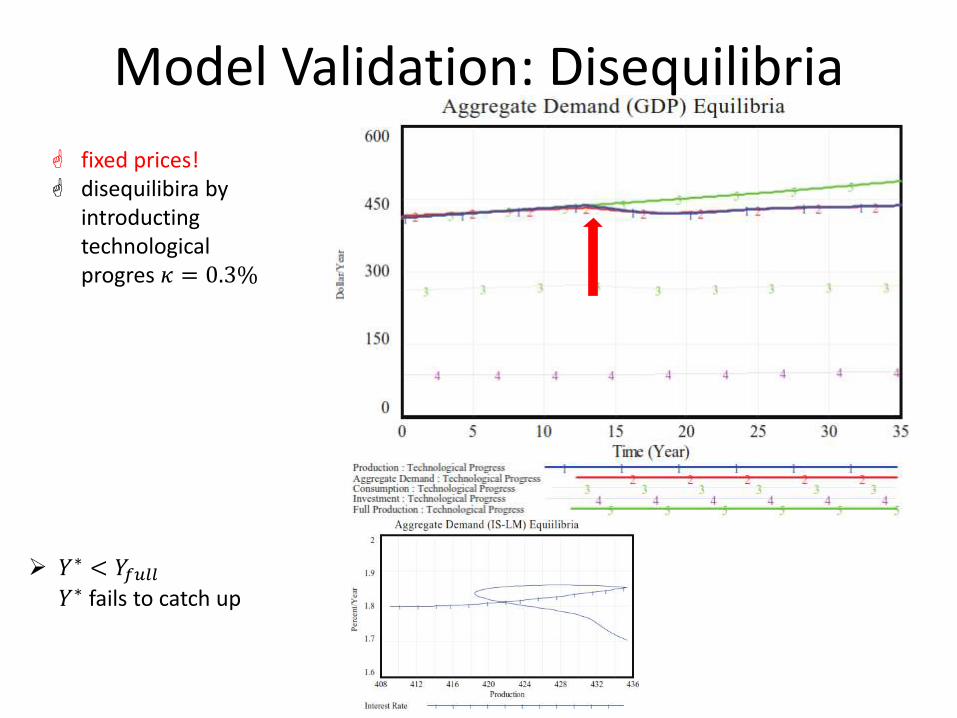
Model Validation: Disequilibria
fixed prices! disequilibira by
introducting technological progres 𝜅 = 0.3%
𝑌∗ < 𝑌𝑓𝑢𝑙𝑙
𝑌∗ fails to catch up
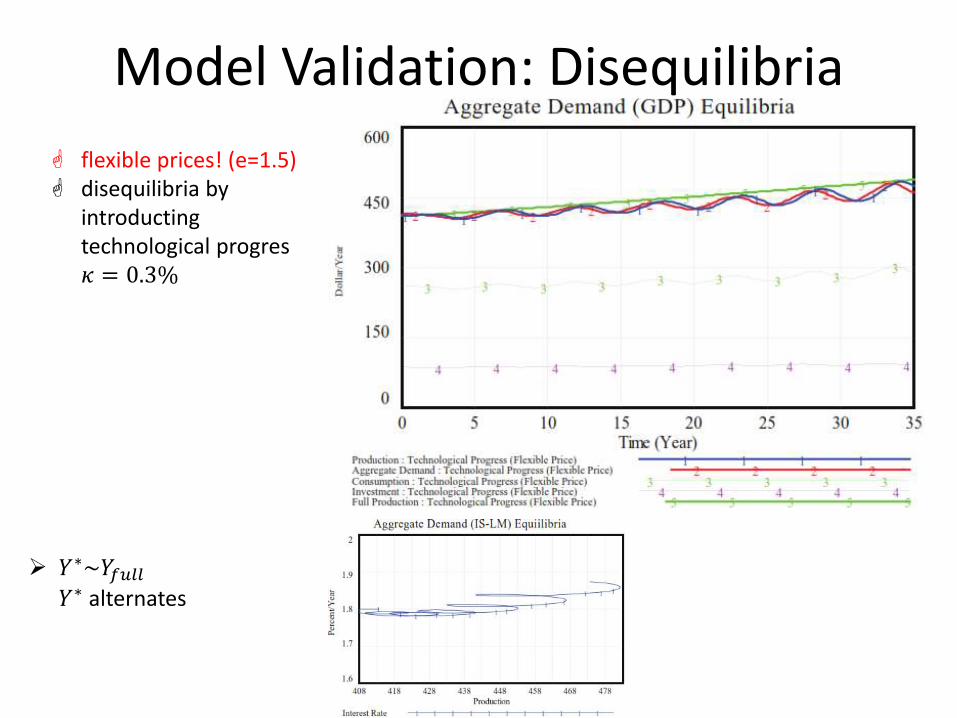
Model Validation: Disequilibria
flexible prices! (e=1.5) disequilibria by
introducting technological progres 𝜅 = 0.3%
𝑌∗~𝑌𝑓𝑢𝑙𝑙
𝑌∗ alternates
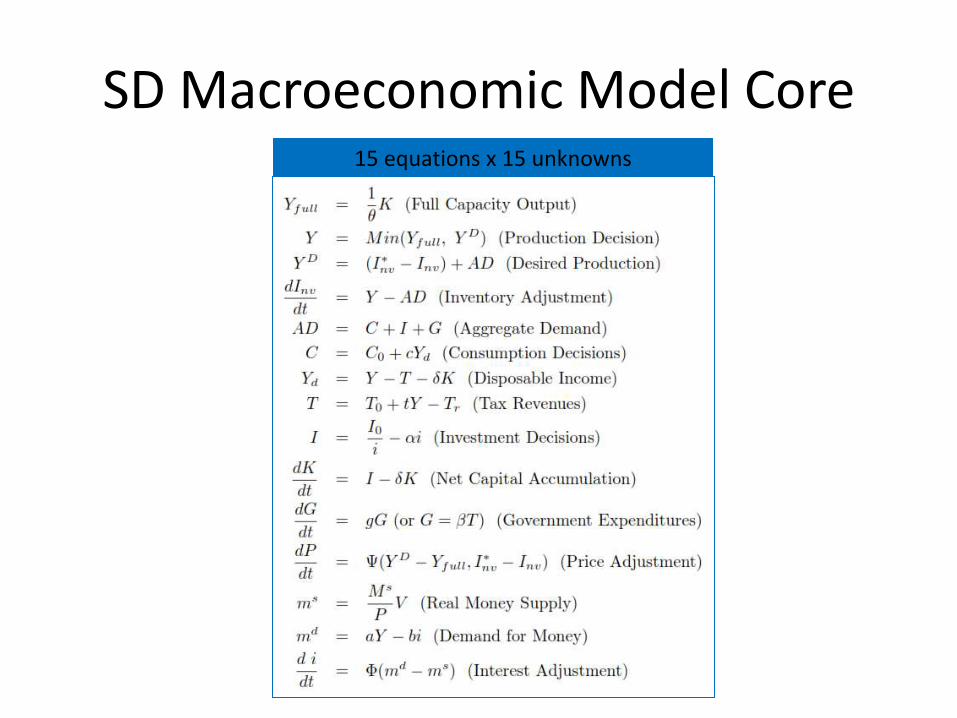
SD Macroeconomic Model Core 15 equations x 15 unknowns
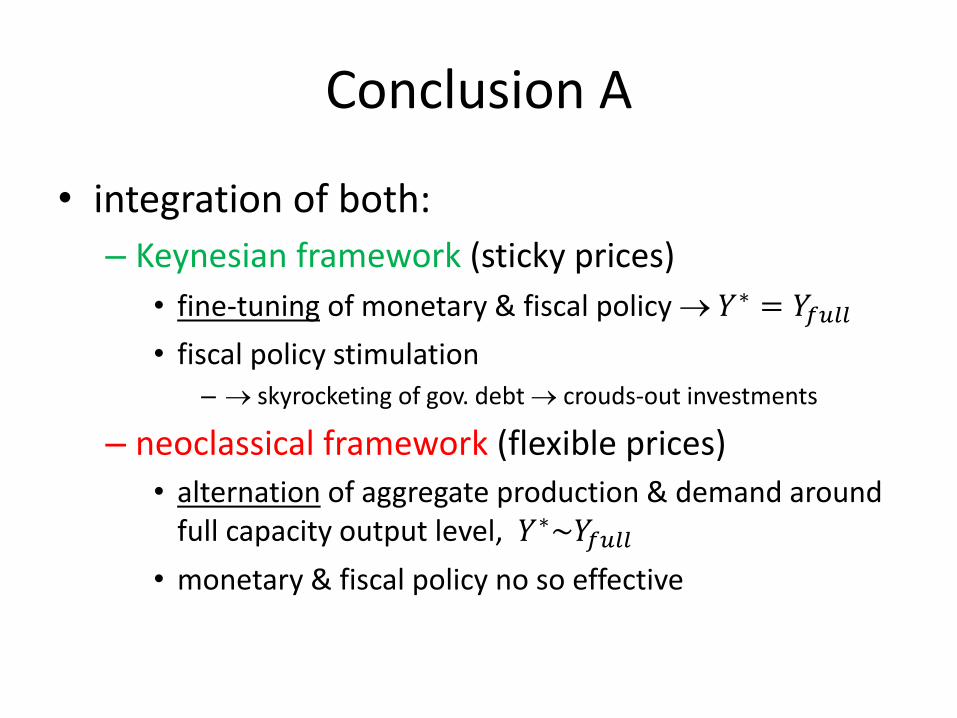
Conclusion A
• integration of both:
– Keynesian framework (sticky prices)
• fine-tuning of monetary & fiscal policy 𝑌∗ = 𝑌𝑓𝑢𝑙𝑙
• fiscal policy stimulation
– skyrocketing of gov. debt crouds-out investments
– neoclassical framework (flexible prices)
• alternation of aggregate production & demand around full capacity output level, 𝑌∗~𝑌𝑓𝑢𝑙𝑙
• monetary & fiscal policy no so effective
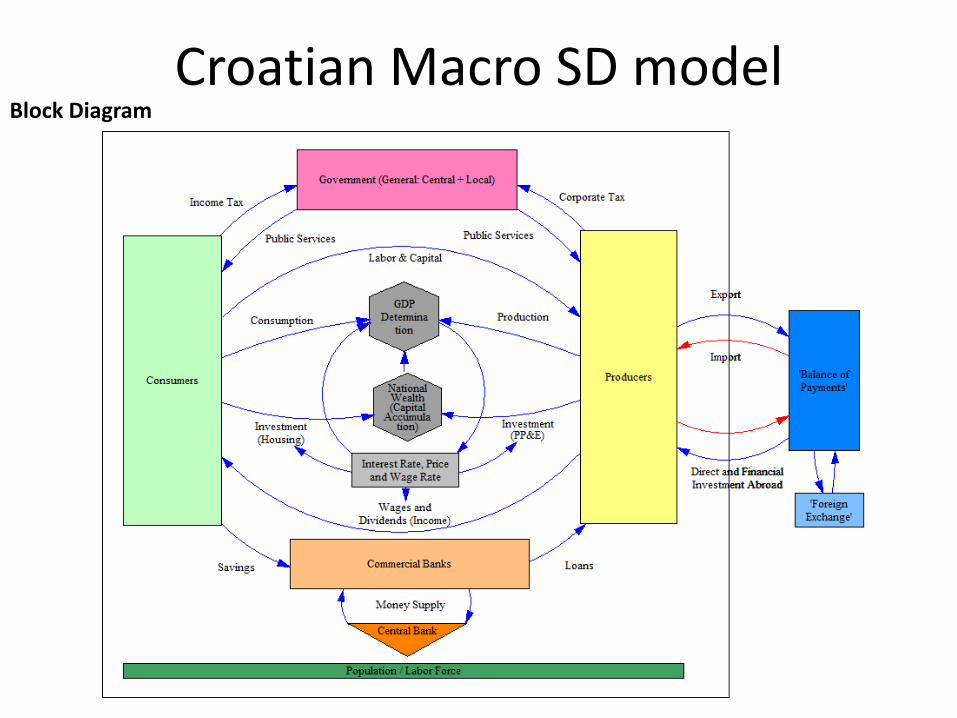
Croatian Macro SD model Block Diagram
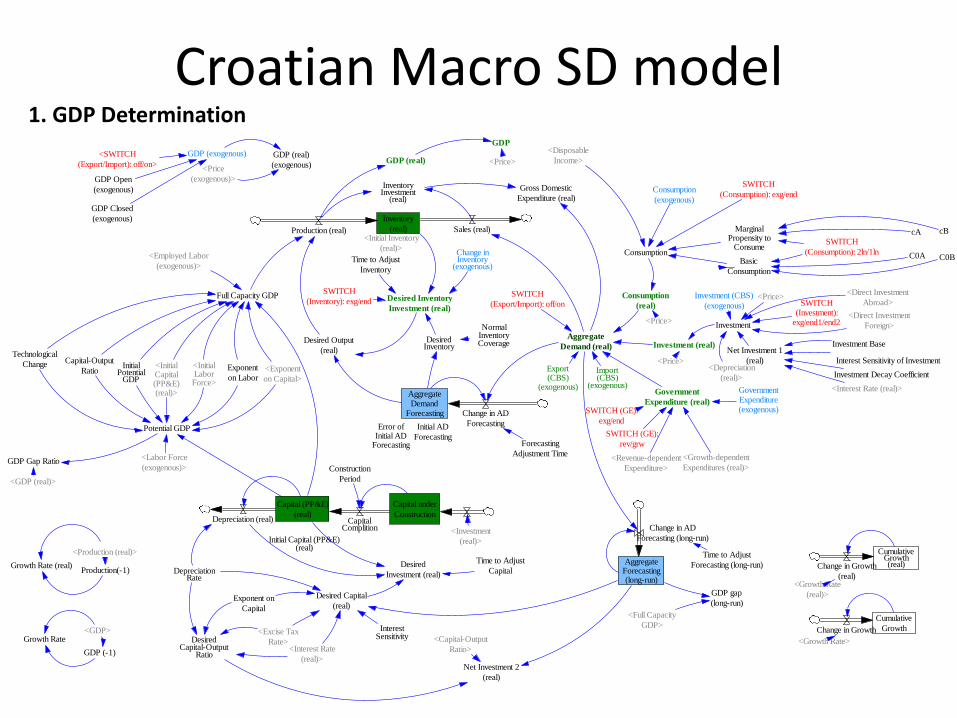
Croatian Macro SD model 1. GDP Determination
Consumption
Aggregate
Demand (real)
AggregateDemand
Forecasting
Change in AD
Forecasting
Desired Output
(real)
MarginalPropensity to
Consume
Basic
Consumption
Investment (real)
Government
Expenditure (real)
Forecasting
Adjustment Time
Error ofInitial AD
Forecasting
GovernmentExpenditure(exogenous)
Consumption
(exogenous)
Investment (CBS)
(exogenous)
Change inInventory
(exogenous)
GDP (exogenous)
Inventory
(real)Production (real) Sales (real)
Time to Adjust
Inventory
Desired Inventory
Investment (real)
DesiredInventory
GDP (real)
Investment Base
Growth Rate (real)
<Production (real)>
Production(-1)
Interest Sensitivity of Investment
<Revenue-dependent
Expenditure>
C0A
cA
C0B
cB
CumulativeGrowth(real)Change in Growth
(real)<Growth Rate
(real)>
Export(CBS)
(exogenous)
Import(CBS)
(exogenous)
SWITCH
(Consumption): exg/end
SWITCH
(Inventory): exg/endSWITCH
(Export/Import): off/on SWITCH(Investment):
exg/end1/end2
SWITCH (GE):
exg/end
SWITCH (GE):
rev/grw
SWITCH
(Consumption): 2ln/1ln
Investment Decay Coefficient
<Disposable
Income>
Full Capacity GDP
Technological
Change Capital-Output
Ratio
<Investment
(real)>Initial Capital (PP&E)(real)
Net Investment 1
(real)
<Interest Rate (real)>
NormalInventoryCoverage
GDP (real)
(exogenous)
GDP
<Price><Price
(exogenous)>
Growth Rate<GDP>
GDP (-1)
<Growth Rate>
Cumulative
GrowthChange in Growth
Capital under
Construction
Construction
Period
Capital (PP&E)
(real)Capital
ComplitionDepreciation (real)
Desired
Investment (real)
Time to Adjust
Capital
Desired Capital
(real)Exponent on
Capital
DepreciationRate
DesiredCapital-Output
Ratio
<Excise Tax
Rate>
InterestSensitivity <Capital-Output
Ratio>
Net Investment 2
(real)
AggregateForecasting(long-run)
Change in AD
Forecasting (long-run)
Time to Adjust
Forecasting (long-run)
<Full Capacity
GDP>
GDP gap
(long-run)
InventoryInvestment
(real)
Gross Domestic
Expenditure (real)
<Initial Inventory
(real)>
<SWITCH
(Export/Import): off/on>
GDP Open
(exogenous)
GDP Closed
(exogenous)
<Interest Rate
(real)>
Consumption
(real)
<Price>
<Price>
Investment
<Depreciation
(real)>
<Price>
Initial AD
Forecasting
<Growth-dependent
Expenditures (real)>
<Employed Labor
(exogenous)>
InitialPotential
GDP
Exponent
on Labor<Exponent
on Capital>
<InitialCapital(PP&E)(real)>
<InitialLaborForce>
Potential GDP
<Labor Force
(exogenous)>GDP Gap Ratio
<GDP (real)>
<Direct Investment
Abroad>
<Direct Investment
Foreign>
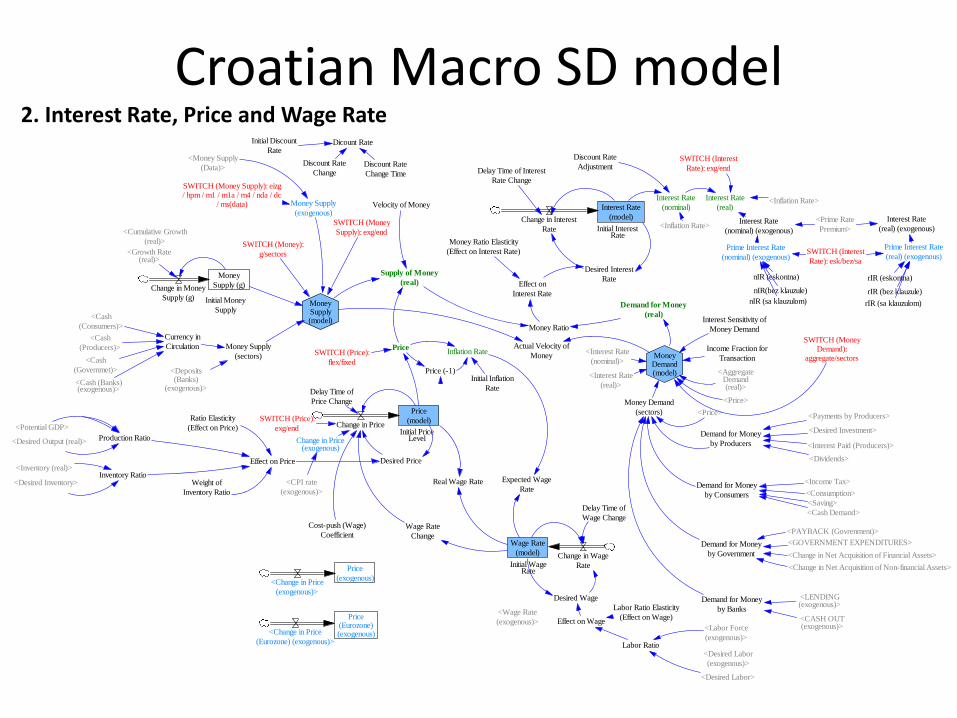
Croatian Macro SD model 2. Interest Rate, Price and Wage Rate
Initial InterestRate
Delay Time of Interest
Rate Change
Money
Supply (g)Change in Money
Supply (g)
Desired Interest
RateEffect on
Interest Rate
Money Ratio Elasticity
(Effect on Interest Rate)
Money Ratio
Demand for Money
(real)
Supply of Money
(real)
Velocity of Money
SWITCH (Money):
g/sectors
Delay Time of
Price Change
Desired PriceEffect on Price
Ratio Elasticity
(Effect on Price)
Weight of
Inventory Ratio
Production Ratio
Inventory Ratio
Initial PriceLevel
<Growth Rate(real)>
Interest Sensitivity of
Money Demand
Income Fraction for
Transaction
<AggregateDemand(real)>
Prime Interest Rate
(nominal) (exogenous)
Money Supply
(exogenous)
Change in Price(exogenous)
Price
(model)Change in Price
Interest Rate
(model)Change in Interest
Rate
Interest Rate
(real)
MoneySupply(model)
Prime Interest Rate
(real) (exogenous)
SWITCH (Price):
exg/end
SWITCH (Money
Supply): exg/end
SWITCH (Interest
Rate): exg/end
PriceSWITCH (Price):
flex/fixed
SWITCH (Interest
Rate): esk/bez/sa
rIR (eskontna)
rIR (bez klauzule)
rIR (sa klauzulom)
nIR (eskontna)
nIR(bez klauzule)
nIR (sa klauzulom)
<Cumulative Growth
(real)>
<Desired Inventory>
<Inventory (real)>
Price
(exogenous)<Change in Price
(exogenous)>
<Desired Output (real)>
Currency in
Circulation
<Cash
(Consumers)>
<Cash
(Producers)>
<Cash
(Governmet)>
<Cash (Banks)(exogenous)>
<Deposits(Banks)
(exogenous)>
Initial Money
Supply
Demand for Money
by Producers
Demand for Money
by Consumers
Demand for Money
by Government
Demand for Money
by Banks
<Payments by Producers>
<Dividends>
<Income Tax>
<Saving>
<PAYBACK (Govrenment)>
<GOVERNMENT EXPENDITURES>
<Change in Net Acquisition of Financial Assets>
<Change in Net Acquisition of Non-financial Assets>
<LENDING(exogenous)>
<CASH OUT(exogenous)>
Money Supply
(sectors)
Money Demand
(sectors) <Price>
SWITCH (MoneyDemand):
aggregate/sectors
Dicount RateInitial Discount
Rate
Interest Rate
(nominal)
Price (-1)
Inflation Rate
Discount Rate
ChangeDiscount Rate
Change Time
<Inflation Rate>
<Desired Investment>
<Cash Demand>
SWITCH (Money Supply): eizg/ hpm / m1 / m1a / m4 / nda / dc
/ ms(data)
<Prime Rate
Premium>Interest Rate
(nominal) (exogenous)
Interest Rate
(real) (exogenous)<Inflation Rate>
Discount Rate
Adjustment
MoneyDemand(model)
<Price>
<Interest Rate
(nominal)>
Actual Velocity of
Money
<Interest Rate
(real)>
<Consumption>
Initial Inflation
Rate
<Money Supply
(Data)>
Wage Rate
(model) Change in Wage
RateInitial WageRate
Delay Time of
Wage ChangeWage Rate
Change
Cost-push (Wage)
Coefficient
<Wage Rate
(exogenous)>
Desired Wage
Labor Ratio
Effect on Wage
Labor Ratio Elasticity
(Effect on Wage)
Expected Wage
Rate
<Labor Force
(exogenous)>
<Desired Labor
(exogenous)>
<Potential GDP>
Real Wage Rate
<Desired Labor>
Price(Eurozone)(exogenous)<Change in Price
(Eurozone) (exogenous)>
<CPI rate
(exogenous)>
<Interest Paid (Producers)>
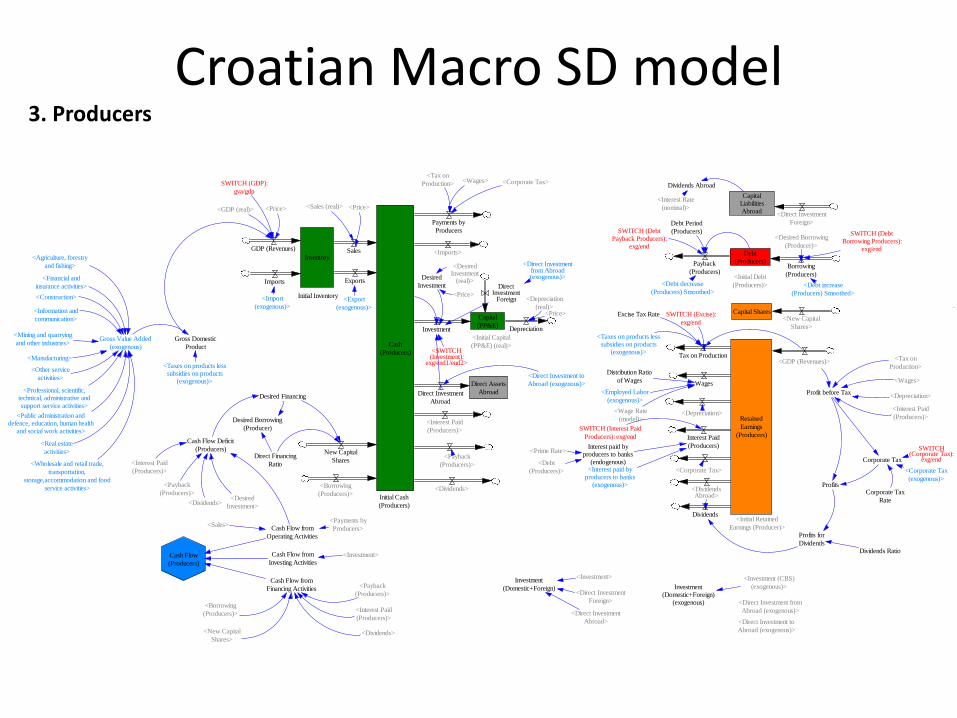
Croatian Macro SD model 3. Producers
Excise Tax Rate
Distribution Ratio
of Wages
Cash
(Producers)
Debt
(Producers)
Capital Shares
Retained
Earnings
(Producers)
Payments by
Producers
<Taxes on products lesssubsidies on products
(exogenous)>
Profit before Tax
Profits
Corporate Tax
Corporate Tax
Rate
Dividends
<Dividends>
<Corporate Tax>
<Corporate Tax>
Payback
(Producers)
<Payback
(Producers)>
Dividends Ratio
<Initial Capital
(PP&E) (real)>
SWITCH (Excise):
exg/endCapital
(PP&E)Depreciation
<Depreciation
(real)>
<Price>
Desired
Investment
<DesiredInvestment
(real)>
<Depreciation>
<Depreciation>
<SWITCH(Investment):
exg/end1/end2>
SWITCH(Corporate Tax):
exg/end
<Corporate Tax
(exogenous)>
Inventory
GDP (Revenues)
Gross Value Added
(exogenous)
<Agriculture, forestry
and fishing>
<Construction>
<Financial and
insurance activities>
<Information and
communication>
<Manufacturing>
<Mining and quarrying
and other industries>
<Other service
activities>
<Professional, scientific,technical, administrative andsupport service activities>
<Public administration anddefence, education, human health
and social work activities>
<Real estate
activities>
<Wholesale and retail trade,
transportation,
storage,accommodation and food
service activities>
SWITCH (GDP):
gva/gdp
<GDP (real)> <Price>
Sales
<Sales (real)> <Price>
Initial Inventory
<GDP (Revenues)>Tax on Production <Tax on
Production>
Gross Domestic
Product
<Taxes on products lesssubsidies on products
(exogenous)>
<Tax on
Production>
<Debt decrease
(Producers) Smoothed><Debt increase
(Producers) Smoothed>
Debt Period
(Producers)SWITCH (DebtPayback Producers):
exg/end
<Initial Debt
(Producers)>
Cash Flow Deficit
(Producers)
<Payback
(Producers)>
<Dividends><Desired
Investment>
Cash Flow from
Operating Activities
Cash Flow from
Investing Activities
Cash Flow from
Financing Activities
Cash Flow
(Producers)
<Payback
(Producers)>
<Dividends>
<Sales><Payments by
Producers>
Desired Financing
Direct Financing
Ratio
Desired Borrowing
(Producer)
New Capital
Shares
<New Capital
Shares>
<New Capital
Shares>
<Price>
Initial Cash
(Producers)
SWITCH (DebtBorrowing Producers):
exg/end
Borrowing
(Producers)
<Borrowing
(Producers)>
<Desired Borrowing
(Producer)>
<Borrowing
(Producers)>
<Initial Retained
Earnings (Producer)>
Investment
<Investment>
Imports Exports
<Import
(exogenous)><Export
(exogenous)>
<Imports>
Direct Assets
AbroadDirect Investment
Abroad
<Direct Investment to
Abroad (exogenous)>
<Direct Investmentfrom Abroad(exogenous)>
DirectInvestment
Foreign
<Price>
Investment
(Domestic+Foreign)
<Investment>
<Direct Investment
Foreign>
<Direct Investment
Abroad>
Investment(Domestic+Foreign)
(exogenous)
<Investment (CBS)
(exogenous)>
<Direct Investment from
Abroad (exogenous)>
<Direct Investment to
Abroad (exogenous)>
CapitalLiabilitiesAbroad
Dividends Abroad
<Interest Rate
(nominal)>
<DividendsAbroad>
Profits for
Dividends
<Direct Investment
Foreign>
Wages
<Employed Labor
(exogenous)>
<Wage Rate
(model)>
<Wages>
<Wages>
Interest Paid
(Producers)
<Interest paid byproducers to banks
(exogenous)>
SWITCH (Interest Paid
Producers): exg/end
Interest paid byproducers to banks
(endogenous)
<Prime Rate>
<Debt
(Producers)>
<Interest Paid
(Producers)>
<Interest Paid
(Producers)>
<Interest Paid
(Producers)>
<Interest Paid
(Producers)>
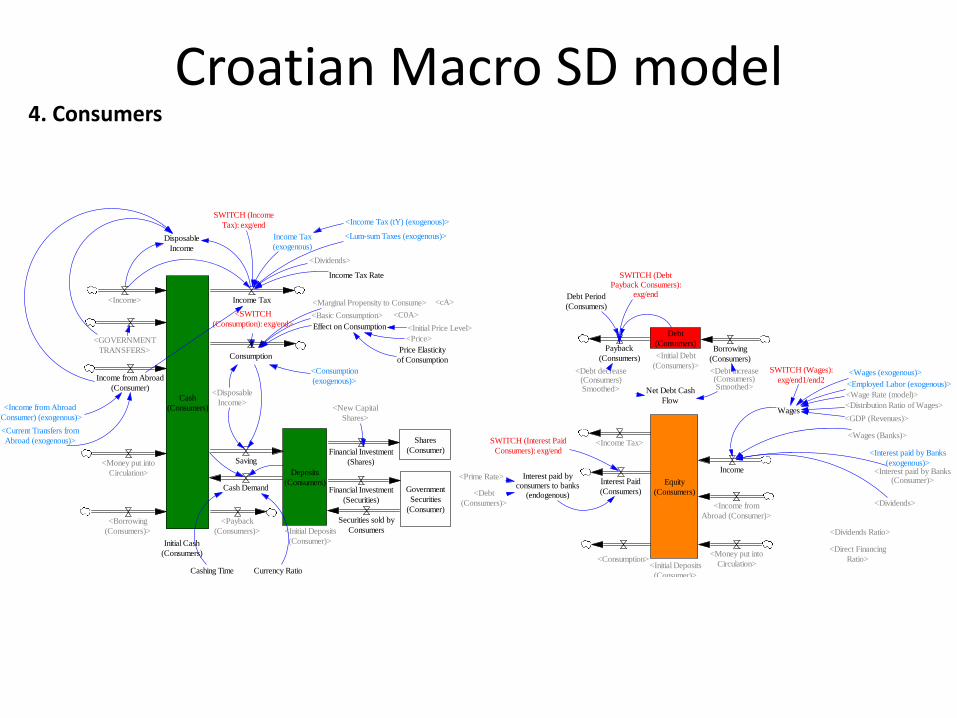
Croatian Macro SD model 4. Consumers
Cash
(Consumers)
Deposits
(Consumers) Equity
(Consumers)
Income
SWITCH (Wages):
exg/end1/end2
<Income> Income Tax
Income Tax Rate
SWITCH (Income
Tax): exg/end
<Basic Consumption>
<Consumption
(exogenous)>
<Marginal Propensity to Consume>
<SWITCH
(Consumption): exg/end>
Consumption
Saving
<Income Tax>
<Consumption>
<Lum-sum Taxes (exogenous)>
<Income Tax (tY) (exogenous)>
<Initial Deposits
(Consumer)>
<Initial Deposits
(Consumer)>
Shares
(Consumer)Financial Investment
(Shares)
Government
Securities
(Consumer)
Financial Investment
(Securities)
Securities sold by
Consumers
Debt
(Consumers)
<Initial Debt
(Consumers)>
Disposable
Income
<Disposable
Income>
<Interest paid by Banks
(exogenous)>
<Dividends>
<Dividends Ratio>
Net Debt Cash
Flow
<C0A>
<cA>
Cash Demand
<Debt increase(Consumers)Smoothed>
<Debt decrease(Consumers)Smoothed>
Effect on Consumption
Price Elasticity
of Consumption
<Price>
<Initial Price Level>
Income Tax
(exogenous)
Cashing Time Currency Ratio
Debt Period
(Consumers)
SWITCH (DebtPayback Consumers):
exg/end
Payback
(Consumers)Borrowing
(Consumers)
<Payback
(Consumers)>
<New Capital
Shares>
<Borrowing
(Consumers)>
Initial Cash
(Consumers)
<GOVERNMENT
TRANSFERS>
<Direct Financing
Ratio>
Income from Abroad
(Consumer)
<Income from Abroad
(Consumer) (exogenous)>
<Income from
Abroad (Consumer)>
<Money put into
Circulation>
<Money put into
Circulation>
Wages<Distribution Ratio of Wages>
<Employed Labor (exogenous)>
<GDP (Revenues)>
<Wage Rate (model)>
<Wages (exogenous)>
<Dividends>
<Current Transfers from
Abroad (exogenous)>
Interest Paid
(Consumers)
SWITCH (Interest Paid
Consumers): exg/end
Interest paid byconsumers to banks
(endogenous)
<Prime Rate>
<Debt
(Consumers)>
<Interest paid by Banks(Consumer)>
<Wages (Banks)>

Croatian Macro SD model 5. Government (General: Central + Local)
Cash
(Governmet)
Retained
Earnings
(Government)
Debt Domestic
(Government)
TAX REVENUES
<TAX
REVENUES>
Debt Foreign
(Government)
<1-2 Social Contributions>
<1-3 Grants>
<1-4 Other Revenues>
GOVERNMENT
EXPENDITURES<2-1 Compensation of Employees>
<2-2 Use of Goods and Services>
<2-3 Interest>
<2-4 Subsidies>
<2-5 Grants>
<2-6 Social Benefits>
<2-7 Other Expenses>
<GOVERNMENT
EXPENDITURES>
Non-financial
Assets<3-1 Acquisition -
Non-financial Assets>
<3-2 Sales -
Non-financial Assets>
Financial
Assets
<4-1 Expenses for
Financial Assets>
<4-1 Earnings from
Financial Assets>
<5-1 Borrowing
(Domestic)><5-1 Payback
(Domestic)>
<5-2 Borrowing(Foreign)>
<5-2 Payback
(Foregin)>
Operational
Balance
Change in Net
Incurrence of Liabilities
Change in Net Acquisition
of Non-financial Assets
Change in NetAcquisition of Financial
Assets
<BORROWING
(Govrnment)><PAYBACK
(Govrenment)>
Deficit /
Surplus
<TAX
REVENUES>
<GOVERNMENT EXPENDITURES>
<PAYBACK (Govrenment)>
<Change in Net Acquisition of
Non-financial Assets>
<Change in Net Acquisition of
Financial Assets>
<4-0 Cash and
Deposits>
Cash andDeposits(MoF)
-----------------------------------------------------------------------------------------------------------------------------------------------------------------------------------------------------------------------------------------
Total Debt
(Govrnment)
Initial Debt
(Govrnment)
Growth-dependent
Expenditures (real) Change in
Expenditure
<Growth Rate (real)>
Base Expenditure
(real)
<Income Tax>
<Tax on Production>
<Corporate Tax>
Tax Revenues
(exogenous)
Tax Revenues
(endogenous)
SWITCH (TaxRevenues):
exg/end
GovernmentExpenditures(exogenous)
SWITCH(Gov.Expenditures)
: exg/end
GovernmentExpenditures(endogenous)
<Price>
<GovernmentExpenditures
(endogenous)>
Initial Cash
(Government)
----------------------------------------------------------------------------------------------------------------------------------------------------------------------------------------------------------------------------------------
SWITCH (DebtPayment Govrnment):
exg/end
Debt Period
(Govrnment)
PAYBACK
(Govrenment)BORROWING
(Govrnment)
Payback Total(Govrnment)(exogenous)
Borrowing Total(Govrnment)(exogenous)
Total Debt (Government)(exogenous)
Inital Debt (Domestic)
Inital Debt (Foreign)
<1-3 Grants>
<1-4 Other Revenues>
SWITCH (DebtBorrowing Governmet):
exg/end
<Deficit / Surplus>
Required
Borrowing
SOCIAL
CONTRIBUTIONSGOVERNMENT
TRANSFERS
1-1 Taxes<1-1-2 Taxes on Property>
<1-1-3 Taxes on Goods and Services>
<1-1-4 Taxes on International Trade and Transactions>
<1-1-5 Other Taxes>
<1-1-1-1 Payable byIndividuals (Employment
Income Tax)>
<1-1-1-2 Payable byCorporations and other
Enterprises (Capital Income Tax)>
<SOCIAL
CONTRIBUTIONS>
<SOCIAL
CONTRIBUTIONS><GOVERNMENT
TRANSFERS>
<GOVERNMENT TRANSFERS>
Interest Paid
(Government)
<Interest Rate
(nominal)>
Payback &
Interest Paid
Debt-GDPratio
<GDP
(Revenues)>
Growth-dependent
Expenditure
Government Expenditure +Social Benefits&Subsidies
(exogenous)
Interest paid by the Government (Central Bank)
Interest paid by the Government (Banks)
Interest paid by the Government (Consumer)
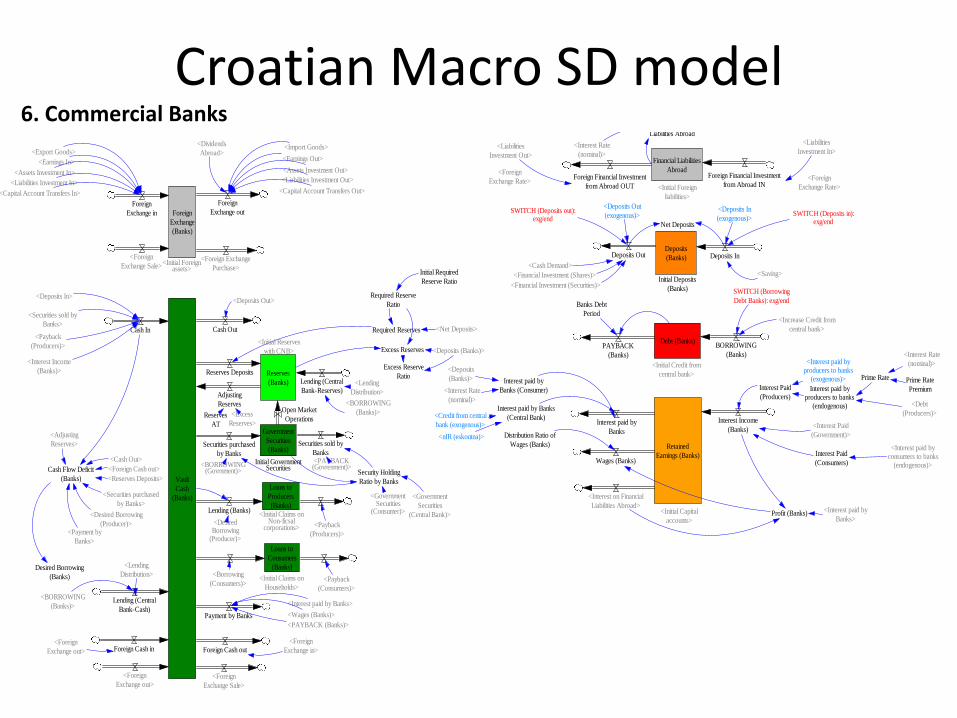
Croatian Macro SD model 6. Commercial Banks
Prime Rate
Premium
Net Deposits
Retained
Earnings (Banks)
Interest Income
(Banks)Interest paid by
Banks
Interest paid by
Banks (Consumer)
Interest paid by Banks
(Central Bank)
Wages (Banks)
<Initial Capital
accounts>
Deposits
(Banks) Deposits InDeposits Out
SWITCH (Deposits in):exg/end
SWITCH (Deposits out):exg/end
Initial Deposits
(Banks)
<Deposits
(Banks)>
<Interest Rate
(nominal)>
<Credit from central
bank (exogenous)>
<nIR (eskontna)>
<Interest Rate
(nominal)>
Prime Rate
<Interest Rate
(nominal)>
Interest paid byproducers to banks
(endogenous) <Debt
(Producers)>
Interest Paid
(Producers)
<Interest paid byproducers to banks
(exogenous)>
<Interest Paid
(Government)>
Interest Paid
(Consumers)
<Interest paid byconsumers to banks
(endogenous)>
Profit (Banks) <Interest paid by
Banks>
Distribution Ratio of
Wages (Banks)
<Saving><Cash Demand>
<Financial Investment (Securities)>
<Financial Investment (Shares)>
Foreign
Exchange
(Banks)
<Foreign
Exchange Sale><Foreign Exchange
Purchase>
Foreign
Exchange in
Foreign
Exchange out
<Export Goods>
<Earnings In>
<Assets Investment In>
<Liabilities Investment In>
<Capital Account Transfers In>
<Import Goods>
<Earnings Out>
<Assets Investment Out>
<Liabilities Investment Out>
<Capital Account Transfers Out>
<Dividends
Abroad>
<Initial Foreignassets>
<Deposits Out
(exogenous)><Deposits In
(exogenous)>
Debt (Banks)BORROWING
(Banks)PAYBACK
(Banks)
Banks Debt
Period
SWITCH (Borrowing
Debt Banks): exg/end
<Increase Credit from
central bank>
<Initial Credit from
central bank>
Financial Liabilities
AbroadForeign Financial Investment
from Abroad IN
Interest on Financial
Liabilities Abroad
<Interest on Financial
Liabilities Abroad>
<Foreign
Exchange Rate>
Foreign Financial Investment
from Abroad OUT
<Liabilities
Investment In><Liabilities
Investment Out>
<Foreign
Exchange Rate><Initial Foreign
liabilities>
Vault
Cash
(Banks)
Cash In Cash Out
<Deposits Out><Deposits In>
Reserves
(Banks)
Reserves Deposits
Adjusting
Reserves
Lending (Central
Bank-Reserves)
Government
Securities
(Banks)Securities purchased
by Banks
Securities sold by
Banks
Open Market
Operations
Loans to
Producers
(Banks)Lending (Banks)
<Payback
(Producers)>
<DesiredBorrowing
(Producer)>
<Initial Claims onNon-ficsal
corporations>
<Initial Claims on
Households><Payback
(Consumers)>
Loans to
Consumers
(Banks)<Borrowing
(Consumers)>
Security Holding
Ratio by Banks
Initial GovernmentSecurities<BORROWING
(Govrnment)>
<PAYBACK(Govrenment)>
<GovernmentSecurities
(Consumer)>
<Government
Securities
(Central Bank)>
Required Reserves
Required Reserve
Ratio
Excess Reserves
Excess Reserve
Ratio
Initial Required
Reserve Ratio
<Net Deposits>
<Deposits (Banks)>
<Lending
Distribution>
<BORROWING
(Banks)>Reserves
AT
<Excess
Reserves>
<Initial Reserves
with CNB>
<Securities sold by
Banks>
<Payback
(Producers)>
<Interest Income
(Banks)>
Cash Flow Deficit
(Banks)
Payment by Banks
<Interest paid by Banks>
<Wages (Banks)>
<PAYBACK (Banks)>
Foreign Cash out<Foreign
Exchange in>
<Foreign
Exchange Sale>
<Foreign
Exchange out>
Foreign Cash in<Foreign
Exchange out>
<Cash Out>
<Foreign Cash out>
<Reserves Deposits>
<Securities purchased
by Banks>
<Desired Borrowing
(Producer)><Payment by
Banks>
<Adjusting
Reserves>
Lending (Central
Bank-Cash)
Desired Borrowing
(Banks)
<BORROWING
(Banks)>
<Lending
Distribution>
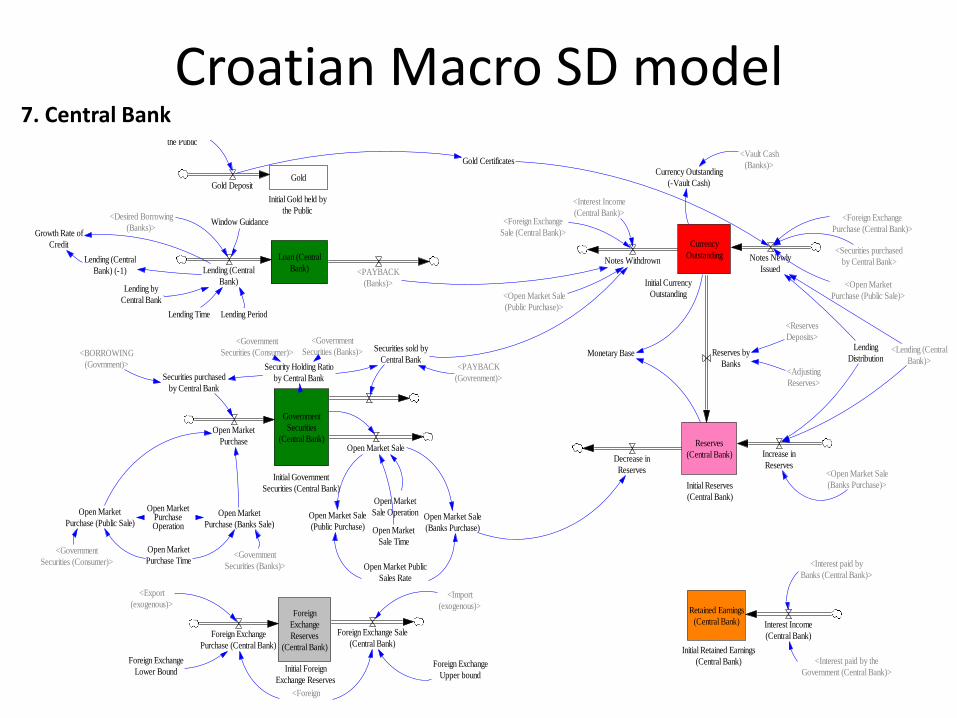
Croatian Macro SD model 7. Central Bank
Government
Securities
(Central Bank)
Lending
Distribution
GoldGold Deposit
Gold Deposit by
the Public
Initial Gold held by
the Public
Loan (Central
Bank)Lending (Central
Bank)<PAYBACK
(Banks)>
<Desired Borrowing
(Banks)>Window Guidance
Lending by
Central Bank
Lending Time Lending Period
Lending (Central
Bank) (-1)
Growth Rate of
Credit
Open Market
PurchaseOpen Market Sale
Security Holding Ratio
by Central Bank
Securities sold by
Central Bank
<Government
Securities (Consumer)>
<Government
Securities (Banks)>
Securities purchased
by Central Bank
<BORROWING
(Govrnment)>
Initial Government
Securities (Central Bank)
<PAYBACK
(Govrenment)>
Open Market
Purchase (Public Sale)Open Market
Purchase (Banks Sale)
Open MarketPurchaseOperation
Open Market
Purchase Time<Government
Securities (Consumer)><Government
Securities (Banks)>
Open Market Sale
(Public Purchase)Open Market Sale
(Banks Purchase)
Open Market
Sale Operation
Open Market
Sale Time
Open Market Public
Sales Rate
Foreign
Exchange
Reserves
(Central Bank)
Foreign Exchange
Purchase (Central Bank)
Foreign Exchange Sale
(Central Bank)
<Export
(exogenous)><Import
(exogenous)>
Foreign Exchange
Lower BoundForeign Exchange
Upper bound
<Foreign
Exchange Rate>
Initial Foreign
Exchange Reserves
Currency
Outstanding Notes Newly
IssuedNotes Withdrown
Reserves
(Central Bank)
Reserves by
Banks
Increase in
ReservesDecrease in
Reserves
Retained Earnings
(Central Bank) Interest Income
(Central Bank)
<Interest paid by
Banks (Central Bank)>
<Interest paid by the
Government (Central Bank)>
Initial Retained Earnings
(Central Bank)
<Open Market Sale
(Banks Purchase)>Initial Reserves
(Central Bank)
<Interest Income
(Central Bank)><Foreign Exchange
Sale (Central Bank)>
<Open Market Sale
(Public Purchase)>
Monetary Base
<Reserves
Deposits>
<Adjusting
Reserves>
Initial Currency
Outstanding
<Vault Cash
(Banks)>Currency Outstanding
(-Vault Cash)
<Open Market
Purchase (Public Sale)>
<Foreign Exchange
Purchase (Central Bank)>
<Securities purchased
by Central Bank>
Gold Certificates
<Lending (Central
Bank)>
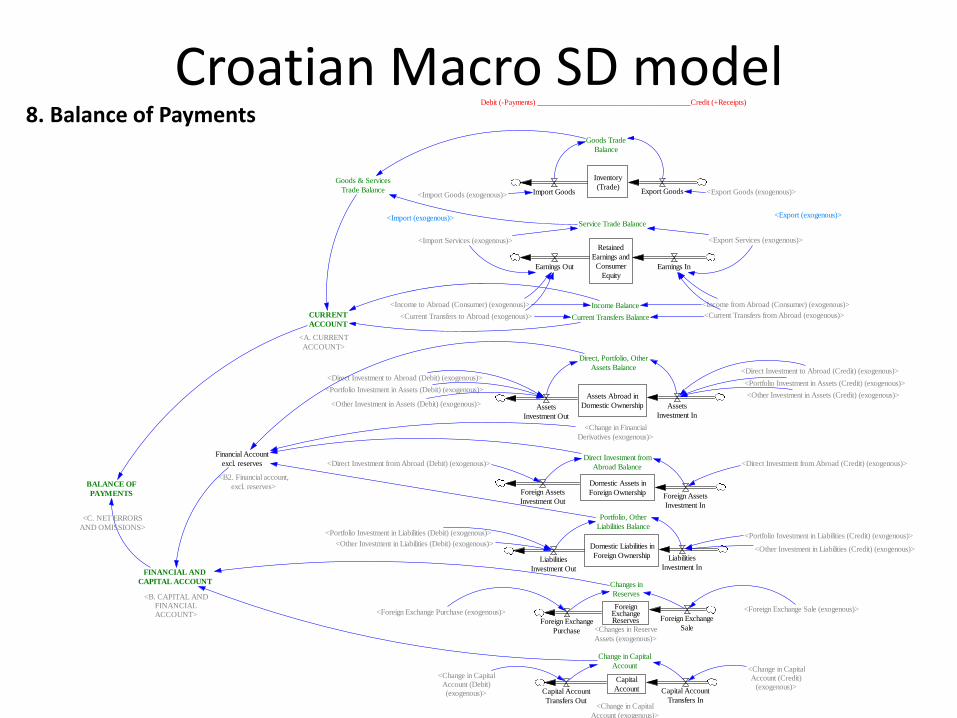
Croatian Macro SD model 8. Balance of Payments
Inventory
(Trade)<Import Goods (exogenous)> <Export Goods (exogenous)>
Goods Trade
Balance
Retained
Earnings and
Consumer
Equity
Debit (-Payments) _______________________________________Credit (+Receipts)
Earnings InEarnings Out
<Export Services (exogenous)>
<Income from Abroad (Consumer) (exogenous)>
<Current Transfers from Abroad (exogenous)>
<Import Services (exogenous)>
<Income to Abroad (Consumer) (exogenous)>
<Current Transfers to Abroad (exogenous)>
Service Trade Balance
Income Balance
Current Transfers Balance
Import Goods Export Goods
Domestic Liabilities in
Foreign Ownership
Goods & Services
Trade Balance
CURRENT
ACCOUNT
<A. CURRENT
ACCOUNT>
<Direct Investment from Abroad (Credit) (exogenous)>
<Direct Investment to Abroad (Credit) (exogenous)>
<Direct Investment from Abroad (Debit) (exogenous)>
<Direct Investment to Abroad (Debit) (exogenous)><Portfolio Investment in Assets (Credit) (exogenous)>
<Portfolio Investment in Liabilities (Credit) (exogenous)>
<Portfolio Investment in Assets (Debit) (exogenous)>
<Portfolio Investment in Liabilities (Debit) (exogenous)>
<Other Investment in Assets (Credit) (exogenous)>
<Other Investment in Liabilities (Credit) (exogenous)>
<Other Investment in Assets (Debit) (exogenous)>
<Other Investment in Liabilities (Debit) (exogenous)>
<Change in Financial
Derivatives (exogenous)>
<Change in Capital
Account (exogenous)>
<Changes in Reserve
Assets (exogenous)>
<Foreign Exchange Purchase (exogenous)> <Foreign Exchange Sale (exogenous)>
Direct, Portfolio, Other
Assets Balance
Assets Abroad in
Domestic Ownership
Portfolio, Other
Liabilities Balance
Financial Account
excl. reserves
<B2. Financial account,
excl. reserves>
ForeignExchangeReserves
Changes in
Reserves
BALANCE OF
PAYMENTS
FINANCIAL AND
CAPITAL ACCOUNT
<B. CAPITAL ANDFINANCIALACCOUNT>
<C. NET ERRORS
AND OMISSIONS>
Capital
Account
<Change in CapitalAccount (Credit)
(exogenous)>
<Change in CapitalAccount (Debit)(exogenous)>
Change in Capital
Account
Assets
Investment InAssets
Investment Out
Liabilities
Investment InLiabilities
Investment Out
Foreign Exchange
SaleForeign Exchange
Purchase
Capital Account
Transfers InCapital Account
Transfers Out
Domestic Assets in
Foreign Ownership Foreign Assets
Investment In
Foreign Assets
Investment Out
Direct Investment from
Abroad Balance
<Export (exogenous)><Import (exogenous)>
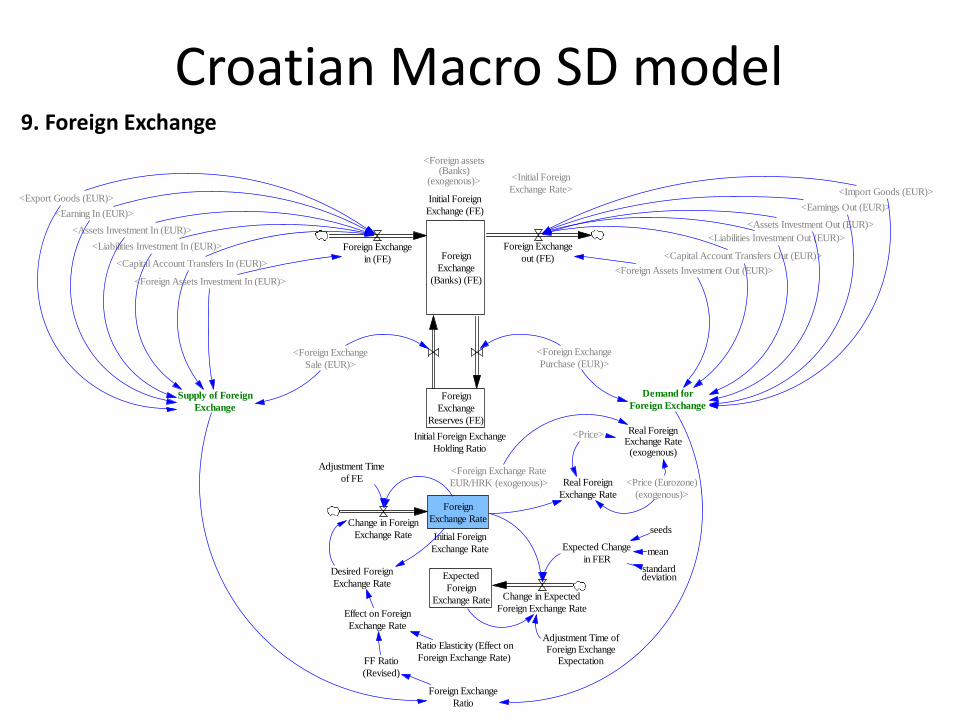
Croatian Macro SD model 9. Foreign Exchange
Foreign
Exchange
(Banks) (FE)
Foreign Exchange
in (FE)
Foreign Exchange
out (FE)
Foreign
Exchange
Reserves (FE)
Supply of Foreign
Exchange
Demand for
Foreign Exchange
Initial Foreign Exchange
Holding Ratio
Initial Foreign
Exchange (FE)
<Foreign assets(Banks)
(exogenous)>
Foreign
Exchange Rate
Expected
Foreign
Exchange Rate
Initial Foreign
Exchange Rate
Change in Foreign
Exchange Rate
Change in Expected
Foreign Exchange Rate
Adjustment Time
of FE
Desired Foreign
Exchange Rate
Effect on Foreign
Exchange Rate
Ratio Elasticity (Effect on
Foreign Exchange Rate)
Foreign Exchange
Ratio
FF Ratio
(Revised)
Adjustment Time ofForeign Exchange
Expectation
Expected Change
in FER
Real Foreign
Exchange Rate
seeds
mean
standarddeviation
<Price (Eurozone)
(exogenous)>
<Price>
<Foreign Exchange Rate
EUR/HRK (exogenous)>
<Export Goods (EUR)>
<Earning In (EUR)>
<Assets Investment In (EUR)>
<Liabilities Investment In (EUR)>
<Capital Account Transfers In (EUR)>
<Import Goods (EUR)>
<Assets Investment Out (EUR)>
<Liabilities Investment Out (EUR)>
<Capital Account Transfers Out (EUR)>
<Earnings Out (EUR)>
<Foreign Exchange
Sale (EUR)>
<Foreign Exchange
Purchase (EUR)>
<Initial Foreign
Exchange Rate>
<Foreign Assets Investment In (EUR)><Foreign Assets Investment Out (EUR)>
Real ForeignExchange Rate(exogenous)
GDP
600 B
480 B
360 B
240 B
120 B
0
4
44
4
4
4
4
4
4
3
3
3
3
3
3
33
3
3
2
2
2
2
2
2
2
2 2 2
1
1
1
1
1
1 1 1 1
2000 2002 2004 2006 2008 2010 2012 2014
Time (year)
GDP : # 1 1 1 1 1 1 1 1 1 1
"GDP (exogenous)" : # 2 2 2 2 2 2 2 2
"Full Capacity GDP (nominal)" : # 3 3 3 3 3 3 3
"Potential GDP (nominal)" : # 4 4 4 4 4 4
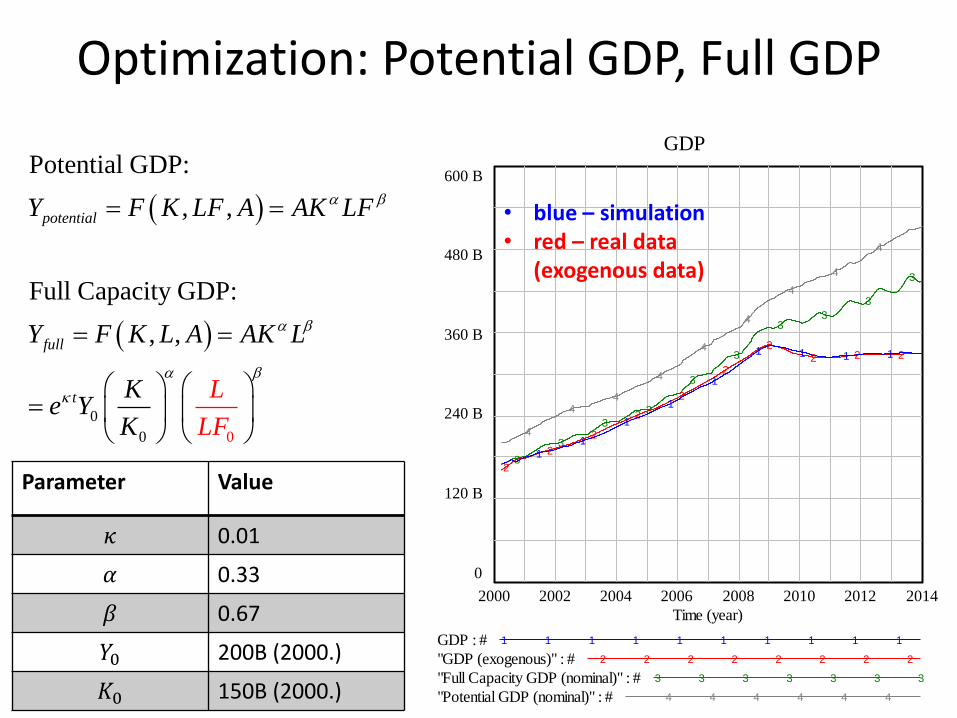
Optimization: Potential GDP, Full GDP
0
0 0
Potential GDP:
, ,
Full Capacity GDP:
, ,
potential
full
t
Y F K LF A AK LF
Y F K L A A
L
K L
Ke Y
K LF
Parameter Value
𝜅 0.01
𝛼 0.33
𝛽 0.67
𝑌0 200B (2000.)
𝐾0 150B (2000.)
• blue – simulation • red – real data
(exogenous data)
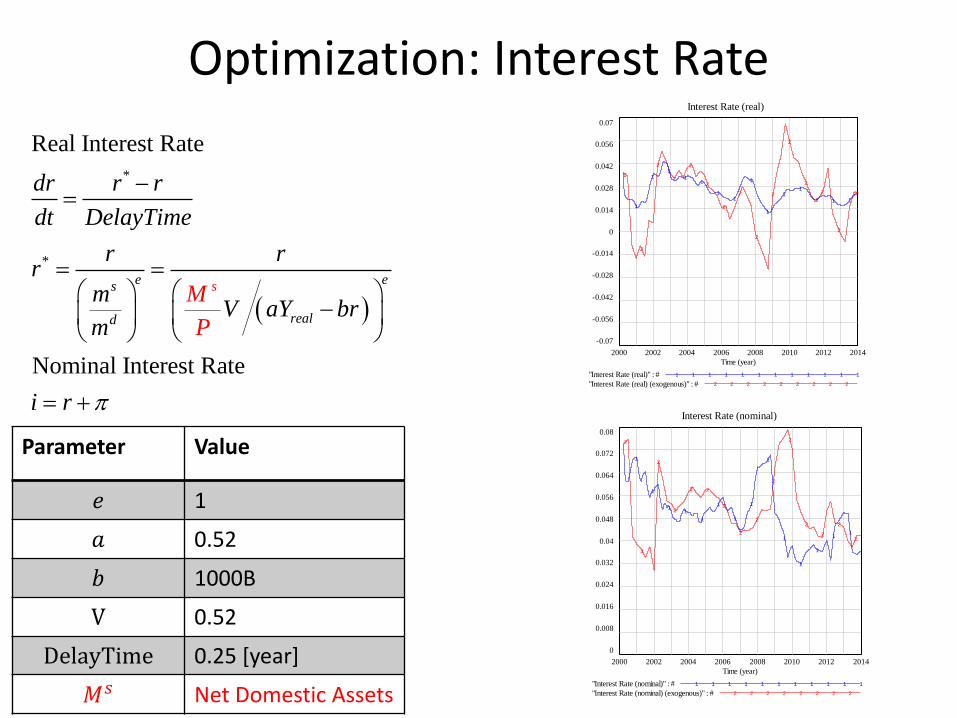
Optimization: Interest Rate
*
*
Real Interest Rate
Nominal Interest Rate
e es
r
s
eald
dr r r
dt DelayTime
r
M
P
rr
mV aY br
m
i r
Parameter Value
𝑒 1
𝑎 0.52
𝑏 1000B
V 0.52
DelayTime 0.25 [year]
𝑀𝑠 Net Domestic Assets
Interest Rate (real)
0.07
0.056
0.042
0.028
0.014
0
-0.014
-0.028
-0.042
-0.056
-0.07
2
2
2
2
2
2
2
2
2
2
2
2
2
2
2
1
11
11
11
1
1
11
1 1 1
2000 2002 2004 2006 2008 2010 2012 2014
Time (year)
"Interest Rate (real)" : # 1 1 1 1 1 1 1 1 1 1 1 1
"Interest Rate (real) (exogenous)" : # 2 2 2 2 2 2 2 2 2
Interest Rate (nominal)
0.08
0.072
0.064
0.056
0.048
0.04
0.032
0.024
0.016
0.008
0
2
2
2
2
2 2
2
2
2
2
2
2
2
2
2
1
1
11
1
1
1
1
1
1
1
1
11
2000 2002 2004 2006 2008 2010 2012 2014
Time (year)
"Interest Rate (nominal)" : # 1 1 1 1 1 1 1 1 1 1 1
"Interest Rate (nominal) (exogenous)" : # 2 2 2 2 2 2 2 2
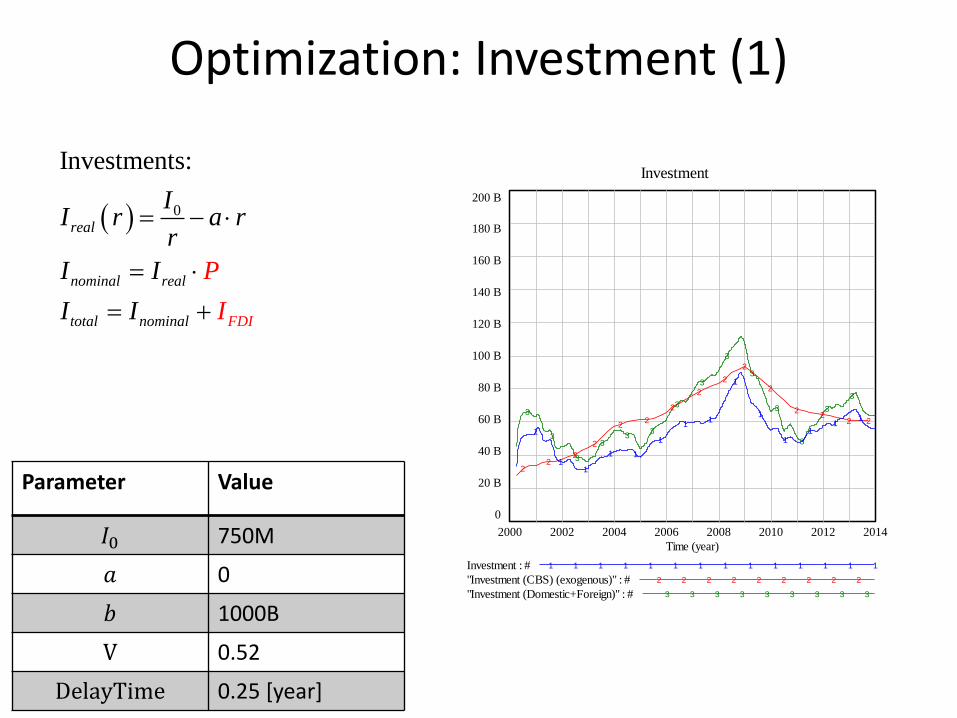
Optimization: Investment (1)
0
Investments:
real
nominal real
total nomina Il FD
II r a r
r
I I
I
P
II
Parameter Value
𝐼0 750M
𝑎 0
𝑏 1000B
V 0.52
DelayTime 0.25 [year]
Investment
200 B
180 B
160 B
140 B
120 B
100 B
80 B
60 B
40 B
20 B
0
3
3
3
33
3
3
3
3
3
3
3
3
3
22
2
2
22
2
2
2
2
2
22
2 2
1
11
1 1
1
11
1
1
11
11
2000 2002 2004 2006 2008 2010 2012 2014
Time (year)
Investment : # 1 1 1 1 1 1 1 1 1 1 1 1 1 1
"Investment (CBS) (exogenous)" : # 2 2 2 2 2 2 2 2 2
"Investment (Domestic+Foreign)" : # 3 3 3 3 3 3 3 3 3
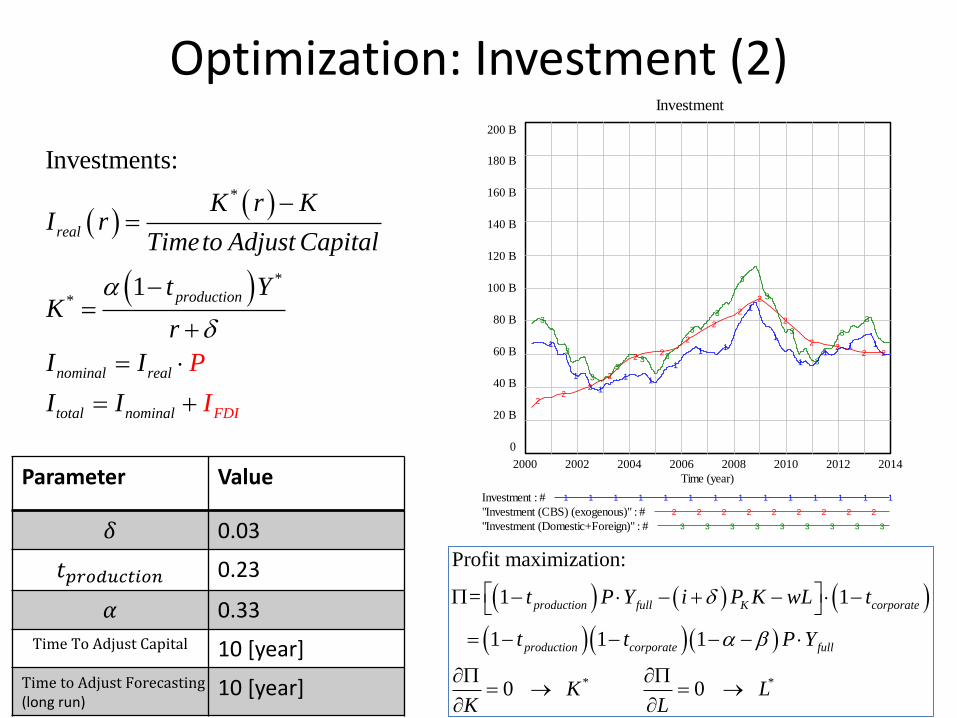
Optimization: Investment (2)
*
*
*
Investments:
1
real
production
nominal real
total nominal FDI
K r KI
P
rTimeto Adjust Capital
t YK
r
I I
I II
Parameter Value
𝛿 0.03
𝑡𝑝𝑟𝑜𝑑𝑢𝑐𝑡𝑖𝑜𝑛 0.23
𝛼 0.33
Time To Adjust Capital 10 [year]
Time to Adjust Forecasting (long run)
10 [year]
* *
Profit maximization:
= 1 1
1 1 1
0 0
production full K corporate
production corporate full
t P Y i P K wL t
t t P Y
K LK L
Investment
200 B
180 B
160 B
140 B
120 B
100 B
80 B
60 B
40 B
20 B
0
3
3
3
33 3
3
3
3
3
3
3
3
3
22
2
2
22
2
2
2
2
2
22
2 21
1
1
1 1
1
1 1
1
1
1
11 1
2000 2002 2004 2006 2008 2010 2012 2014
Time (year)
Investment : # 1 1 1 1 1 1 1 1 1 1 1 1 1 1
"Investment (CBS) (exogenous)" : # 2 2 2 2 2 2 2 2 2
"Investment (Domestic+Foreign)" : # 3 3 3 3 3 3 3 3 3
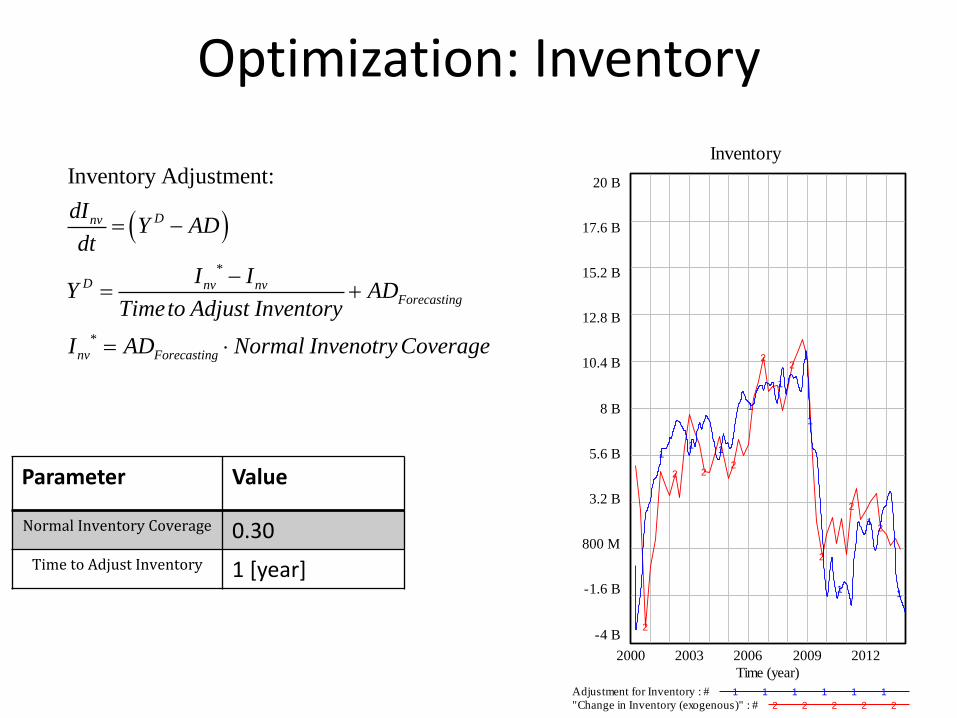
Optimization: Inventory
*
*
Inventory Adjustment:
Dnv
D nv nvForecasting
nv Forecasting
dIY AD
dt
I IY AD
Timeto Adjust Inventory
I AD Normal Invenotry Coverage
Parameter Value
Normal Inventory Coverage 0.30
Time to Adjust Inventory 1 [year]
Inventory
20 B
17.6 B
15.2 B
12.8 B
10.4 B
8 B
5.6 B
3.2 B
800 M
-1.6 B
-4 B2
2 22
22
2
2
2
11 1
1
1
1
1
1
1
2000 2003 2006 2009 2012
Time (year)
Adjustment for Inventory : # 1 1 1 1 1 1
"Change in Inventory (exogenous)" : # 2 2 2 2 2
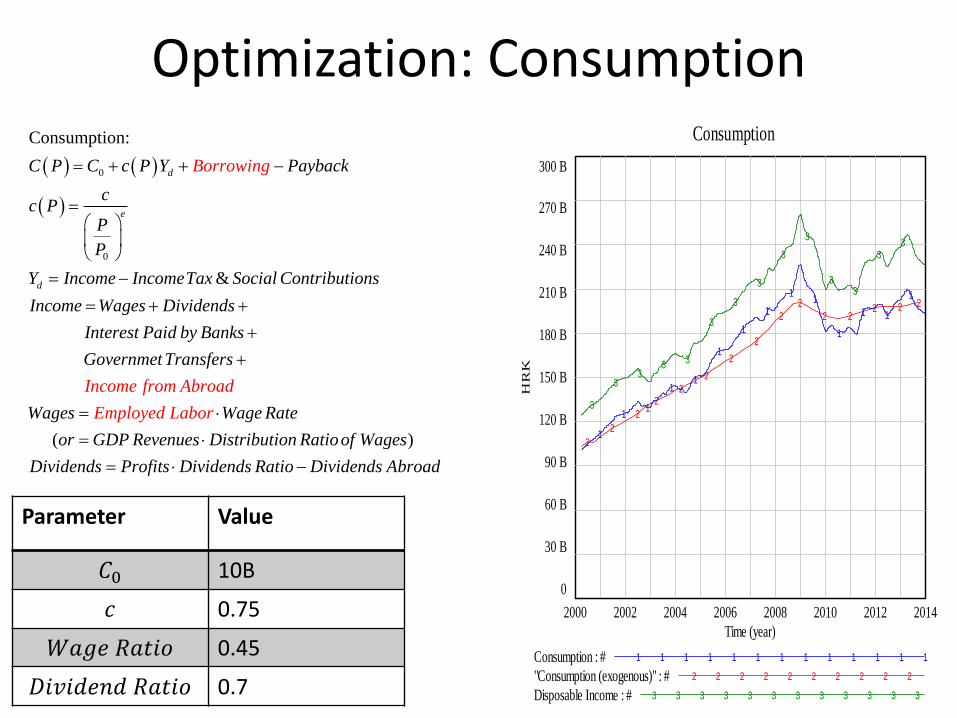
Optimization: Consumption
0
0
Consumption:
&
(
d
e
d
C P C c P Y Payback
cc P
P
P
Y Income IncomeTax Social Contributions
Income Wages Dividends
Interest Paid by Banks
Gove
Borrowing
Income from Abroa
rnmet Transfers
Wages Wage Ra
d
Employe a ted L bor
)or GDP Revenues Distribution Ratioof Wages
Dividends Profits Dividends Ratio Dividends Abroad
Parameter Value
𝐶0 10B
𝑐 0.75
𝑊𝑎𝑔𝑒 𝑅𝑎𝑡𝑖𝑜 0.45
𝐷𝑖𝑣𝑖𝑑𝑒𝑛𝑑 𝑅𝑎𝑡𝑖𝑜 0.7
Consumption
300 B
270 B
240 B
210 B
180 B
150 B
120 B
90 B
60 B
30 B
0
3
33
3 3
3
3
3
3
3
33
33
2
2
2
22
2
2
2
2
2
2 22 2 2
1
11
11
1
1
1
11
1
1 1
1
2000 2002 2004 2006 2008 2010 2012 2014
Time (year)
HR
K
Consumption : # 1 1 1 1 1 1 1 1 1 1 1 1 1
"Consumption (exogenous)" : # 2 2 2 2 2 2 2 2 2 2
Disposable Income : # 3 3 3 3 3 3 3 3 3 3 3 3
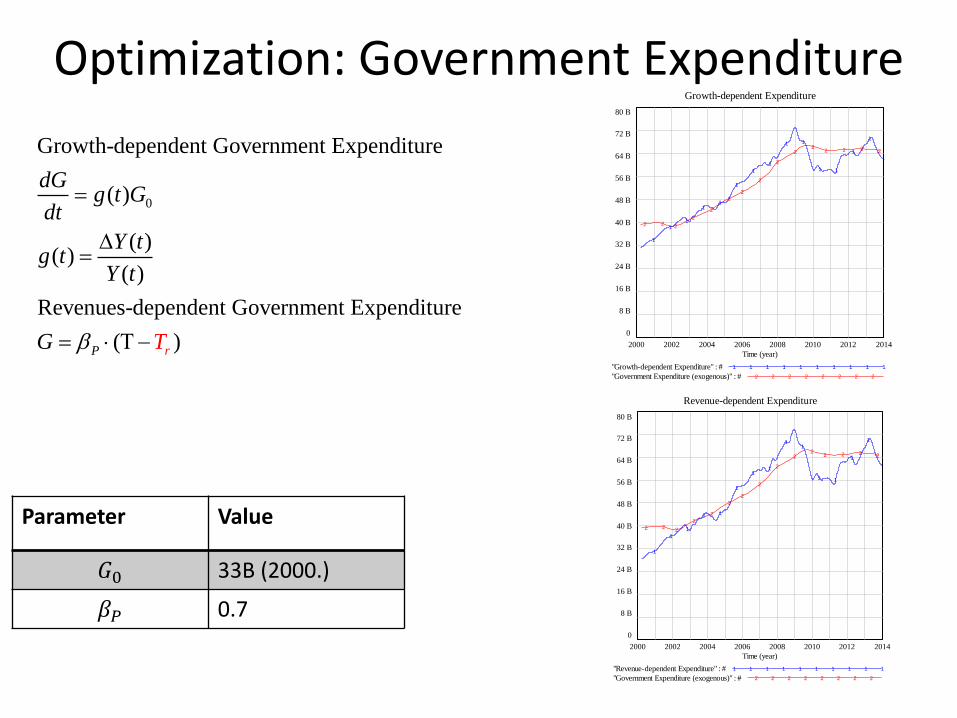
Optimization: Government Expenditure
0
Growth-dependent Government Expenditure
( )
( )( )
( )
Revenues-dependent Government Expenditure
( )rP
dGg t G
dt
Y tg t
Y t
G T
Parameter Value
𝐺0 33B (2000.)
𝛽𝑃 0.7
Growth-dependent Expenditure
80 B
72 B
64 B
56 B
48 B
40 B
32 B
24 B
16 B
8 B
0
2 2 2
2
2
2
2
2
2
22
2 2 2 2
1
1
1
11
1
1
1
1 1
1 1
1
1
2000 2002 2004 2006 2008 2010 2012 2014
Time (year)
"Growth-dependent Expenditure" : # 1 1 1 1 1 1 1 1 1 1
"Government Expenditure (exogenous)" : # 2 2 2 2 2 2 2 2
Revenue-dependent Expenditure
80 B
72 B
64 B
56 B
48 B
40 B
32 B
24 B
16 B
8 B
0
2 2 2
2
2
2
2
2
2
22
2 2 2 2
1
1
1
1 1
1
11
11
1 1
1
1
2000 2002 2004 2006 2008 2010 2012 2014
Time (year)
"Revenue-dependent Expenditure" : # 1 1 1 1 1 1 1 1 1 1
"Government Expenditure (exogenous)" : # 2 2 2 2 2 2 2 2
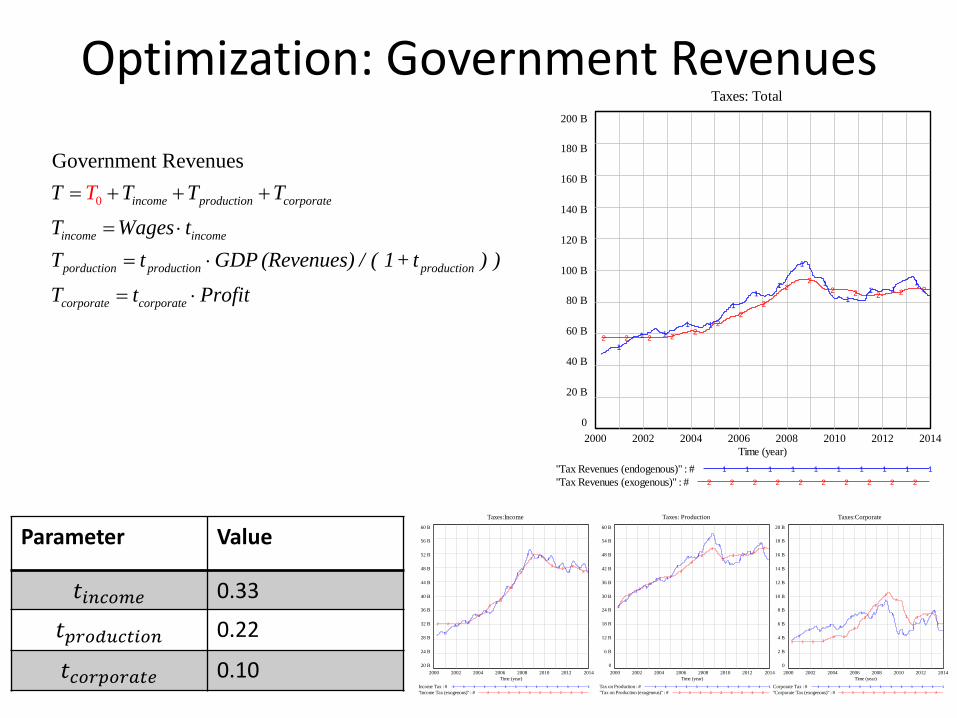
Optimization: Government Revenues
0
Government Revenues
income production corporate
income income
porduction production production
corporate corporate
T T T T
T Wages t
T t GDP (Revenues) / ( 1 + t ) )
T t Profit
T
Parameter Value
𝑡𝑖𝑛𝑐𝑜𝑚𝑒 0.33
𝑡𝑝𝑟𝑜𝑑𝑢𝑐𝑡𝑖𝑜𝑛 0.22
𝑡𝑐𝑜𝑟𝑝𝑜𝑟𝑎𝑡𝑒 0.10
Taxes: Total
200 B
180 B
160 B
140 B
120 B
100 B
80 B
60 B
40 B
20 B
0
2 2 2 22
2
2
2
22
2 2 2 2 2
1
1 1
1 1
1
11
1
1
1
1 11
2000 2002 2004 2006 2008 2010 2012 2014
Time (year)
"Tax Revenues (endogenous)" : # 1 1 1 1 1 1 1 1 1 1
"Tax Revenues (exogenous)" : # 2 2 2 2 2 2 2 2 2 2
Taxes: Production
60 B
54 B
48 B
42 B
36 B
30 B
24 B
18 B
12 B
6 B
0
2
2
2
2
22
2
2
2
2
22 2
2
2
1
1
1
1 1
1
11
1
1
1
1
1
1
2000 2002 2004 2006 2008 2010 2012 2014
Time (year)
Tax on Production : # 1 1 1 1 1 1 1 1 1 1 1 1
"Tax on Production (exogenous)" : # 2 2 2 2 2 2 2 2 2
Taxes:Income
60 B
56 B
52 B
48 B
44 B
40 B
36 B
32 B
28 B
24 B
20 B
2 2 2 2
2
2
2
2
2
22
22
2
2
1
11
11
1
1
1
11
1
1
11
2000 2002 2004 2006 2008 2010 2012 2014
Time (year)
Income Tax : # 1 1 1 1 1 1 1 1 1 1 1 1 1 1
"Income Tax (exogenous)" : # 2 2 2 2 2 2 2 2 2 2
Taxes:Corporate
20 B
18 B
16 B
14 B
12 B
10 B
8 B
6 B
4 B
2 B
0
2 2 2 2
2 2
2
2
2
2
2
2 22
2
1
1 1
1 1
1
1
1
1
1
1
1
1
1
2000 2002 2004 2006 2008 2010 2012 2014
Time (year)
Corporate Tax : # 1 1 1 1 1 1 1 1 1 1 1 1 1
"Corporate Tax (exogenous)" : # 2 2 2 2 2 2 2 2 2 2
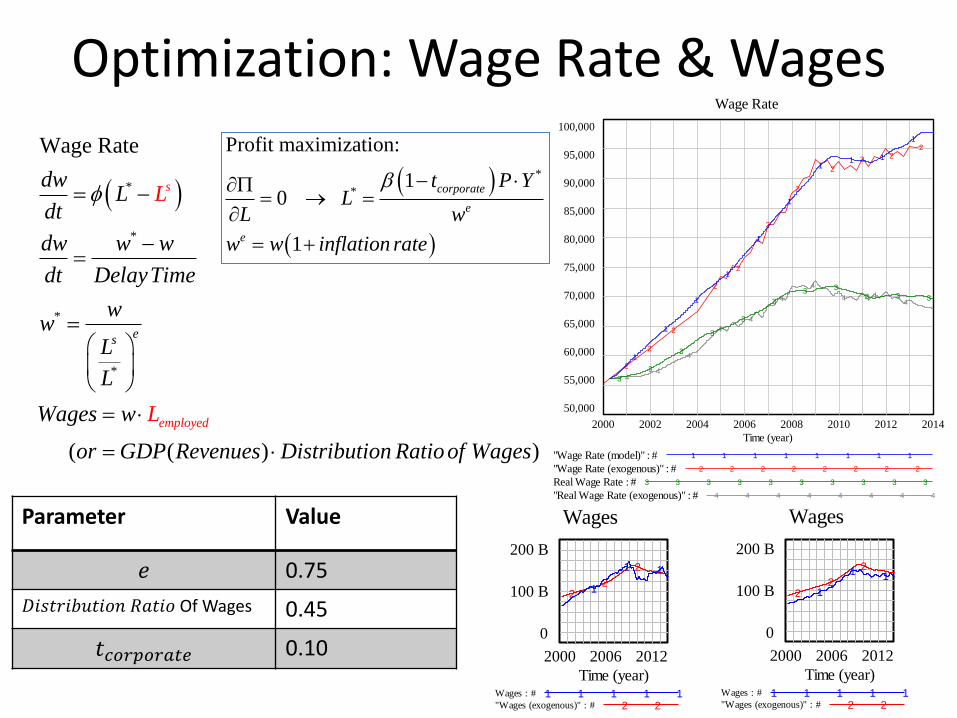
Optimization: Wage Rate & Wages
*
*
*
*
Wage Rate
( ( ) )
s
employe
s
d
e
dwL
dt
dw w w
dt DelayTime
ww
L
L
Wages w
or GDP Revenues Distribution Ratioof W
L
L
ages
Wages
200 B
100 B
0
22
2
1
1 1
2000 2006 2012
Time (year)Wages : # 1 1 1 1 1"Wages (exogenous)" : # 2 2
Wages
200 B
100 B
0
22
2
1
1 1
2000 2006 2012
Time (year)Wages : # 1 1 1 1 1"Wages (exogenous)" : # 2 2
Parameter Value
𝑒 0.75
𝐷𝑖𝑠𝑡𝑟𝑖𝑏𝑢𝑡𝑖𝑜𝑛 𝑅𝑎𝑡𝑖𝑜 Of Wages 0.45
𝑡𝑐𝑜𝑟𝑝𝑜𝑟𝑎𝑡𝑒 0.10
Wage Rate
100,000
95,000
90,000
85,000
80,000
75,000
70,000
65,000
60,000
55,000
50,000
44
4
4
4
4
4
4 44
3
3
3
3
3
3
3 3
3 3 3
2
2
2
2
2
2
2
2
2 22
1
1
1
1
1
1
11 1
1
2000 2002 2004 2006 2008 2010 2012 2014
Time (year)
"Wage Rate (model)" : # 1 1 1 1 1 1 1 1
"Wage Rate (exogenous)" : # 2 2 2 2 2 2 2 2
Real Wage Rate : # 3 3 3 3 3 3 3 3 3 3
"Real Wage Rate (exogenous)" : # 4 4 4 4 4 4 4 4
*
*
Profit maximization:
10
1
corporate
e
e
t P YL
L w
w w inflation rate
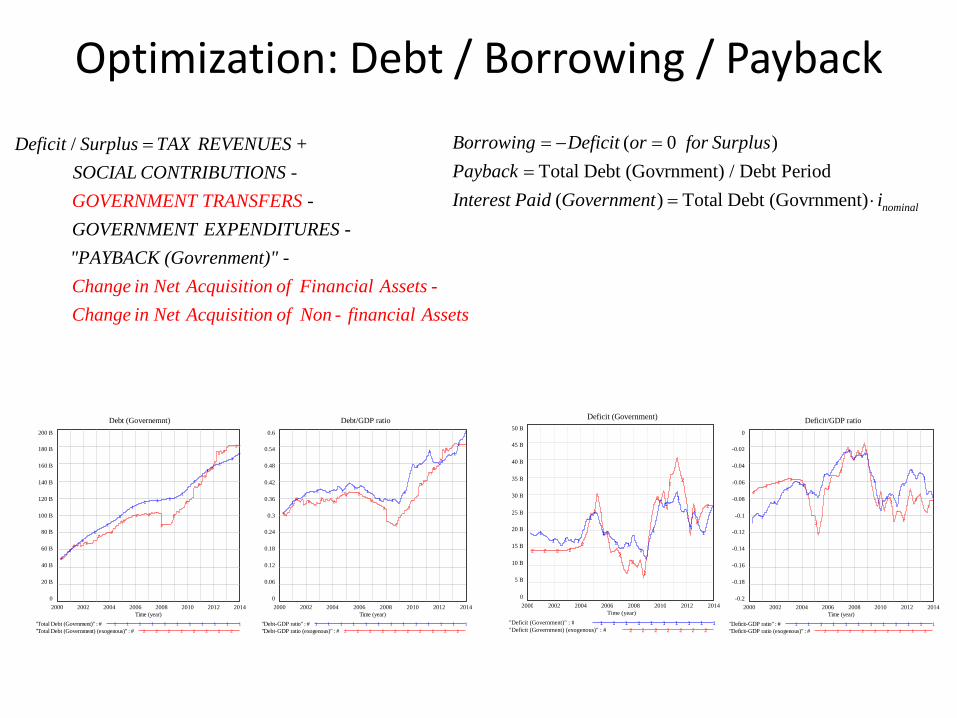
Optimization: Debt / Borrowing / Payback
/Deficit Surplus TAX REVENUES +
SOCIAL CONTRIBUTIONS -
-
GOVERNMENT EXPENDITURES -
GOVERNMENT TRANSFERS
Change in Net Acquisition of Financial Assets -
"PAYBACK (Govrenment)" -
Change in Net Acquisi n
tio
of Non - financial Assets
( 0 )
Total Debt (Govrnment) / Debt Period
( ) Total Debt (Govrnment) nominal
Borrowing Deficit or for Surplus
Payback
Interest Paid Government i
Debt (Governemnt)
200 B
180 B
160 B
140 B
120 B
100 B
80 B
60 B
40 B
20 B
0
2
22
22
2
2 2
2
2
2
2
2
2
2
1
1
1
1
1
1
1 1 1
1
1
1
1
1
2000 2002 2004 2006 2008 2010 2012 2014
Time (year)
"Total Debt (Govrnment)" : # 1 1 1 1 1 1 1 1 1 1 1
"Total Debt (Government) (exogenous)" : # 2 2 2 2 2 2 2 2
Debt/GDP ratio
0.6
0.54
0.48
0.42
0.36
0.3
0.24
0.18
0.12
0.06
0
2
22
22
2 2
2
2
2
2
2
2
2
2
1
11 1 1
11
1 1
1
1
1
1
1
2000 2002 2004 2006 2008 2010 2012 2014
Time (year)
"Debt-GDP ratio" : # 1 1 1 1 1 1 1 1 1 1 1 1 1
"Debt-GDP ratio (exogenous)" : # 2 2 2 2 2 2 2 2 2 2
Deficit (Government) 50 B
45 B
40 B
35 B
30 B
25 B
20 B
15 B
10 B
5 B
0
2 2 2 2 2
2
2
2 2
2
2
2 2
2 2
1 1 1 1
1
1 1 1
1
1
1 1
1 1
2000 2002 2004 2006 2008 2010 2012 2014 Time (year)
"Deficit (Government)" : # 1 1 1 1 1 1 1 1 1 1 "Deficit (Government) (exogenous)" : # 2 2 2 2 2 2 2
Deficit/GDP ratio
0
-0.02
-0.04
-0.06
-0.08
-0.1
-0.12
-0.14
-0.16
-0.18
-0.2
2
22
2
2
2
2
2
2
2
2 2
2
2
2
1
1
1
1
1
1
1
1
1
1
11
1
1
2000 2002 2004 2006 2008 2010 2012 2014
Time (year)
"Deficit-GDP ratio" : # 1 1 1 1 1 1 1 1 1 1 1 1
"Deficit-GDP ratio (exogenous)" : # 2 2 2 2 2 2 2 2 2
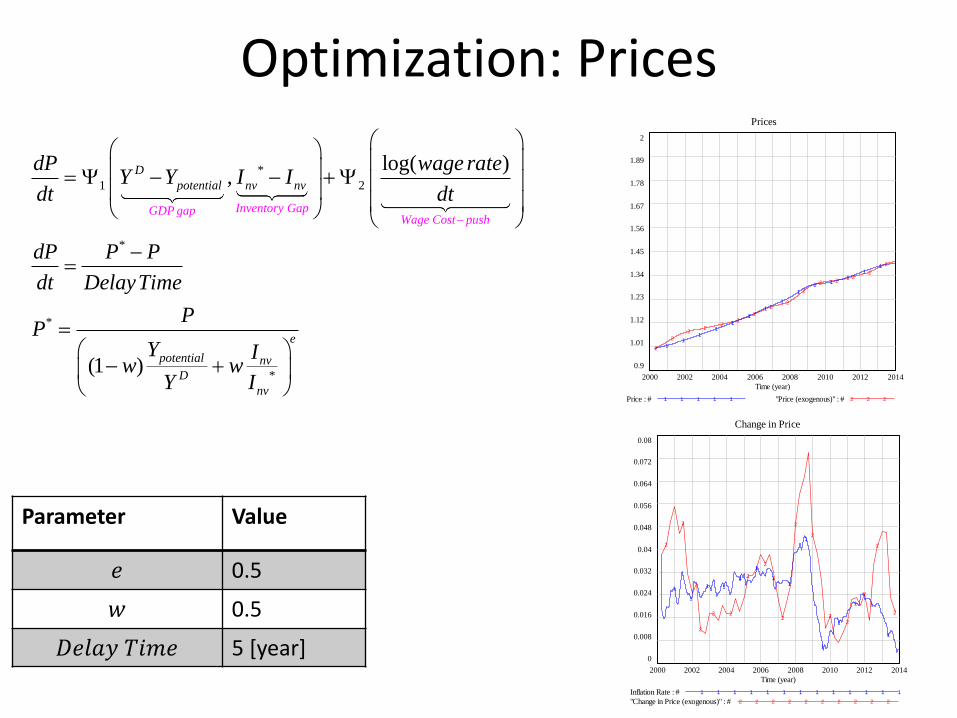
Optimization: Prices
*
1 2
*
*
*
log( ),
(1 )
Inventory GapGDP gapWa
D
potential nv nv
e
ge Cost push
potential nv
D
nv
dP wage rateY Y I I
dt dt
dP P P
dt DelayTime
PP
Y Iw w
Y I
Parameter Value
𝑒 0.5
𝑤 0.5
𝐷𝑒𝑙𝑎𝑦 𝑇𝑖𝑚𝑒 5 [year]
Prices
2
1.89
1.78
1.67
1.56
1.45
1.34
1.23
1.12
1.01
0.9
2
2
22
22
2
22
2
2 22
2
2
11
11
1
1
1
1
1
1 11
11
2000 2002 2004 2006 2008 2010 2012 2014
Time (year)
Price : # 1 1 1 1 1 "Price (exogenous)" : # 2 2 2
Change in Price
0.08
0.072
0.064
0.056
0.048
0.04
0.032
0.024
0.016
0.008
0
2
2
2
2 2
2
2
2
2
2
22
2
2
2
1
1
1 1
1
1
11
1
1
1
1 1
1
2000 2002 2004 2006 2008 2010 2012 2014
Time (year)
Inflation Rate : # 1 1 1 1 1 1 1 1 1 1 1 1 1
"Change in Price (exogenous)" : # 2 2 2 2 2 2 2 2 2 2
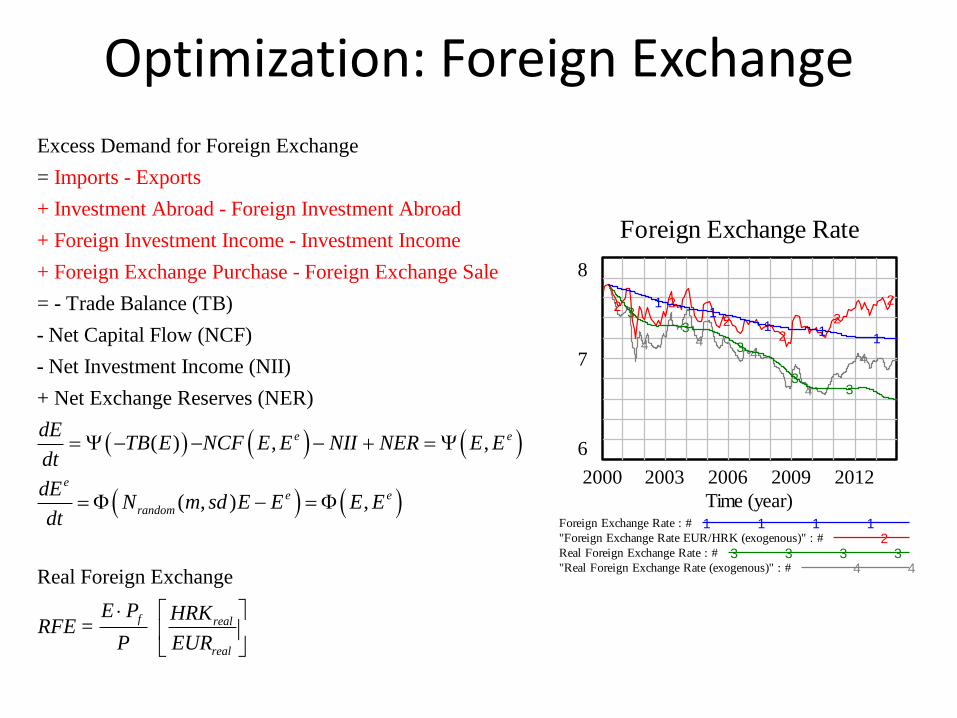
Optimization: Foreign Exchange
Imports - Exports
+ Investment Abroad - Foreign Investment Abroad
+ Foreign Investment Income - Investment Income
+ Foreign Exchange
Excess Demand for Foreign Exchan
Purchase - Foreign Exchange Sa
ge
=
le
=
- Trade Balance (TB)
- Net Capital Flow (NCF)
- Net Investment Income (NII)
+ Net Exchange Reserves (NER)
( ) , ,
( , ) ,
Real Foreign Exchange
e e
ee e
random
f r
dETB E NCF E E NII NER E E
dt
dEN m sd E E E E
dt
E P HRKRFE =
P
eal
realEUR
Foreign Exchange Rate
8
7
6
4 44
4
4
33
3
33
2 2
22
2
211
1 11
2000 2003 2006 2009 2012
Time (year)Foreign Exchange Rate : # 1 1 1 1"Foreign Exchange Rate EUR/HRK (exogenous)" : # 2Real Foreign Exchange Rate : # 3 3 3 3"Real Foreign Exchange Rate (exogenous)" : # 4 4
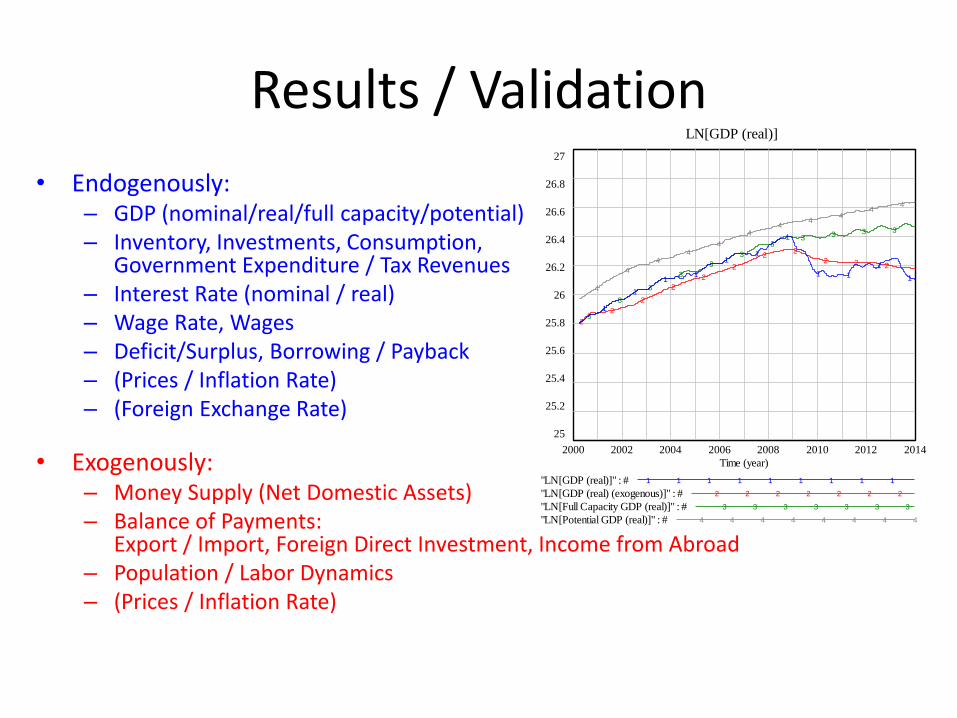
Results / Validation
• Endogenously: – GDP (nominal/real/full capacity/potential) – Inventory, Investments, Consumption,
Government Expenditure / Tax Revenues – Interest Rate (nominal / real) – Wage Rate, Wages – Deficit/Surplus, Borrowing / Payback – (Prices / Inflation Rate) – (Foreign Exchange Rate)
• Exogenously: – Money Supply (Net Domestic Assets) – Balance of Payments:
Export / Import, Foreign Direct Investment, Income from Abroad – Population / Labor Dynamics – (Prices / Inflation Rate)
LN[GDP (real)]
27
26.8
26.6
26.4
26.2
26
25.8
25.6
25.4
25.2
25
4
4
44
4
44
44
44
3
3
3
3
3
3
33 3 3 3
2
2
2
2
2
2
22
2 2 2
1
1
11
11
1
1 1
1
1
2000 2002 2004 2006 2008 2010 2012 2014
Time (year)
"LN[GDP (real)]" : # 1 1 1 1 1 1 1 1 1
"LN[GDP (real) (exogenous)]" : # 2 2 2 2 2 2 2
"LN[Full Capacity GDP (real)]" : # 3 3 3 3 3 3 3
"LN[Potential GDP (real)]" : # 4 4 4 4 4 4 4 4
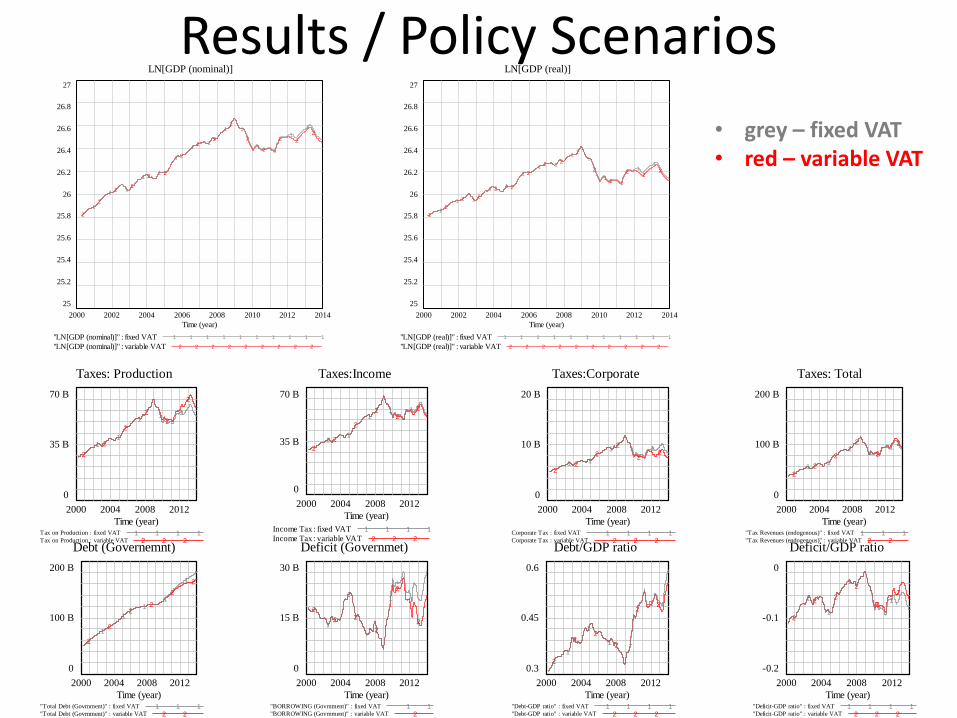
Results / Policy Scenarios LN[GDP (nominal)]
27
26.8
26.6
26.4
26.2
26
25.8
25.6
25.4
25.2
25
2
2
22
22
2
22
2
2
2
2 2
2
1
11
11
1
11
1 1
11
1
1
2000 2002 2004 2006 2008 2010 2012 2014
Time (year)
"LN[GDP (nominal)]" : fixed VAT 1 1 1 1 1 1 1 1 1 1
"LN[GDP (nominal)]" : variable VAT 2 2 2 2 2 2 2 2 2
LN[GDP (real)]
27
26.8
26.6
26.4
26.2
26
25.8
25.6
25.4
25.2
25
2
2
2 2
2 2
2
2 2
2
2
2
22
2
1
1 1
1 1
1
1 1
11
11
11
2000 2002 2004 2006 2008 2010 2012 2014
Time (year)
"LN[GDP (real)]" : fixed VAT 1 1 1 1 1 1 1 1 1 1 1
"LN[GDP (real)]" : variable VAT 2 2 2 2 2 2 2 2 2 2
Taxes: Production
70 B
35 B
0
2
2
2
2
2
2
11
11 1
2000 2004 2008 2012
Time (year)Tax on Production : fixed VAT 1 1 1 1Tax on Production : variable VAT 2 2 2
Taxes:Income
70 B
35 B
0
2
2
2
22
2
11
11 1
2000 2004 2008 2012
Time (year)
Income Tax : fixed VAT 1 1 1 1
Income Tax : variable VAT 2 2 2
Taxes:Corporate
20 B
10 B
0
22
2
2
22
1 1
1 1 1
2000 2004 2008 2012
Time (year)Corporate Tax : fixed VAT 1 1 1 1Corporate Tax : variable VAT 2 2 2
Taxes: Total
200 B
100 B
0
2
2
2
2
2
2
11
11
1
2000 2004 2008 2012
Time (year)"Tax Revenues (endogenous)" : fixed VAT 1 1 1"Tax Revenues (endogenous)" : variable VAT 2 2
Debt (Governemnt)
200 B
100 B
0
2
2
22
2
2
1
1
11
1
2000 2004 2008 2012
Time (year)"Total Debt (Govrnment)" : fixed VAT 1 1 1"Total Debt (Govrnment)" : variable VAT 2 2
Deficit (Governmet)
30 B
15 B
0
2
2 2
2
2
21
1
1
1 1
2000 2004 2008 2012
Time (year)"BORROWING (Govrnment)" : fixed VAT 1 1"BORROWING (Govrnment)" : variable VAT 2
Debt/GDP ratio
0.6
0.45
0.32
22
2
22
1
1
1 1
1
2000 2004 2008 2012
Time (year)"Debt-GDP ratio" : fixed VAT 1 1 1 1"Debt-GDP ratio" : variable VAT 2 2 2
Deficit/GDP ratio
0
-0.1
-0.2
2
22
2
2
21
1
11
1
2000 2004 2008 2012
Time (year)"Deficit-GDP ratio" : fixed VAT 1 1 1 1"Deficit-GDP ratio" : variable VAT 2 2 2
• grey – fixed VAT • red – variable VAT
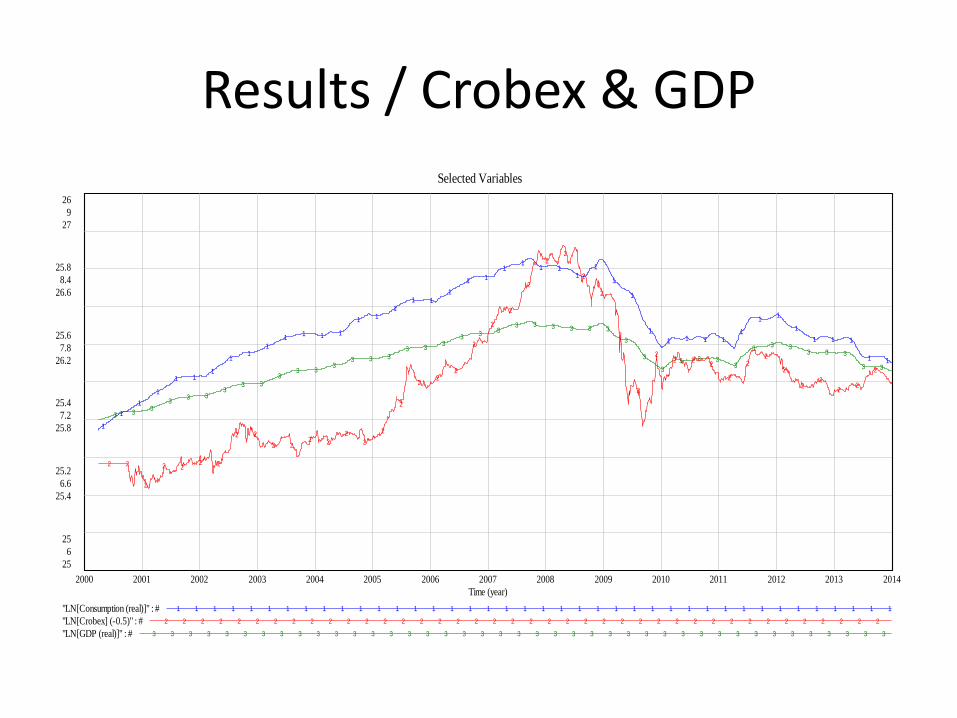
Results / Crobex & GDP
Selected Variables
26
9
27
25.8
8.4
26.6
25.6
7.8
26.2
25.4
7.2
25.8
25.2
6.6
25.4
25
6
25
3 33
33 3
33 3
33 3
33 3 3
3 33
3 3 33 3 3 3 3 3
3
3
3
3 3 33
3 3 33 3 3
3 3
2 2
2
2 22 2
2 2
2 22 2
2
2
2
2
22
2
2
2
2
2
22
2
2
2
2
22 2
2
2
22
2
22
22
2
1
1
1
1
1 11
11
1
11 1 1
1 11
1 1
1
1 1
11
1 11
1
1
1
1
1 1 1 11
11
1
1 1 1
1 1
2000 2001 2002 2003 2004 2005 2006 2007 2008 2009 2010 2011 2012 2013 2014
Time (year)
"LN[Consumption (real)]" : # 1 1 1 1 1 1 1 1 1 1 1 1 1 1 1 1 1 1 1 1 1 1 1 1 1 1 1 1 1 1 1 1 1 1 1 1 1 1 1 1
"LN[Crobex] (-0.5)" : # 2 2 2 2 2 2 2 2 2 2 2 2 2 2 2 2 2 2 2 2 2 2 2 2 2 2 2 2 2 2 2 2 2 2 2 2 2 2 2 2
"LN[GDP (real)]" : # 3 3 3 3 3 3 3 3 3 3 3 3 3 3 3 3 3 3 3 3 3 3 3 3 3 3 3 3 3 3 3 3 3 3 3 3 3 3 3 3 3
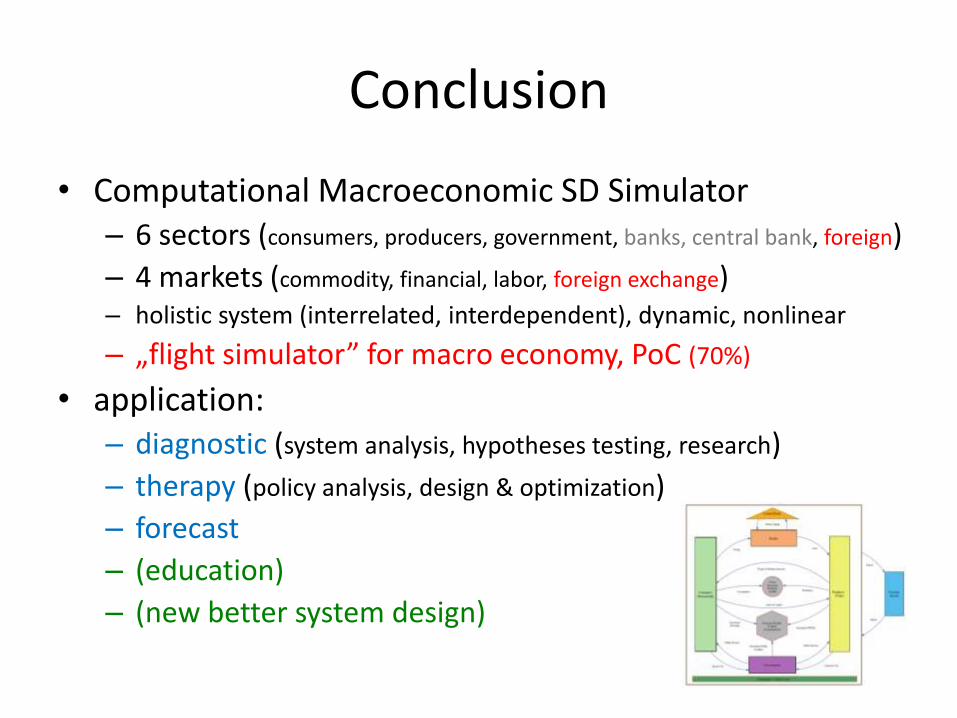
Conclusion
• Computational Macroeconomic SD Simulator – 6 sectors (consumers, producers, government, banks, central bank, foreign)
– 4 markets (commodity, financial, labor, foreign exchange) – holistic system (interrelated, interdependent), dynamic, nonlinear
– „flight simulator” for macro economy, PoC (70%)
• application: – diagnostic (system analysis, hypotheses testing, research)
– therapy (policy analysis, design & optimization)
– forecast
– (education)
– (new better system design)
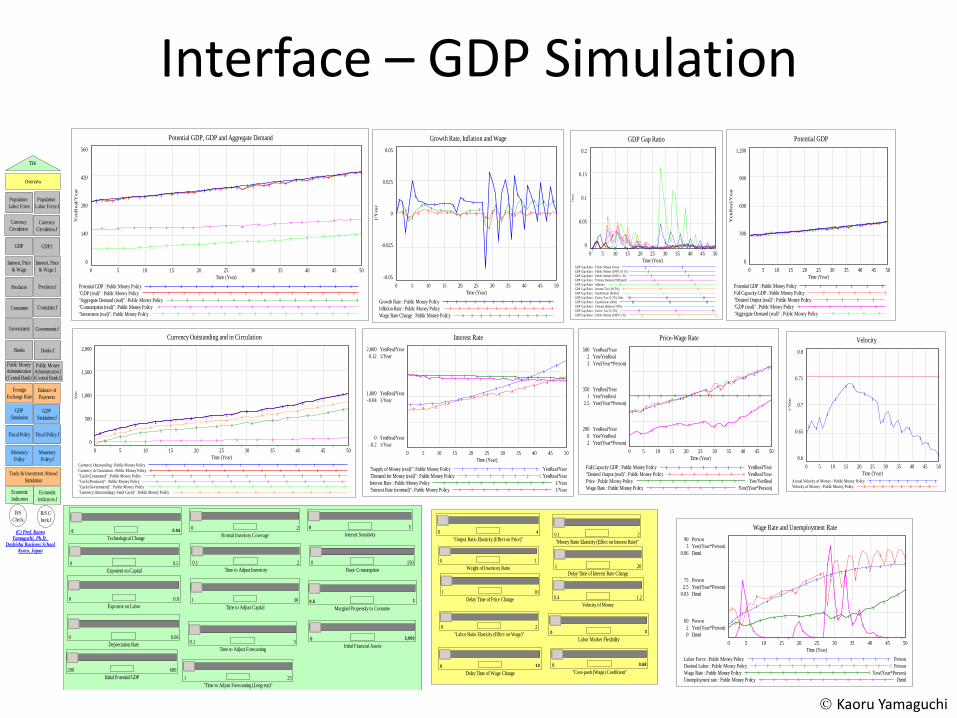
Interface – GDP Simulation
Overview
GDP
Producer
Consumer
Banks
GDP
Simulation
Interest, Price
& Wage
Government
Fiscal Policy
Monetary
Policy
Public MoneyAdministration(Central Bank)
Population
Labor Force
(C) Prof. KaoruYamaguchi, Ph.D.
Doshisha Business SchoolKyoto, Japan
Currency
Circulation
B/S
Check
GDP.f
Producer.f
Consumer.f
Banks.f
GDP
Simulation.f
Interest, Price
& Wage.f
Government.f
Fiscal Policy.f
Monetary
Policy.f
Public MoneyAdministration.f(Central Bank.f)
B/S C
heck.f
Population
Labor Force.f
Currency
Circulation.f
Foreign
Exchange RateBalance of
Payments
Trade & Investment Abroad
Simulation
Title
Economic
IndicatorsEconomic
Indicators.f
Initial Potential GDP
200 600
Basic Consumption
0 150
Depreciation Rate
0 0.06
Exponent on Capital
0 0.5
Time to Adjust Forecasting
0.1 3
"Time to Adjust Forecasting (Long-run)"
1 25
Exponent on Labor
0 0.8
Normal Inventory Coverage
0 2
Time to Adjust Capital
1 30 Delay Time of Price Change
1 10
Time to Adjust Inventory
0.1 2
Potential GDP, GDP and Aggregate Demand
560
420
280
140
0
5 5 5 5 5 5 5 5 5 5 5 5 5 5 5 5 5
4 4 4 4 4 4 4 4 4 44 4 4 4 4 4 4
3 3 3 3 3 3 33 3 3
3 3 33
33 3
3
2 22 2 2 2 2 2 2
2 2 22
2 2 22
2
1 1 1 1 1 1 1 1 1 1 1 1 11 1 1
11
0 5 10 15 20 25 30 35 40 45 50
Time (Year)
Yen
Real/
Year
Potential GDP : Public Money Policy 1 1 1 1 1 1 1 1 1 1 1 1 1 1
"GDP (real)" : Public Money Policy 2 2 2 2 2 2 2 2 2 2 2 2 2 2
"Aggregate Demand (real)" : Public Money Policy 3 3 3 3 3 3 3 3 3 3 3 3 3
"Consumption (real)" : Public Money Policy 4 4 4 4 4 4 4 4 4 4 4 4 4
"Investment (real)" : Public Money Policy 5 5 5 5 5 5 5 5 5 5 5 5 5
Technological Change
0 0.04 Wage Rate and Unemployment Rate
90 Person
3 Yen/(Year*Person)
0.06 Dmnl
75 Person
2.5 Yen/(Year*Person)
0.03 Dmnl
60 Person
2 Yen/(Year*Person)
0 Dmnl
44
4 4 4
4
4
4
4
4 4
44 4
3 33
3 3 3 33
3 33
3
3
3
2 2
2 2
2 2
2
2
22
2
2
2
2
2
1
1
1
1
1
1
11
11
1 1 1 1 1
0 5 10 15 20 25 30 35 40 45 50
Time (Year)
Labor Force : Public Money Policy Person1 1 1 1 1 1 1 1 1 1 1 1
Desired Labor : Public Money Policy Person2 2 2 2 2 2 2 2 2 2 2 2
Wage Rate : Public Money Policy Yen/(Year*Person)3 3 3 3 3 3 3 3 3 3 3
Unemployment rate : Public Money Policy Dmnl4 4 4 4 4 4 4 4 4 4 4
Delay Time of Wage Change
0 10
Interest Sensitivity
0 1
Labor Market Flexibility
0 3
"Cost-push (Wage) Coefficient"
0 0.68
Interest Rate
2,000 YenReal/Year
0.12 1/Year
1,000 YenReal/Year
-0.04 1/Year
0 YenReal/Year
-0.2 1/Year
4 4 4 4 4 4 4 4 4 4 4 4 4
3 3 3 3 3 3 3 3 3 3 3 3 3
2 2 22
22
2 22
22
22
1 1 1 11
11
11
11
1
1
0 5 10 15 20 25 30 35 40 45 50
Time (Year)
"Supply of Money (real)" : Public Money Policy YenReal/Year1 1 1 1 1 1 1
"Demand for Money (real)" : Public Money Policy YenReal/Year2 2 2 2 2 2 2
Interest Rate : Public Money Policy 1/Year3 3 3 3 3 3 3 3 3
"Interest Rate (nominal)" : Public Money Policy 1/Year4 4 4 4 4 4 4 4
Marginal Propensity to Consume
0.5 1
Initial Financial Assets
0 3,000
Price-Wage Rate
500 YenReal/Year
2 Yen/YenReal
3 Yen/(Year*Person)
350 YenReal/Year
1 Yen/YenReal
2.5 Yen/(Year*Person)
200 YenReal/Year
0 Yen/YenReal
2 Yen/(Year*Person)
44
44 4
44 4
4
4
4
3 3 3 3 3 3 3 3 3 3 3
22
22 2
2 2
2
22
22
11
11
11
11
1
11
1
0 5 10 15 20 25 30 35 40 45 50
Time (Year)
Full Capacity GDP : Public Money Policy YenReal/Year1 1 1 1 1 1 1
"Desired Output (real)" : Public Money Policy YenReal/Year2 2 2 2 2 2 2
Price : Public Money Policy Yen/YenReal3 3 3 3 3 3 3 3
Wage Rate : Public Money Policy Yen/(Year*Person)4 4 4 4 4 4 4
Currency Outstanding and in Circulation
2,000
1,500
1,000
500
0
66
66 6 6 6
6 6 66
66
5 5 5 5 5 5 5 5 5 5 5 5 5 54 4 4 4 4 4 4 4 4 4 4 4 4 43
33
3 3 3 3 33
33
33
3
2
22
2 2 22 2
22
22
22
11
11 1
1 11
1 11
11
1
0 5 10 15 20 25 30 35 40 45 50
Time (Year)
Yen
Currency Outstanding : Public Money Policy 1 1 1 1 1 1 1 1 1 1
Currency in Circulation : Public Money Policy 2 2 2 2 2 2 2 2 2 2 2
"Cash (Consumer)" : Public Money Policy 3 3 3 3 3 3 3 3 3 3 3
"Cash (Producer)" : Public Money Policy 4 4 4 4 4 4 4 4 4 4 4
"Cash (Government)" : Public Money Policy 5 5 5 5 5 5 5 5 5 5 5
"Currency Outstanding (-Vault Cash)" : Public Money Policy 6 6 6 6 6 6 6 6 6
Velocity
0.8
0.75
0.7
0.65
0.6
2
11
1
1
1 1
1
1
11
11
1
1
1
0 5 10 15 20 25 30 35 40 45 50
Time (Year)
1/Y
ear
Actual Velocity of Money : Public Money Policy 1 1 1 1 1 1 1 1
Velocity of Money : Public Money Policy 2 2 2 2 2 2 2 2
"Output Ratio Elasticity (Effect on Price)"
0 4
Weight of Inventory Ratio
0 1
"Labor Ratio Elasticity (Effect on Wage)"
0 2
"Money Ratio Elasticity (Effect on Interest Rate)"
0.1 2
Delay Time of Interest Rate Change
1 20
Velocity of Money
0.4 1.2
Growth Rate, Inflation and Wage
0.05
0.025
0
-0.025
-0.05
3
3
33 3 3
3
3 3
3
3
33
3
3 3 3
2
22 2 2 2 2 2 2
2
2
22
2 2 2 2
1
1
1
1 1 1 1
11 1
1
1
11
1
1 1
1
0 5 10 15 20 25 30 35 40 45 50
Time (Year)
1/Y
ear
Growth Rate : Public Money Policy 1 1 1 1 1 1 1 1 1 1 1 1
Inflation Rate : Public Money Policy 2 2 2 2 2 2 2 2 2 2 2 2
Wage Rate Change : Public Money Policy 3 3 3 3 3 3 3 3 3 3
Potential GDP
1,200
900
600
300
0
5 5 5 5 5 5 5 55
44 4 4 4 4
44 4
33 3 3 3
3 33 3
2 2 2 2 2 2 2 2 2
1 1 1 1 1 1 1 1 1
0 5 10 15 20 25 30 35 40 45 50
Time (Year)
YenR
eal/Y
ear
Potential GDP : Public Money Policy 1 1 1 1 1 1
Full Capacity GDP : Public Money Policy 2 2 2 2 2
"Desired Output (real)" : Public Money Policy 3 3 3 3
"GDP (real)" : Public Money Policy 4 4 4 4 4 4
"Aggregate Demand (real)" : Public Money Policy 5 5 5 5
GDP Gap Ratio
0.2
0.15
0.1
0.05
0C C C
B
B B
:
::
9 9 9
8
88
7 7 7
6
6 65 5
5
54
4
4 4
3
3 3 3
2
2 2 21 1
1
1
0 5 10 15 20 25 30 35 40 45 50
Time (Year)
Dm
nl
GDP Gap Ratio : Public Money Policy 1 1GDP Gap Ratio : Public Money (100% 10 Yr) 2 2GDP Gap Ratio : Public Money (100% 1 Yr) 3 3GDP Gap Ratio : Primary Balance(=90%)(all) 4 4GDP Gap Ratio : Inflation 5 5 5GDP Gap Ratio : Income Tax (10+5%) 6 6 6GDP Gap Ratio : Equilibrium (Public) 7 7 7GDP Gap Ratio : Excise Tax (5+5%) Only 8 8 8GDP Gap Ratio : Equilibrium (Debt) 9 9 9GDP Gap Ratio : Primary Balance(=90%) : : :GDP Gap Ratio : Excise Tax (5+5%) B B BGDP Gap Ratio : Public Money (100% 5 Yr) C C C
Kaoru Yamaguchi
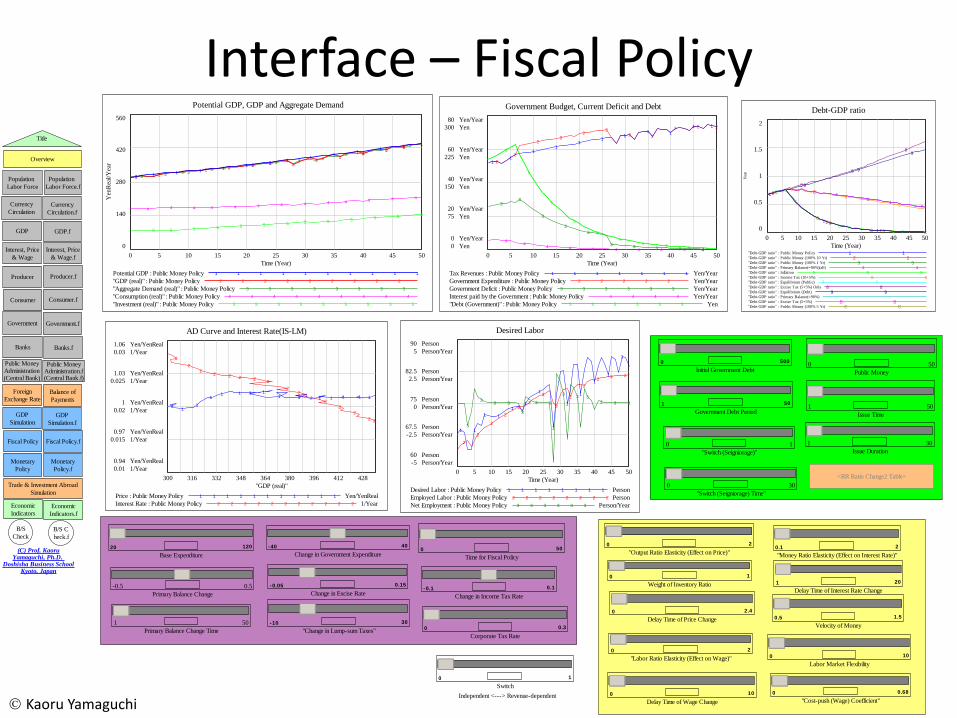
Interface – Fiscal Policy
Overview
GDP
Producer
Consumer
Banks
GDP
Simulation
Interest, Price
& Wage
Government
Fiscal Policy
Monetary
Policy
Public MoneyAdministration(Central Bank)
Population
Labor Force
(C) Prof. KaoruYamaguchi, Ph.D.
Doshisha Business SchoolKyoto, Japan
Currency
Circulation
B/S
Check
GDP.f
Producer.f
Consumer.f
Banks.f
GDP
Simulation.f
Interest, Price
& Wage.f
Government.f
Fiscal Policy.f
Monetary
Policy.f
Public MoneyAdministration.f(Central Bank.f)
B/S C
heck.f
Population
Labor Force.f
Currency
Circulation.f
Foreign
Exchange RateBalance of
Payments
Trade & Investment Abroad
Simulation
Title
Economic
IndicatorsEconomic
Indicators.f
Potential GDP, GDP and Aggregate Demand
560
420
280
140
0
5 5 5 5 5 5 5 5 5 5 5 5 5
4 4 4 4 4 4 4 4 4 4 4 4 4
3 3 33 3
33 3
33 3
33
2 22
22
2 2 22
22
22
1 1 1 11
11
11
11
11
1
0 5 10 15 20 25 30 35 40 45 50
Time (Year)
Yen
Rea
l/Y
ear
Potential GDP : Public Money Policy 1 1 1 1 1 1 1 1 1 1
"GDP (real)" : Public Money Policy 2 2 2 2 2 2 2 2 2
"Aggregate Demand (real)" : Public Money Policy 3 3 3 3 3 3 3 3
"Consumption (real)" : Public Money Policy 4 4 4 4 4 4 4 4 4
"Investment (real)" : Public Money Policy 5 5 5 5 5 5 5 5 5
Government Budget, Current Deficit and Debt
80 Yen/Year
300 Yen
60 Yen/Year
225 Yen
40 Yen/Year
150 Yen
20 Yen/Year
75 Yen
0 Yen/Year
0 Yen
5
5
5
5
5
55
5 5 5
44
4 4 4 4 4 4 4 4
33
3
3
3
3 3 3 3 3
2
2
22
22
2 2
2 2 2
11
11
11
11 1
1 1
0 5 10 15 20 25 30 35 40 45 50
Time (Year)
Tax Revenues : Public Money Policy Yen/Year1 1 1 1 1 1 1
Government Expenditure : Public Money Policy Yen/Year2 2 2 2 2
Government Deficit : Public Money Policy Yen/Year3 3 3 3 3 3
Interest paid by the Government : Public Money Policy Yen/Year4 4 4 4
"Debt (Government)" : Public Money Policy Yen5 5 5 5 5 5
Change in Government Expenditure
-40 40
Time for Fiscal Policy
0 50
Corporate Tax Rate
0 0.3
Switch
0 1
Base Expenditure
20 120
Independent <---> Revenue-dependent
AD Curve and Interest Rate(IS-LM)
1.06 Yen/YenReal
0.03 1/Year
1.03 Yen/YenReal
0.025 1/Year
1 Yen/YenReal
0.02 1/Year
0.97 Yen/YenReal
0.015 1/Year
0.94 Yen/YenReal
0.01 1/Year
2
2
22 2 2 2
2
22
22
2
2
2 2
11
1
11 1 1 1
1 1 11 1 1 1 1
300 316 332 348 364 380 396 412 428
"GDP (real)"
Price : Public Money Policy Yen/YenReal1 1 1 1 1 1 1 1 1 1 1
Interest Rate : Public Money Policy 1/Year2 2 2 2 2 2 2 2 2 2 2
"Change in Lump-sum Taxes"
-10 30
Government Debt Period
1 50
Change in Income Tax Rate
-0.1 0.1Change in Excise Rate
-0.05 0.15
Initial Government Debt
0 500
Desired Labor
90 Person
5 Person/Year
82.5 Person
2.5 Person/Year
75 Person
0 Person/Year
67.5 Person
-2.5 Person/Year
60 Person
-5 Person/Year
3
33 3
3
3 3
33 3
3 3 3
2
2
2
2
22
2
2
2
2
22 2
1 1
1 1
11
1
1
1
1
1
1
1
0 5 10 15 20 25 30 35 40 45 50
Time (Year)
Desired Labor : Public Money Policy Person1 1 1 1 1 1 1 1
Employed Labor : Public Money Policy Person2 2 2 2 2 2 2 2
Net Employment : Public Money Policy Person/Year3 3 3 3 3 3
Delay Time of Price Change
0 2.4
Delay Time of Wage Change
0 10
Labor Market Flexibility
0 10
"Cost-push (Wage) Coefficient"
0 0.68
"Output Ratio Elasticity (Effect on Price)"
0 2
Weight of Inventory Ratio
0 1
"Labor Ratio Elasticity (Effect on Wage)"
0 2
"Money Ratio Elasticity (Effect on Interest Rate)"
0.1 2
Delay Time of Interest Rate Change
1 20
Velocity of Money
0.5 1.5
Debt-GDP ratio
2
1.5
1
0.5
0
C
C C
B
B
B
:
:
:
9
9
9
8
8
8
7
77
6
6
6
5
5
5
44
4
3
3
3
2
2
2
1
1
1
0 5 10 15 20 25 30 35 40 45 50
Time (Year)
Yea
r
"Debt-GDP ratio" : Public Money Policy 1 1"Debt-GDP ratio" : Public Money (100% 10 Yr) 2 2"Debt-GDP ratio" : Public Money (100% 1 Yr) 3 3"Debt-GDP ratio" : Primary Balance(=90%)(all) 4 4"Debt-GDP ratio" : Inflation 5 5 5"Debt-GDP ratio" : Income Tax (10+5%) 6 6"Debt-GDP ratio" : Equilibrium (Public) 7 7"Debt-GDP ratio" : Excise Tax (5+5%) Only 8 8"Debt-GDP ratio" : Equilibrium (Debt) 9 9"Debt-GDP ratio" : Primary Balance(=90%) : :"Debt-GDP ratio" : Excise Tax (5+5%) B B"Debt-GDP ratio" : Public Money (100% 5 Yr) C C
"Switch (Seigniorage)"
0 1
Public Money
0 50
Issue Time
1 50
Issue Duration
1 30
Primary Balance Change
-0.5 0.5
Primary Balance Change Time
1 50
"Switch (Seigniorage) Time"
0 30
<RR Ratio Change2 Table>
Kaoru Yamaguchi
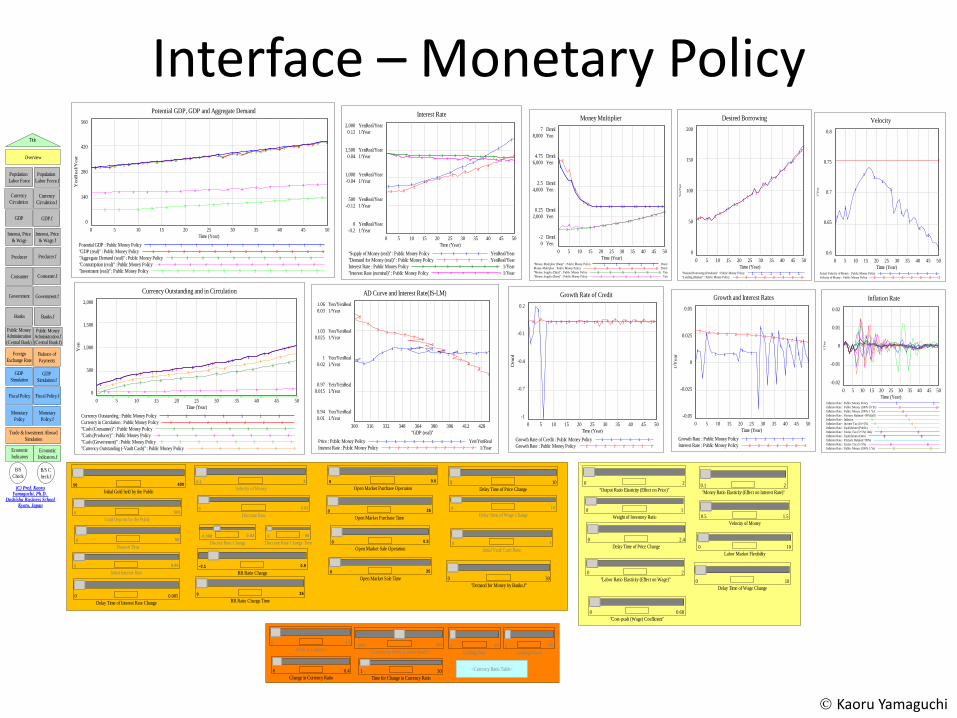
Interface – Monetary Policy
Overview
GDP
Producer
Consumer
Banks
GDP
Simulation
Interest, Price
& Wage
Government
Fiscal Policy
Monetary
Policy
Public MoneyAdministration(Central Bank)
Population
Labor Force
(C) Prof. KaoruYamaguchi, Ph.D.
Doshisha Business SchoolKyoto, Japan
Currency
Circulation
B/S
Check
GDP.f
Producer.f
Consumer.f
Banks.f
GDP
Simulation.f
Interest, Price
& Wage.f
Government.f
Fiscal Policy.f
Monetary
Policy.f
Public MoneyAdministration.f(Central Bank.f)
B/S C
heck.f
Population
Labor Force.f
Currency
Circulation.f
Foreign
Exchange RateBalance of
Payments
Trade & Investment Abroad
Simulation
Title
Economic
IndicatorsEconomic
Indicators.f
Delay Time of Interest Rate Change
0 0.005
Potential GDP, GDP and Aggregate Demand
560
420
280
140
0
5 5 5 5 5 5 5 5 5 5 5 5 5 5 5
4 4 4 4 4 4 4 4 4 4 4 4 4 4 4
3 3 3 3 3 3 33 3
33
3 3 33
2 22 2 2 2 2 2 2 2 2 2 2
22
2
1 1 1 1 1 1 1 11 1 1
1 1 1 11
0 5 10 15 20 25 30 35 40 45 50
Time (Year)
Yen
Real/
Year
Potential GDP : Public Money Policy 1 1 1 1 1 1 1 1 1 1 1 1
"GDP (real)" : Public Money Policy 2 2 2 2 2 2 2 2 2 2 2 2
"Aggregate Demand (real)" : Public Money Policy 3 3 3 3 3 3 3 3 3 3
"Consumption (real)" : Public Money Policy 4 4 4 4 4 4 4 4 4 4 4
"Investment (real)" : Public Money Policy 5 5 5 5 5 5 5 5 5 5 5
RR Ratio Change
-0.1 0.9
RR Ratio Change Time
0 35
Initial Gold held by the Public
50 400Open Market Purchase Operation
0 0.5
Open Market Purchase Time
0 35
Open Market Sale Operation
0 0.5
Open Market Sale Time
0 35
<Currency Ratio Table>
Interest Rate
2,000 YenReal/Year
0.12 1/Year
1,500 YenReal/Year
0.04 1/Year
1,000 YenReal/Year
-0.04 1/Year
500 YenReal/Year
-0.12 1/Year
0 YenReal/Year
-0.2 1/Year
4 4 4 4 4 4 4 4 4 4
3 3 3 3 3 3 3 3 3 3
2 22
22
22
22
2
2
1 1 11
1
1
1
1
1
1
1
0 5 10 15 20 25 30 35 40 45 50
Time (Year)
"Supply of Money (real)" : Public Money Policy YenReal/Year1 1 1 1
"Demand for Money (real)" : Public Money Policy YenReal/Year2 2 2 2
Interest Rate : Public Money Policy 1/Year3 3 3 3 3 3 3
"Interest Rate (nominal)" : Public Money Policy 1/Year4 4 4 4 4 4
Discount Rate
0 0.02
Velocity of Money
0.2 3
Window Guidance
0 1.5
Delay Time of Wage Change
0 10
Initial Interest Rate
0 0.06
Gold Deposit by the Public
0 500
"Lending by PMA (Central Bank)"
-300 300
Lending Time
0 35
Lending Period
1 20
Discount Rate Change Time
0 50
Discout Rate Change
-0.008 0.02
Currency Outstanding and in Circulation
2,000
1,500
1,000
500
0
6
66 6
66 6
66
6
5 5 5 5 5 5 5 5 5 5 54 4 4 4 4 4 4 4 4 4 4
3
33
33 3
33
33
3
2
2
22
2 22
22
2
2
1
1
11
11
11
11
1
0 5 10 15 20 25 30 35 40 45 50
Time (Year)
Yen
Currency Outstanding : Public Money Policy 1 1 1 1 1 1 1
Currency in Circulation : Public Money Policy 2 2 2 2 2 2 2
"Cash (Consumer)" : Public Money Policy 3 3 3 3 3 3 3
"Cash (Producer)" : Public Money Policy 4 4 4 4 4 4 4 4
"Cash (Government)" : Public Money Policy 5 5 5 5 5 5 5 5
"Currency Outstanding (-Vault Cash)" : Public Money Policy 6 6 6 6 6 6
Initial Vault Cash Ratio
0 1Deposit Time
0 50
Growth Rate of Credit
0.2
-0.1
-0.4
-0.7
-1
2 2 2 2 2 2 2 2 2 2 2 2 2 2
1
1
1 1 1 1 1 1 1 1 1 1 1 1
0 5 10 15 20 25 30 35 40 45 50
Time (Year)
Dm
nl
Growth Rate of Credit : Public Money Policy 1 1 1 1 1 1
Growth Rate : Public Money Policy 2 2 2 2 2 2 2 2
Money Multiplier
7 Dmnl
8,000 Yen
4.75 Dmnl
6,000 Yen
2.5 Dmnl
4,000 Yen
0.25 Dmnl
2,000 Yen
-2 Dmnl
0 Yen
44 4 4
44
44
3 3 33
33
33
3
2
2
22 2 2 2 2 2
1
1
1
1 1 1 1 1 1
0 5 10 15 20 25 30 35 40 45 50
Time (Year)"Money Multiplier (Data)" : Public Money Policy Dmnl1 1 1 1 1Money Multiplier : Public Money Policy Dmnl2 2 2 2 2 2"Money Supply (Data)" : Public Money Policy Yen3 3 3 3 3 3"Money Supply (Base)" : Public Money Policy Yen4 4 4 4 4
Velocity
0.8
0.75
0.7
0.65
0.6
2
1
1
1
11
1
1
1
1
1
1
1
0 5 10 15 20 25 30 35 40 45 50
Time (Year)
1/Y
ear
Actual Velocity of Money : Public Money Policy 1 1 1 1 1 1 1Velocity of Money : Public Money Policy 2 2 2 2 2 2 2 2
"Demand for Money by Banks.f"
0 30
Desired Borrowing
200
150
100
50
0
2 2
2
2
2
22
2
2
2
2
2
1 11
1
1
1
1
1
1
1
1
1
0 5 10 15 20 25 30 35 40 45 50
Time (Year)
Yen
/Year
"Desired Borrowing (Producer)" : Public Money Policy 1 1 1 1 1 1"Lending (Banks)" : Public Money Policy 2 2 2 2 2 2 2 2
Delay Time of Price Change
0 2.4
Delay Time of Wage Change
0 10
Labor Market Flexibility
0 10
"Cost-push (Wage) Coefficient"
0 0.68
"Output Ratio Elasticity (Effect on Price)"
0 2
Weight of Inventory Ratio
0 1
"Labor Ratio Elasticity (Effect on Wage)"
0 2
"Money Ratio Elasticity (Effect on Interest Rate)"
0.1 2
Velocity of Money
0.5 1.5
AD Curve and Interest Rate(IS-LM)
1.06 Yen/YenReal
0.03 1/Year
1.03 Yen/YenReal
0.025 1/Year
1 Yen/YenReal
0.02 1/Year
0.97 Yen/YenReal
0.015 1/Year
0.94 Yen/YenReal
0.01 1/Year
2
2
22 2 2
22
2
2
2
22
2
2
11
1
11 1 1 1 1
1 11 1 1 1
300 316 332 348 364 380 396 412 428
"GDP (real)"
Price : Public Money Policy Yen/YenReal1 1 1 1 1 1 1 1 1 1
Interest Rate : Public Money Policy 1/Year2 2 2 2 2 2 2 2 2 2
Growth and Interest Rates
0.05
0.025
0
-0.025
-0.05
2 2 2 2 2 2 2 2 2 2 2 2
1
1
1 1 11
1
1
1
1 1
1
1
0 5 10 15 20 25 30 35 40 45 50
Time (Year)
1/Y
ear
Growth Rate : Public Money Policy 1 1 1 1 1 1 1
Interest Rate : Public Money Policy 2 2 2 2 2 2 2
Inflation Rate
0.02
0.01
0
-0.01
-0.02
CC
BB
:
:9 9
8
87 7 7
6
6 65 55
44 4
3 3 32 2 21
1 1
0 5 10 15 20 25 30 35 40 45 50
Time (Year)
1/Y
ear
Inflation Rate : Public Money Policy 1 1Inflation Rate : Public Money (100% 10 Yr) 2 2Inflation Rate : Public Money (100% 1 Yr) 3Inflation Rate : Primary Balance(=90%)(all) 4Inflation Rate : Inflation 5 5Inflation Rate : Income Tax (10+5%) 6 6Inflation Rate : Equilibrium (Public) 7 7Inflation Rate : Excise Tax (5+5%) Only 8 8Inflation Rate : Equilibrium (Debt) 9 9Inflation Rate : Primary Balance(=90%) : :Inflation Rate : Excise Tax (5+5%) B BInflation Rate : Public Money (100% 5 Yr) C C
Change in Currency Ratio
0 0.4
Time for Change in Currency Ratio
1 30
Delay Time of Price Change
1 10
Kaoru Yamaguchi

Interface – Trade & Investment Simulation
Overview
GDP
Producer
Consumer
Banks
GDP
Simulation
Interest, Price
& Wage
Government
Fiscal Policy
Monetary
Policy
Public MoneyAdministration(Central Bank)
Population
Labor Force
(C) Prof. KaoruYamaguchi, Ph.D.
Doshisha Business SchoolKyoto, Japan
Currency
Circulation
B/S
Check
GDP.f
Producer.f
Consumer.f
Banks.f
GDP
Simulation.f
Interest, Price
& Wage.f
Government.f
Fiscal Policy.f
Monetary
Policy.f
Public MoneyAdministration.f(Central Bank.f)
B/S C
heck.f
Population
Labor Force.f
Currency
Circulation.f
Foreign
Exchange RateBalance of
Payments
Trade & Investment Abroad
Simulation
Title
Economic
IndicatorsEconomic
Indicators.f
Potential GDP, GDP and Aggregate Demand
560
420
280
140
0
5 5 5 5 5 5 5 5 5 5 5 5 54 4 4 4 4 4 4 4 4 4 4 4 4
3 3 3 3 3 33 3 3
3 33
3
2 22 2 2 2
2 22
22
2 2
1 1 1 1 1 1 1 11
1 11 1
1
0 5 10 15 20 25 30 35 40 45 50
Time (Year)
Yen
Real/
Year
Potential GDP : Public Money Policy 1 1 1 1 1 1 1 1 1 1
"GDP (real)" : Public Money Policy 2 2 2 2 2 2 2 2 2
"Aggregate Demand (real)" : Public Money Policy 3 3 3 3 3 3 3 3
"Consumption (real)" : Public Money Policy 4 4 4 4 4 4 4 4 4
"Investment (real)" : Public Money Policy 5 5 5 5 5 5 5 5 5
Foreign Exchange Rate
1.4
1.2
1
0.8
0.6
3 3 3 3 3 3 3 3 3 3 3 3 3 3 3 3 3 32 2 2 22 2
22 2 2 2
2 2 2 2 2 2 21 1 1 1 1 1 1 1 1 1 1 1 1 1 1 1 1 1
0 5 10 15 20 25 30 35 40 45 50
Time (Year)
Yen/D
ollar
Foreign Exchange Rate : Public Money Policy 1 1 1 1 1 1 1 1 1 1
Expected Foreign Exchange Rate : Public Money Policy 2 2 2 2 2 2 2 2 2
Real Foreign Exchange Rate : Public Money Policy 3 3 3 3 3 3 3 3 3
Trade Balance
2
1
0
-1
-2
2
2 2 2
2
2
2
2
2
2
2
2
1 11 1
1
11
1
1
1
1 11
0 5 10 15 20 25 30 35 40 45 50
Time (Year)
Yen
/Year
Trade Balance : Public Money Policy 1 1 1 1 1 1
"Trade Balance.f" : Public Money Policy 2 2 2 2 2
Balance of Payments
3
1.5
0
-1.5
-3
4 4 4 4 4 4 4 43 3 3 3 3 3 3 3
2
22
2
2
2
2
2
1 11
1 1
1
1
11
0 5 10 15 20 25 30 35 40 45 50
Time (Year)
Yen/Y
ear
Current Account : Public Money Policy 1 1 1 1 1"Capital & Financial Account" : Public Money Policy 2 2 2 2Changes in Reserve Assets : Public Money Policy 3 3 3 3 3Balance of Payments : Public Money Policy 4 4 4 4 4 4
Imports Coefficient
0 0.2
"Imports Coefficient.f"
0 0.2
Interest Arbitrage
0.02
0.01
0
-0.01
-0.02
2
2
2
2
2
2
2
2
2
2
2 2
1
1
1
1
1
1
1
1
1
11
1 1
0 5 10 15 20 25 30 35 40 45 50
Time (Year)
1/Y
ear
Interest Arbitrage Adjusted : Public Money Policy 1 1 1 1 1 1 1 1"Interest Arbitrage Adjusted.f" : Public Money Policy 2 2 2 2 2 2 2 2
Financial Investment Ratio
0 0.2
"Financial Investment Ratio.f"
0 0.2
Exports-Imports
50 Yen/Year
2 Yen/Year
35 Yen/Year
0 Yen/Year
20 Yen/Year
-2 Yen/Year
3
3 3
3
3
33
3
3
3 3
22
22
22
22
22
2
11
11
11
1
11
1
1
0 5 10 15 20 25 30 35 40 45 50
Time (Year)
Exports : Public Money Policy Yen/Year1 1 1 1 1 1
Imports : Public Money Policy Yen/Year2 2 2 2 2
Trade Balance : Public Money Policy Yen/Year3 3 3 3
Finacial Investment
4
2.925
1.85
0.775
-0.3
2
22
2
2
22
2
2
2
2
2
2
2 2
1 1 1 1 1 1 1 1 11
1 1 1 1 1 1
0 5 10 15 20 25 30 35 40 45 50
Time (Year)
Yen/Y
ear
Financial Investment Abroad : Public Money Policy 1 1 1 1 1 1 1 1 1 1Foreign Financial Investment Abroad : Public Money Policy 2 2 2 2 2 2 2 2 2 2
Direct Investment Ratio
0 0.2
"Direct Investment Ratio.f"
0 0.2Adjustment Time of FE
1 30
Initial Financial Assets
0 2,000
"Initial Financial Assets.f"
0 2,000
seeds
1 100mean
-0.1 0.1
Price
1.5
1.25
1
0.75
0.5
3 3 3 3 3 3 3 3 3 3 3 3 3 3 3 3 32 2 2 2 2 2 2 2 2 2 2 2 2 2 2 2 2 21 1 1 1 1 1 1 1 1 1 1 1 1 1 1 1 1 1
0 5 10 15 20 25 30 35 40 45 50
Time (Year)
Yen/Y
enR
eal
Price : Public Money Policy 1 1 1 1 1 1 1 1 1 1 1 1 1
"Price.f" : Public Money Policy 2 2 2 2 2 2 2 2 2 2 2 2 2
Real Foreign Exchange Rate : Public Money Policy 3 3 3 3 3 3 3 3 3
Currency Outstanding.f and in Circulation.f
2,000
1,500
1,000
500
0
6 66
66
66
6
6
6
5 5 5 5 5 5 5 5 5 54 4 4 4 4 4 4 4 4 4
3
3 33
33
33
3
3
2
2 22
22
2
2
2
2
1
1 11
11
1
1
1
1
0 5 10 15 20 25 30 35 40 45 50
Time (Year)
Do
llar
"Currency Outstanding.f" : Public Money Policy 1 1 1 1 1 1 1
"Currency in Circulation.f" : Public Money Policy 2 2 2 2 2 2
"Cash (Consumer).f" : Public Money Policy 3 3 3 3 3 3 3
"Cash (Producer).f" : Public Money Policy 4 4 4 4 4 4 4
"Cash (Government).f" : Public Money Policy 5 5 5 5 5 5 5
"Currency Outstanding (-Vault Cash).f" : Public Money Policy 6 6 6 6 6 6
Currency Outstanding and in Circulation
2,000
1,500
1,000
500
0
66
66 6
6 66
66
5 5 5 5 5 5 5 5 5 54 4 4 4 4 4 4 4 4 43
33 3 3 3 3
33
3
22
22
2 22
22
2
11
11
1 11
11
1
0 5 10 15 20 25 30 35 40 45 50
Time (Year)
Yen
Currency Outstanding : Public Money Policy 1 1 1 1 1 1 1
Currency in Circulation : Public Money Policy 2 2 2 2 2 2 2
"Cash (Consumer)" : Public Money Policy 3 3 3 3 3 3 3
"Cash (Producer)" : Public Money Policy 4 4 4 4 4 4 4
"Cash (Government)" : Public Money Policy 5 5 5 5 5 5 5
"Currency Outstanding (-Vault Cash)" : Public Money Policy 6 6 6 6 6 6
"Ratio Elasticity (Effect on Foreign Exchange Rate)"
0 1.5
standard deviation
0 0.3
Kaoru Yamaguchi
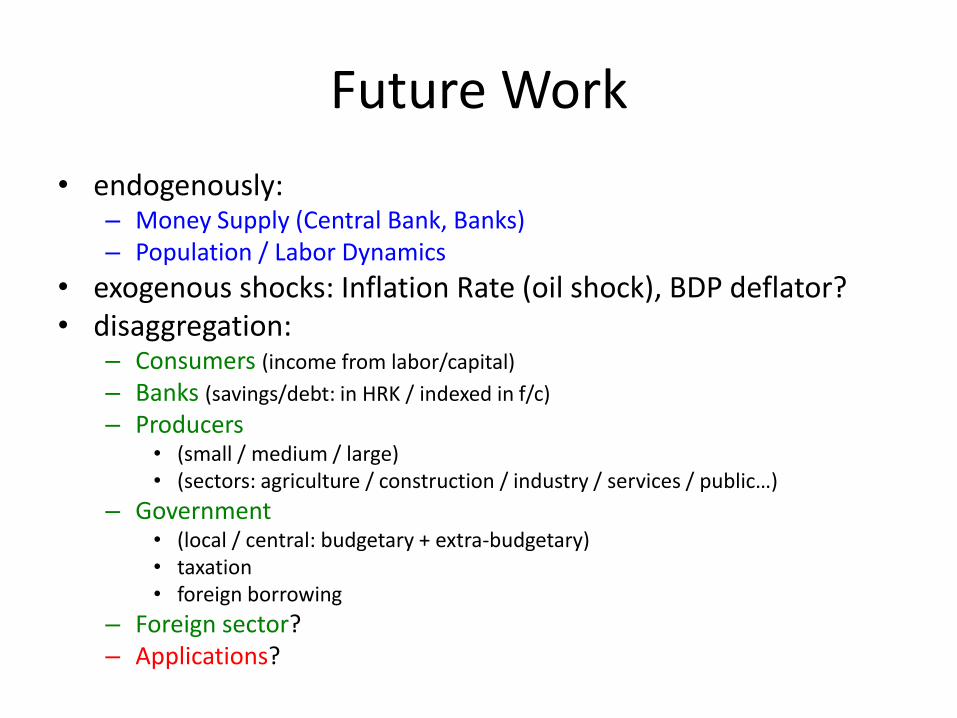
Future Work
• endogenously: – Money Supply (Central Bank, Banks) – Population / Labor Dynamics
• exogenous shocks: Inflation Rate (oil shock), BDP deflator? • disaggregation:
– Consumers (income from labor/capital)
– Banks (savings/debt: in HRK / indexed in f/c)
– Producers • (small / medium / large) • (sectors: agriculture / construction / industry / services / public…)
– Government • (local / central: budgetary + extra-budgetary) • taxation • foreign borrowing
– Foreign sector? – Applications?
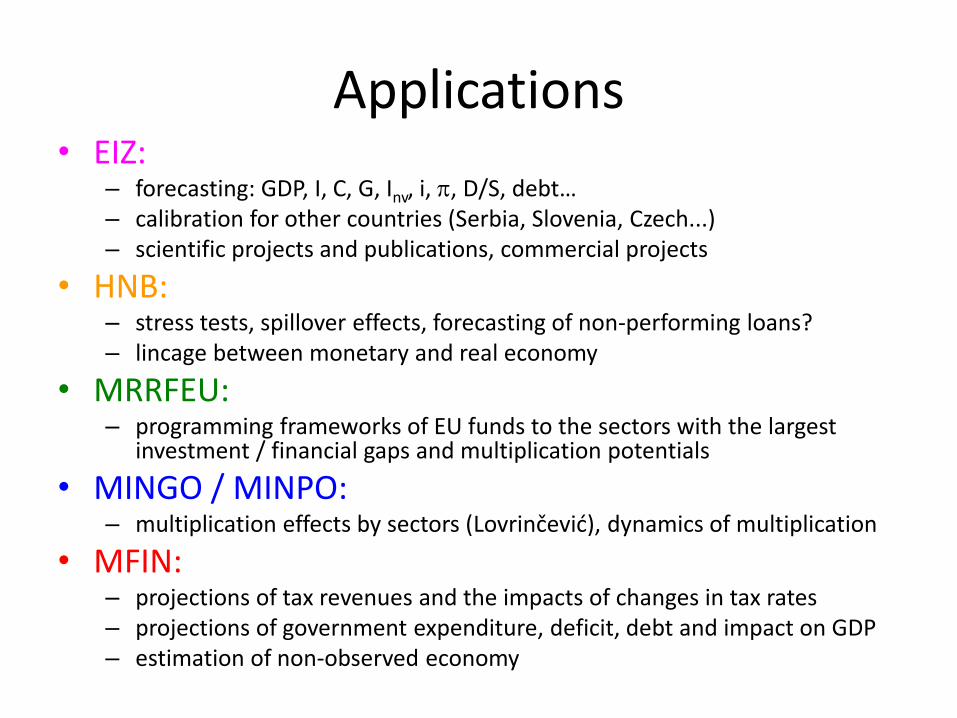
Applications • EIZ:
– forecasting: GDP, I, C, G, Inv, i, , D/S, debt… – calibration for other countries (Serbia, Slovenia, Czech...) – scientific projects and publications, commercial projects
• HNB: – stress tests, spillover effects, forecasting of non-performing loans? – lincage between monetary and real economy
• MRRFEU: – programming frameworks of EU funds to the sectors with the largest
investment / financial gaps and multiplication potentials
• MINGO / MINPO: – multiplication effects by sectors (Lovrinčević), dynamics of multiplication
• MFIN: – projections of tax revenues and the impacts of changes in tax rates – projections of government expenditure, deficit, debt and impact on GDP – estimation of non-observed economy

Primjene • EIZ:
– prognoze kretanja: BDP, I, C, G, Inv, i, , D/S, debt… – kalibracija za ostale zemlje (Srbija, Slovenija, Češka...) – znanstveni projekti i publikacije, komercijalni projekti
• HNB: – stres testovi, spillover efekti, nenaplativi krediti? – veze monetarne i realne ekonomije
• MRRFEU: – usmjeravanje okvira EU fondova prema sektorima s najvećim
investicijskim/ financijskim potrebama i multiplikacijom
• MINGO / MINPO: – multiplikacijski efekti po sektorima (Lovrinčević), dinamika multiplikacije
• MFIN: – projekcije poreznih prihoda i utjecaja promjene poreznih stopa – projekcija državnih rashoda, deficita, duga i njihova utjecaja na BDP – procjena sive ekonomije