crustal motion in the zone of the 1960 chile earthquake ... pubs/wang_etal_g3… · detangling...
TRANSCRIPT

Crustal motion in the zone of the 1960 Chile earthquake:Detangling earthquake-cycle deformation and forearc-slivertranslation
Kelin WangPacific Geoscience Centre, Geological Survey of Canada, 9860 West Saanich Road, Sidney, British Columbia, CanadaV8L 4B2 ([email protected])
Yan HuSchool of Earth and Ocean Sciences, University of Victoria, Victoria, British Columbia, Canada V8P 5C2([email protected])
Michael Bevis and Eric KendrickSchool of Earth Sciences, Ohio State University, 125 South Oval Mall, Columbus, Ohio 43210, USA ([email protected])
Robert Smalley Jr.Center for Earthquake Research and Information, University of Memphis, 3890 Central Avenue, Suite 1, Memphis,Tennessee 38152, USA ([email protected])
Rodrigo Barriga VargasInstituto Geografico Militar, Avenida Santa Isabel 1640, Santiago Centro, Region Metropolitana, Chile
Eduardo LaurıaInstituto Geografico Militar de Argentina, Cabildo 381, 1426 Buenos Aires, Argentina
[1] Temporary deformation in great earthquake cycles and permanent shear deformation associated withoblique plate convergence both provide critical clues for understanding geodynamics and earthquakehazard at subduction zones. In the region affected by the Mw 9.5 great Chile earthquake of 1960, we haveobtained GPS observations that provide information on both types of deformation. Our velocity solutionsfor the first time span the entire latitudinal range of the 1960 earthquake. The new observations revealed apattern of opposing (roughly arc-normal) motion of coastal and inland sites, consistent with what wasreported earlier for the northern part of this region. This finding supports the model of prolongedpostseismic deformation as a result of viscoelastic stress relaxation in the mantle. The new observationsalso provide the first geodetic evidence for the dextral motion of an intravolcanic arc fault system and theconsequent northward translation of a forearc sliver. The sliver motion can be modeled using a rate of6.5 mm/a, accommodating about 30% of the margin-parallel component of Nazca – South America relativeplate motion, with the rate diminishing to the north. Furthermore, the new GPS observations show asouthward decrease in margin-normal velocities of the coastal area. We prefer explaining the southwarddecrease in terms of changes in the width or frictional properties of the megathrust seismogenic zone.Because of the much younger age of the subducting plate and warmer thermal regime in the south, thecurrently locked portion of the plate interface may be narrower. Using a three-dimensional viscoelasticfinite element model of postseismic and interseismic deformation following the 1960 earthquake, wedemonstrate that this explanation, although not unique, is consistent with the GPS observations to the firstorder.
G3G3GeochemistryGeophysics
Geosystems
Published by AGU and the Geochemical Society
AN ELECTRONIC JOURNAL OF THE EARTH SCIENCES
GeochemistryGeophysics
Geosystems
Article
Volume 8, Number 10
18 October 2007
Q10010, doi:10.1029/2007GC001721
ISSN: 1525-2027
ClickHere
for
FullArticle
Copyright 2007 by the American Geophysical Union 1 of 14

Components: 8464 words, 5 figures, 2 tables.
Keywords: 1960 Chile earthquake; GPS; interseismic deformation; forearc deformation; viscoelastic stress relaxation; finite
element modeling.
Index Terms: 1242 Geodesy and Gravity: Seismic cycle related deformations (6924, 7209, 7223, 7230); 8170
Tectonophysics: Subduction zone processes (1031, 3060, 3613, 8413); 9360 Geographic Location: South America.
Received 12 June 2007; Revised 25 July 2007; Accepted 7 August 2007; Published 18 October 2007.
Wang, K., Y. Hu, M. Bevis, E. Kendrick, R. Smalley Jr., R. B. Vargas, and E. Laurıa (2007), Crustal motion in the zone of the
1960 Chile earthquake: Detangling earthquake-cycle deformation and forearc-sliver translation, Geochem. Geophys. Geosyst.,
8, Q10010, doi:10.1029/2007GC001721.
1. Introduction
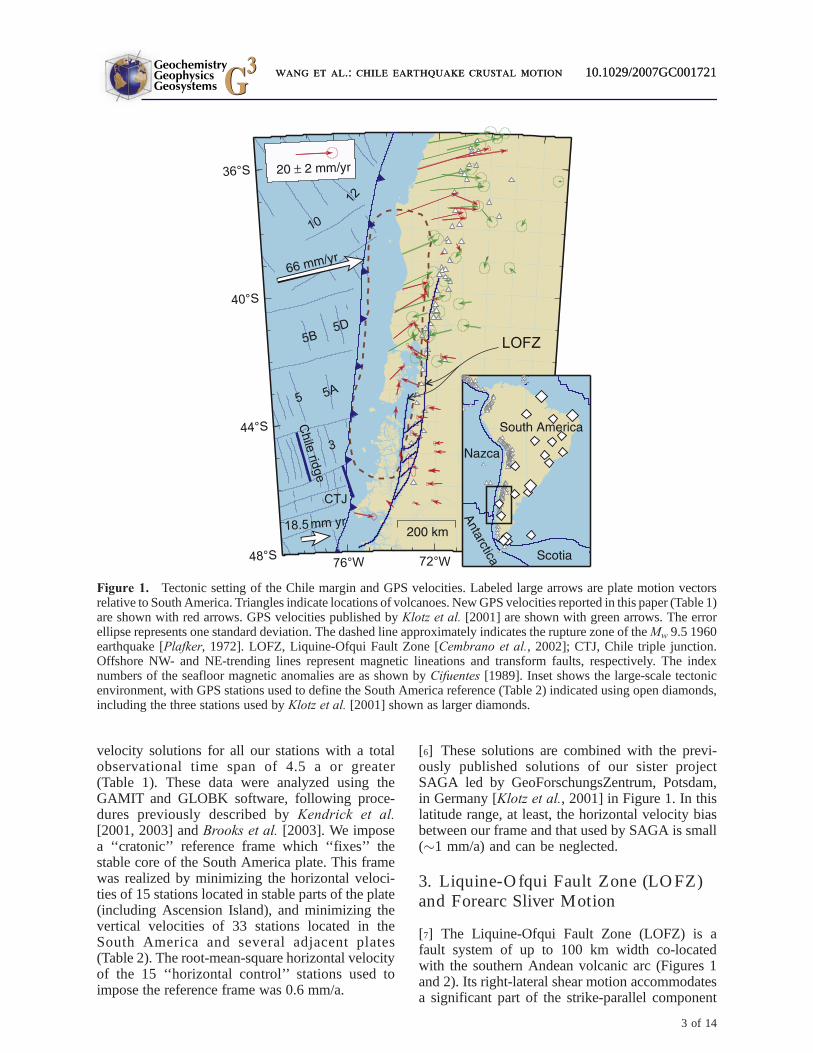
[2] The world’s largest recorded earthquake, with amoment magnitude Mw = 9.5, occurred in 1960 atthe Chile margin where the Nazca plate is subduct-ing beneath the South America plate at a rate ofabout 66 mm/a (Figure 1). Kendrick et al. [1997]first reported anomalous coastward motion of acontinuous Global Positioning System (GPS) sitelandward of the rupture zone of the earthquake, andKlotz et al. [2001] reported that sites of a GPSnetwork, measured in 1994 and 1996, showed apattern of opposing motion of coastal and inlandsites in the region affected by this earthquake.While all coastal sites move landward, consistentwith the current locking of the subduction mega-thrust, a group of inland sites move seaward(Figure 1, green arrows). Khazaradze et al.[2002] and Hu et al. [2004] explained the seawardmotion as the result of prolonged postseismicdeformation due to viscoelastic stress relaxationfollowing the 1960 earthquake. However, theseprevious studies were limited by the spatial distri-bution of the then available GPS measurements.The data covered only the northern half of the 1960rupture region (north of �42�S), although they alsospanned a vast region further north.
[3] Project CAP began observing this region in1993, and although its GPS network has beenoccupied on a piecemeal basis, by the end of year2005 nearly all stations had been occupied at leasttwice and most had been occupied three times. Thealong-strike coverage of our measurements over-laps the southernmost part of that of Klotz et al.[2001] but extends farther south and beyond thesouthern terminus of the 1960 rupture (Figure 1,red arrows). Our measurements not only haveconfirmed the opposing motion of coastal andinland sites reported by Klotz et al. [2001] north
of 42�S, but also have shown that the seawardmotion of inland sites persists south of 42�S andthroughout the 1960 rupture region. In addition, thenew data have revealed two new features of crustalmotion in the southern area (Figure 1). First, near-coast GPS velocities in the southern part of the1960 rupture region have a much smaller landwardcomponent than do those further north. Second,although the landward motion becomes smaller aswe move south along the coast, the margin-parallelmotion does not decrease, indicating a northward‘‘rigid-body’’ translation.
[4] The expanded GPS data coverage provides anopportunity for further testing the concept of pro-longed postseismic deformation and to exploreother processes that contribute to crustal deforma-tion at subduction zones. The purpose of this paperis threefold: (1) to present the new GPS data, (2) todemonstrate that the above mentioned margin-parallel motion of the coastal area is consistentwith the northward translation of a forearc sliver aspreviously inferred from geological evidence, and(3) to refine the post-1960 viscoelastic deformationmodel of Hu et al. [2004] in the light of the newobservations, especially the much smaller landwardvelocities of the coastal area in the south.
2. GPS Observations
[5] Unlike most GPS projects, our network in thezone of the 1960 rupture was not repeatedlyoccupied during a small number of large GPScampaigns. Instead, after initial and large cam-paigns in 1993 (north of �42.5�S) and in 1994(south of �42.5�S) which barely overlapped, thenetwork south of about 42�S was occupied on apiecemeal basis, often using just one or two rovingGPS receivers, over extended periods of timebetween 1997 and 2005. We present horizontal
GeochemistryGeophysicsGeosystems G3G3
wang et al.: chile earthquake crustal motion 10.1029/2007GC001721
2 of 14
velocity solutions for all our stations with a totalobservational time span of 4.5 a or greater(Table 1). These data were analyzed using theGAMIT and GLOBK software, following proce-dures previously described by Kendrick et al.[2001, 2003] and Brooks et al. [2003]. We imposea ‘‘cratonic’’ reference frame which ‘‘fixes’’ thestable core of the South America plate. This framewas realized by minimizing the horizontal veloci-ties of 15 stations located in stable parts of the plate(including Ascension Island), and minimizing thevertical velocities of 33 stations located in theSouth America and several adjacent plates(Table 2). The root-mean-square horizontal velocityof the 15 ‘‘horizontal control’’ stations used toimpose the reference frame was 0.6 mm/a.
[6] These solutions are combined with the previ-ously published solutions of our sister projectSAGA led by GeoForschungsZentrum, Potsdam,in Germany [Klotz et al., 2001] in Figure 1. In thislatitude range, at least, the horizontal velocity biasbetween our frame and that used by SAGA is small(�1 mm/a) and can be neglected.
3. Liquine-Ofqui Fault Zone (LOFZ)and Forearc Sliver Motion
[7] The Liquine-Ofqui Fault Zone (LOFZ) is afault system of up to 100 km width co-locatedwith the southern Andean volcanic arc (Figures 1and 2). Its right-lateral shear motion accommodatesa significant part of the strike-parallel component
Figure 1. Tectonic setting of the Chile margin and GPS velocities. Labeled large arrows are plate motion vectorsrelative to South America. Triangles indicate locations of volcanoes. New GPS velocities reported in this paper (Table 1)are shown with red arrows. GPS velocities published by Klotz et al. [2001] are shown with green arrows. The errorellipse represents one standard deviation. The dashed line approximately indicates the rupture zone of the Mw 9.5 1960earthquake [Plafker, 1972]. LOFZ, Liquine-Ofqui Fault Zone [Cembrano et al., 2002]; CTJ, Chile triple junction.Offshore NW- and NE-trending lines represent magnetic lineations and transform faults, respectively. The indexnumbers of the seafloor magnetic anomalies are as shown by Cifuentes [1989]. Inset shows the large-scale tectonicenvironment, with GPS stations used to define the South America reference (Table 2) indicated using open diamonds,including the three stations used by Klotz et al. [2001] shown as larger diamonds.
GeochemistryGeophysicsGeosystems G3G3
wang et al.: chile earthquake crustal motion 10.1029/2007GC001721wang et al.: chile earthquake crustal motion 10.1029/2007GC001721
3 of 14

of the relative motion between the Nazca andSouth America plates [Hoffmann-Rothe et al.,2006]. The southern termination of LOFZ at about46.5–47.5�S is near the Chile triple junction wherethe Chile spreading ridge is being subducted. Theinteraction of the spreading ridge with the conti-nental forearc has had a strong impact on the
motion of the southern LOFZ [Nelson et al.,1994]. There is evidence that a predecessor ofLOFZ exhibited left-lateral motion in the Mesozoic[Cembrano et al., 2000].
[8] The right-lateral motion of the LOFZ appears tohave accelerated in the Middle Miocene [Cembranoet al., 2002]. The latest estimate of the average rate
Table 1. GPS Site Velocitya
Station Longitude Latitude Ve Vn Vu sigVe sigVn sigVu CorNE Tspan
ALLN �72.19572 �40.77213 14.45 25.94 �1.67 0.39 0.85 0.85 �0.3906 4.814ANTC �71.53205 �37.33870 15.02 �0.42 �1.65 0.06 0.11 0.11 �0.3399 8.832BLMC �71.69264 �45.91463 �8.03 �0.36 5.18 0.41 0.62 0.62 �0.2010 8.490BMNS �73.73379 �40.58712 17.22 10.13 �1.65 0.34 0.39 0.42 �0.2010 6.713BSON �71.20485 �42.01391 �7.93 0.63 0.29 0.51 1.09 1.10 �0.4698 10.263CARA �75.63689 �46.80321 10.61 �2.49 4.14 0.85 1.21 1.22 �0.1036 5.740CBCO �72.78942 �45.45037 �3.06 1.16 7.84 1.38 3.85 3.86 �0.5193 5.164CBQA �72.80183 �36.13834 39.01 11.76 �3.15 0.52 0.85 1.05 �0.5744 4.071CCVC �71.90599 �38.78674 1.47 0.80 3.64 0.36 0.58 0.65 �0.4825 10.783CHCH �71.73384 �46.53889 �4.59 1.43 5.15 0.33 0.37 0.37 �0.1084 9.836CHIO �71.93179 �40.18609 �2.98 0.27 1.85 0.35 0.77 0.83 �0.6902 4.795CHT2 �72.79946 �42.85511 �8.64 3.45 9.08 0.18 0.19 0.19 0.0194 4.832CORR �68.35458 �36.15396 4.58 �0.17 1.92 0.53 0.48 0.52 �0.0387 10.266COYQ �71.89208 �45.51434 �4.98 �0.20 �0.07 0.09 0.13 0.13 �0.1376 7.485DLGN �71.81453 �45.52049 �5.37 0.07 1.58 0.24 0.43 0.43 �0.3413 10.019ESTQ �73.79999 �41.41064 11.45 9.04 3.53 0.23 0.40 0.39 �0.2009 10.816FCPH �72.67475 �41.21869 �3.89 5.43 9.37 0.69 0.78 0.76 �0.0146 10.814FTRN �72.37671 �40.13039 �2.44 5.18 6.76 0.31 0.71 0.73 �0.5181 10.805HNCO �73.96592 �42.67819 7.76 7.64 5.91 0.23 0.63 0.60 �0.2532 5.768LCPG �71.82284 �37.70998 12.38 1.25 �0.62 0.39 0.38 0.38 0.0116 10.767LEBU �73.64339 �37.57926 33.60 12.38 �16.20 0.27 0.32 0.35 �0.1866 10.786LHCL �65.59525 �38.00266 �0.31 �0.62 �1.17 0.08 0.11 0.11 �0.2161 8.400LO10 �68.47272 �46.04242 �11.75 5.27 �25.61 0.98 0.73 0.72 0.0995 4.972LQMY �71.27235 �38.44978 2.40 �3.97 �3.17 0.50 0.64 0.70 �0.2801 4.567LSRF �73.87044 �46.64516 �3.60 3.44 8.09 0.14 0.18 0.18 �0.0769 10.011MCHN �72.25869 �37.69691 17.42 4.13 0.99 1.06 1.97 2.19 �0.5277 4.655MFNT �71.58023 �44.93283 �5.31 �0.03 �0.28 0.50 0.34 0.34 0.1152 4.961MLKA �73.74928 �43.89679 0.29 6.22 16.86 0.22 0.18 0.17 0.1677 10.538MONA �72.60508 �44.50118 �5.52 2.54 �0.05 0.61 1.10 1.09 �0.1867 4.849NBLA �73.40202 �39.87030 13.80 3.89 3.18 0.43 0.66 0.67 �0.2013 5.483PAGR �73.52343 �45.16086 �0.48 4.15 14.95 0.12 0.23 0.23 �0.4334 10.022PCGN �72.30287 �41.53350 �3.64 1.81 4.93 0.34 0.28 0.27 0.1561 4.877PDBL �69.67096 �45.45724 �4.07 �0.00 0.52 0.45 0.60 0.60 �0.4774 4.973PLNA �71.80873 �43.62018 �6.54 1.14 �2.29 0.80 0.64 0.64 0.1195 4.841PLRN �72.43517 �41.99835 �10.25 6.33 �78.41 0.35 0.80 0.82 �0.5179 4.887PLTQ �72.69846 �46.57107 �2.95 0.83 9.70 0.51 0.40 0.39 0.0733 9.800PMGN �69.64240 �43.75306 �4.88 0.28 1.42 0.93 0.91 0.91 �0.0011 4.932PMON �72.91821 �41.46990 �1.01 3.57 2.22 0.08 0.12 0.12 �0.2040 7.910QLLN �73.68450 �43.14881 1.52 6.86 12.77 0.37 0.61 0.61 �0.2791 10.551RARI �71.34717 �35.78683 27.65 5.04 �4.37 0.41 0.25 0.23 0.2764 10.742STMZ �72.62987 �42.01485 �4.55 3.15 8.35 0.42 1.09 1.09 �0.4710 9.797TPRA �71.67515 �44.64530 �4.79 �0.45 �1.80 0.48 0.73 0.73 �0.1618 5.079TREL �65.37825 �43.26431 �2.47 1.33 �1.76 0.34 0.47 0.46 �0.1720 7.025TRMS �71.43185 �36.91761 13.59 �5.09 5.13 0.68 1.59 1.64 �0.5151 10.751VRPL �72.36816 �43.87057 �5.50 0.22 3.57 0.33 0.82 0.81 �0.3121 9.786ZAPL �70.02394 �38.82775 �0.47 �1.64 0.55 0.15 0.35 0.36 �0.5481 10.260
aGPS site velocity is expressed relative to the South America reference frame defined using GPS stations listed in Table 2. Ve, Vn, and Vu are the
east, north, and up components of velocity (mm/a), respectively, with SigVe, SigVn, and SigVu being their standard errors (mm/a). CorNE is northand east correlation coefficient. Tspan is time span of measurements in years.
GeochemistryGeophysicsGeosystems G3G3
wang et al.: chile earthquake crustal motion 10.1029/2007GC001721
4 of 14

since Pliocene is about 36 mm/a for its southern part,decreasing northward to 13 mm/a near its northerntermination [Rosenau et al., 2006]. The motion musthave substantially slowed down from these rates,because the present margin-parallel component ofthe Nazca–South America motion is only about23 mm/a according to geodetic observations[Angermann et al., 1999; Kendrick et al., 2003]or 28 mm/a according to the NUVEL-1a globalplate motion model [DeMets et al., 1994]. Themost direct evidence for its modern activity is theMs 5.3 Longuimay earthquake in 1989, the Mw 6.2Hudson earthquake in 1965, and the Mw 6.2 Aisenearthquake in 2007 (Figure 2). All these earth-quakes are right-lateral strike-slip faulting events.
The two Mw 6.2 events occurred almost in the sameplace. However, there have been no direct obser-vational constraints on the LOFZ’s modern rate ofmotion.
[9] Forearc-sliver translation accommodating themargin-parallel component of oblique convergenceis a very common process at subduction zones[Fitch, 1972]. As a result of the sliver motion,the relative convergence between the sliver and thesubducting plate is much less oblique, as reflectedin the orientation of the slip vectors of numerousgreat megathrust earthquakes [e.g., Yu et al., 1993;McCaffrey, 1994]. This slip partitioning translatesinto a type of strain partitioning: Much of the
Table 2. GPS Stations Defining the South America Reference Framea
Station Longitude Latitude Ve Vn Vu Type Tspan
KOUR �52.80596 5.25218 0.54 �0.01 1.26 HV 12.296FLIX �80.08806 �26.29705 62.81 8.10 1.02 V 7.355PARE �70.91950 �53.62742 5.73 0.62 �0.29 V 6.614PELD �70.67493 �33.14318 20.74 6.10 0.72 V 10.509RBSN �78.83698 �33.62886 62.67 8.18 2.18 V 6.679TNDL �59.08637 �37.32423 0.97 0.29 1.25 HV 10.241EISL �109.38329 �27.14821 67.83 �11.20 �1.80 V 11.006FORT �38.42561 �3.87745 0.22 �0.25 �3.55 H 11.359LPGS �57.93230 �34.90675 �0.00 �0.17 1.17 HV 11.362ESRN �68.79857 �53.34318 1.72 2.30 1.92 V 5.660MYMD �69.49918 �52.15680 0.93 1.49 1.04 V 5.655AREQ �71.49279 �16.46551 14.07 3.83 �1.20 V 7.161HART 27.70776 �25.88710 22.19 13.91 1.77 V 3.260BRAZ �47.87787 �15.94748 0.38 �0.14 �0.70 HV 10.225PARA �49.23095 �25.44837 �0.07 �0.19 �0.02 HV 10.008UEPP �51.40853 �22.11990 �0.04 0.53 0.23 HV 10.008VICO �42.86999 �20.76150 �0.01 �0.30 �1.32 HV 10.008BOMJ �43.42174 �13.25556 �1.09 0.41 �2.56 HV 10.008CUIB �56.06987 �15.55526 0.08 0.05 �0.64 H 10.008IMPZ �47.49723 �5.49177 0.25 �0.04 �1.11 HV 10.008MANB �60.05603 �3.11615 �0.38 �0.64 �2.73 H 8.350UNSA �65.40764 �24.72746 6.33 0.35 �0.31 V 10.006CFAG �68.23265 �31.60217 7.10 0.96 �1.59 V 9.548TUCU �65.23035 �26.84326 3.35 �1.10 �0.39 V 9.499GALA �90.30362 �0.74270 55.86 2.56 �0.22 V 6.764ASC1 �14.41207 �7.95121 �0.38 �0.22 �2.26 H 8.990COPO �70.33824 �27.38453 21.36 6.54 1.05 V 8.925LHCL �65.59525 �38.00266 �0.31 �0.62 �1.17 HV 8.400PMON �72.91821 �41.46990 �1.01 3.57 2.22 V 7.910PARC �70.87988 �53.13696 2.13 1.71 �1.16 V 8.383FREI �58.98050 �62.19410 7.83 6.20 �3.39 V 7.306PALM �64.05112 �64.77509 10.66 0.71 1.15 V 7.691COYQ �71.89208 �45.51434 �4.98 �0.20 �0.07 V 7.485PWMS �67.58493 �54.93420 6.51 1.07 0.43 V 7.471LKTH �57.85074 �51.69841 �0.07 1.15 �0.19 HV 6.515RIOP �78.65111 �1.65060 �0.76 �10.43 1.64 V 3.120BORC �44.74062 �60.73978 8.69 1.18 �1.96 V 4.367
aThe reference frame is realized by minimizing the horizontal H type stations that are located within the stable core of the reference plate and the
vertical velocity of V type stations that are located both within the reference plate and elsewhere. Ve, Vn, and Vu are the east, north, and upcomponents of velocity (mm/a), respectively. Tspan is time span of measurements in years.
GeochemistryGeophysicsGeosystems G3G3
wang et al.: chile earthquake crustal motion 10.1029/2007GC001721
5 of 14

along-strike shear is accommodated by the perma-nent deformation of the upper plate along faultzones such as the LOFZ, but much of the elasticstrain accumulation and release in interplate greatearthquake cycles takes place in the margin-normaldirection. The most recent example is the Mw 9.2great Sumatra earthquake of 2004. Although theplate convergence direction is very oblique, thecoseismic slip of the Sumatra megathrust as con-strained by GPS observations is much less oblique[Chlieh et al., 2007]. The margin-parallel compo-nent is accommodated by the strike-slip motion ofthe Sumatran fault in the upper plate [Fitch, 1972;McCaffrey et al., 2000]. In some cases, forearcmotion occurs without a clearly defined strike-slip
fault system and may not be purely strike-slip. Ifthe sliver motion has a margin-normal component,the distance between the trench and the stable partof the upper plate may change with time, such as atthe central and southern Cascadia subduction zone[Wells et al., 1998] and the northern Hikurangisubduction zone [Wallace et al., 2004].
[10] The motion of the LOFZ is evident in our GPSmeasurements south of 42�S (Figure 1), althoughthe rate of the motion cannot be accurately deter-mined. Around 44�S, the almost 90� difference inthe direction of GPS velocities across the LOFZcan only be explained by the right-lateral shear ofthe fault zone. No other geological models can
Figure 2. The LOFZ and GPS velocities corrected for the strike-parallel motion of the forearc sliver west of it.Labeled large arrows are plate motion vectors relative to South America. Squares indicate locations of GPS sites.New GPS data and those from Klotz et al. [2001] are shown with red and green arrows, respectively, with one-standard-deviation error ellipses. Stars indicate epicenters of earthquakes along the LOFZ, with their focalmechanisms shown using beach-ball diagrams (lower-hemisphere stereonet projection): the 1989 Ms 5.3 Lonquimayearthquake [Barrientos and Acevedo-Aranguiz, 1992], the 1965 Mw 6.2 Hudson earthquake [Chinn and Isacks,1983], and the 2007 Mw 6.2 Aisen earthquake (U.S. Geological Survey National Earthquake Information Center:http://neic.usgs.gov/neis/qed/).
GeochemistryGeophysicsGeosystems G3G3
wang et al.: chile earthquake crustal motion 10.1029/2007GC001721
6 of 14

explain the drastic velocity rotation over such ashort distance. The southward decrease in themargin-normal component of coastal GPS veloci-ties is very likely to be caused by a southwardchange in the slip and locking behavior of themegathrust seismogenic zone, which will be dis-cussed in section 4. But the change in the seismo-genic zone behavior alone cannot explain why themargin-parallel velocities do not show a similarsouthward decrease. Considering the geologicaland seismological evidence for the right-lateralshear of the LOFZ, the most reasonable explana-tion for the sustained margin-parallel velocity isthat it reflects a net northward translation of theforearc sliver west of the LOFZ.
[11] Our GPS observations shown in Figure 1present the first geodetic evidence for the contem-porary dextral motion of the LOFZ. In terms oflocalizing shear strain in the volcanic arc, theweakest part of the overriding plate, to accommo-date the margin-parallel component of relativeplate motion, the LOFZ is similar to the Sumatranfault, although the convergence obliquity at Chileis much less than at Sumatra and the LOFZ is notas long as the Sumatran fault. However, our smallnumber of GPS stations only allows a highlysimplified deformation pattern of the LOFZ to bedefined. There have been no neotectonic studiesthat address the current deformation rate of theLOFZ, nor how the rate decreases northward.
[12] As a working hypothesis, we consider thefollowing simple kinematical model for the LOFZ.We assume that the translation of the southern partof the forearc sliver is at a rate represented by theaverage strike-parallel velocity of the three GPSsites (6.5 mm/a) within the sliver between latitudes42�S and 44�S. This rate is about three quarters ofthe strike-slip component of the relative motionbetween the Nazca and South America plates. Wefurther assume that the rate linearly decreasesnorthward from 42�S to the approximate northernend of the LOFZ at 39.5�S, implying a north-southshortening of the sliver over this latitudinal range.This simple model will be tested and refined byfuture geodetic and geological observations. TheGPS velocities after this assumed sliver motion issubtracted are shown in Figure 2. The ‘‘corrected’’GPS velocities west of the LOFZ are either in theopposite direction of those east of the LOFZ ornegligibly small. In the following section, we usethe velocity pattern of Figure 2 to constrain themodel of postseismic and interseismic deformationfollowing the 1960 earthquake. A similar approach
of removing forearc motion before modeling earth-quake cycle deformation has been used by Wang etal. [2003].
4. Deformation Following the 1960Chile Earthquake
4.1. Conceptual Model and Rheology
[13] As explained by Hu et al. [2004], the seawardmotion of inland GPS sites is a consequence ofstress relaxation in Earth’s viscoelastic mantle, inmuch the same way as postglacial rebound. Thrustmotion of the subduction zone megathrust during agreat interplate earthquake pulls the upper platetoward the trench. Because the instantaneousresponse of the Earth to sudden loading is elastic,stress is induced in the crust and upper mantle toresist deformation. Coseismic elastic deformationthus rapidly decreases with increasing distancefrom the rupture zone as is rather accuratelydescribed by elastic dislocation models. Thelonger-term response of the upper mantle isviscous, and the stress associated with the initialelastic deformation will relax. As the underlyingmantle gradually loses its shear strength in thisprocess, the stretching stress in the elastic litho-sphere causes the lithosphere itself to move towardthe trench. Therefore inland sites away from therupture that were unable to have significant coseis-mic motion can slowly catch up after the earth-quake, manifesting as seaward motion in GPSmeasurements. At the same time, coastal sites havebegun to move landward as a result of the relock-ing of the megathrust, to accumulate strain energyfor the next great earthquake. After a long time oflocking, the inland sites will eventually stop theirseaward motion and move landward [Wang et al.,2001].
[14] Postseismic seaward motion of distal inlandsites has also been observed in the region affectedby the Mw 9.2 Alaska earthquake of 1964 [Savage etal., 1999; Freymueller et al., 2000]. It is currentlytaking place at a fast rate in the region affected by the2004 great Sumatra earthquake [e.g., Pollitz et al.,2006; Chlieh et al., 2007; Paul et al., 2007],although the rate is expected to decrease substan-tially in the next couple of decades as can beinferred from the Chile model of Hu et al.[2004]. Hu et al. [2004] have shown that theduration of the seaward motion depends on thealong-strike length of the rupture. Rupture lengthsof most interplate earthquakes are less than acouple of hundred kilometers, and the seaward
GeochemistryGeophysicsGeosystems G3G3
wang et al.: chile earthquake crustal motion 10.1029/2007GC001721
7 of 14

motion of inland sites quickly slows down beforeeventually reversing direction, as is observed inboth the CAP and SAGA GPS networks in theregion of the 1995, Mw = 8, Antofagasta earth-quake [e.g., Klotz, 2006].
[15] The viscoelastic mantle rheology mentionedabove is of the Maxwell type, and the viscouscomponent of the deformation is usually assumedto be Newtonian. The time for the mode ofdeformation to change from predominantly elasticto predominantly viscous is referred to as theMaxwell time (TM). With the continental uppermantle viscosity values of around 1019 Pa s com-monly used in subduction zone postseismic stressrelaxation models [Wang, 2007], TM is of the orderof a decade. The rate of stress relaxation of asystem consisting units of different mechanicalproperties depends on the exact configuration ofthe system. For the simple subduction zone modelemployed by Hu et al. [2004] and in this work(Figure 3), which has two elastic plates and visco-elastic continental and oceanic mantle, the systemis fully relaxed in about 20 TM of the continentalmantle.
[16] Modern geodetic observations have shownthat the linear Maxwell viscoelastic rheology,widely used in postglacial and postseismic defor-mation modeling, is inadequate for modeling short-term postseismic deformation. The rate of the
velocity change (deceleration of the site) within afew years of an earthquake observed at continuousGPS stations is much too fast to be explained usingthe linear Maxwell viscoelasticity. The mechanismof the short-term deformation is still a matter ofconjecture, however. Models of short-term post-seismic deformation include afterslip of the faultarea around the rupture zone [Melbourne et al.,2002], transient rheology [Pollitz et al., 2006], andnonlinear (power law) rheology [Freed et al.,2006]. Afterslip and transient rheology areunavoidable on the basis of rupture mechanicsand rock physics, but the parameters involved arepractically unconstrained at present. Power lawparameters are well determined in laboratories underthe condition of steady state deformation (constantstress and strain rate), but it is highly debatable towhat degree the steady state rheology is applicableto the transient short-term deformation.
[17] Regardless of the mechanisms of the short-term deformation, the rate of the velocity changebecomes very small a decade or more after theearthquake, such that the linear Maxwell viscoelas-ticity is a very reasonable approximation fordecadal and century-scale deformation models[Wang, 2007]. For our purpose of modeling thedeformation a few decades after the 1960 earth-quake, it suffices to ‘‘lump’’ the rapid short-termdeformation into the coseismic deformation. Forthis purpose, we need to use a rather wide coseismicrupture zone and a wide zone of downdip transitionover which the slip tapers to zero (Figure 3).
4.2. Numerical Model
[18] Our numerical model is a modification of thethree-dimensional (3-D) finite element model ofHu et al. [2004]. The model is developed in aCartesian coordinate system. The results on the flatsurface (x-y plane) of the Cartesian model mesh aremapped onto the ellipsoidal surface of the Earth viaLambert Conformal map projection for comparisonwith GPS observations. Free parameters are deter-mined by trial and error through visual assessmentof the fit to GPS data.
[19] The following aspects of the new model areidentical to the model of Hu et al. [2004]. We usethe GPS-determined Nazca–South America con-vergence rate of 66 mm/a [Angermann et al.,1999], which is similar to the rate reported byKendrick et al. [2003], rather than the NUVEL-1along-term tectonic rate of 80 mm/a [DeMets et al.,1994]. The viscosities of the continental mantle andoceanic mantle are assumed to be 2.5 � 1019 Pa s
Figure 3. (a) Schematic illustration of the fault modelof this work. (b) Coseismic slip model. (c) Backslipmodel for fault locking after the earthquake. Slip inFigure 3b or backslip rate in Figure 3c tapers to zeroover the transition zone (lighter shading). The model ismodified from the model of uniform seismogenic zonewidth of Hu et al. [2004].
GeochemistryGeophysicsGeosystems G3G3
wang et al.: chile earthquake crustal motion 10.1029/2007GC001721
8 of 14

and 1020 Pa s, respectively. The higher viscosityvalue for the oceanic mantle yields a more reason-able vertical deformation pattern following a modelearthquake, while the horizontal deformation pat-tern is very insensitive to this parameter [Hu et al.,2004]. The elastic upper and lower plates areassumed to be 40 km and 30 km thick, respectively,both with a Young’s modulus of 120 GPa. Themantle is assumed to have a Young’s modulus of160 GPa. The Poisson’s ratio and density areuniformly 0.25 and 3300 kg/m3, respectively. Theeffect of gravity on deformation is simulated using aprestress advection approach commonly employedin postglacial rebound modeling [Peltier, 1974].Numerically, the effect is incorporated as a restoringbody force proportional to density and verticaldisplacement that tends to bring a perturbed systemback to a hydrostatic state [Wang et al., 2001].Faulting is modeled using a 3-D version of thesplit-node method [Melosh and Raefsky, 1981].The effect of fault locking is simulated using thestandard back-slip recipe, assuming processes unre-lated to great earthquake cycles have been sub-tracted [Savage, 1983; Wang, 2007]. Downdip ofthe uniform coseismic slip (or interseismic back-slip) zone, there is a transition zone over which theslip (or back slip) linearly tapers to zero (Figure 3).The width of the transition zone is fixed at 2/3that of the zone of uniform slip (or back slip).Hu et al. [2004] provided justifications for thechoice of parameter values and conducted nu-merous tests on the sensitivity of model resultsto the parameters.
[20] The following aspects of the new model aredifferent from the model of Hu et al. [2004].Instead of a uniform convergence rate of 66 mm/a,we use a rate of 18.5 mm/a south of the Chile triplejunction to represent the much slower convergencebetween the Antarctica plate and South Americaplate (Figure 1). This rate is obtained using anAntarctica–South America Euler vector derived byone of the authors of this paper (R.S.). It is similarto those obtained using other GPS-constrainedAntarctica–South America Euler vectors reportedin the literature [Sella et al., 2002; Prawirodirdjoand Bock, 2004] and is slightly smaller than theNUVEL-1a value of 20 mm/a. Compared to themodel of Hu et al. [2004], the assumed 1960rupture extends slightly further south in order togive a better fit to the GPS data in that area, but theextension is well within uncertainties in the geo-logical and seismological constraints on the south-ern termination of the rupture. Another smalldifference from the model of Hu et al. [2004] is
that we have made the locked zone north of the1960 rupture wider to improve the fit to the GPSdata. These modifications to the model of Hu et al.[2004] are straightforward operations. The mainnew challenge is to account for the southwarddecrease in the speed of landward motion of coastalGPS sites (Figure 2). To explain the southwarddecrease, various options are available.
[21] For example, we may assume a southwardnarrowing of the megathrust seismogenic zone. Anarrower rupture zone in 1960 and a narrowerlocked zone afterward can reduce the landwardvelocities of the coastal sites. This option is con-sistent with the hypothesis that the downdip widthof the seismogenic zone is thermally controlled. Aswe move south along the margin, the age of theincoming plate gradually decreases to zero at theChile triple junction, accompanied with an increasein heat flow [Cande et al., 1987]. The southerntermination of the 1960 rupture is very likely to berelated to the high temperature near the Chile triplejunction. For margins with very young incomingplates, the downdip limit of the seismogenic zoneis expected to be controlled by a temperature ofabout 350�C [Hyndman and Wang, 1993].Although detailed thermal models are not yetavailable, there is no doubt that the temperaturealong a given megathrust depth contour increasessouthward, and therefore the thermally controlleddowndip limit of the seismogenic zone becomesshallower.
[22] Another option is to assume no southwardchange in the seismogenic zone but attribute thesouthward decrease of coastal velocities entirely tothe sliver motion discussed in section 3. Thiswould require the motion of the southern part ofthe sliver to have a westward component in addi-tion to the northward component. The northwardcomponent has been removed from velocitiesshown in Figure 1 to obtain velocities shown inFigure 2. If an additional westward componentwere also removed, velocities in the southern partof the sliver could become similar to those to thenorth. We do not pursue this option, because itwould require the LOFZ to have an opening rate ofa few mm/a, which contradicts the current recog-nition of the LOFZ as a transcurrent or trans-pressive system.
4.3. Model Results
[23] In Figure 4, we show the results of a modelwith a southward narrowing of both the 1960rupture zone and the subsequent locked zone.
GeochemistryGeophysicsGeosystems G3G3
wang et al.: chile earthquake crustal motion 10.1029/2007GC001721
9 of 14

The reasoning for assuming the southward narrow-ing has been discussed in section 4.2. In thismodel, we assume a uniform coseismic slip of20 m along strike in the rupture zone and completelocking of the locked zone afterward, as done byHu et al. [2004]. This rupture scenario gives an Mw
of 9.52, similar to the seismologically determinedMw of 9.5 for the 1960 event [Kanamori, 1977].
[24] We allow the southward narrowing to occur ina stepwise fashion (Figure 4), consistent with thealong-strike stepwise change in the age of theincoming plate as indicated by offshore magneticanomalies (Figure 1). The age of the oceanic platejumps across transform faults (and their landwardextension beneath the forearc) that are oriented at alarge angle with the Chile trench. For example,major changes in age occur around 37–38�S and41–42�S (Figure 1). Between two adjacent trans-form faults, the age of the plate is nearly constant.Without detailed 3-D thermal modeling, the along-strike change in the thermal regime as a conse-
quence of the stepwise age change cannot bequantified. Even if the temperatures were preciselyknown, there still is large uncertainty whether thedowndip limit of the seismogenic zone exactlyfollows an isotherm. The widths of the rupture/locked and transition zones for the northern halfof the 1960 earthquake zone are 120 km and 80 km,the same as used by Hu et al. [2004]. The widths ofthe southern half are chosen to fit the GPS velocities.
[25] After numerous numerical tests, we concludethat if the width of the 1960 rupture zone and thewidth of the subsequent locked zone are the same,this model cannot simultaneously fit the GPSobservations in both the coastal and inland areassouth of 42�S. Depending on the width, the modelwould predict either coastal velocities that are toolarge or inland velocities that are too small. Withthe locked zone assumed to be slightly wider thanthe rupture zone, the model can fit the generalpattern of the GPS observations reasonably well(Figure 4b). The southward narrowing of both the
Figure 4. Results for a model with southward narrowing of both the 1960 rupture zone and subsequent locked zone.(a) Coseismic vertical deformation. Contours are in centimeters. For the subsidence area, only the �30 cm contour isshown. (b) Comparison of model velocities calculated 40 a after the earthquake (blue arrows) with sliver-motion-corrected GPS observations. Squares indicate locations of GPS sites. GPS velocities from this work and Klotz et al.[2001] are shown with red and green arrows, respectively, with one-standard-deviation error ellipses. In both Figure 4aand Figure 4b, dark shading and light shading represent the rupture (20 m slip) and coseismic transition zones,respectively. In Figure 4b, thick solid and dashed lines outline the locked and interseismic transition zones,respectively.
GeochemistryGeophysicsGeosystems G3G3
wang et al.: chile earthquake crustal motion 10.1029/2007GC001721
10 of 14
1960 rupture zone and the subsequent locked zonecauses the crustal deformation pattern to be‘‘shifted’’ toward the trench in the south. Nearthe trench and directly above the locked zone, thelandward motion is still at the plate convergencevelocity, but the velocity decreases rapidly land-ward and becomes zero just west of the LOFZ.
[26] The difficulty with assuming a nonuniformwidth of the 1960 rupture is that it cannot producea coseismic vertical deformation pattern as uniformas that observed by Plafker in 1968 [Plafker andSavage, 1970]. His deformation pattern, particularlythe ‘‘hinge line’’ between uplift and subsidence,would suggest a fairly uniform rupture width[Barrientos and Ward, 1990]. The pattern shownin Figure 4a in the northern half of the 1960 rupturezone is the same as that of Hu et al. [2004]. Herethe hinge line is located more landward thanPlafker’s, because of the wide rupture zone usedto account for the effects of continuing short-termpostseismic deformation after 1968, as discussed in
section 4.1 and Hu et al. [2004]. In the southernpart where the seismogenic zone is assumed to benarrower, the hinge line is more consistent withthat of Plafker’s. If the pattern in Figure 4a iscorrect, it implies that the rapid short-term post-seismic deformation in the south had been largelydiminished when Plafker visited these sites in1968, such that we do not need to use a wider-than-actual rupture zone for this part of the model.Conceivably, the warmer thermal regime in thesouth may give rise to a faster process of short-term deformation by affecting frictional propertiesof the megathrust and rock rheology of the shallowpart of the subduction zone.
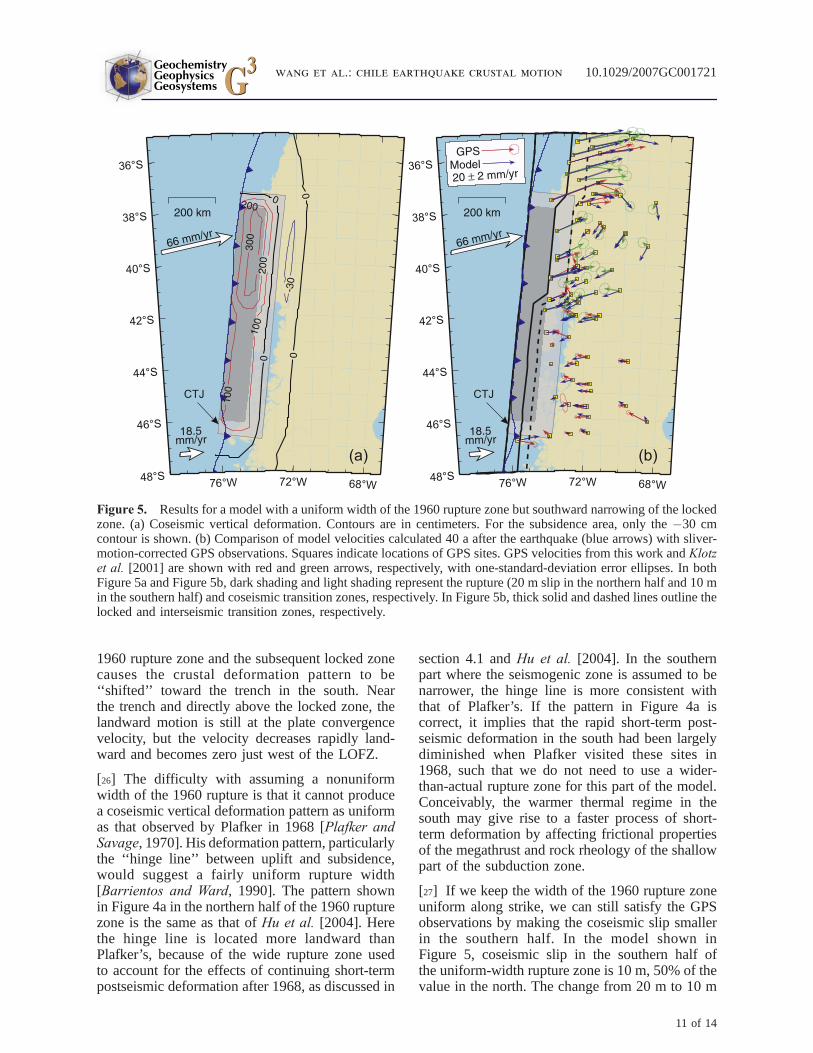
[27] If we keep the width of the 1960 rupture zoneuniform along strike, we can still satisfy the GPSobservations by making the coseismic slip smallerin the southern half. In the model shown inFigure 5, coseismic slip in the southern half ofthe uniform-width rupture zone is 10 m, 50% of thevalue in the north. The change from 20 m to 10 m
Figure 5. Results for a model with a uniform width of the 1960 rupture zone but southward narrowing of the lockedzone. (a) Coseismic vertical deformation. Contours are in centimeters. For the subsidence area, only the �30 cmcontour is shown. (b) Comparison of model velocities calculated 40 a after the earthquake (blue arrows) with sliver-motion-corrected GPS observations. Squares indicate locations of GPS sites. GPS velocities from this work and Klotzet al. [2001] are shown with red and green arrows, respectively, with one-standard-deviation error ellipses. In bothFigure 5a and Figure 5b, dark shading and light shading represent the rupture (20 m slip in the northern half and 10 min the southern half) and coseismic transition zones, respectively. In Figure 5b, thick solid and dashed lines outline thelocked and interseismic transition zones, respectively.
GeochemistryGeophysicsGeosystems G3G3
wang et al.: chile earthquake crustal motion 10.1029/2007GC001721
11 of 14
slip is assumed to occur in the same place as thewidth change in the model shown in Figure 4. Themoment magnitude for this rupture scenario is9.49. Fault locking after the earthquake is identicalto that of the model shown in Figure 4. A com-parison of Figure 5b with Figure 4b shows that, inaffecting horizontal deformation, making thecoseismic slip smaller is similar to making therupture zone narrower. The vertical deformationpattern produced by the model of uniform rupturewidth is more comparable with Plafker’s observedpattern, except for the more landward location ofthe hinge line for reasons explained above.
[28] No single model can uniquely explain the GPSobservations shown in Figures 1 and 2. For a sitesufficiently away from the trench, a narrowerrupture zone with a larger coseismic slip or a widerrupture zone with a smaller slip can have a similareffect, a narrower locked zone with complete lock-ing or a wider locked zone with incomplete lockingcan have a similar effect, and so forth. With carefulmatching of parameters, a model involving incom-plete interseismic locking can also fit the GPSobservations. A southward decrease in the thicknessof the Nazca plate in the model, also compatiblewith its younger age in the south, can also to somedegree account for the southward decrease incoastal margin-normal velocities. Given the manysimplifying assumptions required to set up thenumerical model, we do not think selecting thebest parameter combination on the basis of astatistical measure of data fit is very meaningful.The two models shown in Figures 4 and 5 serve todemonstrate that the southward decrease in margin-normal velocities of near-coast GPS sites can beadequately explained by a southward change in thewidth or frictional properties of the seismogeniczone.
5. Conclusions
[29] 1. GPS velocities determined by campaignsurveys conducted during 1993–2005 have con-firmed the presence of opposing motion of coastaland inland sites previously reported by Klotz et al.[2001] for the northern part of the region affectedby the Mw 9.5 great Chile earthquake of 1960. Thenew observations show that the opposing motion ispresent also in the southern part and throughout the1960 earthquake zone. The observations thussupport the concept of prolonged postseismicdeformation after an earthquake of very large
along-strike length. The landward motion of coast-al sites reflects the current locking of the plateinterface, and the seaward motion of inland sitesindicates viscoelastic relaxation of the stressinduced by the 1960 earthquake.
[30] 2. The new GPS observations provide the firstgeodetic evidence for the active dextral shearmotion of the LOFZ and the consequent northwardtranslation of a forearc sliver. The observed motionof the forearc can be described as block translationat 6.5 mm/a, with the rate tapering to zero north-ward at the northern termination of the LOFZ. Ourfinding is consistent with the model of forearcsliver motion accommodating the strike-slip com-ponent of oblique plate convergence. It suggeststhe need for further geological and geodetic inves-tigation of the modern motion of the LOFZ.
[31] 3. The new GPS observations indicate asouthward decrease in the current margin-normalmotion of the coastal area in the region of the 1960rupture. The present data do not allow a unique andunambiguous explanation for this change. Ourpreferred explanation is that the southwarddecrease in the age of the subducting plate andconsequently the increase in the temperature on theplate interface give rise to changes in the width orfrictional properties of the megathrust seismo-genic zone. The southern part of the presentlylocked portion of the plate interface is likely tobe narrower. A modification of an earlier 3-Dviscoelastic postseismic deformation model of Huet al. [2004] to account for this southwardchange can explain the first-order pattern of theGPS observations.
Acknowledgments
[32] We thank the Instituto Geografico Militar de Chile,
UNAVCO, Gino Cassassa and the Universidad de Magallanes,
Romualdo Moreno Arias, Alvaro Giannini, and Sabine Comes
for their assistance with the GPS measurements in Chile, and
Adolfo Garcia and Horacio Barrera of Instituto Geografico
Militar Argentina for their assistance with the GPS measure-
ments in Argentina. We would also like to acknowledge the
encouragement and the assistance of Detleff Angermann and
Jurgen Klotz of CAP’s sister project, SAGA; the GPS cam-
paign in 1994 was a collaborative effort between CAP and
SAGA. J. He wrote the computer program, PGCvisel, that we
used to develop the 3-D finite element model in this work and
provided assistance in the modeling work. We thank
R. Burgmann and H. Dragert for their valuable comments.
This is Geological Survey of Canada contribution 20070241
and the Center for Earthquake Research and Information
(U. Memphis) contribution 514.
GeochemistryGeophysicsGeosystems G3G3
wang et al.: chile earthquake crustal motion 10.1029/2007GC001721
12 of 14

References
Angermann, D., J. Klotz, and C. Reigber (1999), Space-geodetic estimation of the Nazca-South America Eulervector, Earth Planet. Sci. Lett., 171, 329–334.
Barrientos, S. E., and P. S. Acevedo-Aranguiz (1992), Seismo-logical aspects of the 1988–1989 Lonquimay (Chile) volca-nic eruption, J. Volcanol. Geotherm. Res., 53, 73–87.
Barrientos, S. E., and S. N. Ward (1990), The 1960 Chileearthquake: Inversion for slip distribution from surface de-formation, Geophys. J. Int., 103, 589–598.
Brooks, B. A., M. Bevis, R. Smalley, Jr., E. Kendrick,R. Manceda, E. Laurıa, R. Maturana, and M. Araujo (2003),Crustal motion in the Southern Andes (26�–36�S): Do theAndes behave like a microplate?, Geochem. Geophys. Geo-syst., 4(10), 1085, doi:10.1029/2003GC000505.
Cande, S. C., R. B. Leslie, J. C. Parra, and M. Hobart (1987),Interaction between the Chile ridge and Chile trench: Geo-physical and geothermal evidence, J. Geophys. Res., 92,495–520.
Cembrano, J., E. Schermer, A. Sanhueza, and A. Lavenu(2000), Along strike variations in the nature and timing ofdeformation along the intra-arc shear zone, the Liquine Ofquifault zone, southern Chilean Andes, Tectonophysics, 319,129–149.
Cembrano, J., A. Lavenu, P. Reynolds, G. Arancibia, G. Lopez,and A. Sanhueza (2002), Late Cenozoic transpressionalductile deformation north of the Nazca–South America–Antarctica triple junction, Tectonophysics, 354, 289–314.
Chinn, D. S., and B. L. Isacks (1983), Accurate source depthsand focal mechanisms of shallow earthquakes in westernSouth America and in the New Hebrides island arc, Tectonics,2(6), 529–563.
Chlieh, M., J.-P. Avouac, V. Hjorleifsdottir, T.-R. A. Song, C. Ji,K. Sieh, A. Sladen, H. Hebert, L. Prawirodirdjo, Y. Bock, andJ. Galetzka (2007), Coseismic slip and afterslip of the greatMw 9.15 Sumatra-Andaman earthquake of 2004, Bull. Seis-mol. Soc. Am., 97(1A), S152–S173.
Cifuentes, I. L. (1989), The 1960 Chilean Earthquakes,J. Geophys. Res., 94, 665–680.
DeMets, C., R. G. Gordon, D. F. Argus, and S. Stein (1994),Effect of recent revisions to the geomagnetic reversal timescale on estimates of current plate motions, Geophys. Res.Lett., 21(20), 2191–2194.
Fitch, T. J. (1972), Plate convergence, transcurrent faults andinternal deformation adjacent to southeast Asia and the wes-tern Pacific, J. Geophys. Res., 77, 4432–4460.
Freed, A. M., R. Burgmann, E. Calais, and J. Freymueller(2006), Stress-dependent power-law flow in the upper man-tle following the 2002 Denali, Alaska, earthquake, EarthPlanet. Sci. Lett., 252, 481–489.
Freymueller, J. T., S. C. Cohen, and H. J. Fletcher (2000),Spatial variations in continuously monitoring GPS stationsabout 100 to 250 km from present-day deformation, KenaiPeninsula, Alaska, and their implications, J. Geophys. Res.,105, 8079–8101.
Hoffmann-Rothe, A., N. Kukowski, G. Dresen, H. Echtler,O. Oncken, J. Klotz, E. Scheuber, and A. Kellner (2006),Oblique convergence along the Chilean margin: Partition-ing, margin-parallel faulting and force interaction at theplate interface, in The Andes: Active Subduction Orogeny,edited by O. Oncken et al., pp. 125–146, Springer, Berlin.
Hu, Y., K. Wang, J. He, J. Klotz, and G. Khazaradze (2004),Three-dimensional viscoelastic finite element model for
postseismic deformation of the great 1960 Chile earthquake,J. Geophys. Res., 109, B12403, doi:10.1029/2004JB003163.
Hyndman, R. D., and K. Wang (1993), Thermal constraints onthe zone of major thrust earthquake failure: The Cascadiasubduction zone, J. Geophys. Res., 98, 2039–2060.
Kanamori, H. (1977), The energy release in great earthquake,J. Geophys. Res., 82, 2981–2987.
Kendrick, E., M. Bevis, R. Smalley, R. Barriga, R. Maturana,F. Galban, F. Forconesi, V. H. Rıos, and J. Normandeau(1997), Preliminary results of the Central Andes GPS Pro-ject, Eos Trans. AGU, 78(46), Fall Meet. Suppl., F167.
Kendrick, E., M. Bevis, R. Smalley, Jr., and B. Brooks (2001),An integrated crustal velocity field for the central Andes,Geochem. Geophys. Geosyst., 2(11), doi:10.1029/2001GC000191.
Kendrick, E., M. Bevis, R. Smalley, Jr., B. Brooks, R. B.Vargas, E. Laurıa, and L. P. S. Fortes (2003), The Nazca–South America Euler vector and its rate of change, J. S. Am.Earth Sci., 16, 125–131.
Khazaradze, G., K. Wang, J. Klotz, Y. Hu, and J. He (2002),Prolonged post-seismic deformation of the 1960 great Chileearthquake and implications for mantle rheology, Geophys.Res. Lett., 29(22), 2050, doi:10.1029/2002GL015986.
Klotz, J. (2006), Long-term signals in the present-day defor-mation field of the central and southern Andes and con-straints on the viscosity of the Earth’s upper mantle, in TheAndes: Active subduction Orogeny, edited by O. Oncken etal., pp. 65–89, Springer, Berlin.
Klotz, J., G. Khazaradze, D. Angermann, C. Reigber, R. Perdomo,and O. Cifuentes (2001), Earthquake cycle dominates contem-porary crustal deformation in Central and Southern Andes,Earth Planet. Sci. Lett., 193, 437–446.
McCaffrey, R. (1994), Global variability in subduction thrustzone—Forearc systemsPure Appl. Geophys., 142(1), 173–224.
McCaffrey, R., P. Zwick, Y. Bock, L. Prawirodirdjo, J. Genrich,C. Stevens, S. Puntodewo, and C. Subarya (2000), Strainpartitioning during oblique plate convergence in northernSumatra: Geodetic observations and numerical modeling,J. Geophys. Res., 105, 28,363–28,375.
Melbourne, T. I., F. H. Webb, J. M. Stock, and C. Reigber(2002), Rapid postseismic transients in subduction zonesfrom continuous GPS, J. Geophys. Res., 107(B10), 2241,doi:10.1029/2001JB000555.
Melosh, H. J., and A. Raefsky (1981), A simple and efficientmethod for introducing faults into finite element computa-tions, Bull. Seismol. Soc. Am., 71, 1391–1400.
Nelson, E., R. Forsythe, and I. Arit (1994), Ridge collisiontectonics in terrane development, J. S. Am. Earth Sci., 7,271–278.
Paul, J., A. R. Lowry, R. Bilham, S. Sen, and R. Smalley, Jr.(2007), Postseismic deformation of the Andaman Islandsfollowing the 26 December 2004 Great Sumatra-Andamanea r thquake , Geophys . Res . Le t t . , do i : 10 .1029 /2007GL031024, in press.
Peltier, W. R. (1974), The impulse response of a MaxwellEarth, Rev. Geophys., 12, 649–668.
Plafker, G. (1972), Alaskan earthquake of 1964 and Chileanearthquake of 1960: Implications for arc tectonics, J. Geo-phys. Res., 77, 901–925.
Plafker, G., and J. C. Savage (1970), Mechanism of the Chileanearthquake of May 21 and 22, 1960, Geol. Soc. Am. Bull., 81,1001–1030.
Pollitz, F. F., R. Burgmann, and P. Banerjee (2006), Post-seismicrelaxation following the great 2004 Sumatra-Andaman earth-
GeochemistryGeophysicsGeosystems G3G3
wang et al.: chile earthquake crustal motion 10.1029/2007GC001721
13 of 14
quake on a compressible self-gravitating Earth, Geophys. J.Int., 167, 397–420.
Prawirodirdjo, L., and Y. Bock (2004), Instantaneous globalplate motion model from 12 years of continuous GPS ob-servations, J. Geophys. Res., 109, B08405, doi:10.1029/2003JB002944.
Rosenau, M., D. Melnick, and H. Echtler (2006), Kinematicconstraints on intra-arc shear and strain partitioning in thesouthern Andes between 38�S and 42�S latitude, Tectonics,25, TC4013, doi:10.1029/2005TC001943.
Savage, J. C. (1983), A dislocation model of strain accumula-tion and release at a subduction zone, J. Geophys. Res., 88,4984–4996.
Savage, J. C., J. L. Svarc, and W. H. Prescott (1999), Deforma-tion across the Alaska-Aleutian subduction zone near Kodiak,Geophys. Res. Lett., 26, 2117–2120.
Sella, G. F., T. H. Dixon, and A. Mao (2002), REVEL: A modelfor Recent plate velocities from space geodesy, J. Geophys.Res., 107(B4), 2081, doi:10.1029/2000JB000033.
Wallace, L. M., J. Beavan, R. McCaffrey, and D. Darby(2004), Subduction zone coupling and tectonic block rota-
tions in the North Island, New Zealand, J. Geophys. Res.,109, B12406, doi:10.1029/2004JB003241.
Wang, K. (2007), Elastic and viscoelastic models of subduc-tion earthquake cycles, in The Seismogenic Zone of Subduc-tion Thrust Faults, edited by T. H. Dixon and J. C. Moore,pp. 540–575, Columbia Univ. Press, New York.
Wang, K., J. He, H. Dragert, and T. James (2001), Three-dimensional viscoelastic interseismic deformation modelfor the Cascadia subduction zone, Earth Planets Space, 53,295–306.
Wang, K., R. Wells, S. Mazzotti, R. D. Hyndman, andT. Sagiya (2003), A revised dislocation model of interseismicdeformation of the Cascadia subduction zone, J. Geophys.Res., 108(B1), 2026, doi:10.1029/2001JB001227.
Wells, R. E., C. S. Weaver, and R. J. Blakely (1998), Forearcmigration in Cascadia and its neotectonic significance,Geology, 26, 759–762.
Yu, G., S. Wesnousky, and G. Ekstrom (1993), Slip partition-ing along major convergence plate boundaries, Pure Appl.Geophys., 140(2), 183–210.
GeochemistryGeophysicsGeosystems G3G3
wang et al.: chile earthquake crustal motion 10.1029/2007GC001721
14 of 14