csn day 2020
TRANSCRIPT

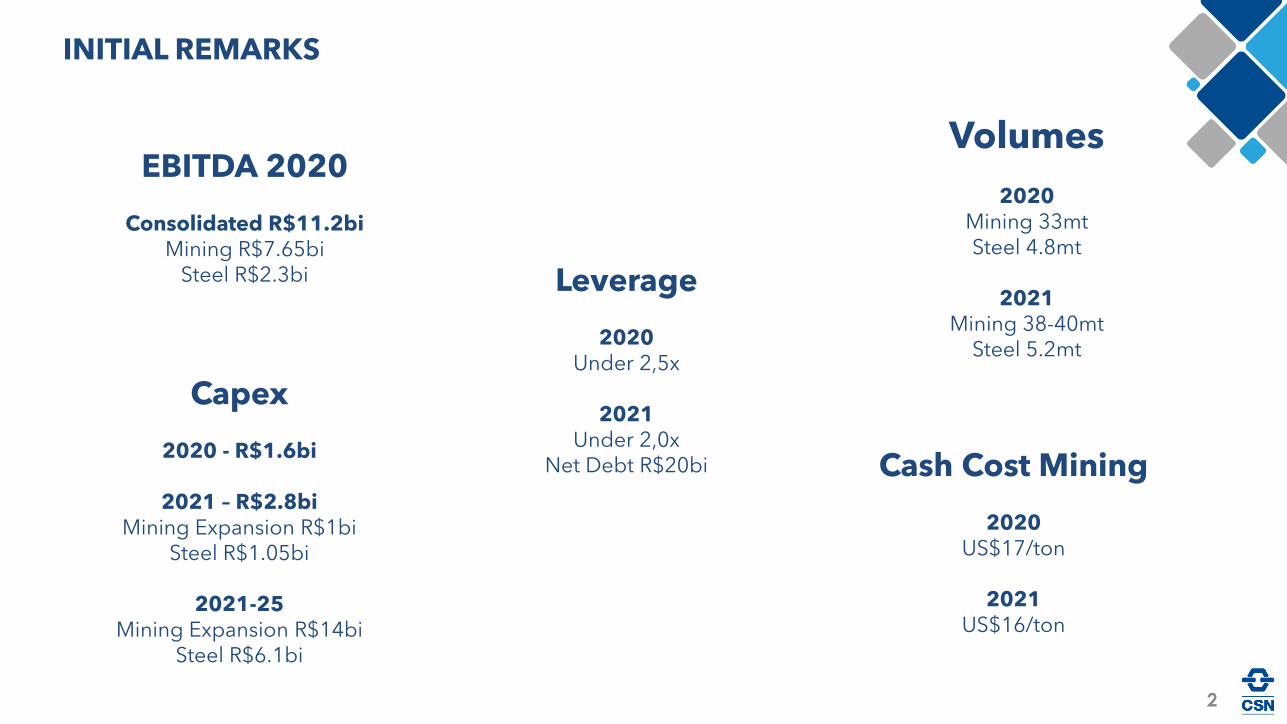
INITIAL REMARKS
2
EBITDA 2020
Consolidated R$11.2biMining R$7.65bi
Steel R$2.3bi
Volumes
2020Mining 33mtSteel 4.8mt
2021Mining 38-40mt
Steel 5.2mt
Capex
2020 - R$1.6bi
2021 – R$2.8biMining Expansion R$1bi
Steel R$1.05bi
2021-25 Mining Expansion R$14bi
Steel R$6.1bi
Leverage
2020Under 2,5x
2021Under 2,0x
Net Debt R$20bi Cash Cost Mining
2020 US$17/ton
2021US$16/ton
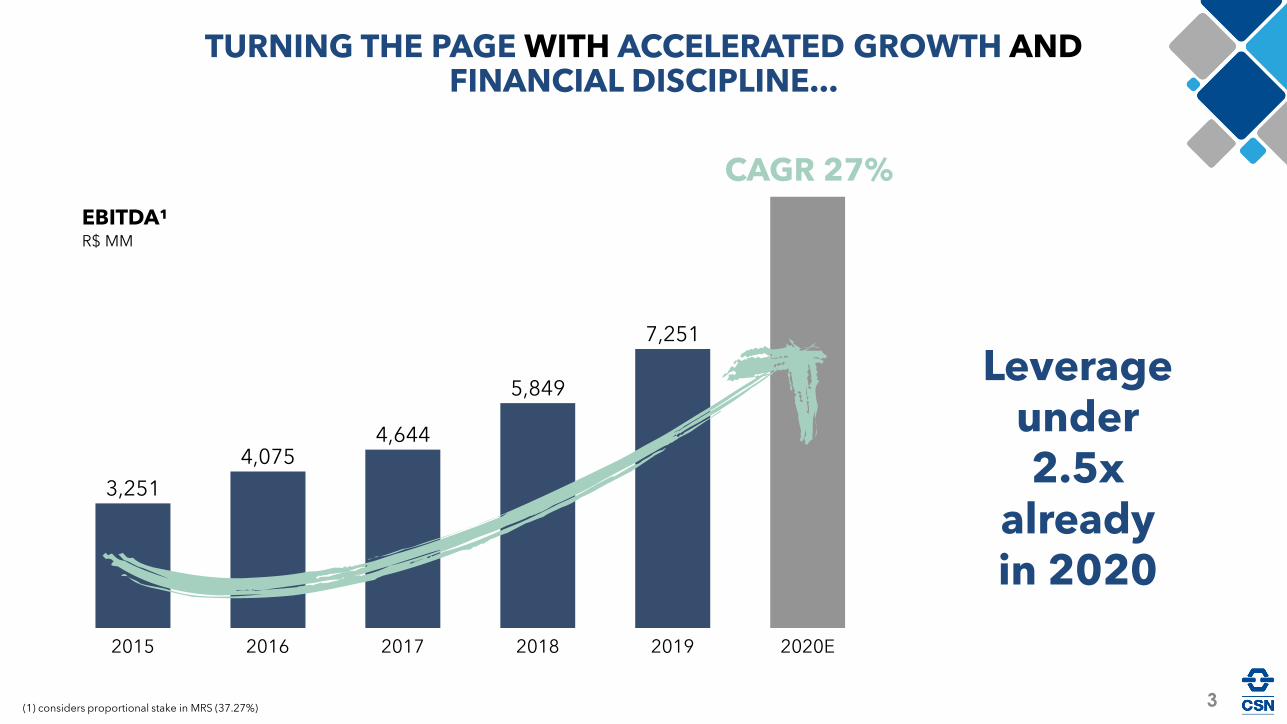
EBITDA¹R$ MM
20192015
3,251
2016 2017 2018
4,075
2020E
4,644
5,849
7,251
TURNING THE PAGE WITH ACCELERATED GROWTH AND FINANCIAL DISCIPLINE...
(1) considers proportional stake in MRS (37.27%)
Leverageunder2.5x
alreadyin 2020
CAGR 27%
3
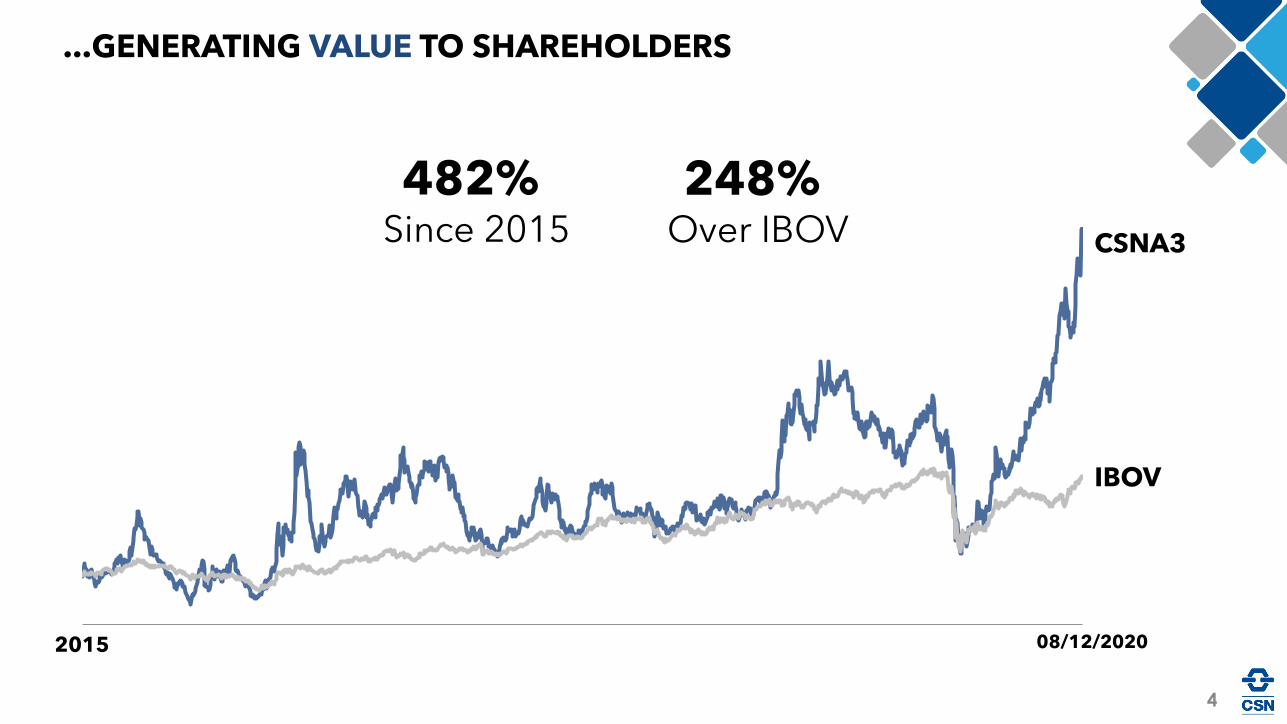
...GENERATING VALUE TO SHAREHOLDERS
IBOV
2015
CSNA3
482% Since 2015
248% Over IBOV
08/12/2020
4
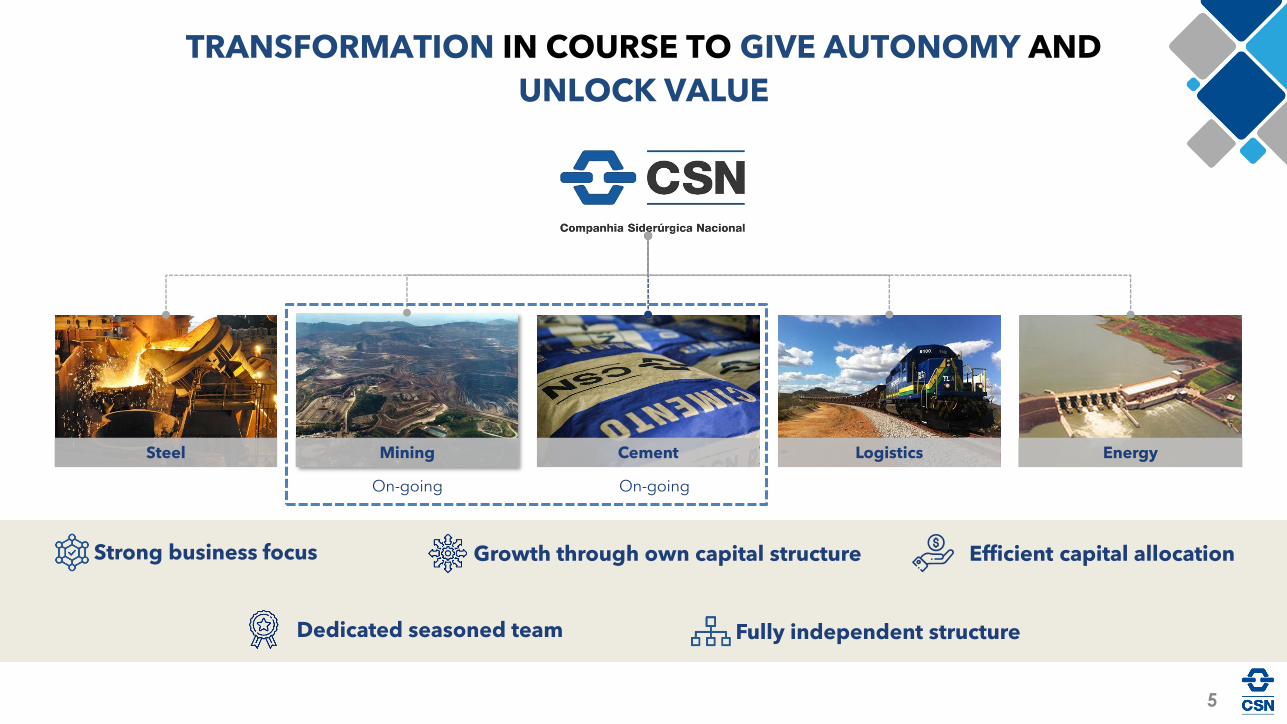
Steel Mining Cement Logistics Energy
On-going On-going
Dedicated seasoned team
Growth through own capital structure Efficient capital allocationStrong business focus
Fully independent structure
5
TRANSFORMATION IN COURSE TO GIVE AUTONOMY AND
UNLOCK VALUE
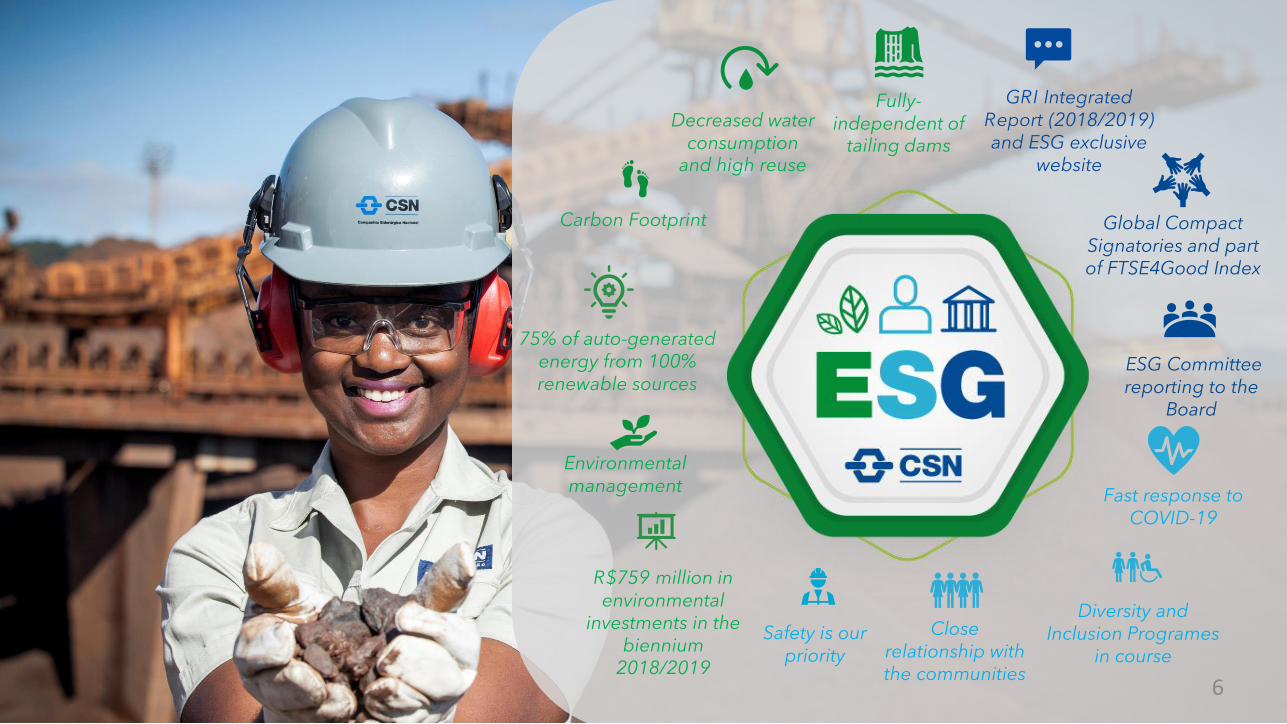
Close relationship with the communities
Diversity and Inclusion Programes
in course
Fast response to COVID-19
Carbon Footprint
Environmental management
Decreased water consumption
and high reuse
Global Compact Signatories and part of FTSE4Good Index
GRI Integrated Report (2018/2019) and ESG exclusive
website
Fully-independent of
tailing dams
ESG Committee reporting to the
Board
75% of auto-generated energy from 100% renewable sources
R$759 million in environmental
investments in the biennium
2018/2019
Safety is our priority
6

CSN Mineração has become, since January2020, the first Brazilian mining company100% independent of tailing dams usage.
Filtering dam view.
100% of the tailings generated is filtered and dry stacked.
7
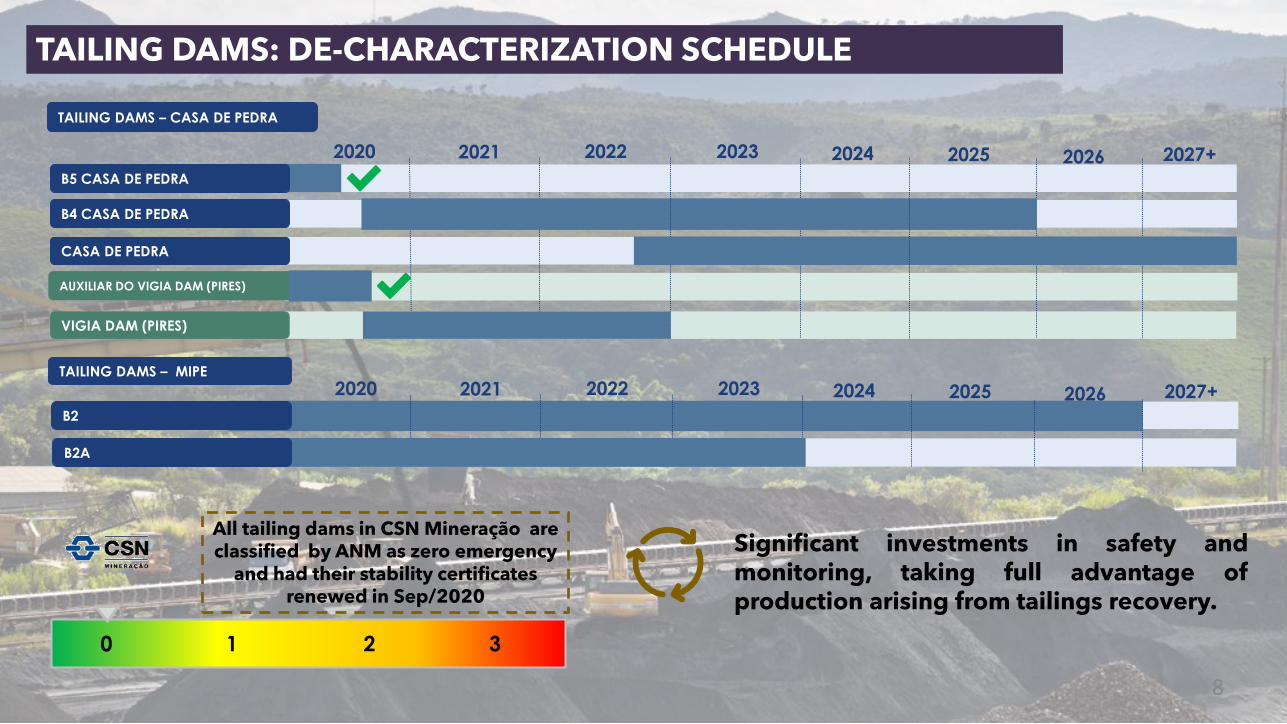
TAILING DAMS: DE-CHARACTERIZATION SCHEDULE
CASA DE PEDRA
AUXILIAR DO VIGIA DAM (PIRES)
VIGIA DAM (PIRES)
2020
B4 CASA DE PEDRA
2024 20252021 2022 2023
B5 CASA DE PEDRA
2026 2027+
0 1 2 3
TAILING DAMS – CASA DE PEDRA
TAILING DAMS – MIPE
2020 2024 20252021 2022 2023
B2
2026 2027+
B2A
All tailing dams in CSN Mineração are classified by ANM as zero emergency
and had their stability certificatesrenewed in Sep/2020
Significant investments in safety andmonitoring, taking full advantage ofproduction arising from tailings recovery.
8
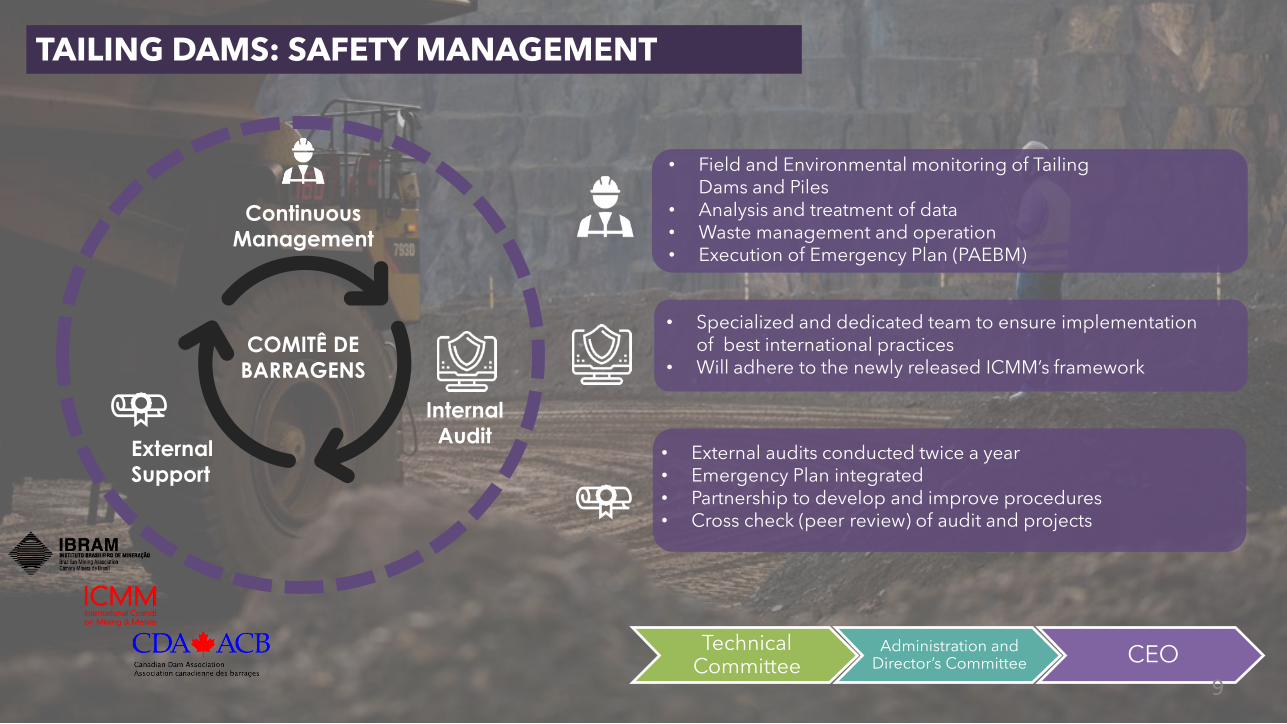
TAILING DAMS: SAFETY MANAGEMENT
• Field and Environmental monitoring of Tailing Dams and Piles
• Analysis and treatment of data• Waste management and operation• Execution of Emergency Plan (PAEBM)
• Specialized and dedicated team to ensure implementation of best international practices
• Will adhere to the newly released ICMM’s framework
• External audits conducted twice a year• Emergency Plan integrated • Partnership to develop and improve procedures• Cross check (peer review) of audit and projects
Continuous
Management
COMITÊ DE
BARRAGENS
Internal
AuditExternal
Support
TechnicalCommittee
Administration andDirector’s Committee CEO
9
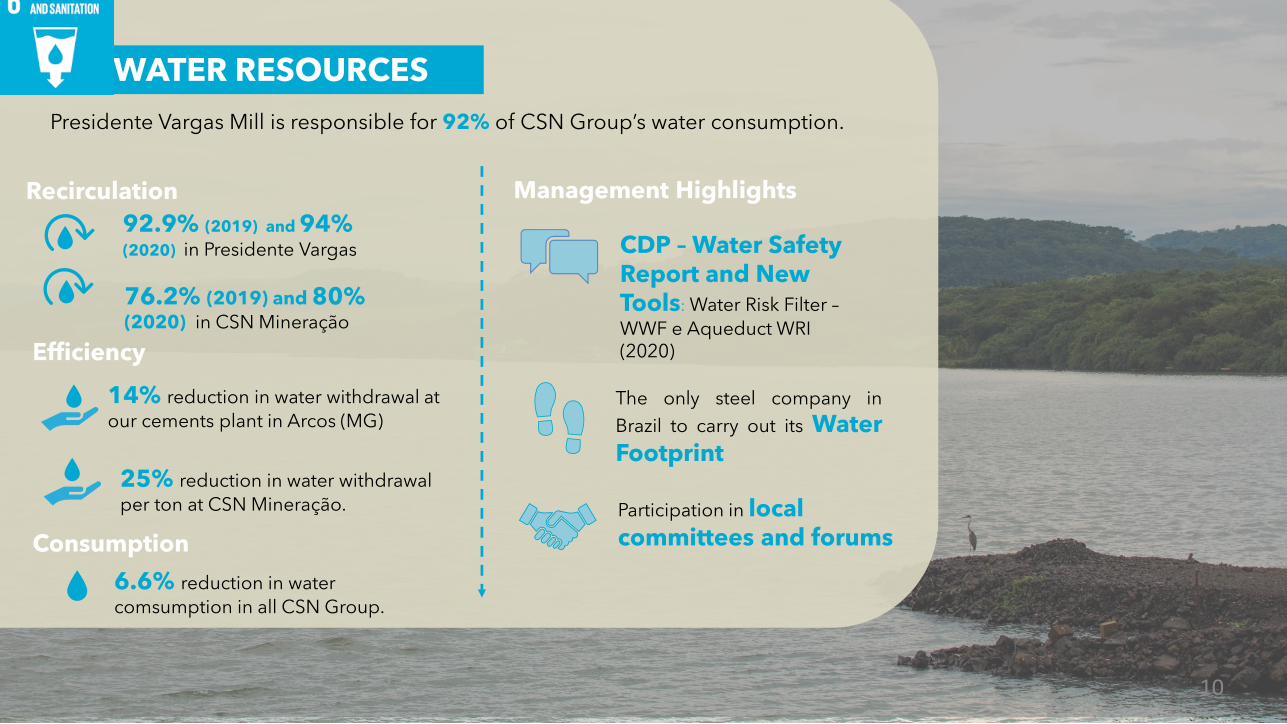
WATER RESOURCES
92.9% (2019) and 94% (2020) in Presidente Vargas
76.2% (2019) and 80%(2020) in CSN Mineração
Presidente Vargas Mill is responsible for 92% of CSN Group’s water consumption.
Efficiency
Recirculation
14% reduction in water withdrawal at
our cements plant in Arcos (MG)
25% reduction in water withdrawal
per ton at CSN Mineração.
Consumption
6.6% reduction in water
comsumption in all CSN Group.
Management Highlights
CDP – Water SafetyReport and New Tools: Water Risk Filter –
WWF e Aqueduct WRI (2020)
Participation in local committees and forums
The only steel company in
Brazil to carry out its WaterFootprint
10
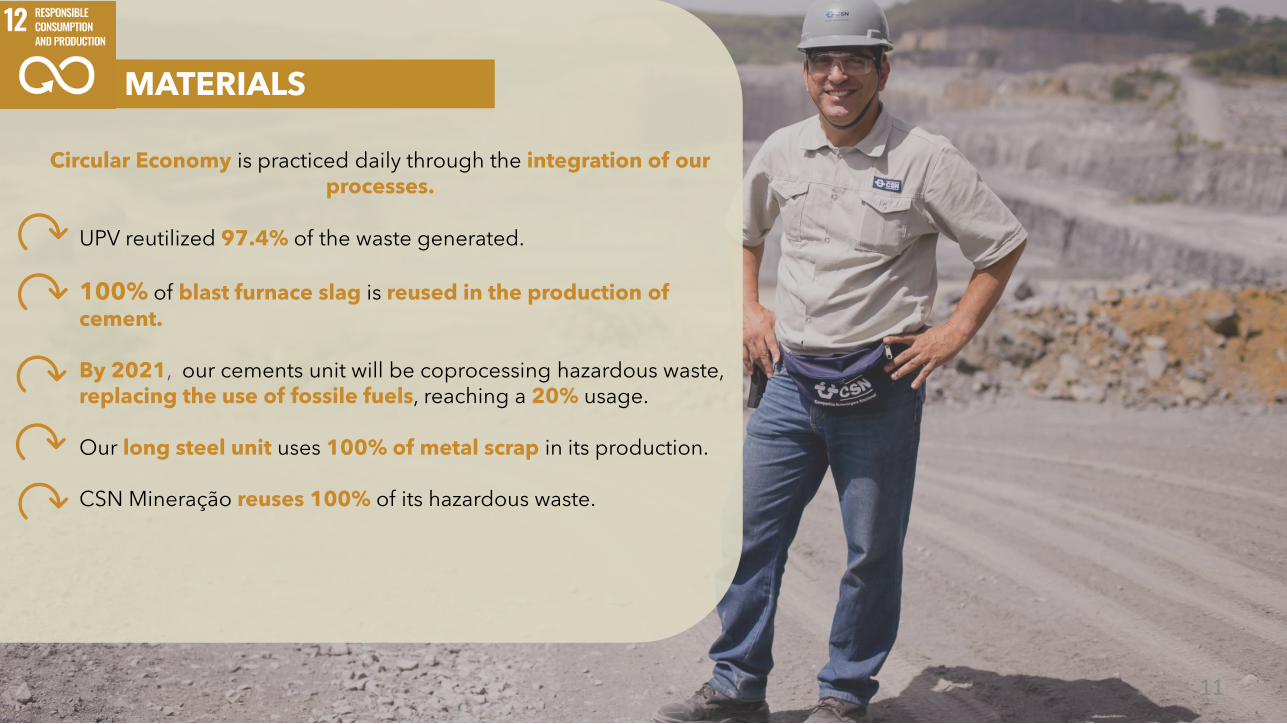
MATERIALS
Circular Economy is practiced daily through the integration of ourprocesses.
UPV reutilized 97.4% of the waste generated.
100% of blast furnace slag is reused in the production of cement.
By 2021, our cements unit will be coprocessing hazardous waste, replacing the use of fossile fuels, reaching a 20% usage.
Our long steel unit uses 100% of metal scrap in its production.
CSN Mineração reuses 100% of its hazardous waste.
11
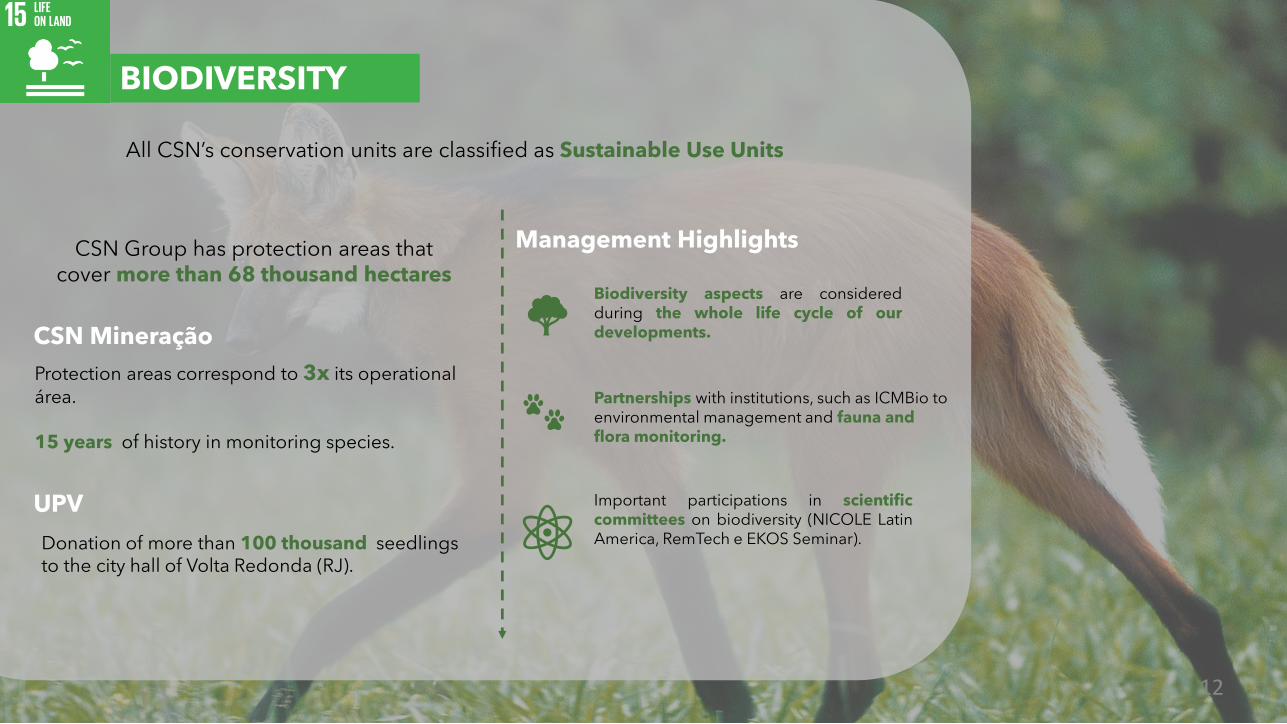
BIODIVERSITY
All CSN’s conservation units are classified as Sustainable Use Units
Management Highlights
Biodiversity aspects are consideredduring the whole life cycle of ourdevelopments.
Partnerships with institutions, such as ICMBio toenvironmental management and fauna andflora monitoring.
Important participations in scientificcommittees on biodiversity (NICOLE LatinAmerica, RemTech e EKOS Seminar).
CSN Mineração
UPV
CSN Group has protection areas thatcover more than 68 thousand hectares
Protection areas correspond to 3x its operationalárea.
15 years of history in monitoring species.
Donation of more than 100 thousand seedlingsto the city hall of Volta Redonda (RJ).
12
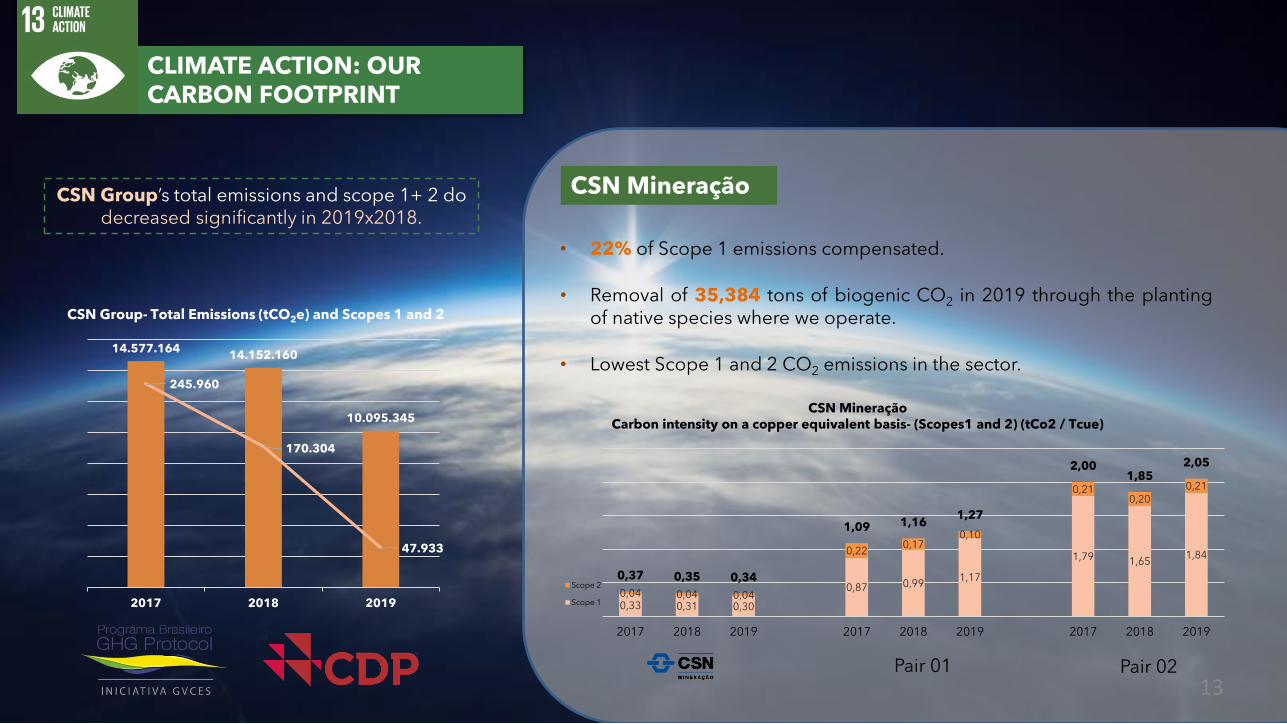
CLIMATE ACTION: OUR CARBON FOOTPRINT
CSN MineraçãoCSN Group’s total emissions and scope 1+ 2 do decreased significantly in 2019x2018.
• 22% of Scope 1 emissions compensated.
• Removal of 35,384 tons of biogenic CO2 in 2019 through the plantingof native species where we operate.
• Lowest Scope 1 and 2 CO2 emissions in the sector.14.577.164
14.152.160
10.095.345
245.960
170.304
47.933
2017 2018 2019
CSN Group- Total Emissions (tCO2e) and Scopes 1 and 2
Pair 01 Pair 02
0,33 0,31 0,30
0,87 0,991,17
1,79 1,651,84
0,04 0,04 0,04
0,220,17
0,10
0,210,20
0,21
0,37 0,35 0,34
1,09 1,161,27
2,001,85
2,05
2017 2018 2019 2017 2018 2019 2017 2018 2019
CSN Mineração Carbon intensity on a copper equivalent basis- (Scopes1 and 2) (tCo2 / Tcue)
Scope 2
Scope 1
13
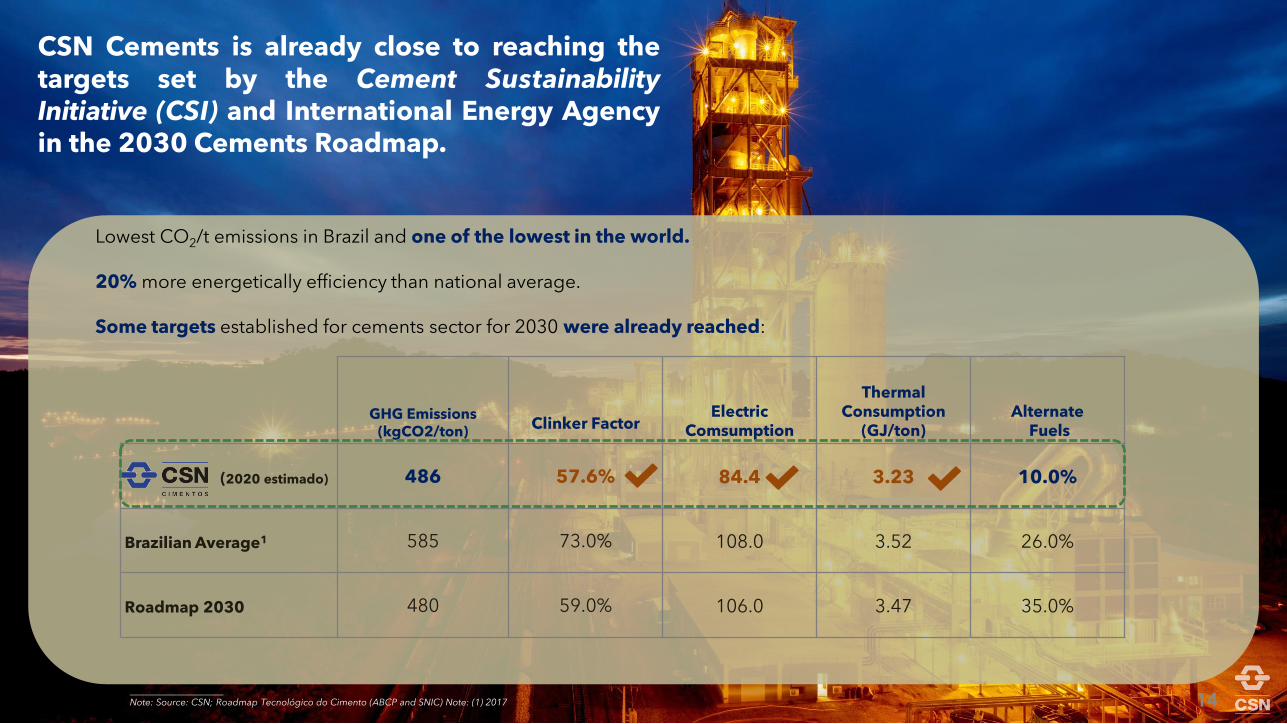
CSN Cements is already close to reaching thetargets set by the Cement SustainabilityInitiative (CSI) and International Energy Agencyin the 2030 Cements Roadmap.
____________________Note: Source: CSN; Roadmap Tecnológico do Cimento (ABCP and SNIC) Note: (1) 2017
Lowest CO2/t emissions in Brazil and one of the lowest in the world.
20% more energetically efficiency than national average.
Some targets established for cements sector for 2030 were already reached:
GHG Emissions (kgCO2/ton)
Clinker FactorElectric
Comsumption
Thermal Consumption
(GJ/ton)Alternate
Fuels
(2020 estimado) 486 57.6% 84.4 3.23 10.0%
Brazilian Average1 585 73.0% 108.0 3.52 26.0%
Roadmap 2030 480 59.0% 106.0 3.47 35.0%
14
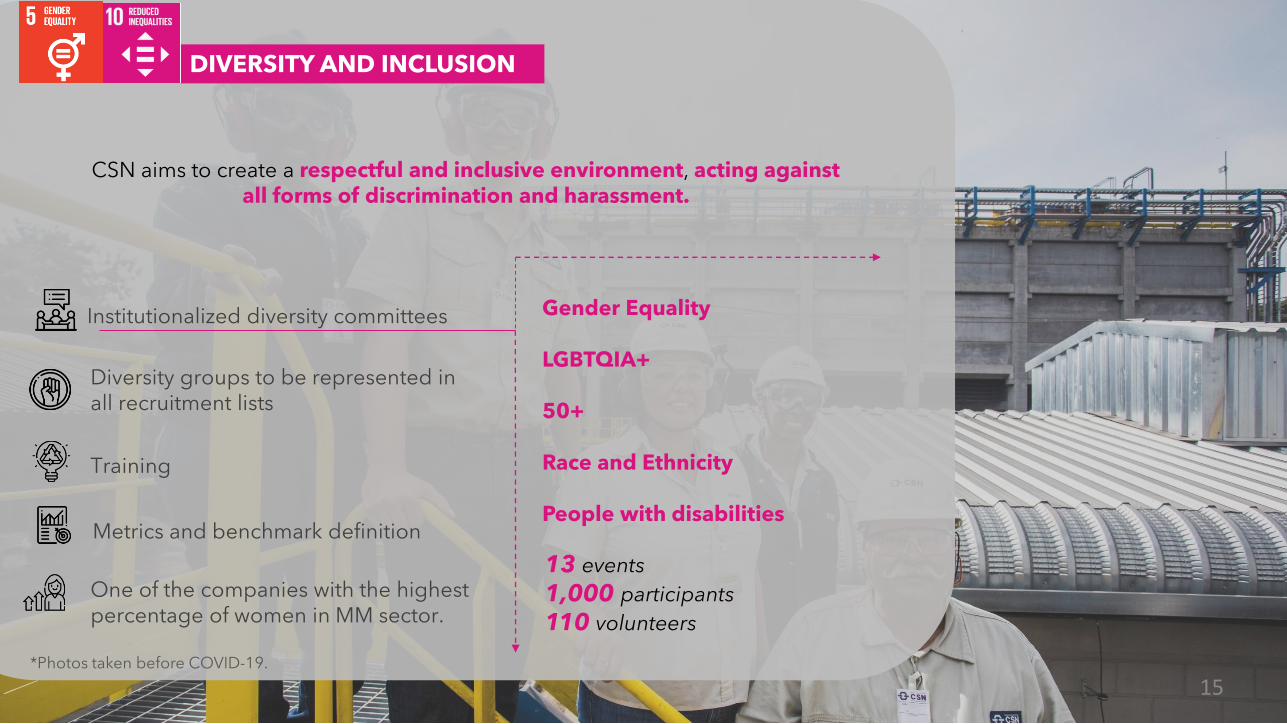
DIVERSITY AND INCLUSION
Institutionalized diversity committees
Training
Metrics and benchmark definition
One of the companies with the highest percentage of women in MM sector.
Diversity groups to be represented in all recruitment lists
CSN aims to create a respectful and inclusive environment, acting againstall forms of discrimination and harassment.
Gender Equality
LGBTQIA+
50+
Race and Ethnicity
People with disabilities
13 events
1,000 participants
110 volunteers
*Photos taken before COVID-19.
15
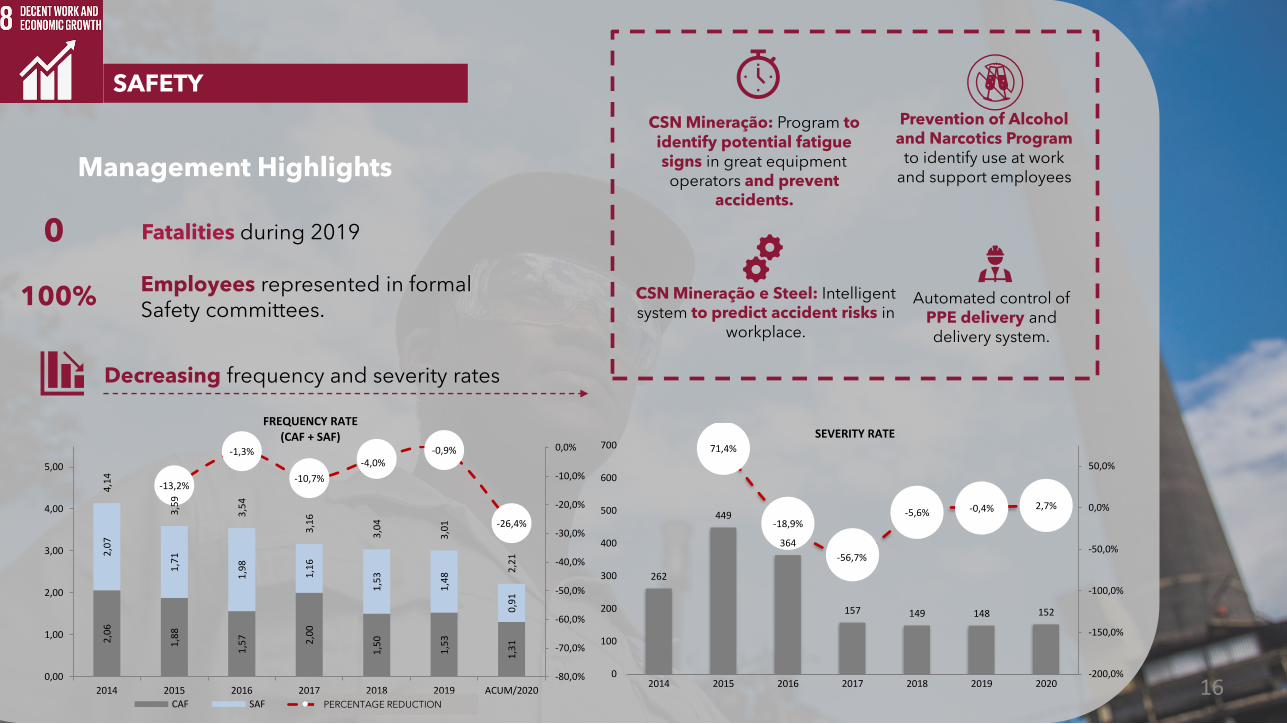
SAFETY
Management Highlights
CSN Mineração: Program to identify potential fatigue signs in great equipment operators and prevent
accidents.
CSN Mineração e Steel: Intelligent system to predict accident risks in
workplace.
Prevention of Alcohol and Narcotics Program
to identify use at work and support employees
Automated control of PPE delivery and delivery system.
0 Fatalities during 2019
Employees represented in formal Safety committees.
100%
Decreasing frequency and severity rates
2,0
6
1,8
8
1,5
7 2,0
0
1,5
0
1,5
3
1,3
1
2,0
7
1,7
1
1,9
8
1,1
6
1,5
3
1,4
8
0,9
1
4,1
4
3,5
9
3,5
4
3,1
6
3,0
4
3,0
1
2,2
1
-13,2%
-1,3%
-10,7%
-4,0%-0,9%
-26,4%
-80,0%
-70,0%
-60,0%
-50,0%
-40,0%
-30,0%
-20,0%
-10,0%
0,0%
0,00
1,00
2,00
3,00
4,00
5,00
2014 2015 2016 2017 2018 2019 ACUM/2020
FREQUENCY RATE(CAF + SAF)
CAF SAF REDUÇÃO PENCENTUAL
262
449
364
157 149 148 152
71,4%
-18,9%
-56,7%
-5,6% -0,4% 2,7%
-200,0%
-150,0%
-100,0%
-50,0%
0,0%
50,0%
0
100
200
300
400
500
600
700
2014 2015 2016 2017 2018 2019 2020
SEVERITY RATE
PERCENTAGE REDUCTION
16
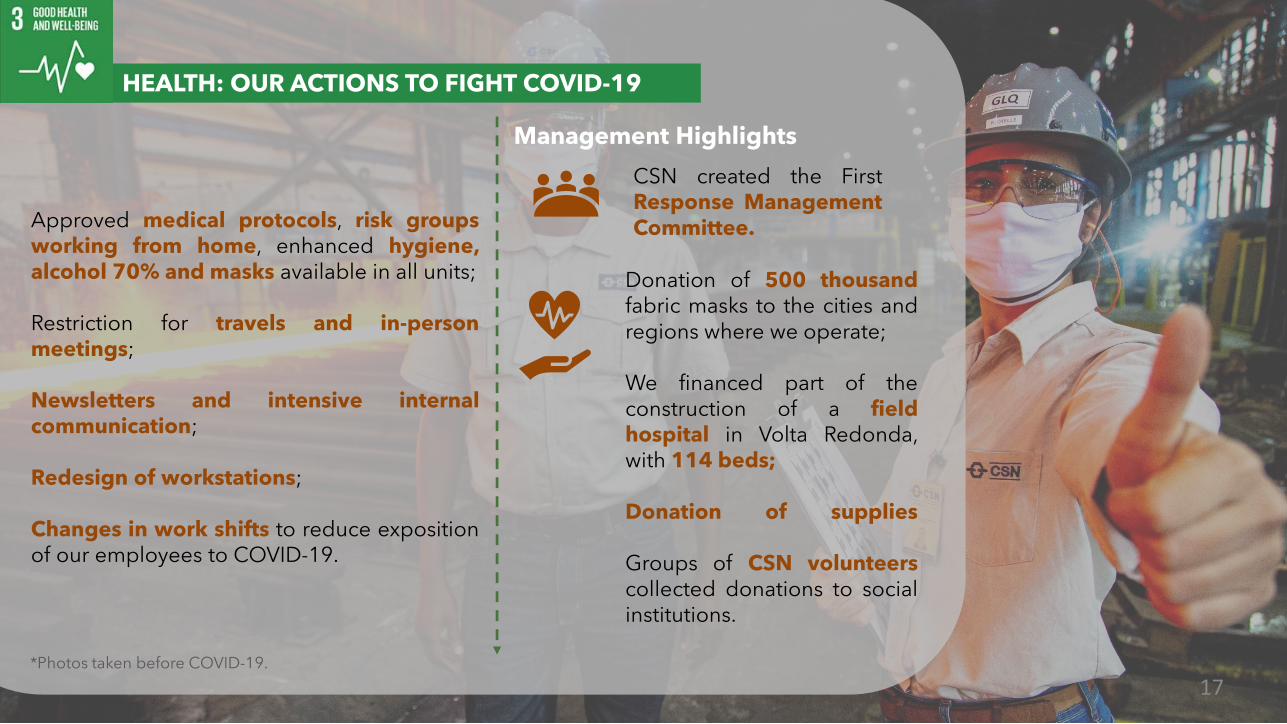
HEALTH: OUR ACTIONS TO FIGHT COVID-19
Approved medical protocols, risk groupsworking from home, enhanced hygiene,alcohol 70% and masks available in all units;
Restriction for travels and in-personmeetings;
Newsletters and intensive internalcommunication;
Redesign of workstations;
Changes in work shifts to reduce expositionof our employees to COVID-19.
Management Highlights
Donation of 500 thousandfabric masks to the cities andregions where we operate;
We financed part of theconstruction of a fieldhospital in Volta Redonda,with 114 beds;
Donation of supplies
Groups of CSN volunteerscollected donations to socialinstitutions.
CSN created the FirstResponse ManagementCommittee.
*Photos taken before COVID-19.
17
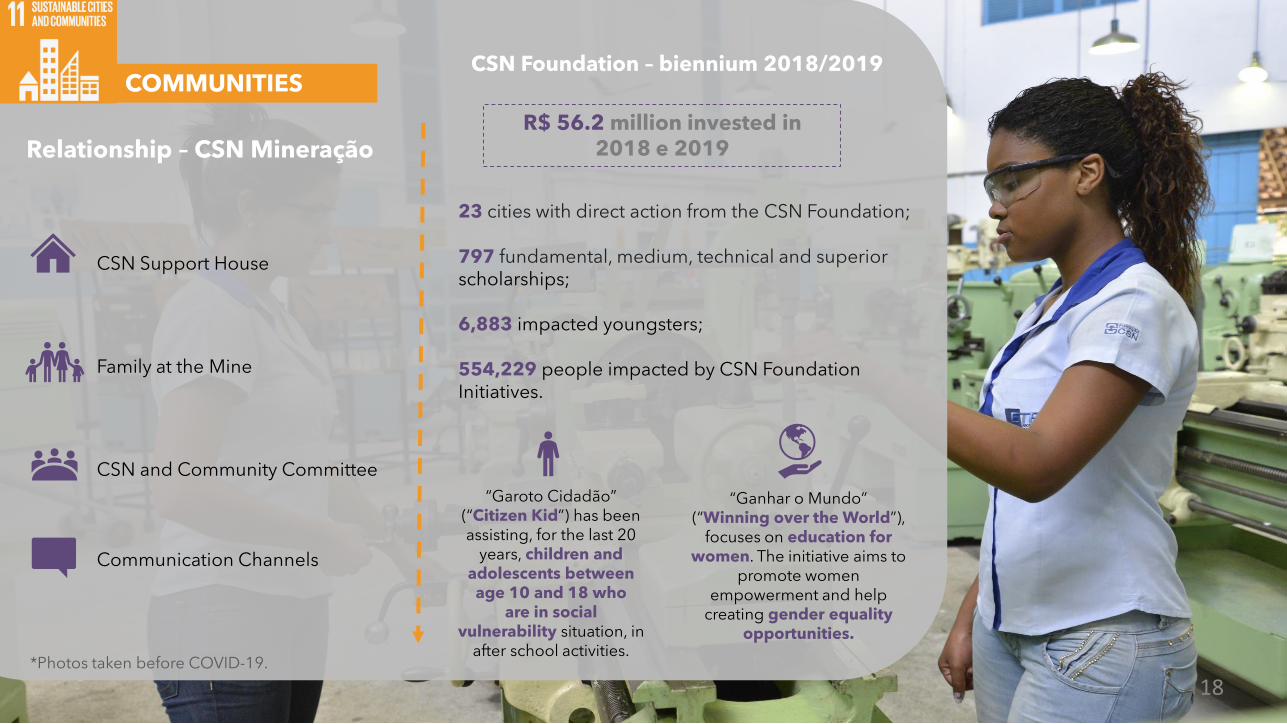
23 cities with direct action from the CSN Foundation;
797 fundamental, medium, technical and superiorscholarships;
6,883 impacted youngsters;
554,229 people impacted by CSN Foundation Initiatives.
Relationship – CSN Mineração
“Ganhar o Mundo” (“Winning over the World”),
focuses on education for women. The initiative aims to
promote women empowerment and help
creating gender equalityopportunities.
“Garoto Cidadão” (“Citizen Kid”) has beenassisting, for the last 20
years, children andadolescents between age 10 and 18 who
are in social vulnerability situation, in
after school activities.
CSN Support House
Family at the Mine
CSN and Community Committee
Communication Channels
CSN Foundation – biennium 2018/2019
R$ 56.2 million invested in 2018 e 2019
*Photos taken before COVID-19.
COMMUNITIES
18
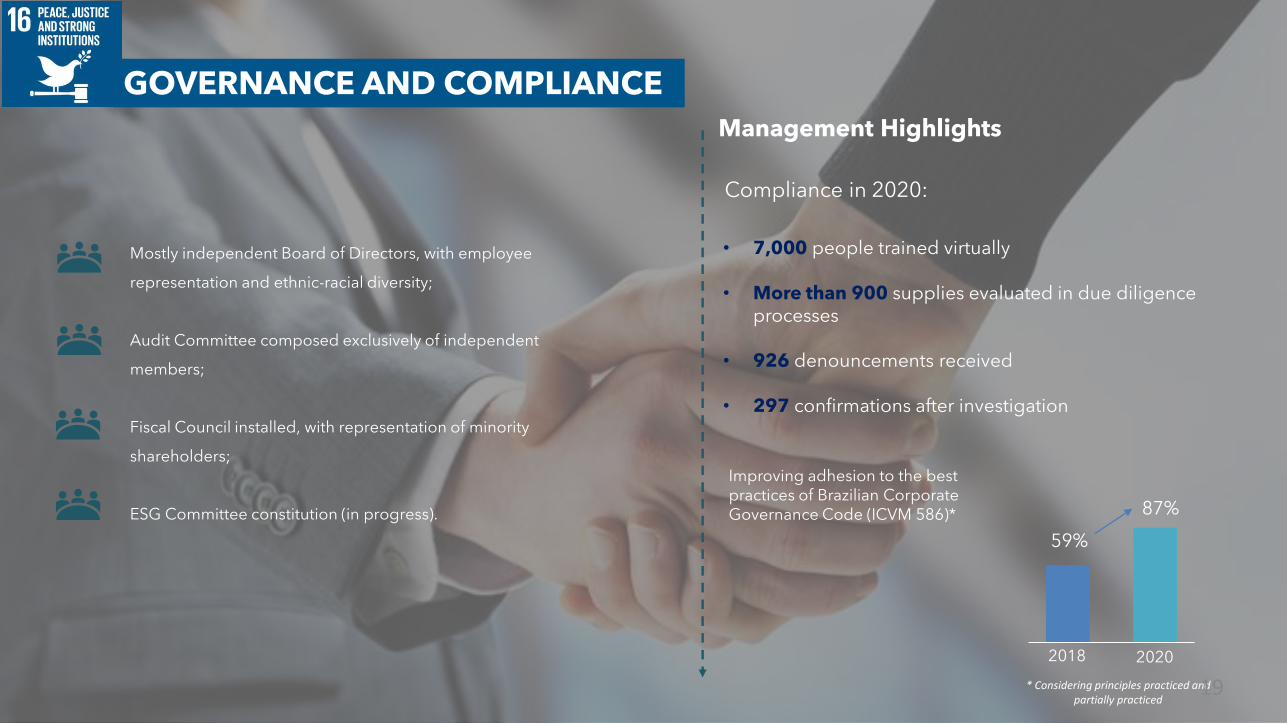
GOVERNANCE AND COMPLIANCE
Mostly independent Board of Directors, with employee
representation and ethnic-racial diversity;
Audit Committee composed exclusively of independent
members;
Fiscal Council installed, with representation of minority
shareholders;
ESG Committee constitution (in progress).
• 7,000 people trained virtually
• More than 900 supplies evaluated in due diligenceprocesses
• 926 denouncements received
• 297 confirmations after investigation
Management Highlights
Compliance in 2020:
Improving adhesion to the bestpractices of Brazilian Corporate Governance Code (ICVM 586)*
59%
87%
2018 2020
* Considering principles practiced and partially practiced
19
OUR ESG AMBITIONS
20

To double the percentage ofwomen, from the current 14% in
2019 to 28% by 2025.
To reduce by 10% theaccidents frequency rate registered year after year.
To reduce by 10% by 2030 the scopes 1 and 2 emissions(tCO2e – baseline: 2018);
To continously increase theattendance index of best
practices established by CVM nº 586/2017, which institutes themodel “Practice or Explain”.
To cover our ESG gaps mappedwith institutions and rating
agencies and be part of ISE –Sustainability Index by 2022.
CSN GROUP CSN MINERAÇÃO
To double the currentpercentage of 13% of
women by 2025.
To reduce our withdrawal ofwater per ton of ore
produced by 10% by 2030.
To reach 100% of energyfrom renewable sourced by
2021.
TECAR certified by ISO 14.001 by 2021.
STEEL CEMENTS
To achieve13% ofworkforce composed of
women by 2020.
To reduce by 10% by 2030 the carbon
equivalent emissions (tCO2/ton steel produced –
baseline: 2018)
To reduce by 40% by 2030, the Particulate
Matter emissions (baseline: 2019).
To reduce by 10%, by 2030, the ratio tCO2/ton
of cement produced (baseline 2019).
Plants certified by ISO 14.001 by 2021.
CSN INOVA
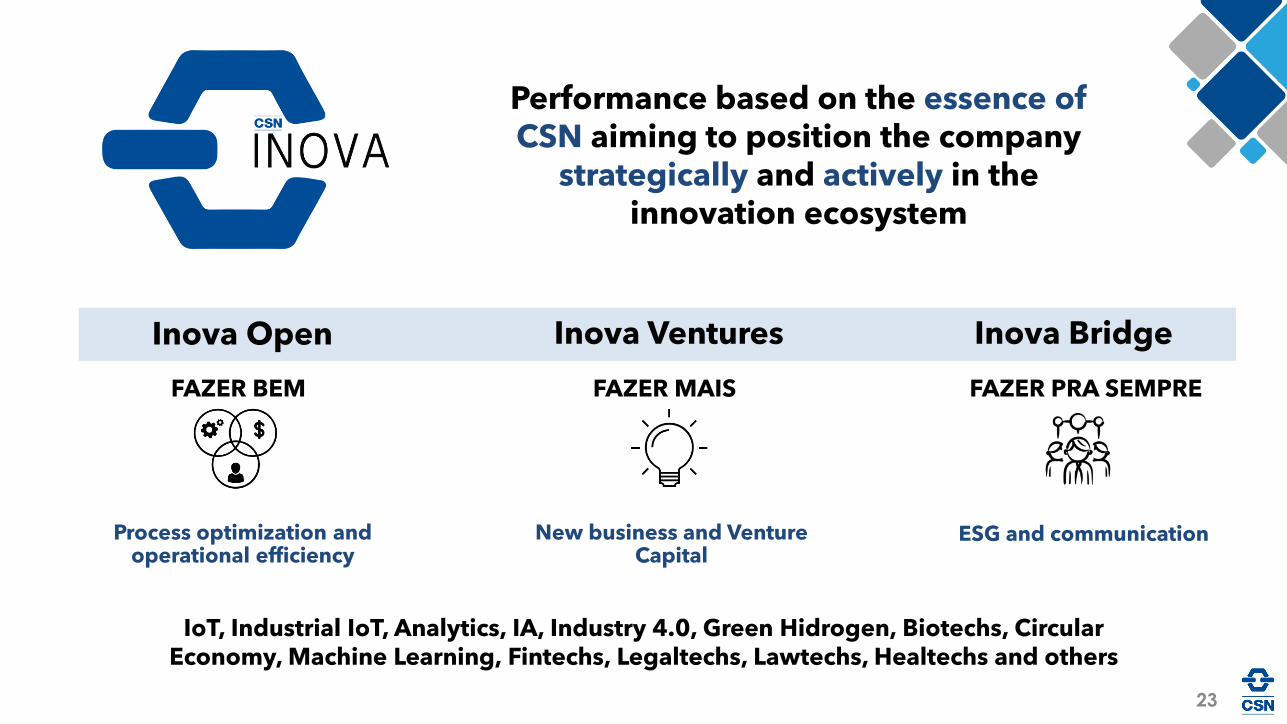
Process optimization andoperational efficiency
New business and Venture Capital
Inova Open Inova Ventures Inova Bridge
ESG and communication
FAZER BEM FAZER MAIS FAZER PRA SEMPRE
23
Performance based on the essence ofCSN aiming to position the company
strategically and actively in theinnovation ecosystem
IoT, Industrial IoT, Analytics, IA, Industry 4.0, Green Hidrogen, Biotechs, Circular Economy, Machine Learning, Fintechs, Legaltechs, Lawtechs, Healtechs and others
v
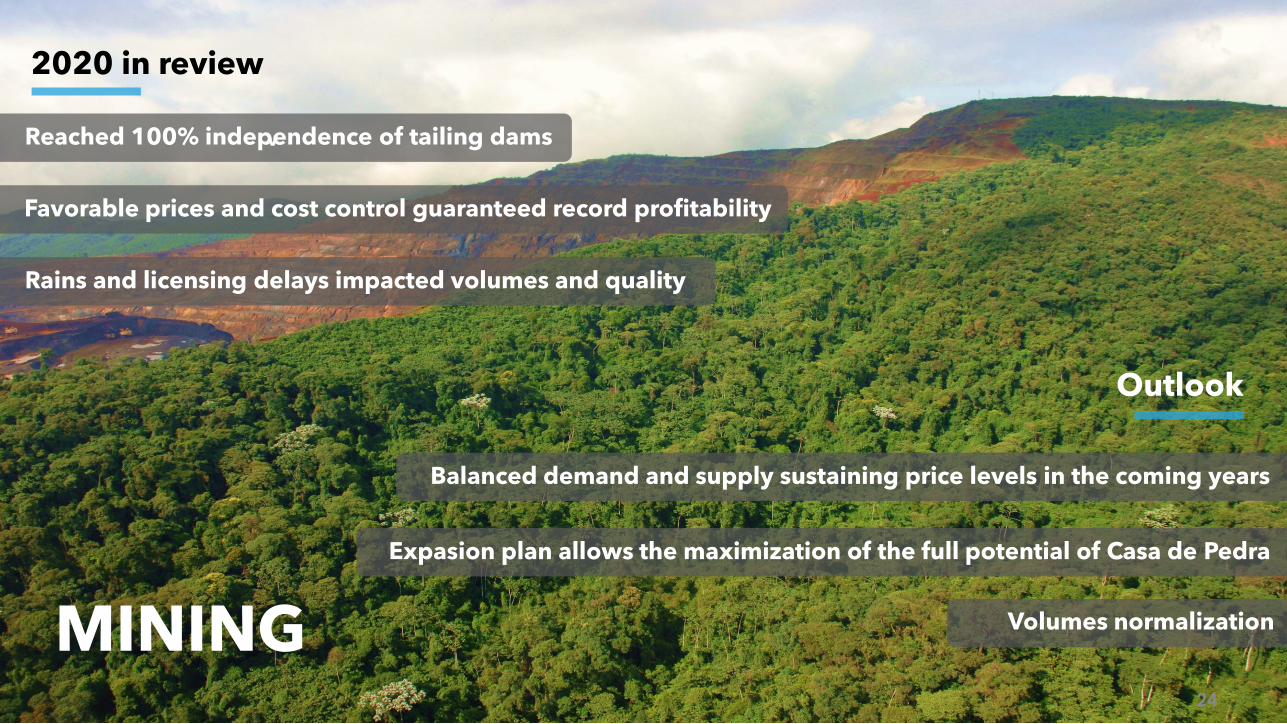
MINING
Reached 100% independence of tailing dams
2020 in review
Outlook
Favorable prices and cost control guaranteed record profitability
Rains and licensing delays impacted volumes and quality
Balanced demand and supply sustaining price levels in the coming years
Expasion plan allows the maximization of the full potential of Casa de Pedra
24
Volumes normalization
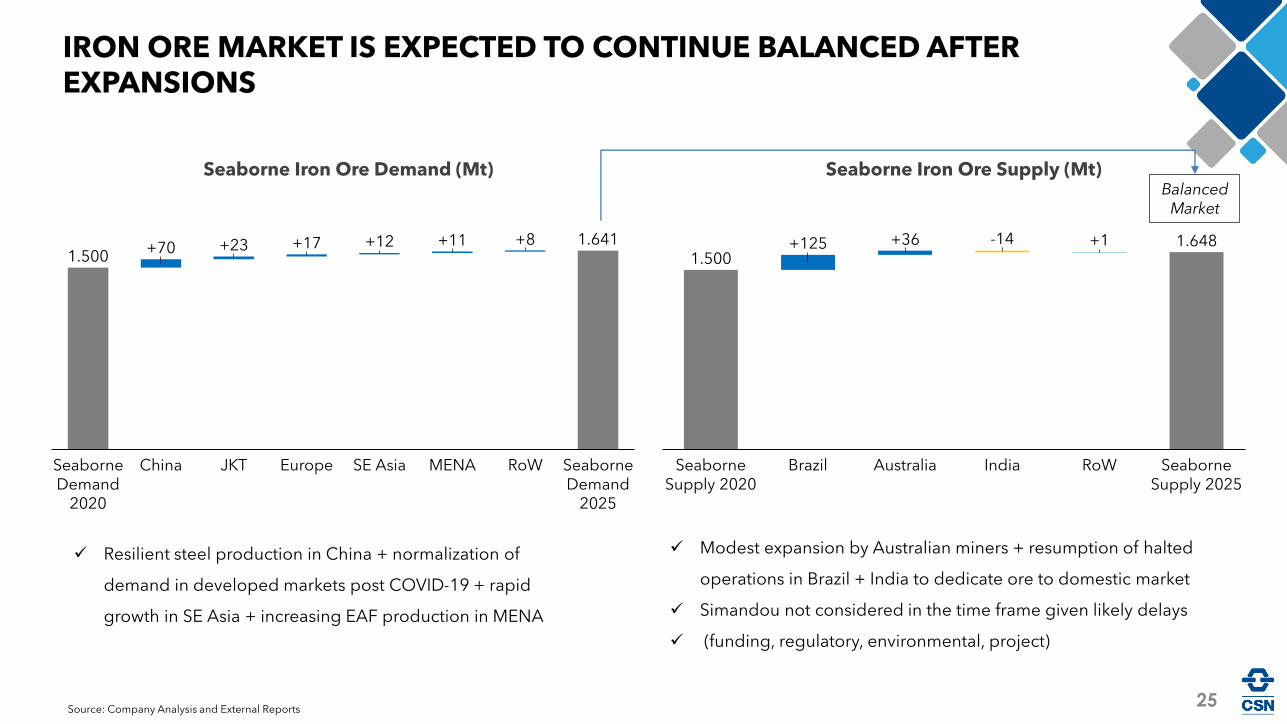
Source: Company Analysis and External Reports
Seaborne Iron Ore Demand (Mt) Seaborne Iron Ore Supply (Mt)Balanced
Market
1.5001.641
+70 +23 +17 +12 +11 +8
ChinaSeaborne Demand
2020
JKT Europe SE Asia MENA RoW Seaborne Demand
2025
1.5001.648+125 +36
Brazil
-14 +1
Seaborne Supply 2020
India RoWAustralia Seaborne Supply 2025
25
IRON ORE MARKET IS EXPECTED TO CONTINUE BALANCED AFTER EXPANSIONS
✓ Resilient steel production in China + normalization of
demand in developed markets post COVID-19 + rapid
growth in SE Asia + increasing EAF production in MENA
✓ Modest expansion by Australian miners + resumption of halted
operations in Brazil + India to dedicate ore to domestic market
✓ Simandou not considered in the time frame given likely delays
✓ (funding, regulatory, environmental, project)
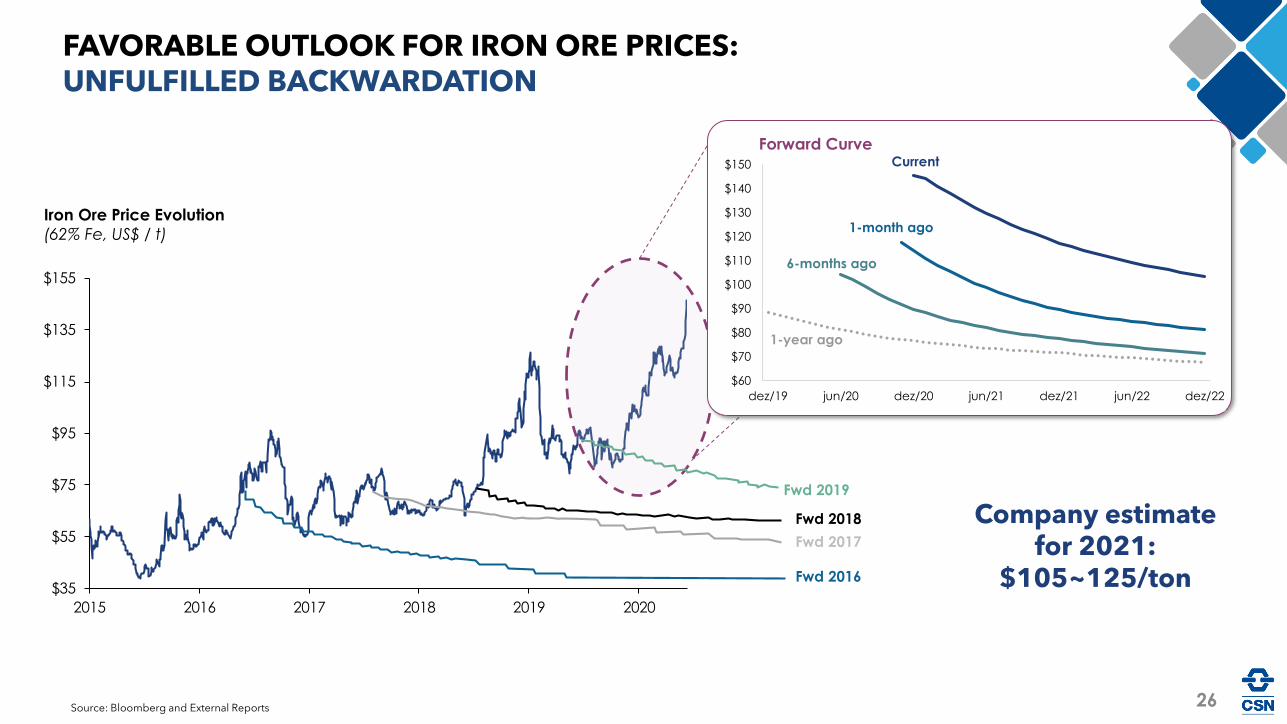
$35
$55
$75
$95
$115
$135
$155
2015 2016 2017 2018 2019 2020
Source: Bloomberg and External Reports
Iron Ore Price Evolution
(62% Fe, US$ / t)
Fwd 2019
Fwd 2017
Fwd 2016
Fwd 2018
Forward Curve
$60
$70
$80
$90
$100
$110
$120
$130
$140
$150
dez/19 jun/20 dez/20 jun/21 dez/21 jun/22 dez/22
Current
1-month ago
6-months ago
1-year ago
FAVORABLE OUTLOOK FOR IRON ORE PRICES: UNFULFILLED BACKWARDATION
Company estimatefor 2021:
$105~125/ton
26
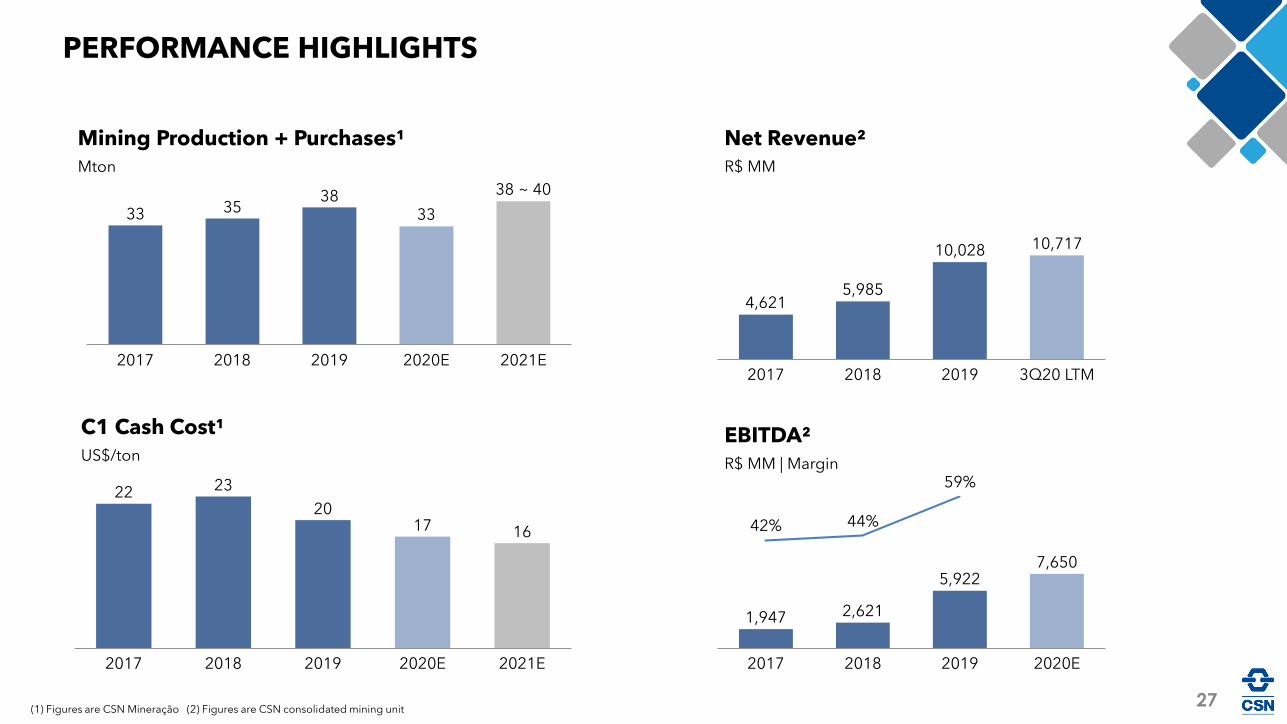
Mining Production + Purchases¹
Mton
PERFORMANCE HIGHLIGHTS
33 3538
33
20182017
38 ~ 40
2021E2020E2019
22 23
2017 16
20192017 2018 2021E2020E
C1 Cash Cost¹
US$/ton
(1) Figures are CSN Mineração (2) Figures are CSN consolidated mining unit
20182017 2019
10,717
3Q20 LTM
4,6215,985
10,028
Net Revenue²
R$ MM
42% 44%
59%
1,947
2017
7,650
2018 2019
2,621
2020E
5,922
EBITDA²
R$ MM | Margin
27
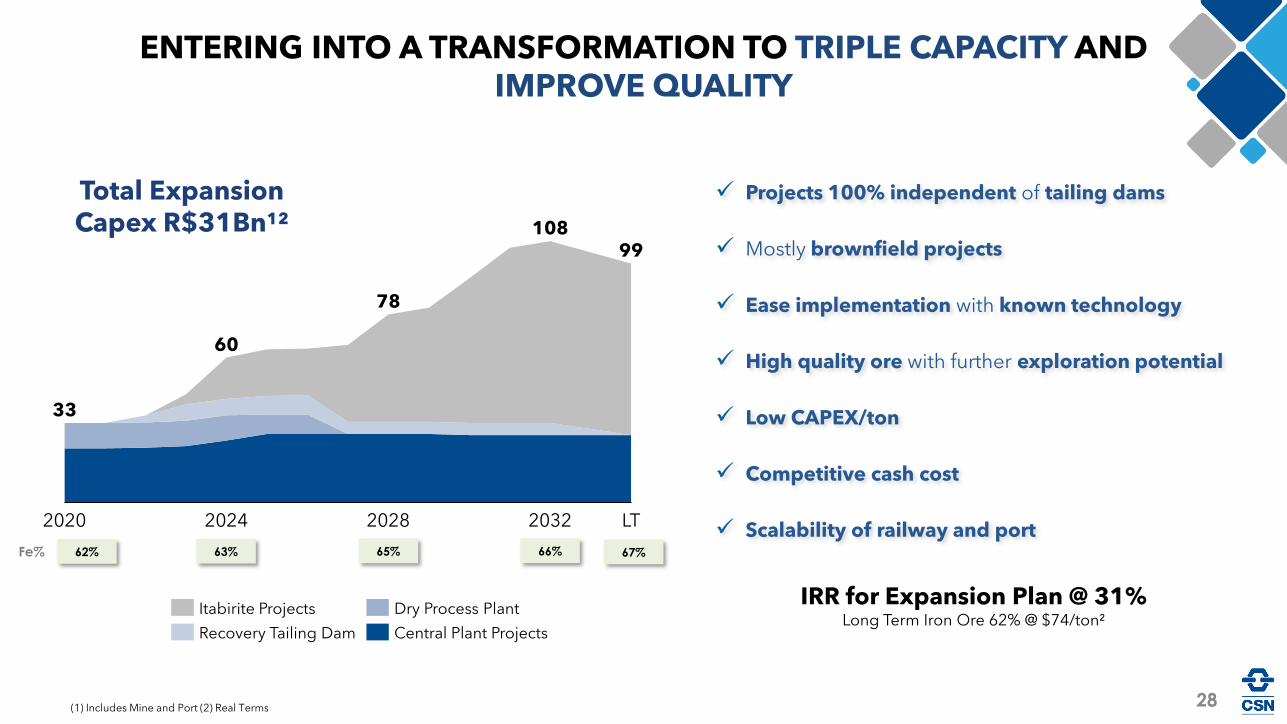
ENTERING INTO A TRANSFORMATION TO TRIPLE CAPACITY AND IMPROVE QUALITY
2020 2024
33
2028 2032 LT
60
78
10899
✓ Projects 100% independent of tailing dams
✓ Mostly brownfield projects
✓ Ease implementation with known technology
✓ High quality ore with further exploration potential
✓ Low CAPEX/ton
✓ Competitive cash cost
✓ Scalability of railway and port
Central Plant Projects
Itabirite Projects Dry Process Plant
Recovery Tailing Dam
Total ExpansionCapex R$31Bn¹²
(1) Includes Mine and Port (2) Real Terms
62%Fe% 63% 65% 66% 67%
IRR for Expansion Plan @ 31%Long Term Iron Ore 62% @ $74/ton²
28
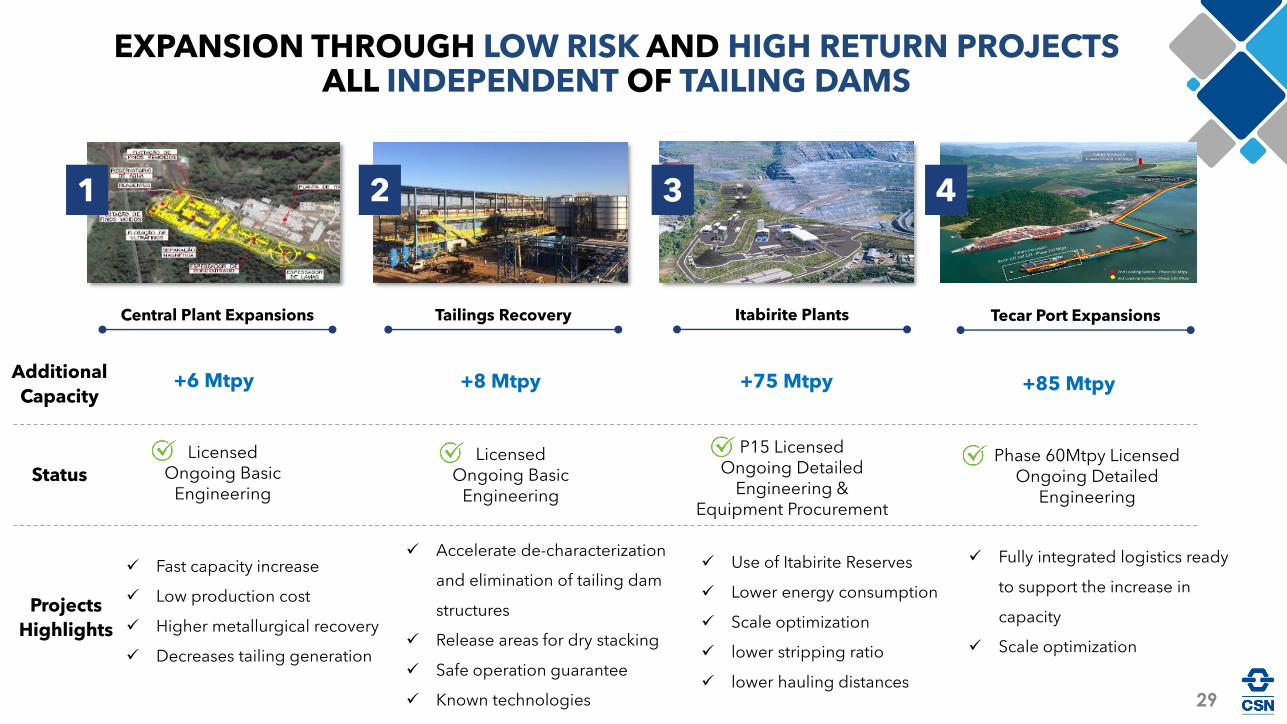
Phase 60Mtpy LicensedOngoing Detailed
Engineering
29
1 2 3 4
Central Plant Expansions Tailings Recovery Itabirite Plants Tecar Port Expansions
Additional
Capacity +6 Mtpy +8 Mtpy +75 Mtpy +85 Mtpy
✓ Fast capacity increase
✓ Low production cost
✓ Higher metallurgical recovery
✓ Decreases tailing generation
StatusLicensed
Ongoing Basic Engineering
Projects
Highlights
EXPANSION THROUGH LOW RISK AND HIGH RETURN PROJECTS ALL INDEPENDENT OF TAILING DAMS
LicensedOngoing Basic
Engineering
✓ Accelerate de-characterization
and elimination of tailing dam
structures
✓ Release areas for dry stacking
✓ Safe operation guarantee
✓ Known technologies
P15 LicensedOngoing Detailed
Engineering &Equipment Procurement
✓ Use of Itabirite Reserves
✓ Lower energy consumption
✓ Scale optimization
✓ lower stripping ratio
✓ lower hauling distances
✓ Fully integrated logistics ready
to support the increase in
capacity
✓ Scale optimization
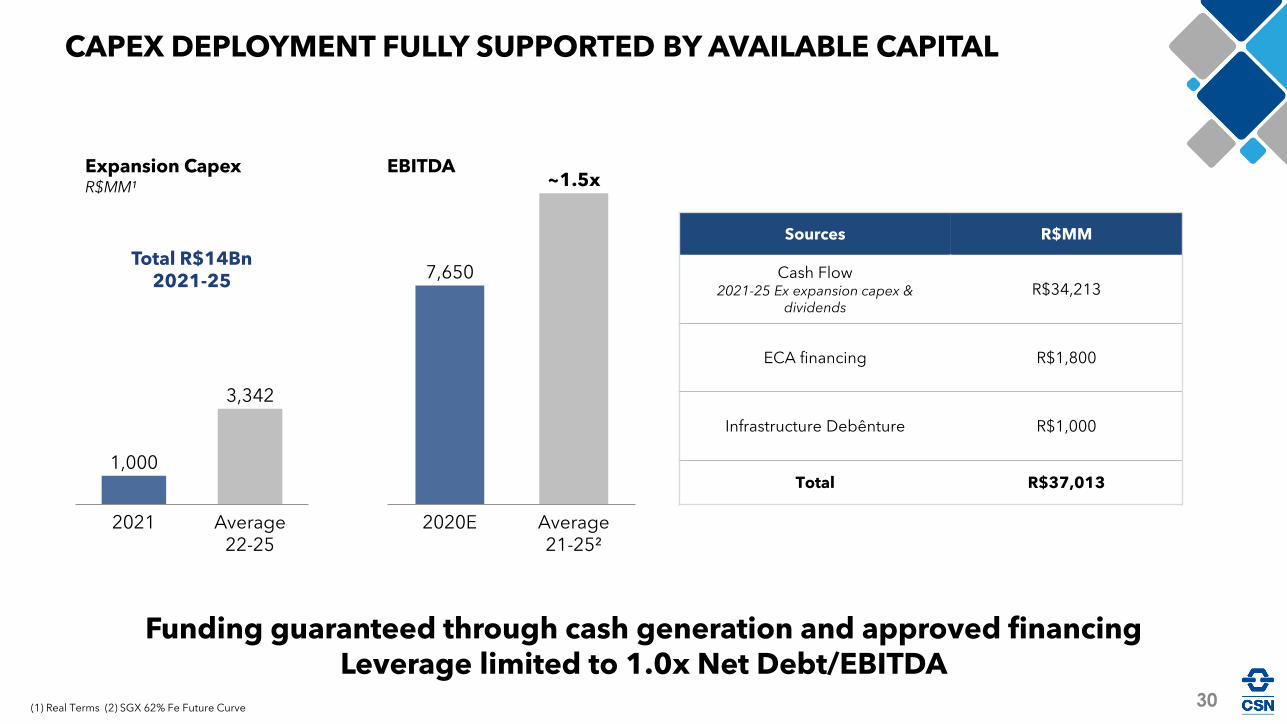
CAPEX DEPLOYMENT FULLY SUPPORTED BY AVAILABLE CAPITAL
2021 Average 22-25
3,342
1,000
Sources R$MM
Cash Flow2021-25 Ex expansion capex &
dividendsR$34,213
ECA financing R$1,800
Infrastructure Debênture R$1,000
Total R$37,013
Expansion CapexR$MM¹
Funding guaranteed through cash generation and approved financingLeverage limited to 1.0x Net Debt/EBITDA
2020E
7,650
Average 21-25²
~1.5xEBITDA
Total R$14Bn2021-25
30(1) Real Terms (2) SGX 62% Fe Future Curve
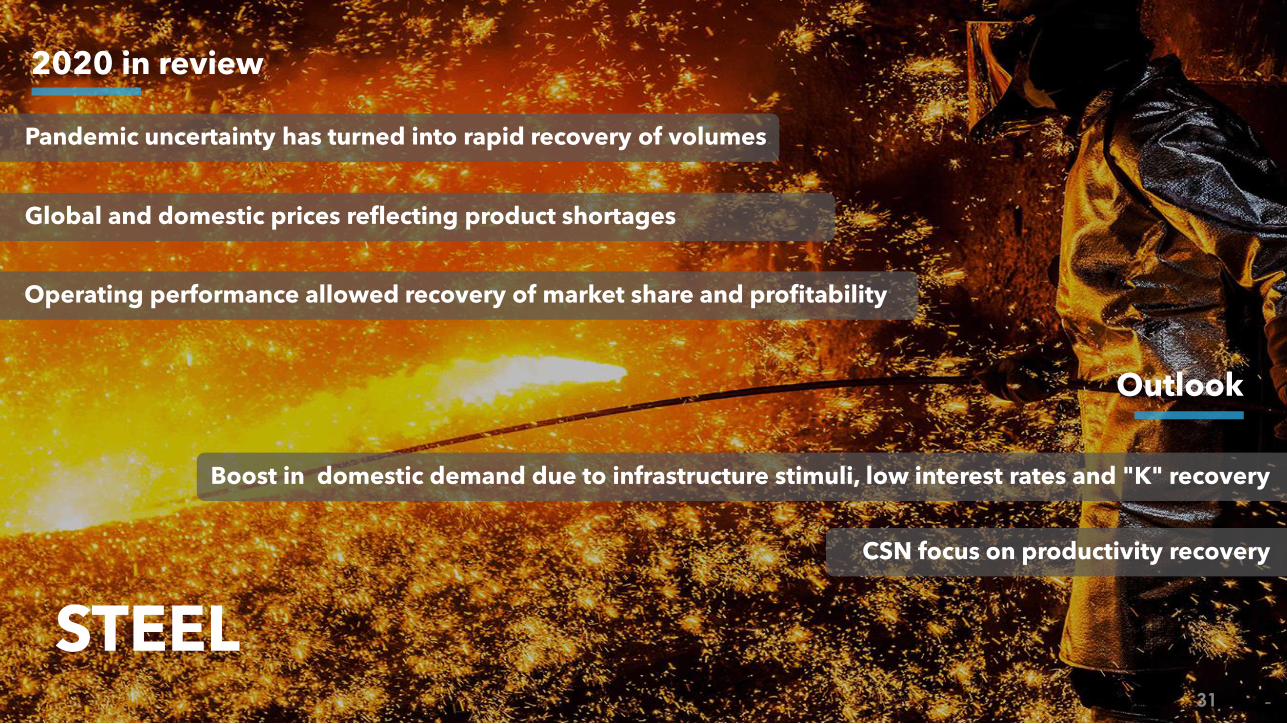
STEEL
Pandemic uncertainty has turned into rapid recovery of volumes
2020 in review
Outlook
Operating performance allowed recovery of market share and profitability
Global and domestic prices reflecting product shortages
Boost in domestic demand due to infrastructure stimuli, low interest rates and "K" recovery
CSN focus on productivity recovery
31
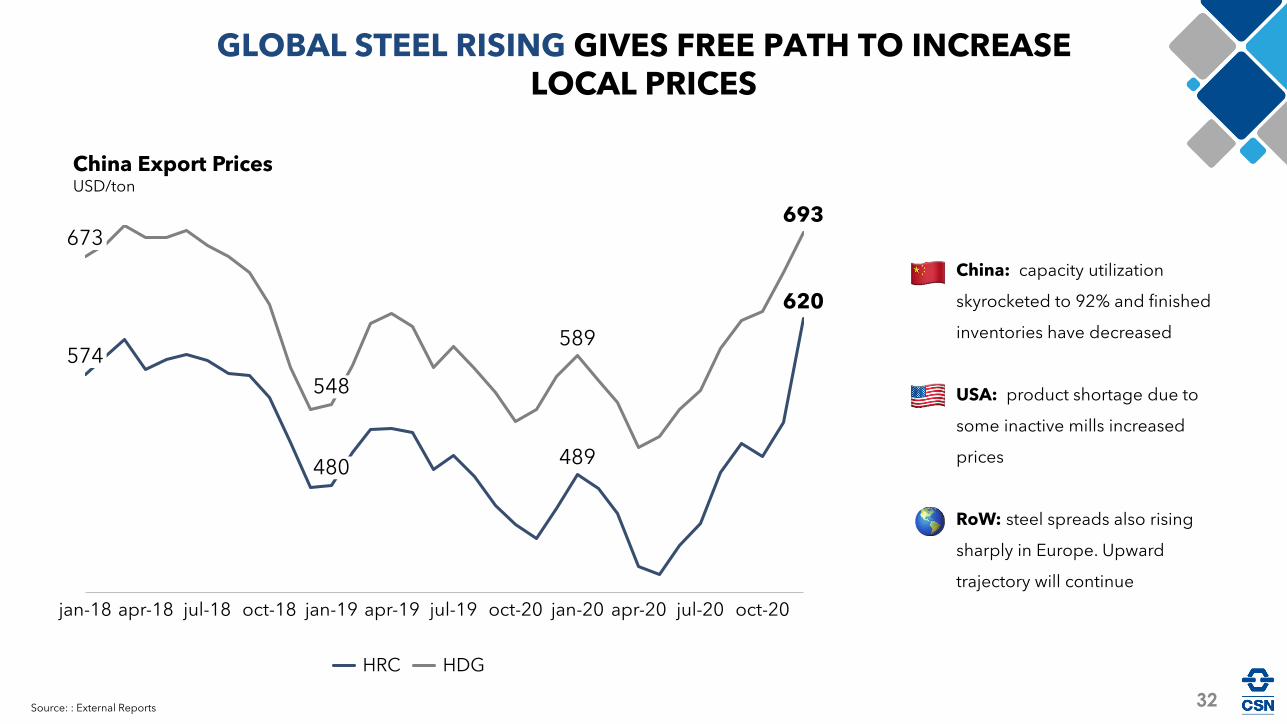
GLOBAL STEEL RISING GIVES FREE PATH TO INCREASE LOCAL PRICES
China: capacity utilization
skyrocketed to 92% and finished
inventories have decreased
USA: product shortage due to
some inactive mills increased
prices
RoW: steel spreads also rising
sharply in Europe. Upward
trajectory will continue
Source: : External Reports
489
620
589
693
apr-20jan-18 jul-19apr-19 oct-20oct-18 jul-20apr-18 oct-20jul-18 jan-19 jan-20
548
480
574
673
HRC HDG
China Export PricesUSD/ton
32
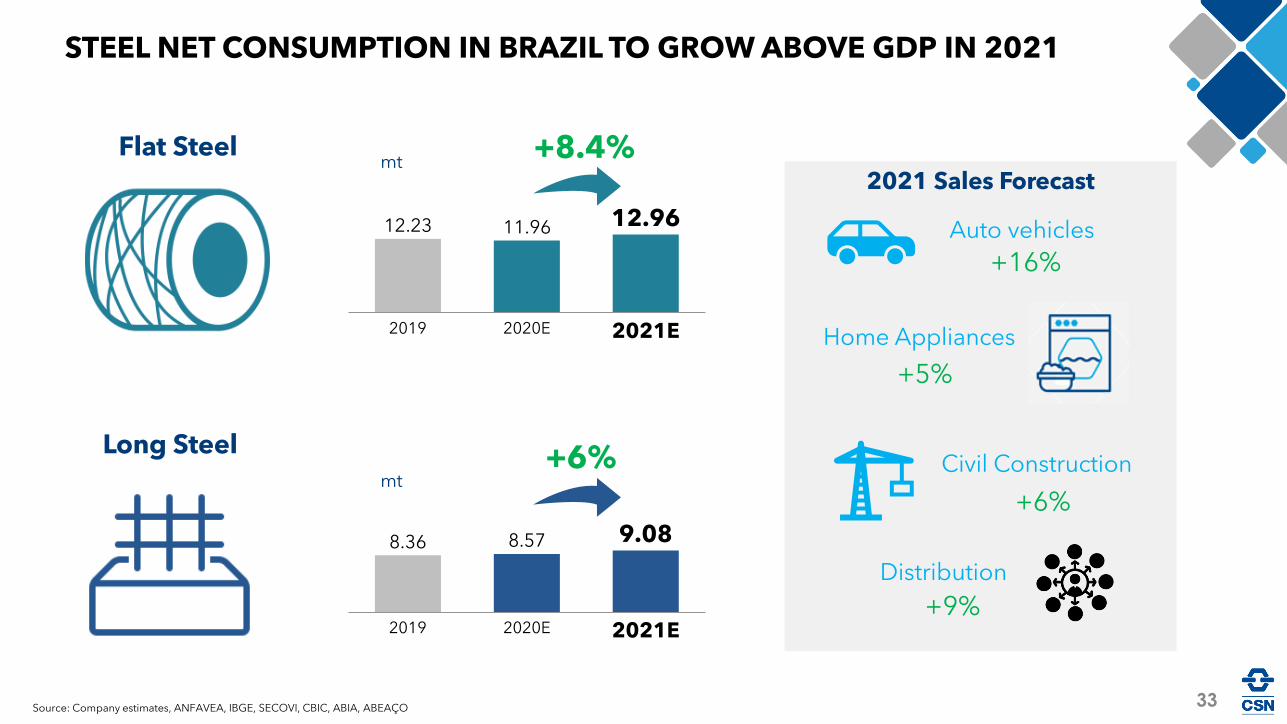
+8.4%
Source: Company estimates, ANFAVEA, IBGE, SECOVI, CBIC, ABIA, ABEAÇO
Long Steel
9.08
2020E2019 2021E
8.36 8.57
Flat Steel
12.23
2021E2019 2020E
11.96 12.96
mt
+6%
2021 Sales Forecast
+16%Auto vehicles
+5%
Home Appliances
+6%
Civil Construction
+9%
Distribution
STEEL NET CONSUMPTION IN BRAZIL TO GROW ABOVE GDP IN 2021
mt
33
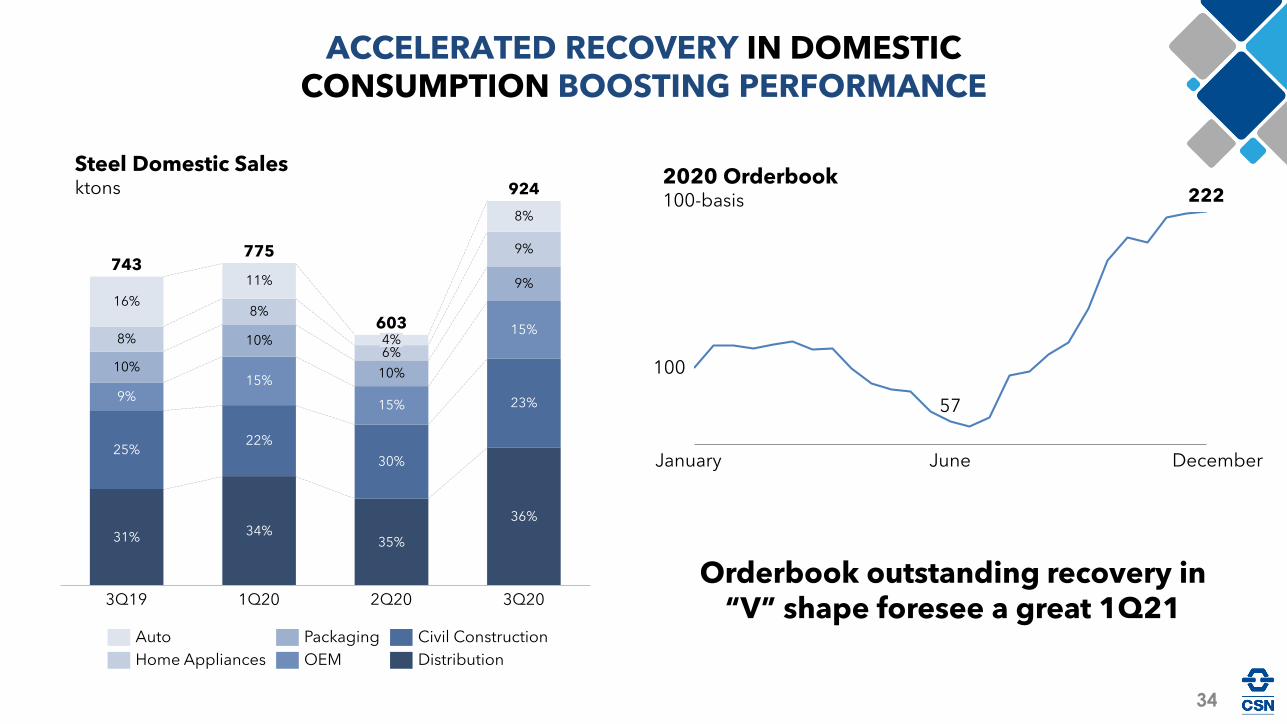
19.4%Steel Domestic Sales ktons
ACCELERATED RECOVERY IN DOMESTIC CONSUMPTION BOOSTING PERFORMANCE
2020 Orderbook100-basis
January June December
Orderbook outstanding recovery in “V” shape foresee a great 1Q21 3Q19
11%
8%
10%
22%
2Q20
30%
36%
1Q20
4%6%
23%
35%
8%
924
9%
743
8%
9%
15%
15%
3Q20
16%
15%
10%
34%
9%
25%
775
31%
10%
603
Auto
Home Appliances OEM
Civil ConstructionPackaging
Distribution
34
100
57
222
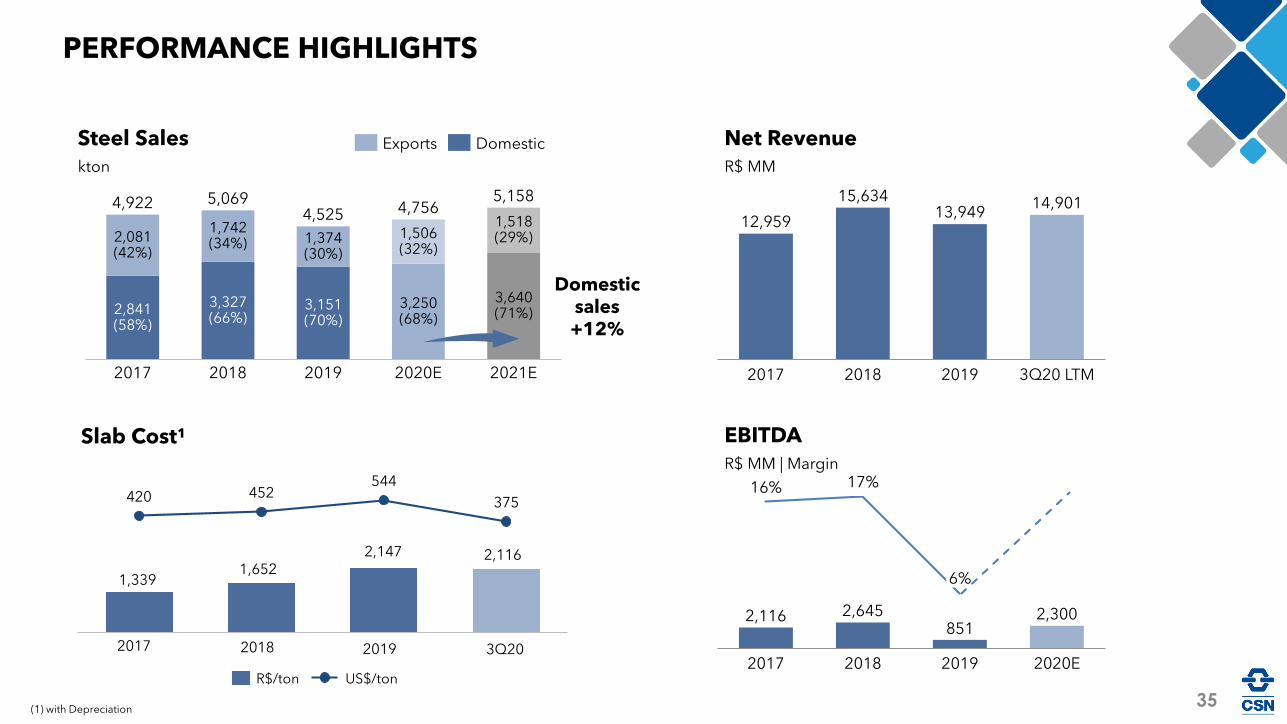
Steel Sales
kton
PERFORMANCE HIGHLIGHTS
Slab Cost¹
3Q20 LTM20182017 2019
12,95914,90115,634
13,949
Net Revenue
R$ MM
851
16% 17%
2,645 2,300
20192017 2018 2020E
6%
2,116
EBITDA
R$ MM | Margin
2017
1,518(29%)2,081
(42%)
1,506(32%)
1,374(30%)
2,841(58%)
3,151(70%)
5,158
1,742(34%)
2019
3,327(66%)
2018
3,250(68%)
2020E
3,640(71%)
2021E
4,922 5,0694,525 4,756
Exports Domestic
420 452544
375
2017
1,339
2018 2019
1,652
3Q20
2,147 2,116
R$/ton US$/ton
(1) with Depreciation35
Domesticsales+12%
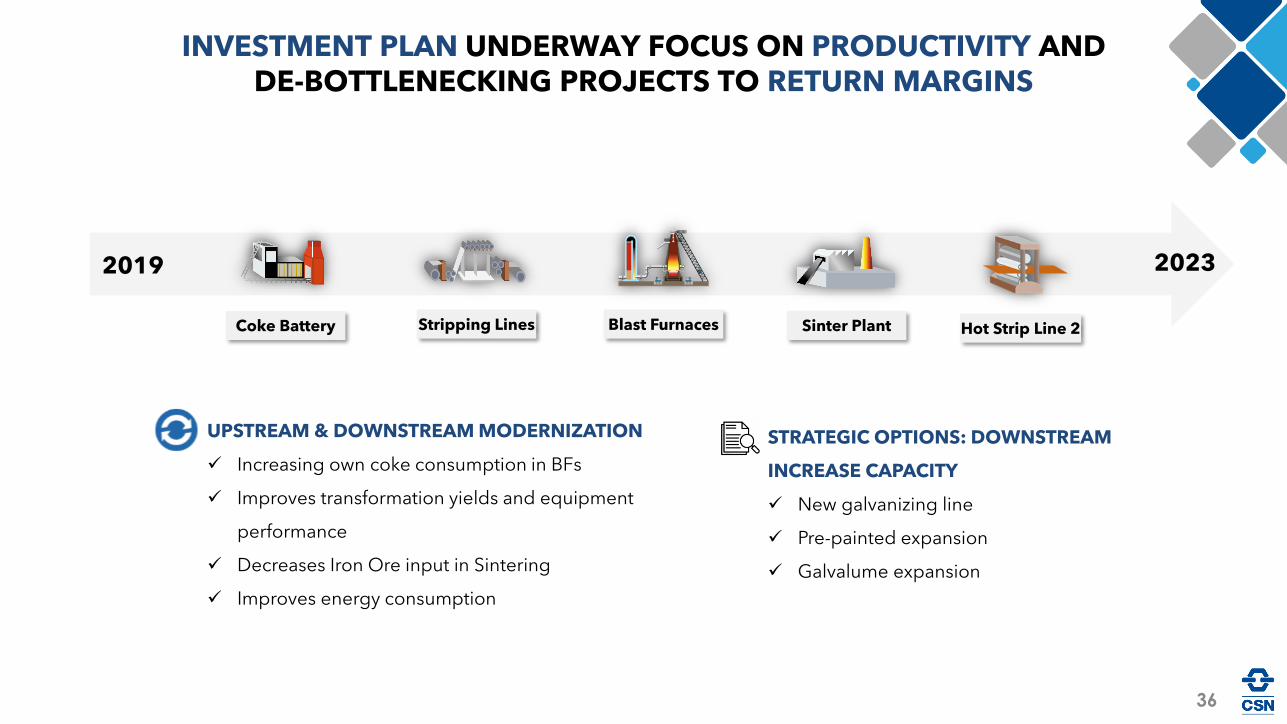
INVESTMENT PLAN UNDERWAY FOCUS ON PRODUCTIVITY AND DE-BOTTLENECKING PROJECTS TO RETURN MARGINS
Coke Battery Stripping Lines Blast Furnaces Sinter Plant Hot Strip Line 2
20232019
UPSTREAM & DOWNSTREAM MODERNIZATION
✓ Increasing own coke consumption in BFs
✓ Improves transformation yields and equipment
performance
✓ Decreases Iron Ore input in Sintering
✓ Improves energy consumption
STRATEGIC OPTIONS: DOWNSTREAM
INCREASE CAPACITY
✓ New galvanizing line
✓ Pre-painted expansion
✓ Galvalume expansion
36
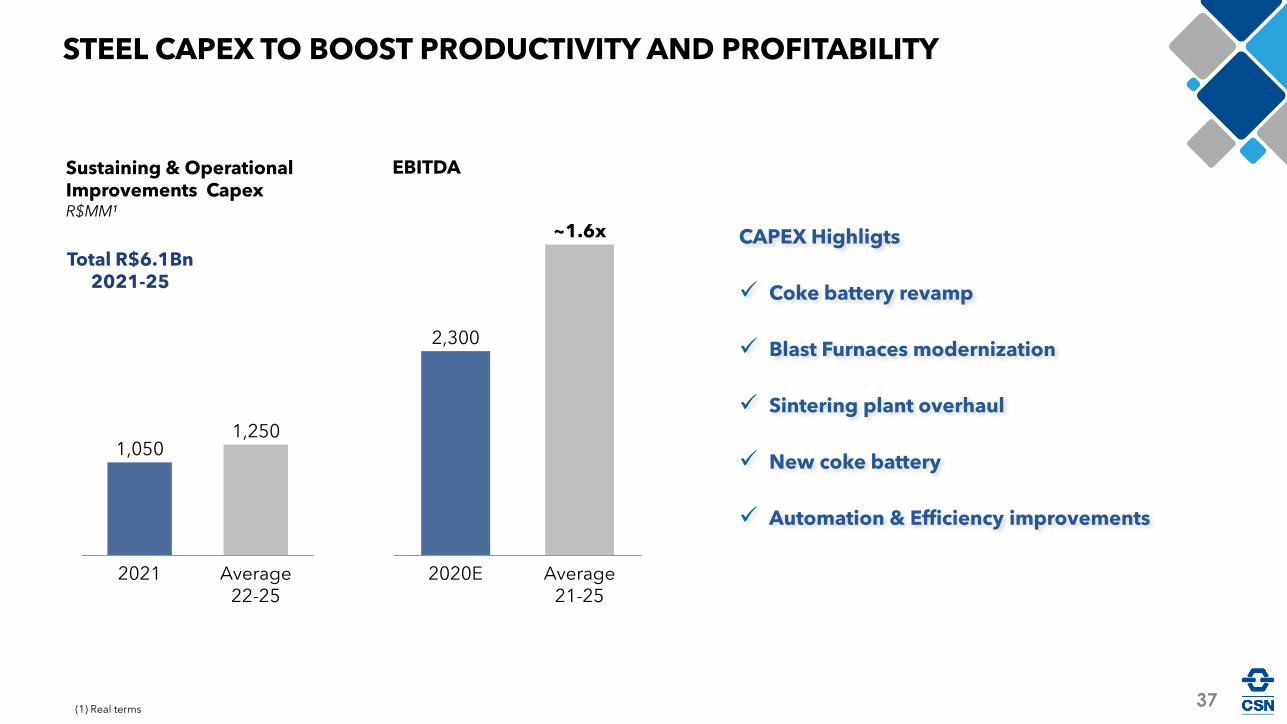
STEEL CAPEX TO BOOST PRODUCTIVITY AND PROFITABILITY
1,050
2021 Average 22-25
1,250
~1.6x
2020E Average 21-25
2,300
Sustaining & Operational Improvements CapexR$MM¹
Total R$6.1Bn2021-25
EBITDA
37
CAPEX Highligts
✓ Coke battery revamp
✓ Blast Furnaces modernization
✓ Sintering plant overhaul
✓ New coke battery
✓ Automation & Efficiency improvements
(1) Real terms
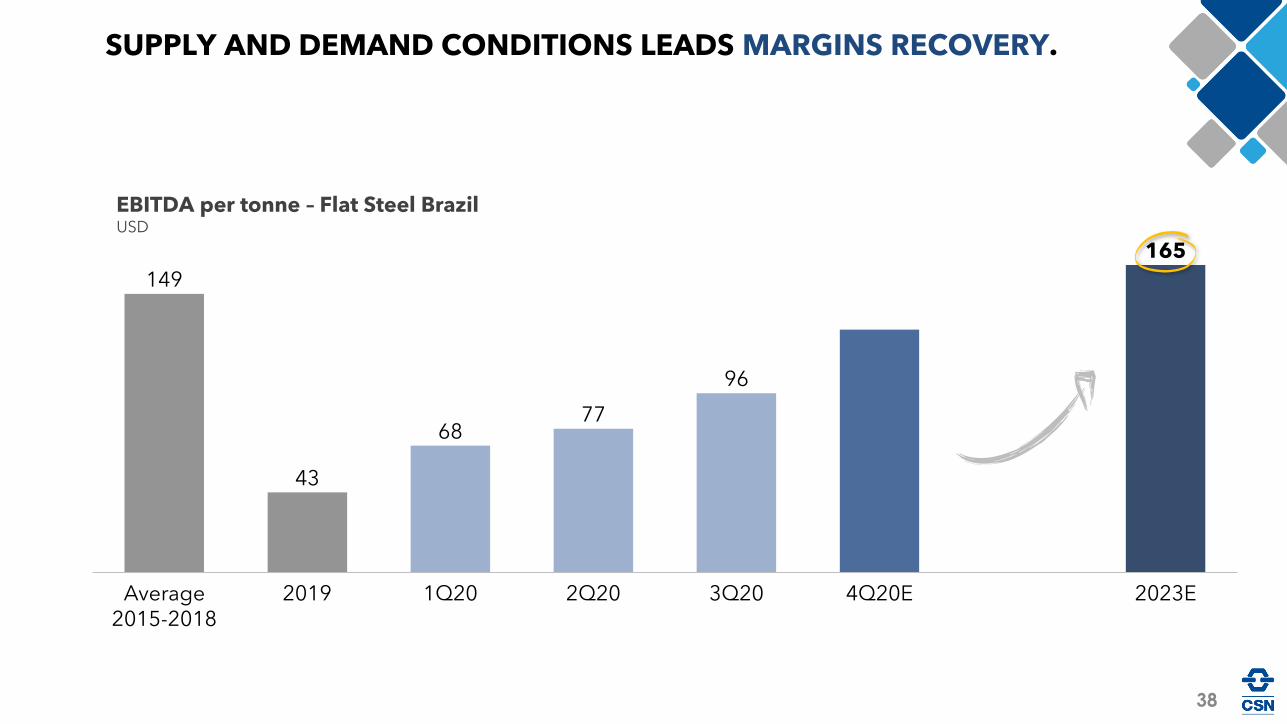
EBITDA per tonne – Flat Steel BrazilUSD
149
43
6877
96
165
Average 2015-2018
4Q20E2Q202019 2023E1Q20 3Q20
SUPPLY AND DEMAND CONDITIONS LEADS MARGINS RECOVERY.
38
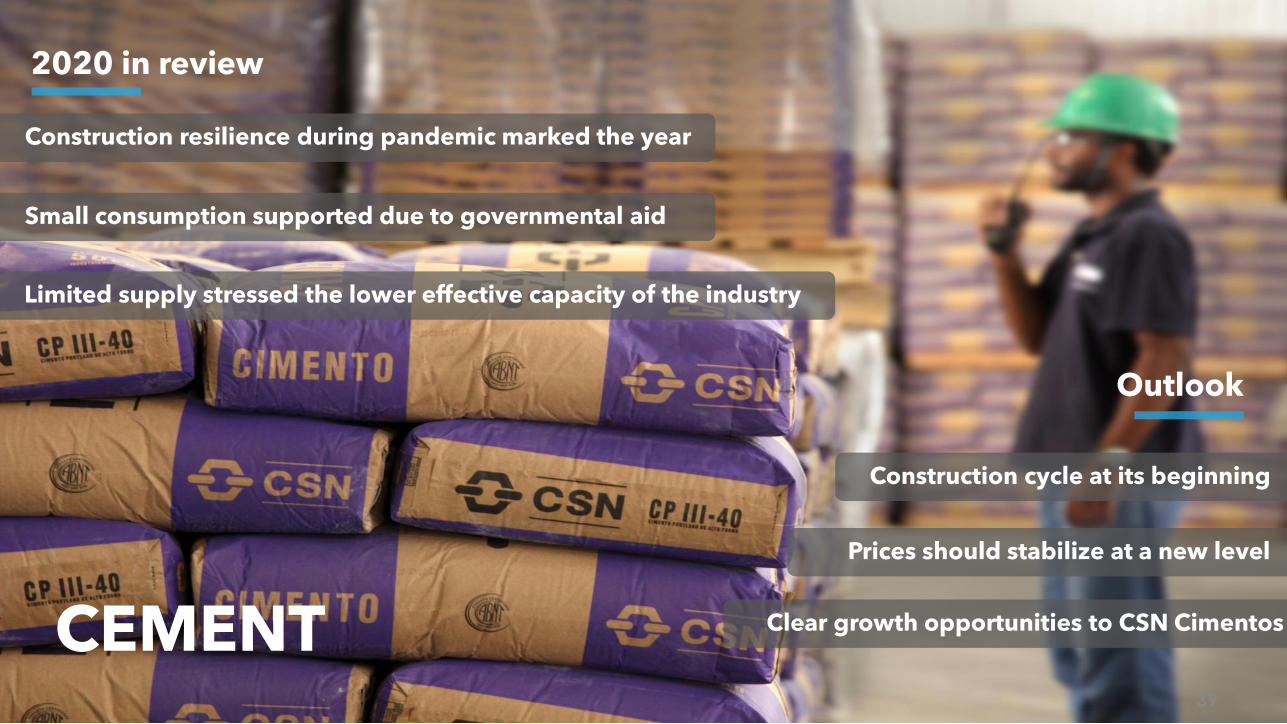
CEMENT
Construction resilience during pandemic marked the year
2020 in review
Outlook
Limited supply stressed the lower effective capacity of the industry
Small consumption supported due to governmental aid
Construction cycle at its beginning
Prices should stabilize at a new level
Clear growth opportunities to CSN Cimentos
39
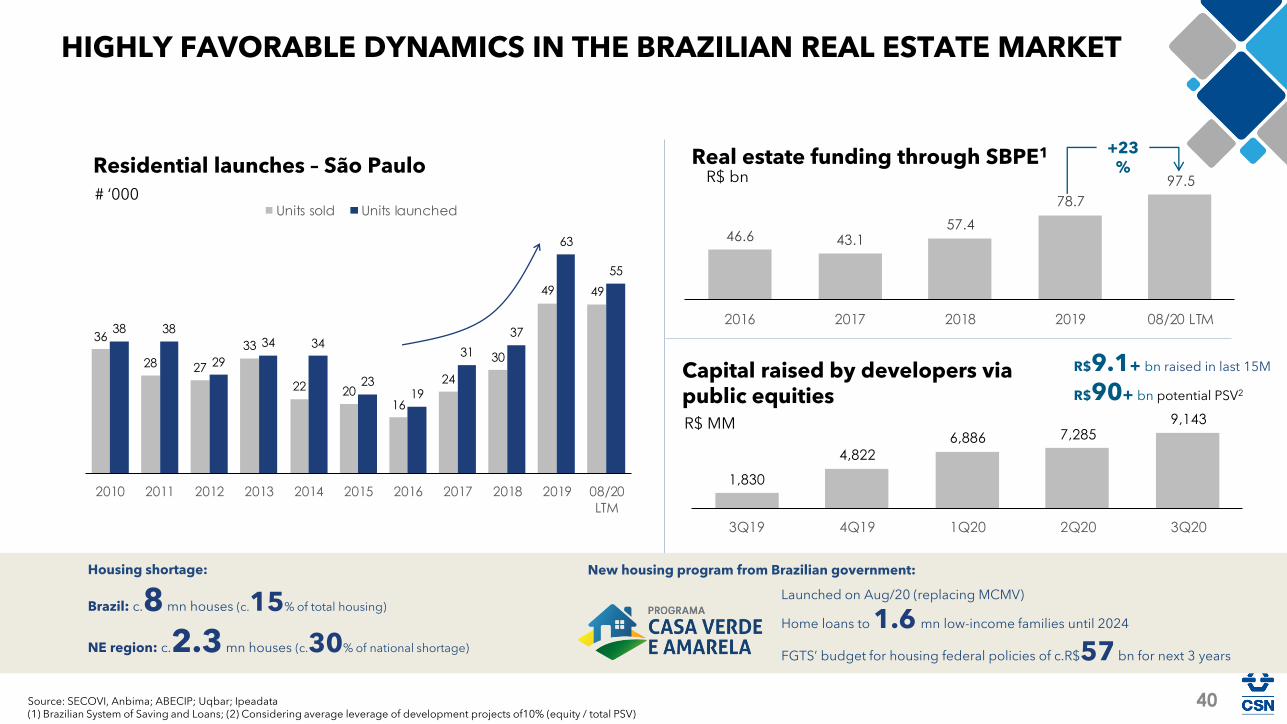
HIGHLY FAVORABLE DYNAMICS IN THE BRAZILIAN REAL ESTATE MARKET
Source: SECOVI, Anbima; ABECIP; Uqbar; Ipeadata(1) Brazilian System of Saving and Loans; (2) Considering average leverage of development projects of10% (equity / total PSV)
Real estate funding through SBPE1
R$ bnResidential launches – São Paulo
# ‘000
Capital raised by developers via public equitiesR$ MM
R$9.1+ bn raised in last 15M
R$90+ bn potential PSV2
36
28 27
33
22 2016
24
30
49 49
38 38
29
34 34
2319
31
37
63
55
2010 2011 2012 2013 2014 2015 2016 2017 2018 2019 08/20
LTM
Units sold Units launched
46.6 43.1 57.4
78.7
97.5
2016 2017 2018 2019 08/20 LTM
+23%
1,830
4,822
6,886 7,285 9,143
3Q19 4Q19 1Q20 2Q20 3Q20
Housing shortage:
Brazil: c.8 mn houses (c.15% of total housing)
NE region: c.2.3 mn houses (c.30% of national shortage)
New housing program from Brazilian government:
Launched on Aug/20 (replacing MCMV)
Home loans to 1.6 mn low-income families until 2024
FGTS’ budget for housing federal policies of c.R$57 bn for next 3 years
40
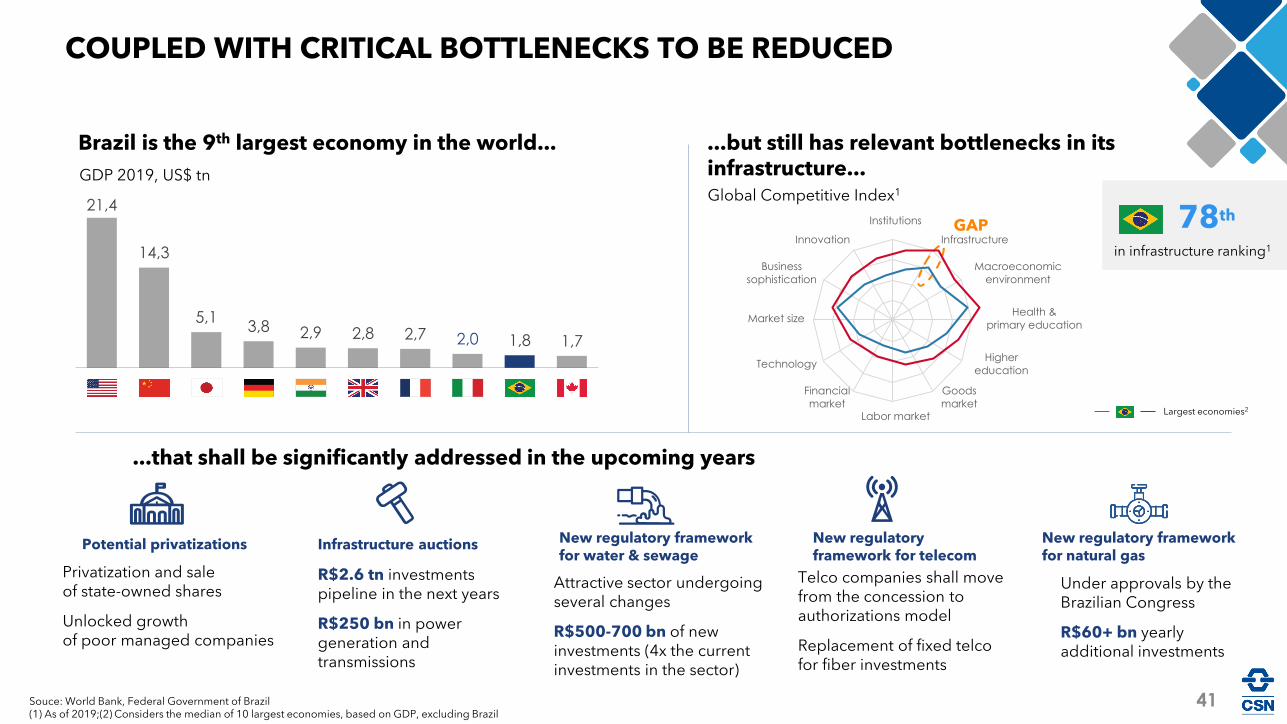
Institutions
Innovation
Business
sophistication
Market size
Technology
Financial
marketLabor market
Goods
market
Higher
education
Health &
primary education
Macroeconomic
environment
Infrastructure
Souce: World Bank, Federal Government of Brazil(1) As of 2019;(2) Considers the median of 10 largest economies, based on GDP, excluding Brazil
Brazil is the 9th largest economy in the world...
GDP 2019, US$ tn
...but still has relevant bottlenecks in its infrastructure...Global Competitive Index1
...that shall be significantly addressed in the upcoming years
Potential privatizations
Privatization and sale of state-owned shares
Unlocked growth of poor managed companies
R$2.6 tn investments pipeline in the next years
R$250 bn in power generation and transmissions
Attractive sector undergoing several changes
R$500-700 bn of new investments (4x the current investments in the sector)
Telco companies shall move from the concession to authorizations model
Replacement of fixed telco for fiber investments
COUPLED WITH CRITICAL BOTTLENECKS TO BE REDUCED
Under approvals by the Brazilian Congress
R$60+ bn yearly additional investments
GAP
Largest economies2
Infrastructure auctions New regulatory framework for water & sewage
New regulatoryframework for telecom
21,4
14,3
5,13,8 2,9 2,8 2,7 2,0 1,8 1,7
New regulatory framework for natural gas
78th
in infrastructure ranking1
41
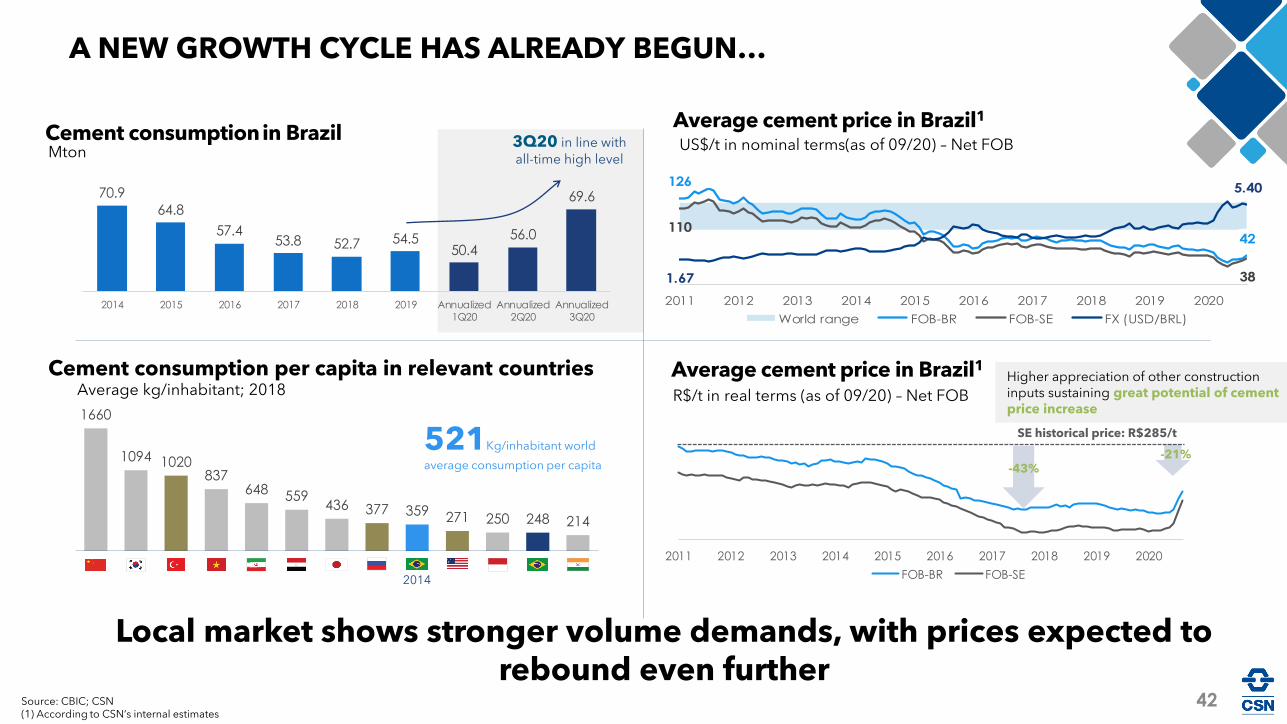
2011 2012 2013 2014 2015 2016 2017 2018 2019 2020
FOB-BR FOB-SE
70.9
64.8
57.4 53.8 52.7 54.5
50.4 56.0
69.6
2014 2015 2016 2017 2018 2019 Annualized1Q20
Annualized2Q20
Annualized3Q20
A NEW GROWTH CYCLE HAS ALREADY BEGUN…
Source: CBIC; CSN(1) According to CSN’s internal estimates
Average cement price in Brazil1
US$/t in nominal terms(as of 09/20) – Net FOB Cement consumptionin BrazilMton
Average cement price in Brazil1
R$/t in real terms (as of 09/20) – Net FOB
Cement consumption per capita in relevant countriesAverage kg/inhabitant; 2018
Local market shows stronger volume demands, with prices expected to rebound even further
3Q20 in line with
all-time high level
126
42110
381.67
5.40
2011 2012 2013 2014 2015 2016 2017 2018 2019 2020
World range FOB-BR FOB-SE FX (USD/BRL)
-43%
SE historical price: R$285/t
-21%
Higher appreciation of other construction inputs sustaining great potential of cement price increase
521Kg/inhabitant world
average consumption per capita
1660
1094 1020837
648 559436 377 359 271 250 248 214
2014
42
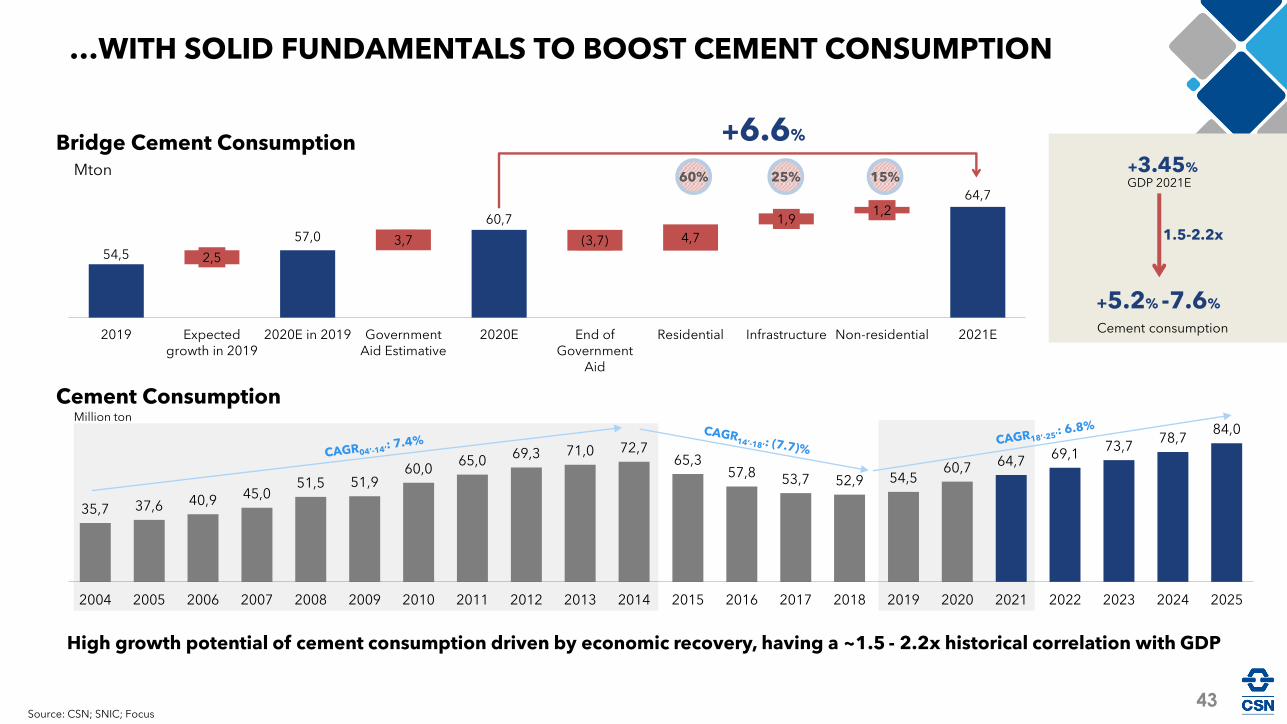
Bridge Cement Consumption
Source: CSN; SNIC; Focus
Cement Consumption
Mton
+6.6%
GDP 2021E+3.45%
+5.2% -7.6%
Cement consumption
1.5-2.2x
…WITH SOLID FUNDAMENTALS TO BOOST CEMENT CONSUMPTION
Million ton
High growth potential of cement consumption driven by economic recovery, having a ~1.5 - 2.2x historical correlation with GDP
60% 25% 15%
35,7 37,6 40,9 45,0 51,5 51,9
60,0 65,0
69,3 71,0 72,7 65,3
57,8 53,7 52,9 54,5 60,7 64,7
69,1 73,7
78,7 84,0
2004 2005 2006 2007 2008 2009 2010 2011 2012 2013 2014 2015 2016 2017 2018 2019 2020 2021 2022 2023 2024 2025
54,5
57,0
60,7
64,7
2,5
3,7 (3,7) 4,7
1,9 1,2
2019 Expectedgrowth in 2019
2020E in 2019 GovernmentAid Estimative
2020E End ofGovernment
Aid
Residential Infrastructure Non-residential 2021E
43
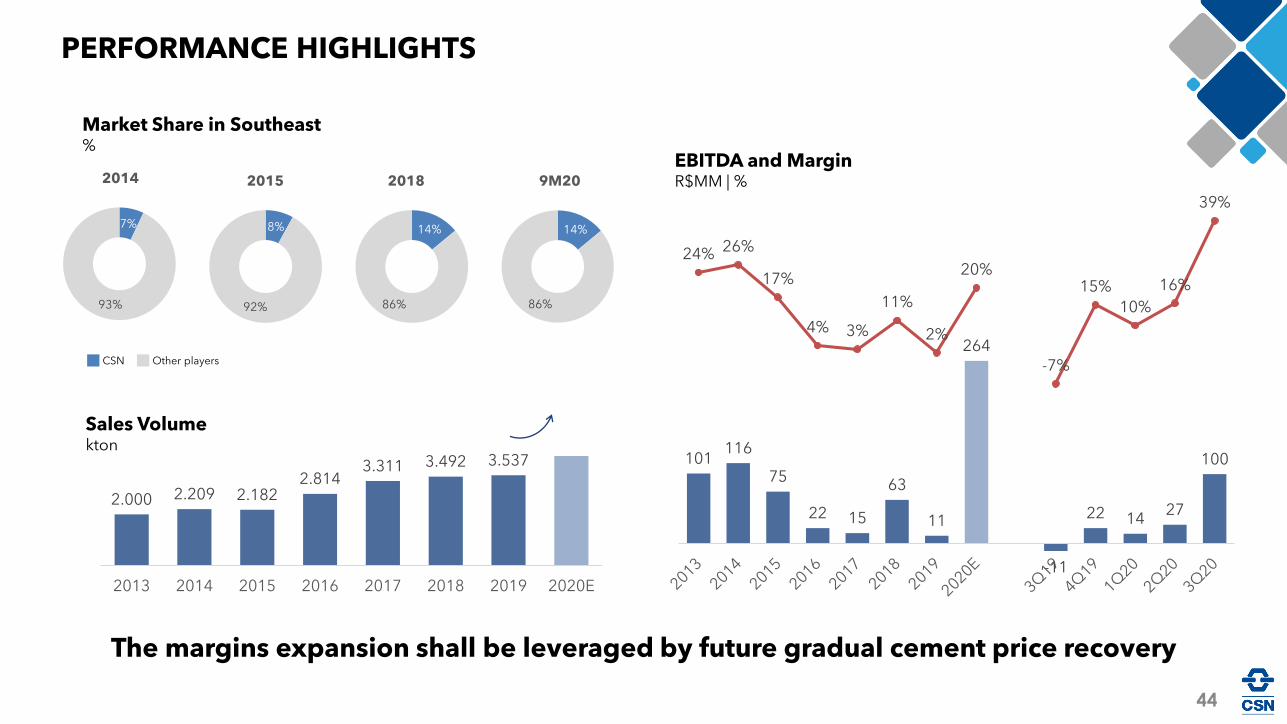
PERFORMANCE HIGHLIGHTS
2.000 2.209 2.1822.814
3.311 3.492 3.537
2013 2014 2015 2016 2017 2018 2019 2020E
14%
86%
9M20
8%
92%
2015
14%
86%
2018
CSN Other players
The margins expansion shall be leveraged by future gradual cement price recovery
101116
75
22 15
63
11
264
-11
22 1427
100
24% 26%
17%
4% 3%
11%
2%
20%
-7%
15%
10%
16%
39%
7%
93%
2014EBITDA and MarginR$MM | %
Sales Volumekton
Market Share in Southeast%
44
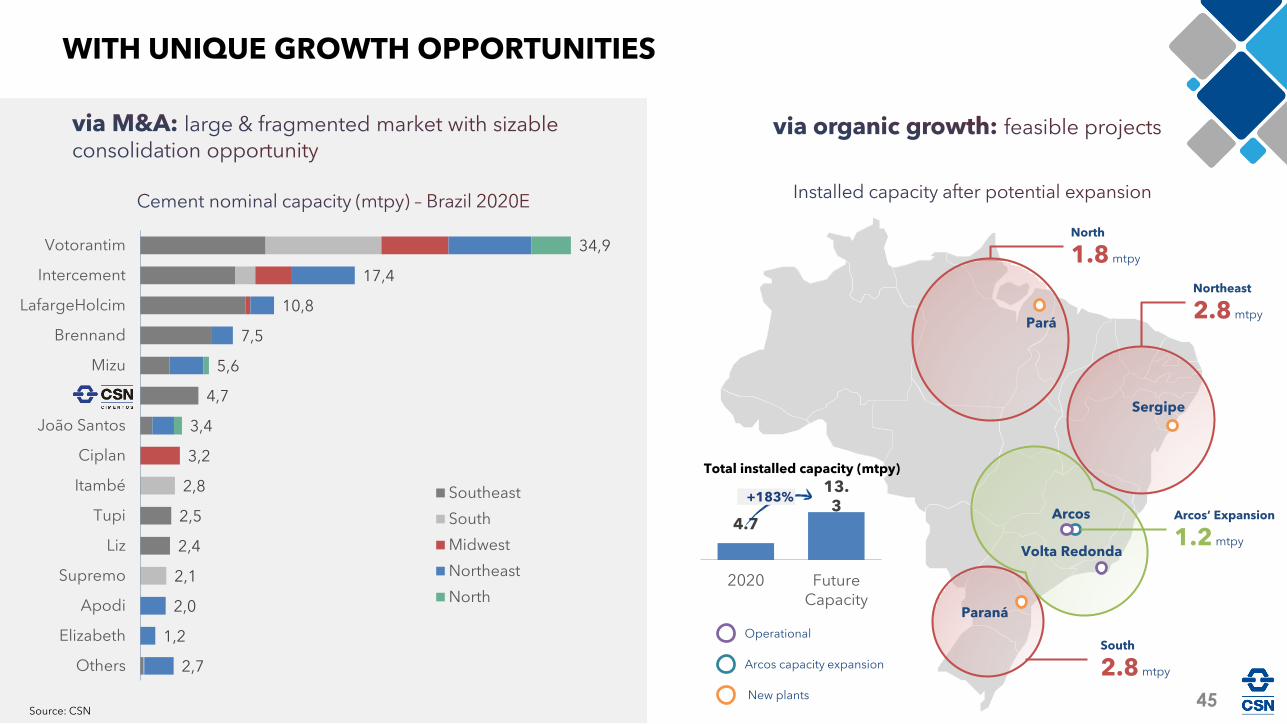
34,9
17,4
10,8
7,5
5,6
4,7
3,4
3,2
2,8
2,5
2,4
2,1
2,0
1,2
2,7
Votorantim
Intercement
LafargeHolcim
Brennand
Mizu
CSN
João Santos
Ciplan
Itambé
Tupi
Liz
Supremo
Apodi
Elizabeth
Others
Southeast
South
Midwest
Northeast
North
Source: CSN
Total installed capacity (mtpy)
South
2.8 mtpy
Northeast
2.8 mtpy
North
1.8 mtpy
Arcos’ Expansion
1.2 mtpy
New plants
Pará
Paraná
Sergipe
Arcos
Volta Redonda
Arcos capacity expansion
Operational
WITH UNIQUE GROWTH OPPORTUNITIES
4.7
13.3
2020 FutureCapacity
+183%
45
FINANCIAL46
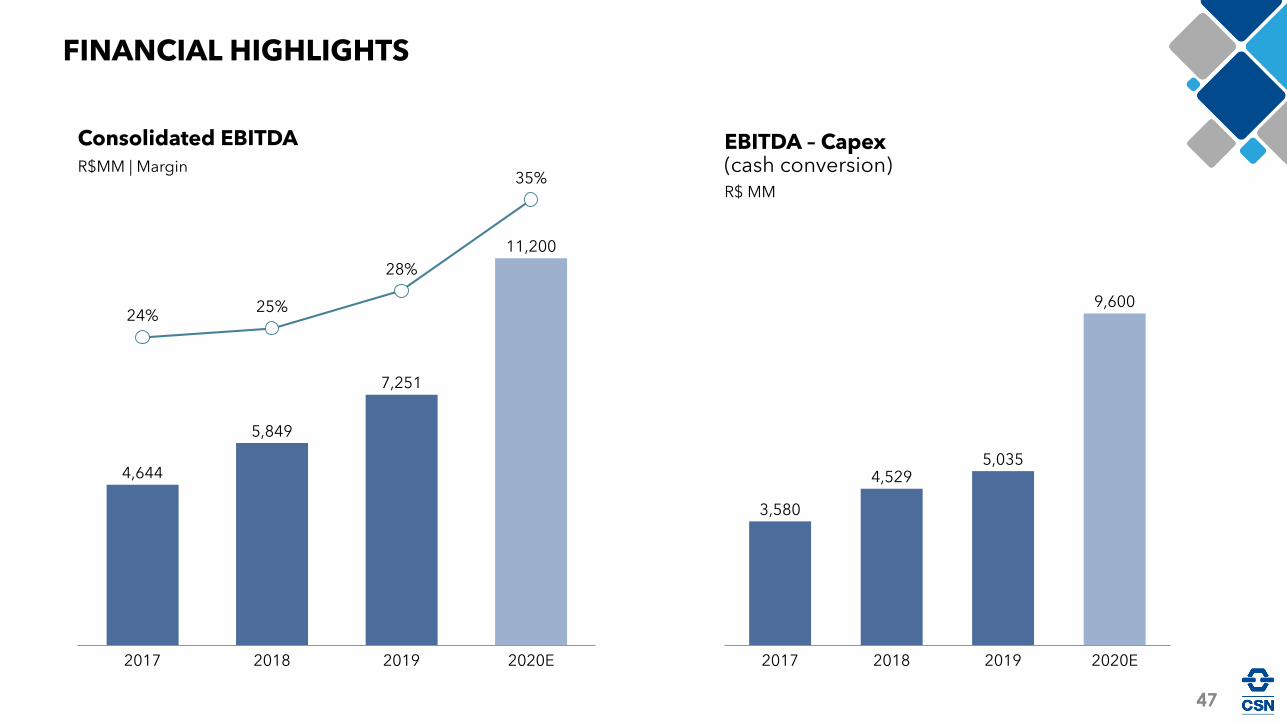
Consolidated EBITDA
R$MM | Margin
FINANCIAL HIGHLIGHTS
EBITDA – Capex(cash conversion)R$ MM
24%25%
28%
35%
7,251
2017 2018 2019 2020E
4,644
5,849
11,200
9,600
2017 2018 2019
5,0354,529
2020E
3,580
47
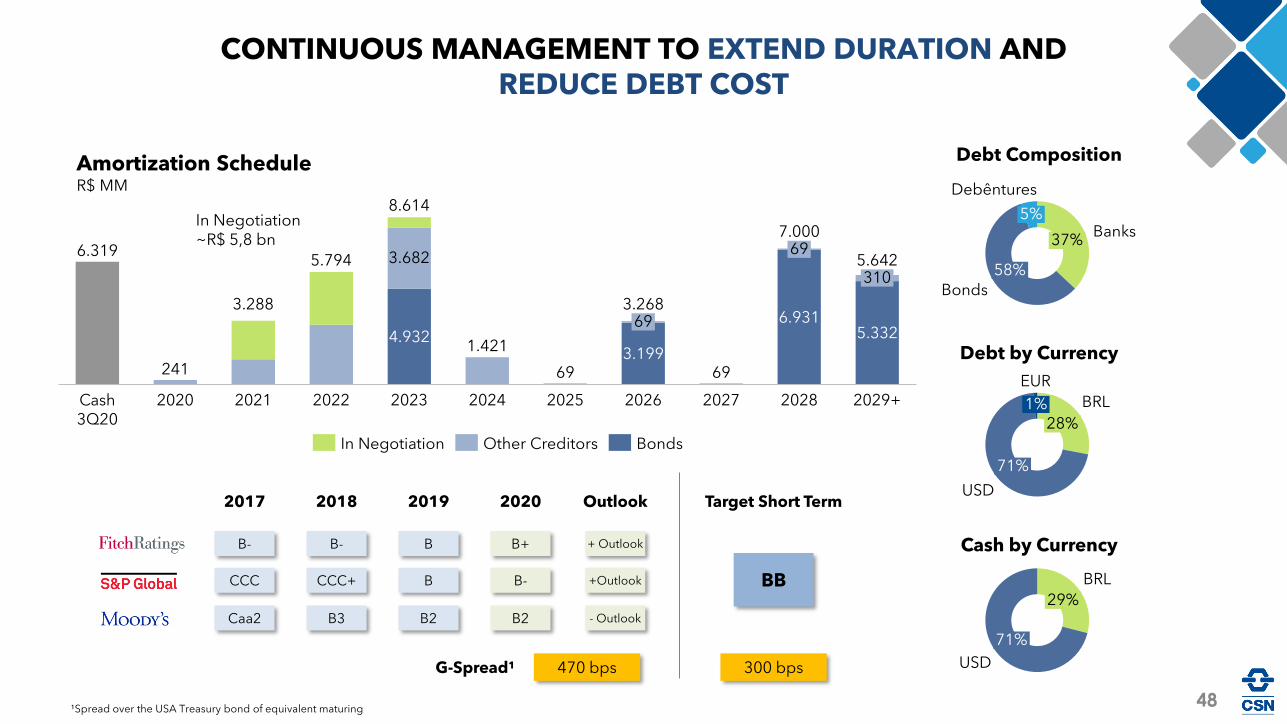
Debt Composition
Debt by Currency
Cash by Currency
48
5%
37%Banks
58%
Debêntures
Bonds
71%
29%
BRL
USD
EUR
28%
BRL1%
71%
USD
CONTINUOUS MANAGEMENT TO EXTEND DURATION AND REDUCE DEBT COST
Amortization ScheduleR$ MM
B-
CCC
Caa2
B-
CCC+
B3
B
B
B2
B+
B-
B2
+ Outlook
+Outlook
- Outlook
2017 2018 2019 2020 Outlook
470 bps
Target Short Term
BB
300 bpsG-Spread¹
¹Spread over the USA Treasury bond of equivalent maturing
6.319
241
4.9321.421
693.199
69
6.9315.332
3.682
Cash 3Q20
5.642
2020 20242021 20232022 2025
69
2026 2027
69
2028
3.288
310
2029+
5.794
8.614
3.268
7.000
In Negotiation BondsOther Creditors
In Negotiation~R$ 5,8 bn
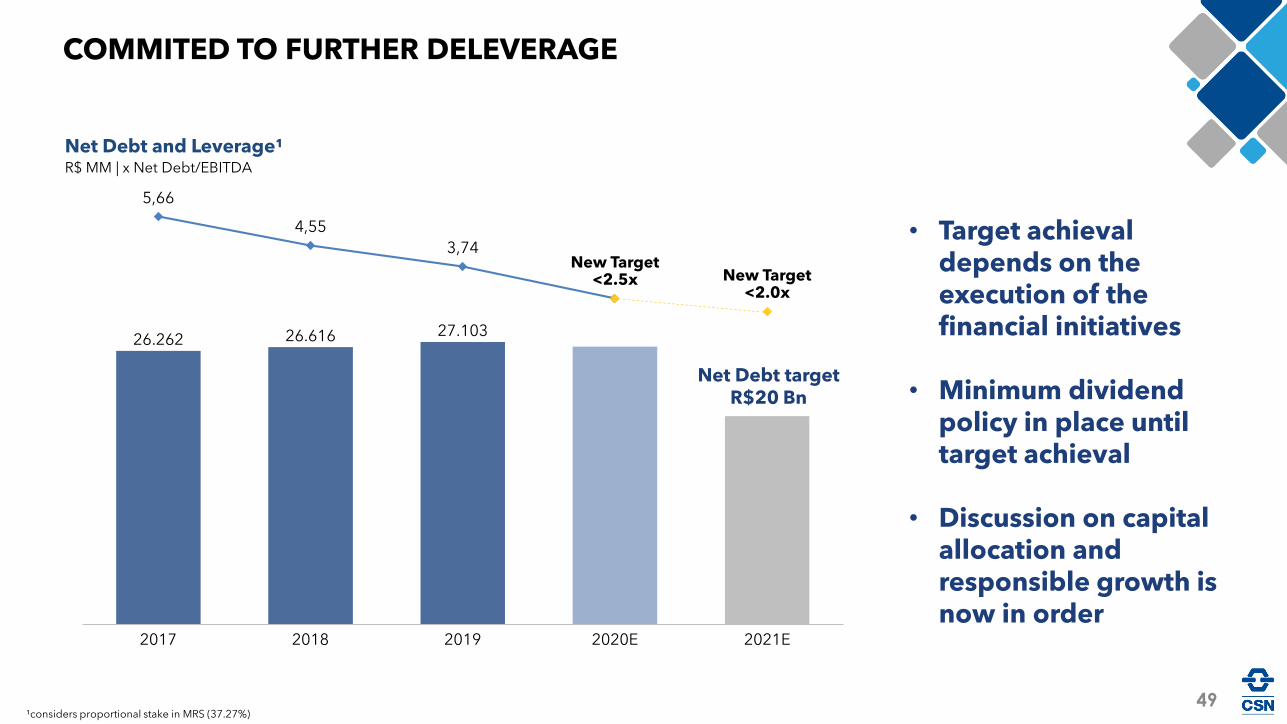
Net Debt and Leverage¹R$ MM | x Net Debt/EBITDA
COMMITED TO FURTHER DELEVERAGE
¹considers proportional stake in MRS (37.27%)
Net Debt target R$20 Bn
49
26.262 26.616 27.103
5,66
4,55
3,74
2020E20182017 2021E2019
New Target<2.5x New Target
<2.0x
• Target achievaldepends on theexecution of thefinancial initiatives
• Minimum dividendpolicy in place untiltarget achieval
• Discussion on capital allocation andresponsible growth isnow in order
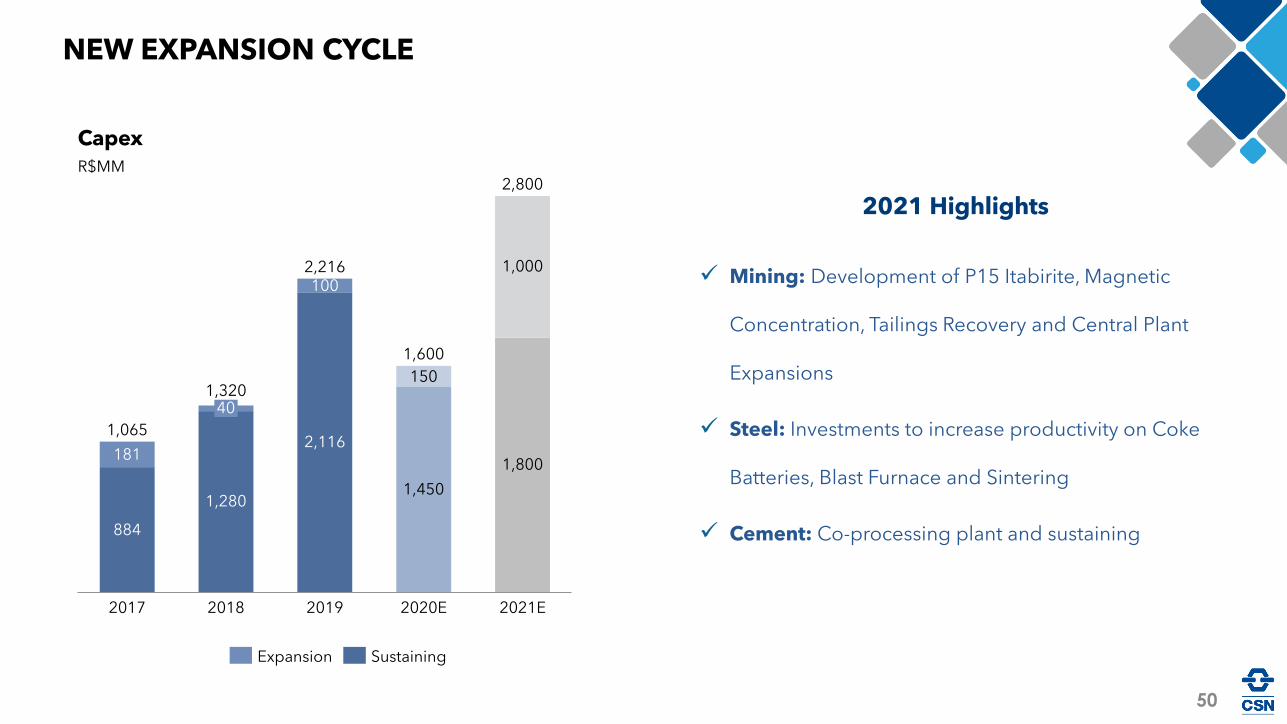
Capex
R$MM
NEW EXPANSION CYCLE
884
181
100
150
2017
40
2018 2020E 2021E2019
1,320
1,065
1,450
2,216
1,600
2,800
1,280
2,116
1,800
1,000✓ Mining: Development of P15 Itabirite, Magnetic
Concentration, Tailings Recovery and Central Plant
Expansions
✓ Steel: Investments to increase productivity on Coke
Batteries, Blast Furnace and Sintering
✓ Cement: Co-processing plant and sustaining
Expansion Sustaining
2021 Highlights
50

Steel Mining Cement Logistics Energy
On-going On-going
Dedicated seasoned team
Growth through own capital structure Efficient capital allocationStrong business focus
Fully independent structure
51
TRANSFORMATION IN COURSE TO GIVE AUTONOMY AND
UNLOCK VALUE
Investor Relations:
CFO and IR Director: Marcelo Ribeiro
Investor Relations Team: Jose Henrique Triques and Guilherme Vinco dos Santos
52