detection of verbal and nonverbal speech features as
TRANSCRIPT
Detection of Verbal and Nonverbal speech features as
markers of Depression:
results of manual analysis and automatic classification
Filomena Scibelli
Thesis submitted for the degree of Doctor of Philosophy
in
Mind, Gender and Language XXXI cycle,
curriculum Cognitive and Experimental Psychology
Supervisor: Co-supervisor
Prof. Anna Esposito Prof. Alessandro Vinciarelli
2018/2019 Academic Year


A mia zia Michelina,
grande esempio di bontà e umiltà
IV
Declaration
I declare that I have developed and written this Thesis by myself, under the guidelines
of my supervisor Prof. Anna Esposito. I have not used sources without declaration in
the text. The contributions of others involved in this study are clearly indicated in the
text and in Acknowledgements Section.
V
Acknowledgements
I would like to thank all psychiatrists of the Clinical Health Centers for collaboration:
- Dr. Luca Bartoli (Department of Public Mental Health [UOMS] of Angri-Sacafi,
Salerno) for the stipulation of the collaboration agreement with the Clinical Health
Center of Salerno (ASL Salerno);
- Dr. Gaetano De Mattia (Department of Public Mental Health [UOMS] of Santa
Maria Capua Vetere, Caserta) and his medical staff for patients recruitment;
- Dr. Sabato Manzi (Department of Public Mental Health [UOMS] of Atripalda,
Avellino) and his medical staff for the stipulation of the collaboration agreement with
the Clinical Health Center of Avellino (ASL Avellino) and patients recruitment;
- Dr. Maurizio Sabia (Casa di Cura Villa Camaldoli, Napoli) for patients recruitment;
- Dr. Enrico Tresca (Department of Public Mental Health [UOMS] of Caserta) for
the stipulation of the collaboration agreement with the Clinical Health Center of
Caserta (ASL Caserta).
Thanks to all patients for their voluntary participation in the study and the psychology
students (Marianna Aprea, Antonello Cito, Giulia De Gregorio, Gabriella Forgine,
Sara Pesce; Università della Campania L. Vanvitelli) for collaborating on healthy
subjects recruitment.
Thanks to Prof. Gennaro Cordasco (Università della Campania L. Vanvitelli) for the
technical support, and Giorgio Roffo and Mohammed Tayarami (University of
Glasgow) for collaboration on data analysis presented in Chapter 4.
I thank my supervisor Prof. Anna Esposito for directing me during my three years of
PhD course and my co-supervisor Prof. Alessandro Vinciarelli for directing me
during my visiting to the University of Glasgow.
Lust but not least, I would like to thank my parents Enrico and Viola, and my
boyfriend Vincenzo for always supporting me and believing in my abilities.
VI
Summary
The present PhD project was the result of a multidisciplinary work involving
psychiatrists, computing scientists, social signal processing experts and psychology
students with the aim to analyse verbal and nonverbal behaviour in patients affected
by Depression. Collaborations with several Clinical Health Centers1 were established
for the collection of a group of patients suffering from depressive disorders.
Moreover, a group of healthy controls was collected as well. A collaboration with the
School of Computing Science of Glasgow University was established with the aim to
analysed the collected data.
Depression was selected for this study because is one of the most common mental
disorder in the world (World Health Organization, 2017) associated with half of all
suicides (Lecrubier, 2000). It requires prolonged and expensive medical treatments
resulting into a significant burden for both patients and society (Olesen et al., 2012).
The use of objective and reliable measurements of depressive symptoms can support
the clinicians during the diagnosis reducing the risk of subjective biases and disorder
misclassification (see discussion in Chapter 1) and doing the diagnosis in a quick and
non-invasive way. Given this, the present PhD project proposes the investigation of
verbal (i.e. speech content) and nonverbal (i.e. paralingiuistic features) behaviour in
depressed patients to find several speech parameters that can be objective markers of
depressive symptoms. The verbal and nonverbal behaviour are investigated through
two kind of speech tasks: reading and spontaneous speech. Both manual features
extraction and automatic classification approaches are used for this purpose.
1 Department of Public Mental Healthy of Atripalda (Avellino), Department of Public Mental Healthy
of Santa Maria Capua Vetere (Caserta), Department of Public Mental Healthy Scafati-Angri (Salerno),
Casa di Cura Villa Camaldoli (Napoli).
VII
Differences between acute and remitted patients for prosodic and verbal features have
been investigated as well. In addition, unlike other literature studies, in this project
differences between subjects with and without Early Maladaptive Schema (EMS:
Young et al., 2003) independently from the depressive symptoms, have been
investigated with respect to both verbal and nonverbal behaviour.
The proposed analysis shows that patients differ from healthy subjects for several
verbal and nonverbal features. Moreover, using both reading and spontaneous speech,
it is possible to automatically detect Depression with a good accuracy level (from 68
to 76%). These results demonstrate that the investigation of speech features can be a
useful instrument, in addition to the current self-reports and clinical interviews, for
helping the diagnosis of depressive disorders.
Contrary to what was expected, patients in acute and remitted phase do not report
differences regarding the nonverbal features and only few differences emerges for the
verbal behaviour. At the same way, the automatic classification using paralinguistic
features does not work well for the discrimination of subjects with and without EMS
and only few differences between them have been found for the verbal behaviour.
Possible explanations and limitations of these results will be discussed.
VIII
Contents
Declaration... ............................................................................................................ IV
Acknowledgements .................................................................................................... V
Summary .................................................................................................................. VI
List of Figures .......................................................................................................... XI
List of Tables .......................................................................................................... XII
Introduction ............................................................................................................... 1
1 The misdiagnosis of Depression ........................................................................ 4
1.1 The current status of Depression ...................................................................... 4
1.2 The diagnostic problems of Depression ........................................................... 6
1.2.1 Patients and clinician factors ...................................................................... 7
1.2.2 Assessment methodologies ......................................................................... 8
1.2.3 Diagnostic criteria ....................................................................................... 9
1.2.4 Disorders' overlaps.................................................................................... 11
1.3 Towards specific behavioural measures of Depression: the proposed research
work..... ................................................................................................................. 12
2 Prosodic features as markers of Depression ................................................. 21
2.1 Introduction .................................................................................................... 21
2.2 Literature results ............................................................................................. 22
2.3 The present research project ........................................................................... 28
2.3.1 Participants ............................................................................................... 28
2.3.2 Experimental set-up .................................................................................. 30
2.3.3 Procedure .................................................................................................. 32
2.3.4 Features extraction .................................................................................... 33
2.3.4.1 Tale’s segmentation .......................................................................... 33
2.3.4.2 Diary transcriptions ........................................................................... 34
IX
2.3.5 The measurements .................................................................................... 36
2.3.5.1 Tale ................................................................................................... 36
2.3.5.2 Diary ................................................................................................. 36
2.3.6 Data Analyses ........................................................................................... 40
2.3.6.1 Socio-demographic data .................................................................... 41
2.3.6.2 Tale parameters ................................................................................. 42
2.3.6.3 Diary parameters ............................................................................... 45
2.3.7 Discussion of the reported results ............................................................. 56
2.3.7.1 Tale ................................................................................................... 56
2.3.7.2 Diary ................................................................................................. 58
2.3.8 Conclusions .............................................................................................. 63
3 Verbal behaviour analysis in Depression ...................................................... 65
3.1 Introduction .................................................................................................... 65
3.1 Literature results ............................................................................................. 66
3.2 The present research project ........................................................................... 72
3.2.1 Participants and Experimental set-up ....................................................... 72
3.2.2 The measurements .................................................................................... 74
3.2.3 Data Analyses ........................................................................................... 75
3.2.3.1 Differences between depressed and healthy subjects ....................... 76
3.2.3.2 Differences between patients in remission and acute phase ............. 81
3.2.3.3 Differences between subjects with and without Early Maladaptive
Schema .......................................................................................................... 85
3.3.4 Discussion of the reported results ............................................................. 88
3.3.4.1 Differences between depressed and healthy subjects ....................... 89
3.3.4.2 Differences between patients in remission and acute phases ............ 92
3.3.4.3 Differences between subjects with and without Early Maladaptive
Schema .......................................................................................................... 92
3.3.5 Conclusions .............................................................................................. 97
4 Detecting Depression from speech: results of automatic classification ...... 99
4.1 Introduction .................................................................................................... 99
4.1.1 Literature results ..................................................................................... 100
X
4.1.2 Participants and Experimental set-up ..................................................... 105
4.1.3 The approach .......................................................................................... 105
4.1.4 Data Analyses and Results ..................................................................... 107
4.1.5 Conclusions ............................................................................................ 113
Conclusions ............................................................................................................ 116
Appendix 1: List of prosodic features .................................................................... 121
References .............................................................................................................. 123
XI
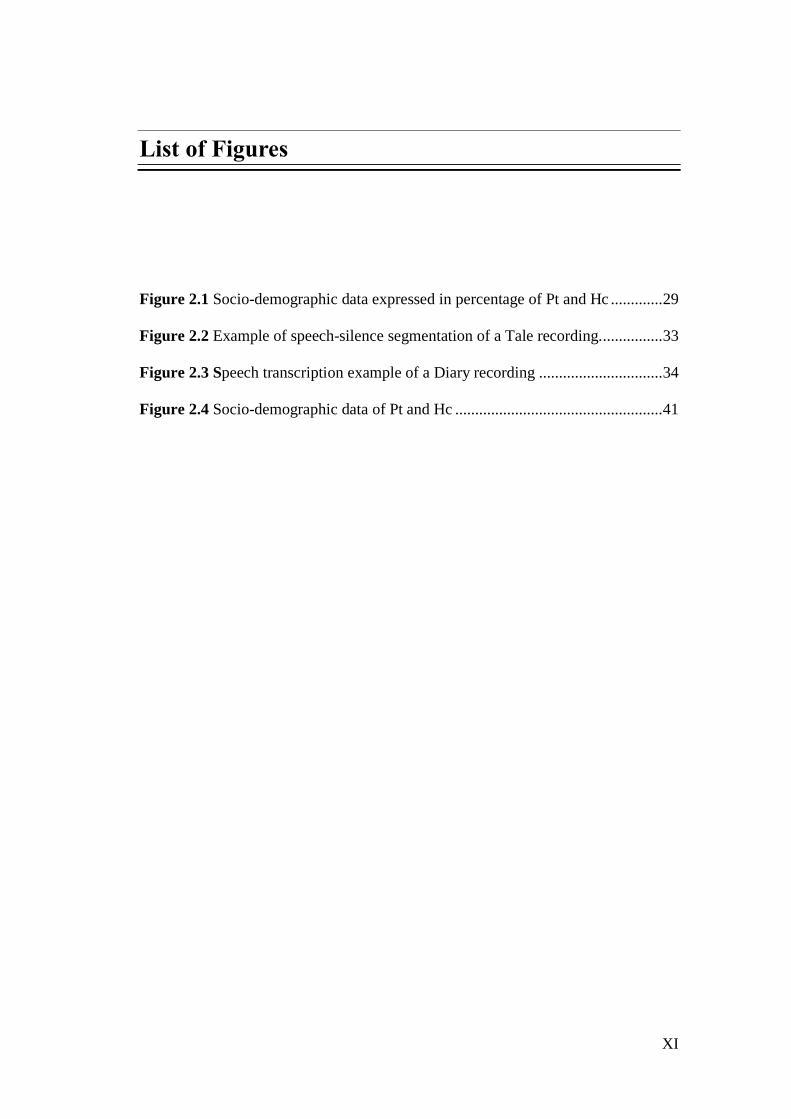
List of Figures
Figure 2.1 Socio-demographic data expressed in percentage of Pt and Hc ............. 29
Figure 2.2 Example of speech-silence segmentation of a Tale recording................ 33
Figure 2.3 Speech transcription example of a Diary recording ............................... 34
Figure 2.4 Socio-demographic data of Pt and Hc .................................................... 41
XII
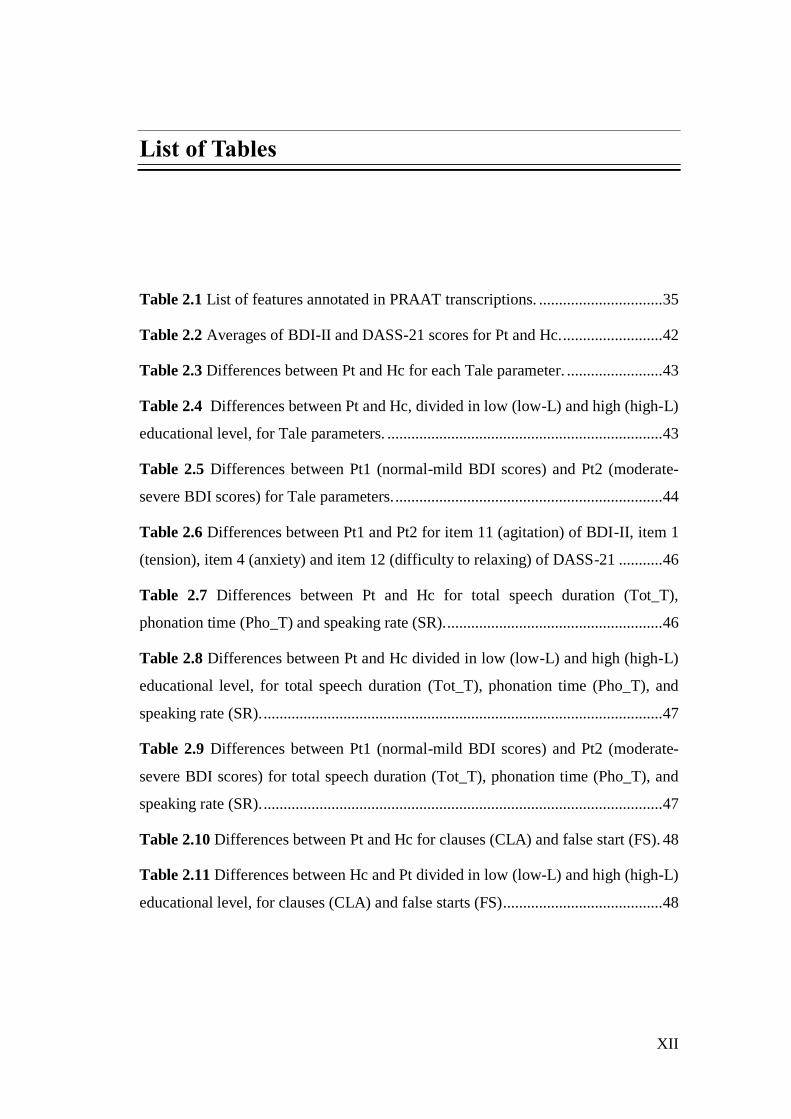
List of Tables
Table 2.1 List of features annotated in PRAAT transcriptions. ............................... 35
Table 2.2 Averages of BDI-II and DASS-21 scores for Pt and Hc. ......................... 42
Table 2.3 Differences between Pt and Hc for each Tale parameter. ........................ 43
Table 2.4 Differences between Pt and Hc, divided in low (low-L) and high (high-L)
educational level, for Tale parameters. ..................................................................... 43
Table 2.5 Differences between Pt1 (normal-mild BDI scores) and Pt2 (moderate-
severe BDI scores) for Tale parameters. ................................................................... 44
Table 2.6 Differences between Pt1 and Pt2 for item 11 (agitation) of BDI-II, item 1
(tension), item 4 (anxiety) and item 12 (difficulty to relaxing) of DASS-21 ........... 46
Table 2.7 Differences between Pt and Hc for total speech duration (Tot_T),
phonation time (Pho_T) and speaking rate (SR). ...................................................... 46
Table 2.8 Differences between Pt and Hc divided in low (low-L) and high (high-L)
educational level, for total speech duration (Tot_T), phonation time (Pho_T), and
speaking rate (SR). .................................................................................................... 47
Table 2.9 Differences between Pt1 (normal-mild BDI scores) and Pt2 (moderate-
severe BDI scores) for total speech duration (Tot_T), phonation time (Pho_T), and
speaking rate (SR). .................................................................................................... 47
Table 2.10 Differences between Pt and Hc for clauses (CLA) and false start (FS). 48
Table 2.11 Differences between Hc and Pt divided in low (low-L) and high (high-L)
educational level, for clauses (CLA) and false starts (FS) ........................................ 48
XIII
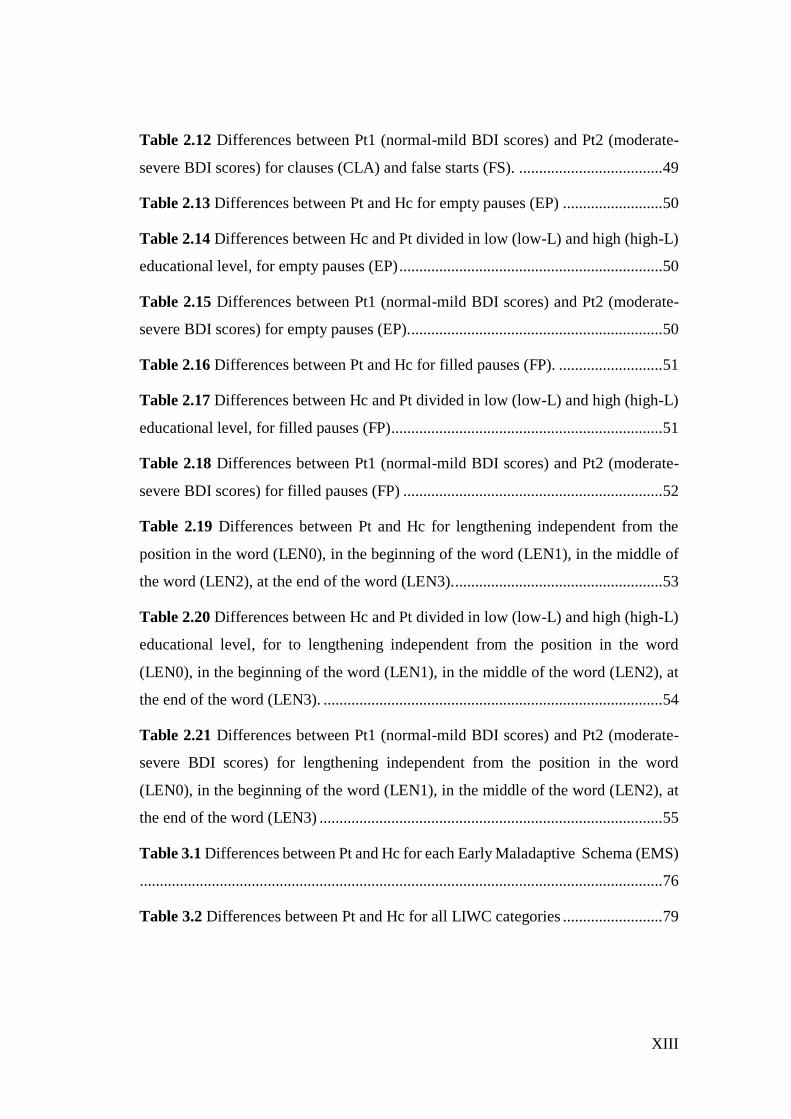
Table 2.12 Differences between Pt1 (normal-mild BDI scores) and Pt2 (moderate-
severe BDI scores) for clauses (CLA) and false starts (FS). .................................... 49
Table 2.13 Differences between Pt and Hc for empty pauses (EP) ......................... 50
Table 2.14 Differences between Hc and Pt divided in low (low-L) and high (high-L)
educational level, for empty pauses (EP) .................................................................. 50
Table 2.15 Differences between Pt1 (normal-mild BDI scores) and Pt2 (moderate-
severe BDI scores) for empty pauses (EP)................................................................ 50
Table 2.16 Differences between Pt and Hc for filled pauses (FP). .......................... 51
Table 2.17 Differences between Hc and Pt divided in low (low-L) and high (high-L)
educational level, for filled pauses (FP).................................................................... 51
Table 2.18 Differences between Pt1 (normal-mild BDI scores) and Pt2 (moderate-
severe BDI scores) for filled pauses (FP) ................................................................. 52
Table 2.19 Differences between Pt and Hc for lengthening independent from the
position in the word (LEN0), in the beginning of the word (LEN1), in the middle of
the word (LEN2), at the end of the word (LEN3). .................................................... 53
Table 2.20 Differences between Hc and Pt divided in low (low-L) and high (high-L)
educational level, for to lengthening independent from the position in the word
(LEN0), in the beginning of the word (LEN1), in the middle of the word (LEN2), at
the end of the word (LEN3). ..................................................................................... 54
Table 2.21 Differences between Pt1 (normal-mild BDI scores) and Pt2 (moderate-
severe BDI scores) for lengthening independent from the position in the word
(LEN0), in the beginning of the word (LEN1), in the middle of the word (LEN2), at
the end of the word (LEN3) ...................................................................................... 55
Table 3.1 Differences between Pt and Hc for each Early Maladaptive Schema (EMS)
................................................................................................................................... 76
Table 3.2 Differences between Pt and Hc for all LIWC categories ......................... 79
XIV
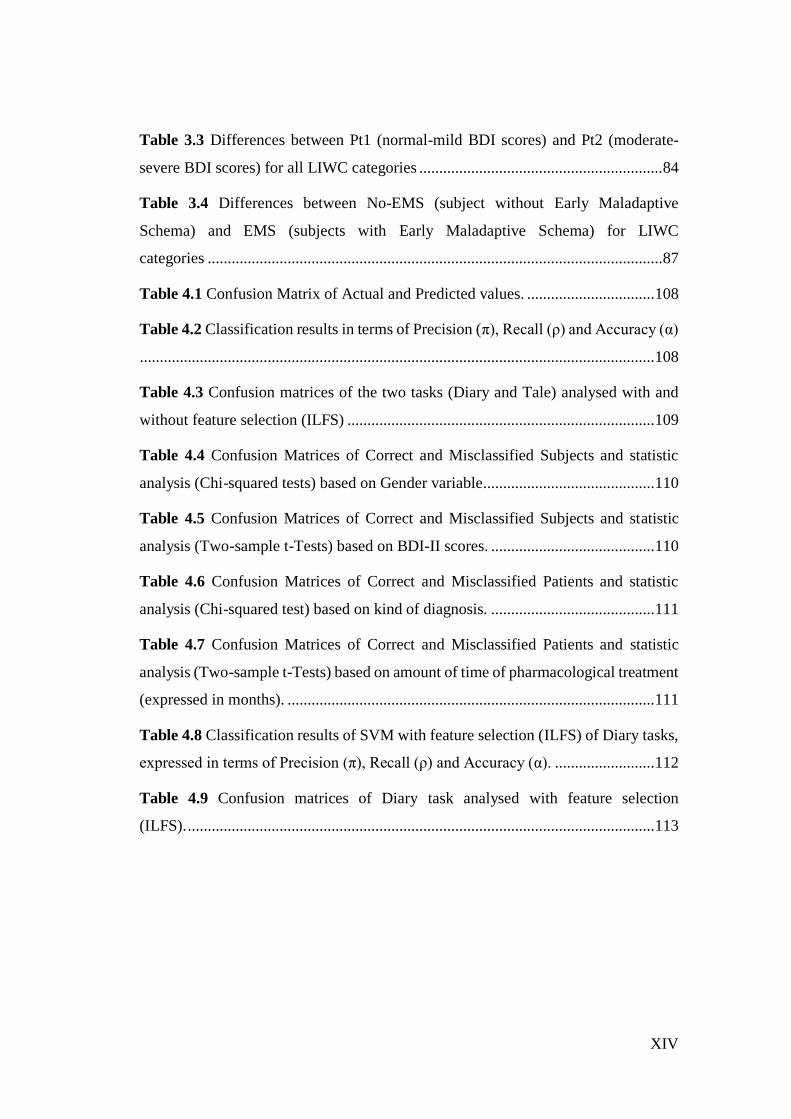
Table 3.3 Differences between Pt1 (normal-mild BDI scores) and Pt2 (moderate-
severe BDI scores) for all LIWC categories ............................................................. 84
Table 3.4 Differences between No-EMS (subject without Early Maladaptive
Schema) and EMS (subjects with Early Maladaptive Schema) for LIWC
categories .................................................................................................................. 87
Table 4.1 Confusion Matrix of Actual and Predicted values. ................................ 108
Table 4.2 Classification results in terms of Precision (π), Recall (ρ) and Accuracy (α)
................................................................................................................................. 108
Table 4.3 Confusion matrices of the two tasks (Diary and Tale) analysed with and
without feature selection (ILFS) ............................................................................. 109
Table 4.4 Confusion Matrices of Correct and Misclassified Subjects and statistic
analysis (Chi-squared tests) based on Gender variable ........................................... 110
Table 4.5 Confusion Matrices of Correct and Misclassified Subjects and statistic
analysis (Two-sample t-Tests) based on BDI-II scores. ......................................... 110
Table 4.6 Confusion Matrices of Correct and Misclassified Patients and statistic
analysis (Chi-squared test) based on kind of diagnosis. ......................................... 111
Table 4.7 Confusion Matrices of Correct and Misclassified Patients and statistic
analysis (Two-sample t-Tests) based on amount of time of pharmacological treatment
(expressed in months). ............................................................................................ 111
Table 4.8 Classification results of SVM with feature selection (ILFS) of Diary tasks,
expressed in terms of Precision (π), Recall (ρ) and Accuracy (α). ......................... 112
Table 4.9 Confusion matrices of Diary task analysed with feature selection
(ILFS). ..................................................................................................................... 113
1
Introduction
Depression is a mental health disorder that causes significant disability and
impairment of quality of life (Cuijpers & Smit, 2002; Large, 2016). The European
Community underlies the crucial importance of prevention programs for the early
detection of the disorder (Wahlbeck & Mäkinen, 2008). Nevertheless, different
factors still cause the underdiagnosis and/or misdiagnosis of Depression essentially
ascribed to: patients characteristics, professional evaluation by clinicians, some
weakness of current diagnostic criteria and assessment methodologies (i.e. self
reports and clinical interviews), characteristics of Depression that often overlaps with
other depressive states (e.g. Adjustment Disorder). Possible new approaches should
improve the accuracy of diagnosis using quantitative methods based on objective
recordings of depressive symptoms. Considering this, the present PhD project
proposes the investigation of verbal and nonverbal speech features to find several
parameters that can be robust markers of the depressive states. The implementation
of such parameters in linguistic tools could be useful, in addition to the traditional
diagnostic instruments (e.g. BDI-II: Beck et al., 1996; HRSD: Hamilton, 1960), for a
more valid and reliable diagnosis. Because of the need to introduce objective, quick
and non-invasive instruments to diagnose the disorder, the detection of Depression
has attracted the interest of computing community that is developing new methods
for the automatic analysis of Depression using features extracted from behavioural
data, such as speech and body movements. In particular, the present project proposes
to investigate on the reliability of both verbal and nonverbal speech features
exploiting both manual and automatic analyses. For this purpose, a reading and
spontaneous speech task was administered to a group of depressed patients (who
2
received the diagnosis by professional psychiatrists) matched with a group of healthy
subjects according to several socio-demographic characteristics (gender, age,
educational level, employment and marital status).
In Chapter 2 a set of prosodic features, manually extracted by the reading and
spontaneous speech, are investigated through a statistical approach, to find possible
differences between depressed and healthy subjects. Furthermore, differences
between patients in acute and remission phase are considered.
In Chapter 3 verbal speech categories are automatically extracted using the LIWC
tool (Pennebaker et al., 2001, see paragraph 3.3.2) and a statistic analysis is carried
out to find possible differences between patients and healthy subjects, and acute and
remitted patients. Moreover, while all the literature studies have focused on the
discrimination of depressed subjects based on current diagnostic criteria (DMS-5 and
ICD-10, see par. 1.1) in this project also Early Maladaptive Schema (EMS: Young et
al., 2003) are investigated independently of the detected depressive symptoms.
Finally, in Chapter 4 the automatic detection of Depression based on a set of
paralinguistic features are analysed using a Support Vector Machine classifier taking
as input either all set of speech features or a subset of them selected through a feature
selection approach algorithm (see paragraph 4.1.4). As for the verbal analysis, also
in this case the aim is to discriminate among patients, healthy controls, and subjects
with and without EMS.
The speech of depressed patients presents several differences with respect to that of
healthy subjects for both verbal and nonverbal features. In the reading activities
patients are slower and the duration of pauses is longer than healthy subjects. While
in the spontaneous speech they reported a greater mean length of clauses, empty
pauses, filled pauses and lengthening, a longer duration of empty pauses and a shorter
phonation time (although this last result is only for patients in acute phase) than
controls.
Patients show differences also for the speech content especially characterized by
significant negative emotions and self-focusing. Finally, the automatic detection of
Depression reports a good accuracy classification of depressed and healthy subjects

3
(from 68 to 76%). Considering the comparison of acute and remitted patients and
subjects with and without EMS, only few differences was found for the verbal
analysis.
4
1 The misdiagnosis of Depression
1.1 The current status of Depression
Depression is a common disorder (see definition in Box 1.1) characterized by
emotional (e.g. sadness, anhedonia), physical (e.g. insomnia, decreased energy,
appetitive disturbance), cognitive (e.g. low self-esteem, memory and concentration
difficulties) and behavioural (e.g. social isolation) symptoms (Diagnostic and
Statistical Manual of Mental Disorders 5th edition [DSM-5]: American Psychiatric
Association, 2013; International Classification of Diseases 10th Revision [CD-10]:
World Health Organization, 1993) that engender significant disability, impairment of
quality of life and increased of morbidity and mortality (Cuijpers & Smit, 2002;
Large, 2016). There are multiple variations of Depression (see definition in Box 1.2),
although the most general distinction is between Unipolar Depressive Disorder and
Bipolar Disorder according to the presence or not of hypomanic or manic episodes
(DSM-V, ICD-10). In DSM-5, among the Unipolar Disorders, there is the Major
Depressive Disorder characterized by one or more major depressive episodes without
a history of manic or hypomanic episodes (see details in Box 1.2). The two main
symptoms of depressive episodes are sadness and loss of interest or pleasure for daily
activities, that they must be associated with at least 5 other physical and/or cognitive
symptoms to make the diagnosis. If manic or hypomanic episodes are present, the
diagnosis is of Bipolar Disorder (BD), divided in the DMS-5 into I and II type, while
there is not this distinction in ICD-10 (see details in Table 1.2).
5
Box 1.1 Depressive disorders definition (from WHO, 2017)
Depressive disorders are characterized by sadness, loss of interest or pleasure,
feelings of guilt or low self-worth, disturbed sleep or appetite, feelings of
tiredness, and poor concentration. Depression can be long-lasting or recurrent,
substantially impairing an individual’s ability to function at work or school or
cope with daily
life. At its most severe, Depression can lead to suicide. Depressive disorders
include two main sub-categories:
major depressive disorder / depressive episode, which involves
symptoms such as depressed mood, loss of interest and enjoyment, and
decreased energy; depending on the number and severity of symptoms,
a depressive episode can be categorized as mild, moderate, or severe;
and
dysthymia, a persistent or chronic form of mild Depression; the
symptoms of dysthymia are similar to depressive episode, but tend to be
less intense and last longer.
A further important distinction concerns Depression in people with or without a
history of manic episodes. Bipolar affective disorder typically consists of both
manic and depressive episodes separated by periods of normal mood. Manic
episodes involve elevated mood and increased energy, resulting in over-activity,
pressure of speech and decreased need for sleep.
Currently, Depression is one of the most common mental health disorder in the world:
the WHO (World Health Organization, 2017) has estimated that more than 300
million patients suffer from Depression in 2015 (the number increased by 18%
between 2005 and 2015), of which one-third show from moderate to severe
symptoms. It is the second cause of disability after ischaemia and the most important
suicide risk factor for elderly people (Wahlbeck & Mäkinen, 2008): around 60% of
suicides in Europe are associated with Depression (Mann et al., 2005). Depression is
more common in females (5.1%) than males (3.6%) and it is one of the leading cause
6
of disease for woman in both high-income and low-middle income countries.
Depressive symptoms are also frequently associated with other psychiatric (Rohde et
al. 1991), physical (Carney & Freedland, 2000) or neurological (Rickards, 2005)
diseases. The main consequences of Depression are the impairments in social
relationships, job decreases productivity and absenteeism from work (Kessler et al.,
2006).
Considering that Depression is one of the most disabling diseases causing significant
burden both to the patient and society, the report of the European Communities
(Wahlbeck & Mäkinen, 2008) underlies the importance of prevention through
psychological treatments, for people at risk to develop the disorder. Nevertheless,
Depression is currently undertreated: Alonso et al. (2004) reported that only a third
of Europeans with mood disorders have been in contact with formal health services
in 2003 and, of these patients, only a half have received adequate treatments.
According to the report of European Communities, one of the undertreatment reason
is the underdiagnosis of the disorder by healthcare professionals in primary setting
(Wahlbeck & Mäkinen, 2008). However, in addition to this factor, there are others
(which will be discussed in the next paragraph) that make difficult to correctly
diagnose the depressive disorders. They can be ascribed to: patients characteristics,
diagnostic criteria, methodologies used for the diagnosis and disorders’ overlaps.
1.2 The diagnostic problems of Depression
Current diagnostic systems (DSM-5 and ICD-10) attempt to classify different kinds
of Depression considering the “number of symptoms” simultaneously present for a
“certain time period”, and their impact on the “social functioning” of patients. These
categorical classifications allow a good agreement among clinicians with respect to
the presence or absence of the disorder (Haslam, 2003). However, the diagnostic
process based on these systems (DSM-5 and ICD-10) still have some weaknesses
essentially associate to four aspects discussed in the next paragraphs: patients and
7
clinician factors, assessment methodologies, diagnostic criteria and disorders’
overlap.
1.2.1 Patients and clinician factors
The diagnostic process is based on both the reported patients’ experiences and the
capability of clinicians to correctly interpret the symptoms reported by patients. With
respect to the first one, if from one hand the anamnesis based on reported symptoms
is essential for the diagnostic process, on the other hand some factors connected to
the patients characteristics, may compromise the validity of the diagnosis itself.
Patients can be unable to provide reliable information about their health state,
thoughts and emotions. For instance, it could be hard for patients to express their
feeling because of dominant emotional inhibition (Young et al., 2003), or they may
become upset and stressed when trying to report episodes of their life (Moyle, 2002).
Symptoms, like loss of energy and interest, difficulty of attention, memory and
concentration, flight of idea, may make difficult the flow of narrative experiences.
Other patients may voluntarily omit information for disparate reasons (such as to
avoid particular treatments, or for legal consequences).
The second factor that can influence the diagnosis is the capability of clinicians to
correctly identify the symptoms. This issue is particular relevant in primary care
setting, given that people suffering from Depression often seek advises from primary
care physician. It is clear that the capability to diagnose the mental condition is
important to avoid the underdetection or misdetection of the disorder, erroneous
treatments, or late treatments starting long time after the onset of diseases.
Nevertheless, there are significant evidences on the misrecognition or underdiagnosis
of Depression in primary care setting (Kessler et al., 2002; Lecrubier, 2007; Mitchell,
Vaze, & Rao, 2009; Simon et al., 2004). In this context, patients are most likely to
report somatic complaints (e.g. headaches, fatigue, stomach pains), that can be easily
confused with physical illnesses (Trivedi, 2004) and omit the emotional distress
(Simon et al., 1999). This factor makes hard the recognition of depressive symptoms
8
if the primary care physician has not specific skills (Henriques et al., 2009; Rost et
al. 1994; Wahlbeck & Mäkinen, 2008). Especially, when the direct observation is not
combined with other data sources (like self-reports and clinical interviews), the
possibility of erroneous diagnoses increases. In this sense, the possibility to use tools
and methodologies that do not require specific training and are independent from the
subjective prospective of both patients and clinicians, can be useful to avoid all the
abovementioned biases.
1.2.2 Assessment methodologies
Aboraya et al. (2006) state that one of the problem about psychiatric diagnoses is that
most clinicians use the unstructured interviews such as the Traditional Diagnostic
Assessment (TDA: Miller et al. 2001), which have been found to give a low diagnosis
reliability (Miller et al. 2001). In addition, unstructured interviews are biased by the
following factors: a) they require clinician’s trainings to develop skills (like the
ability to establish a therapeutic relationship); b) they are not cheap and quick (like
self-reports); c) they can provide only qualitative data. However, several studies
reported that also structured interviews do not always show high validity. For
example, Gjerdingen et al. (2011) investigated the use of SCID (Structured Clinical
Interview for DSM-5: First & Williams, 2016) to diagnose Post Partum Depression
in a large sample of women. They found lower Depression rates than it was expected
and inconsistent SCID and PHQ-9 (9-item Patient Health Questionnaire: Kroenke et
al. 2001) results. Knäuper & Wittchen (1994) found age-specific response biases in
elderly for the Depression assessment using both the DIS (Diagnostic Interview
Schedule: Robins et al. 1981) and CIDI (Composite Diagnostic Interview Schedule:
Robins et al., 1988), probably because of the tendency to ascribe to the aging the
elder’s health problems, rather than to depressed mood. Similarly, Eaton et al. (2000)
found that the DIS missed many cases judged to meet Depression using the SCAN
(Schedules for Clinical Assessment in Neuropsychiatry: Wing et al., 1990).
9
Another methodology to detect depressive symptoms is through self-report
questionnaires (e.g. the Beck Depression Inventory II [BDI-II]: Beck et al., 1996).
This is a cheap and quick method to gather information of patients’ symptoms and it
can be used to collect quantitative data on large clinical samples. Nevertheless, even
though the questionnaires can discriminate between depressed and healthy subjects,
it is not obvious that Depression is measured with a high validity level. For example,
questionnaires may not be able to detect subtle differences between Depression and
Healthy condition, because of several factors that may affect the correct
measurements (Hoskin, 2012): some items can be difficult to understand for people
with low educational level; some people may lack the introspective ability necessary
to give accurate answers; others may have the tendency to choose the outer points of
the rating scale, while others to choose the midpoints (Austin et al., 1998). In a review
about the validity aspects of the BDI questionnaire, Richter et al. (1998) found that
its shortcomings are the high item difficulty index, controversial factorial validity
(because affected by different factors such as the characteristics of the sample and the
criterion to estimate the factor numbers), instability of scores over short time intervals
(over the course of one day), poor discriminant validity against anxiety.
It is clear that, despite the different methodologies to assess Depression (unstructured,
structured interviews and self-reports), many diagnostic weaknesses are still to be
solved. New diagnostic assessment tools, which are unbiased, reliable across judges,
non-invasive, quick and simple to use, can be useful to overcome the limitations of
current methodologies.
1.2.3 Diagnostic criteria
The current diagnostic systems (DSM-5 and ICD-10) are based on the number of
symptoms and the duration of their appearance. In addition, for affective disorders,
specific patterns of symptoms are suggested to discriminate different types of
Depression. For example, the MDD diagnosis requires that the “depressed mood” and
the “diminished interest or pleasure” are associated with five of the nine criteria (four
10
of which cover two distinct symptoms, e.g. insomnia or hypersomnia; see Box 1.2).
This means that different criteria combination are possible to make the diagnosis.
Two people could suffer from the MDD, but not share the same symptoms.
From a certain point of view, these current systems (DSM-5 and ICD-10) can be
considered rather imperfect indicators of Depression. First, most of the symptoms
(like sadness and loss of energy) are recognizable as extensions of feeling states of
healthy people. This means that these symptoms can be placed on a dimensional
continuum, where on the opposite side there are the normal negative emotional
responses to everyday life experiences. Whether the symptoms reported by patients
reflect normal feelings or psychopathological states is a clinician’s decision based
only of the “duration” parameter. There are no other parameters to discriminate
between the two conditions (normal feelings or psychopathological states). Second,
not all the combinations of symptoms have the same importance for the diagnosis.
For example, loss of energy and difficulty to get concentrate can be the consequence
of insomnia, while the thoughts of death can be the consequence of worthlessness
and guilt feelings; while the loss of energy is more specific to Depression, fatigue is
a common state present in many psychiatric and non-psychiatric conditions (Parker,
2011). This means that some symptoms cannot be the core attributes of the disorder.
Third, if the symptoms do not specifically satisfy the diagnostic criteria in terms of
number or duration of them, patients are diagnosed as suffer from "disorder not
otherwise specified", risking to wrongly fall in the atypical category.
Given the abovementioned weak points of the diagnostic systems (DSM-5, ICD-10),
the two parameters of “number” and “duration” of symptoms may not be enough for
the correct diagnosis of depressive disorders. Conversely, the use of more specific
and objective behavioral, emotional and cognitive parameters can allow a
“quantitative measurement” of symptoms, instead of a general description of them
based of the experiences reported by patients and clinicians’ judgment.
11
1.2.4 Disorders' overlaps
Depressive disorders are characterized by the overlap of several symptoms that
contribute to the misrecognition of them, and may give rise inappropriate treatments
and waste of money for the public healthcare. It is extensively demonstrated that BD
is often misdiagnosed with MDD (Bowden, 2001; Cuellar et al., 2005; Perlis, 2005).
Ghaemi et al. (1999) found that 40% of patients with BD had previously received an
incorrect diagnosis of MDD. In the study of Lish (1994) this percentage is around
33%. When BD patients experience the depressive episode, the diagnostic criteria for
depressive symptoms are the same as for MDD ones (see Box 1.1). In this case, the
two disorders are distinguished on the basis of history of manic or hypomanic
episodes. However, considering that often the first or two episodes are to be
depressive (Bowden, 2001), patients can initially be diagnosed as having the Major
Depressive Disorder, causing a misdiagnosis of BD.
Another frequent misrecognition is between MDD and Adjustment Disorder (AD)
symptoms, specifically, the subtype with Depressed Mood (see diagnostic criteria in
Box 1.3), also called in the past Reactive Depression (Winokur & Pitts Jr, 1964).
Reactive Depression is characterized by maladaptive behaviours and emotional
distress as response to punctual or long lasting stressful life events, like e.g. loss of
job, physical diseases, divorce, etc. These events engender depressive symptoms,
easily confuse with MDD ones (Carta et al., 2009; Casey & Bailey, 2011). In addition,
many Major Depressive Episodes are triggered by negative life events, which is a
specific criterion for the diagnosis of AD. This last criterion (i.e. the occurrence of
punctual or long lasting stressful life events) is the only one for the diagnosis of AD.
On the contrary to the other psychiatric disorders, they are not indicated the “number”
and the “duration” of symptoms necessary for the diagnosis. The absence of specific
criteria contributes to the misrecognition between MDD and AD. Both the DSM-5
and ICD-10 attempt to overcame the problem specifying that the AD can be
diagnosed only when symptoms do not completely meet the criteria for other
psychiatric disorders. Given this, at present, the diagnosis of AD is essentially
12
descriptive and no specific differences with respect to the symptoms of MDD and
AD are still reported.
The abovementioned evidences again suggest that current diagnostic criteria for
specific depressive states are rather general to be able to discriminate among the
depressive disorders, and more specific parameters of behaviour and cognitive
processes (e.g. differences in specific aspects of psychomotor retardation) should be
studied.
1.3 Towards specific behavioural measures of Depression: the
proposed research work
The report of The European Communities (Wahlbeck & Mäkinen, 2008) underlies
the importance of prevention programs and states: “the prevention of Depression and
suicides needs to be strengthened by good quality experimental studies. Due to the
complex nature of human mental health, multidisciplinary collaboration and
complementary approaches should be prioritised in searching for the best options to
improve mental health of Europeans. Systematic research is also needed on how to
bridge the gap between current knowledge and current practice in prevention of
Depression and suicide” (p.17). One of the main key for efficient prevention
programs is the early disorder detection, considering that the earlier illnesses are
diagnosed and more high it is the probability to obtain positive outcomes (Cuijpers
et al., 2005; Wahlbeck & Mäkinen, 2008). Nevertheless, as discussed in the previous
paragraphs, the current diagnostic process still has several weak points, essentially
ascribable to the patients and clinician factors, diagnostic criteria of classification
systems (DSM-5 and ICD-10), assessment methodologies, and characteristics of the
Depression that cause overlaps with other depressive states. Possible new approaches
to improve current classification methods should include increased specificity and
sensitivity of diagnostic criteria and objective and reliable recordings of symptoms.
Considering this, studies have focused on several aspects of verbal and nonverbal
behaviours (e.g. gestures, facial expressions, speech paralinguistic features;
13
(Marazziti et al., 2010) to find parameters connected to Depression. The exploitation
of these markers and the use of unbiased tools to detect them, allows a more valid
and reliable diagnosis. In addition, contrary to the current self-reports, most of these
methods are:
a) quick, generally few minutes are required to complete the task, e.g. recording of
reading tasks end spontaneous speech;
b) non-invasive, they don’t require to investigate particular aspect of life or events
that can be stressful to report by patients, e.g. analysis of paralinguistic features
independently from the speech content;
c) difficult to be manipulated by patients, considering that most of behaviours
measurements depend on reflex responses and are not completely under conscious
control (e.g. facial expressions and head movement during a clinical interview);
d) not require long, expensive and professional training for clinicians.
Hence, given the current requirement to detect mental disorders with objective, quick,
non-invasive and reliable procedures, the goals of the present study are:
1) to investigate verbal and nonverbal behaviour in depressed patients. More
specifically, prosodic features (like pauses, fillers, speaking and articulation rate, etc.)
and content speech analysis will be investigated, with the expectation that some of
these features can act as markers of depressive symptoms;
2) to propose an approach for the discrimination between depressed and non-
depressed subjects based on the automatic classification. More specifically, it will be
proposed the Support Vector Machine (SVM) classifier, a supervised learning model
based on learning algorithms that analyse the data and classify them in two (or more)
categories (in this case depressed and non-depressed) according to a training
examples.
The next three chapters of the present work will be focused on the analysis of speech
produced by depressed patients as compared with a control group. In Chapter 2,
paralinguistic features (such as pauses, phonation time and disfluencies) will be
analysed through a manual transcription of texts, features extraction and statistical
approach. In Chapter 3, verbal characteristics will be investigated through the LIWC
14
(Linguistic Inquiry Word Count; Tausczik & Pennebaker, 2010) - a tool to count the
words linked to some linguistic, emotional and cognitive dimensions - and a statistical
approach. Finally, in Chapter 4, the automatic classification using the SVM with a
set of paralinguistic features (such as energy, Mel Frequency Cepstral Coefficients,
etc.) will be presented. Differences between patients in acute and remission phase
will be also considered regarding the analysis of nonverbal (Chapter 2) and verbal
behaviour (Chapter 3). Finally, differences between subjects with and without Early
Maladaptive Schema (Young et al., 2003) regardless the depressive symptoms, will
be considered for both verbal features (in Chapter 3) and paralinguistic features,
analysed through automatic classification (in Chapter 4). For each chapter, after to
have investigated the main literature studies, corpus dataset, data analysis and results
of the present project will be presented and discussed.
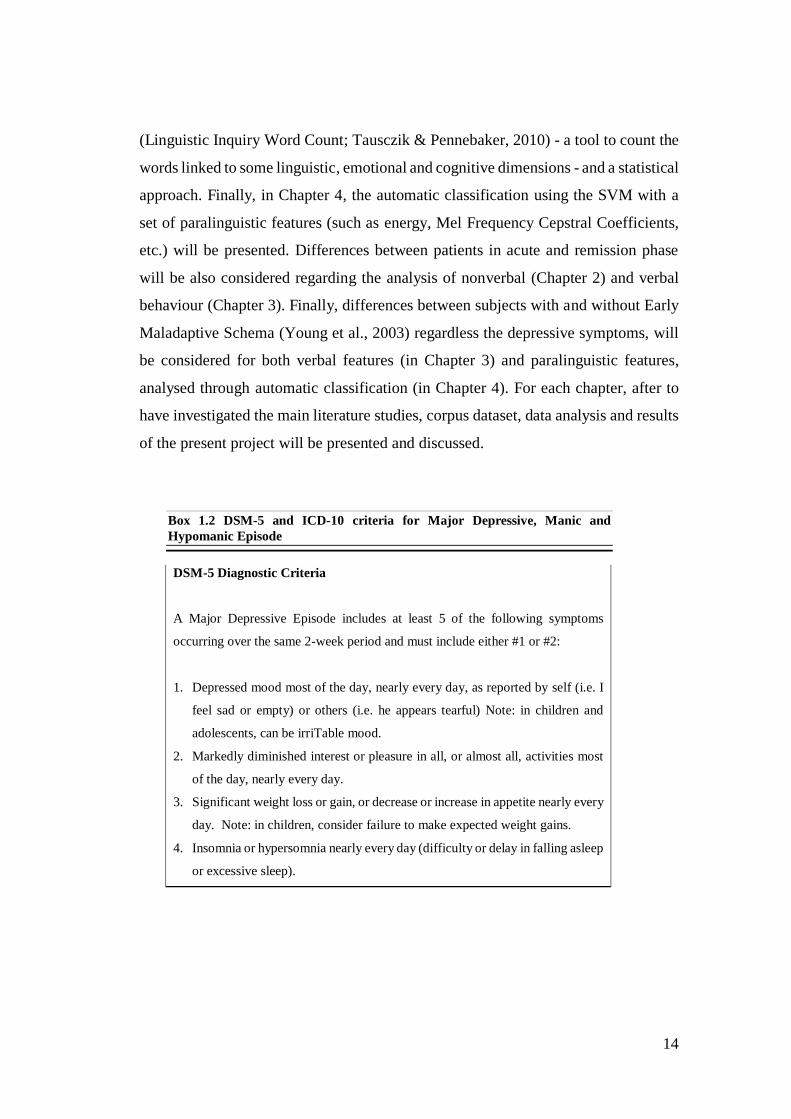
Box 1.2 DSM-5 and ICD-10 criteria for Major Depressive, Manic and
Hypomanic Episode
DSM-5 Diagnostic Criteria
A Major Depressive Episode includes at least 5 of the following symptoms
occurring over the same 2-week period and must include either #1 or #2:
1. Depressed mood most of the day, nearly every day, as reported by self (i.e. I
feel sad or empty) or others (i.e. he appears tearful) Note: in children and
adolescents, can be irriTable mood.
2. Markedly diminished interest or pleasure in all, or almost all, activities most
of the day, nearly every day.
3. Significant weight loss or gain, or decrease or increase in appetite nearly every
day. Note: in children, consider failure to make expected weight gains.
4. Insomnia or hypersomnia nearly every day (difficulty or delay in falling asleep
or excessive sleep).
15
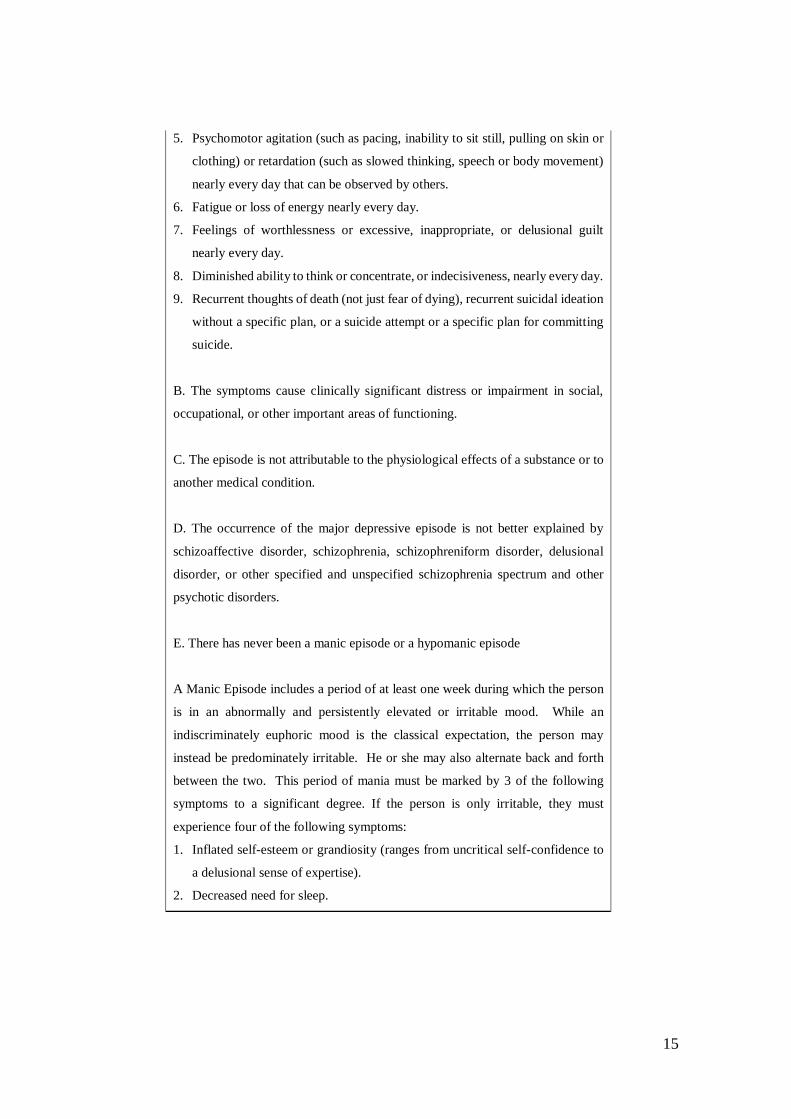
5. Psychomotor agitation (such as pacing, inability to sit still, pulling on skin or
clothing) or retardation (such as slowed thinking, speech or body movement)
nearly every day that can be observed by others.
6. Fatigue or loss of energy nearly every day.
7. Feelings of worthlessness or excessive, inappropriate, or delusional guilt
nearly every day.
8. Diminished ability to think or concentrate, or indecisiveness, nearly every day.
9. Recurrent thoughts of death (not just fear of dying), recurrent suicidal ideation
without a specific plan, or a suicide attempt or a specific plan for committing
suicide.
B. The symptoms cause clinically significant distress or impairment in social,
occupational, or other important areas of functioning.
C. The episode is not attributable to the physiological effects of a substance or to
another medical condition.
D. The occurrence of the major depressive episode is not better explained by
schizoaffective disorder, schizophrenia, schizophreniform disorder, delusional
disorder, or other specified and unspecified schizophrenia spectrum and other
psychotic disorders.
E. There has never been a manic episode or a hypomanic episode
A Manic Episode includes a period of at least one week during which the person
is in an abnormally and persistently elevated or irritable mood. While an
indiscriminately euphoric mood is the classical expectation, the person may
instead be predominately irritable. He or she may also alternate back and forth
between the two. This period of mania must be marked by 3 of the following
symptoms to a significant degree. If the person is only irritable, they must
experience four of the following symptoms:
1. Inflated self-esteem or grandiosity (ranges from uncritical self-confidence to
a delusional sense of expertise).
2. Decreased need for sleep.
16
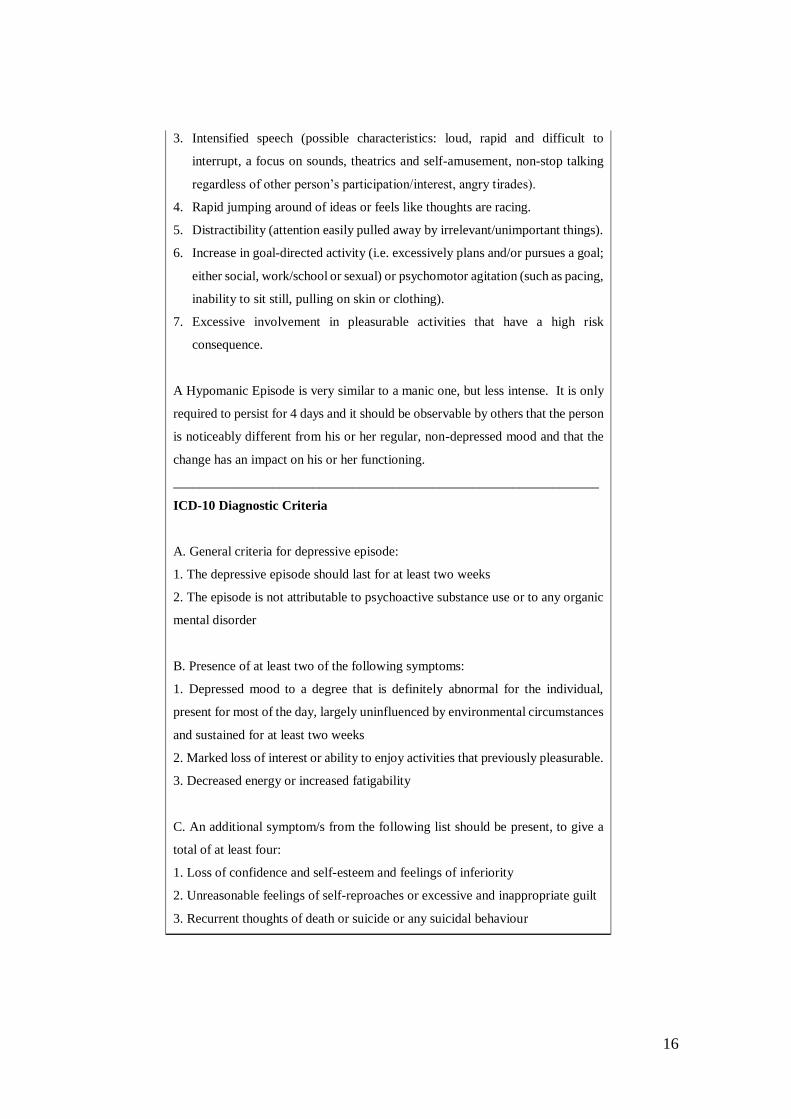
3. Intensified speech (possible characteristics: loud, rapid and difficult to
interrupt, a focus on sounds, theatrics and self-amusement, non-stop talking
regardless of other person’s participation/interest, angry tirades).
4. Rapid jumping around of ideas or feels like thoughts are racing.
5. Distractibility (attention easily pulled away by irrelevant/unimportant things).
6. Increase in goal-directed activity (i.e. excessively plans and/or pursues a goal;
either social, work/school or sexual) or psychomotor agitation (such as pacing,
inability to sit still, pulling on skin or clothing).
7. Excessive involvement in pleasurable activities that have a high risk
consequence.
A Hypomanic Episode is very similar to a manic one, but less intense. It is only
required to persist for 4 days and it should be observable by others that the person
is noticeably different from his or her regular, non-depressed mood and that the
change has an impact on his or her functioning.
________________________________________________________________
ICD-10 Diagnostic Criteria
A. General criteria for depressive episode:
1. The depressive episode should last for at least two weeks
2. The episode is not attributable to psychoactive substance use or to any organic
mental disorder
B. Presence of at least two of the following symptoms:
1. Depressed mood to a degree that is definitely abnormal for the individual,
present for most of the day, largely uninfluenced by environmental circumstances
and sustained for at least two weeks
2. Marked loss of interest or ability to enjoy activities that previously pleasurable.
3. Decreased energy or increased fatigability
C. An additional symptom/s from the following list should be present, to give a
total of at least four:
1. Loss of confidence and self-esteem and feelings of inferiority
2. Unreasonable feelings of self-reproaches or excessive and inappropriate guilt
3. Recurrent thoughts of death or suicide or any suicidal behaviour
17
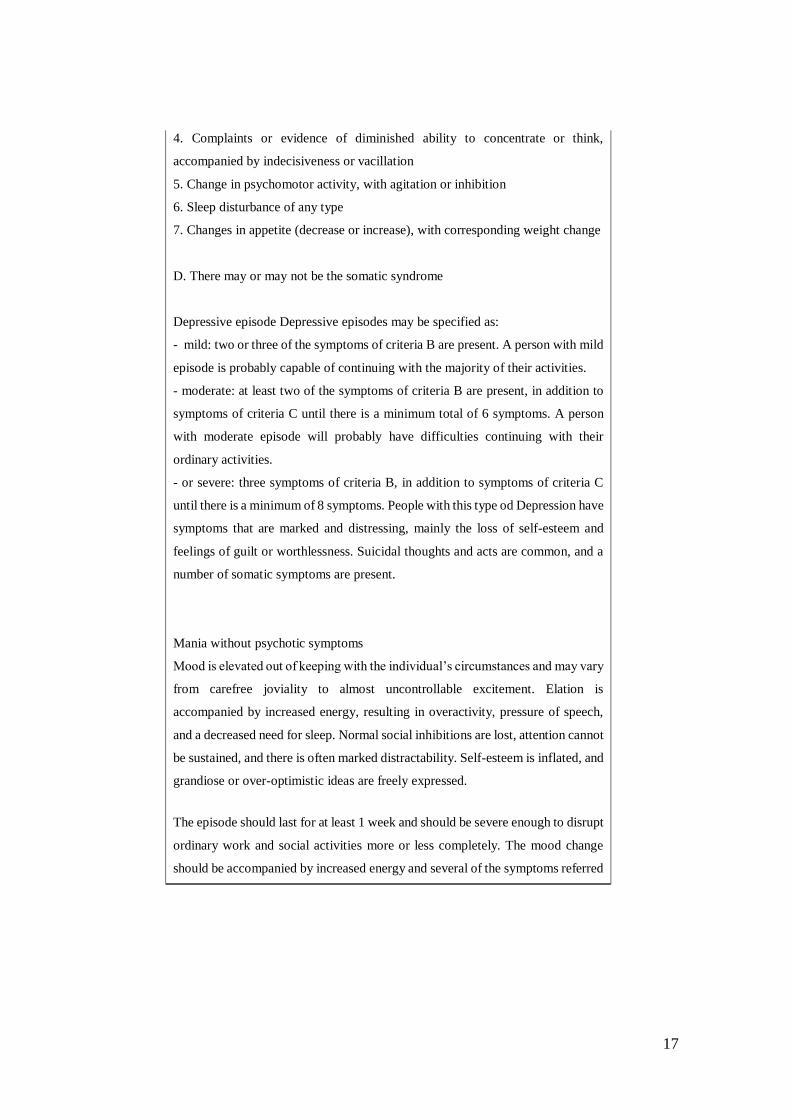
4. Complaints or evidence of diminished ability to concentrate or think,
accompanied by indecisiveness or vacillation
5. Change in psychomotor activity, with agitation or inhibition
6. Sleep disturbance of any type
7. Changes in appetite (decrease or increase), with corresponding weight change
D. There may or may not be the somatic syndrome
Depressive episode Depressive episodes may be specified as:
- mild: two or three of the symptoms of criteria B are present. A person with mild
episode is probably capable of continuing with the majority of their activities.
- moderate: at least two of the symptoms of criteria B are present, in addition to
symptoms of criteria C until there is a minimum total of 6 symptoms. A person
with moderate episode will probably have difficulties continuing with their
ordinary activities.
- or severe: three symptoms of criteria B, in addition to symptoms of criteria C
until there is a minimum of 8 symptoms. People with this type od Depression have
symptoms that are marked and distressing, mainly the loss of self-esteem and
feelings of guilt or worthlessness. Suicidal thoughts and acts are common, and a
number of somatic symptoms are present.
Mania without psychotic symptoms
Mood is elevated out of keeping with the individual’s circumstances and may vary
from carefree joviality to almost uncontrollable excitement. Elation is
accompanied by increased energy, resulting in overactivity, pressure of speech,
and a decreased need for sleep. Normal social inhibitions are lost, attention cannot
be sustained, and there is often marked distractability. Self-esteem is inflated, and
grandiose or over-optimistic ideas are freely expressed.
The episode should last for at least 1 week and should be severe enough to disrupt
ordinary work and social activities more or less completely. The mood change
should be accompanied by increased energy and several of the symptoms referred
18
to above (particularly pressure of speech, decreased need for sleep, grandiosity,
and excessive optimism).
Hypomania is a lesser degree of mania, in which abnormalities
of mood and behaviour are too persistent and marked to be included under
cyclothymia but are not accompanied by hallucinations or delusions. There
is a persistent mild elevation of mood (for at least several days on end),
increased energy and activity, and usually marked feelings of well-being
and both physical and mental efficiency. Increased sociability, talkativeness,
overfamiliarity, increased sexual energy, and a decreased need for sleep
are often present but not to the extent that they lead to severe disruption
of work or result in social rejection. Irritability, conceit, and boorish
behaviour may take the place of the more usual euphoric sociability.
Concentration and attention may be impaired, thus diminishing the ability to settle
down to work or to relaxation and leisure, but this may not prevent the appearance
of interests in quite new ventures and activities, or mild over-spending.
Several of the features mentioned above, consistent with elevated or changed
mood and increased activity, should be present for at least several days on end, to
a degree and with a persistence greater than described for cyclothymia.
Box 1.3 Adjustment disorder
DSM-5 Diagnostic Criteria
A. The development of emotional or behavioral symptoms in response to an
identifiable stressor(s) occurring within 3 months of the onset of the stressor(s).
B. These symptoms or behaviors are clinically significant, as evidenced by one
or both of the following:
1. Marked distress that is out of proportion to the severity or intensity of the
stressor, taking into account the external context and the cultural factors that
might influence symptom severity and presentation.
2. Significant impairment in social, occupational, or other important areas of
functioning.

19
C. The stress-related disturbance does not meet the criteria for another mental
disorder and is not merely an exacerbation of a pre-existing mental disorder.
D. The symptoms do not represent normal bereavement.
E. Once the stressor or its consequences have terminated, the symptoms do not
persist for more than an additional 6 months.
Specify whether:
Acute, Persistent (Chronic)
Specify whether:
With depressed mood: Low mood, tearfulness, or feelings of hopelessness
are predominant.
Nervousness, worry, jitteriness, or separation anxiety is predominant.
With mixed anxiety and depressed mood: A combination of Depression and
anxiety is predominant.
With disturbance of conduct: Disturbance of conducti s predominant. 309.4
F43.25 With mixed disturbance or emotions and conduct: Both emotional
symptoms (e.g., Depression and anxiety) and a disturbance of conduct are
predominant.
ICD 10 Diagnostic Criteria
States of subjective distress and emotional disturbance, usually interfering with
social functioning and performance, arising in the period of adaptation to a
significant life change or a stressful life event. The stressor may have affected the
integrity of an individual's social network (bereavement, separation experiences)
or the wider system of social supports and values (migration, refugee status), or
represented a major developmental transition or crisis (going to school, becoming
a parent, failure to attain a cherished personal goal, retirement). Individual
predisposition or vulnerability plays an important role in the risk of occurrence
and the shaping of the manifestations of adjustment disorders, but it is
nevertheless assumed that the condition would not have arisen without the
stressor. The manifestations vary and include depressed mood, anxiety or worry
(or mixture of these), a feeling of inability to cope, plan ahead, or continue in the
20
present situation, as well as some degree of disability in 9 the performance of
daily routine. Conduct disorders may be an associated feature, particularly in
adolescents. The predominant feature may be a brief or prolonged depressive
reaction, or a disturbance of other emotions and conduct.
21
2 Prosodic features as markers of Depression
2.1 Introduction
For many years, clinicians have observed that mental disorders cause changes in
voice and speech patterns. Kraepelin (1921) reported that depressed patients speak
slowly, monotonously, whispering and become silent in the middle of a sentence.
Schafer (1949) described their speech as being monosyllabic, while Beck (1967)
reported that the depressed speech is characterized by pauses, hesitations, brevity and
breaking off. Robinson & Lewinsohn (1973) described the speech of a chronically
depressed woman as to be halting, monotonous, tending to interrupt without
prodding. At the same way, Darby et al. (1984) referred to speech of depressed as
characterized by reduced stress, monopitch and monoloudness. These clinical
observations have increased, during the years, the interest in the research field about
the possibility of using objective speech measures that could reflect the depressive
states. Since the 60s, a large part of these studies has focused on nonverbal (or
paralinguistic) components of speech (e.g. pitch, speaking rate, articulation time,
pauses). Considering that nonverbal components are automatically generated with a
low awareness level, and independently from the content of the speech (words), they
can mirror genuine measures of physical, emotional and cognitive changes in
depressive states. Most of these studies have focused especially on prosodic features,
such as duration and number of pauses, phonation time, fundamental frequency (F0).
This last one is a parameter that measures the frequency at which the vocal fold
vibrate. In the next paragraphs, a review of the literature results about the
investigation of paralinguistic features in depressed subjects and the data and results
of the present research project will be presented.
22
2.2 Literature results
The prosodic features in depressed speech have been investigated through two
approaches: cross-sectional studies, that compare depressed and healthy control
subjects, and longitudinal studies, in which the subject’s speech is analysed before,
during and after treatments (see below). The involved tasks have utilized either
automatic, or semi-automatic (counting and reading), and spontaneous speech
(structured and semi-structured interviews). Many studies have found that prosodic
(or supra-segmental) features, such as pauses, speaking rate, energy and F0, are
sensitive markers of changes in mood. Szabadi et al. (1976), using a counting task
with 4 female patients and 4 healthy subjects, reported that speech pause time (SPT),
but not phonation time (PT), decreases from pre-treatment to post-treatment phase,
according to the decrease of psychomotor retardation, measured with the Hamilton
Rating Scale for Depression (HRSD: Hamilton, 1960). Also Greden et al. (1980;
1981) using the same task with 4 unipolar and 3 bipolar depressed, reported long SPT
(without changes in PT) during pre-treatment phase. Same results with automatic
speech (counting task) have been simulated by Godfrey & Knight (1984) and Hardy
et al. (1984). Hoffmann et al. (1985) tested 22 unipolar and bipolar depressed patients
and 15 controls with three automatic tasks (counting, reading numbers, reading
alphabet). Their results showed that SPT are longer in the speech of unipolar than
bipolar patients and control subjects and such parameter is correlated with
psychomotor retardation and reaction time.
Energy and F0 have been investigated in depressed speech as well. Leff & Abberton,
(1981), using spontaneous and reading tasks with 4 severe depressed patients, found
higher kurtosis of second-order fundamental frequency (F0) than control subjects,
that could determine the perception of voice as to be monotonous. Tolkmitt et al.
(1982) investigated speech changes during a psychiatric interview before and after
therapy in 17 depressed patients. They found a decrease in F0 after therapy; a
decrease of spectral energy between 500 and 1000 Hz and an increment of it under
500 Hz. According to these results, the authors stated that during the acute phase of
23
Depression, the anxiety causes high muscular tension, while the therapeutic
improvement may led to a reduction of anxiety and, consequently, a general decrease
in muscle tone. Nilsonne (1987) recruited a sample of 16 depressed patients tested
with reading task administered during pre-treatment and clinical improvement phase.
The author found a decrease in SPT and number of pauses (NOP), without changes
in PT, although did not find any correlations between them and psychomotor
retardation. In addition, changes of different F0 descriptors during pre and post
treatment phases have been tested: no differences have been found in the mean F0;
while differences were reported for the standard deviation of F0, the standard
deviation of rate of change of F0, the average speed of F0 change. These measures
reflect little pitch variations during the pre-treatment phase, and the corresponding
speech is perceived as a monotonous and lifeless speech. Finally, the author found
some correlations between the above reported measures of F0 and psychomotor
retardation. Using a reading task with 21 depressed participants, Vicsi et al. (2013)
reported that the length of pauses (SPT) and the range of F0 intensity show significant
changes in depressed compared to healthy subjects.
Overall, most of the above-mentioned studies did not find significant changes for
the phonation time (PT) and found correlations between pause time (SPT) and
psychomotor retardation. For these reasons, the changes in speech rate (SR) can
directly be linked to pause variations and not to slow speaking rate. Given this, the
first explanation hypothesis is that SPT reflects a psychomotor retardation due to a
generalized impairment of the motor system (Ellgring & Scherer, 1996). In this case,
considering that brain mechanisms are involved, they are the biological components
to have a central role in the speech changes. For instance, some evidences show in
MDD a reduced blood flow in the prefrontal cortex involved in motor activities
(Mayberg, 2003). However, Ellgring and Scherer (1996) argued that, if there is a
general motor impairment, also changes of PT, and not only of SPT, should be
observed. In addition, the authors underlie that counting and reading task are different
from spontaneous speech, considering that they do not require an involvement of
complex cognitive planning processes. Hence, results could be different using a more
24
ecologic task. The authors conducted a study on 16 depressed hospitalized patients
using a standardized interview (Ellgring & Scherer, 1996). They found that the
speech rate (SR) increases from depressive to recovered state, because of the decrease
of pause duration (SPT) and the number of pauses (NOP). Nevertheless, even though
the authors have replicated the results of previous works, they did not conclude that
the psychomotor retardation hypothesis is a good explanation. In fact, they found a
correlation between subjective well-being - measured with Visual Analogue Scale
(VAS: Gift, 1989) - SR and SPT. In addition, for female depressed participants,
decreases for F0 minimum and F0 range from acute to remission phase have been
reported. Hence, the authors’ conclusion is that the speech in Depression could be
affected by emotional states that engender changes in muscle tension, which in turn
causes F0 variations. This conclusion agrees with the social-emotional hypothesis
(Scherer K.S., 1986), according to which the dominant emotional state affect all
aspects of human functioning, included the speech production. For example, in the
case of Depression, sadness may cause slow speech rate and long pauses, while
anxiety may increase them. This means that different speech changes are possible for
the same subject - according to the dominant emotion or emotions active during the
measurements - or for subjects affected by different kind of Depression.
Other studies, that have involved spontaneous speech, obtained results similar to
those previously described that have used automatic tasks. Bouhuys & van der
Meulen (1984) tried to find relationships between psychomotor retardation
(measured with HDRS: Hamilton, 1960) and speech timing parameters in 28
depressed patients using a psychiatric interview conducted before and during
treatments. They found positive correlations between psychomotor retardation and
SPT and switching pauses, and negative correlations between psychomotor
retardation and frequency of vocalization and switching pause. Conversely, they did
not find any relation between agitation and the above-mentioned features. According
to these results, the decrease of psychomotor retardation is associated with a decrease
in the pause duration (SPT) and an increase in the degree to which patients take the
floor and start talking.
25
Breznitz (1992) interviewed a sample of 11 depressed woman, matched with controls,
who had to speak about contents with different emotional valence (happy, neutral,
angry, sad). The author found significantly longer pauses (SPT) in depressed speech
than control one, although there were no differences in the number of pauses (NOP).
However, contrary to the previous studies, differences for the vocalization (PT) of
depressed women, shorter in duration with respect to those of controls, have been
found. In addition, according to social-emotional hypothesis, healthy women spoke
more expressively than depressed ones, resulting in a wider F0 range and higher F0
average, reflecting the change of mood content in their speech. For example, the
author found that depressed women speak without much modulation, whereas healthy
women expressed their anger freely.
Cannizzaro et al. (2004) investigated speaking rate (calculated as number of syllables
divided by the length of records) and percent pause time in 7 depressed subjects using
the interview assessment for HDRS (Hamilton, 1960). They found a negative
correlation between HDRS and speaking rate, but not with percent pause time and
pitch variation. Trevino et al. (2011) analysed speech parameters involving 35
speakers with Depression tested before and after treatment. They found correlations
between different scores of HDRS categories (like mood, guilt, suicide) and number
(NOP) and time (SPT) of pauses. The strongest correlation was between psychomotor
retardation and pause length. With the same method, Mundt et al. (2012) tested 105
depressed patients employing 4 tasks (free speech, counting, reading the alphabet and
reading the Grandfather passage). They found correlations between the QIDS-C total
scores (Quick Inventory of Depressive Symptomatology: Rush et al., 2003) and
several timing parameters (total pause time, pause variability, percent pause time,
speech rate, speech/pause radio) in the reading task. In the free speech, pause
variability and percent pause time correlated with QIDS-C. No correlations have been
found with the variance of pitch. Differently, Quatieri & Malyska (2012) using a sub-
group of Mundt’s study (35 depressed subjects), analysed pitch (variance and average
velocity) and energy (variance and average velocity), finding positive correlations
between such speech features and the two Depression assessments (QIDS-C and
26
HRDS). Finally, Liu et al. (2017) investigated phonation and pause time (PT and
SPT) in four different tasks (interview, passage reading, word reading and picture
description) involving 92 depressed patients. They found that the two timing features
(PT and SPT) are significantly longer in the speech of depressed than controls only
in the interview task, suggesting that these features are a good marker of Depression
only in spontaneous speech.
All the above-mentioned studies have focused essentially on the empty pauses, i.e.
silent speech intervals between two words or sentences. Such pauses have two
different functions (Boomer, 1965): some of them are demarcative and appear at the
junction of speech segments, others are hesitation and reflect the speakers’ difficulty
in searching and encoding mental operations (Barik, 1968). Maclay & Osgood (1959)
have been the first ones to distinguish another category of pause, the fillers, that seems
to have only the hesitation function: the speaker tries to build the next part of the
speech and, at the same time, to keep the turn (Clark H.H. et al., 2002). The same
hesitation function seems to have also some kinds of consonant/vowel lengthening
(Guaïtella, 1993) occurring in the middle or at the end of the words. Esposito et al.
(2016) investigated all three pauses categories (empty, fillers and lengthening) in a
sample of 12 depressed subjects, compared with 12 controls, using both reading and
spontaneous speech. The authors found that only the empty pauses in spontaneous
speech are significantly longer in depressed than healthy subjects. In addition, they
found the phonation time (PT) is shorter in duration and clauses are less frequent in
depressed sample. The authors agreed with the cognitive hypothesis (Scherer, 1996),
according to which the increase in number and duration of pauses is due to attentional
and planning processes deficits antecedent to speech behaviour. Filled pauses have
been investigated also by Lott et al. (2002), through an interview task, involving a
group of 23 patients with MDD compared with bipolar and schizophrenic patients.
They did not find significant differences among the clinical groups.
Overall, the literature research work seems to suggest that among the prosodic speech
parameters, a good marker of Depression can be considered the fundamental
27
frequency (F0). Several studies reported an increase in F0 and a decrease in range
and variability during the acute phase of Depression (due an increase of muscular
tension), while F0 range and variability tend to increase in remission phase. Such
variations in acute phase are perceived as a monotonous and faded voice, with low
emphasis. These results seem to support the psychomotor retardation hypothesis,
even though some authors agree with the social-emotional theory (for a discussion
see Ellgring & Scherer 1996), according to which emotional disturbances are
accompanied by physiological changes, among of which, those in the voice.
According to the literature results, the silent pause can be considered another good
indicator of Depression: it tends to be longer (SPT) and more frequent (NOP) in acute
depressed patients. Most of the authors (e.g. Szabadi 1996; Hoffman et al., 1985;
Bouhuys & Van Der Meulen 1984; Trevino et al., 2011; Quatiery & Maliska 2012)
relate this effect to a general psychomotor retardation, a symptom extensively
reported in depressive disorders (Bennabi et al., 2013).
In line with the previous studies, in the present research project, prosodic speech
parameters will be investigated in a sample of depressed patients, matched with
controls for different socio-demographic variables (gender, age, educational level,
employment, marital status). The speech characteristics will be analysed in two kind
of tasks: automatic (reading) and spontaneous speech. Silent pauses, phonation time
and other parameters less studied in previous research works (clauses, filled pause,
lengthening, false starts) will be analysed. In addition, differently from previous
studies, possible effects due to the interaction between depressive symptoms and
educational level will also be taken into account. Finally, two groups of patients - in
acute (with moderate-severe depressive symptoms) and remission (with absence or
mild depressive symptoms) phases - will be compared with respect to their speech
characteristics.
28
2.3 The present research project
The aim of the present study is to investigate speech prosody in patients affected by
Depression, analysing several parameters manually extracted from two kind of
speech tasks: reading and spontaneous speech. The speech characteristics of
depressed patients have been compared with those of healthy subjects matched with
the clinical group for several socio-demographic characteristics (gender, age,
educational level, employment and marital status). The educational level (never
studied as regards the speech changes in depressed subjects) has been considered in
the present analysis. More specifically, the interaction between educational level and
severity of depressive symptoms has been taken in consideration as possible effects
on speech features measurements. Differences between patients in acute and
remission phase will be investigated as well. In the next paragraphs participants, data
collection, statistical analyses and results will be described.
2.3.1 Participants
One group of clinical patients (Pt) and one group of healthy subjects (Hc) took part
in this study. The clinical group was composed by 72 patients recruited at different
Clinical Health Centers2 of Campania Region (Italy). Three patients have been
excluded because two of them were affected by psychotic Depression and one by
Dissociative Disorder. Seven patients were excluded because their recorded speech
was too loud. The final group was composed by 62 patients (41 females; age range
=19-68; average age=47.77; Sd=±11.57): 32 with Major Depressive Disorder
(MDD), 15 with Bipolar Disorder (BD), 8 with Adjustment Disorder with Depressed
Mood (AD), 7 with endo-reactive Depression (ENDO-R). All patients received the
2 Patients have been recruited at the following Clinical Health Centers: Department of Public Mental
Health of Atripalda (Avellino), Department of Public Mental Health of Santa Maria Capua Vetere
(Caserta), Department of Public Mental Health Scafati-Angri (Salerno), Casa di Cura Villa Camaldoli
(Napoli).
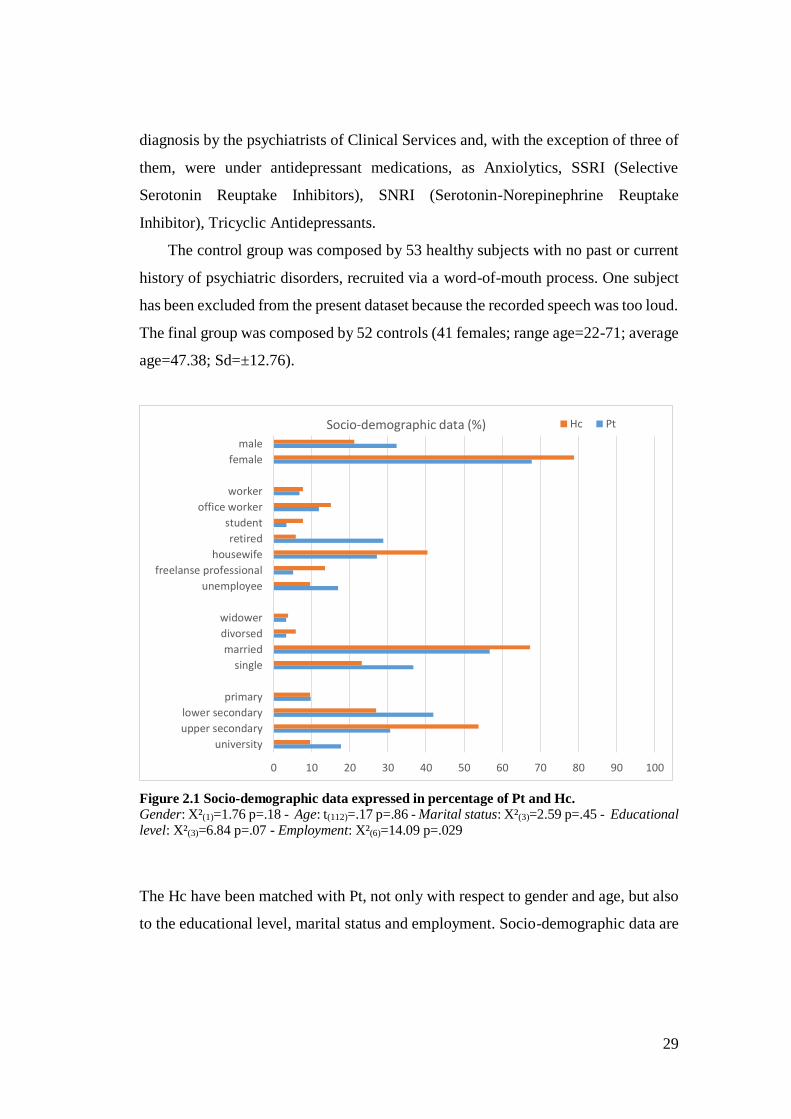
29
diagnosis by the psychiatrists of Clinical Services and, with the exception of three of
them, were under antidepressant medications, as Anxiolytics, SSRI (Selective
Serotonin Reuptake Inhibitors), SNRI (Serotonin-Norepinephrine Reuptake
Inhibitor), Tricyclic Antidepressants.
The control group was composed by 53 healthy subjects with no past or current
history of psychiatric disorders, recruited via a word-of-mouth process. One subject
has been excluded from the present dataset because the recorded speech was too loud.
The final group was composed by 52 controls (41 females; range age=22-71; average
age=47.38; Sd=±12.76).
Figure 2.1 Socio-demographic data expressed in percentage of Pt and Hc. Gender: X²(1)=1.76 p=.18 - Age: t(112)=.17 p=.86 - Marital status: X²(3)=2.59 p=.45 - Educational level: X²(3)=6.84 p=.07 - Employment: X²(6)=14.09 p=.029
The Hc have been matched with Pt, not only with respect to gender and age, but also
to the educational level, marital status and employment. Socio-demographic data are
0 10 20 30 40 50 60 70 80 90 100
university
upper secondary
lower secondary
primary
single
married
divorsed
widower
unemployee
freelanse professional
housewife
retired
student
office worker
worker
female
male
Socio-demographic data (%) Hc Pt
30
reported in Figure 2.1. The two groups do not significantly differ for all socio-
demographic data, with the exception of employment variable (p=.03) due to the
frequency of retirements, that is around 29% for Pt and 6% for Hc (p=.002). The
reason of such difference is that some patients retired because of disabilities
engendered by their mental disorder. There are no differences for the frequencies
distribution of the other employment classes (p>.05).
2.3.2 Experimental set-up
The experimental set-up is composed by three self-report inventories (BDI-II, DASS-
21, YSQ-s3-36) and two speech tasks (spontaneous and reading speech) administered
both to the Pt and Hc group:
The Italian version of the BDI-II (Beck Depression Inventory Second Edition:
Beck et al., 1996; Sica et al., 2007) is used to assess the current Depression level.
It rates the Depression degree from normal to severe, considering several
cognitive, emotional, physical and behavioural symptoms. Subjects are asked to
select the sentence that best describes their psychological and physical state
during the past two weeks before taking the test. For each sentence, the answer
scores range from 0 to 3. Filling out the BDI-II does not require more than 10-12
min.
Given that Depression co-occur frequently with Anxiety, it has been decided to
administer also the Italian version of DASS-21 (Depression, Anxiety and Stress
Scale Short Version: Lovibond & Lovibond, 1995; Severino & Haynes, 2010), a
self-report questionnaire providing a good discrimination between the main
symptoms of Depression and Anxiety (Bottesi et al., 2015). The questionnaire is
composed by three subscales (each of which composed by 7 statements)
concerning Depression, Anxiety and Stress symptoms. Subjects are asked to
match how much each statement apply to their psychological and physical state
over the past week, using a 4-point Likert scale, ranging from 0 (Did not apply to
31
me at all) to 3 (Apply to me very much, or most of the time). Filling out the
DASS-21 does not require more than 10-12 min.
Given that a goal of the present study is to consider not only the core symptoms
typically measured by the most used self-reports and described in the current
diagnostic systems (DSM-5 and ICD-10), but also the typical dysfunctional
thoughts of depressive disorders (such as abandonment, undeveloped self,
pessimism, etc.) the Italian version of YSQ-s3 (Young Schema Questionnaire-
short form 3: Baldetti et al., 2015; Young et al., 2003) has been administered.
The questionnaire is based on the concept of Early Maladaptive Schema (EMS)
theorized by Young: “EMS is a broad, pervasive theme or pattern, comprised of
memories, emotions, cognitions, and bodily sensations, regarding oneself and
one’s relationships with others, developed during childhood or adolescence,
elaborated throughout one’s lifetime and dysfunctional to a significant degree”
(Young et al., 2003, p. 7).
The original version of the YSQ-short form is composed by 90 items that
measure 18 Early Maladaptive Schema, while the Italian version used for the
present study is composed by 36 items measuring 12 Schema3 (described in
Chapter 3). For each statement, subjects are asked to select the option that best
describes their condition occurred in the last year. Each item is rated using a 6-
point Likert scale (1= completely untrue for me, 2= mostly untrue for me, 3=
slightly more true than untrue, 4= moderately true for me, 5= mostly true for me,
6= describes me perfectly). To avoid confusion between the two versions of the
questionnaire, in the present study the Italian version will be indicated as YSQ-
s3-36. Filling out the YSQ-s3-36 does not require more than 15-20 min. The
YSQ questionnaire will be analysed in Chapter 3 regarding the linguistic analysis
of speech based on words counts and in Chapter 4 regarding the automatic
3 The other 5 schemas (abuse, dependence, vulnerability to harm, grandiosity and subjugation) have
not been confirmed on the Italian population (Baldetti et al. 2015).
32
discrimination of subjects with and without EMS based on paralinguistic
features.
The speech tests were composed by a spontaneous (it was called Diary) and a
reading (it was called Tale) speech task. For the Diary, subjects had to report
weekly activities, hobbies, family, work description, etc. The experimenter asks
some questions to encourage the dialogue. The length of conversation range
between 4-5 minutes for each subject. The reading passage is a standard
phonetically balanced short folk Tale (The North Wind and the Sun, by Esopo)
frequently used in the phoniatric practise.
The speech samples were recorded with clip-on microphones (Audio-Technica
ATR3350), with external USB sound card, at a sampling rate of 16 kHz, with
every sample represented with 16 bits. The speech test require no more than 15
min.
2.3.3 Procedure
The data were collected in non-controlled settings where the level of environmental
noise is significant and it was not possible to respect a rigorous experimental protocol.
In this respect, the collection has been performed in the wild and the data can be
considered challenging not only for the inherent difficulties of the task, but also
because the data has been collected in the wild. The experimenter administered the
tests, after informing participants of the aims of the study, requesting them to sign the
consent form, and giving instructions to each of them. To avoid that the last test (or
two tests) was influenced by a possible decrease in motivation, or increase of
tiredness, the tests have been randomly administered. No time limit was given to
complete the experiment. For the speech tasks, the subjects were asked to sit in front
of a PC and provided with headphones. They first completed the Diary and then the
Tale task. To preserve the anonymity of participants, each of them was labelled with
a string identifying the belonging group (Patient or Healthy Control), gender, age, the
clinical Centre (where the patient was recruited or WOM [word-of-mouth] for the
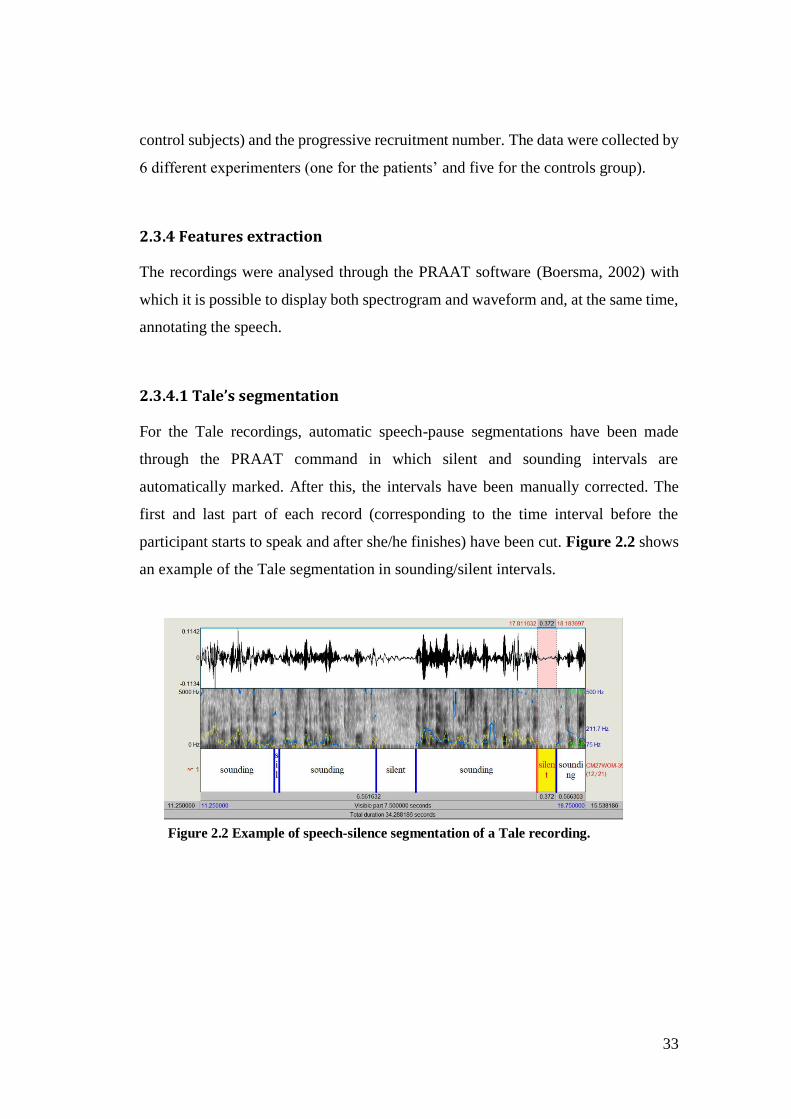
33
control subjects) and the progressive recruitment number. The data were collected by
6 different experimenters (one for the patients’ and five for the controls group).
2.3.4 Features extraction
The recordings were analysed through the PRAAT software (Boersma, 2002) with
which it is possible to display both spectrogram and waveform and, at the same time,
annotating the speech.
2.3.4.1 Tale’s segmentation
For the Tale recordings, automatic speech-pause segmentations have been made
through the PRAAT command in which silent and sounding intervals are
automatically marked. After this, the intervals have been manually corrected. The
first and last part of each record (corresponding to the time interval before the
participant starts to speak and after she/he finishes) have been cut. Figure 2.2 shows
an example of the Tale segmentation in sounding/silent intervals.
Figure 2.2 Example of speech-silence segmentation of a Tale recording.
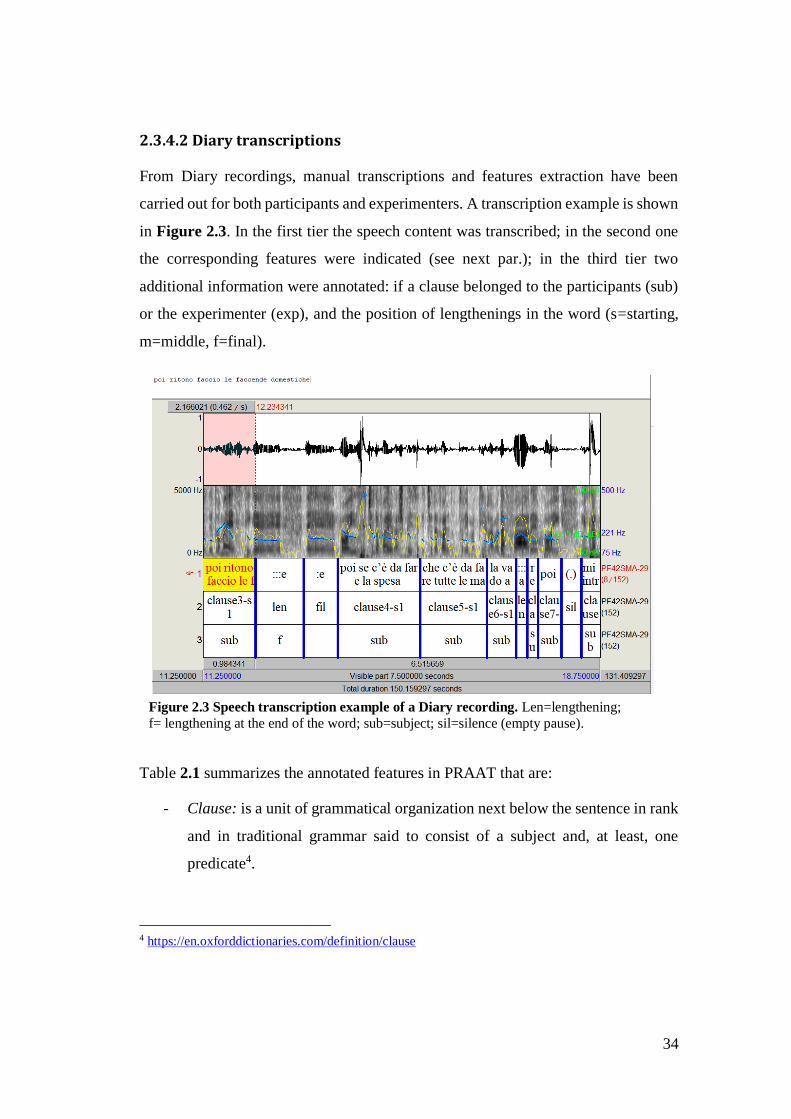
34
2.3.4.2 Diary transcriptions
From Diary recordings, manual transcriptions and features extraction have been
carried out for both participants and experimenters. A transcription example is shown
in Figure 2.3. In the first tier the speech content was transcribed; in the second one
the corresponding features were indicated (see next par.); in the third tier two
additional information were annotated: if a clause belonged to the participants (sub)
or the experimenter (exp), and the position of lengthenings in the word (s=starting,
m=middle, f=final).
Figure 2.3 Speech transcription example of a Diary recording. Len=lengthening;
f= lengthening at the end of the word; sub=subject; sil=silence (empty pause).
Table 2.1 summarizes the annotated features in PRAAT that are:
- Clause: is a unit of grammatical organization next below the sentence in rank
and in traditional grammar said to consist of a subject and, at least, one
predicate4.
4 https://en.oxforddictionaries.com/definition/clause
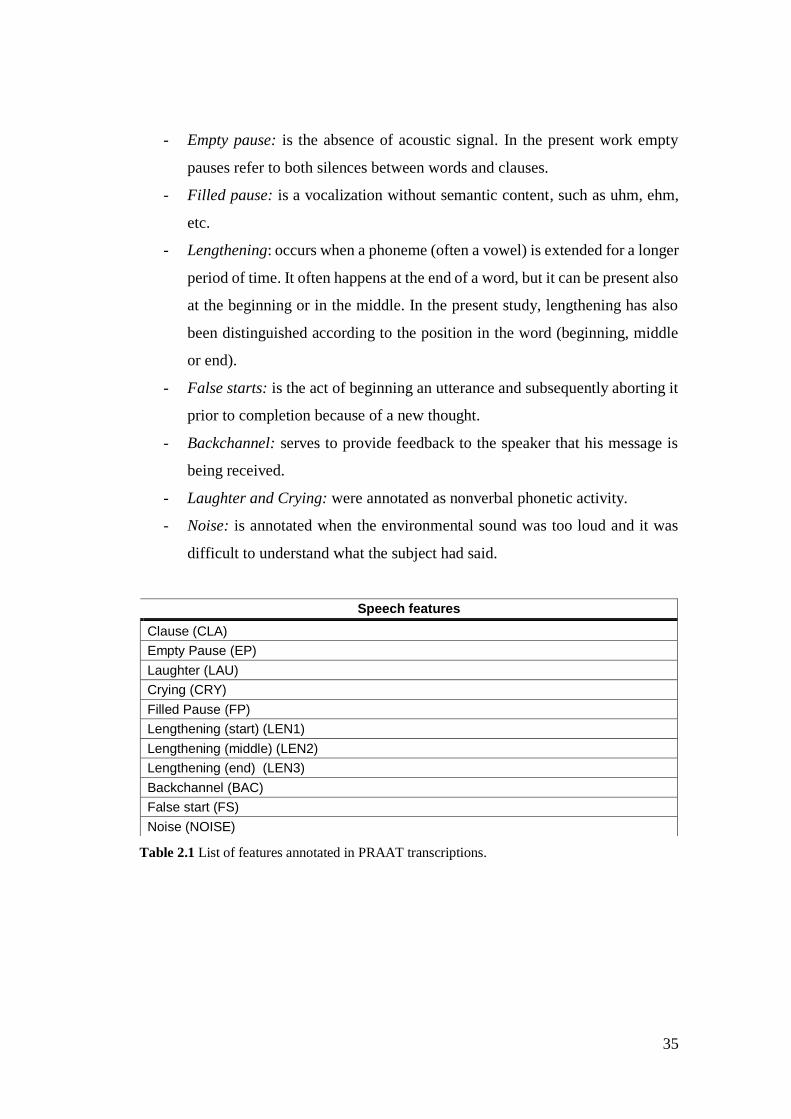
35
- Empty pause: is the absence of acoustic signal. In the present work empty
pauses refer to both silences between words and clauses.
- Filled pause: is a vocalization without semantic content, such as uhm, ehm,
etc.
- Lengthening: occurs when a phoneme (often a vowel) is extended for a longer
period of time. It often happens at the end of a word, but it can be present also
at the beginning or in the middle. In the present study, lengthening has also
been distinguished according to the position in the word (beginning, middle
or end).
- False starts: is the act of beginning an utterance and subsequently aborting it
prior to completion because of a new thought.
- Backchannel: serves to provide feedback to the speaker that his message is
being received.
- Laughter and Crying: were annotated as nonverbal phonetic activity.
- Noise: is annotated when the environmental sound was too loud and it was
difficult to understand what the subject had said.
Table 2.1 List of features annotated in PRAAT transcriptions.
Speech features
Clause (CLA)
Empty Pause (EP)
Laughter (LAU)
Crying (CRY)
Filled Pause (FP)
Lengthening (start) (LEN1)
Lengthening (middle) (LEN2)
Lengthening (end) (LEN3)
Backchannel (BAC)
False start (FS)
Noise (NOISE)
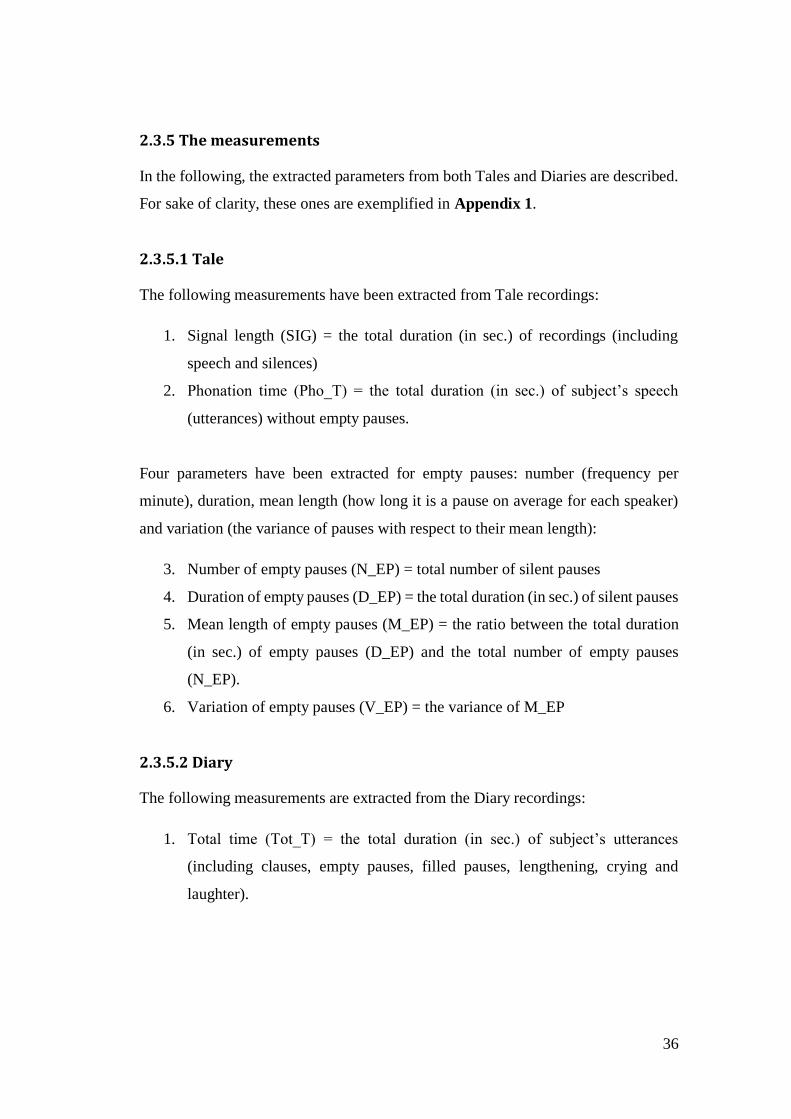
36
2.3.5 The measurements
In the following, the extracted parameters from both Tales and Diaries are described.
For sake of clarity, these ones are exemplified in Appendix 1.
2.3.5.1 Tale
The following measurements have been extracted from Tale recordings:
1. Signal length (SIG) = the total duration (in sec.) of recordings (including
speech and silences)
2. Phonation time (Pho_T) = the total duration (in sec.) of subject’s speech
(utterances) without empty pauses.
Four parameters have been extracted for empty pauses: number (frequency per
minute), duration, mean length (how long it is a pause on average for each speaker)
and variation (the variance of pauses with respect to their mean length):
3. Number of empty pauses (N_EP) = total number of silent pauses
4. Duration of empty pauses (D_EP) = the total duration (in sec.) of silent pauses
5. Mean length of empty pauses (M_EP) = the ratio between the total duration
(in sec.) of empty pauses (D_EP) and the total number of empty pauses
(N_EP).
6. Variation of empty pauses (V_EP) = the variance of M_EP
2.3.5.2 Diary
The following measurements are extracted from the Diary recordings:
1. Total time (Tot_T) = the total duration (in sec.) of subject’s utterances
(including clauses, empty pauses, filled pauses, lengthening, crying and
laughter).
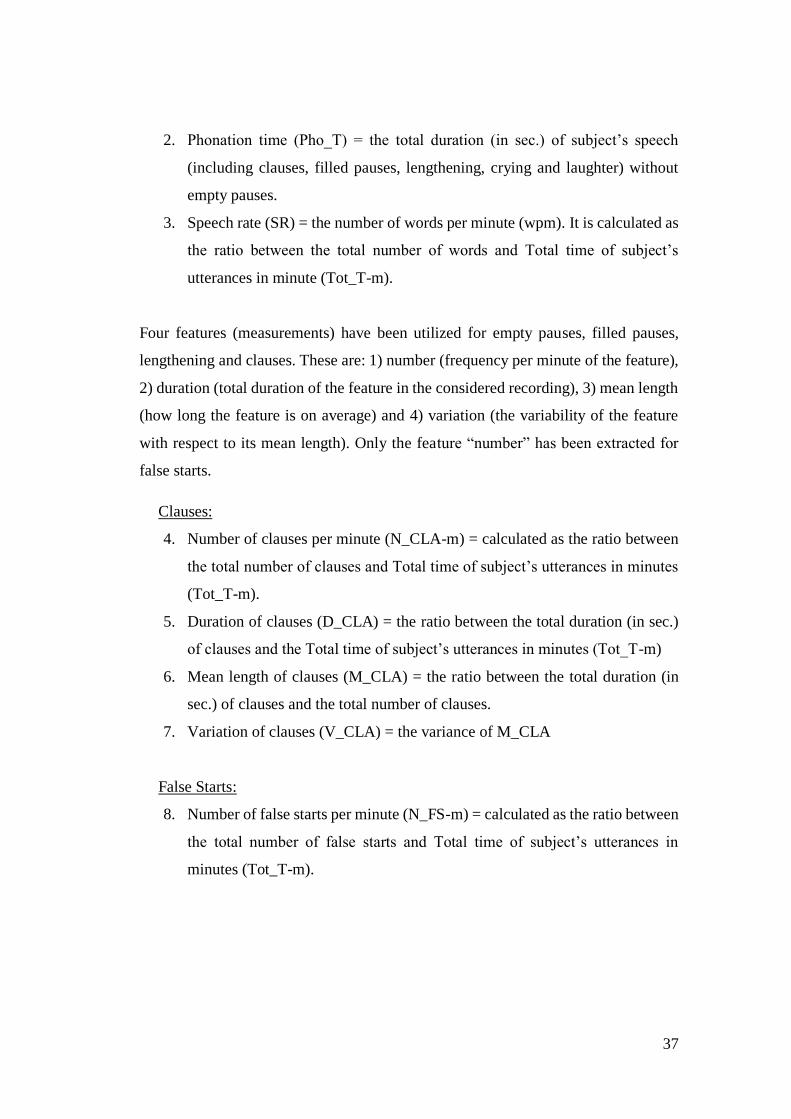
37
2. Phonation time (Pho_T) = the total duration (in sec.) of subject’s speech
(including clauses, filled pauses, lengthening, crying and laughter) without
empty pauses.
3. Speech rate (SR) = the number of words per minute (wpm). It is calculated as
the ratio between the total number of words and Total time of subject’s
utterances in minute (Tot_T-m).
Four features (measurements) have been utilized for empty pauses, filled pauses,
lengthening and clauses. These are: 1) number (frequency per minute of the feature),
2) duration (total duration of the feature in the considered recording), 3) mean length
(how long the feature is on average) and 4) variation (the variability of the feature
with respect to its mean length). Only the feature “number” has been extracted for
false starts.
Clauses:
4. Number of clauses per minute (N_CLA-m) = calculated as the ratio between
the total number of clauses and Total time of subject’s utterances in minutes
(Tot_T-m).
5. Duration of clauses (D_CLA) = the ratio between the total duration (in sec.)
of clauses and the Total time of subject’s utterances in minutes (Tot_T-m)
6. Mean length of clauses (M_CLA) = the ratio between the total duration (in
sec.) of clauses and the total number of clauses.
7. Variation of clauses (V_CLA) = the variance of M_CLA
False Starts:
8. Number of false starts per minute (N_FS-m) = calculated as the ratio between
the total number of false starts and Total time of subject’s utterances in
minutes (Tot_T-m).
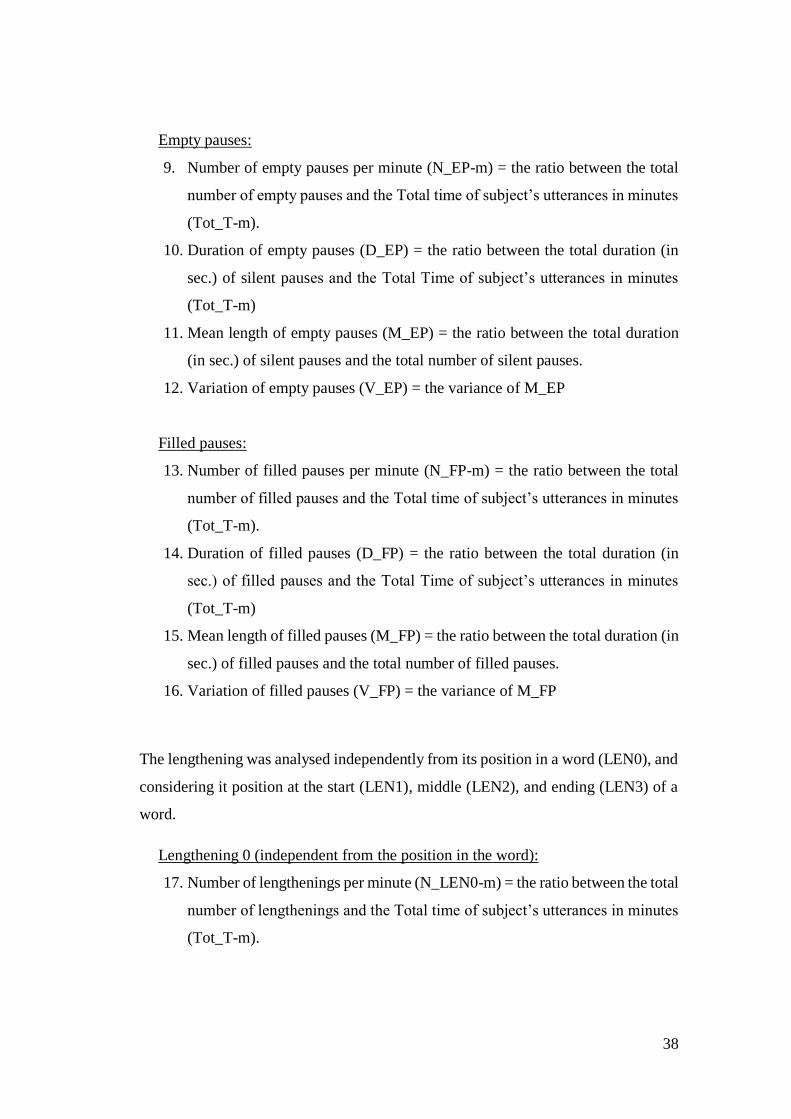
38
Empty pauses:
9. Number of empty pauses per minute (N_EP-m) = the ratio between the total
number of empty pauses and the Total time of subject’s utterances in minutes
(Tot_T-m).
10. Duration of empty pauses (D_EP) = the ratio between the total duration (in
sec.) of silent pauses and the Total Time of subject’s utterances in minutes
(Tot_T-m)
11. Mean length of empty pauses (M_EP) = the ratio between the total duration
(in sec.) of silent pauses and the total number of silent pauses.
12. Variation of empty pauses (V_EP) = the variance of M_EP
Filled pauses:
13. Number of filled pauses per minute (N_FP-m) = the ratio between the total
number of filled pauses and the Total time of subject’s utterances in minutes
(Tot_T-m).
14. Duration of filled pauses (D_FP) = the ratio between the total duration (in
sec.) of filled pauses and the Total Time of subject’s utterances in minutes
(Tot_T-m)
15. Mean length of filled pauses (M_FP) = the ratio between the total duration (in
sec.) of filled pauses and the total number of filled pauses.
16. Variation of filled pauses (V_FP) = the variance of M_FP
The lengthening was analysed independently from its position in a word (LEN0), and
considering it position at the start (LEN1), middle (LEN2), and ending (LEN3) of a
word.
Lengthening 0 (independent from the position in the word):
17. Number of lengthenings per minute (N_LEN0-m) = the ratio between the total
number of lengthenings and the Total time of subject’s utterances in minutes
(Tot_T-m).
39
18. Duration of lengthenings (D_LEN0) = the ratio between the total duration (in
sec.) of lengthenings and the Total Time of subject’s utterances in minutes
(Tot_T-m).
19. Mean time of lengthenings (M_LEN0) = the ratio between the total duration
(in sec.) of a lengthenings and the total number of lengthenings.
20. Variation of lengthenings (V_LEN0) = the variance of M_LEN1
Lengthening1 (in the beginning of the word):
21. Number of lengthening per minute (N_LEN1-m) = the ratio between the total
number of lengthening and the Total time of subject’s utterances in minutes
(Tot_T-m).
22. Duration of lengthening (D_LEN1) = the ratio between the total duration (in
sec.) of lengthening and the Total Time of subject’s utterances in minutes
(Tot_T-m).
23. Mean time of lengthening (M_LEN1) = the ratio between the total duration
(in sec.) of lengthening and the total number of lengthening.
24. Variation of lengthening (V_LEN1) = the variance of M_LEN1
Lengthening2 (in the middle of the word):
25. Number of lengthening per minute (N_LEN2-m) = the ratio between the total
number of lengthening and the Total time of subject’s utterances in minutes
(Tot_T-D).
26. Duration of lengthening (D_LEN2) = the ratio between the total duration (in
sec.) of lengthening and the Total Time of subject’s utterances in minutes
(Tot_T-m)
27. Mean time of lengthening (M_LEN2) = the ratio between the total duration
(in sec.) of lengthening and the total number of lengthening.
28. Variation of lengthening (V_LEN2) = the variance of M_LEN2
40
Lengthening3 (at the end of the word):
29. Number of lengthening per minute (N_LEN3-m) = the ratio between the total
number of lengthening and the Total time of subject’s utterances in minutes
(Tot_T-m).
30. Duration of lengthening (D_LEN3) = the ratio between the total duration (in
sec.) of lengthening and the Total Time of subject’s utterances in minutes
(Tot_T-m).
31. Mean time of lengthening (M_LEN3) = the ratio between the total duration
(in sec.) of lengthening and the total number of lengthening.
32. Variation of lengthening (V_LEN3) = the variance of M_LEN3
2.3.6 Data Analyses
A set of statistic tests have been performed to analyse the collected data. Socio-
demographic data (educational level, marital status, employment) have been analysed
through Chi square tests, while clinical data (BDI-II, DASS-21, YSQ-s3-36) through
t-Test students after testing the assumption hypotheses5.
To test the differences between Pt and Hc with respect to the extracted speech
parameters, Two sample t-Tests have been performed when the assumptions
hypotheses have been respected, contrarily Mann-Whitney U tests have been carried
out. To test the differences between the two groups (Pt and Hc) with respect to the
extracted parameters considering also the educational level , One-way ANOVAs have
been performed after testing the assumption hypotheses6. Considering the small
groups size, the four classes of educational level have been joined in two classes: low
5 Two-Sample t-Test Assumptions: 1- The data are continuous; 2- The data follow the normal
probability distribution; 3- The variances of the two populations are equal (homoscedasticity); 4-The
two samples are independent; 5- The two samples are random samples from their respective
populations. 6 One-way Anova Assumptions: 1- The data follow the normal probability distribution; 2- The
variances of the populations are equal (homoscedasticity); 3-The samples are independent; 4- The
samples are random samples from their respective populations.
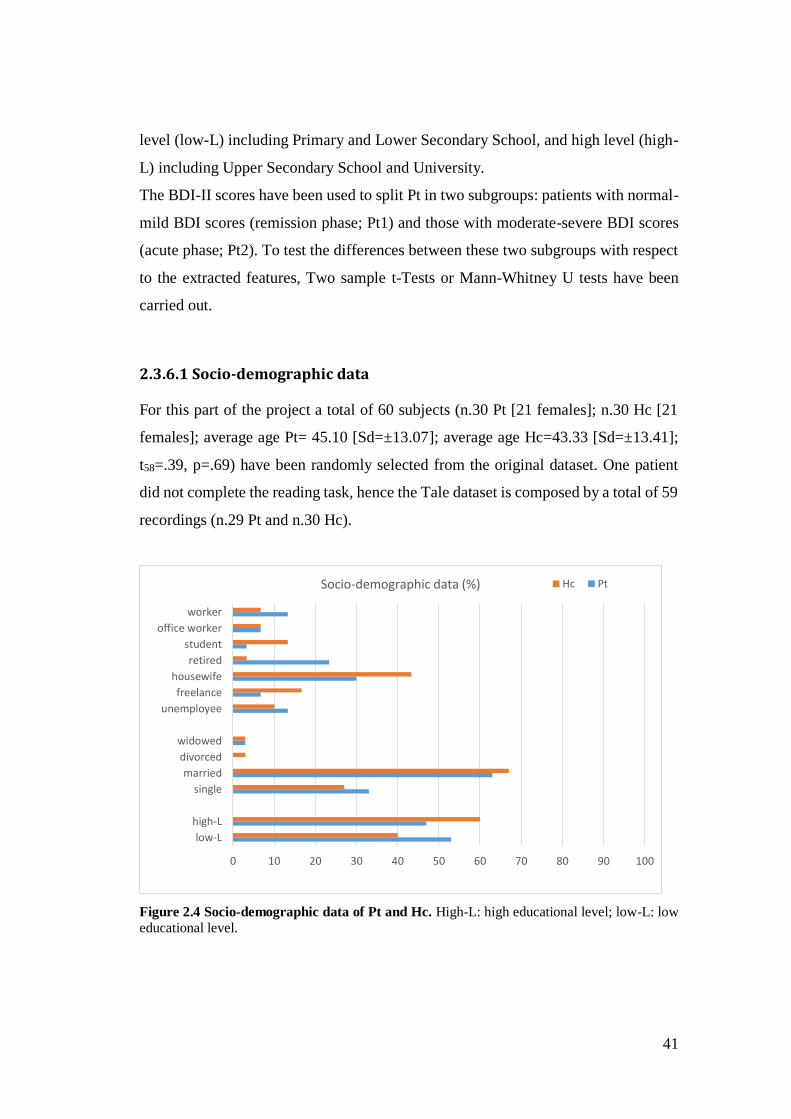
41
level (low-L) including Primary and Lower Secondary School, and high level (high-
L) including Upper Secondary School and University.
The BDI-II scores have been used to split Pt in two subgroups: patients with normal-
mild BDI scores (remission phase; Pt1) and those with moderate-severe BDI scores
(acute phase; Pt2). To test the differences between these two subgroups with respect
to the extracted features, Two sample t-Tests or Mann-Whitney U tests have been
carried out.
2.3.6.1 Socio-demographic data
For this part of the project a total of 60 subjects (n.30 Pt [21 females]; n.30 Hc [21
females]; average age Pt= 45.10 [Sd=±13.07]; average age Hc=43.33 [Sd=±13.41];
t58=.39, p=.69) have been randomly selected from the original dataset. One patient
did not complete the reading task, hence the Tale dataset is composed by a total of 59
recordings (n.29 Pt and n.30 Hc).
Figure 2.4 Socio-demographic data of Pt and Hc. High-L: high educational level; low-L: low educational level.
0 10 20 30 40 50 60 70 80 90 100
low-L
high-L
single
married
divorced
widowed
unemployee
freelance
housewife
retired
student
office worker
worker
Socio-demographic data (%) Hc Pt
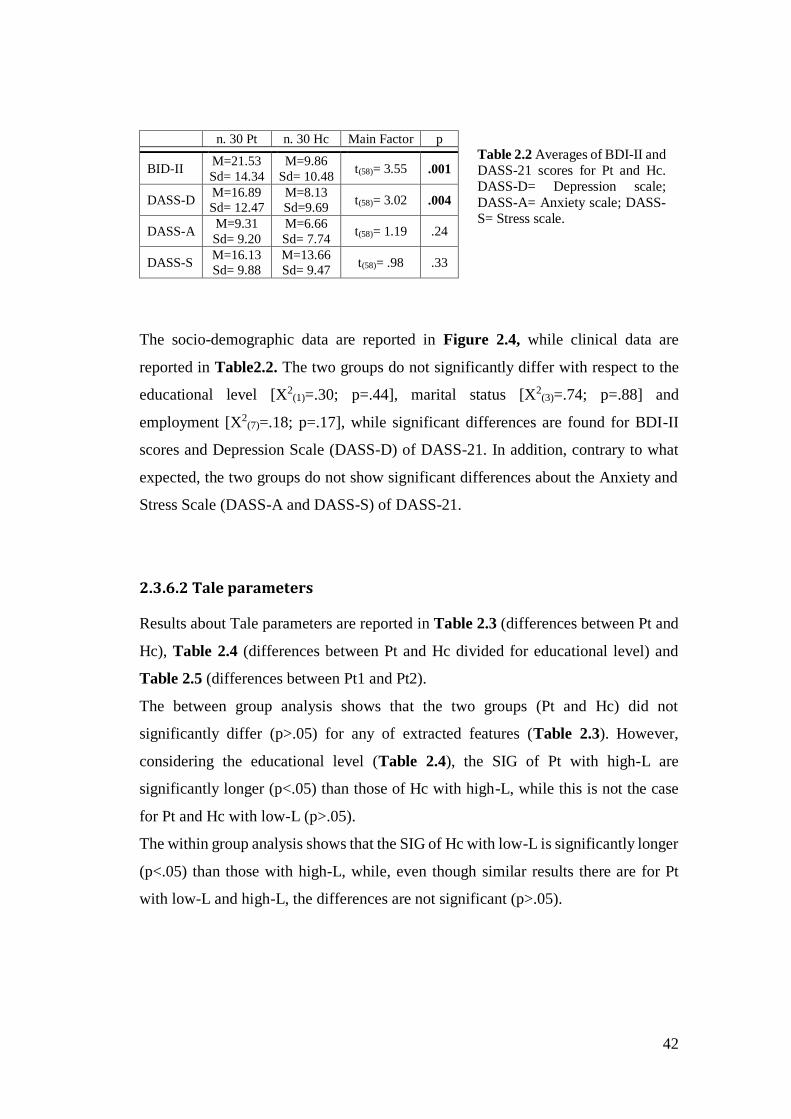
42
n. 30 Pt n. 30 Hc Main Factor p
BID-II M=21.53
Sd= 14.34
M=9.86
Sd= 10.48 t(58)= 3.55 .001
DASS-D M=16.89
Sd= 12.47
M=8.13
Sd=9.69 t(58)= 3.02 .004
DASS-A M=9.31
Sd= 9.20
M=6.66
Sd= 7.74 t(58)= 1.19 .24
DASS-S M=16.13
Sd= 9.88
M=13.66
Sd= 9.47 t(58)= .98 .33
The socio-demographic data are reported in Figure 2.4, while clinical data are
reported in Table2.2. The two groups do not significantly differ with respect to the
educational level [X2(1)=.30; p=.44], marital status [X2
(3)=.74; p=.88] and
employment [X2(7)=.18; p=.17], while significant differences are found for BDI-II
scores and Depression Scale (DASS-D) of DASS-21. In addition, contrary to what
expected, the two groups do not show significant differences about the Anxiety and
Stress Scale (DASS-A and DASS-S) of DASS-21.
2.3.6.2 Tale parameters
Results about Tale parameters are reported in Table 2.3 (differences between Pt and
Hc), Table 2.4 (differences between Pt and Hc divided for educational level) and
Table 2.5 (differences between Pt1 and Pt2).
The between group analysis shows that the two groups (Pt and Hc) did not
significantly differ (p>.05) for any of extracted features (Table 2.3). However,
considering the educational level (Table 2.4), the SIG of Pt with high-L are
significantly longer (p<.05) than those of Hc with high-L, while this is not the case
for Pt and Hc with low-L (p>.05).
The within group analysis shows that the SIG of Hc with low-L is significantly longer
(p<.05) than those with high-L, while, even though similar results there are for Pt
with low-L and high-L, the differences are not significant (p>.05).
Table 2.2 Averages of BDI-II and DASS-21 scores for Pt and Hc. DASS-D= Depression scale;
DASS-A= Anxiety scale; DASS-S= Stress scale.
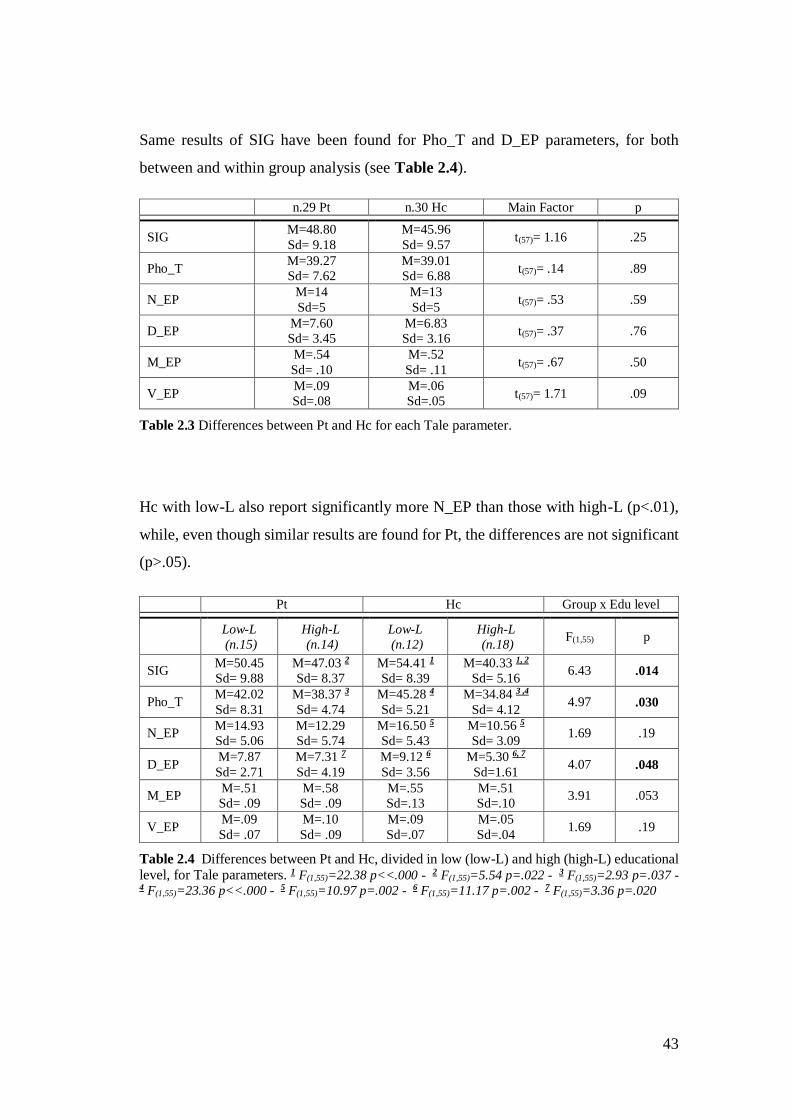
43
Same results of SIG have been found for Pho_T and D_EP parameters, for both
between and within group analysis (see Table 2.4).
n.29 Pt n.30 Hc Main Factor p
SIG M=48.80
Sd= 9.18
M=45.96
Sd= 9.57 t(57)= 1.16 .25
Pho_T M=39.27
Sd= 7.62
M=39.01
Sd= 6.88 t(57)= .14 .89
N_EP M=14
Sd=5
M=13
Sd=5 t(57)= .53 .59
D_EP M=7.60
Sd= 3.45
M=6.83
Sd= 3.16 t(57)= .37 .76
M_EP M=.54
Sd= .10
M=.52
Sd= .11 t(57)= .67 .50
V_EP M=.09
Sd=.08
M=.06
Sd=.05 t(57)= 1.71 .09
Table 2.3 Differences between Pt and Hc for each Tale parameter.
Hc with low-L also report significantly more N_EP than those with high-L (p<.01),
while, even though similar results are found for Pt, the differences are not significant
(p>.05).
Pt Hc Group x Edu level
Low-L
(n.15)
High-L
(n.14)
Low-L
(n.12)
High-L
(n.18) F(1,55) p
SIG M=50.45
Sd= 9.88
M=47.03 2
Sd= 8.37
M=54.41 1
Sd= 8.39
M=40.33 1, 2
Sd= 5.16 6.43 .014
Pho_T M=42.02
Sd= 8.31
M=38.37 3
Sd= 4.74
M=45.28 4
Sd= 5.21
M=34.84 3 ,4
Sd= 4.12 4.97 .030
N_EP M=14.93
Sd= 5.06
M=12.29
Sd= 5.74
M=16.50 5
Sd= 5.43
M=10.56 5
Sd= 3.09 1.69 .19
D_EP M=7.87
Sd= 2.71
M=7.31 7
Sd= 4.19
M=9.12 6
Sd= 3.56
M=5.30 6, 7
Sd=1.61 4.07 .048
M_EP M=.51
Sd= .09
M=.58
Sd= .09
M=.55
Sd=.13
M=.51
Sd=.10 3.91 .053
V_EP M=.09
Sd= .07
M=.10
Sd= .09
M=.09
Sd=.07
M=.05
Sd=.04 1.69 .19
Table 2.4 Differences between Pt and Hc, divided in low (low-L) and high (high-L) educational level, for Tale parameters. 1 F(1,55)=22.38 p<<.000 - 2 F(1,55)=5.54 p=.022 - 3 F(1,55)=2.93 p=.037 - 4 F(1,55)=23.36 p<<.000 - 5 F(1,55)=10.97 p=.002 - 6 F(1,55)=11.17 p=.002 - 7 F(1,55)=3.36 p=.020
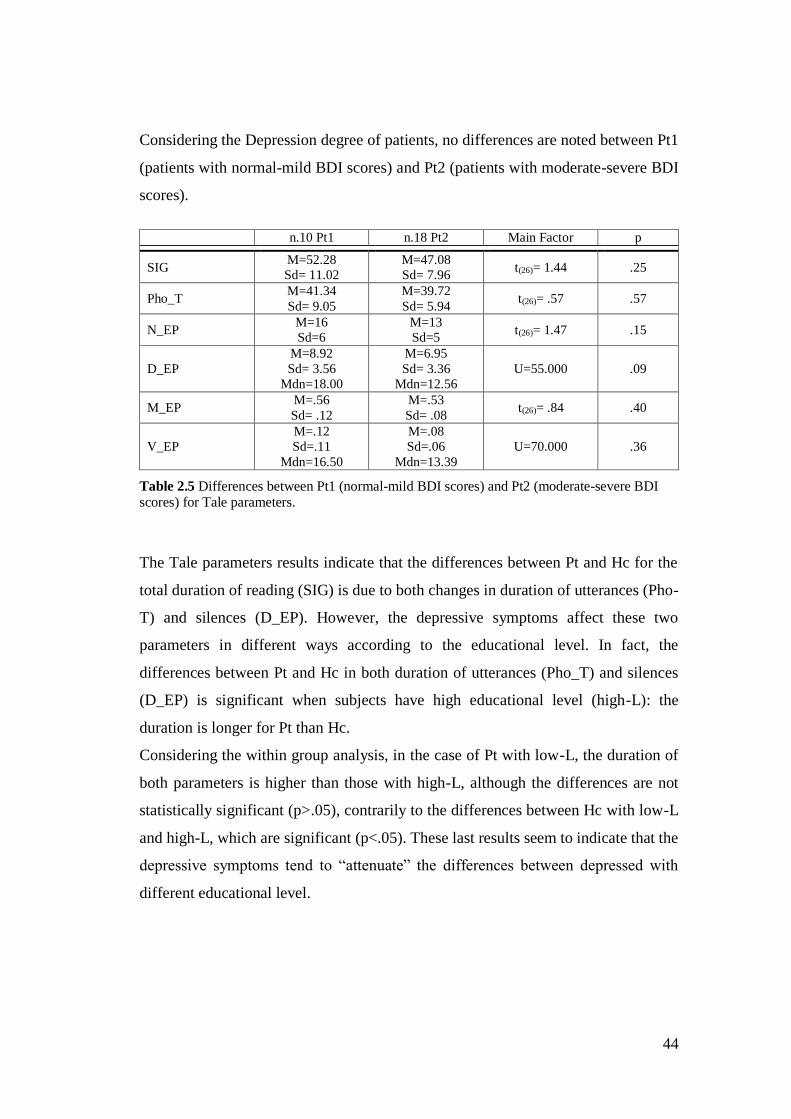
44
Considering the Depression degree of patients, no differences are noted between Pt1
(patients with normal-mild BDI scores) and Pt2 (patients with moderate-severe BDI
scores).
n.10 Pt1 n.18 Pt2 Main Factor p
SIG M=52.28
Sd= 11.02
M=47.08
Sd= 7.96 t(26)= 1.44 .25
Pho_T M=41.34
Sd= 9.05
M=39.72
Sd= 5.94 t(26)= .57 .57
N_EP M=16
Sd=6
M=13
Sd=5 t(26)= 1.47 .15
D_EP
M=8.92
Sd= 3.56
Mdn=18.00
M=6.95
Sd= 3.36
Mdn=12.56
U=55.000 .09
M_EP M=.56
Sd= .12
M=.53
Sd= .08 t(26)= .84 .40
V_EP
M=.12
Sd=.11
Mdn=16.50
M=.08
Sd=.06
Mdn=13.39
U=70.000 .36
Table 2.5 Differences between Pt1 (normal-mild BDI scores) and Pt2 (moderate-severe BDI scores) for Tale parameters.
The Tale parameters results indicate that the differences between Pt and Hc for the
total duration of reading (SIG) is due to both changes in duration of utterances (Pho-
T) and silences (D_EP). However, the depressive symptoms affect these two
parameters in different ways according to the educational level. In fact, the
differences between Pt and Hc in both duration of utterances (Pho_T) and silences
(D_EP) is significant when subjects have high educational level (high-L): the
duration is longer for Pt than Hc.
Considering the within group analysis, in the case of Pt with low-L, the duration of
both parameters is higher than those with high-L, although the differences are not
statistically significant (p>.05), contrarily to the differences between Hc with low-L
and high-L, which are significant (p<.05). These last results seem to indicate that the
depressive symptoms tend to “attenuate” the differences between depressed with
different educational level.
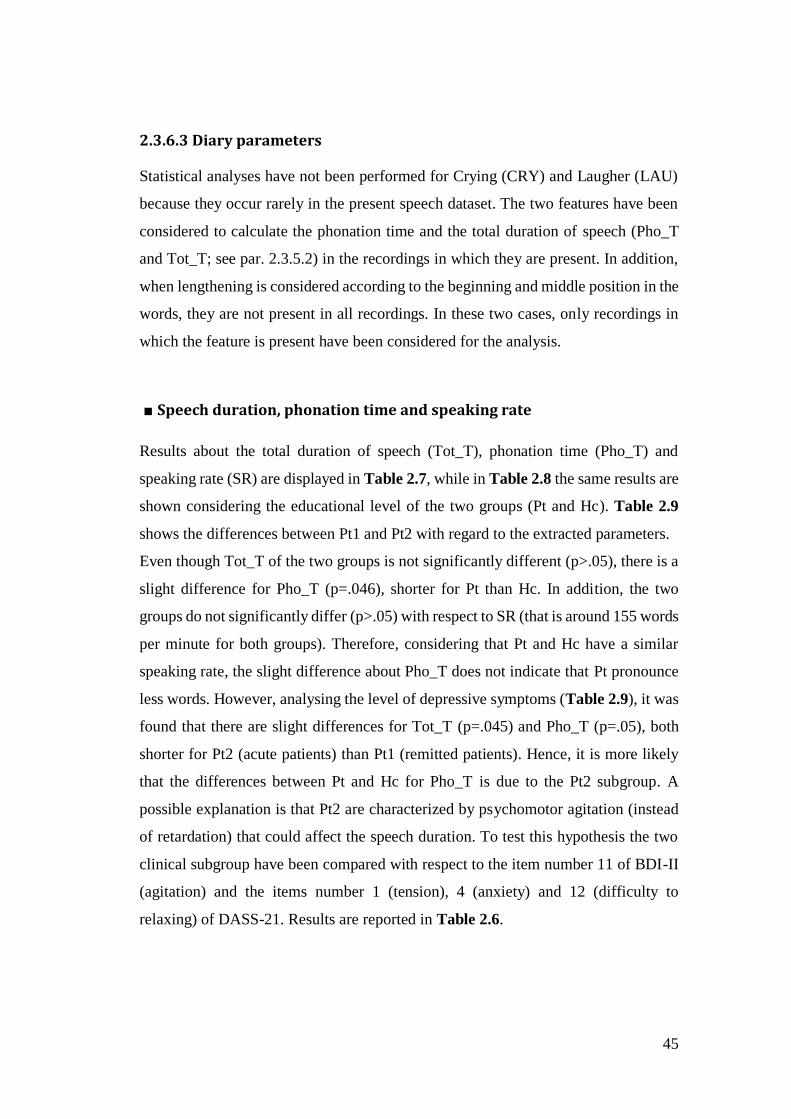
45
2.3.6.3 Diary parameters
Statistical analyses have not been performed for Crying (CRY) and Laugher (LAU)
because they occur rarely in the present speech dataset. The two features have been
considered to calculate the phonation time and the total duration of speech (Pho_T
and Tot_T; see par. 2.3.5.2) in the recordings in which they are present. In addition,
when lengthening is considered according to the beginning and middle position in the
words, they are not present in all recordings. In these two cases, only recordings in
which the feature is present have been considered for the analysis.
■ Speech duration, phonation time and speaking rate
Results about the total duration of speech (Tot_T), phonation time (Pho_T) and
speaking rate (SR) are displayed in Table 2.7, while in Table 2.8 the same results are
shown considering the educational level of the two groups (Pt and Hc). Table 2.9
shows the differences between Pt1 and Pt2 with regard to the extracted parameters.
Even though Tot_T of the two groups is not significantly different (p>.05), there is a
slight difference for Pho_T (p=.046), shorter for Pt than Hc. In addition, the two
groups do not significantly differ (p>.05) with respect to SR (that is around 155 words
per minute for both groups). Therefore, considering that Pt and Hc have a similar
speaking rate, the slight difference about Pho_T does not indicate that Pt pronounce
less words. However, analysing the level of depressive symptoms (Table 2.9), it was
found that there are slight differences for Tot_T (p=.045) and Pho_T (p=.05), both
shorter for Pt2 (acute patients) than Pt1 (remitted patients). Hence, it is more likely
that the differences between Pt and Hc for Pho_T is due to the Pt2 subgroup. A
possible explanation is that Pt2 are characterized by psychomotor agitation (instead
of retardation) that could affect the speech duration. To test this hypothesis the two
clinical subgroup have been compared with respect to the item number 11 of BDI-II
(agitation) and the items number 1 (tension), 4 (anxiety) and 12 (difficulty to
relaxing) of DASS-21. Results are reported in Table 2.6.
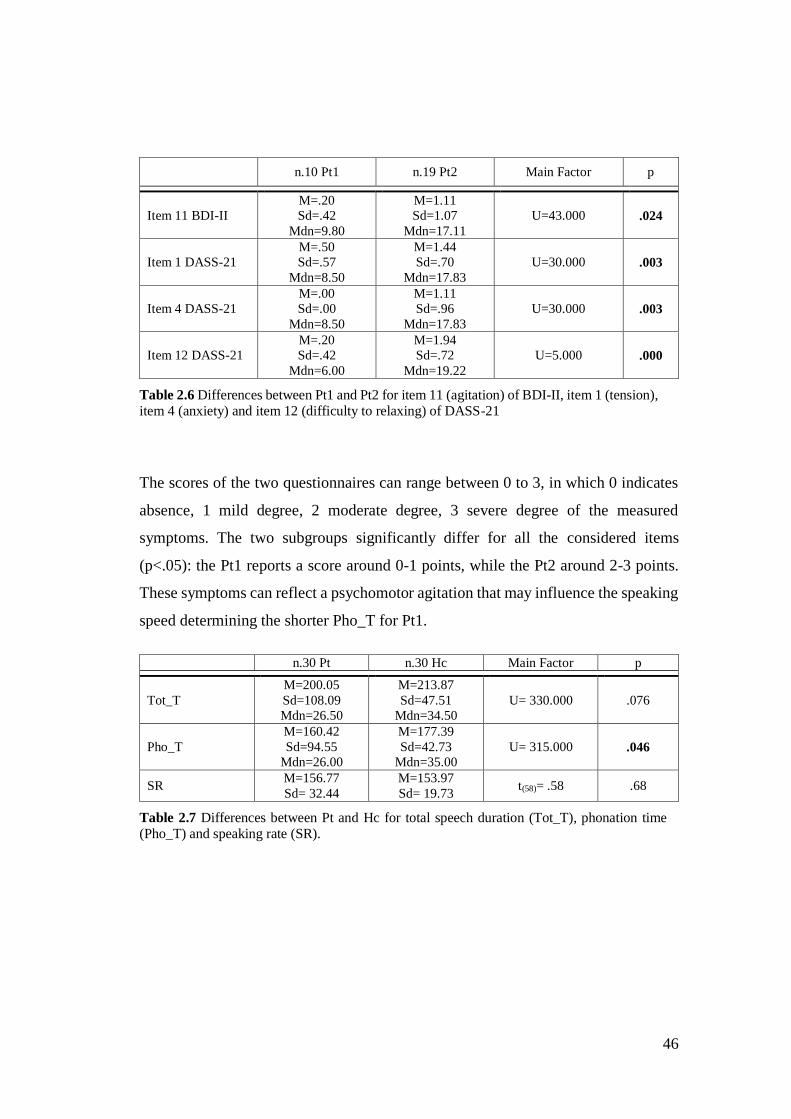
46
n.10 Pt1 n.19 Pt2 Main Factor p
Item 11 BDI-II
M=.20
Sd=.42
Mdn=9.80
M=1.11
Sd=1.07
Mdn=17.11
U=43.000 .024
Item 1 DASS-21
M=.50
Sd=.57
Mdn=8.50
M=1.44
Sd=.70
Mdn=17.83
U=30.000 .003
Item 4 DASS-21
M=.00
Sd=.00
Mdn=8.50
M=1.11
Sd=.96
Mdn=17.83
U=30.000 .003
Item 12 DASS-21
M=.20
Sd=.42
Mdn=6.00
M=1.94
Sd=.72
Mdn=19.22
U=5.000 .000
Table 2.6 Differences between Pt1 and Pt2 for item 11 (agitation) of BDI-II, item 1 (tension), item 4 (anxiety) and item 12 (difficulty to relaxing) of DASS-21
The scores of the two questionnaires can range between 0 to 3, in which 0 indicates
absence, 1 mild degree, 2 moderate degree, 3 severe degree of the measured
symptoms. The two subgroups significantly differ for all the considered items
(p<.05): the Pt1 reports a score around 0-1 points, while the Pt2 around 2-3 points.
These symptoms can reflect a psychomotor agitation that may influence the speaking
speed determining the shorter Pho_T for Pt1.
n.30 Pt n.30 Hc Main Factor p
Tot_T
M=200.05
Sd=108.09
Mdn=26.50
M=213.87
Sd=47.51
Mdn=34.50
U= 330.000 .076
Pho_T
M=160.42
Sd=94.55
Mdn=26.00
M=177.39
Sd=42.73
Mdn=35.00
U= 315.000 .046
SR M=156.77
Sd= 32.44
M=153.97
Sd= 19.73 t(58)= .58 .68
Table 2.7 Differences between Pt and Hc for total speech duration (Tot_T), phonation time (Pho_T) and speaking rate (SR).
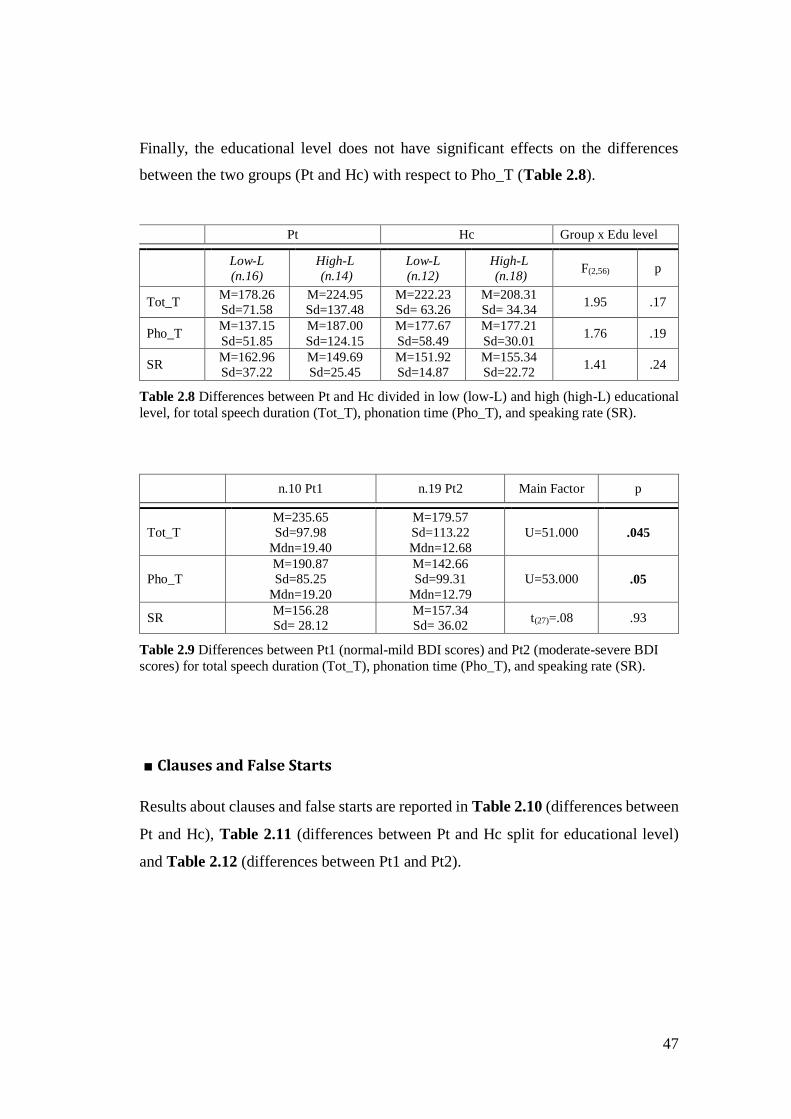
47
Finally, the educational level does not have significant effects on the differences
between the two groups (Pt and Hc) with respect to Pho_T (Table 2.8).
Pt Hc Group x Edu level
Low-L
(n.16)
High-L
(n.14)
Low-L
(n.12)
High-L
(n.18) F(2,56) p
Tot_T M=178.26
Sd=71.58
M=224.95
Sd=137.48
M=222.23
Sd= 63.26
M=208.31
Sd= 34.34 1.95 .17
Pho_T M=137.15
Sd=51.85
M=187.00
Sd=124.15
M=177.67
Sd=58.49
M=177.21
Sd=30.01 1.76 .19
SR M=162.96
Sd=37.22
M=149.69
Sd=25.45
M=151.92
Sd=14.87
M=155.34
Sd=22.72 1.41 .24
Table 2.8 Differences between Pt and Hc divided in low (low-L) and high (high-L) educational
level, for total speech duration (Tot_T), phonation time (Pho_T), and speaking rate (SR).
n.10 Pt1 n.19 Pt2 Main Factor p
Tot_T
M=235.65
Sd=97.98
Mdn=19.40
M=179.57
Sd=113.22
Mdn=12.68
U=51.000 .045
Pho_T
M=190.87
Sd=85.25
Mdn=19.20
M=142.66
Sd=99.31
Mdn=12.79
U=53.000 .05
SR M=156.28
Sd= 28.12
M=157.34
Sd= 36.02 t(27)=.08 .93
Table 2.9 Differences between Pt1 (normal-mild BDI scores) and Pt2 (moderate-severe BDI
scores) for total speech duration (Tot_T), phonation time (Pho_T), and speaking rate (SR).
■ Clauses and False Starts
Results about clauses and false starts are reported in Table 2.10 (differences between
Pt and Hc), Table 2.11 (differences between Pt and Hc split for educational level)
and Table 2.12 (differences between Pt1 and Pt2).
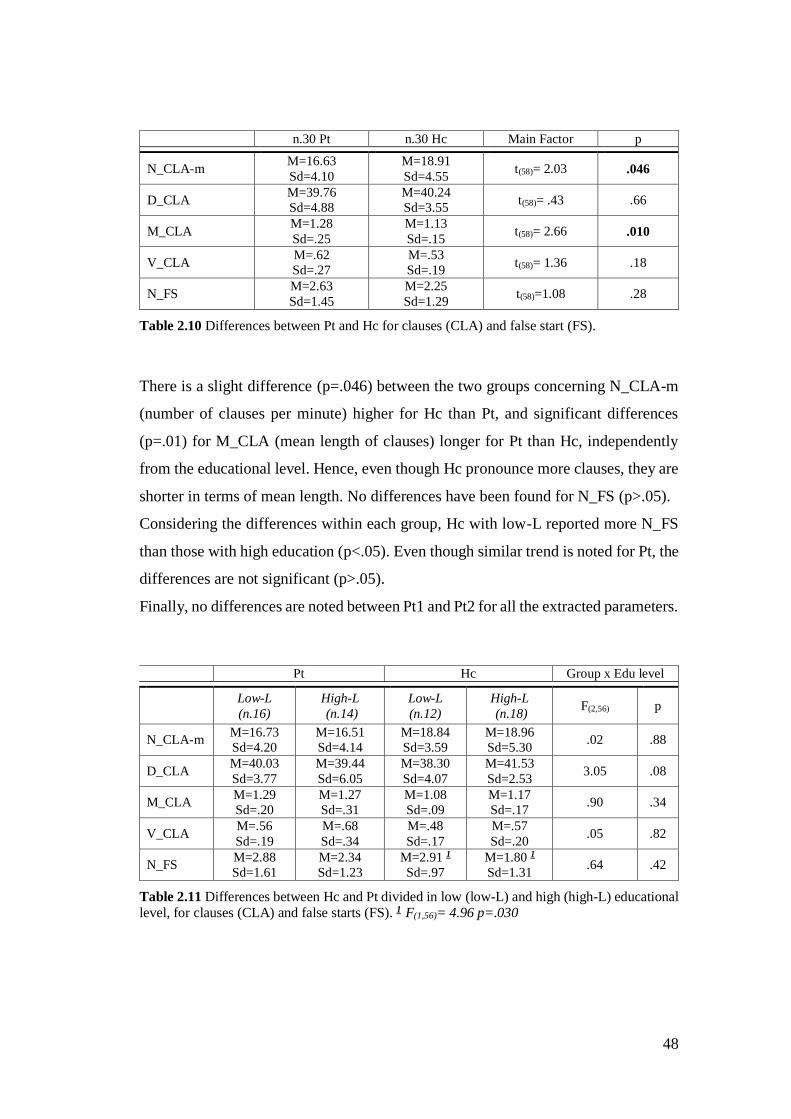
48
n.30 Pt n.30 Hc Main Factor p
N_CLA-m M=16.63
Sd=4.10
M=18.91
Sd=4.55 t(58)= 2.03 .046
D_CLA M=39.76
Sd=4.88
M=40.24
Sd=3.55 t(58)= .43 .66
M_CLA M=1.28
Sd=.25
M=1.13
Sd=.15 t(58)= 2.66 .010
V_CLA M=.62
Sd=.27
M=.53
Sd=.19 t(58)= 1.36 .18
N_FS M=2.63
Sd=1.45
M=2.25
Sd=1.29 t(58)=1.08 .28
Table 2.10 Differences between Pt and Hc for clauses (CLA) and false start (FS).
There is a slight difference (p=.046) between the two groups concerning N_CLA-m
(number of clauses per minute) higher for Hc than Pt, and significant differences
(p=.01) for M_CLA (mean length of clauses) longer for Pt than Hc, independently
from the educational level. Hence, even though Hc pronounce more clauses, they are
shorter in terms of mean length. No differences have been found for N_FS (p>.05).
Considering the differences within each group, Hc with low-L reported more N_FS
than those with high education (p<.05). Even though similar trend is noted for Pt, the
differences are not significant (p>.05).
Finally, no differences are noted between Pt1 and Pt2 for all the extracted parameters.
Pt Hc Group x Edu level
Low-L
(n.16)
High-L
(n.14)
Low-L
(n.12)
High-L
(n.18) F(2,56) p
N_CLA-m M=16.73
Sd=4.20
M=16.51
Sd=4.14
M=18.84
Sd=3.59
M=18.96
Sd=5.30 .02 .88
D_CLA M=40.03
Sd=3.77
M=39.44
Sd=6.05
M=38.30
Sd=4.07
M=41.53
Sd=2.53 3.05 .08
M_CLA M=1.29
Sd=.20
M=1.27
Sd=.31
M=1.08
Sd=.09
M=1.17
Sd=.17 .90 .34
V_CLA M=.56
Sd=.19
M=.68
Sd=.34
M=.48
Sd=.17
M=.57
Sd=.20 .05 .82
N_FS M=2.88
Sd=1.61
M=2.34
Sd=1.23
M=2.91 1
Sd=.97
M=1.80 1
Sd=1.31 .64 .42
Table 2.11 Differences between Hc and Pt divided in low (low-L) and high (high-L) educational level, for clauses (CLA) and false starts (FS). 1 F(1,56)= 4.96 p=.030
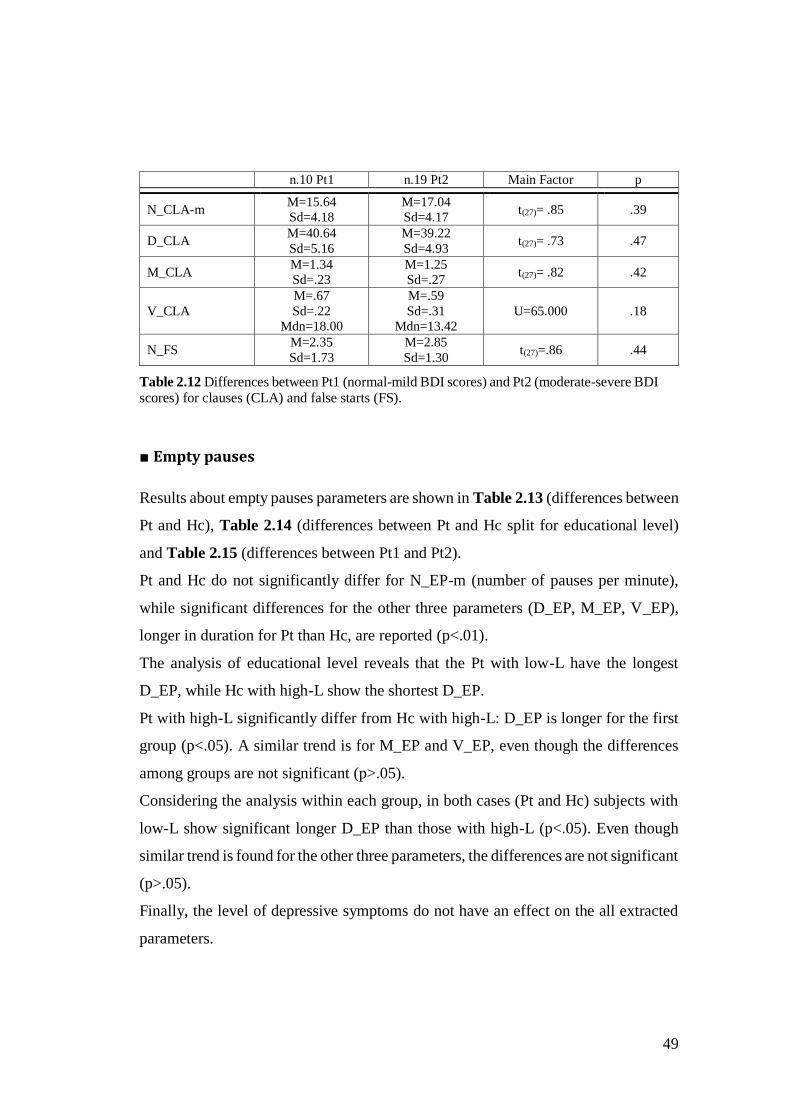
49
n.10 Pt1 n.19 Pt2 Main Factor p
N_CLA-m M=15.64
Sd=4.18
M=17.04
Sd=4.17 t(27)= .85 .39
D_CLA M=40.64
Sd=5.16
M=39.22
Sd=4.93 t(27)= .73 .47
M_CLA M=1.34
Sd=.23
M=1.25
Sd=.27 t(27)= .82 .42
V_CLA
M=.67
Sd=.22
Mdn=18.00
M=.59
Sd=.31
Mdn=13.42
U=65.000 .18
N_FS M=2.35
Sd=1.73
M=2.85
Sd=1.30 t(27)=.86 .44
Table 2.12 Differences between Pt1 (normal-mild BDI scores) and Pt2 (moderate-severe BDI scores) for clauses (CLA) and false starts (FS).
■ Empty pauses
Results about empty pauses parameters are shown in Table 2.13 (differences between
Pt and Hc), Table 2.14 (differences between Pt and Hc split for educational level)
and Table 2.15 (differences between Pt1 and Pt2).
Pt and Hc do not significantly differ for N_EP-m (number of pauses per minute),
while significant differences for the other three parameters (D_EP, M_EP, V_EP),
longer in duration for Pt than Hc, are reported (p<.01).
The analysis of educational level reveals that the Pt with low-L have the longest
D_EP, while Hc with high-L show the shortest D_EP.
Pt with high-L significantly differ from Hc with high-L: D_EP is longer for the first
group (p<.05). A similar trend is for M_EP and V_EP, even though the differences
among groups are not significant (p>.05).
Considering the analysis within each group, in both cases (Pt and Hc) subjects with
low-L show significant longer D_EP than those with high-L (p<.05). Even though
similar trend is found for the other three parameters, the differences are not significant
(p>.05).
Finally, the level of depressive symptoms do not have an effect on the all extracted
parameters.
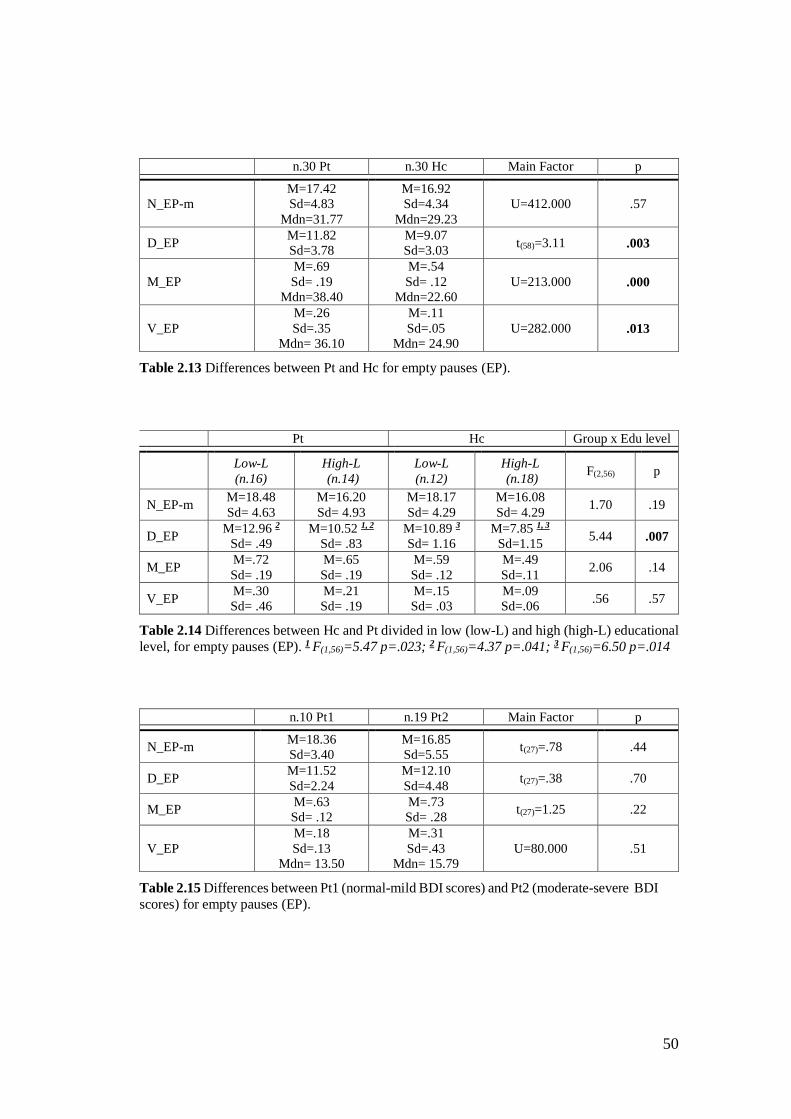
50
n.30 Pt n.30 Hc Main Factor p
N_EP-m
M=17.42
Sd=4.83
Mdn=31.77
M=16.92
Sd=4.34
Mdn=29.23
U=412.000 .57
D_EP M=11.82
Sd=3.78
M=9.07
Sd=3.03 t(58)=3.11 .003
M_EP
M=.69
Sd= .19
Mdn=38.40
M=.54
Sd= .12
Mdn=22.60
U=213.000 .000
V_EP
M=.26
Sd=.35
Mdn= 36.10
M=.11
Sd=.05
Mdn= 24.90
U=282.000 .013
Table 2.13 Differences between Pt and Hc for empty pauses (EP).
Pt Hc Group x Edu level
Low-L
(n.16)
High-L
(n.14)
Low-L
(n.12)
High-L
(n.18) F(2,56) p
N_EP-m M=18.48
Sd= 4.63
M=16.20
Sd= 4.93
M=18.17
Sd= 4.29
M=16.08
Sd= 4.29 1.70 .19
D_EP M=12.96 2
Sd= .49
M=10.52 1, 2
Sd= .83
M=10.89 3
Sd= 1.16
M=7.85 1, 3
Sd=1.15 5.44 .007
M_EP M=.72
Sd= .19
M=.65
Sd= .19
M=.59
Sd= .12
M=.49
Sd=.11 2.06 .14
V_EP M=.30
Sd= .46
M=.21
Sd= .19
M=.15
Sd= .03
M=.09
Sd=.06 .56 .57
Table 2.14 Differences between Hc and Pt divided in low (low-L) and high (high-L) educational
level, for empty pauses (EP). 1 F(1,56)=5.47 p=.023; 2 F(1,56)=4.37 p=.041; 3 F(1,56)=6.50 p=.014
n.10 Pt1 n.19 Pt2 Main Factor p
N_EP-m M=18.36
Sd=3.40
M=16.85
Sd=5.55 t(27)=.78 .44
D_EP M=11.52
Sd=2.24
M=12.10
Sd=4.48 t(27)=.38 .70
M_EP M=.63
Sd= .12
M=.73
Sd= .28 t(27)=1.25 .22
V_EP
M=.18
Sd=.13
Mdn= 13.50
M=.31
Sd=.43
Mdn= 15.79
U=80.000 .51
Table 2.15 Differences between Pt1 (normal-mild BDI scores) and Pt2 (moderate-severe BDI
scores) for empty pauses (EP).
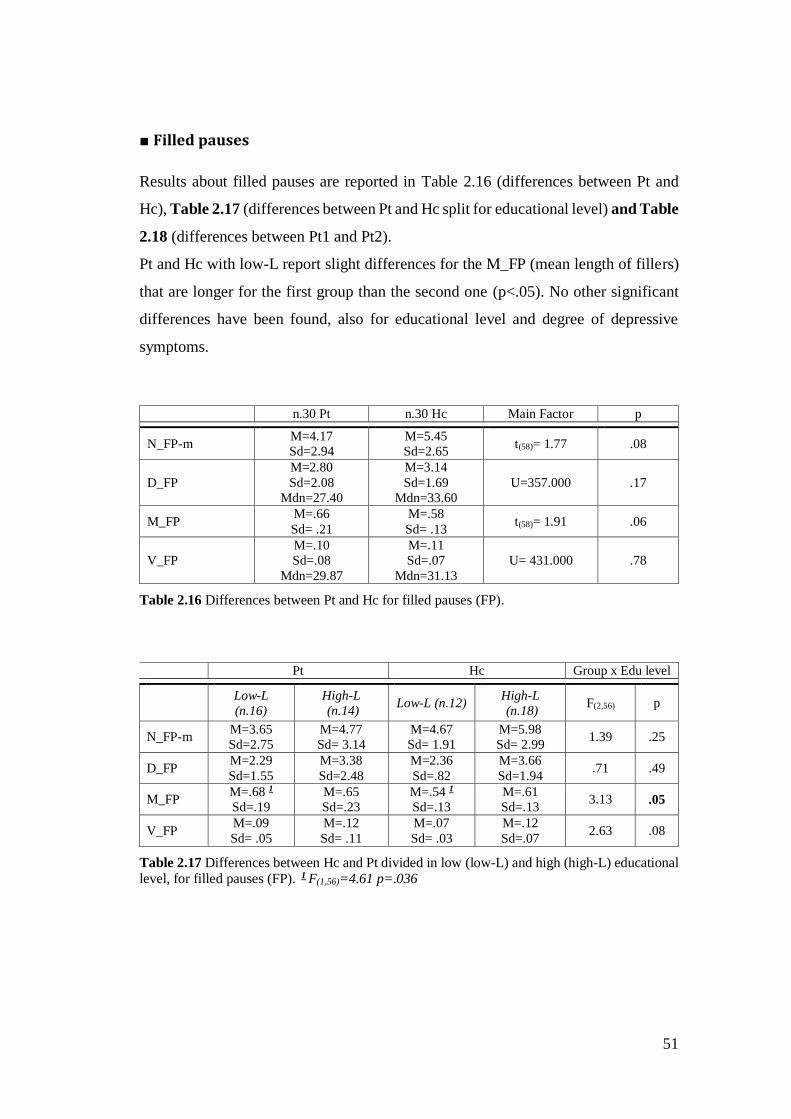
51
■ Filled pauses
Results about filled pauses are reported in Table 2.16 (differences between Pt and
Hc), Table 2.17 (differences between Pt and Hc split for educational level) and Table
2.18 (differences between Pt1 and Pt2).
Pt and Hc with low-L report slight differences for the M_FP (mean length of fillers)
that are longer for the first group than the second one (p<.05). No other significant
differences have been found, also for educational level and degree of depressive
symptoms.
n.30 Pt n.30 Hc Main Factor p
N_FP-m M=4.17
Sd=2.94
M=5.45
Sd=2.65 t(58)= 1.77 .08
D_FP
M=2.80
Sd=2.08
Mdn=27.40
M=3.14
Sd=1.69
Mdn=33.60
U=357.000 .17
M_FP M=.66
Sd= .21
M=.58
Sd= .13 t(58)= 1.91 .06
V_FP
M=.10
Sd=.08
Mdn=29.87
M=.11
Sd=.07
Mdn=31.13
U= 431.000 .78
Table 2.16 Differences between Pt and Hc for filled pauses (FP).
Pt Hc Group x Edu level
Low-L
(n.16)
High-L
(n.14) Low-L (n.12)
High-L
(n.18) F(2,56) p
N_FP-m M=3.65
Sd=2.75
M=4.77
Sd= 3.14
M=4.67
Sd= 1.91
M=5.98
Sd= 2.99 1.39 .25
D_FP M=2.29
Sd=1.55
M=3.38
Sd=2.48
M=2.36
Sd=.82
M=3.66
Sd=1.94 .71 .49
M_FP M=.68 1
Sd=.19
M=.65
Sd=.23
M=.54 1
Sd=.13
M=.61
Sd=.13 3.13 .05
V_FP M=.09
Sd= .05
M=.12
Sd= .11
M=.07
Sd= .03
M=.12
Sd=.07 2.63 .08
Table 2.17 Differences between Hc and Pt divided in low (low-L) and high (high-L) educational level, for filled pauses (FP). 1 F(1,56)=4.61 p=.036
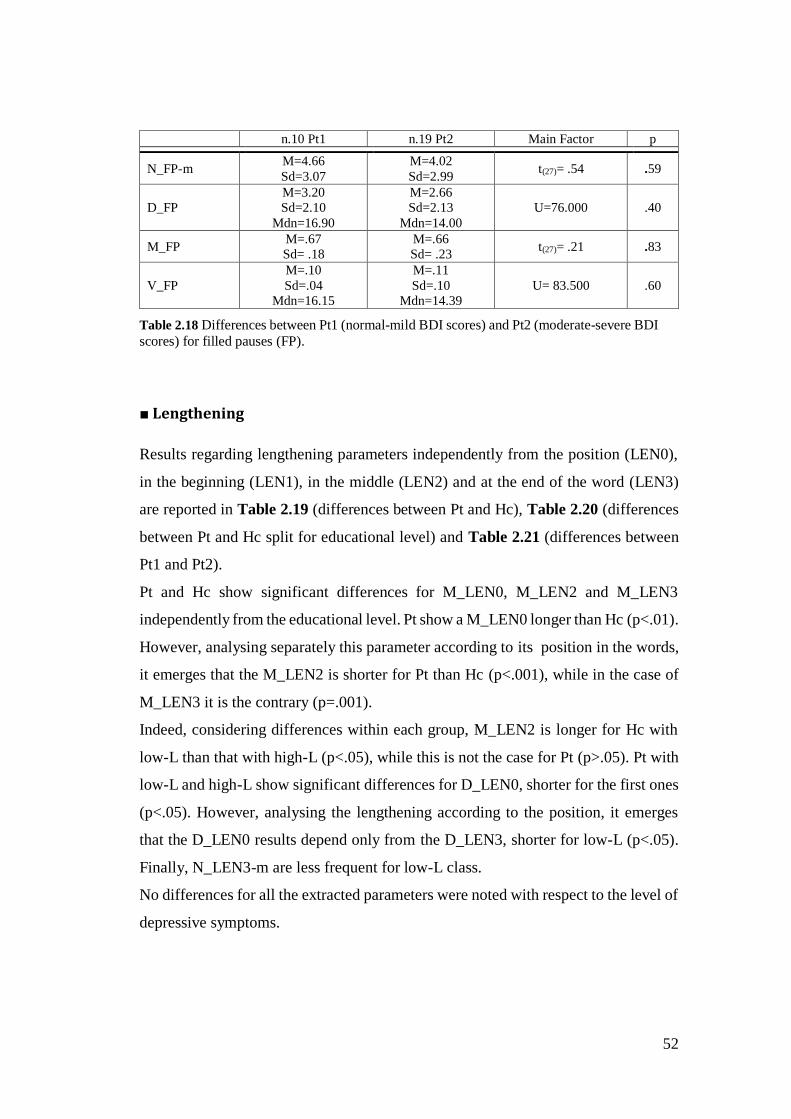
52
n.10 Pt1 n.19 Pt2 Main Factor p
N_FP-m M=4.66
Sd=3.07
M=4.02
Sd=2.99 t(27)= .54 .59
D_FP
M=3.20
Sd=2.10
Mdn=16.90
M=2.66
Sd=2.13
Mdn=14.00
U=76.000 .40
M_FP M=.67
Sd= .18
M=.66
Sd= .23 t(27)= .21 .83
V_FP
M=.10
Sd=.04
Mdn=16.15
M=.11
Sd=.10
Mdn=14.39
U= 83.500 .60
Table 2.18 Differences between Pt1 (normal-mild BDI scores) and Pt2 (moderate-severe BDI
scores) for filled pauses (FP).
■ Lengthening
Results regarding lengthening parameters independently from the position (LEN0),
in the beginning (LEN1), in the middle (LEN2) and at the end of the word (LEN3)
are reported in Table 2.19 (differences between Pt and Hc), Table 2.20 (differences
between Pt and Hc split for educational level) and Table 2.21 (differences between
Pt1 and Pt2).
Pt and Hc show significant differences for M_LEN0, M_LEN2 and M_LEN3
independently from the educational level. Pt show a M_LEN0 longer than Hc (p<.01).
However, analysing separately this parameter according to its position in the words,
it emerges that the M_LEN2 is shorter for Pt than Hc (p<.001), while in the case of
M_LEN3 it is the contrary (p=.001).
Indeed, considering differences within each group, M_LEN2 is longer for Hc with
low-L than that with high-L (p<.05), while this is not the case for Pt (p>.05). Pt with
low-L and high-L show significant differences for D_LEN0, shorter for the first ones
(p<.05). However, analysing the lengthening according to the position, it emerges
that the D_LEN0 results depend only from the D_LEN3, shorter for low-L (p<.05).
Finally, N_LEN3-m are less frequent for low-L class.
No differences for all the extracted parameters were noted with respect to the level of
depressive symptoms.
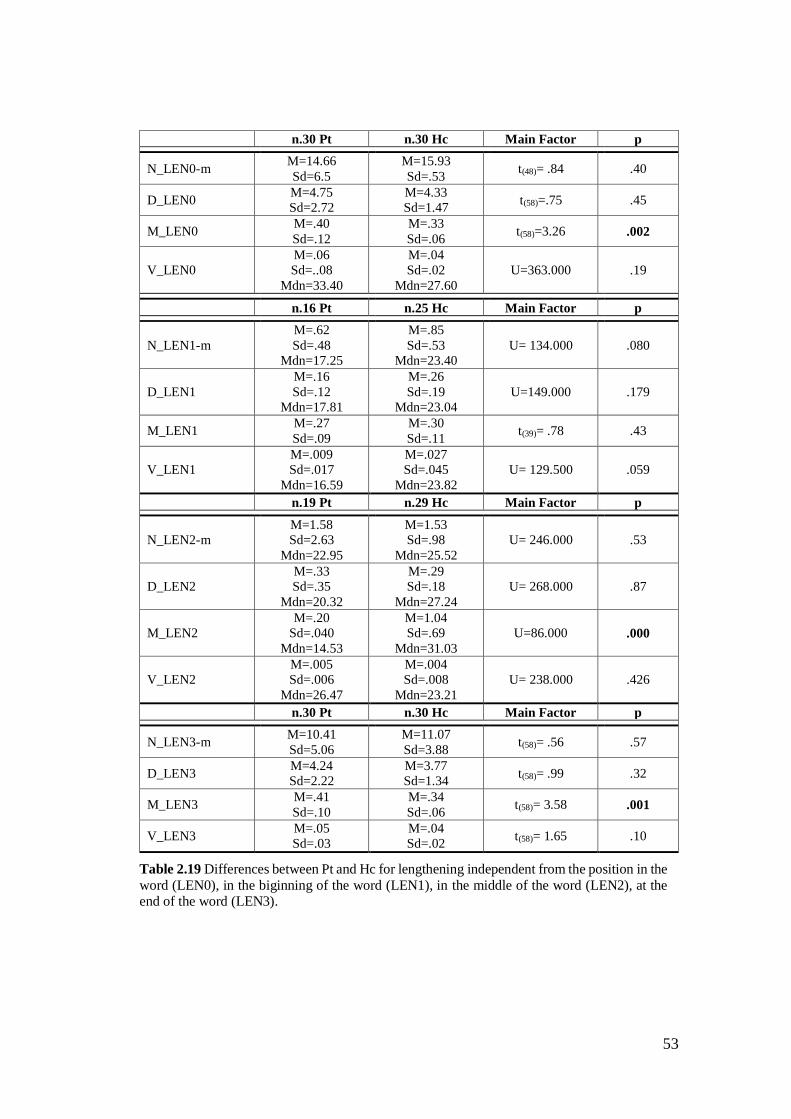
53
n.30 Pt n.30 Hc Main Factor p
N_LEN0-m M=14.66
Sd=6.5
M=15.93
Sd=.53 t(48)= .84 .40
D_LEN0 M=4.75
Sd=2.72
M=4.33
Sd=1.47 t(58)=.75 .45
M_LEN0 M=.40
Sd=.12
M=.33
Sd=.06 t(58)=3.26 .002
V_LEN0
M=.06
Sd=..08
Mdn=33.40
M=.04
Sd=.02
Mdn=27.60
U=363.000 .19
n.16 Pt n.25 Hc Main Factor p
N_LEN1-m
M=.62
Sd=.48
Mdn=17.25
M=.85
Sd=.53
Mdn=23.40
U= 134.000 .080
D_LEN1
M=.16
Sd=.12
Mdn=17.81
M=.26
Sd=.19
Mdn=23.04
U=149.000 .179
M_LEN1 M=.27
Sd=.09
M=.30
Sd=.11 t(39)= .78 .43
V_LEN1
M=.009
Sd=.017
Mdn=16.59
M=.027
Sd=.045
Mdn=23.82
U= 129.500 .059
n.19 Pt n.29 Hc Main Factor p
N_LEN2-m
M=1.58
Sd=2.63
Mdn=22.95
M=1.53
Sd=.98
Mdn=25.52
U= 246.000 .53
D_LEN2
M=.33
Sd=.35
Mdn=20.32
M=.29
Sd=.18
Mdn=27.24
U= 268.000 .87
M_LEN2
M=.20
Sd=.040
Mdn=14.53
M=1.04
Sd=.69
Mdn=31.03
U=86.000 .000
V_LEN2
M=.005
Sd=.006
Mdn=26.47
M=.004
Sd=.008
Mdn=23.21
U= 238.000 .426
n.30 Pt n.30 Hc Main Factor p
N_LEN3-m M=10.41
Sd=5.06
M=11.07
Sd=3.88 t(58)= .56 .57
D_LEN3 M=4.24
Sd=2.22
M=3.77
Sd=1.34 t(58)= .99 .32
M_LEN3 M=.41
Sd=.10
M=.34
Sd=.06 t(58)= 3.58 .001
V_LEN3 M=.05
Sd=.03
M=.04
Sd=.02 t(58)= 1.65 .10
Table 2.19 Differences between Pt and Hc for lengthening independent from the position in the
word (LEN0), in the biginning of the word (LEN1), in the middle of the word (LEN2), at the end of the word (LEN3).
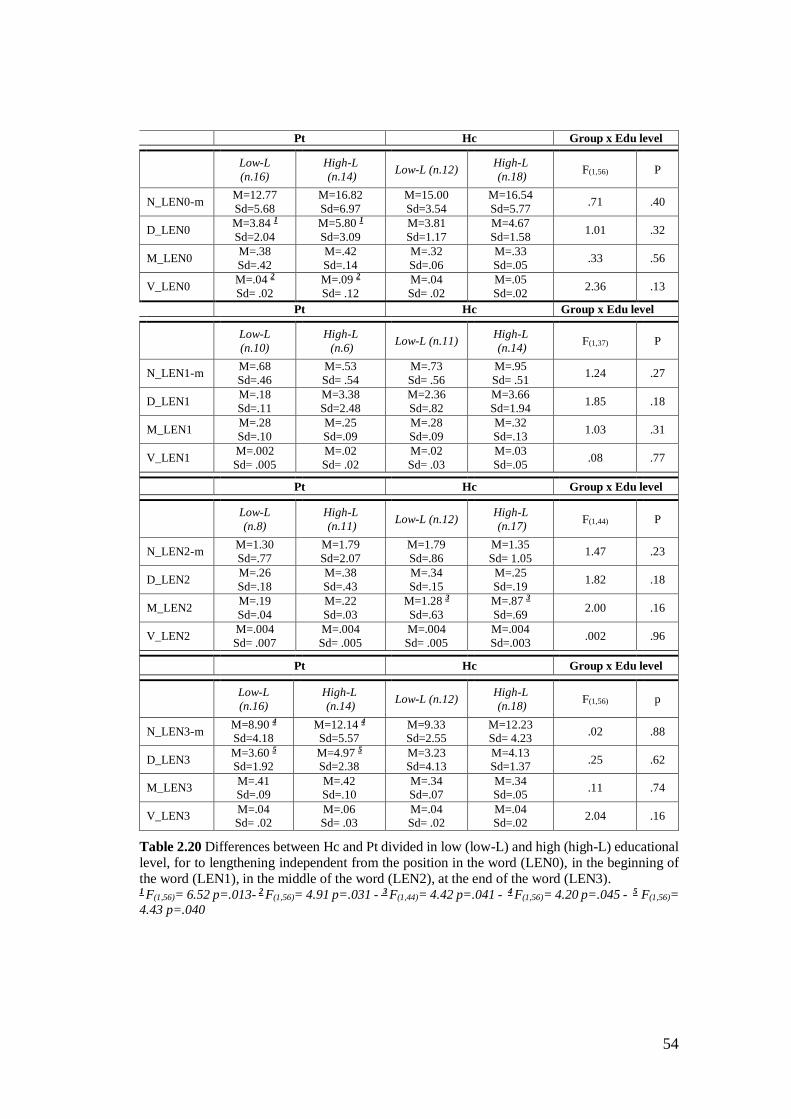
54
Pt Hc Group x Edu level
Low-L
(n.16)
High-L
(n.14) Low-L (n.12)
High-L
(n.18) F(1,56) P
N_LEN0-m M=12.77
Sd=5.68
M=16.82
Sd=6.97
M=15.00
Sd=3.54
M=16.54
Sd=5.77 .71 .40
D_LEN0 M=3.84 1
Sd=2.04
M=5.80 1
Sd=3.09
M=3.81
Sd=1.17
M=4.67
Sd=1.58 1.01 .32
M_LEN0 M=.38
Sd=.42
M=.42
Sd=.14
M=.32
Sd=.06
M=.33
Sd=.05 .33 .56
V_LEN0 M=.04 2
Sd= .02
M=.09 2
Sd= .12
M=.04
Sd= .02
M=.05
Sd=.02 2.36 .13
Pt Hc Group x Edu level
Low-L
(n.10)
High-L
(n.6) Low-L (n.11)
High-L
(n.14) F(1,37) P
N_LEN1-m M=.68
Sd=.46
M=.53
Sd= .54
M=.73
Sd= .56
M=.95
Sd= .51 1.24 .27
D_LEN1 M=.18
Sd=.11
M=3.38
Sd=2.48
M=2.36
Sd=.82
M=3.66
Sd=1.94 1.85 .18
M_LEN1 M=.28
Sd=.10
M=.25
Sd=.09
M=.28
Sd=.09
M=.32
Sd=.13 1.03 .31
V_LEN1 M=.002
Sd= .005
M=.02
Sd= .02
M=.02
Sd= .03
M=.03
Sd=.05 .08 .77
Pt Hc Group x Edu level
Low-L
(n.8)
High-L
(n.11) Low-L (n.12)
High-L
(n.17) F(1,44) P
N_LEN2-m M=1.30
Sd=.77
M=1.79
Sd=2.07
M=1.79
Sd=.86
M=1.35
Sd= 1.05 1.47 .23
D_LEN2 M=.26
Sd=.18
M=.38
Sd=.43
M=.34
Sd=.15
M=.25
Sd=.19 1.82 .18
M_LEN2 M=.19
Sd=.04
M=.22
Sd=.03
M=1.28 3
Sd=.63
M=.87 3
Sd=.69 2.00 .16
V_LEN2 M=.004
Sd= .007
M=.004
Sd= .005
M=.004
Sd= .005
M=.004
Sd=.003 .002 .96
Pt Hc Group x Edu level
Low-L
(n.16)
High-L
(n.14) Low-L (n.12)
High-L
(n.18) F(1,56) p
N_LEN3-m M=8.90 4
Sd=4.18 M=12.14 4
Sd=5.57 M=9.33
Sd=2.55 M=12.23
Sd= 4.23 .02 .88
D_LEN3 M=3.60 5
Sd=1.92 M=4.97 5
Sd=2.38 M=3.23
Sd=4.13 M=4.13
Sd=1.37 .25 .62
M_LEN3 M=.41 Sd=.09
M=.42 Sd=.10
M=.34
Sd=.07 M=.34
Sd=.05 .11 .74
V_LEN3 M=.04 Sd= .02
M=.06 Sd= .03
M=.04
Sd= .02 M=.04
Sd=.02 2.04 .16
Table 2.20 Differences between Hc and Pt divided in low (low-L) and high (high-L) educational level, for to lengthening independent from the position in the word (LEN0), in the beginning of the word (LEN1), in the middle of the word (LEN2), at the end of the word (LEN3). 1 F(1,56)= 6.52 p=.013- 2 F(1,56)= 4.91 p=.031 - 3 F(1,44)= 4.42 p=.041 - 4 F(1,56)= 4.20 p=.045 - 5 F(1,56)=
4.43 p=.040
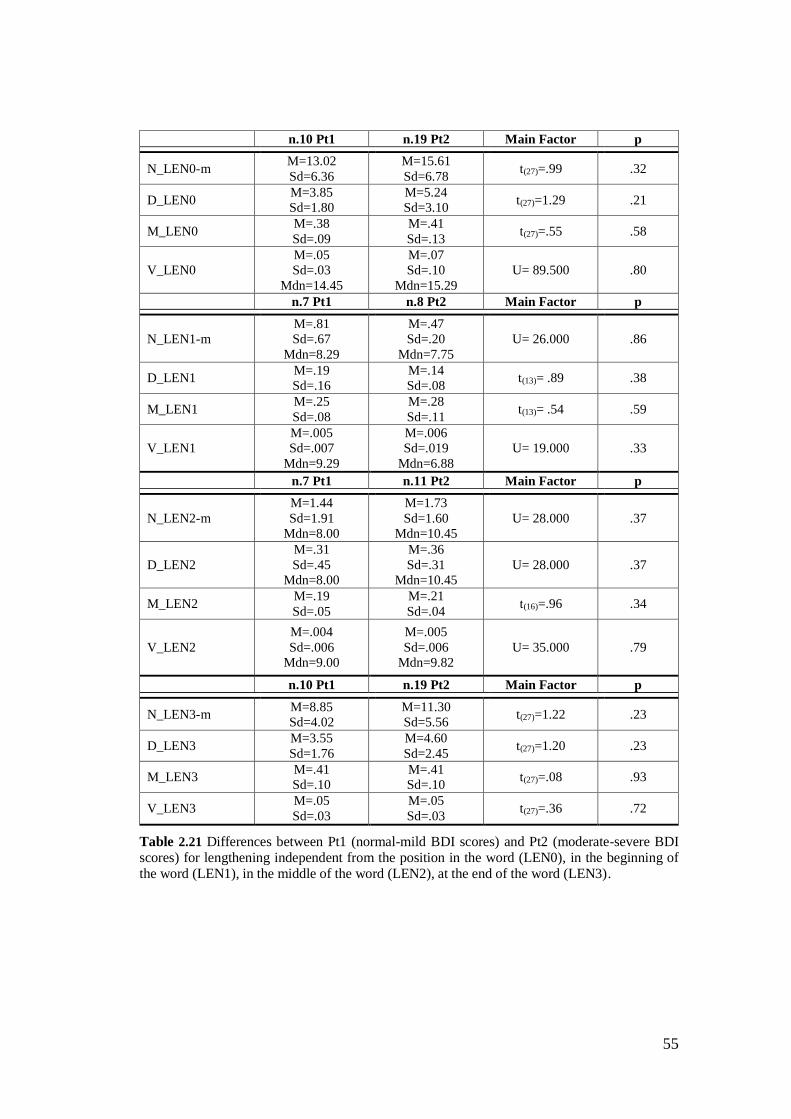
55
n.10 Pt1 n.19 Pt2 Main Factor p
N_LEN0-m M=13.02
Sd=6.36
M=15.61
Sd=6.78 t(27)=.99 .32
D_LEN0 M=3.85
Sd=1.80
M=5.24
Sd=3.10 t(27)=1.29 .21
M_LEN0 M=.38
Sd=.09
M=.41
Sd=.13 t(27)=.55 .58
V_LEN0
M=.05
Sd=.03
Mdn=14.45
M=.07
Sd=.10
Mdn=15.29
U= 89.500 .80
n.7 Pt1 n.8 Pt2 Main Factor p
N_LEN1-m
M=.81
Sd=.67
Mdn=8.29
M=.47
Sd=.20
Mdn=7.75
U= 26.000 .86
D_LEN1 M=.19
Sd=.16
M=.14
Sd=.08 t(13)= .89 .38
M_LEN1 M=.25
Sd=.08
M=.28
Sd=.11 t(13)= .54 .59
V_LEN1
M=.005
Sd=.007
Mdn=9.29
M=.006
Sd=.019
Mdn=6.88
U= 19.000 .33
n.7 Pt1 n.11 Pt2 Main Factor p
N_LEN2-m
M=1.44
Sd=1.91
Mdn=8.00
M=1.73
Sd=1.60
Mdn=10.45
U= 28.000 .37
D_LEN2
M=.31
Sd=.45
Mdn=8.00
M=.36
Sd=.31
Mdn=10.45
U= 28.000 .37
M_LEN2 M=.19
Sd=.05
M=.21
Sd=.04 t(16)=.96 .34
V_LEN2
M=.004
Sd=.006
Mdn=9.00
M=.005
Sd=.006
Mdn=9.82
U= 35.000 .79
n.10 Pt1 n.19 Pt2 Main Factor p
N_LEN3-m M=8.85
Sd=4.02
M=11.30
Sd=5.56 t(27)=1.22 .23
D_LEN3 M=3.55
Sd=1.76
M=4.60
Sd=2.45 t(27)=1.20 .23
M_LEN3 M=.41
Sd=.10
M=.41
Sd=.10 t(27)=.08 .93
V_LEN3 M=.05
Sd=.03
M=.05
Sd=.03 t(27)=.36 .72
Table 2.21 Differences between Pt1 (normal-mild BDI scores) and Pt2 (moderate-severe BDI scores) for lengthening independent from the position in the word (LEN0), in the beginning of the word (LEN1), in the middle of the word (LEN2), at the end of the word (LEN3).
56
Overall, the results indicate that Pt and Hc do not differ for the frequency and duration
of lengthening, while they significantly differ for the mean size (M_LEN0), that is
longer for Pt than Hc. However, analysing the lengthening according to the position
in the words, it emerges that the difference for M_LEN0 is due to the longer M_LEN3
for Pt than Hc, while opposite results are found for M_LEN2.
In addition, the M-LEN2 is affected by the educational level for Hc (but not for Pt),
while this effect is noted for Pt with respect to D_LEN0, V_LEN0, D_LEN3 and N-
LEN3-m. The same trend is for Hc educational classes, even though the differences
are not significant.
2.3.7 Discussion of the reported results
In this first part of the present study, reading (Tale) and spontaneous speech (Diary)
tasks have been administered to 30 depressed patients (Pt) and 30 healthy subjects
(Hc) matched for gender, age, educational level, marital status and employment. The
goal was to analyse several prosodic features (see par. 2.3.5) comparing the two
groups not only with respect to the presence/absence of Depression, but also
considering the possible effect of educational level (low-L and high-L) of both
groups, and the Depression degree (absence or mild depressive symptoms [Pt1]) and
moderate-severe depressive symptoms [Pt2]) of the Pt group. Tale and Diary have
been analysed separately.
2.3.7.1 Tale
From Tale recordings the following parameters (measurements) have been extracted:
1) SIG (the total duration of recordings including speech and silences); 2) Pho_T (the
total duration of subject’s speech without empty pauses); 3) N_EP (total number of
silent pauses); 4) D_EP (the total duration of silent pauses; 5) M_EP (the ratio
between D_EP and N_EP); V_EP (the variance of M_EP). The analysis of these
parameters reveals that changes in the total duration of patients’ speech (SIG) are
57
caused by both phonation time (Pho_T) and empty pause duration (D_EP). However,
the changes of these two parameters depend on the interaction between depressive
symptoms and educational level. Indeed, the between group analysis shows that when
Pt have a high education (high-L), comparing them with Hc with the same
educational level, the changes in reading activity engendered by depressive
symptoms are significant: the reading speed becomes slower (Pho_T: p=.031) and
the duration of pauses is lengthened (D_EP; p=.002). This is not the case for Pt with
low education (low-L; p>.05).
The within group analysis reveals that the differences between Hc with low and high
education for Pho_T and D_EP is statistically significant (p<<.000 and p=.002
respectively) demonstrating that for healthy people the timing parameters of reading
strongly depend on the educational level: healthy subjects with low education are
slower, with more and longer pauses than those with high education. Indeed, in the
case of Pt with low education, even though this effect is present, does not clearly
emerge comparing them with patients with high education level (p<.05). Therefore,
considering separately the performance of the two groups (Pt and Hc), it emerges that
in the case of clinical group, the depressive symptoms “attenuate” the differences
between patients with high and low education; in the case of control group, the
absence of Depression allows to clearly detect the differences between subjects high
and low education.
The Tale results agreed partially with those of Vicsi et al. (2013) who used the same
reading task on a sample of 21 Hungarian depressed patients. Even though the study
does not take into account the educational level, the authors found longer pauses for
Pt than Hc, but not for phonation time. Opposite results have been reported by
Esposito et al. (2016) on a sample of 12 Italian depressed, and Liu et al. (2017) on a
sample of 92 Chinese depressed, using the same reading task of the present study.
The authors, comparing clinical and healthy subject groups, did not find differences
about pauses and phonation time.
Overall, the present results confirm that phonation and pause timing parameters are,
in general, good markers of Depression, even though they could vary according to
58
other subjects’ characteristics, e.g. educational level (see par. 2.3.6.2), gender (see
Vicsi et al., 2013), kind of disorder (e.g. MDD, BP; see Hofmann, 1995) and
treatment phase (e.g. pre-post treatment; see Nilsonne, 1986). In this study the
Depression degree has also been considered to find possible differences between
patients in acute (i.e. with moderate-severe symptoms) and in remission phase (i.e.
with absence or mild symptoms). Nevertheless, the analysis failed to find differences
between the two clinical subgroups (Pt1 and Pt2) indicating that the differences
between them, if any, are too weak to be observed with the present data.
2.3.7.2 Diary
Several features have been extracted from Diary recordings: empty pauses (EP), filled
pauses (FP), lengthening (LEN), clauses (CLA), total speech duration (ToT_T),
phonation time (Pho_T), speaking rate (SR) and number of false starts (FS).
Phonation time. From the present analysis it emerges that Pt and Hc have similar
(p>.05) total speech duration (Tot_T, including both utterances and silences). In
addition, Pt do not pronounce more words per minute (SR) than Hc (p>.05). However,
contrarily to the reading task, the phonation time (Pho_T) is slightly shorter for Pt
than Hc (p=.046). A possible explanation of such results could derive from the
characteristics of the two clinical subgroups (Pt1 [with absence or mild depressive
symptoms] and Pt2 [with moderate-severe depressive symptoms]): it is the Pt2
subgroup to have shorter phonation time that Hc, while for Pt1 the parameter is
slightly longer than Hc (mean Hc=177.39; mean Pt1=190.87; mean Pt2=142.66). The
shorter phonation time of Pt2 could be due to the psychomotor agitation, as
demonstrated by the answers regarding agitation, tension, anxiety and difficulty to
relaxing reported by patients to BDI-II and DASS-21 (see Table 2.6). According to
the BDI-II and DASS-21 scores, Pt2 shows high level of psychomotor agitation with
respect to Pt1.
59
Finally, differently from Tale, in the Diary narratives, comparing Pt and Hc for the
educational level (low-L and high-L), no significant differences emerge (p=.19).
Hence, even though phonation time of both kind of speech (reading and spontaneous
speech) is influenced by the dominant affective state, in the case of reading, this effect
changes according to the educational level, contrarily to the spontaneous speech.
Overall, the present data give an additional contribution to most of studies that found
changes in phonation time and its correlation with psychomotor retardation in
depressed subjects (see par. 2.2). According to the present results, phonation time is
shorter in patients with moderate-severe Depression than those with absence or mild
depressive symptoms and healthy subjects. This difference is probably due to the
psychomotor agitation. In addition, the changes of this parameter are not related to
the educational level. Considering such characteristics of phonation time - i.e.
independence from the education variable and relation with psychomotor
retardation/agitation (that is one of the main attributes of Depression) - it can be
considered a good candidate for objective, quick and non-invasive measurement of
depressive states.
Clauses. Despite the shorter phonation time in Pt than Hc, data show that clauses of
Pt are longer in terms of mean length (M_CLA; p=.010) than Hc, although they
pronounce less clauses per minute (N_CLA-m; p=.046).
The difference between phonation time and clauses is that the first one contains words
and disfluencies (i.e. clauses, filled pauses, lengthening, crying and laughter), while
in the case of clauses only the words pronunciation have been considered. It is
possible that when only the words are considered (instead of measure both words and
dysfluencies), there is an effect of pronunciation time, slower for Pt.
Empty pauses. The empty pause total duration (D_EP) is longer for Pt than Hc
(p=.003). In addition, this result depends on the interaction between depressive
symptoms and educational level. Pt with high education, compared with Hc with the
same educational level, reported significantly longer D_EP (p=.023). The same trend
is observed for Pt with low education, although differences with Hc are not
60
statistically significant (p>.05). The within group analysis shows that there are
significant differences between low and high education classes, for both Pt (p=.041)
and Hc (p=.014): low-L classes report longer D_EP than high-L classes. The data
demonstrate that the empty pause total duration is a parameter affected by the
education variable in both groups (Pt and Hc).
Finally, the data show that Pt significantly differ from Hc for both mean length
(M_EP) and variation (V_EP) of pauses, independently from the educational level:
the length of pauses is longer for Pt than Hc (p<<.000), but they also have more
variability with respect to the mean value (p=.013). It is possible that the different
kind of Depression (i.e. MDD, BD, ENDO-R, AD), of which the patients involved in
the present study suffer, determines a greater variability of pause characteristics
compared to that of Hc.
Overall, the data about empty pauses duration (D_EP) agree with most of the reported
results in literature (see par. 2.2) providing evidences about longer pauses duration
for depressed patients. Considering that studies recruited patients with different
clinical characteristics, the agreement among most of them, indicates that the pause
timing can be considered a good marker of speech changes caused by depressive
symptoms. However, to our knowledge, this is the first study that has considered the
educational level as well. In both tasks (Tale and Diary) it was found that there is a
Depression and educational level interaction effect. In the case of depressed with high
education, comparing with Hc with the same educational level, the pauses duration is
significantly longer, while comparing Pt and Hc with low education, although there
is the same trend, the differences between the two groups are not significant.
Regarding the possible explanation of change in pauses timing in depressed subjects,
as previously discussed (see par. 1.2), three hypotheses have been suggested in
literature (Ellgring & Scherer, 1996; Siegman, 1987). The psychomotor retardation
hypothesis postulates the changes in speech production are caused by a generalized
impairment of motor systems. On the other hand, the cognitive hypothesis assumes
the deficits in attentional and planning processes antecedent to speech production,
61
rather than motor behaviour impairments, engender the increase in number and
duration of pauses. Finally, the socio-emotional hypothesis argue that the dominant
emotional states or traits affect the speech characteristics (i.e. sadness can engender
slowing speech rate and longer pauses, while anxiety increases the speech rate). In
the present study, considering that Pt1 have normal-mild scores for agitation, tension
and anxiety symptoms, while Pt2 reported moderate-severe degree of them, it is
possible that the longer pauses in the clinical group (Pt) could not related with
psychomotor retardation. According to the cognitive assumption, they could be
related with other cognitive impairments involved in depressive states (e.g.
attentional and concentration capability) or impairments in decision-making process.
According to socio-emotional theory, the two clinical subgroups (Pt1 and Pt2), which
differ for the degree of depressive symptoms, should have shown differences in
speech parameters because of differences in the dominant emotional states (e.g.
sadness or anxiety). However, this is not the case of the present data. One possible
explanation is that, even though patients with different clinical phase (e.g. acute and
remission phase) differ for the dominant emotions, they have similar personality traits
(e.g. depressive and anxiety traits) that could affect the speech characteristics
(Scherer K.S., 1979; Furnham, 1990; Pianesi et al., 2008), independently from the
active and dominant affective states.
Filled pauses. In agreement with Lott et al. (2002) and Esposito et al. (2016), in the
case of filled pauses, Pt and Hc do not show differences for the total duration (D_FP;
p>.05). However, differences emerge for the mean length of fillers (M_FP) according
to the educational level. Pt with low education have longer M_FP than Hc with the
same educational level (p=.036), while this is not the case for high education classes
(p>.05). Finally, Pt1 and Pt2 do not differ (p>.05) for this parameter (as for empty
pauses, and on the contrary of phonation time).
Fillers are considered a hesitation phenomenon in which the speaker is uncertain
about to what she/he is saying, so she/he takes time to build the next part of the
speech, preventing interruptions from the interlocutor (Clark & Tree, 2002). From
62
this point of view, filled pauses and empty pauses could involve a planning process
reflecting the effort to decide what saying to continuous the conversation. The within
group analysis show that the mean length of empty and filled pauses is similar for
both Pt and Hc, while the between group analysis report that the two parameters are
longer for Pt than Hc. These results may suggest that the cognitive processes involved
in empty and filled pauses could be, at least partially, overlapping.
Finally, filled pauses results (as empty pauses data) suggest again the importance to
consider the educational level. If it is assumed that filled pauses are connected by
planning and decision-making processes (Chafe & Danielewicz, 1987), depressed
with low education seem to have more impairments in those processes, or need more
time to plan the answer, while in the case of depressed with high education, the
education variable may “compensate” the effect of depressive symptoms.
Lengthening. This feature has been analysed in two conditions: 1) independently
from the position in a word (LEN0) and 2) discriminating the lengthenings in the
beginning (LEN1), in the middle (LEN2) and at the end (LEN3) of a word.
The most robust parameter to discriminate between Pt and Hc is the average size of
lengthening (M-LEN). If the position in the words is not considered, the average size
is longer for Pt than Hc. However, the analysis of this parameter according to the
position (middle and final), shows that Pt have shorter LEN2 and longer LEN3 with
respect to the Hc, independently from educational level. Also considering the within
group analysis, the M_LEN2 is shorter than M_LEN3 for Pt, while the opposite
results are for Hc.
Lengthening has been investigated especially at the final position of the words
(Cooper & Danly, 1981; Lindblom, 1978; Smith & Hogan, 2001) and it was
suggested to be a hesitation phenomenon about what saying, probably connected to
planning and decision-making function, as fillers and some kind of empty pauses
(Vaissière, 1983; Betz et al., 2015). Assuming this hypothesis, the present data seem
to suggest that healthy subjects, on the contrary of depressed, tend to anticipate the
planning of the next part of the speech: they start to think already during the
63
pronunciation of the words (lengthening at the middle), spending more time in this
point to plan the speech, rather than waiting the end of the words (lengthening at the
ending). The opposite process appears to be for Pt.
2.3.8 Conclusions
The present study shows that the duration of both phonation ad empty pauses appears
to be a robust marker of Depression in both automatic (Tale) and spontaneous speech
(Diary), even though their values are also affected by the educational level of the
speaker. The average length of all the investigated features can also be considered a
robust marker of voice changes in depressive states. However, only in the case of
filled and empty pauses the average length is affected by the educational level. Given
these results, future works should also take into account the education, to analyse
possible interaction effects between Depression and education that can attenuate or
amplify the changes in speech production. Indeed, the present analysis fail to find
significant differences between patients in acute (with moderate-severe Depression)
and remission (without or with mild Depression) phases. One possible explanation
for such result is the group size, which is too small and does not allow the detecting
of “subtle” differences between the two groups. However, it is also possible that the
absence of differences in the values of the investigated speech parameters are due to
the fact that, even though acute and remissive patients differ for the severity of
depressive symptoms, they have similar personality traits which may affect the
speech parameters (Scherer K.S., 1979; Furnham, 1990; Pianesi et al., 2008).
In this study, it was found that depressed patients are slower and with longer empty
pauses in reading activity. While, in the spontaneous speech the phonation time tend
to be shorter for patients with moderate-severe Depression probably because of
psychomotor agitation. Finally, the length of clauses, empty pauses, fillers and
lengthening in the spontaneous speech tend to be longer, probably because of
impairments in planning and decision-making processes. From these data, it seems
evident that each parameter may reflect different impairments in depressive states
64
and it is not possible to interpret them according to a general impairment of
psychomotor system. A more complex system, involving physical, emotional and
cognitive functions, is necessary to consider for better understanding the speech
changes in Depression.
65
3 Verbal behaviour analysis in Depression
3.1 Introduction
The verbal behaviour analysis allows to investigate both the content (what is said, i.e.
the nouns) and the linguistic style (how it is said, e.g. pronouns, prepositions, articles)
of speech (Tausczik & Pennebaker, 2010). These two aspects could reflect cognitive
patterns (e.g. self-focus, pessimism, low self-esteem [Beck et al., 1996; Young et al.,
2003]), and emotional states (e.g. anger, anxious, sadness) that are dominant and/or
maladaptive in depressive disorders. The clinical practise of psychologists and
psychiatrists is based on the analysis of thoughts and emotions expressed by patients
through speech. Of course, in this case, the physician does not quantify what the
patient said. Its examination is based on a qualitative analysis of emotional and
cognitive processes expressed by the conversation. A scientific and systematic
approach to analyse the verbal behaviour can provide a reliable quantification of
several speech characteristics connected to affective and cognitive aspects. The
approach does not only allow objective and reproducible speech measurements useful
for the diagnosis, but can also help the improvement of diagnostic skills during the
physicians’ training through the analysis of speech pattern typical of mental
disorders. Given this premise, the first goal of the present part of the research project
is to investigate the speech content of depressed patients through a computerized text
analysis (Linguistic Inquiry Word Count [LIWC]: (Pennebaker et al., 2001, 2003;
Tausczik and Pennebaker, 2010) that classifies the words of a give text in several
categories (e.g. affective, cognitive, linguistic, etc.). Using the same method, the
second goal is to analyse the speech content in subjects with and without Early
Maladaptive Schema (EMS) regardless of depressive symptoms. In the next
66
paragraphs the literature results regarding speech content analysis in depressive
subjects and the present research project (dataset, statistics analysis and results) will
be described.
3.1 Literature results
Given that Depression is especially characterized by negative emotions and loss of
interest (or pleasure) towards the external environment (DSM-5; ICD-10), most of
studies have investigated verbal characteristics that could reflect these characteristics
of Depression. For instance, the sentiment analysis allows to examine the prevalence
of positive and negative emotional words in the text, while the frequency of first
personal pronouns can give information about the tendency to self-focusing and the
disengagement from social environmental stimuli.
Bucci & Freedman (1981) analysed the spontaneous speech of 5 elderly females
depressed patients. They found that depressed, compared to control subjects, use
significantly more the first and less the second and third person singular pronouns. In
addition, they tend to focus more on their own subjective reactions (feelings), rather
than objective details when they describe an experience. Oxman et al. (1988) tried to
discriminate among patients with somatization disorder (n. 17), paranoid disorder (n.
25), cancer (n.17) and major Depression (n.12) through the content analysis of a
spontaneous speech task in which the participants had to talk about hobbies, work,
past events, etc. They used the General Inquirer (Stone et al., 1966), a computerized
text analysis that classifies the words in categories, such as distress, work, family,
etc. The authors found that the tool correctly classified 80% of the participants (83%
for depressed patients).
Weintraub (1989) conducted a systematic text analysis through a hand-counting of
people’s words in several texts (e.g. clinical interview) and found that the level of
Depression is linked to the use of first person singular pronouns (e.g. I, my, me). Lott
et al. (2002) tried to discriminate among schizophrenia (n. 43 patients), bipolar (n. 29
67
patients) and major Depression (n. 23 patients) disorders through the analysis of
linguistic abnormalities. They measured language and communicational
characteristics (such as poverty of speech, circumstantiality, loss of goal, illogicality,
etc.), fluency of speech (filled pauses, false starts, self-corrections), syntactic analysis
and cohesion (such as personal reference, verbal ellipsis, temporal conjunction, etc.).
They found that only illogicality (having a conclusion that does not follow from the
premises) and poverty of speech discriminate among the groups, while all the other
features failed for this purpose. The authors conclude that linguistic abnormalities
represent an “independent syndrome complex manifested at varying intensities
across mental illnesses” (p.220). Rude et al. (2004) investigated linguistic patterns
of undergraduate psychology students classified as currently-depressed (n.29),
formerly depressed (n.47) and never-depressed subjects (n. 67) according to BDI-II
(Beck et al., 1996). They were asked to write an essay in which they described their
deepest thoughts and feelings about coming to college. The words of the text have
been classified through the LIWC (Pennebaker et al., 2001) in four categories: use of
first person singular pronoun, negative and positive emotional words and social
references. They found that depressed students used significantly more the first-
person singular pronoun and negative emotional words than never-depressed
students. They did not find any significant differences between formerly and never-
depressed students. However, they also found that formerly depressed students use
more first personal pronoun than never-depressed ones only in the third segment of
the essay. The authors postulated that during the written task, the formerly-depressed
students became progressively more ensnared in self-preoccupations, while never-
depressed students became progressively more engaged in aspects not regarding
themselves.
In the last years, the quick development of social media has increased the interest
towards the linguistic analysis on social networks (like Twitter and Facebook) for
trying to detect speech characteristics of several mental disorders, that could be useful
for monitoring mental health conditions or to predict disease characteristics
(Ramirez-Esparza et al., 2008).
68
Park et al. (2012) investigated the correlation between depressive state and feelings
express through tweets of users classified as low-mild (n.41) and severe depressed
(n. 28) according to CES-D (Center for Epidemiologic Studies Depression Scale:
Lewinsohn et al., 1997). Through the LIWC tool, the affective categories were
analysed and it was found that severe depressed users group were more likely to
express negative than positive emotions. Participants with high education were less
likely to have Depression than those with lower education, while having a regular job
was linked with a significantly reduced likelihood of Depression. Finally, the
qualitative analysis showed that many tweets of the severe depressed group were
monologue addressed towards an unspecified audience. De Choudhury et al. (2013)
examined the tweets characteristics of users classified as depressed (n. 117) and non-
depressed (n.157) using the CES-D. They extracted features concerning the
emotional valence (positive, negative, activation and dominance), linguistic style
(personal pronouns, verbs, preposition, etc.), the time of posts, the engagements and
the number of followers. They found significant differences for most of them,
especially depressed show more negative emotional words, decrease in user
engagements (indicating a possible loss of social connectedness), lower number of
followers and following, more use of the first-person singular pronoun. Combining
all these features in an automatic classifier (Support Vector Machine), the author
reports an overall discrimination accuracy between the two groups of 73%. Wang et
al. (2013) analysed the linguistic characteristics of micro-blog posted by a group of
90 depressed and 90 non-depressed users previously diagnosed by psychologists.
They measured features concerning first and third personal pronouns, positive and
negative emoticons, interactions (times of mentioning others, times of when they
were forwarded and times of being commented) and time of posted blogs. When the
features are analysed separately, the total number of emotions and micro-blogs topics
are the most important markers to discriminate between depressed and non-
depressed, while the automatic classification with Weka (Waikato Environment for
Knowledge Analysis: Garner, 1995) using all the features, reports 80% of precision.
(Nguyen et al., 2014) investigated affective and content characteristics of several
69
online communities on Depression. They extracted information concerning words
and tags expressing feelings and mood, the forum topics and psycholinguistic
categories using ANEW (Affective Norms for English Words: Bradley & Lang,
1999) and LIWC. The feature selection method, based on regularized regression
model, reports a precision accuracy of 100% combining words mood, forum topics
and LIWC categories. While analysing separately each ANEW and LIWC feature,
they found that the clinical group use more words with negative connotations and low
valence: anxiety, anger and sadness words are positive predictors of Depression. In
addition, the forum topics of depressed users are related to depressive disease (such
as suicide, death and self-harming). Ramirez-Esparza et al. (2008) examined
linguistic markers of Depression using 160 posts from depression forums and 160
posts from breast cancer forums. They analysed the text with LIWC and, in line with
other studies, found that depressed users use more first-person singular pronoun and
negative emotion words than non-depressed users.
Overall, studies agree that both oral and written speech of depressed people are
especially characterized by negative emotional words and first singular pronouns.
This is in line with the self-focused attention theorization (Ingram, 1990), according
to which Depression is characterized by an excessive focus on own thoughts and
emotions. The self-focus attention is defined as “an awareness of self-referent
internally generated information that stands in contrast to an awareness of externally
generated information derived through sensory receptors” (Ingram 1990 p.156).
Carver & Scheier (1990, 1996) postulated the self-focus regularly negative feedback
cycle: the self-focused attention engenders a self-evaluation process when a
behavioural standard is salient for the person. In this case, the current status and the
standard (or aspiration) are compared. If the subjective probability of successful
discrepancy reduction is high, the person continues to compare the current and the
standard status until the discrepancy is eliminated and positive emotions are
experienced. Contrarily, if the subjective probability to reduce the discrepancy is low,
the person withdraws from further efforts to reduce such discrepancy. In this last case,
the failure to achieve the standard engender negative emotions.

70
Pyszczynski & Greenberg (1987) theorized that the main characteristic of Depression
is a depressive self-focusing style. The self-focus attention in the depressive disorder
is increased by stressful life events or losses. When they occur, the person is unable
to accept the loss because of its central importance for emotional security, identity
and self-esteem. The impossibility to accept a loss causes a failure in the
disengagement from the self-focus, perseverating in a constant confrontation between
the current status and what is expected. Individuals stuck in this cycle of constant
confrontation without resolving it, often develop a depressive self-focusing style:
they focus on themselves when negative events occur, while avoid such focus
following positive events. The depressive self-focusing style intensifies the negative
emotions and leads to increased salience of negative aspects of themselves In
addition, the self-focusing attention affects other cognitive and behavioural domains
(e.g. it discourages an increase in self-esteem and motivation after positive outcomes;
Pyszcynski & Greenberg, 1987).
Lewinsohn et al. (1980) postulated that extreme negative emotions and disruption of
daily activities caused by stressful events increase the self-focus attention that in turn
encourages several depressive symptoms (e.g. negative emotions and self-criticism).
Other theorists (Williams et al., 1990; Beck, 2002; Young et al., 2003) underlie the
role of dominant negative automatic thoughts (most of which focused on one self) in
the development and maintenance of Depression, and postulate a link between them
and negative emotions. The meta-analysis of Mor & Winquist (2002) confirmed a
strong relationship between depression and private self-focus that “reflects private,
autonomous, egocentric goals that did not necessarily require one to consider others’
reactions to what one is doing” (Carver & Scheier, 1981, p. 527).
Pyszcynski & Greenberg (1987) also found that the self-focusing bias partially
mediates the pessimism about future life events. In their experiment, subjects were
asked to write a short story using a list of words. There were the self-focus condition
and external focus condition (in which a writing on Abraham Lincoln was asked). It
was found that in the self-focus condition, depressed subjects rated negative events
as more likely to happen to themselves than controls did. In the external-focus
71
condition, depressed subjects were no more pessimistic than non-depressed subjects
in these ratings. These results agreed with the Beck’s theory (2002) assuming that
depressed subjects are characterized by a negative view about the oneself, and the
future and others. The Back’s theorization underlies the depressive tendency for
selective focus on past events as well (Kovacs & Beck, 1979).
According to the literature and main theories of Depression above reported, in the
second part of this project, the speech content will be investigated with the
expectation that depressed differ from healthy subjects for several linguistic
categories, such as: more use of the first personal pronoun and verbs referred to the
first personal pronoun, and less use of plural pronouns (that could reflect the self-
focusing attention); more use of past instead of present and future tense (that could
reflect the tendency to focus on past personal events) and less references to social
activities (that could reflect the loss of pleasure towards daily activities). The possible
differences between depressed in acute and remission phases will be also
investigated. In addition, considering that subjects express their dominant negative
thoughts and emotions through speech (Beck 2002; Young et al. 2003), several Early
Maladaptive Schemas and their relation with the verbal content will be investigated.
The texts will be analysed with the Linguistic Inquiry Word Count (LIWC,
(Pennebaker et al., 2001, 2003; Tausczik & Pennebaker, 2010), a computerized word
counting tool focused on words linked to emotional and cognitive processes.
Pennebaker has carried out several studies (see for example Pennebaker, 1993;
Stirman, James, & Pennebaker, 2001; Pennebaker et al., 2003) about the relation
between verbal speech and traumatic events using LIWC, finding that oral, written
and speaking activities reflect elements linked to emotional expressions and cognitive
processes.
72
3.2 The present research project
The aim of the present study is to investigate the verbal speech behaviour, that could
reflect several emotional and cognitive aspects, in patients affected by Depression.
The first goal is to investigate differences in speech content between healthy and
depressed subjects. The second goal is to evaluate if there are differences between
acute and remitted depressed patients with respect to the investigated verbal
categories. Finally, given that through the verbal behaviour people express their
dominant emotional and cognitive processes, the third goal is to investigate if subjects
with and without Early Maladaptive Schemas (EMS, see below) differ for several
speech contents reflecting such processes.
3.2.1 Participants and Experimental set-up
For this part of the project, the texts of the spontaneous speech task described in
Chapter 2 (see par. 2.3.2) have been used. Characteristics of depressed (Pt) and
healthy (Hc) groups are described in par. 2.3.6.1.
They are 30 Pt [21 females; mean age 45.10; Sd=±13.07] and 30 Hc [21 females;
average age 43.33; Sd=±13.41]. For socio-demographic data of the two groups see
Figure 2.1.
BDI-II (see Table 2.2) was used to distinguish between depressed in remission phase
(normal-mild BDI scores; Pt1) and those in acute phase (moderate-severe BDI scores;
Pt2), while YSQ-s3-36 was used to measure 12 Early Maladaptive Schema (EMS;
Young et al., 2003) in both patients and healthy subjects:
Emotional Deprivation (ED): concerns the expectation and desire to receive
emotional support (e.g. absence of attention, understanding or guidance from
others) by others.
Abandonment (AB): the perception that significant others will not continue to
provide emotional support or practical protection because they are instable or
unreliable.
73
Defectiveness/Shame (DE): the feeling to be inferior, bad, unwanted, invalid,
defective or unlovable to significant others. May involve hypersensitivity to
criticism, rejection, blame, and sense of shame.
Social Isolation (SI): the feeling to be isolated from the rest of the world, different
from others, and/or not being part of any group or community.
Enmeshment (or undeveloped Self, EM): the excessive emotional involvement
with one or more significant others, at the expense of normal social development.
Failure to achieve (FA): the belief that it is inevitable to fail or to be inadequate
with respect to other people in area like school, job, sports, etc.
Self-Sacrifice (SS): the excessive focus on meeting the needs of others, at the
expense of one's own gratification, to prevent causing pain to others, avoid guilt,
maintain the connection with others perceived as needy, or for an acute sensitivity
to others’ pain.
Emotional Inhibition (EI): the excessive inhibition of spontaneous feelings to
avoid others’ disapproval, feelings of shame or losing the impulse control. The
inhibition usually regards anger, positive impulse (as happiness, sexual
excitement), difficulty to communicate feelings and needs or expressing
vulnerability.
Insufficient self-control (IS): the difficulty or the refusal to exercise sufficient
self-control and frustration tolerance to achieve personal goals or to limit the
excessive expression of impulses and emotions.
Approval Seeking (AS): the excessive focus on gaining approval and attention
from other people.. The self-esteem depends on the others’ reaction and the
person gives importance to money, achievement, status or appearance to obtain
admiration or attention.
Negativity (NA): the excessive focus on negative aspects of life (like loss,
mistakes, pain) and the minimization of positive things. Generally, it implicates
the expectation that things will go wrong or the fear of making big mistakes.
74
Punitiveness (PU): the belief that the person should be punished for making
mistakes. Usually it includes difficulty forgiving mistakes of oneself or others,
and tendency to be angry, intolerant and impatient with people who do not meet
one’s expectations or standards.
3.2.2 The measurements
The texts have been extracted using the first tier of PRAAT transcription (see Figure
2.3). Given that fillers and lengthening have been already analysed in the previous
part of the research (see Chapter 2), these features have been excluded. Hence, only
words are considered for the present analysis. The text has been analysed through the
LIWC tool (Pennebaker et al. 2001, 2003; Tausczik & Pennebaker, 2010) that
classifies the words in several categories. There are 4 main dimensions: Linguistics,
Psychological Processes, Relativity and Personal contents. Each dimension contains
some sub-dimensions (e.g. Psychological Processes dimension contains affective,
emotional, cognitive, perceptive, sensorial and social processes). Each sub-dimension
contains several categories (e.g. cognitive process contains causation, inhibition,
etc.). The Linguistics dimension especially contains pronouns and verb tenses that
can give information about attentional allocation (internal feelings or external worlds)
and temporal focus of attention (past, present or future). The Psychological Processes
dimension gives information about the dominant emotions and feelings (degree and
valence), cognitive processes (they can reflect different cognitive mechanisms like
reappraisal, insecurity about the topic) and social relationships (reflecting how much
the person is engaged in social relations). Relativity dimension contains information
about the attention towards external space, movements and time. Finally, the personal
concerns dimension can give information about the person’s interest towards jobs,
pleasure activities, physical states and general topics like religion, money, death. The
output of the analysis is a file in which are indicated, for each text, the percentage of
words belonging to each category. Each word can be located in more categories, for
example, the word “go” is located in Verb and Movement categories. For the present
75
study, the Italian version validated by Alparone et al. (2002) using the LIWC2007, is
used. The vocabulary of Italian version contains around 2800 words. For the list of
all categories see Table 3.2.
3.2.3 Data Analyses
The percentage of words belonging to each LIWC category is used as dependent
variable. To test the differences between Pt and Hc with respect to the LIWC
categories, Two sample t-Tests have been performed when the assumptions
hypotheses (see par. 2.3.6) have been respected, contrarily, Mann-Whitney U test
have been carried out. Results are displayed in Table 3.2.
To test the differences between patients with normal-mild BDI scores (Pt1, remission
phase) and moderate-severe BDI scores (Pt2, acute phase), Two sample t-Tests have
been performed when the assumptions hypotheses have been respected, contrarily,
Mann-Whitney U test have been carried out. Results are displayed in Table 3.3.
Mann-Whitney U tests have been carried out to test the differences between Pt and
Hc with respect the 12 scales of YSQ-s3-36. Results are reported in Table 3.1. Given
that Pt and Hc do not significantly differ for any of such schema, all subjects have
been distinguished in those with Early Maladaptive Schema (EMS) and those without
Early Maladaptive Schema (No-EMS), independently from the depressive symptoms.
In addition, EMS group contains subjects with maladaptive schema independently
from the level of severity (mild, moderate, severe). To test the differences between
No-EMS and EMS with respect to the LIWC categories, Mann-Whitney U tests have
been carried out. Results are displayed in Table 3.4.
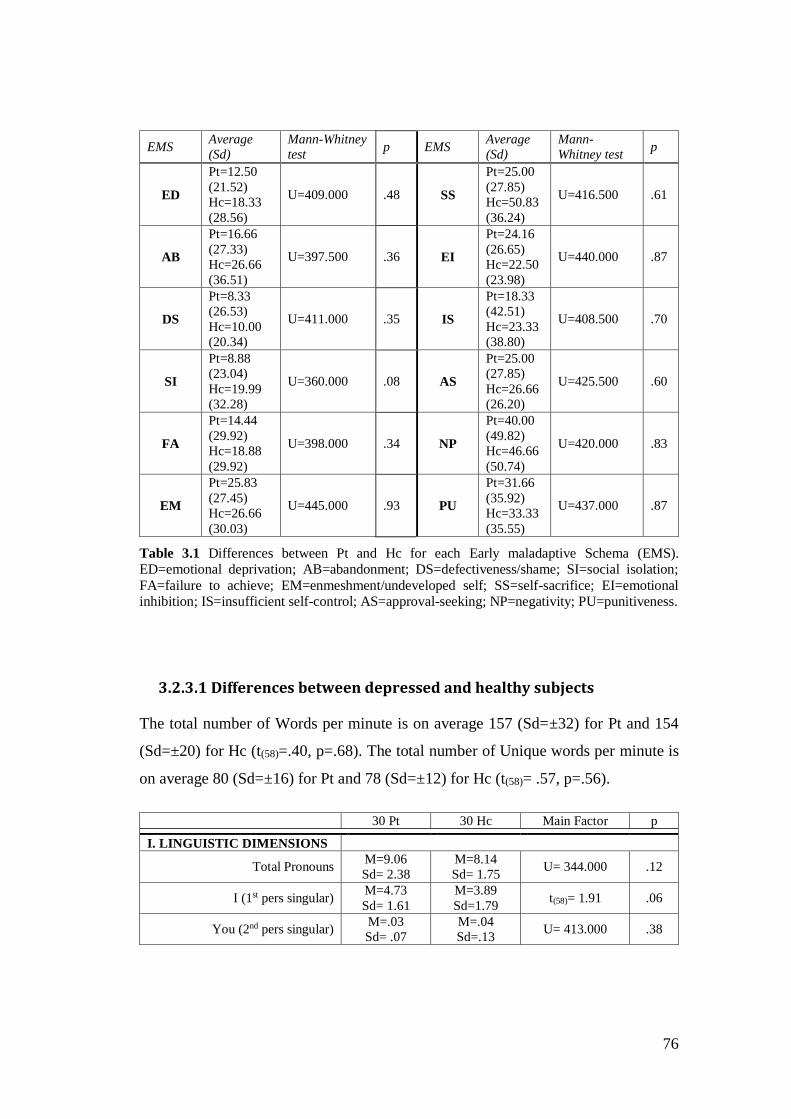
76
EMS Average
(Sd)
Mann-Whitney
test p EMS
Average
(Sd)
Mann-
Whitney test p
ED
Pt=12.50
(21.52)
Hc=18.33
(28.56)
U=409.000 .48 SS
Pt=25.00
(27.85)
Hc=50.83
(36.24)
U=416.500 .61
AB
Pt=16.66
(27.33)
Hc=26.66
(36.51)
U=397.500 .36 EI
Pt=24.16
(26.65)
Hc=22.50
(23.98)
U=440.000 .87
DS
Pt=8.33
(26.53)
Hc=10.00
(20.34)
U=411.000 .35 IS
Pt=18.33
(42.51)
Hc=23.33
(38.80)
U=408.500 .70
SI
Pt=8.88
(23.04)
Hc=19.99
(32.28)
U=360.000 .08 AS
Pt=25.00
(27.85)
Hc=26.66
(26.20)
U=425.500 .60
FA
Pt=14.44
(29.92)
Hc=18.88
(29.92)
U=398.000 .34 NP
Pt=40.00
(49.82)
Hc=46.66
(50.74)
U=420.000 .83
EM
Pt=25.83
(27.45)
Hc=26.66
(30.03)
U=445.000 .93 PU
Pt=31.66
(35.92)
Hc=33.33
(35.55)
U=437.000 .87
Table 3.1 Differences between Pt and Hc for each Early maladaptive Schema (EMS). ED=emotional deprivation; AB=abandonment; DS=defectiveness/shame; SI=social isolation;
FA=failure to achieve; EM=enmeshment/undeveloped self; SS=self-sacrifice; EI=emotional inhibition; IS=insufficient self-control; AS=approval-seeking; NP=negativity; PU=punitiveness.
3.2.3.1 Differences between depressed and healthy subjects
The total number of Words per minute is on average 157 (Sd=±32) for Pt and 154
(Sd=±20) for Hc (t(58)=.40, p=.68). The total number of Unique words per minute is
on average 80 (Sd=±16) for Pt and 78 (Sd=±12) for Hc (t(58)= .57, p=.56).
30 Pt 30 Hc Main Factor p
I. LINGUISTIC DIMENSIONS
Total Pronouns M=9.06
Sd= 2.38
M=8.14
Sd= 1.75 U= 344.000 .12
I (1st pers singular) M=4.73
Sd= 1.61
M=3.89
Sd=1.79 t(58)= 1.91 .06
You (2nd pers singular) M=.03
Sd= .07
M=.04
Sd=.13 U= 413.000 .38
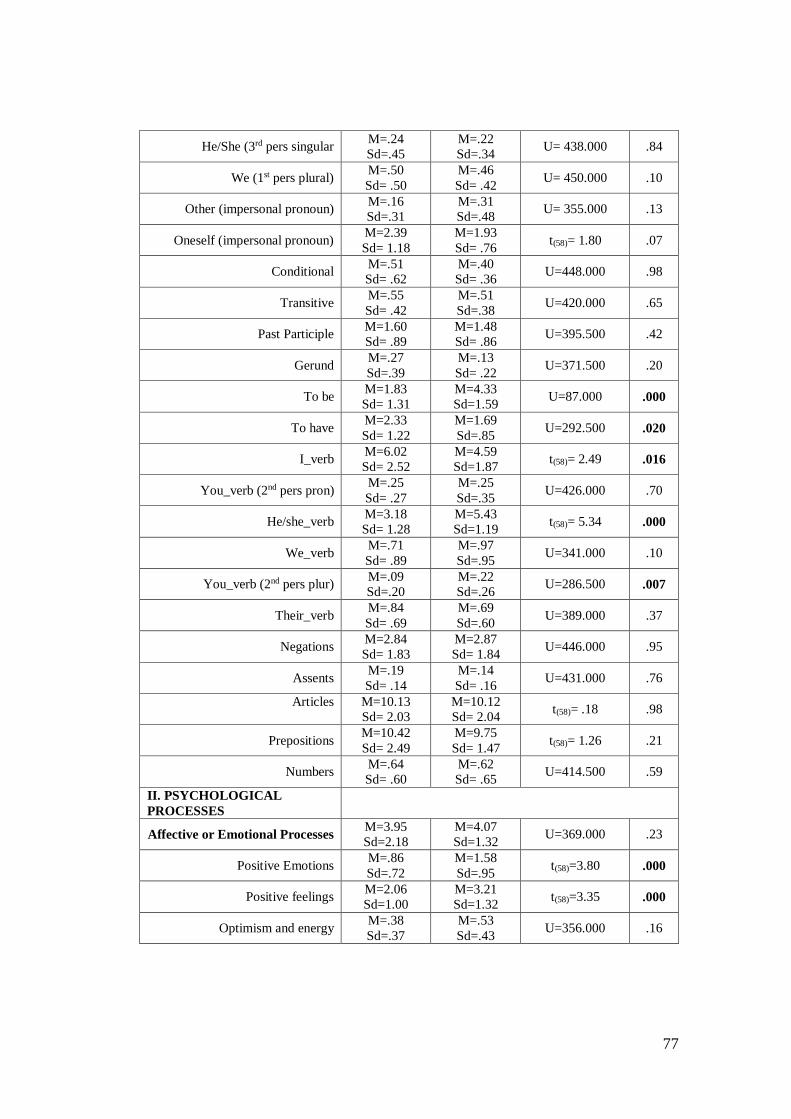
77
He/She (3rd pers singular M=.24
Sd=.45
M=.22
Sd=.34 U= 438.000 .84
We (1st pers plural) M=.50
Sd= .50
M=.46
Sd= .42 U= 450.000 .10
Other (impersonal pronoun) M=.16
Sd=.31
M=.31
Sd=.48 U= 355.000 .13
Oneself (impersonal pronoun) M=2.39
Sd= 1.18
M=1.93
Sd= .76 t(58)= 1.80 .07
Conditional M=.51
Sd= .62
M=.40
Sd= .36 U=448.000 .98
Transitive M=.55
Sd= .42
M=.51
Sd=.38 U=420.000 .65
Past Participle M=1.60
Sd= .89
M=1.48
Sd= .86 U=395.500 .42
Gerund M=.27
Sd=.39
M=.13
Sd= .22 U=371.500 .20
To be M=1.83
Sd= 1.31
M=4.33
Sd=1.59 U=87.000 .000
To have M=2.33
Sd= 1.22
M=1.69
Sd=.85 U=292.500 .020
I_verb M=6.02
Sd= 2.52
M=4.59
Sd=1.87 t(58)= 2.49 .016
You_verb (2nd pers pron) M=.25
Sd= .27
M=.25
Sd=.35 U=426.000 .70
He/she_verb M=3.18
Sd= 1.28
M=5.43
Sd=1.19 t(58)= 5.34 .000
We_verb M=.71
Sd= .89
M=.97
Sd=.95 U=341.000 .10
You_verb (2nd pers plur) M=.09
Sd=.20
M=.22
Sd=.26 U=286.500 .007
Their_verb M=.84
Sd= .69
M=.69
Sd=.60 U=389.000 .37
Negations M=2.84
Sd= 1.83
M=2.87
Sd= 1.84 U=446.000 .95
Assents M=.19
Sd= .14
M=.14
Sd= .16 U=431.000 .76
Articles
M=10.13
Sd= 2.03
M=10.12
Sd= 2.04 t(58)= .18 .98
Prepositions M=10.42
Sd= 2.49
M=9.75
Sd= 1.47 t(58)= 1.26 .21
Numbers M=.64
Sd= .60
M=.62
Sd= .65 U=414.500 .59
II. PSYCHOLOGICAL
PROCESSES
Affective or Emotional Processes M=3.95
Sd=2.18
M=4.07
Sd=1.32 U=369.000 .23
Positive Emotions M=.86
Sd=.72
M=1.58
Sd=.95 t(58)=3.80 .000
Positive feelings M=2.06
Sd=1.00
M=3.21
Sd=1.32 t(58)=3.35 .000
Optimism and energy M=.38
Sd=.37
M=.53
Sd=.43 U=356.000 .16

78
Negative Emotions M=1.81
Sd=1.46
M=.85
Sd=.57 U=246.500 .003
Anxiety or fear M=.43
Sd=.63
M=.12
Sd=.27 U=295.000 .012
Anger M=.38
Sd=.52
M=.13
Sd=.23 U=315.000 .032
Sadness or Depression M=.63
Sd=.77
M=.33
Sd=.35 t(58)=1.92 .05
Cognitive Processes M=6.65
Sd=3.08
M=6.18
Sd=2.15 U=409.000 .54
Causation M=2.39
Sd=1.51
M=2.35
Sd=.3 U=444.500 .93
Insight M=1.46
Sd=1.31
M=1.27
Sd=.99 U=427.500 .73
Discrepancy M=1.49
Sd=1.11
M=1.29
Sd=.75 U=430.500 .77
Inhibition M=.25
Sd=.33
M=.21
Sd=.27 U=421.000 .65
Tentative M=2.35
Sd=1.46
M=2.56
Sd=2.45 U=402.500 .48
Certainty M=1.12
Sd=1.04
M=1.04
Sd=.47 t(58)=.51 .61
Sensory and Perceptual
Processes
M=1.61
Sd=1.27
M=1.52
Sd=.77 U=450.000 1.00
Seeing M=.29
Sd=.48
M=.36
Sd=34 U=354.000 .14
Hearing M=.82
Sd=.83
M=.86
Sd=.76 U=413.000 .58
Feeling M=.45
Sd=.75
M=.16
Sd=.24 U=309.000 .028
Social Processes M=4.87
Sd=1.87
M=4.56
Sd=1.63 t(58)=.67 .50
Communication M=1.24
Sd=.92
M=1.19
Sd=.80 U=433.500 .80
Other references to people M=.62
Sd=.67
M=.78
Sd=.66 U=370.000 .23
Friends M=.24
Sd=.32
M=.23
Sd=.32 U=428.000 .73
Family M=1.73
Sd=1.20
M=1.36
Sd=.91 t(58)=1.33 .19
Humans M=.74
Sd=.70
M=.62
Sd=.47 U=424.500 .70
III.RELATIVITY
Time M=4.16
Sd=1.66
M=3.09
Sd=1.19 U=281.500 .013
Past tense verb M=2.09
Sd=1.47
M=1.95
Sd=1.42 t(58)=.39 .69
Present tense verb M=12.04
Sd=2.66
M=12.79
Sd=2.21 t(58)=1.20 .23
Future tense verb M=.07
Sd=.22
M=.31
Sd=.39 U=230.500 .000
Space M=.98 M=1.26 U=314.500 .045
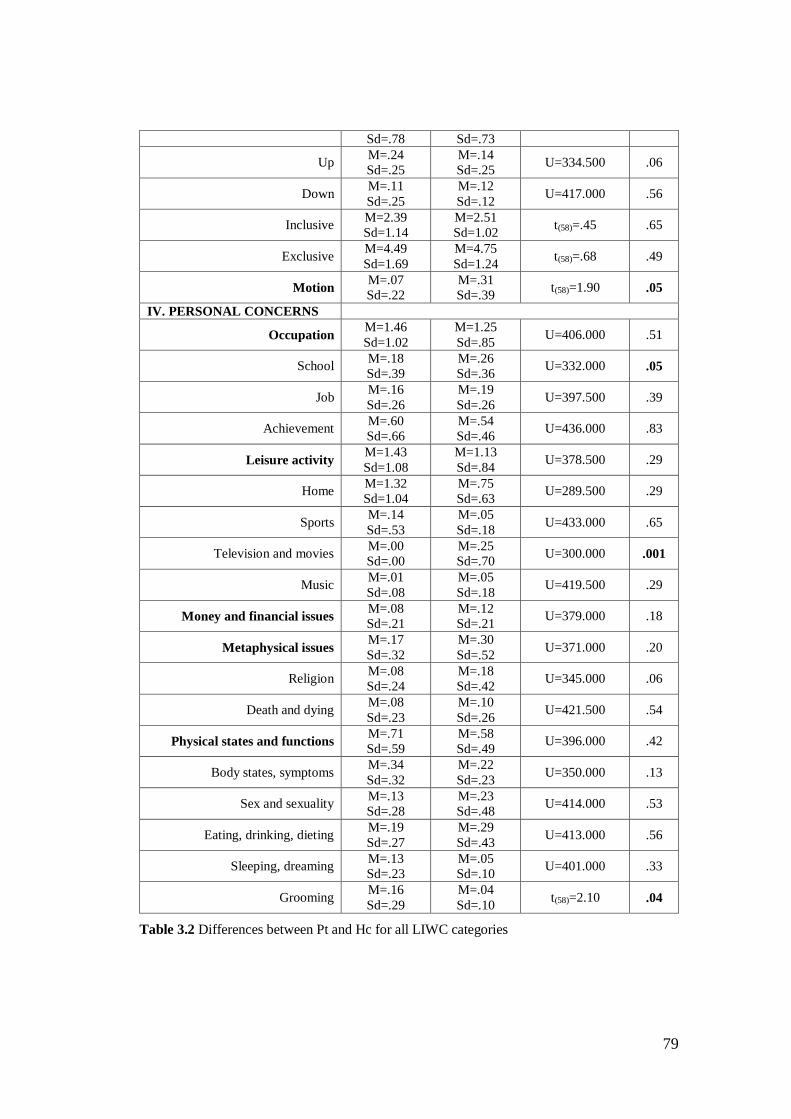
79
Sd=.78 Sd=.73
Up M=.24
Sd=.25
M=.14
Sd=.25 U=334.500 .06
Down M=.11
Sd=.25
M=.12
Sd=.12 U=417.000 .56
Inclusive M=2.39
Sd=1.14
M=2.51
Sd=1.02 t(58)=.45 .65
Exclusive M=4.49
Sd=1.69
M=4.75
Sd=1.24 t(58)=.68 .49
Motion M=.07
Sd=.22
M=.31
Sd=.39 t(58)=1.90 .05
IV. PERSONAL CONCERNS
Occupation M=1.46
Sd=1.02
M=1.25
Sd=.85 U=406.000 .51
School M=.18
Sd=.39
M=.26
Sd=.36 U=332.000 .05
Job M=.16
Sd=.26
M=.19
Sd=.26 U=397.500 .39
Achievement M=.60
Sd=.66
M=.54
Sd=.46 U=436.000 .83
Leisure activity M=1.43
Sd=1.08
M=1.13
Sd=.84 U=378.500 .29
Home M=1.32
Sd=1.04
M=.75
Sd=.63 U=289.500 .29
Sports M=.14
Sd=.53
M=.05
Sd=.18 U=433.000 .65
Television and movies M=.00
Sd=.00
M=.25
Sd=.70 U=300.000 .001
Music M=.01
Sd=.08
M=.05
Sd=.18 U=419.500 .29
Money and financial issues M=.08
Sd=.21
M=.12
Sd=.21 U=379.000 .18
Metaphysical issues M=.17
Sd=.32
M=.30
Sd=.52 U=371.000 .20
Religion M=.08
Sd=.24
M=.18
Sd=.42 U=345.000 .06
Death and dying M=.08
Sd=.23
M=.10
Sd=.26 U=421.500 .54
Physical states and functions M=.71
Sd=.59
M=.58
Sd=.49 U=396.000 .42
Body states, symptoms M=.34
Sd=.32
M=.22
Sd=.23 U=350.000 .13
Sex and sexuality M=.13
Sd=.28
M=.23
Sd=.48 U=414.000 .53
Eating, drinking, dieting M=.19
Sd=.27
M=.29
Sd=.43 U=413.000 .56
Sleeping, dreaming M=.13
Sd=.23
M=.05
Sd=.10 U=401.000 .33
Grooming M=.16
Sd=.29
M=.04
Sd=.10 t(58)=2.10 .04
Table 3.2 Differences between Pt and Hc for all LIWC categories
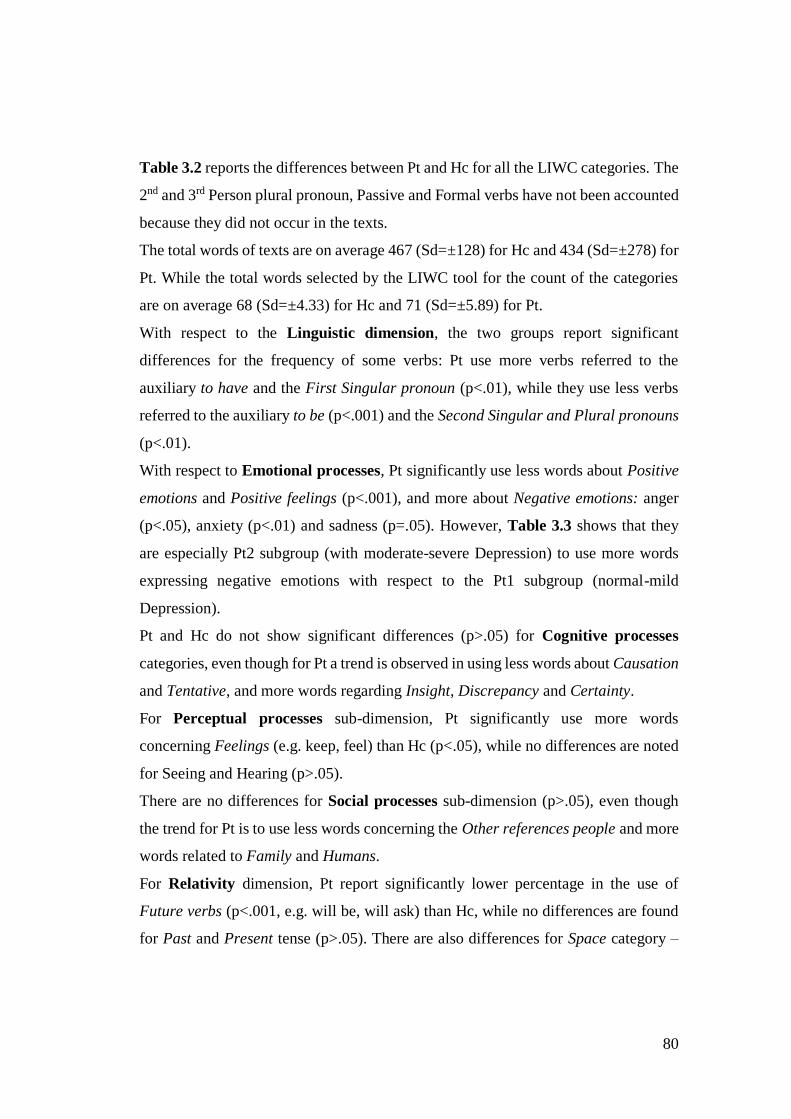
80
Table 3.2 reports the differences between Pt and Hc for all the LIWC categories. The
2nd and 3rd Person plural pronoun, Passive and Formal verbs have not been accounted
because they did not occur in the texts.
The total words of texts are on average 467 (Sd=±128) for Hc and 434 (Sd=±278) for
Pt. While the total words selected by the LIWC tool for the count of the categories
are on average 68 (Sd=±4.33) for Hc and 71 (Sd=±5.89) for Pt.
With respect to the Linguistic dimension, the two groups report significant
differences for the frequency of some verbs: Pt use more verbs referred to the
auxiliary to have and the First Singular pronoun (p<.01), while they use less verbs
referred to the auxiliary to be (p<.001) and the Second Singular and Plural pronouns
(p<.01).
With respect to Emotional processes, Pt significantly use less words about Positive
emotions and Positive feelings (p<.001), and more about Negative emotions: anger
(p<.05), anxiety (p<.01) and sadness (p=.05). However, Table 3.3 shows that they
are especially Pt2 subgroup (with moderate-severe Depression) to use more words
expressing negative emotions with respect to the Pt1 subgroup (normal-mild
Depression).
Pt and Hc do not show significant differences (p>.05) for Cognitive processes
categories, even though for Pt a trend is observed in using less words about Causation
and Tentative, and more words regarding Insight, Discrepancy and Certainty.
For Perceptual processes sub-dimension, Pt significantly use more words
concerning Feelings (e.g. keep, feel) than Hc (p<.05), while no differences are noted
for Seeing and Hearing (p>.05).
There are no differences for Social processes sub-dimension (p>.05), even though
the trend for Pt is to use less words concerning the Other references people and more
words related to Family and Humans.
For Relativity dimension, Pt report significantly lower percentage in the use of
Future verbs (p<.001, e.g. will be, will ask) than Hc, while no differences are found
for Past and Present tense (p>.05). There are also differences for Space category –
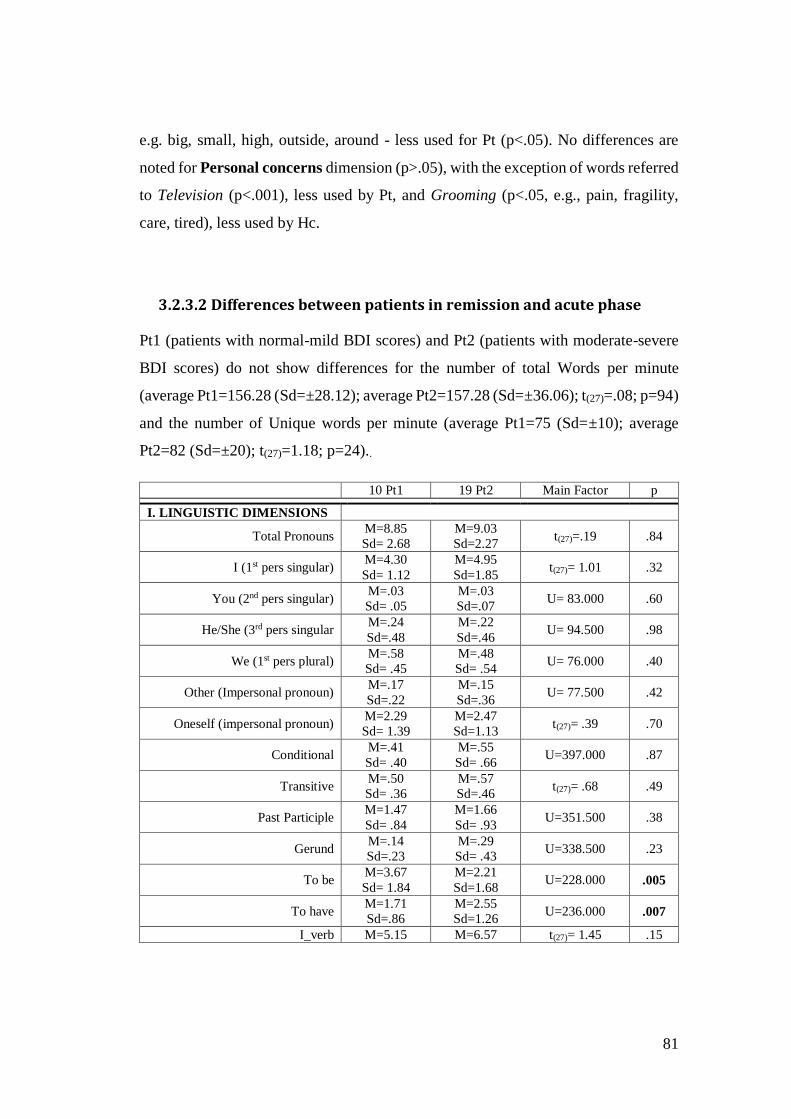
81
e.g. big, small, high, outside, around - less used for Pt (p<.05). No differences are
noted for Personal concerns dimension (p>.05), with the exception of words referred
to Television (p<.001), less used by Pt, and Grooming (p<.05, e.g., pain, fragility,
care, tired), less used by Hc.
3.2.3.2 Differences between patients in remission and acute phase
Pt1 (patients with normal-mild BDI scores) and Pt2 (patients with moderate-severe
BDI scores) do not show differences for the number of total Words per minute
(average Pt1=156.28 (Sd=±28.12); average Pt2=157.28 (Sd=±36.06); t(27)=.08; p=94)
and the number of Unique words per minute (average Pt1=75 (Sd=±10); average
Pt2=82 (Sd=±20); t(27)=1.18; p=24)..
10 Pt1 19 Pt2 Main Factor p
I. LINGUISTIC DIMENSIONS
Total Pronouns M=8.85
Sd= 2.68
M=9.03
Sd=2.27 t(27)=.19 .84
I (1st pers singular) M=4.30
Sd= 1.12
M=4.95
Sd=1.85 t(27)= 1.01 .32
You (2nd pers singular) M=.03
Sd= .05
M=.03
Sd=.07 U= 83.000 .60
He/She (3rd pers singular M=.24
Sd=.48
M=.22
Sd=.46 U= 94.500 .98
We (1st pers plural) M=.58
Sd= .45
M=.48
Sd= .54 U= 76.000 .40
Other (Impersonal pronoun) M=.17
Sd=.22
M=.15
Sd=.36 U= 77.500 .42
Oneself (impersonal pronoun) M=2.29
Sd= 1.39
M=2.47
Sd=1.13 t(27)= .39 .70
Conditional M=.41
Sd= .40
M=.55
Sd= .66 U=397.000 .87
Transitive M=.50
Sd= .36
M=.57
Sd=.46 t(27)= .68 .49
Past Participle M=1.47
Sd= .84
M=1.66
Sd= .93 U=351.500 .38
Gerund M=.14
Sd=.23
M=.29
Sd= .43 U=338.500 .23
To be M=3.67
Sd= 1.84
M=2.21
Sd=1.68 U=228.000 .005
To have M=1.71
Sd=.86
M=2.55
Sd=1.26 U=236.000 .007
I_verb M=5.15 M=6.57 t(27)= 1.45 .15

82
Sd= 1.65 Sd=2.83
You_verb (2nd pers pron) M=.23
Sd= .25
M=.26
Sd=.29 U=87.000 .73
He/she_verb M=3.18
Sd= 1.69
M=3.11
Sd=1.04 t(27)= .15 .88
We_verb M=.64
Sd= .70
M=.76
Sd=1.00 U=89.500 .80
You_verb (2nd pers plur) M=.12
Sd=.27
M=.05
Sd=.15 U=93.000 .95
Their_verb M=.99
Sd= .79
M=.74
Sd=.65 t(27)= .89 .37
Negations M=2.86
Sd= 2.05
M=2.80
Sd= 1.62 t(27)=1.35 .18
Assents M=.10
Sd= .19
M=.29
Sd= .45 U=84.000 .64
Articles M=10.56
Sd= 2.08
M=9.64
Sd= 1.91 t(27)=.11 .90
Prepositions M=10.44
Sd= 2.76
M=10.40
Sd=2.26 t(27)=1.17 .25
Numbers M=.58
Sd=.72
M=.72
Sd= .43 t(27)=1.28 .20
II. PSYCHOLOGICAL
PROCESSES
Affective or Emotional Processes M=2.92
Sd=.97
M=4.51
Sd=2.50 U=60.000 .11
Positive Emotions M=.60
Sd=.53
M=1.00
Sd=.78 t(27)=1.16 .25
Positive feelings M=1.76
Sd=.68
M=2.22
Sd=1.14 t(27)=1.44 .16
Optimism and energy M=.53
Sd=.42
M=.32
Sd=.34 U=65.000 .18
Negative Emotions M=1.17
Sd=.78
M=2.16
Sd=1.69 U=62.000 .14
Anxiety or fear M=.05
Sd=.09
M=.65
Sd=.70 U=30.500 .002
Anger M=.26
Sd=.38
M=.41
Sd=.59 U=84.000 .63
Sadness or Depression M=.34
Sd=.31
M=.79
Sd=.92 U=74.000 .35
Cognitive Processes M=5.99
Sd=1.74
M=7.02
Sd=3.65 t(27)=.84 .41
Causation M=2.35
Sd=1.08
M=2.46
Sd=1.74 t(27)=.19 .84
Insight M=1.33
Sd=1.12
M=1.36
Sd=.81 U=91.000 .87
Discrepancy M=1.35
Sd=.81
M=1.57
Sd=1.27 t(27)=.47 .64
Inhibition M=.32
Sd=.39
M=.21
Sd=.31 U=76.500 .40
Tentative M=2.09
Sd=.95
M=2.48
Sd=1.71 t(27)=.67 .51
Certainty M=1.09 M=1.13 t(27)=.13 .89
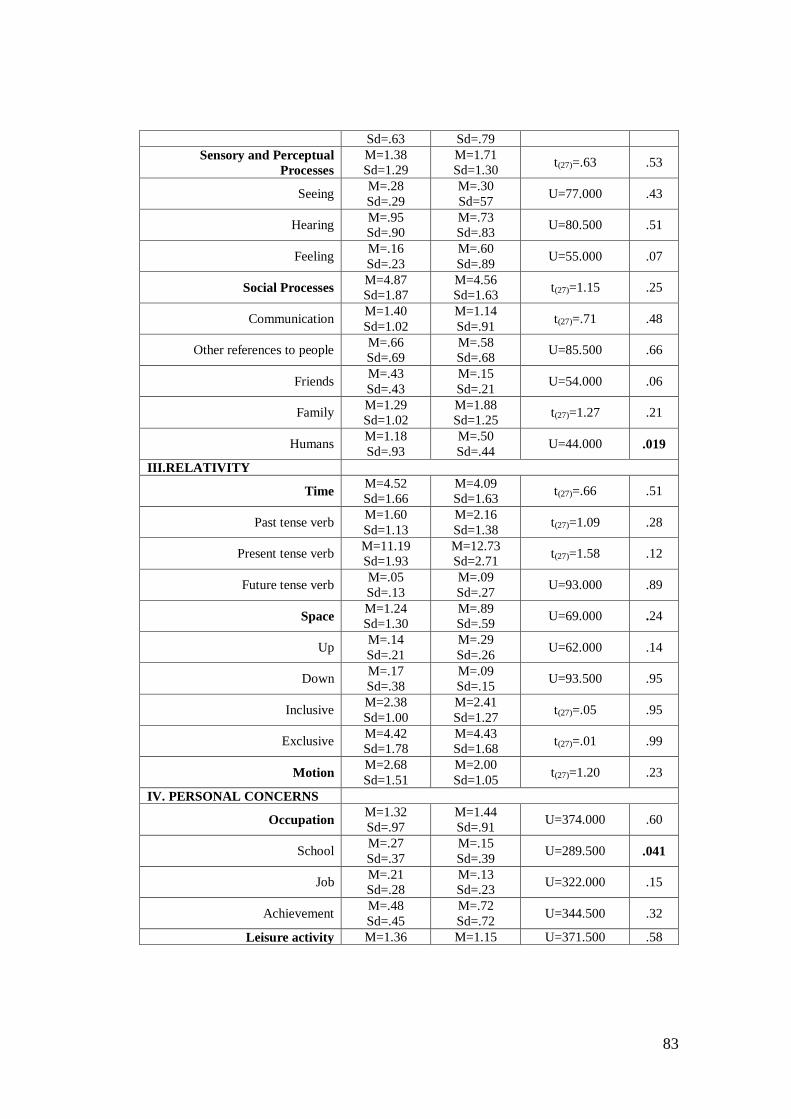
83
Sd=.63 Sd=.79
Sensory and Perceptual
Processes
M=1.38
Sd=1.29
M=1.71
Sd=1.30 t(27)=.63 .53
Seeing M=.28
Sd=.29
M=.30
Sd=57 U=77.000 .43
Hearing M=.95
Sd=.90
M=.73
Sd=.83 U=80.500 .51
Feeling M=.16
Sd=.23
M=.60
Sd=.89 U=55.000 .07
Social Processes M=4.87
Sd=1.87
M=4.56
Sd=1.63 t(27)=1.15 .25
Communication M=1.40
Sd=1.02
M=1.14
Sd=.91 t(27)=.71 .48
Other references to people M=.66
Sd=.69
M=.58
Sd=.68 U=85.500 .66
Friends M=.43
Sd=.43
M=.15
Sd=.21 U=54.000 .06
Family M=1.29
Sd=1.02
M=1.88
Sd=1.25 t(27)=1.27 .21
Humans M=1.18
Sd=.93
M=.50
Sd=.44 U=44.000 .019
III.RELATIVITY
Time M=4.52
Sd=1.66
M=4.09
Sd=1.63 t(27)=.66 .51
Past tense verb M=1.60
Sd=1.13
M=2.16
Sd=1.38 t(27)=1.09 .28
Present tense verb M=11.19
Sd=1.93
M=12.73
Sd=2.71 t(27)=1.58 .12
Future tense verb M=.05
Sd=.13
M=.09
Sd=.27 U=93.000 .89
Space M=1.24
Sd=1.30
M=.89
Sd=.59 U=69.000 .24
Up M=.14
Sd=.21
M=.29
Sd=.26 U=62.000 .14
Down M=.17
Sd=.38
M=.09
Sd=.15 U=93.500 .95
Inclusive M=2.38
Sd=1.00
M=2.41
Sd=1.27 t(27)=.05 .95
Exclusive M=4.42
Sd=1.78
M=4.43
Sd=1.68 t(27)=.01 .99
Motion M=2.68
Sd=1.51
M=2.00
Sd=1.05 t(27)=1.20 .23
IV. PERSONAL CONCERNS
Occupation M=1.32
Sd=.97
M=1.44
Sd=.91 U=374.000 .60
School M=.27
Sd=.37
M=.15
Sd=.39 U=289.500 .041
Job M=.21
Sd=.28
M=.13
Sd=.23 U=322.000 .15
Achievement M=.48
Sd=.45
M=.72
Sd=.72 U=344.500 .32
Leisure activity M=1.36 M=1.15 U=371.500 .58
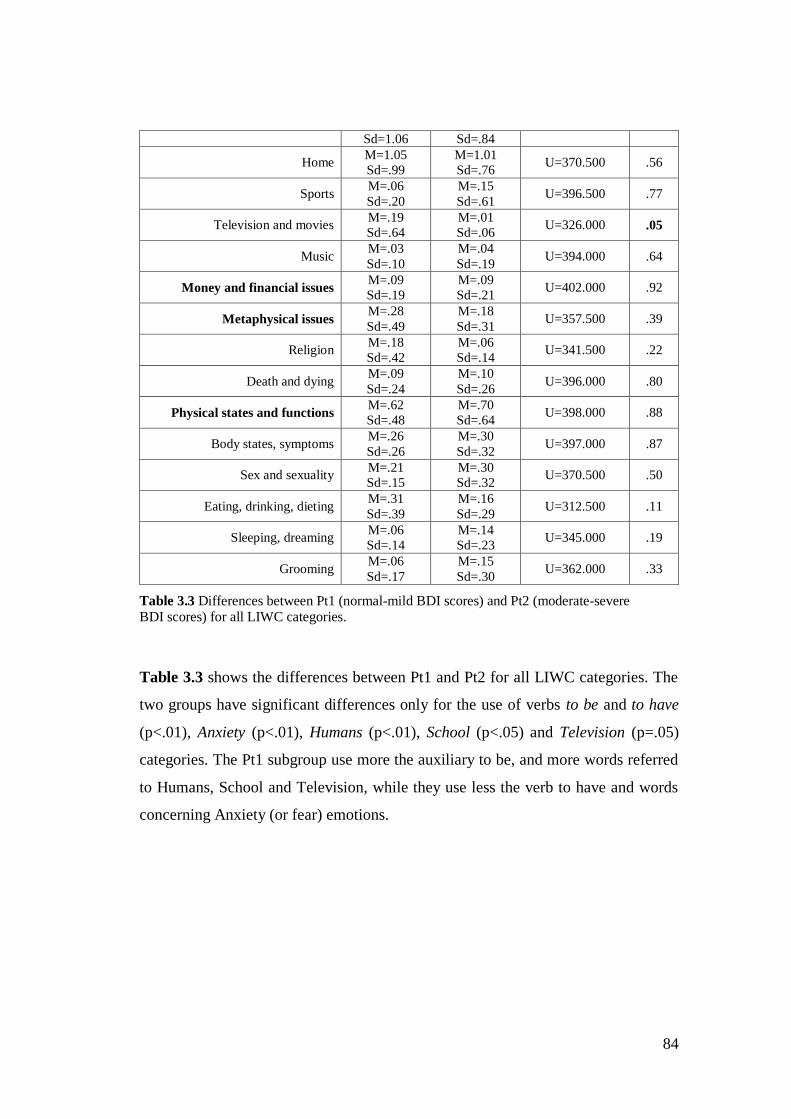
84
Sd=1.06 Sd=.84
Home M=1.05
Sd=.99
M=1.01
Sd=.76 U=370.500 .56
Sports M=.06
Sd=.20
M=.15
Sd=.61 U=396.500 .77
Television and movies M=.19
Sd=.64
M=.01
Sd=.06 U=326.000 .05
Music M=.03
Sd=.10
M=.04
Sd=.19 U=394.000 .64
Money and financial issues M=.09
Sd=.19
M=.09
Sd=.21 U=402.000 .92
Metaphysical issues M=.28
Sd=.49
M=.18
Sd=.31 U=357.500 .39
Religion M=.18
Sd=.42
M=.06
Sd=.14 U=341.500 .22
Death and dying M=.09
Sd=.24
M=.10
Sd=.26 U=396.000 .80
Physical states and functions M=.62
Sd=.48
M=.70
Sd=.64 U=398.000 .88
Body states, symptoms M=.26
Sd=.26
M=.30
Sd=.32 U=397.000 .87
Sex and sexuality M=.21
Sd=.15
M=.30
Sd=.32 U=370.500 .50
Eating, drinking, dieting M=.31
Sd=.39
M=.16
Sd=.29 U=312.500 .11
Sleeping, dreaming M=.06
Sd=.14
M=.14
Sd=.23 U=345.000 .19
Grooming M=.06
Sd=.17
M=.15
Sd=.30 U=362.000 .33
Table 3.3 Differences between Pt1 (normal-mild BDI scores) and Pt2 (moderate-severe BDI scores) for all LIWC categories.
Table 3.3 shows the differences between Pt1 and Pt2 for all LIWC categories. The
two groups have significant differences only for the use of verbs to be and to have
(p<.01), Anxiety (p<.01), Humans (p<.01), School (p<.05) and Television (p=.05)
categories. The Pt1 subgroup use more the auxiliary to be, and more words referred
to Humans, School and Television, while they use less the verb to have and words
concerning Anxiety (or fear) emotions.
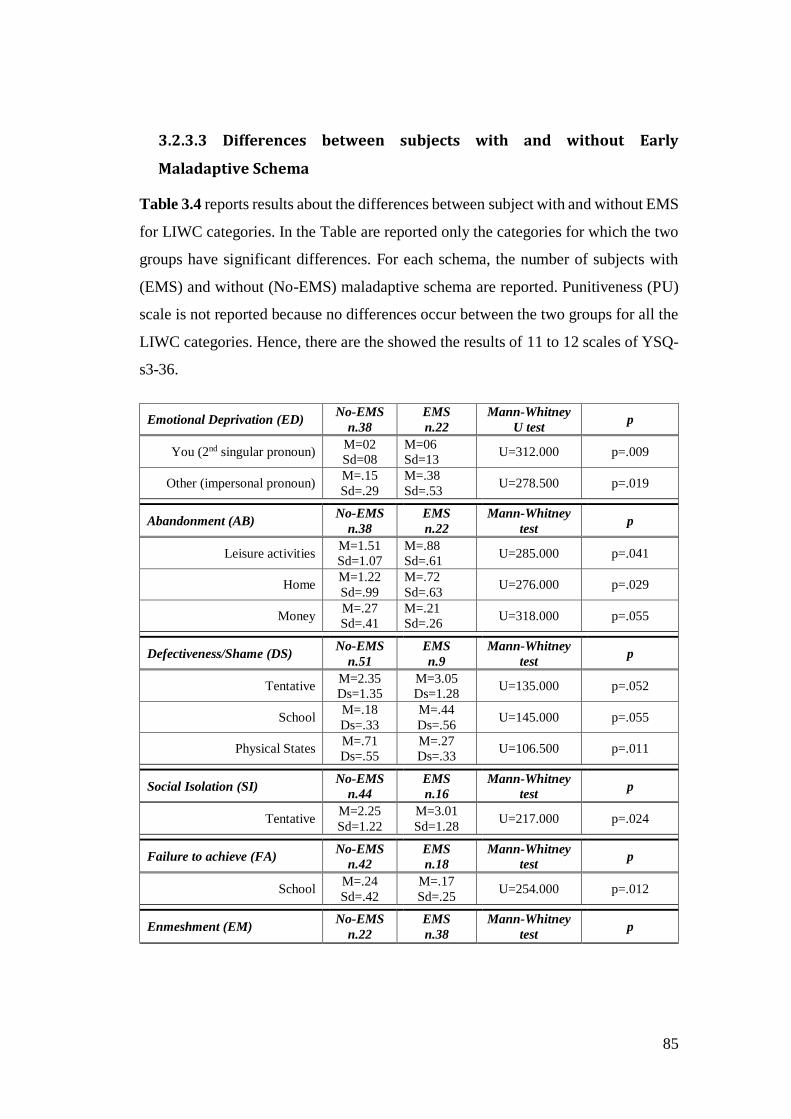
85
3.2.3.3 Differences between subjects with and without Early
Maladaptive Schema
Table 3.4 reports results about the differences between subject with and without EMS
for LIWC categories. In the Table are reported only the categories for which the two
groups have significant differences. For each schema, the number of subjects with
(EMS) and without (No-EMS) maladaptive schema are reported. Punitiveness (PU)
scale is not reported because no differences occur between the two groups for all the
LIWC categories. Hence, there are the showed the results of 11 to 12 scales of YSQ-
s3-36.
Emotional Deprivation (ED) No-EMS
n.38
EMS
n.22
Mann-Whitney
U test p
You (2nd singular pronoun) M=02
Sd=08
M=06
Sd=13 U=312.000 p=.009
Other (impersonal pronoun) M=.15
Sd=.29
M=.38
Sd=.53 U=278.500 p=.019
Abandonment (AB) No-EMS
n.38
EMS
n.22
Mann-Whitney
test p
Leisure activities M=1.51
Sd=1.07
M=.88
Sd=.61 U=285.000 p=.041
Home M=1.22
Sd=.99
M=.72
Sd=.63 U=276.000 p=.029
Money M=.27
Sd=.41
M=.21
Sd=.26 U=318.000 p=.055
Defectiveness/Shame (DS) No-EMS
n.51
EMS
n.9
Mann-Whitney
test p
Tentative M=2.35
Ds=1.35
M=3.05
Ds=1.28 U=135.000 p=.052
School M=.18
Ds=.33
M=.44
Ds=.56 U=145.000 p=.055
Physical States M=.71
Ds=.55
M=.27
Ds=.33 U=106.500 p=.011
Social Isolation (SI) No-EMS
n.44
EMS
n.16
Mann-Whitney
test p
Tentative M=2.25
Sd=1.22
M=3.01
Sd=1.28 U=217.000 p=.024
Failure to achieve (FA) No-EMS
n.42
EMS
n.18
Mann-Whitney
test p
School M=.24
Sd=.42
M=.17
Sd=.25 U=254.000 p=.012
Enmeshment (EM) No-EMS
n.22
EMS
n.38
Mann-Whitney
test p
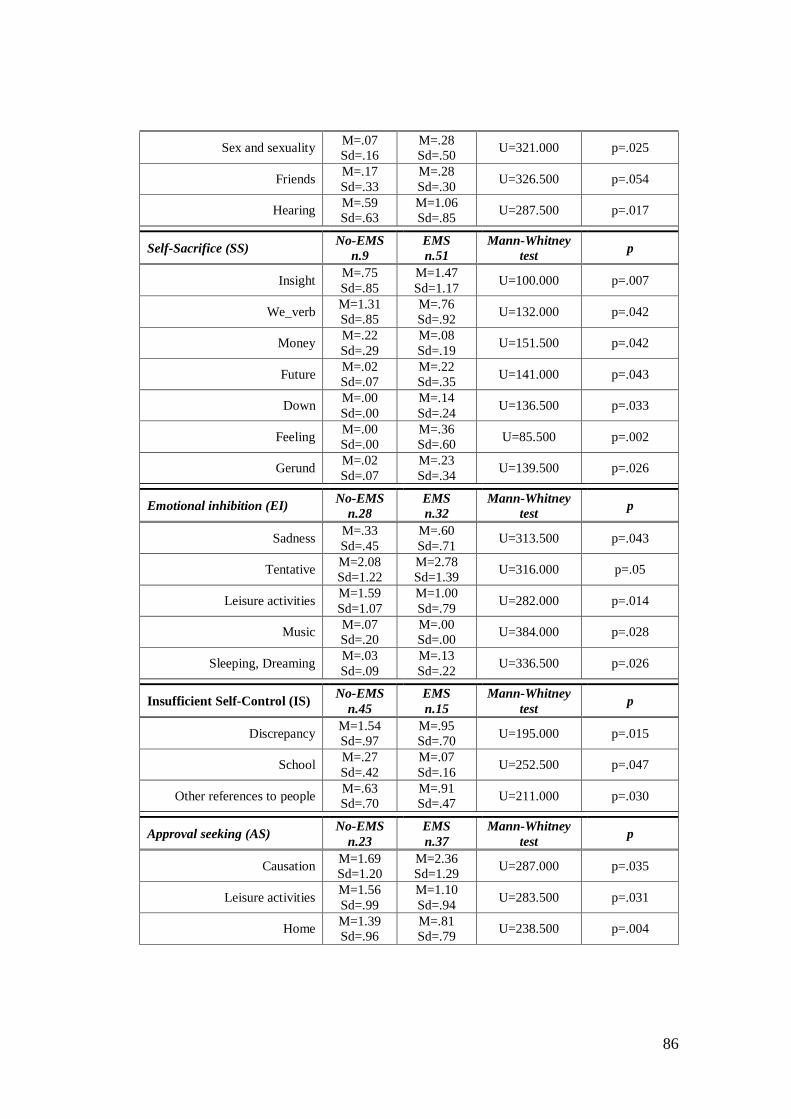
86
Sex and sexuality M=.07
Sd=.16
M=.28
Sd=.50 U=321.000 p=.025
Friends M=.17
Sd=.33
M=.28
Sd=.30 U=326.500 p=.054
Hearing M=.59
Sd=.63
M=1.06
Sd=.85 U=287.500 p=.017
Self-Sacrifice (SS) No-EMS
n.9
EMS
n.51
Mann-Whitney
test p
Insight M=.75
Sd=.85
M=1.47
Sd=1.17 U=100.000 p=.007
We_verb M=1.31
Sd=.85
M=.76
Sd=.92 U=132.000 p=.042
Money M=.22
Sd=.29
M=.08
Sd=.19 U=151.500 p=.042
Future M=.02
Sd=.07
M=.22
Sd=.35 U=141.000 p=.043
Down M=.00
Sd=.00
M=.14
Sd=.24 U=136.500 p=.033
Feeling M=.00
Sd=.00
M=.36
Sd=.60 U=85.500 p=.002
Gerund M=.02
Sd=.07
M=.23
Sd=.34 U=139.500 p=.026
Emotional inhibition (EI) No-EMS
n.28
EMS
n.32
Mann-Whitney
test p
Sadness M=.33
Sd=.45
M=.60
Sd=.71 U=313.500 p=.043
Tentative M=2.08
Sd=1.22
M=2.78
Sd=1.39 U=316.000 p=.05
Leisure activities M=1.59
Sd=1.07
M=1.00
Sd=.79 U=282.000 p=.014
Music M=.07
Sd=.20
M=.00
Sd=.00 U=384.000 p=.028
Sleeping, Dreaming M=.03
Sd=.09
M=.13
Sd=.22 U=336.500 p=.026
Insufficient Self-Control (IS) No-EMS
n.45
EMS
n.15
Mann-Whitney
test p
Discrepancy M=1.54
Sd=.97
M=.95
Sd=.70 U=195.000 p=.015
School M=.27
Sd=.42
M=.07
Sd=.16 U=252.500 p=.047
Other references to people M=.63
Sd=.70
M=.91
Sd=.47 U=211.000 p=.030
Approval seeking (AS) No-EMS
n.23
EMS
n.37
Mann-Whitney
test p
Causation M=1.69
Sd=1.20
M=2.36
Sd=1.29 U=287.000 p=.035
Leisure activities M=1.56
Sd=.99
M=1.10
Sd=.94 U=283.500 p=.031
Home M=1.39
Sd=.96
M=.81
Sd=.79 U=238.500 p=.004
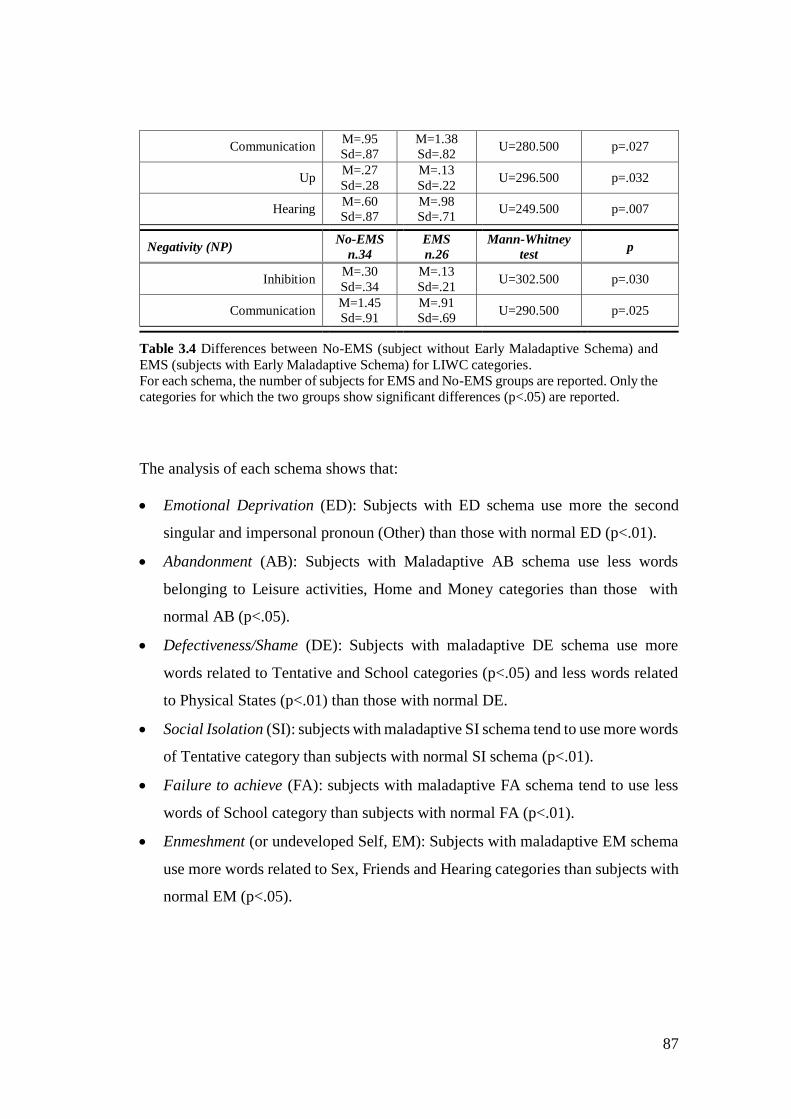
87
Communication M=.95
Sd=.87
M=1.38
Sd=.82 U=280.500 p=.027
Up M=.27
Sd=.28
M=.13
Sd=.22 U=296.500 p=.032
Hearing M=.60
Sd=.87
M=.98
Sd=.71 U=249.500 p=.007
Negativity (NP) No-EMS
n.34
EMS
n.26
Mann-Whitney
test p
Inhibition M=.30
Sd=.34
M=.13
Sd=.21 U=302.500 p=.030
Communication M=1.45
Sd=.91
M=.91
Sd=.69 U=290.500 p=.025
Table 3.4 Differences between No-EMS (subject without Early Maladaptive Schema) and
EMS (subjects with Early Maladaptive Schema) for LIWC categories. For each schema, the number of subjects for EMS and No-EMS groups are reported. Only the categories for which the two groups show significant differences (p<.05) are reported.
The analysis of each schema shows that:
Emotional Deprivation (ED): Subjects with ED schema use more the second
singular and impersonal pronoun (Other) than those with normal ED (p<.01).
Abandonment (AB): Subjects with Maladaptive AB schema use less words
belonging to Leisure activities, Home and Money categories than those with
normal AB (p<.05).
Defectiveness/Shame (DE): Subjects with maladaptive DE schema use more
words related to Tentative and School categories (p<.05) and less words related
to Physical States (p<.01) than those with normal DE.
Social Isolation (SI): subjects with maladaptive SI schema tend to use more words
of Tentative category than subjects with normal SI schema (p<.01).
Failure to achieve (FA): subjects with maladaptive FA schema tend to use less
words of School category than subjects with normal FA (p<.01).
Enmeshment (or undeveloped Self, EM): Subjects with maladaptive EM schema
use more words related to Sex, Friends and Hearing categories than subjects with
normal EM (p<.05).
88
Self-Sacrifice (SS): subjects with maladaptive SS schema use more words related
to Insight (p<.01), Future (p<.05), Down (p<.05), Feeling (p<.01), Gerund
(p<.05) categories and less verbs referred to the first plural pronoun (We_verb)
and Money categories (p<.05) than subjects with normal SS.
Emotional Inhibition (EI): subjects with maladaptive EI schema express more
words regarding Sadness, Tentative and Sleeping (p<.05), and less words about
Leisure activities (p<.01) and Music (p<.05) categories than subjects with normal
EI.
Insufficient self-control (IS): subjects with maladaptive IS schema express less
words related to Discrepancy and School, and more words of other people
references category (p<.05) than subjects with normal IS.
Approval Seeking (AS): subjects with Maladaptive AS schema use more words
related to Causation (p<.05), Communication (p<.05) and Hearing (p<.01)
categories, and less words regarding Leisure activities, Home and Up (p<.05)
categories than subjects with normal AS.
Negativity (NA): subjects with maladaptive NA schema use less words related to
Cognitive processes, Inhibition, Money and Communication categories (p<.05)
than subjects with normal NA.
3.3.4 Discussion of the reported results
In the present part of the project the speech content of depressed patients has been
investigated using LIWC program, which counts the frequency of words fall in
specific linguistic, emotional and cognitive categories. The first goal is to find
differences between depressed and healthy subjects with respect to these categories.
The second goal is to investigate possible differences between acute and remitted
depressed patients. The last purpose is the analysis of differences between subjects
with and without Early Maladaptive Schema (EMS), independently from the
depressive symptoms.
89
3.3.4.1 Differences between depressed and healthy subjects
The results about the differences between depressed (Pt) and healthy subjects (Hc) in
speech content partially agree with the literature studies. Previous research studies
(see par. 3.1) found that depressed use more First singular pronoun than controls,
while in the present study the differences between clinical and healthy groups are not
significant (p>.05), even though the average for first singular pronoun category is
higher for the first than the second group. Nevertheless, depressed patients
significantly use more verbs referred to the First singular pronoun (p=.016) and less
verbs referred to the Third singular (p<<.000) and Second plural pronouns (p=.007).
As discussed in par. 2.2, the major use of first personal pronoun and the minor use of
second and third ones reflects the dominant self-focused attention of depressed
subjects. The self-focus bias could explain also the significant major use of words
related to the Feelings category by depressed with respect to control subjects
(p=.028). According to Bucci and Freedman’ results (1981), when patients have to
tell about aspects concerning their everyday life, they tend to focus on their own
subjective feelings and emotions, rather than objective descriptions of the events and
experiences. The present text analysis shows that depressed subjects frequently use
the verb to feel in sentences such as “I feel/felt down, upset, sad, sick” to describe
how the day/week was.
Patients use significantly less the auxiliary to be (p<<.000) and more the verb to have
(p=.016). However, while healthy subjects use the auxiliary to have specially to
describe dynamic recent activities (e.g. “I have cooked fish”, “I have invited my
sister”), the depressed referred often to their family members (e.g. “I have two
brothers”) or to express their thoughts and feeling (“I have thought that I did not feel
well”, “I have no reason to be happy”). From a certain point of view, this use of the
auxiliary to have (what I have; What I think/feel) also reflects the trend of depressed
to concentrate on the self, instead of describing activities than can connect themselves
with others and with the external environment.
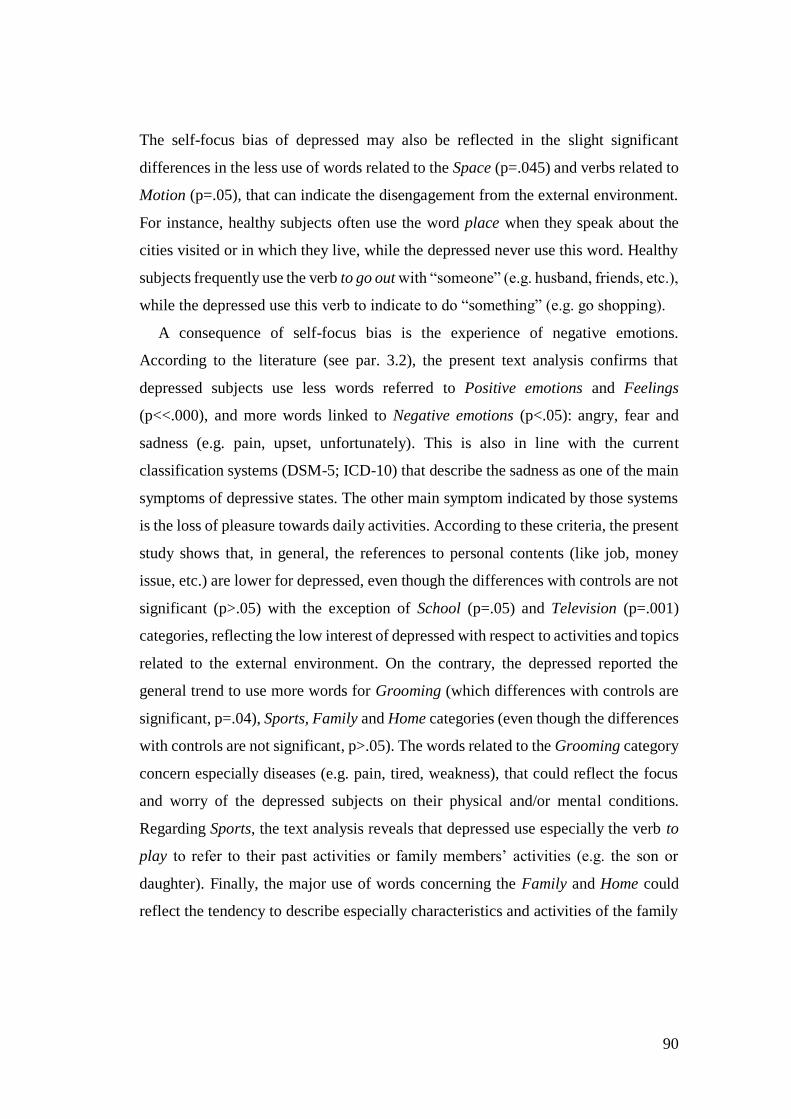
90
The self-focus bias of depressed may also be reflected in the slight significant
differences in the less use of words related to the Space (p=.045) and verbs related to
Motion (p=.05), that can indicate the disengagement from the external environment.
For instance, healthy subjects often use the word place when they speak about the
cities visited or in which they live, while the depressed never use this word. Healthy
subjects frequently use the verb to go out with “someone” (e.g. husband, friends, etc.),
while the depressed use this verb to indicate to do “something” (e.g. go shopping).
A consequence of self-focus bias is the experience of negative emotions.
According to the literature (see par. 3.2), the present text analysis confirms that
depressed subjects use less words referred to Positive emotions and Feelings
(p<<.000), and more words linked to Negative emotions (p<.05): angry, fear and
sadness (e.g. pain, upset, unfortunately). This is also in line with the current
classification systems (DSM-5; ICD-10) that describe the sadness as one of the main
symptoms of depressive states. The other main symptom indicated by those systems
is the loss of pleasure towards daily activities. According to these criteria, the present
study shows that, in general, the references to personal contents (like job, money
issue, etc.) are lower for depressed, even though the differences with controls are not
significant (p>.05) with the exception of School (p=.05) and Television (p=.001)
categories, reflecting the low interest of depressed with respect to activities and topics
related to the external environment. On the contrary, the depressed reported the
general trend to use more words for Grooming (which differences with controls are
significant, p=.04), Sports, Family and Home categories (even though the differences
with controls are not significant, p>.05). The words related to the Grooming category
concern especially diseases (e.g. pain, tired, weakness), that could reflect the focus
and worry of the depressed subjects on their physical and/or mental conditions.
Regarding Sports, the text analysis reveals that depressed use especially the verb to
play to refer to their past activities or family members’ activities (e.g. the son or
daughter). Finally, the major use of words concerning the Family and Home could
reflect the tendency to describe especially characteristics and activities of the family
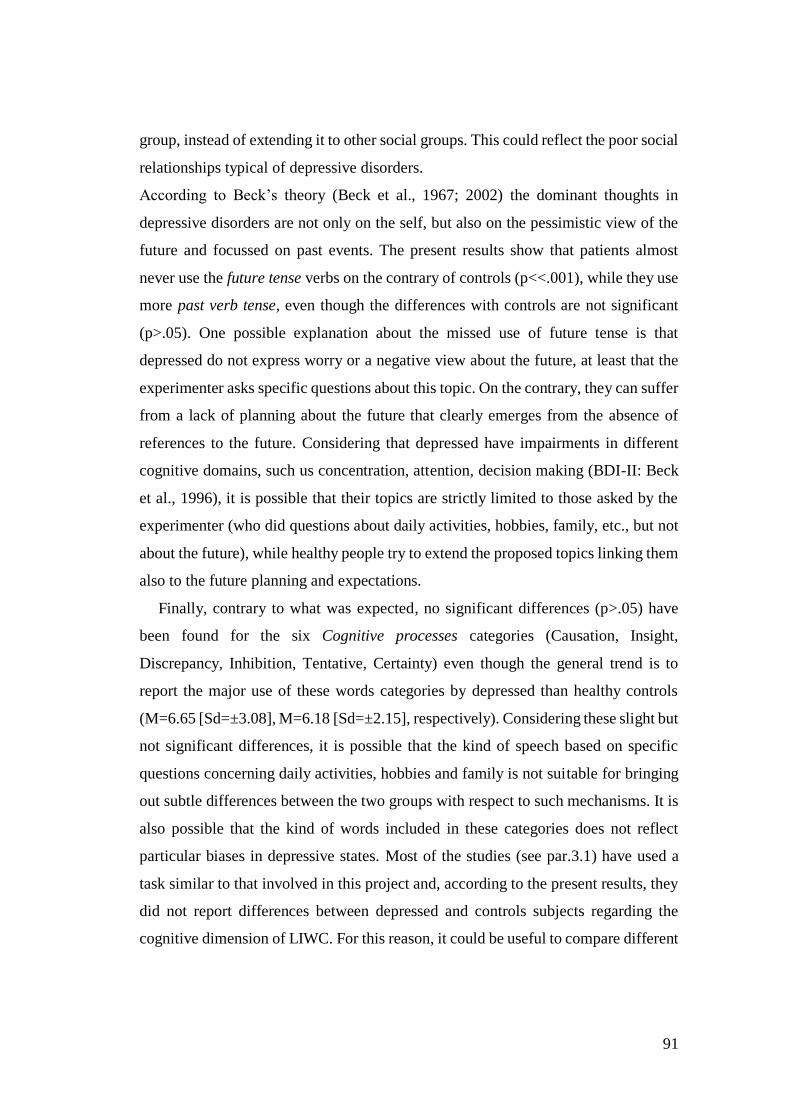
91
group, instead of extending it to other social groups. This could reflect the poor social
relationships typical of depressive disorders.
According to Beck’s theory (Beck et al., 1967; 2002) the dominant thoughts in
depressive disorders are not only on the self, but also on the pessimistic view of the
future and focussed on past events. The present results show that patients almost
never use the future tense verbs on the contrary of controls (p<<.001), while they use
more past verb tense, even though the differences with controls are not significant
(p>.05). One possible explanation about the missed use of future tense is that
depressed do not express worry or a negative view about the future, at least that the
experimenter asks specific questions about this topic. On the contrary, they can suffer
from a lack of planning about the future that clearly emerges from the absence of
references to the future. Considering that depressed have impairments in different
cognitive domains, such us concentration, attention, decision making (BDI-II: Beck
et al., 1996), it is possible that their topics are strictly limited to those asked by the
experimenter (who did questions about daily activities, hobbies, family, etc., but not
about the future), while healthy people try to extend the proposed topics linking them
also to the future planning and expectations.
Finally, contrary to what was expected, no significant differences (p>.05) have
been found for the six Cognitive processes categories (Causation, Insight,
Discrepancy, Inhibition, Tentative, Certainty) even though the general trend is to
report the major use of these words categories by depressed than healthy controls
(M=6.65 [Sd=±3.08], M=6.18 [Sd=±2.15], respectively). Considering these slight but
not significant differences, it is possible that the kind of speech based on specific
questions concerning daily activities, hobbies and family is not suitable for bringing
out subtle differences between the two groups with respect to such mechanisms. It is
also possible that the kind of words included in these categories does not reflect
particular biases in depressive states. Most of the studies (see par.3.1) have used a
task similar to that involved in this project and, according to the present results, they
did not report differences between depressed and controls subjects regarding the
cognitive dimension of LIWC. For this reason, it could be useful to compare different
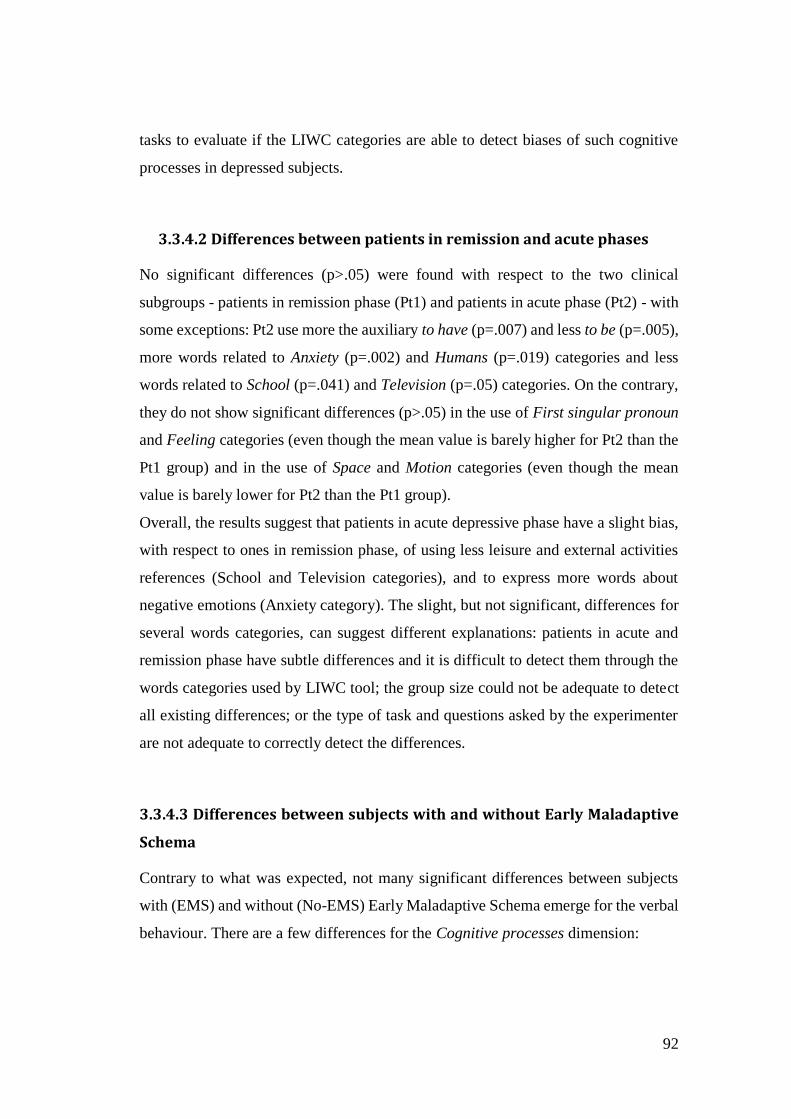
92
tasks to evaluate if the LIWC categories are able to detect biases of such cognitive
processes in depressed subjects.
3.3.4.2 Differences between patients in remission and acute phases
No significant differences (p>.05) were found with respect to the two clinical
subgroups - patients in remission phase (Pt1) and patients in acute phase (Pt2) - with
some exceptions: Pt2 use more the auxiliary to have (p=.007) and less to be (p=.005),
more words related to Anxiety (p=.002) and Humans (p=.019) categories and less
words related to School (p=.041) and Television (p=.05) categories. On the contrary,
they do not show significant differences (p>.05) in the use of First singular pronoun
and Feeling categories (even though the mean value is barely higher for Pt2 than the
Pt1 group) and in the use of Space and Motion categories (even though the mean
value is barely lower for Pt2 than the Pt1 group).
Overall, the results suggest that patients in acute depressive phase have a slight bias,
with respect to ones in remission phase, of using less leisure and external activities
references (School and Television categories), and to express more words about
negative emotions (Anxiety category). The slight, but not significant, differences for
several words categories, can suggest different explanations: patients in acute and
remission phase have subtle differences and it is difficult to detect them through the
words categories used by LIWC tool; the group size could not be adequate to detect
all existing differences; or the type of task and questions asked by the experimenter
are not adequate to correctly detect the differences.
3.3.4.3 Differences between subjects with and without Early Maladaptive
Schema
Contrary to what was expected, not many significant differences between subjects
with (EMS) and without (No-EMS) Early Maladaptive Schema emerge for the verbal
behaviour. There are a few differences for the Cognitive processes dimension:
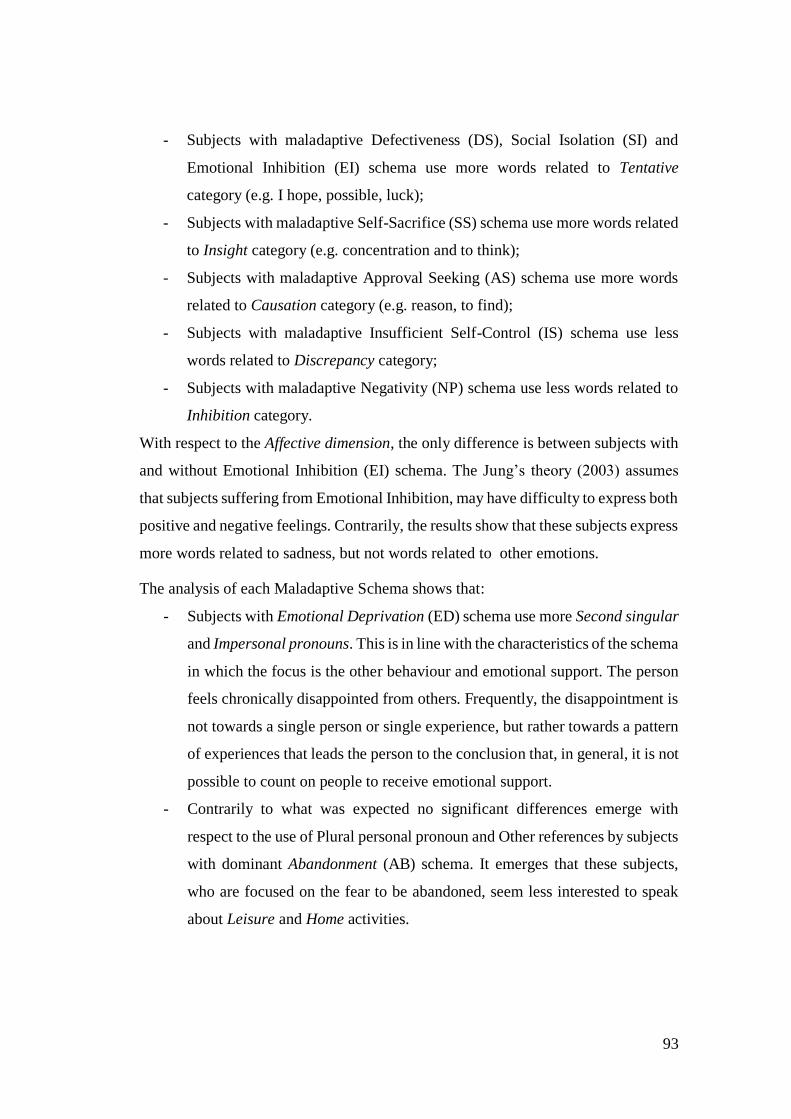
93
- Subjects with maladaptive Defectiveness (DS), Social Isolation (SI) and
Emotional Inhibition (EI) schema use more words related to Tentative
category (e.g. I hope, possible, luck);
- Subjects with maladaptive Self-Sacrifice (SS) schema use more words related
to Insight category (e.g. concentration and to think);
- Subjects with maladaptive Approval Seeking (AS) schema use more words
related to Causation category (e.g. reason, to find);
- Subjects with maladaptive Insufficient Self-Control (IS) schema use less
words related to Discrepancy category;
- Subjects with maladaptive Negativity (NP) schema use less words related to
Inhibition category.
With respect to the Affective dimension, the only difference is between subjects with
and without Emotional Inhibition (EI) schema. The Jung’s theory (2003) assumes
that subjects suffering from Emotional Inhibition, may have difficulty to express both
positive and negative feelings. Contrarily, the results show that these subjects express
more words related to sadness, but not words related to other emotions.
The analysis of each Maladaptive Schema shows that:
- Subjects with Emotional Deprivation (ED) schema use more Second singular
and Impersonal pronouns. This is in line with the characteristics of the schema
in which the focus is the other behaviour and emotional support. The person
feels chronically disappointed from others. Frequently, the disappointment is
not towards a single person or single experience, but rather towards a pattern
of experiences that leads the person to the conclusion that, in general, it is not
possible to count on people to receive emotional support.
- Contrarily to what was expected no significant differences emerge with
respect to the use of Plural personal pronoun and Other references by subjects
with dominant Abandonment (AB) schema. It emerges that these subjects,
who are focused on the fear to be abandoned, seem less interested to speak
about Leisure and Home activities.
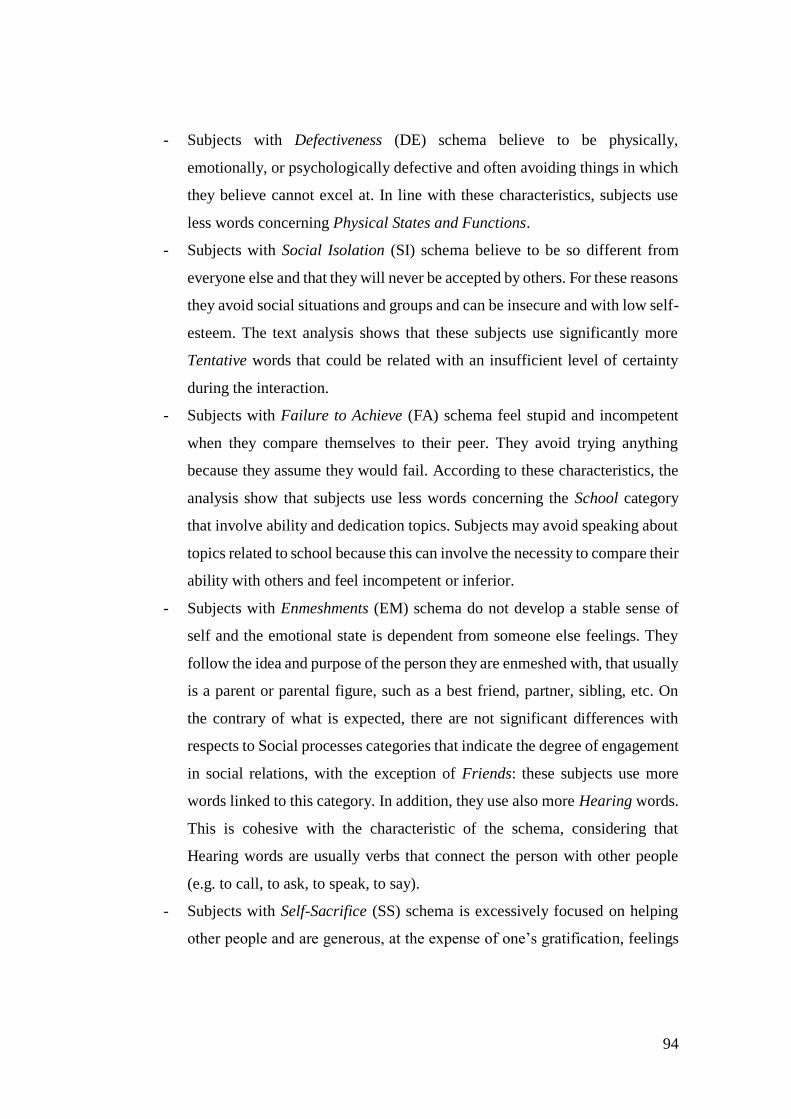
94
- Subjects with Defectiveness (DE) schema believe to be physically,
emotionally, or psychologically defective and often avoiding things in which
they believe cannot excel at. In line with these characteristics, subjects use
less words concerning Physical States and Functions.
- Subjects with Social Isolation (SI) schema believe to be so different from
everyone else and that they will never be accepted by others. For these reasons
they avoid social situations and groups and can be insecure and with low self-
esteem. The text analysis shows that these subjects use significantly more
Tentative words that could be related with an insufficient level of certainty
during the interaction.
- Subjects with Failure to Achieve (FA) schema feel stupid and incompetent
when they compare themselves to their peer. They avoid trying anything
because they assume they would fail. According to these characteristics, the
analysis show that subjects use less words concerning the School category
that involve ability and dedication topics. Subjects may avoid speaking about
topics related to school because this can involve the necessity to compare their
ability with others and feel incompetent or inferior.
- Subjects with Enmeshments (EM) schema do not develop a stable sense of
self and the emotional state is dependent from someone else feelings. They
follow the idea and purpose of the person they are enmeshed with, that usually
is a parent or parental figure, such as a best friend, partner, sibling, etc. On
the contrary of what is expected, there are not significant differences with
respects to Social processes categories that indicate the degree of engagement
in social relations, with the exception of Friends: these subjects use more
words linked to this category. In addition, they use also more Hearing words.
This is cohesive with the characteristic of the schema, considering that
Hearing words are usually verbs that connect the person with other people
(e.g. to call, to ask, to speak, to say).
- Subjects with Self-Sacrifice (SS) schema is excessively focused on helping
other people and are generous, at the expense of one’s gratification, feelings
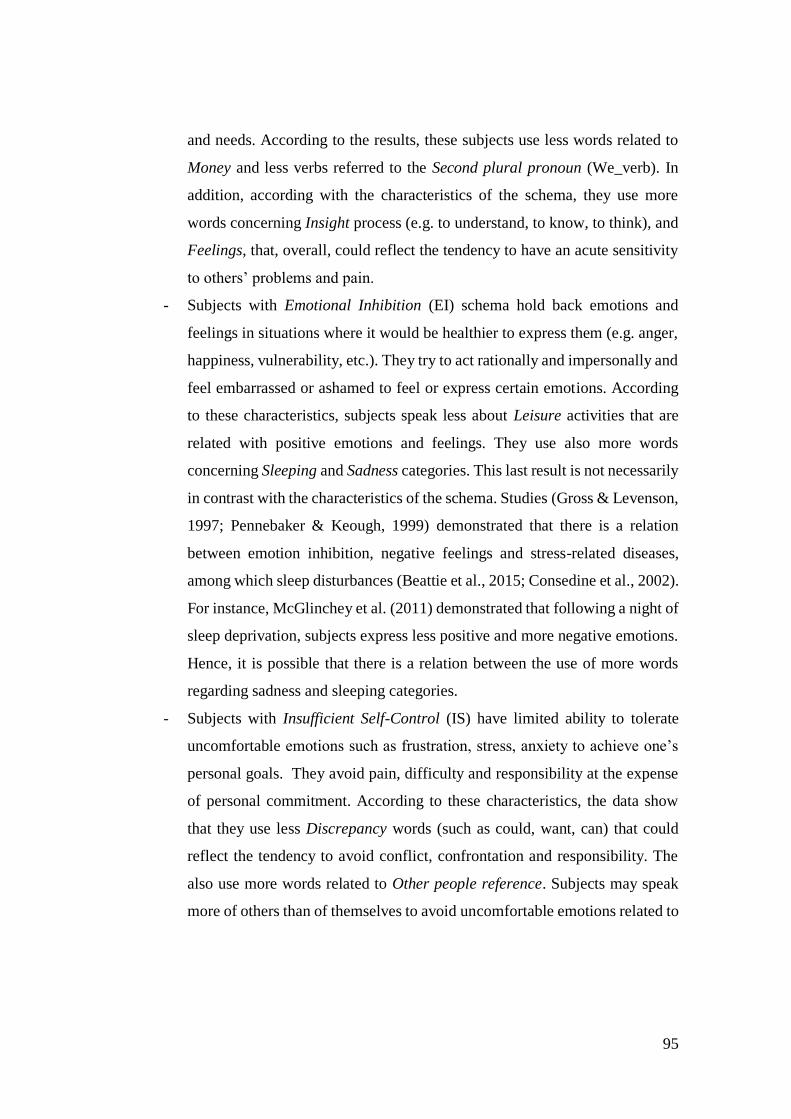
95
and needs. According to the results, these subjects use less words related to
Money and less verbs referred to the Second plural pronoun (We_verb). In
addition, according with the characteristics of the schema, they use more
words concerning Insight process (e.g. to understand, to know, to think), and
Feelings, that, overall, could reflect the tendency to have an acute sensitivity
to others’ problems and pain.
- Subjects with Emotional Inhibition (EI) schema hold back emotions and
feelings in situations where it would be healthier to express them (e.g. anger,
happiness, vulnerability, etc.). They try to act rationally and impersonally and
feel embarrassed or ashamed to feel or express certain emotions. According
to these characteristics, subjects speak less about Leisure activities that are
related with positive emotions and feelings. They use also more words
concerning Sleeping and Sadness categories. This last result is not necessarily
in contrast with the characteristics of the schema. Studies (Gross & Levenson,
1997; Pennebaker & Keough, 1999) demonstrated that there is a relation
between emotion inhibition, negative feelings and stress-related diseases,
among which sleep disturbances (Beattie et al., 2015; Consedine et al., 2002).
For instance, McGlinchey et al. (2011) demonstrated that following a night of
sleep deprivation, subjects express less positive and more negative emotions.
Hence, it is possible that there is a relation between the use of more words
regarding sadness and sleeping categories.
- Subjects with Insufficient Self-Control (IS) have limited ability to tolerate
uncomfortable emotions such as frustration, stress, anxiety to achieve one’s
personal goals. They avoid pain, difficulty and responsibility at the expense
of personal commitment. According to these characteristics, the data show
that they use less Discrepancy words (such as could, want, can) that could
reflect the tendency to avoid conflict, confrontation and responsibility. The
also use more words related to Other people reference. Subjects may speak
more of others than of themselves to avoid uncomfortable emotions related to
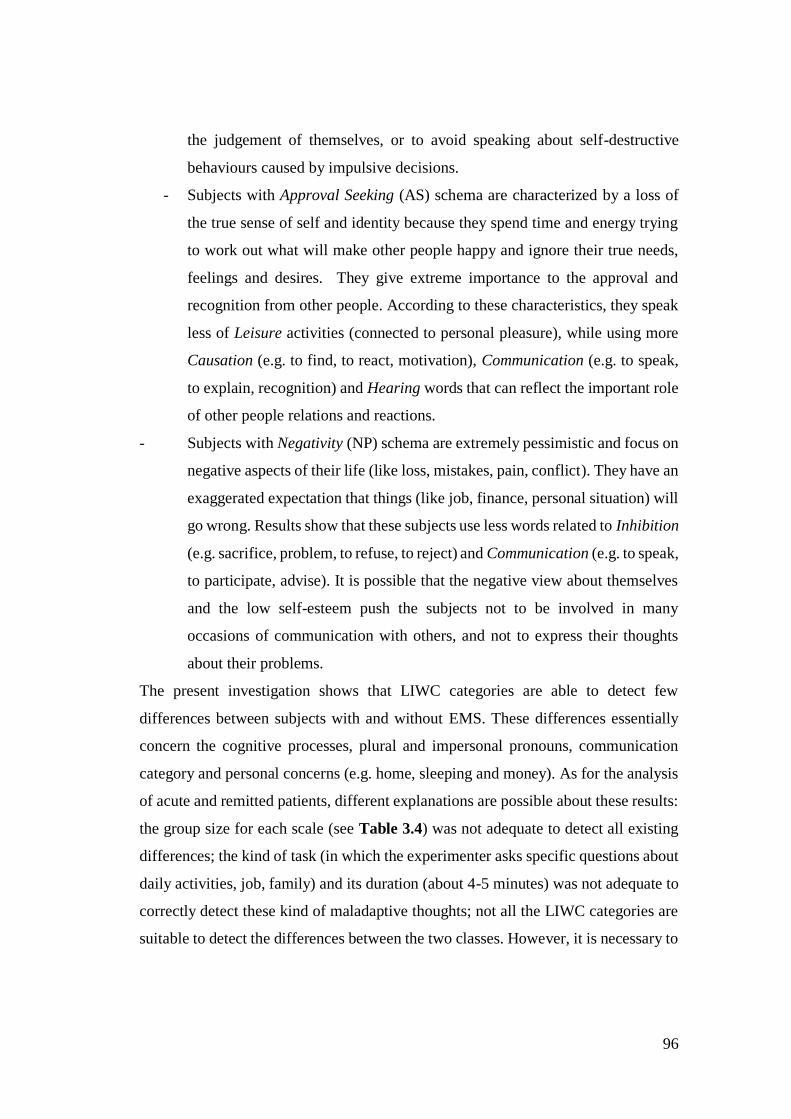
96
the judgement of themselves, or to avoid speaking about self-destructive
behaviours caused by impulsive decisions.
- Subjects with Approval Seeking (AS) schema are characterized by a loss of
the true sense of self and identity because they spend time and energy trying
to work out what will make other people happy and ignore their true needs,
feelings and desires. They give extreme importance to the approval and
recognition from other people. According to these characteristics, they speak
less of Leisure activities (connected to personal pleasure), while using more
Causation (e.g. to find, to react, motivation), Communication (e.g. to speak,
to explain, recognition) and Hearing words that can reflect the important role
of other people relations and reactions.
- Subjects with Negativity (NP) schema are extremely pessimistic and focus on
negative aspects of their life (like loss, mistakes, pain, conflict). They have an
exaggerated expectation that things (like job, finance, personal situation) will
go wrong. Results show that these subjects use less words related to Inhibition
(e.g. sacrifice, problem, to refuse, to reject) and Communication (e.g. to speak,
to participate, advise). It is possible that the negative view about themselves
and the low self-esteem push the subjects not to be involved in many
occasions of communication with others, and not to express their thoughts
about their problems.
The present investigation shows that LIWC categories are able to detect few
differences between subjects with and without EMS. These differences essentially
concern the cognitive processes, plural and impersonal pronouns, communication
category and personal concerns (e.g. home, sleeping and money). As for the analysis
of acute and remitted patients, different explanations are possible about these results:
the group size for each scale (see Table 3.4) was not adequate to detect all existing
differences; the kind of task (in which the experimenter asks specific questions about
daily activities, job, family) and its duration (about 4-5 minutes) was not adequate to
correctly detect these kind of maladaptive thoughts; not all the LIWC categories are
suitable to detect the differences between the two classes. However, it is necessary to
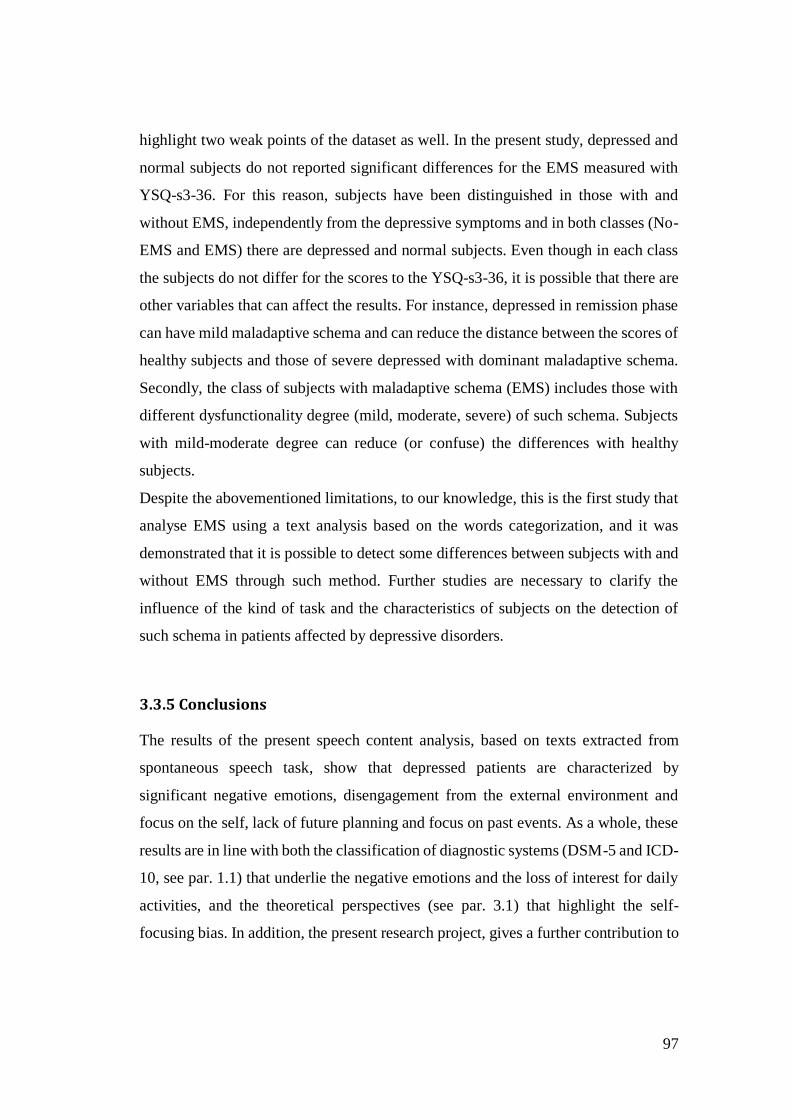
97
highlight two weak points of the dataset as well. In the present study, depressed and
normal subjects do not reported significant differences for the EMS measured with
YSQ-s3-36. For this reason, subjects have been distinguished in those with and
without EMS, independently from the depressive symptoms and in both classes (No-
EMS and EMS) there are depressed and normal subjects. Even though in each class
the subjects do not differ for the scores to the YSQ-s3-36, it is possible that there are
other variables that can affect the results. For instance, depressed in remission phase
can have mild maladaptive schema and can reduce the distance between the scores of
healthy subjects and those of severe depressed with dominant maladaptive schema.
Secondly, the class of subjects with maladaptive schema (EMS) includes those with
different dysfunctionality degree (mild, moderate, severe) of such schema. Subjects
with mild-moderate degree can reduce (or confuse) the differences with healthy
subjects.
Despite the abovementioned limitations, to our knowledge, this is the first study that
analyse EMS using a text analysis based on the words categorization, and it was
demonstrated that it is possible to detect some differences between subjects with and
without EMS through such method. Further studies are necessary to clarify the
influence of the kind of task and the characteristics of subjects on the detection of
such schema in patients affected by depressive disorders.
3.3.5 Conclusions
The results of the present speech content analysis, based on texts extracted from
spontaneous speech task, show that depressed patients are characterized by
significant negative emotions, disengagement from the external environment and
focus on the self, lack of future planning and focus on past events. As a whole, these
results are in line with both the classification of diagnostic systems (DSM-5 and ICD-
10, see par. 1.1) that underlie the negative emotions and the loss of interest for daily
activities, and the theoretical perspectives (see par. 3.1) that highlight the self-
focusing bias. In addition, the present research project, gives a further contribution to
98
the literature studies through the analysis of speech content in patients in remission
and acute phase and in subjects with and without Early Maladaptive Schema (EMS).
In both investigations, it emerges that some words categories of LIWC program are
able to discriminate between the two classes. In future works different speech tasks
should be used and, probably, more than 4-5 minutes of speech recordings are needed
to better understand the differences and commonalities between the two classes (acute
and remitted depressed patients; subject with and without EMS).
Overall, the results give a further proof that it is possible to detect depressive
characteristics using objective, reliable and non-invasive instruments, to support the
diagnostic process currently based on the clinicians’ prospective about the
interpretation of symptoms reported by patients and methodologies (such as clinical
interviews and questionnaires) that are often long, expensive and invasive (see par.
1.2).
99
4 Detecting Depression from speech: results of
automatic classification
4.1 Introduction
As discussed in the first chapter, the current diagnosis of Depression is affected by
several problems (see paragraph 1.2) due to the characteristics of such disease that
tends to be confused with other disorders (e.g. bipolar [BD] and adjustment disorder
[AD]), and for some weakness of current diagnostic process, classification systems
(DSM-5 and ICD-10) and assessment methodologies. The diagnostic process is based
on the experience reported by patients and the opinion and ability of clinicians: in the
first case, there is a risk of biases due to patients’ motivation and the ability to
recognize or express their symptoms; in the second case, there is a risk of biases due
to training and theoretical orientations of the clinicians. The classification systems
(DSM-5 and ICD-10) are based essentially on the “number” and “duration” of a set
of symptoms. No other objective and specific parameters currently exist to facilitate
the diagnosis of the disorder. On the other hand, some of the current assessment
methodologies (unstructured and structured interviews and self-report
questionnaires) - such as Traditional Diagnostic Assessment (TDA: Miller et al.,
2001); Structured Clinical Interview for DSM-5 (SCID: First & Williams, 2016),
BID-II (Beck et al. 1996) - also have some limitations, essentially ascribed to the low
validity and reliability (Gjerdingen et al., 2011; Eaton et al., 2000; Richter et al.,
1998). Probably because of the above limitations, in the recent years, the problem of
Depression detection has attracted significant attention in the affective computing and
social signal processing community and it has been the subject of several
international benchmarking campaigns (see, e.g. Valstar et al., 2013). The proposed
100
approaches are often multimodal (see e.g. Cohn et al., 2009; Scherer et al., 2014), but
methodologies based on the sole speech are not uncommon (see e.g. Alghowinem et
al., 2012; Scherer et al., 2013). One possible explanation is that the collection of
speech data is, on average, less invasive and makes it easier to preserve the anonymity
of the subjects. The most common approach to analyse the speech is to adopt features
inspired by affective computing - e.g., Mel Frequency Cepstral Coefficients, pitch,
formants, energy, turn-taking characteristics - and to feed the resulting feature vectors
to classifiers. In the next paragraphs the main literature studies about these methods
and the results of the present research project, based on the automatic classification
through the Support Vector Machine (SVM), will be presented. The method involved
in the present study will be proposed not only for discriminating depressed and non-
depressed speakers, but also subjects with and without EMS (see par. 2.3.2),
independently from the depressive symptoms.
4.1.1 Literature results
The two most common tasks involved in the automatic speech classification of
Depression are the discrimination between depressed and healthy subjects and the
discrimination among different degree of Depression (e.g. normal, mild, moderate,
severe). The present discussion will be focused on the first kind of task, while for a
review of the second see Cummins et al. (2015). A typical automatic classifier
consists of two parts: the features extraction from the speech signal (such as prosodic,
formant, spectral features), and the application of a computational method to predict
the belonging of the data to one of the two classes (e.g. depressed and non-depressed
subjects). This second part has two main phases: the training of the computational
model to predict a certain output given the input (i.e. the features extracted from
speech signals), and the testing phase in which the classifier use the learnt model to
assign an unseen speech sample to one of the two classes. Different classifiers (such
as Support Vector Machine [SVM], Gaussian Mixture Models [GMM], K-Nearest

101
Neighbors [K-NN], Artificial Neural Network [ANN], etc.)7, have been used to detect
Depression from nonverbal speech behaviour using several prosodic and acoustic
features (e.g. fundamental frequency, MFC coefficients, pauses, loudness, formant,
etc. [for a review see Cumming et al. 2015]). The output of these classifiers are,
generally, reported in terms of accuracy (percentage of subjects attributed to a class
that actually belong to such a class) and/or recall (percentage of samples belonging
to a given class that have actually been attributed to that class). Most of the studies
reported an accuracy of more than 70% demonstrating that, in general, this new
approach based on automatic classifiers can be a useful tool for the diagnosis of
Depression, in addition to the traditional methods (i.e. clinical interviews and self-
report questionnaires [see par 1.3]).
In Scherer et al. (2013), 39 participants (14 depressed and 25 non-depressed) - of
which Depression was assessed with Patient Health Questionnaire (PHQ-9: Kroenke
et al. 2001) - were interviewed through a semi-structured virtual human interviews
(i.e. a wizard-of-Oz controlled virtual human with pre-recorded questions and
animated using a SmartBody architecture [Thiebaux et al., 2008]). The authors
analysed features derived from the glottal source signal provided as an input vector
to an SVM classifier, obtaining an accuracy of 75%. Kiss et al. (2016) recruited a
sample of 53 Hungarian and 11 Italian depressed patients (diagnosed by psychiatrists
and assessed with BDI-II with respect to the Depression degree) matched with 73
Hungarian and 11 Italian controls, to compare SVM and ANN performances. They
extracted segmental parameters (formants, Jitter and Shimmer) and prosodic features
(variance of intensity, range of fundamental frequency, total length of pauses,
articulation and speech rate) from a reading speech. The authors reported an accuracy
of 75% for both methods when the Hungarians were used for training and testing, and
77% when Hungarians were used for training and Italians for testing. Cummins et al.
(2011) extracted prosodic, F0, spectral and glottal features form a reading task
administered to a sample of 23 depressed and 24 control subjects. Using a GMM
7 For a description of such systems see Herrera-Boyer et al. (2003).
102
classifier they found that MFCCs (Mel Frequency Cepstral Coefficients), formants
and the combination of both displayed the strongest discrimination accuracy between
the two samples (from 74% to 79%). However, the authors specify that no formal
measures (i.e. clinical interviews or self-report questionnaires) were used to
differentiate between depressed and control subjects. In a subsequent study
(Cummins et al., 2013) 35 depressed subjects (diagnosed by trained physician
through the HRSD: Hamilton 1960) were asked to repeat a syllabic sequence. The
authors reported 67% of accuracy with the SVM, using a set of features derived from
Modulation Spectrum (defined as the frequency composition of the temporal-
trajectory of each acoustic frequency channel in a spectrogram [Quatieri, 2006]).
Analysing, in the same sample, the first three formant in free response and sustained
vowels, Helfer et al. (2013) reported an accuracy of 76% using SVM and 70% using
GMM classifiers. Alghowinem et al. (2013) tested the differences between
spontaneous and read speech extracting several Low-Level Descriptors (i.e. pitch,
MFCCs, energy, intensity, loudness, formants, jitter shimmer, voice quality, HNR)
from the speech of 30 depressed patients - diagnosed with severe Depression through
HRSD - and matched them with 30 healthy subjects. Using the combination of such
features as vectors of SVM, they found that the recall was higher for spontaneous
(68-69%) than read speech (61-64%). They also extracted several acoustic features
(F0, MFCC, energy, intensity, formants, voice quality) from the spontaneous speech
used as vectors in a GGM classifier, obtaining the 64% of recall (Alghowinem et al.
2012). Using the same speech recordings, Alghowinem et al. (2013b) compared the
performance of different classifiers (SVM, HFA [Hierarchical Fuzzy Signature],
MLP [Multilayer Perception Neural Network], GMM) and fusion methods as well.
They found that the fusion of GMM and SVM classifiers perform best (81% of
recall), followed by SVM (76% of recall). Similar results are reported in the study of
Jiang et al. (2017), in which 85 depressed subjects (diagnosed according to PHQ-9
scores) and 85 controls were recruited and submitted to three different tasks (reading,
interview, picture description). The authors compared three methods (SVM, GMM
and K-NN) using LLD features, finding that the accuracy is slightly higher for SVM
103
(65%) than GMM and K-NN (60-62%), while the picture description performed best
(68%) than interview (63%) and reading (60%) tasks. Joshi et al. (2013) computed
the SVM using F0, loudness, intensity and MFCCs features extracted from an
interview task administered to 30 depressed patients (diagnosed by psychiatrists) and
30 healthy subjects, finding that the combination of such features performed better
(83%) than the individuals ones (63% to 73%). Memon et al. (2009) used MFCCs
extracted from a set of 70 depressed and 68 non-depressed spontaneous speech, and
reported an accuracy of 71% using a GMM classifier. However, no indication there
is regarding the methodology (e.g. clinical interview, self-report questionnaires) used
to diagnose the participants’ Depression.
Despite the abovementioned studies reported high accuracy level for the automatic
discrimination of Depression (from 68% to 80%), they have some limitations. Firstly,
most of them have used depressive symptoms scales (e.g. PHQ-9, HRSD) to diagnose
the disorder (see Scherer et al. 2013; Alghowinem et al., 2013; Jiang et al., 2017;
Joshi et al., 2013). One of the problem of self-report scales is that the cut-off point to
determine the Depression degree usually depends on the sample characteristics (age,
pathology, educational level) and patients diagnosis (type of Depression, severity of
symptoms, clinical phase), hence, the scores can change according to all these factors
(Sanchez-Villegas et al., 2008). In addition, although subjects can report a certain
Depression degree to the self-report, without a diagnosis by clinician, it is not possible
to determine whether the condition reflects or not a depressive disorder – this requires
the presence of specific symptoms occurred for a certain period of time [see Box 1.2]
- and which disorder it is MDD, BD, etc.).
Secondly, most of them do not report specific socio-demographic information (e.g.
age, gender, educational level) of both depressed and control subjects, and do not
specify the kind of Depression, referring to the participants only as “depressed
speakers” (Kiss et al., 2013; Cummins et al., 2013; Helfer et al., 2013; Memon et al.
2009). In these cases, even though the classifier reports a high accuracy level, it is
not certain that the discrimination of the two classes (depressed and non-depressed)
is based only on the depressive characteristics, or is affected by other uncontrolled
104
variables (i.e. socio-demographic and clinical characteristics). Finally, most of them
(with few exception, see Kiss et al., 2013; Jiang et al., 2017) have involved a small
size of depressed subjects (around 30 participants).
Given these limitations, the first goal of the present part of the project is to propose
an automatic classification of Depression using a large sample of depressed patients
(62 subjects in total) and healthy controls (54 subjects in total). Depressed patients
were matched with control subjects with respect to gender, educational level,
employment and marital status (see Figure 2.1 in par. 2.3.1). The goal is to ensure
that the approach actually detects Depression and not speaking differences that might
result from other factors. Furthermore, the depressed subjects have been diagnosed
as such by professional psychiatrists and, at the time of the data collection, they were
being treated for Depression in medical structures. As discussed before, this
represents a major advantage with respect to corpora where the subjects fill
questionnaires (like the BDI-II and HRSD), but have not actually been diagnosed as
depressed. The reason is that it becomes possible to avoid the risk to deal with data
that does not reflect actual psychiatric problems (Stone et al., 1999) and, hence,
leading to more realistic estimates of the computational approaches’ performance. In
the next paragraphs, participants and experimental set-up, the approach, data analyses
and results will be described.
All previous studies on the automatic classification, discriminate the two classes of
depressed and non-depressed subjects according to the diagnostic criteria (DSM-5
and ICD-10). The second goal of the present analysis is to propose an automatic
classification based on Early Maladaptive Schema (EMS) typical of depressive
disorders as well. While the depressive symptoms change and/or disappear according
to the clinical phase (acute, remission, relapse), the Early Maladaptive Schema are
stable traits that are resistant to change (Young et al. 2003; Riso et al., 2006). The
goal is to evaluate if it is possible to discriminate speech characteristics of subjects
with and without Early Maladaptive Schemas, independently from the presence of
depressive symptoms.
105
4.1.2 Participants and Experimental set-up
The clinical group was composed by 62 patients (Pt; 41 female; range age=19-68;
mean age=47.77; Sd=±11.57): 32 with Major Depressive Disorder (MDD), 15 with
Bipolar Disorder (BD), 8 with Adjustment Disorder with Depressed Mood (AD), 7
with endo-reactive Depression (ENDO-R). The control group was composed by 54
healthy subjects (Hc; 41 female; range age=22-71; mean age=47.38; Sd=±12.76). For
details of socio-demographic and clinical characteristics see paragraph 2.3.1.
For the classification based on Early Maladaptive Schema (EMS), all sample of 116
subjects (62 patients and 54 controls) have been distinguished according to the
presence or not of the investigated schemas. For the number of subjects with and
without maladaptive schemas (EMS and No-EMS respectively) see Table 4.5.
Regarding the experimental set-up, in the present paragraph only the speech tasks
will be shortly described. For a detailed description of all the administered tests see
par.2.3.2. The speech tasks were composed by a spontaneous (Diary) and read (Tale)
speech. In the first one, the experimenter asked the subjects to talk (for 4-5 minutes)
about their hobbies, job, family, etc. In the second task, the subjects had to read aloud
an Aesop tale (The North Wind and the Sun). Few recordings had to be discarded
because of technical difficulties and, as a result, the data available for the two tasks
are as follow: for Diary recordings 62 depressed and 52 control subjects; for Tale
recordings 57 depressed and 54 control subjects.
4.1.3 The approach
The proposed method is composed by four steps: the first one is the manual extraction
of experimenters’ voice from Diary recordings using PRAAT software (Boersma,
2002). The second step, applied on both Diary and Tale samples, is the automatic
segmentation of each recording into speech/non-speech intervals. For this purpose a
106
MATLAB script8, based on two audio features (signal energy and spectral centroid)
has been performed. The third step is the automatic feature extraction aimed at
converting every speech interval into a vector. The final step was the automatic
classification with SVM classifier using the extracted vectors.
The feature extraction is performed with OpenSmile (Eyben et al., 2013), a publicly
available tool commonly adopted for the inference of social and psychological
phenomena from speech. The feature set - known as IS09 (Zhang et al., 2015) - is
extracted following the methodologies of computational paralinguistics. First, 16
short-term features are extracted from 25 ms long analysis windows that span the
whole sample being processed at regular time steps of 10 ms. The 16 features are:
Root Mean Square (RMS) of the energy (i.e. the average power of the signal [for
details see Panagiotakis & Tziritas, 2005), the first 12 Mel Frequency Cepstrum
Coefficients (MFCCs; i.e. representations of the short-term power spectrum of the
signal [for details see On et al., 2006]), the Zero Crossing Rate (ZCR; i.e. the rate at
which the signal changes from positive to negative or back [for details see Chen,
1988]), the Voicing Probability (i.e. the percentage of unvoiced and voiced energy in
a speech signal [for details see Yeldener, 2001] and the pitch (F0, i.e. the relative
highness or lowness of a tone as perceived by the ear [for details see de Cheveigné,
2005]). After these features are available, it is possible to extract their ∆’s, i.e. the
differences between consecutive frames, thus leading the total number of features to
32. Finally, once these 32 features have been extracted from all short-term windows,
their distribution across the speech sample is represented through the following 12
statistics: minimum, maximum, range, position of the windows where maximum and
minimum have been extracted, mean, slope and offset of the linear approximation of
the contour, difference between linear approximation and actual contour, standard
deviation, third and fourth order moment. As a result, the feature vector representing
a sample includes 32 x 12= 384 features. The vectors are used as input to a kernel
8 For the script details see the following webpage:
https://uk.mathworks.com/matlabcentral/fileexchange/28826-silence-removal-in-speech-
signals?ue&nocookie=true
107
Support Vector Machine (SVM). The SVM is a supervised learning model based on
learning algorithms to classify the data. Given a set of training examples, the goal is
to build a model that assigns new examples to one of the two investigated classes (in
this case depressed and healthy subjects). An SVM model is a representation of the
vectors as points in space, mapped so that the vectors of the two classes are divided
by a clear gap. New examples are mapped into the space and predicted to belong to a
class based on which side of the gap they fall. The SVM is performed in two
conditions: the first one is with all the extracted features, the second one is with the
Infinite Latent Feature Selection (ILFS, (Roffo et al., 2017). The ILFS is an approach
aimed to reduce the dimensionality of the feature vectors, selecting the subset of the
features expected to be most likely to discriminate between depressed and control
subjects. It is a probabilistic latent graph-based feature selection algorithm that
performs the ranking step while considering all the possible subsets of features, as
paths on a graph. Since the experiments follow a leave-one-out approach, the feature
selection is applied over a different training set at every iteration. Since it is a
statistical process, the subset of the selected features is likely to change at every
iteration. Thus, every feature will be selected only in a fraction of the iterations and
the higher such a fraction, the higher the chance that the feature acts as a Depression
marker, i.e., that it makes the difference between depressed and control subjects.
4.1.4 Data Analyses and Results
The experiments follow a leave-one-out approach: all subjects except one are used to
perform the feature selection and to train the SVM aimed at doing the actual
classification. The resulting system is then tested over the left-out subject. The
process is iterated as many times as there are subjects and, at each iteration, a different
subject is left out. The performance of the classifier will be reported in terms of:
- Precision π (or positive predictive value) = percentage of subjects attributed
to a class that actually belong to such a class;
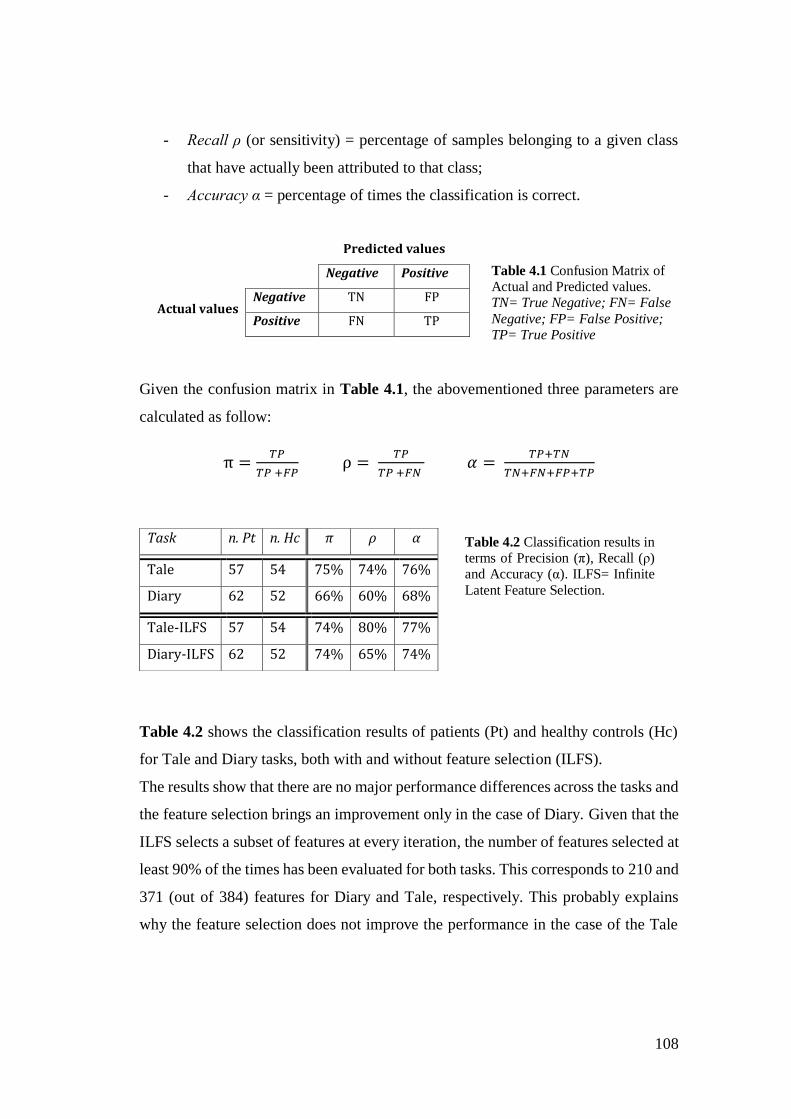
108
- Recall ρ (or sensitivity) = percentage of samples belonging to a given class
that have actually been attributed to that class;
- Accuracy α = percentage of times the classification is correct.
Predicted values
Negative Positive
Actual values Negative TN FP
Positive FN TP
Given the confusion matrix in Table 4.1, the abovementioned three parameters are
calculated as follow:
π =𝑇𝑃
𝑇𝑃 +𝐹𝑃 ρ =
𝑇𝑃
𝑇𝑃 +𝐹𝑁 𝛼 =
𝑇𝑃+𝑇𝑁
𝑇𝑁+𝐹𝑁+𝐹𝑃+𝑇𝑃
Table 4.2 shows the classification results of patients (Pt) and healthy controls (Hc)
for Tale and Diary tasks, both with and without feature selection (ILFS).
The results show that there are no major performance differences across the tasks and
the feature selection brings an improvement only in the case of Diary. Given that the
ILFS selects a subset of features at every iteration, the number of features selected at
least 90% of the times has been evaluated for both tasks. This corresponds to 210 and
371 (out of 384) features for Diary and Tale, respectively. This probably explains
why the feature selection does not improve the performance in the case of the Tale
Task n. Pt n. Hc π ρ α
Tale 57 54 75% 74% 76%
Diary 62 52 66% 60% 68%
Tale-ILFS 57 54 74% 80% 77%
Diary-ILFS 62 52 74% 65% 74%
Table 4.2 Classification results in terms of Precision (π), Recall (ρ) and Accuracy (α). ILFS= Infinite
Latent Feature Selection.
Table 4.1 Confusion Matrix of Actual and Predicted values. TN= True Negative; FN= False
Negative; FP= False Positive; TP= True Positive
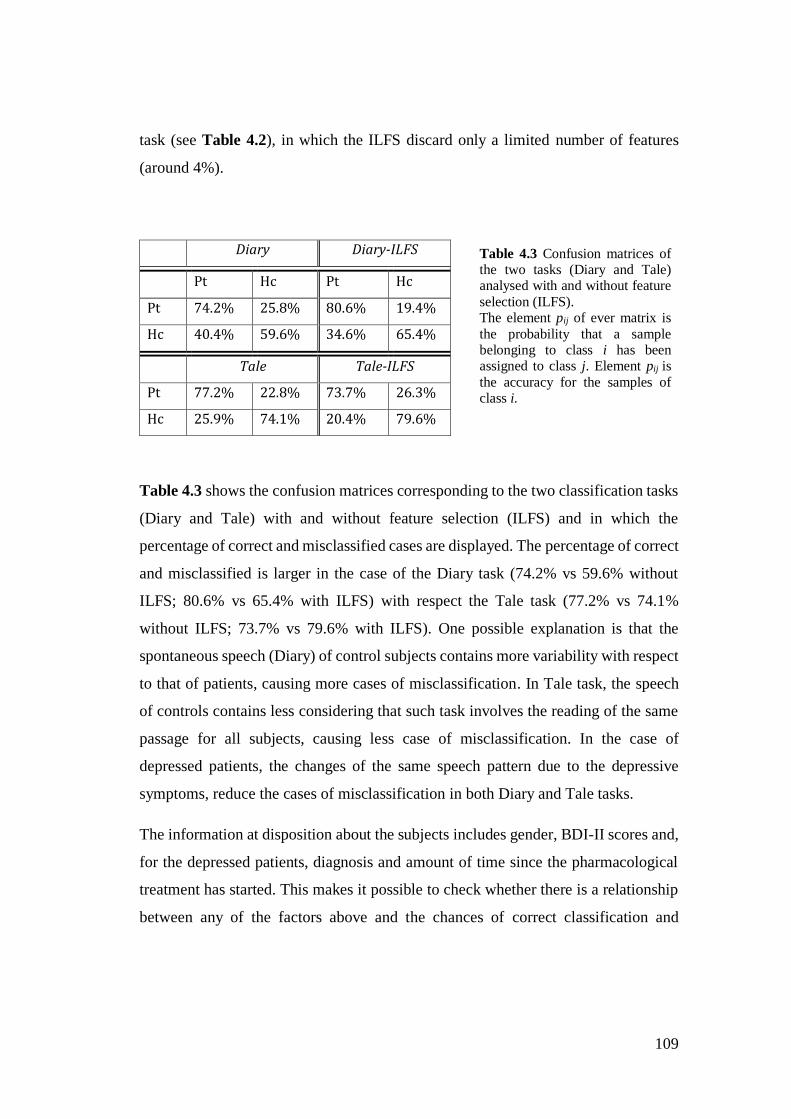
109
task (see Table 4.2), in which the ILFS discard only a limited number of features
(around 4%).
Table 4.3 shows the confusion matrices corresponding to the two classification tasks
(Diary and Tale) with and without feature selection (ILFS) and in which the
percentage of correct and misclassified cases are displayed. The percentage of correct
and misclassified is larger in the case of the Diary task (74.2% vs 59.6% without
ILFS; 80.6% vs 65.4% with ILFS) with respect the Tale task (77.2% vs 74.1%
without ILFS; 73.7% vs 79.6% with ILFS). One possible explanation is that the
spontaneous speech (Diary) of control subjects contains more variability with respect
to that of patients, causing more cases of misclassification. In Tale task, the speech
of controls contains less considering that such task involves the reading of the same
passage for all subjects, causing less case of misclassification. In the case of
depressed patients, the changes of the same speech pattern due to the depressive
symptoms, reduce the cases of misclassification in both Diary and Tale tasks.
The information at disposition about the subjects includes gender, BDI-II scores and,
for the depressed patients, diagnosis and amount of time since the pharmacological
treatment has started. This makes it possible to check whether there is a relationship
between any of the factors above and the chances of correct classification and
Diary Diary-ILFS
Pt Hc Pt Hc
Pt 74.2% 25.8% 80.6% 19.4%
Hc 40.4% 59.6% 34.6% 65.4%
Tale Tale-ILFS
Pt 77.2% 22.8% 73.7% 26.3%
Hc 25.9% 74.1% 20.4% 79.6%
Table 4.3 Confusion matrices of the two tasks (Diary and Tale) analysed with and without feature
selection (ILFS). The element pij of ever matrix is
the probability that a sample belonging to class i has been assigned to class j. Element pij is
the accuracy for the samples of class i.
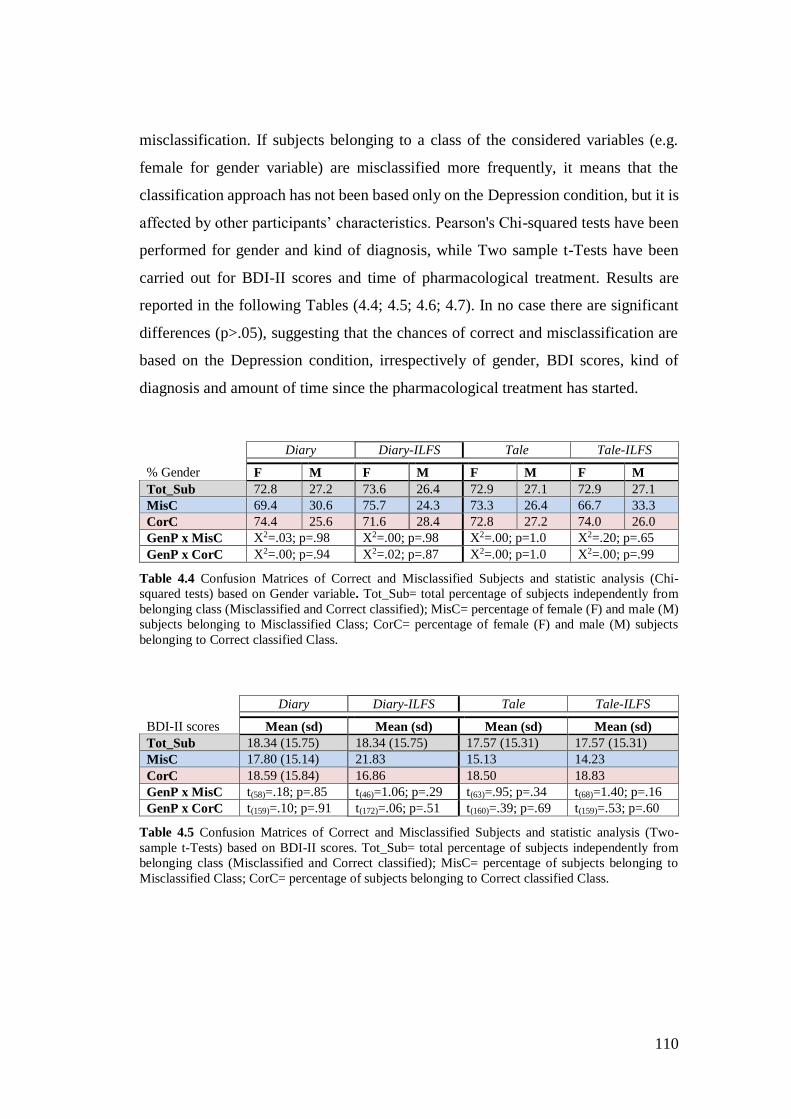
110
misclassification. If subjects belonging to a class of the considered variables (e.g.
female for gender variable) are misclassified more frequently, it means that the
classification approach has not been based only on the Depression condition, but it is
affected by other participants’ characteristics. Pearson's Chi-squared tests have been
performed for gender and kind of diagnosis, while Two sample t-Tests have been
carried out for BDI-II scores and time of pharmacological treatment. Results are
reported in the following Tables (4.4; 4.5; 4.6; 4.7). In no case there are significant
differences (p>.05), suggesting that the chances of correct and misclassification are
based on the Depression condition, irrespectively of gender, BDI scores, kind of
diagnosis and amount of time since the pharmacological treatment has started.
Diary Diary-ILFS Tale Tale-ILFS
% Gender F M F M F M F M
Tot_Sub 72.8 27.2 73.6 26.4 72.9 27.1 72.9 27.1
MisC 69.4 30.6 75.7 24.3 73.3 26.4 66.7 33.3
CorC 74.4 25.6 71.6 28.4 72.8 27.2 74.0 26.0
GenP x MisC X2=.03; p=.98 X2=.00; p=.98 X2=.00; p=1.0 X2=.20; p=.65
GenP x CorC X2=.00; p=.94 X2=.02; p=.87 X2=.00; p=1.0 X2=.00; p=.99
Table 4.4 Confusion Matrices of Correct and Misclassified Subjects and statistic analysis (Chi-
squared tests) based on Gender variable. Tot_Sub= total percentage of subjects independently from
belonging class (Misclassified and Correct classified); MisC= percentage of female (F) and male (M)
subjects belonging to Misclassified Class; CorC= percentage of female (F) and male (M) subjects
belonging to Correct classified Class.
Diary Diary-ILFS Tale Tale-ILFS
BDI-II scores Mean (sd) Mean (sd) Mean (sd) Mean (sd)
Tot_Sub 18.34 (15.75) 18.34 (15.75) 17.57 (15.31) 17.57 (15.31)
MisC 17.80 (15.14) 21.83 15.13 14.23
CorC 18.59 (15.84) 16.86 18.50 18.83
GenP x MisC t(58)=.18; p=.85 t(46)=1.06; p=.29 t(63)=.95; p=.34 t(68)=1.40; p=.16
GenP x CorC t(159)=.10; p=.91 t(172)=.06; p=.51 t(160)=.39; p=.69 t(159)=.53; p=.60
Table 4.5 Confusion Matrices of Correct and Misclassified Subjects and statistic analysis (Two-
sample t-Tests) based on BDI-II scores. Tot_Sub= total percentage of subjects independently from
belonging class (Misclassified and Correct classified); MisC= percentage of subjects belonging to
Misclassified Class; CorC= percentage of subjects belonging to Correct classified Class.
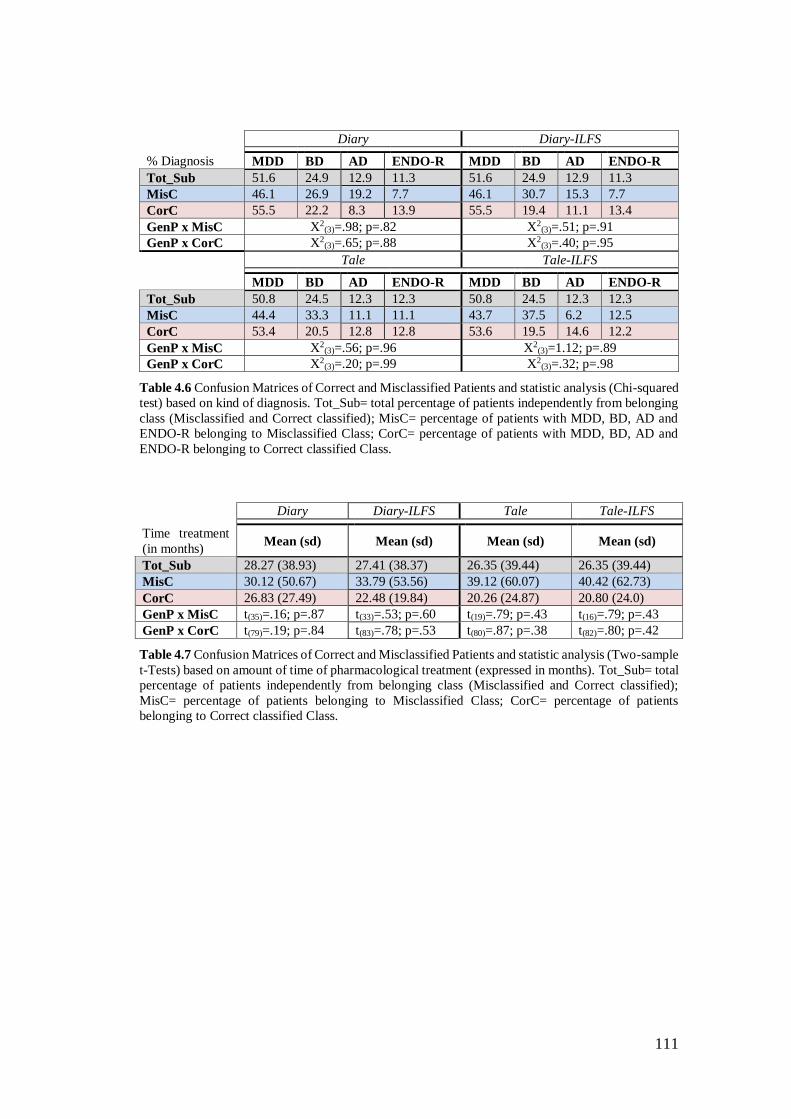
111
Diary Diary-ILFS
% Diagnosis MDD BD AD ENDO-R MDD BD AD ENDO-R
Tot_Sub 51.6 24.9 12.9 11.3 51.6 24.9 12.9 11.3
MisC 46.1 26.9 19.2 7.7 46.1 30.7 15.3 7.7
CorC 55.5 22.2 8.3 13.9 55.5 19.4 11.1 13.4
GenP x MisC X2(3)=.98; p=.82 X2
(3)=.51; p=.91
GenP x CorC X2(3)=.65; p=.88 X2
(3)=.40; p=.95
Tale Tale-ILFS
MDD BD AD ENDO-R MDD BD AD ENDO-R
Tot_Sub 50.8 24.5 12.3 12.3 50.8 24.5 12.3 12.3
MisC 44.4 33.3 11.1 11.1 43.7 37.5 6.2 12.5
CorC 53.4 20.5 12.8 12.8 53.6 19.5 14.6 12.2
GenP x MisC X2(3)=.56; p=.96 X2
(3)=1.12; p=.89
GenP x CorC X2(3)=.20; p=.99 X2
(3)=.32; p=.98
Table 4.6 Confusion Matrices of Correct and Misclassified Patients and statistic analysis (Chi-squared
test) based on kind of diagnosis. Tot_Sub= total percentage of patients independently from belonging
class (Misclassified and Correct classified); MisC= percentage of patients with MDD, BD, AD and
ENDO-R belonging to Misclassified Class; CorC= percentage of patients with MDD, BD, AD and
ENDO-R belonging to Correct classified Class.
Diary Diary-ILFS Tale Tale-ILFS
Time treatment
(in months) Mean (sd) Mean (sd) Mean (sd) Mean (sd)
Tot_Sub 28.27 (38.93) 27.41 (38.37) 26.35 (39.44) 26.35 (39.44)
MisC 30.12 (50.67) 33.79 (53.56) 39.12 (60.07) 40.42 (62.73)
CorC 26.83 (27.49) 22.48 (19.84) 20.26 (24.87) 20.80 (24.0)
GenP x MisC t(35)=.16; p=.87 t(33)=.53; p=.60 t(19)=.79; p=.43 t(16)=.79; p=.43
GenP x CorC t(79)=.19; p=.84 t(83)=.78; p=.53 t(80)=.87; p=.38 t(82)=.80; p=.42
Table 4.7 Confusion Matrices of Correct and Misclassified Patients and statistic analysis (Two-sample
t-Tests) based on amount of time of pharmacological treatment (expressed in months). Tot_Sub= total
percentage of patients independently from belonging class (Misclassified and Correct classified);
MisC= percentage of patients belonging to Misclassified Class; CorC= percentage of patients
belonging to Correct classified Class.
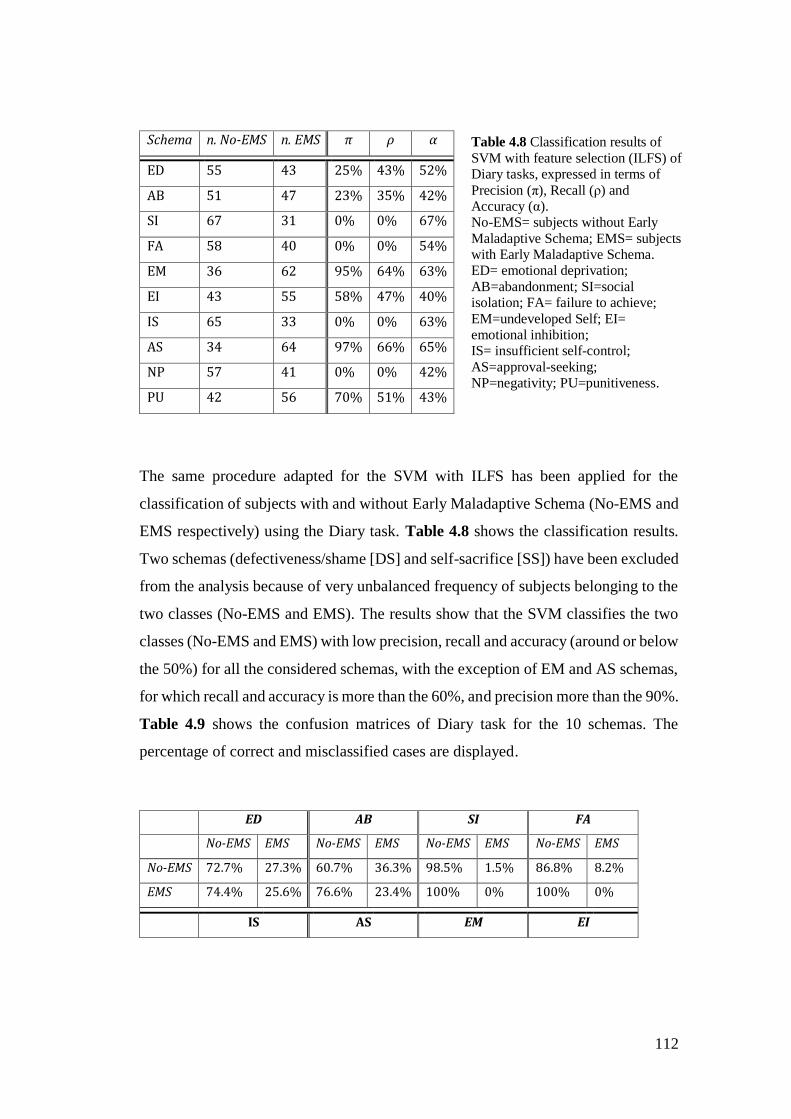
112
The same procedure adapted for the SVM with ILFS has been applied for the
classification of subjects with and without Early Maladaptive Schema (No-EMS and
EMS respectively) using the Diary task. Table 4.8 shows the classification results.
Two schemas (defectiveness/shame [DS] and self-sacrifice [SS]) have been excluded
from the analysis because of very unbalanced frequency of subjects belonging to the
two classes (No-EMS and EMS). The results show that the SVM classifies the two
classes (No-EMS and EMS) with low precision, recall and accuracy (around or below
the 50%) for all the considered schemas, with the exception of EM and AS schemas,
for which recall and accuracy is more than the 60%, and precision more than the 90%.
Table 4.9 shows the confusion matrices of Diary task for the 10 schemas. The
percentage of correct and misclassified cases are displayed.
Schema n. No-EMS n. EMS π ρ α
ED 55 43 25% 43% 52%
AB 51 47 23% 35% 42%
SI 67 31 0% 0% 67%
FA 58 40 0% 0% 54%
EM 36 62 95% 64% 63%
EI 43 55 58% 47% 40%
IS 65 33 0% 0% 63%
AS 34 64 97% 66% 65%
NP 57 41 0% 0% 42%
PU 42 56 70% 51% 43%
ED AB SI FA
No-EMS EMS No-EMS EMS No-EMS EMS No-EMS EMS
No-EMS 72.7% 27.3% 60.7% 36.3% 98.5% 1.5% 86.8% 8.2%
EMS 74.4% 25.6% 76.6% 23.4% 100% 0% 100% 0%
IS AS EM EI
Table 4.8 Classification results of
SVM with feature selection (ILFS) of Diary tasks, expressed in terms of
Precision (π), Recall (ρ) and Accuracy (α). No-EMS= subjects without Early
Maladaptive Schema; EMS= subjects with Early Maladaptive Schema. ED= emotional deprivation;
AB=abandonment; SI=social isolation; FA= failure to achieve;
EM=undeveloped Self; EI= emotional inhibition; IS= insufficient self-control;
AS=approval-seeking; NP=negativity; PU=punitiveness.
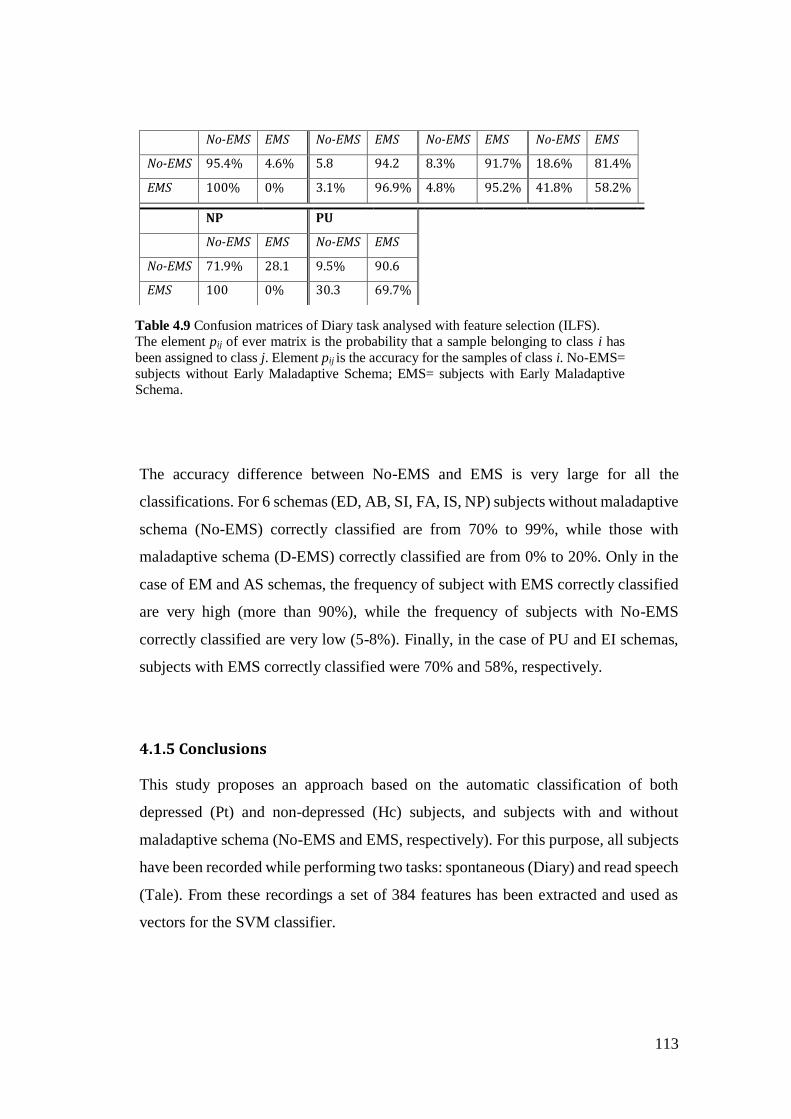
113
The accuracy difference between No-EMS and EMS is very large for all the
classifications. For 6 schemas (ED, AB, SI, FA, IS, NP) subjects without maladaptive
schema (No-EMS) correctly classified are from 70% to 99%, while those with
maladaptive schema (D-EMS) correctly classified are from 0% to 20%. Only in the
case of EM and AS schemas, the frequency of subject with EMS correctly classified
are very high (more than 90%), while the frequency of subjects with No-EMS
correctly classified are very low (5-8%). Finally, in the case of PU and EI schemas,
subjects with EMS correctly classified were 70% and 58%, respectively.
4.1.5 Conclusions
This study proposes an approach based on the automatic classification of both
depressed (Pt) and non-depressed (Hc) subjects, and subjects with and without
maladaptive schema (No-EMS and EMS, respectively). For this purpose, all subjects
have been recorded while performing two tasks: spontaneous (Diary) and read speech
(Tale). From these recordings a set of 384 features has been extracted and used as
vectors for the SVM classifier.
No-EMS EMS No-EMS EMS No-EMS EMS No-EMS EMS
No-EMS 95.4% 4.6% 5.8 94.2 8.3% 91.7% 18.6% 81.4%
EMS 100% 0% 3.1% 96.9% 4.8% 95.2% 41.8% 58.2%
NP PU
No-EMS EMS No-EMS EMS
No-EMS 71.9% 28.1 9.5% 90.6
EMS 100 0% 30.3 69.7%
Table 4.9 Confusion matrices of Diary task analysed with feature selection (ILFS). The element pij of ever matrix is the probability that a sample belonging to class i has
been assigned to class j. Element pij is the accuracy for the samples of class i. No-EMS= subjects without Early Maladaptive Schema; EMS= subjects with Early Maladaptive Schema.
114
The automatic discrimination of Depression involves one of the largest and complete
(i.e. with much socio-demographic and clinical information accessible) corpora
available in the literature, including 62 depressed patients and 54 control subjects.
Unlike most of the studies in the literature (see par 4.1.1), the depressed patients of
the corpus have been diagnosed as such by psychiatrists during their actual clinical
activity. In addition, socio-demographic (gender, age, educational level, employment
and marital status) and clinical information (kind of diagnosis and level of depressive
symptoms) have been obtained during the experiments. The results show that it is
possible to achieve an accuracy of 75% and 66% for Tale and Diary respectively,
when no feature selection approach is applied. The accuracy for Diary improves to
74% when the ILSF is used, while it remains the same for Tale. This is probably due
to the fact that, while the ILFS discards a small number of features (around 4%) in
the read speech (Tale), this is not the case for spontaneous speech (Diary), in which
around 44% of features have been discarded. In other words, the number of features
that act as Depression markers is significantly larger in read speech compared to
spontaneous speech. This probably explains why the performance over the two tasks
is similar even if the number of features discarded in the case of the Diary task is
larger and, hence, the classifier should be trained more effectively. However, in the
case of Tale, depressed and control subjects are classified correctly with the same
performance (more than 74%), while in the case of spontaneous speech, depressed
subjects are detected with higher accuracy than the control ones (74% against 60%
without ILFS; 80% against 65% with ILFS). A possible explanation is that healthy
subjects present more variability in the characteristics of spontaneous speech than
depressed subjects, determining more misclassified cases.
The error analysis shows that the accuracy is the same for male and female subjects,
subjects with different BDI-II scores, and for depressed patients diagnosed with
different types of Depression and with different length of pharmacological treatment.
This suggests that the effect of these factors on the accuracy, if any, is too weak to be
observed with the data available.
115
Overall, this finding seems to suggest that read speech captures more effectively the
difference between depressed and control subjects. However, in both cases (Diary
and Tale), speech carries a large number of Depression markers, but no small subset
of them can be identified that actually makes the difference between depressed and
control subjects.
The classification accuracy of 75% is in line with other studies that used the same
(SVM) or different classifiers (such as GMM) reporting more than 70% of accuracy
(see par. 4.1.1). These results suggest that the automatic classification based on the
combination of several speech parameters can be a quick, objective and non-invasive
method to detect the Depression, in addition to statistical methods based on the
analysis of single parameters (see Chapter 2).
The SVM classifier failed with respect to the discrimination between subject with and
without EMS (the accuracy levels are from 42 to 67%). These last ones are enduring
believes (or thoughts) about oneself and the world emerging when subjects express
their idea related to these schemas (e.g. the fear of being abandoned by own partner,
or the belief of being less capable than the work colleagues). It is possible that such
thoughts do not cause changes of paralinguistic features, but they can be detected
with the analysis or verbal speech characteristics through which it is possible to
investigate linguistic, cognitive and emotional dimensions. This is demonstrated, at
least partially, by the results about the content speech analysis reported in Chapter 3,
according to which subjects with and without maladaptive schemas show some
differences with respect to several LIWC verbal categories (see par. 3.3.4.3).
Future studies should better investigate the influence of the kind of task (e.g. compare
structured and unstructured interviews) on the automatic classification approach. It
should also be useful analysing and comparing different features combination (e.g.
combine verbal and nonverbal speech features) to discriminate a subset of features
that work best with the automatic classifiers.
116
Conclusions
The goal of the present research project was to investigate verbal and nonverbal
behaviour in patients with depressive disorders, comparing their performance with
that of healthy control subjects, using two speech tasks (reading and spontaneous
speech, called Tale and Diary respectively). In addition, differences between acute
and remitted patients and subjects with and without Early Maladaptive Schema
(EMS: Young et al., 2003) regarding both verbal and nonverbal characteristics have
been investigated.
In Chapter 2, a set of paralinguistic features (for details see Appendix 1) was
extracted through a manual transcription of both Tale and Diary narratives and
analysed through a statistical approach. Differences due to depressive symptoms were
investigated comparing depressed patients (n.30) with healthy subjects (n.30), and
depressed in acute (n. 19) and remission phase (n.10).
The results show that duration and mean length parameters of the extracted features
appear to be good indicators of Depression. However, it is necessary to consider also
the influence of the education variable, considering that in some cases significant
differences were found only when the interaction between depressive symptoms and
educational level is considered. In the case of Tale narratives, patients with high
education (included Upper Secondary and University degree) show a slower reading
speed and longer empty pauses then healthy subjects with the same educational level.
While, comparing patients and controls with low education (included Primary and
Lower Secondary) the differences with respect to the Tale parameters are not
significant. This means that especially people with high education suffer from the
effect of depressive symptoms on reading activity.
117
In the case of Diary recordings, differences between depressed patients and healthy
subjects were found for the mean length parameter of the extracted features.
Particularly, patients show a greater mean length of clauses, empty pauses, and
lengthening at the final position of words, and shorter lengthening at the middle
position of words, independently of the educational level. Instead, the mean length of
filled pauses is affected from the educational level: patients with low education
reported longer mean length of fillers then controls with the same educational level.
Finally, the total duration of empty pauses is longer for patients with high education
compared with controls with the same educational level.
The greater mean length of several features could be due to impairments in planning
and decision-making processes causing the need of more time to plan what saying
during a conversation. However, the results of lengthening - longer at the final
position and shorter at the middle position of words - may suggest that patients spend
more time to plane the next part of the speech already during the pronunciation of the
words, while healthy subjects active this process at the end of the words.
Finally, it was found that the subgroup of acute patients has shorter phonation time
then controls, while no significant differences emerge between remitted patients and
controls. The shorter phonation time is probably due to the psychomotor agitation
present in the subgroup of acute patients (who suffer from moderate-severe
Depression), while this symptom is not present in remitted patients (characterized by
the absence or mild Depression).
The results about Diary recordings suggest that each speech parameter may reflect
different impairments (e.g. decision-making, psychomotor agitation) in depressive
disorders and a complex system, involving physical, emotional and cognitive
functions, is necessary to consider for better understanding the speech changes in
Depression.
In Chapter 3, the verbal behaviour of depressed patients was investigated using the
Diary narratives. The verbal features were extracted with a computerized text analysis
(LIWC) that classifies the words of a give text in several categories (e.g. affective,
118
cognitive, linguistic, etc., for details see par. 3.3.2). After this, the frequency of words
categories have been analysed through a statistical approach. As for the nonverbal
analysis in Chapter 1, also in this case both differences between depressed patients
(n.30) and healthy subjects (n.30), and depressed in acute (n. 19) and remission phase
(n.10) were investigated. In addition, the speech content in subjects with and without
EMS regardless of depressive symptoms was analysed as well.
According to several theoretical perspectives (Beck et al., 2002; Carver & Scheider
1998; Williams et al., 1990; Pyszcynski & Greenberg, 1987; Ingram, 1990) the
depressed patients’ speech is characterized by significant negative emotions,
disengagement from the external environment, focus on the self, lack of future
planning and focus on past events. Comparing the two subgroups of patients in acute
and remitted phase, it emerges that the first one, according to their Depression
severity (moderate-severe degree), uses less leisure and external activities references,
and express more words about negative emotions.
Few differences were found between subjects with and without EMS for the
investigated verbal features (see results in paragraph 3.3.4.3), essentially regarding
the cognitive processes, plural and impersonal pronouns, communication category
and personal concerns (e.g. home, sleeping and money). These results suggest that if
subjects with and without EMS differ for the frequency of several word categories
used during the spontaneous speech, these are too weak for being detected with the
collected data, the type of task (unstructured interview), or the kind of tool (LIWC)
used in this study.
Finally, in Chapter 4 nonverbal behaviour of depressed patients was studied through
an automatic approach. A set of paralinguistic features was automatically extracted
from Tale and Diary recordings of 62 patients and 54 controls. Such features were
used as input vectors to a Support Vector Machine (SVM) classifier. The SVM was
trained with all the extracted features, and a reduced set of features extracted through
the Infinite Latent Feature Selection (ILFS: Roffo et al. 2017) approach. This
algorithm selects the subset of features expected to be most likely to discriminate
119
between depressed and control subjects. The results show that it is possible to achieve
an accuracy of 75% and 66% for Tale and Diary respectively, when no feature
selection is applied. The accuracy for Diary improves to 74% when the feature
selection approach is used, while no improvements are observed for the Tale
recordings. Such results demonstrate that, not only the analysis of single parameters
can allow to identify markers able to discriminate between depressed and not
depressed states (as shown in Chapter 2 and 3), but also the combination of a large
set of speech parameters using the automatic classification approach.
Contrarily to these results, the automatic discrimination between subjects with and
EMS do not report a good accuracy (from 42 to 67%), and many subjects with
maladaptive schemas are misclassified (from 40 to 100%), suggesting that
dysfunctional thoughts do not probably engender changes of paralinguistic features,
but they can partially detected through the verbal speech analysis (see Chapter 3).
The data analysed in the present research project prove that the investigation of
speech features can be a useful instrument, in addition to the current self-reports and
clinical interviews (see Chapter 1), for helping the diagnosis of depressive disorders.
The implementation in a linguistic tool of a set of verbal and nonverbal features, that
are the best indicators of depressive symptoms (e.g. length of phonation time and
empty pauses; using of the first personal pronoun), can offer several advantages. In
fact, this method can allow objective and replicable measurements of speech
parameters, not risking biases due to the patient’s characteristics and/or clinicians
evaluation, reducing misclassification cases. In addition, contrary to the current
diagnostic methodologies (self-reports and interviews), this approach can be fast and
easy to administrate, non-invasive (considering that they do not require the
investigation of stressful events experienced by patients), and hardly to be affected
by patients (considering that most of speech parameters depend on reflex responses
and are not completely under conscious control).
Speech parameters could be also used together with face and body movements
parameters (see for example Joshi et al., 2013; Valstar et al., 2014) to build virtual
120
patients for psychology and psychiatry students’ training. Given the problem of
patients’ privacy and the impossibility of doing clinical practice by university
students before graduation (because lacking of the clinical license), the introduction
of laboratory activities in university courses, in which virtual individuals simulate
patients’ disorders through verbal and nonverbal behaviours, could be a useful
instrument to achieve diagnostic ability necessary for the future career of students.
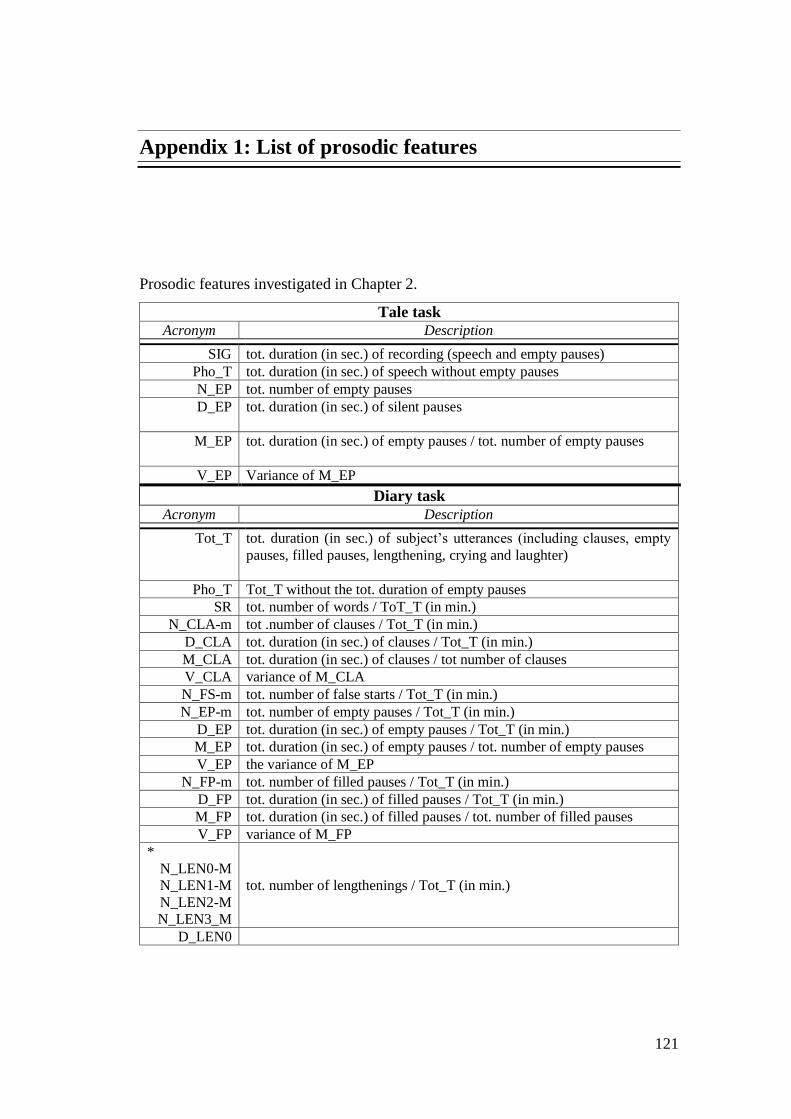
121
Appendix 1: List of prosodic features
Prosodic features investigated in Chapter 2.
Tale task
Acronym Description
SIG tot. duration (in sec.) of recording (speech and empty pauses)
Pho_T tot. duration (in sec.) of speech without empty pauses
N_EP tot. number of empty pauses
D_EP tot. duration (in sec.) of silent pauses
M_EP tot. duration (in sec.) of empty pauses / tot. number of empty pauses
V_EP Variance of M_EP
Diary task
Acronym Description
Tot_T tot. duration (in sec.) of subject’s utterances (including clauses, empty
pauses, filled pauses, lengthening, crying and laughter)
Pho_T Tot_T without the tot. duration of empty pauses
SR tot. number of words / ToT_T (in min.)
N_CLA-m tot .number of clauses / Tot_T (in min.)
D_CLA tot. duration (in sec.) of clauses / Tot_T (in min.)
M_CLA tot. duration (in sec.) of clauses / tot number of clauses
V_CLA variance of M_CLA
N_FS-m tot. number of false starts / Tot_T (in min.)
N_EP-m tot. number of empty pauses / Tot_T (in min.)
D_EP tot. duration (in sec.) of empty pauses / Tot_T (in min.)
M_EP tot. duration (in sec.) of empty pauses / tot. number of empty pauses
V_EP the variance of M_EP
N_FP-m tot. number of filled pauses / Tot_T (in min.)
D_FP tot. duration (in sec.) of filled pauses / Tot_T (in min.)
M_FP tot. duration (in sec.) of filled pauses / tot. number of filled pauses
V_FP variance of M_FP
*
N_LEN0-M
N_LEN1-M
N_LEN2-M
N_LEN3_M
tot. number of lengthenings / Tot_T (in min.)
D_LEN0
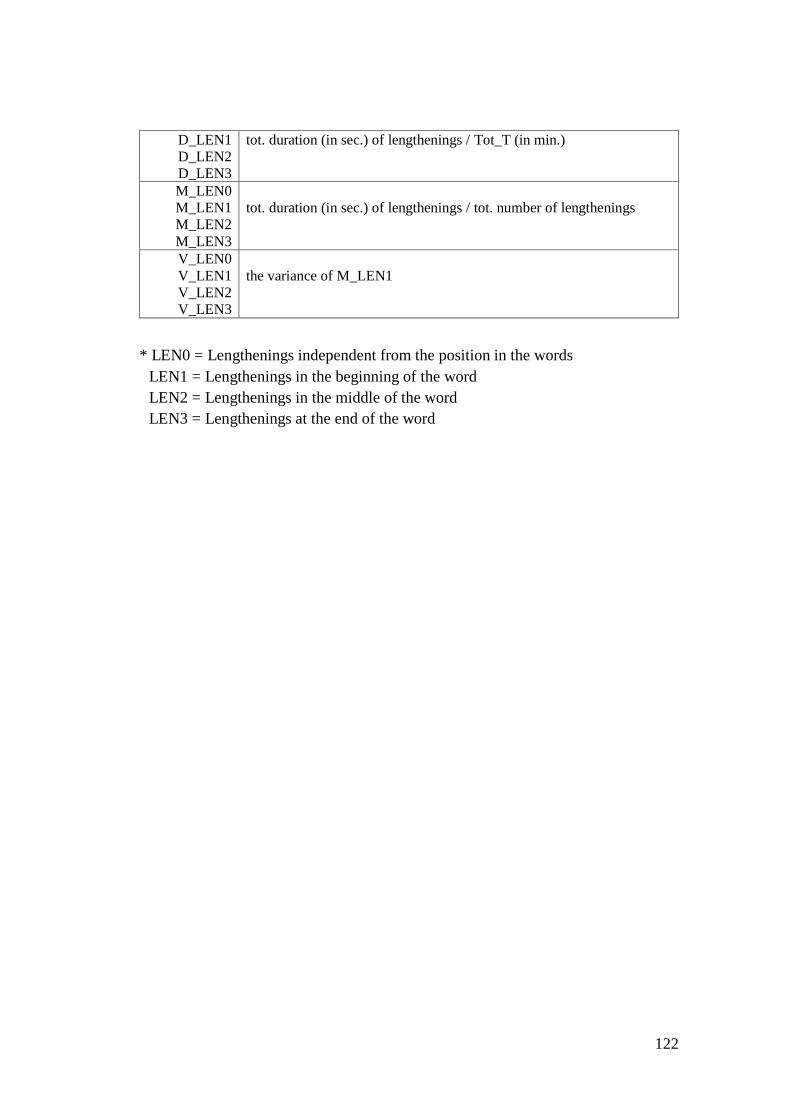
122
D_LEN1
D_LEN2
D_LEN3
tot. duration (in sec.) of lengthenings / Tot_T (in min.)
M_LEN0
M_LEN1
M_LEN2
M_LEN3
tot. duration (in sec.) of lengthenings / tot. number of lengthenings
V_LEN0
V_LEN1
V_LEN2
V_LEN3
the variance of M_LEN1
* LEN0 = Lengthenings independent from the position in the words
LEN1 = Lengthenings in the beginning of the word
LEN2 = Lengthenings in the middle of the word
LEN3 = Lengthenings at the end of the word
123
References
Aboraya, A., Rankin, E., France, C., El-Missiry, A., & John, C. (2006). The Reliability of
Psychiatric Diagnosis Revisited. Psychiatry (Edgmont), 3(1), 41–50.
Alghowinem, S., Goecke, R., Wagner, M., Epps, J., Breakspear, M., & Parker, G. (2013).
Detecting Depression: A comparison between spontaneous and read speech. In 2013
IEEE International Conference on Acoustics, Speech and Signal Processing (pp. 7547–
7551).
Alghowinem, S., Goecke, R., Wagner, M., Epps, J., Gedeon, T., Breakspear, M., & Parker,
G. (2013b). A comparative study of different classifiers for detecting Depression from
spontaneous speech. In Acoustics, Speech and Signal Processing (ICASSP), 2013 IEEE
International Conference on (pp. 8022–8026). IEEE.
Alghowinem, S., Goecke, R., Wagner, M., Epps, J., Breakspear, M., & Parker, G. (2012).
From Joyous to Clinically Depressed: Mood Detection Using Spontaneous Speech. In
FLAIRS Conference.
Alonso, J., Angermeyer, M. C., Bernert, S., Bruffaerts, R., Brugha, T. S., Bryson, H., …
Vollebergh, W. a. M. (2004). Use of mental health services in Europe: results from the
European Study of the Epidemiology of Mental Disorders (ESEMeD) project. Acta
Psychiatrica Scandinavica. Supplementum, (420), 47–54.
Alparone, F. R., Caso, S., Solano, L., & Prezza, M. (2002). Traduzione e adattamento al
contesto linguistico italiano del “Linguistic Inquiry and Word Count”(LIWC).
Emozioni: Cultura, Comunicazione, Benessere, 133–140.
American Psychiatric Association. (2013). Diagnostic and statistical manual of mental
disorders (DSM-5®). American Psychiatric Pub.
Austin, E. J., Deary, I. J., Gibson, G. J., McGregor, M. J., & Dent, J. B. (1998). Individual
response spread in self-report scales: personality correlations and consequences.
Personality and Individual Differences, 24(3), 421–438.
Baldetti, M., La Mela, C. G., Mori, S., & Sansone, M. (2015). Schemi Maladattivi Precoci e
sintomi psicopatologici: studio esplorativo in una popolazione non clinica. Quaderni di
Psicoterapia Cognitiva, (36), 133–143.
Barik, H. C. (1968). On Defining Juncture Pauses: A Note On Boomer’s" Hesitation and
Grammatical Encoding". Language and Speech, 11(3), 156–159.
124
Beattie, L., Kyle, S. D., Espie, C. A., & Biello, S. M. (2015). Social interactions, emotion
and sleep: A systematic review and research agenda. Sleep Medicine Reviews, 24,
83e100.
Beck, A. T. (2002). Cognitive models of Depression. Clinical Advances in Cognitive
Psychotherapy: Theory and Application, 14(1), 29–61.
Beck, A. T., Steer, R. A., & Brown, G. K. (1996). Beck Depression Inventory-II (BDI-II).
San Antonio, TX: Psychological Corporation.
Beck, A. T. (1967). Depression: Clinical, experimental, and theoretical aspects. University
of Pennsylvania Press.
Bennabi, D., Vandel, P., Papaxanthis, C., Pozzo, T., & Haffen, E. (2013). Psychomotor
retardation in Depression: a systematic review of diagnostic, pathophysiologic, and
therapeutic implications., Psychomotor Retardation in Depression: A Systematic
Review of Diagnostic, Pathophysiologic, and Therapeutic Implications. BioMed
Research International, BioMed Research International, 2013, 2013, 158746–158746.
Betz, S., Wagner, P., & Schlangen, D. (2015). Micro-structure of disfluencies: Basics for
conversational speech synthesis. Interspeech 2015.
Boersma, P. (2002). Praat, a system for doing phonetics by computer. Glot International, 5.
Boomer, D. S. (1965). Hesitation and grammatical encoding. Language and Speech, 8(3),
148–158.
Bottesi, G., Ghisi, M., Altoè, G., Conforti, E., Melli, G., & Sica, C. (2015). The Italian version
of the Depression Anxiety Stress Scales-21: Factor structure and psychometric
properties on community and clinical samples. Comprehensive Psychiatry, 60, 170–181.
Bouhuys, A. L., & van der Meulen, W. (1984). Speech timing measures of severity,
psychomotor retardation, and agitation in endogenously depressed patients. Journal of
Communication Disorders, 17(4), 277–288.
Bowden, C. L. (2001). Strategies to reduce misdiagnosis of bipolar Depression. Psychiatr
Serv (Washington, DC), 52, 51–55.
Bradley, M. M., & Lang, P. J. (1999). Affective norms for English words (ANEW): Instruction
manual and affective ratings. Citeseer.
Breznitz, Z. (1992). Verbal indicators of Depression. The Journal of General Psychology,
119(4), 351–363.
Bucci, W., & Freedman, N. (1981). The Language of Depression. Bulletin of the Menninger
Clinic; Topeka, Kan., 45(4).
Cannizzaro, M., Harel, B., Reilly, N., Chappell, P., & Snydera, P. J. (2004). Voice acoustical
measurement of the severity of major Depression. Brain and Cognition, 56, 30–35.
Carney, R. M., & Freedland, K. E. (2000). Depression and medical illness. In Social
epidemiology (pp. 191–212). New York: Oxford University Press.
125
Carta, M. G., Balestrieri, M., Murru, A., & Hardoy, M. C. (2009). Adjustment Disorder:
epidemiology, diagnosis and treatment. Clinical Practice and Epidemiology in Mental
Health, 5(1), 15.
Carver, C. S., & Scheier, M. (1990). Principles of self-regulation: Action and emotion.
Guilford Press.
Carver, C. S., & Scheier, M. F. (1996). Self-regulation and its failures. Psychological Inquiry,
7(1), 32–40.
Carver, C. S., & Scheier, M. (1981). Attention and self-regulation: A control-theory
approach to human behavior. New York: Springer-Verlag.
Casey, P., & Bailey, S. (2011). Adjustment disorders: the state of the art. World Psychiatry,
10(1), 11–18.
Chafe, W., & Danielewicz, J. (1987). Properties of spoken and written language. Academic
Press.
Chen, C. (1988). Signal processing handbook (Vol. 51). CRC Press.
Clark, H. H., & Tree, J. E. F. (2002). Using uh and um in spontaneous speaking. Cognition,
84(1), 73–111.
Clark, L., Iversen, S. D., & Goodwin, S. (2002). Sustained attention deficit in bipolar
disorder. British Journal of Psychiatry, 180, 313–319.
Cohn, J. F., Kruez, T. S., Matthews, I., Yang, Y., Nguyen, M. H., Padilla, M. T., … De la
Torre, F. (2009). Detecting Depression from facial actions and vocal prosody. In
Affective Computing and Intelligent Interaction and Workshops, 2009. ACII 2009. 3rd
International Conference on (pp. 1–7). IEEE.
Consedine, N. S., Magai, C., Cohen, C. I., & Gillespie, M. (2002). Ethnic variation in the
impact of negative affect and emotion inhibition on the health of older adults. The
Journals of Gerontology Series B: Psychological Sciences and Social Sciences, 57(5),
P396–P408.
Cooper, W. E., & Danly, M. (1981). Segmental and Temporal Aspects of Utterance-Final
Lengthening. Phonetica, 38(1–3), 106–115. https://doi.org/10.1159/000260017
Cuellar, A. K., Johnson, S. L., & Winters, R. (2005). Distinctions between bipolar and
unipolar Depression. Clinical Psychology Review, 25(3), 307.
Cuijpers, P., & Smit, F. (2002). Excess mortality in Depression: a meta-analysis of
community studies. Journal of Affective Disorders, 72(3), 227–236.
Cuijpers, P., Van Straten, A., & Smit, F. (2005). Preventing the incidence of new cases of
mental disorders: a meta-analytic review. The Journal of Nervous and Mental Disease,
193(2), 119–125.
Cummins, N., Scherer, S., Krajewski, J., Schnieder, S., Epps, J., & Quatieri, T. F. (2015). A
review of Depression and suicide risk assessment using speech analysis. Speech
Communication, 71, 10–49.
126
Cummins, N., Epps, J., & Ambikairajah, E. (2013). Spectro-temporal analysis of speech
affected by Depression and psychomotor retardation. In Acoustics, Speech and Signal
Processing (ICASSP), 2013 IEEE (pp. 7542–7546). IEEE.
Cummins, N., Epps, J., Breakspear, M., & Goecke, R. (2011). An investigation of depressed
speech detection: Features and normalization. In Twelfth Annual Conference of the
International Speech Communication Association.
Darby, J. K., Simmons, N., & Berger, P. A. (1984). Speech and voice parameters of
Depression: A pilot study. Journal of Communication Disorders, 17(2), 75–85.
De Cheveigné A. (2005). Pitch Perception Models. In: Plack C.J., Fay R.R., Oxenham A.J.,
Popper A.N. (eds) Pitch. Springer Handbook of Auditory Research, vol 24. Springer,
New York, NY
De Choudhury, M., Counts, S., & Horvitz, E. (2013). Social media as a measurement tool of
Depression in populations. In Proceedings of the 5th Annual ACM Web Science
Conference (pp. 47–56). ACM.
Eaton, W. W., Neufeld, K., Chen, L.-S., & Cai, G. (2000). A Comparison of Self-report and
Clinical Diagnostic Interviews for Depression: Diagnostic Interview Schedule and
Schedules for Clinical Assessment in Neuropsychiatry in the Baltimore Epidemiologic
Catchment Area Follow-up. Archives of General Psychiatry, 57(3), 217–222.
Ellgring, H., & Scherer, K. R. (1996). Vocal indicators of mood change in Depression.
Journal of Nonverbal Behavior, 20(2), 83–110.
Esposito, A., Esposito, A. M., Likforman-Sulem, L., Maldonato, M. N., & Vinciarelli, A.
(2016). On the significance of speech pauses in depressive disorders: results on read and
spontaneous narratives. In Recent Advances in Nonlinear Speech Processing (pp. 73–
82). Springer.
Eyben, F., Weninger, F., Gross, F., & Schuller, B. (2013). Recent developments in opensmile,
the munich open-source multimedia feature extractor. In Proceedings of the 21st ACM
international conference on Multimedia (pp. 835–838). ACM.
First, M. B., & Williams, J. B. (2016). SCID-5-CV: Structured Clinical Interview for DSM-
5 Disorders: Clinician Version. American Psychiatric Association Publishing.
Furnham, A. (1990). Language and personality. In H. Giles & W. P. Robinson (Eds.),
Handbook of language and social psychology (pp. 73-95). Oxford, England: John Wiley
& Sons.
Garner, S. R. (1995). Weka: The waikato environment for knowledge analysis. In
Proceedings of the New Zealand computer science research students conference (pp.
57–64).
Ghaemi, S., Sachs, G., Chiou, A., Pandurangi, A., & Goodwin, F. (1999). Is bipolar disorder
still underdiagnosed? Are antidepressants overutilized? Journal of Affective Disorders,
52(1–3), 135–144.
Gift, A. G. (1989). Visual analogue scales: Measurement of subjective phenomena. Nursing
Research, 38(5), 286–288.
127
Gjerdingen, D., McGovern, P., & Center, B. (2011). Problems Encountered with Using a
Diagnostic Depression Interview In a Postpartum Depression Trial. Journal of the
American Board of Family Medicine, 24(2), 187–193.
Godfrey, H. P., & Knight, R. G. (1984). The validity of actometer and speech activity
measures in the assessment of depressed patients. The British Journal of Psychiatry,
145(2), 159–163.
Greden, J. F., Albala, A. A., Smokler, I. A., Gardner, R., & Carroll, B. J. (1981). Speech
pause time: a marker of psychomotor retardation among endogenous depressives.
Biological Psychiatry.
Greden, J. F., & Carroll, B. J. (1980). Decrease in speech pause times with treatment of
endogenous Depression. Biological Psychiatry.
Gross, J. J., & Levenson, R. W. (1997). Hiding feelings: the acute effects of inhibiting
negative and positive emotion. Journal of Abnormal Psychology, 106(1), 95.
Guaïtella, I. (1993). Functional, acoustical and perceptual analysis of vocal hesitations in
spontaneous speech. In ESCA Workshop on Prosody.
Hamilton, M. (1960). A rating scale for Depression. Journal of Neurology, Neurosurgery,
and Psychiatry, 23(1), 56.
Hardy, P., Jouvent, R., & Widlöcher, D. (1984). Speech pause time and the retardation rating
scale for Depression (ERD). Journal of Affective Disorders, 6(1), 123–127.
Haslam, N. (2003). Categorical versus dimensional models of mental disorder: the taxometric
evidence. Australian and New Zealand Journal of Psychiatry, 37(6), 696–704.
Helfer, B. S., Quatieri, T. F., Williamson, J. R., Mehta, D. D., Horwitz, R., & Yu, B. (2013).
Classification of Depression state based on articulatory precision (pp. 2172–2176).
Presented at the Proceedings of the Annual Conference of the International Speech
Communication Association, INTERSPEECH.
Henriques, S. G., Fráguas, R., Iosifescu, D. V., Menezes, P. R., Lucia, M. C. S. de, Gattaz,
W. F., & Martins, M. A. (2009). Recognition of depressive symptoms by physicians.
Clinics, 64(7), 629–635.
Herrera-Boyer, P., Peeters, G., & Dubnov, S. (2003). Automatic Classification of Musical
Instrument Sounds. Journal of New Music Research, 32(1), 3–21.
Hoffmann, G. M., Gonze, J. C., & Mendlewicz, J. (1985). Speech pause time as a method for
the evaluation of psychomotor retardation in depressive illness. The British Journal of
Psychiatry, 146(5), 535–538.
Hoskin, R. (2012). The dangers of self-report. Science Brainwaves.
Ingram, R. E. (1990). Self-focused attention in clinical disorders: review and a conceptual
model. Psychological Bulletin, 107(2), 156.
Jiang, H., Hu, B., Liu, Z., Yan, L., Wang, T., Liu, F., … Li, X. (2017). Investigation of
different speech types and emotions for detecting Depression using different classifiers.
Speech Communication, 90, 39–46.
128
Joshi, J., Goecke, R., Alghowinem, S., Dhall, A., Wagner, M., Epps, J., … Breakspear, M.
(2013). Multimodal assistive technologies for Depression diagnosis and monitoring.
Journal on Multimodal User Interfaces, 7(3), 217–228.
Kessler, D., Bennewith, O., Lewis, G., & Sharp, D. (2002). Detection of Depression and
anxiety in primary care: follow up study. Bmj, 325(7371), 1016–1017.
Kessler, R. C., Akiskal, H. S., Ames, M., Birnbaum, H., Greenberg, P., .a, R. M., … Wang,
P. S. (2006). Prevalence and Effects of Mood Disorders on Work Performance in a
Nationally Representative Sample of U.S. Workers. American Journal of Psychiatry,
163(9), 1561–1568.
Kiss, G., Tulics, M. G., Sztahó, D., Esposito, A., & Vicsi, K. (2016). Language independent
detection possibilities of Depression by speech. In Recent Advances in Nonlinear Speech
Processing (pp. 103–114). Springer.
Knäuper, B., & Wittchen, H.-U. (1994). Diagnosing major Depression in the elderly:
Evidence for response bias in standardized diagnostic interviews? Journal of Psychiatric
Research, 28(2), 147–164.
Kovacs, M., & Beck, A. T. (1979). Cognitive-affective processes in Depression. In Emotions
in personality and psychopathology (pp. 415–442). Springer.
Kraepelin, E. (1921). Manic depressive insanity and paranoia. The Journal of Nervous and
Mental Disease, 53(4), 350.
Kroenke, K., Spitzer, R. L., & Williams, J. B. W. (2001). The PHQ-9. Journal of General
Internal Medicine, 16(9), 606–613.
Large, M. (2016). Study on suicide risk assessment in mental illness underestimates inpatient
suicide risk. BMJ, 352, i267.
Lecrubier, Y. (2000). Depressive illness and disability. European
Neuropsychopharmacology, 10, S439–S443.
Lecrubier, Y. (2007). Widespread underrecognition and undertreatment of anxiety and mood
disorders: Results from 3 European studies. The Journal of Clinical Psychiatry,
68(Suppl 2), 36–41.
Leff, J., & Abberton, E. (1981). Voice pitch measurements in schizophrenia and Depression.
Psychological Medicine, 11(4), 849–852.
Lewinsohn, P. M., Mischel, W., Chaplin, W., & Barton, R. (1980). Social competence and
Depression: The role of illusory self-perceptions. Journal of Abnormal Psychology,
89(2), 203.
Lewinsohn, P. M., Seeley, J. R., Roberts, R. E., & Allen, N. B. (1997). Center for
Epidemiologic Studies Depression Scale (CES-D) as a screening instrument for
Depression among community-residing older adults. Psychology and Aging, 12(2), 277.
Lindblom, B. (1978). Final lengthening in speech and music. In Garding, E., Bruce, G. and
Bannert, R. (Eds.) Nordic Prosody, pp. 85-101. Department of Linguistics, University
of Lund
129
Lish, J. (1994). The National Depressive and Manic-depressive Association (DMDA) survey
of bipolar members. J. Affect. Disord., 31, 281–294.
Liu, Z., Kang, H., Feng, L., & Zhang, L. (2017). Speech Pause Time: A Potential Biomarker
For Depression Detection. In 2017 IEEE International Conference on Bioinformatics
and Biomedicine (BIBM) (pp. 2020–2025). IEEE.
Lott, P. R., Guggenbühl, S., Schneeberger, A., Pulver, A. E., & Stassen, H. H. (2002).
Linguistic analysis of the speech output of schizophrenic, bipolar, and depressive
patients. Psychopathology, 35(4), 220–227.
Lovibond, P. F., & Lovibond, S. H. (1995). The structure of negative emotional states:
Comparison of the Depression Anxiety Stress Scales (DASS) with the Beck Depression
and Anxiety Inventories. Behaviour Research and Therapy, 33(3), 335–343.
Maclay, H., & Osgood, C. E. (1959). Hesitation phenomena in spontaneous English speech.
Word, 15(1), 19–44.
Mann, J. J., Apter, A., Bertolote, J., Beautrais, A., Currier, D., Haas, A., … Hendin, H.
(2005). Suicide Prevention Strategies: A Systematic Review. JAMA, 294(16), 2064–
2074.
Marazziti, D., Consoli, G., Picchetti, M., Carlini, M., & Faravelli, L. (2010). Cognitive
impairment in major Depression. European Journal of Pharmacology, 626(1), 83–86.
Mayberg, H. S. (2003). Modulating dysfunctional limbic-cortical circuits in Depression:
towards development of brain-based algorithms for diagnosis and optimised treatment.
British Medical Bulletin, 65, 193–207.
McGlinchey, E. L., Talbot, L. S., Chang, K., Kaplan, K. A., Dahl, R. E., & Harvey, A. G.
(2011). The effect of sleep deprivation on vocal expression of emotion in adolescents
and adults. Sleep, 34(9), 1233–1241.
Memon, S., Maddage, N., Lech, M., & Allen, N. (2009). Effect of clinical Depression on
automatic speaker identification. In Bioinformatics and Biomedical Engineering, 2009.
ICBBE 2009. 3rd International Conference on (pp. 1–4). IEEE.
Miller, P. R., Dasher, R., Collins, R., Griffiths, P., & Brown, F. (2001). Inpatient diagnostic
assessments: 1. Accuracy of structured vs. unstructured interviews. Psychiatry
Research, 105(3), 255–264.
Mitchell, A. J., Vaze, A., & Rao, S. (2009). Clinical diagnosis of Depression in primary care:
a meta-analysis. The Lancet, 374(9690), 609–619.
Mor, N., & Winquist, J. (2002). Self-focused attention and negative affect: A meta-analysis.
Psychological Bulletin, 128(4), 638–662.
Moyle, W. (2002). Unstructured interviews: challenges when participants have a major
depressive illness. Journal of Advanced Nursing, 39(3), 266–273.
Mundt, J. C., Vogel, A. P., Feltner, D. E., & Lenderking, W. R. (2012). Vocal Acoustic
Biomarkers of Depression Severity and Treatment Response. Biological Psychiatry,
72(7), 580–587.
130
Nguyen, T., Phung, D., Dao, B., Venkatesh, S., & Berk, M. (2014). Affective and Content
Analysis of Online Depression Communities. IEEE Transactions on Affective
Computing, 3(5), 217–226.
Nilsonne, A. (1987). Acoustic analysis of speech variables during Depression and after
improvement. Acta Psychiatrica Scandinavica, 76(3), 235–245.
Olesen, J., Gustavsson, A., Svensson, M., Wittchen, H.-U., Jönsson, B., on behalf of the
CDBE2010 study group, & the European Brain Council. (2012). The economic cost of
brain disorders in Europe. European Journal of Neurology, 19(1), 155–162.
On, C. K., Pandiyan, P. M., Yaacob, S., & Saudi, A. (2006). Mel-frequency cepstral
coefficient analysis in speech recognition. Computing & Informatics, 2–6.
Oxman, T. E., Rosenberg, S. D., Schnurr, P. P., & Tucker, G. J. (1988). Diagnostic
classification through content analysis of patients’ speech. The American Journal of
Psychiatry, 145(4), 464.
Panagiotakis, C., & Tziritas, G. (2005). A speech/music discriminator based on RMS and
zero-crossings. IEEE Transactions on Multimedia, 7(1), 155–166.
Park, M., Cha, C., & Cha, M. (2012). Depressive moods of users portrayed in Twitter. In
Proceedings of the ACM SIGKDD Workshop on healthcare informatics (HI-KDD), Vol.
2012, pp. 1–8. ACM New York, NY.
Parker, G. (2011). Classifying clinical Depression: an operational proposal. Acta
Psychiatrica Scandinavica, 123(4), 314–316.
Pennebaker, J. W., Mehl, M. R., & Niederhoffer, K. G. (2003). Psychological aspects of
natural language use: Our words, our selves. Annual Review of Psychology, 54(1), 547–
577.
Pennebaker, J. W., Francis, M. E., & Booth, R. J. (2001). Linguistic inquiry and word count:
LIWC 2001. Mahway: Lawrence Erlbaum Associates, 71(2001), 2001.
Pennebaker, J. W., & Keough, K. A. (1999). Revealing, organizing, and reorganizing the self
in response to stress and emotion.
Pennebaker, J. W. (1993). Putting stress into words: Health, linguistic, and therapeutic
implications. Behaviour Research and Therapy, 31(6), 539–548.
Pianesi, F., Mana, N., Cappelletti, A., Lepri, B., & Zancanaro, M. (2008). Multimodal
recognition of personality traits in social interactions. In Proceedings of the 10th
international conference on Multimodal interfaces (pp. 53–60). ACM.
Pyszczynski, T., & Greenberg, J. (1987). Self-regulatory perseveration and the depressive
self-focusing style: a self-awareness theory of reactive Depression. Psychological
Bulletin, 102(1), 122.
Quatieri, T. F., & Malyska, N. (2012). Vocal-Source Biomarkers for Depression: A Link to
Psychomotor Activity. In Thirteenth Annual Conference of the International Speech
Communication Association.
131
Quatieri, T. F. (2006). Discrete-time speech signal processing: principles and practice.
Pearson Education India.
Ramirez-Esparza, N., Chung, C. K., Kacewicz, E., & Pennebaker, J. W. (2008). The
Psychology of Word Use in Depression Forums in English and in Spanish: Texting Two
Text Analytic Approaches. In ICWSM.
Richter, P., Werner, J., Heerlein, A., Kraus, A., & Sauer, H. (1998). On the Validity of the
Beck Depression Inventory. Psychopathology, 31(3), 160–168.
Rickards, H. (2005). Depression in neurological disorders: Parkinson’s disease, multiple
sclerosis, and stroke. Journal of Neurology, Neurosurgery & Psychiatry, 76(suppl 1),
i48–i52.
Riso, L. P., Froman, S. E., Raouf, M., Gable, P., Maddux, R. E., Turini-Santorelli, N., …
Cherry, M. (2006). The long-term stability of early maladaptive schemas. Cognitive
Therapy and Research, 30(4), 515–529.
Robins, L. N., Helzer, J. E., Croughan, J., & Ratcliff, K. S. (1981). Diagnostic interview
schedule. Arch Gen Psychiatry, 38, 381–389.
Robins, L. N., Wing, J., Wittchen, H. U., Helzer, J. E., Babor, T. F., Burke, J., … Regier, D.
A. (1988). The Composite International Diagnostic Interview: an epidemiologic
instrument suitable for use in conjunction with different diagnostic systems and in
different cultures. Archives of General Psychiatry, 45(12), 1069–1077.
Robinson, J. C., & Lewinsohn, P. M. (1973). Behavior modification of speech characteristics
in a chronically depressed man. Behavior Therapy, 4(1), 150–152.
https://doi.org/10.1016/S0005-7894(73)80090-5
Roffo, G., Melzi, S., Castellani, U., & Vinciarelli, A. (2017). Infinite latent feature selection:
A probabilistic latent graph-based ranking approach. In Computer Vision and Pattern
Recognition.
Rohde, P., Lewinsohn, P. M., & Seeley, J. R. (1991). Comorbidity of unipolar Depression:
II. Comorbidity with other mental disorders in adolescents and adults. Journal of
Abnormal Psychology, 100(2), 214–222.
Rost, K., Smith, G. R., Matthews, D. B., & Guise, B. (1994). The Deliberate Misdiagnosis
of Major Depression in Primary Care. Archives of Family Medicine, 3(4), 333.
Roy H. Perlis. (2005). Misdiagnosis of bipolar disorder. The American Journal of Managed
Care, 11(9).
Rude, S., Gortner, E.-M., & Pennebaker, J. (2004). Language use of depressed and
Depression-vulnerable college students. Cognition and Emotion, 18(8), 1121–1133.
Rush, A. J., Trivedi, M. H., Ibrahim, H. M., Carmody, T. J., Arnow, B., Klein, D. N., …
Manber, R. (2003). The 16-Item Quick Inventory of Depressive Symptomatology
(QIDS), clinician rating (QIDS-C), and self-report (QIDS-SR): a psychometric
evaluation in patients with chronic major Depression. Biological Psychiatry, 54(5), 573–
583.
132
Sanchez-Villegas, A., Schlatter, J., Ortuno, F., Lahortiga, F., Pla, J., Benito, S., & Martinez-
Gonzalez, M. A. (2008). Validity of a self-reported diagnosis of Depression among
participants in a cohort study using the Structured Clinical Interview for DSM-IV
(SCID-I). BMC Psychiatry, 8, 43.
Schafer, R. (1949). The clinical application of psychological tests. Journal of Consulting
Psychology, 13(2), 147.
Scherer, K. R. (1986). Voice, stress, and emotion. In Dynamics of stress (pp. 157-179).
Springer, Boston, MA.
Scherer, K. R. (1979). Personality markers in speech. Cambridge University Press.
Scherer, S., Stratou, G., Lucas, G., Mahmoud, M., Boberg, J., & Gratch, J. (2014). Automatic
audiovisual behavior descriptors for psychological disorder analysis. Image and Vision
Computing, 32, 648–658.
Scherer, S., Stratou, G., Gratch, J., & Morency, L.-P. (2013). Investigating voice quality as a
speaker-independent indicator of Depression and PTSD. In Interspeech (pp. 847–851).
Severino, G. A., & Haynes, W. D. G. (2010). Development of an Italian version of the
Depression Anxiety Stress Scales. Psychology, Health & Medicine, 15(5), 607–621.
Sica, C., Ghisi, M., & Lange, M. A. (2007). The Italian versions of the Beck Anxiety
Inventory and the Beck Depression Inventory-II: Psychometric properties and
discriminant power. Leading-Edge Psychological Tests and Testing Research, 27–50.
Siegman, A. W. (1987). The pacing of speech in Depression. Depression and Expressive
Behavior, 83–102.
Simon, G. E., Fleck, M., Lucas, R., Bushnell, D. M., & Group, L. (2004). Prevalence and
predictors of Depression treatment in an international primary care study. The American
Journal of Psychiatry, 161(9), 1626.
Simon, Gregory E., VonKorff, M., Piccinelli, M., Fullerton, C., & Ormel, J. (1999). An
international study of the relation between somatic symptoms and Depression. New
England Journal of Medicine, 341(18), 1329–1335.
Smith, C. L., & Hogan, L. A. (2001). Variation in final lengthening as a function of topic
structure. In Seventh European Conference on Speech Communication and Technology.
Stirman, S. W., James, & Pennebaker, W. (2001). Word use in the poetry of suicidal and non-
suicidal poets. Psychosomatic Medicine, 517–522.
Stone, A. A., Bachrach, C. A., Jobe, J. B., Kurtzman, H. S., & Cain, V. S. (1999). The science
of self-report: Implications for research and practice. Psychology Press.
Stone, P. J., Dunphy, D. C., & Smith, M. S. (1966). The general inquirer: A computer
approach to content analysis. Oxford, England: M.I.T. Press.
Szabadi, E., Bradshaw, C. M., & Besson, J. A. (1976). Elongation of pause-time in speech:
a simple, objective measure of motor retardation in Depression. The British Journal of
Psychiatry, 129(6), 592–597.
133
Tausczik, Y. R., & Pennebaker, J. W. (2010a). The Psychological Meaning of Words: LIWC
and Computerized Text Analysis Methods. Journal of Language and Social Psychology,
29(1), 24–54.
Thiebaux, M., Marsella, S., Marshall, A. N., & Kallmann, M. (2008). Smartbody: Behavior
realization for embodied conversational agents. In Proceedings of the 7th international
joint conference on Autonomous agents and multiagent systems-Volume 1 (pp. 151–
158). International Foundation for Autonomous Agents and Multiagent Systems.
Tolkmitt, F., Helfrich, H., Standke, R., & Scherer, K. R. (1982). Vocal indicators of
psychiatric treatment effects in depressives and schizophrenics. Journal of
Communication Disorders, 15(3), 209–222.
Trevino, A. C., Quatieri, T. F., & Malyska, N. (2011). Phonologically-based biomarkers for
major depressive disorder.
Trivedi, M. H. (2004). The Link Between Depression and Physical Symptoms. Primary Care
Companion to The Journal of Clinical Psychiatry, 6(suppl 1), 12–16.
Vaissière, J. (1983). Language-independent prosodic features. In Prosody: Models and
measurements (pp. 53–66). Springer.
Valstar, M., Schuller, B., Smith, K., Eyben, F., Jiang, B., Bilakhia, S., … Pantic, M. (2013).
The continuous audio/visual emotion and Depression recognition challenge. In The 21st
ACM International Conference on Multimedia.
Vicsi, K., Sztahó, D., & Tamás, F. (2013). Examination of segmental and supra-segmental
parameters of depressed speech. Models and analysis of vocal emissions for Biomedical
Applications, 227.
Wahlbeck, K., & Mäkinen, M. (2008). Prevention of Depression and suicide. Luxembourg:
European Communities.
Wang, X., Zhang, C., Ji, Y., Sun, L., Wu, L., & Bao, Z. (2013). A Depression Detection
Model Based on Sentiment Analysis in Micro-blog Social Network. In Pacific-Asia
Conference on Knowledge Discovery and Data Mining (pp. 201-213). Springer, Berlin,
Heidelberg
Weintraub, W. (1989). Verbal behavior in everyday life. Springer Publishing Co.
Williams, J. M. G., Healy, D., Teasdale, J. D., White, W., & Paykel, E. S. (1990).
Dysfunctional attitudes and vulnerability to persistent Depression. Psychological
Medicine, 20(2), 375–381.
Wing, J. K., Babor, T., Brugha, T. S., Burke, J., Cooper, J. E., Giel, R., … Sartorius, N.
(1990). Scan: Schedules fonr clinical assessment in neuropsychiatry. Archives of
General Psychiatry, 47(6), 589–593.
Winokur, G., & Pitts Jr, F. N. (1964). Affective disorder. Is Reactive Depression an entity?
The Journal of Nervous and Mental Disease, 138, 541.
World Health Organization. (1993). The ICD–10 Classification of Mental and Behavioural
Disorders: Diagnostic Criteria for Research (Vol. 2). World Health Organization.
134
World Health Organization. (2017). Depression and Other Common Mental Disorders:
Global Health Estimates. Geneva, Switzerland.
Yeldener, S. (2001). Method of determining the voicing probability of speech signals. U.S.
Patent, 6(253), 171. Washington, DC: U.S. Patent and Trademark Office.
Young, J. E., Klosko, J. S., & Weishaar, M. E. (2003). Schema therapy: A practitioner’s
guide. Guilford Press.
Zhang, Z., Coutinho, E., Deng, J., & Schuller, B. (2015). Cooperative learning and its
application to emotion recognition from speech. IEEE/ACM Transactions on Audio,
Speech and Language Processing (TASLP), 23(1), 115–126.