document resume - files.eric.ed.gov · oral hygiene was evaluated by the simplified oral hygiene...
TRANSCRIPT
ED 071 220
TITLE
INSTITUTION
PUB DATENOTEAVAILABLE FROM
DOCUMENT RESUME
EC 050 392
Periodontal Disease and Oral Hygiene Among Children.United States.National Center for Health Statistics (DHEW),Rockville, Md.Jun 7235p.
Superintendent of Documents, U.S. Government PrintingOffice, Washington, D.C. 20402 (Vital and HealthStatistics, Series 11, No. 117, $0.35)
EDRS PRICE MF-$0.65 HC-$3.29DESCRIPTORS Demography; *Dental Health; Diseases; *Elementary
School Students; *Exceptional Child Research;Hygiene; Incidence; *National Surveys; Special HealthProblems; *Statistical Data
IDENTIFIERS OHI S; Periodontal Index; PI; Simplified Oral HygieneIndex
ABSTRACTStatistical data presented on periodontal disease and
oral hygiene among noninstitutionalized children, aged 6-11, in theUnited States are based on a probability sample of approximately7,400 children involved in a national health survey during 1963-65.The report contains estimates of the Periodontal Index (PI) and theSimplified Oral Hygiene Index (OHI-S) by various demographiccharacteristics (age, sex, race, family income, education of head ofhousehold, geographic region). The PI, which reflects the presence orabsence of gingival inflammation and obvious pocket formation, wasused in assessing prevalence and severity of periodontal disease. TheOHI-S, assessing oral hygiene, reflected presence or absence of oraldebris (soft foreign material loosely attached to tooth) and oralcalculus (zardened foreign material firmly attached). The report alsocontains a correlation analysis of the interrelation of the PI,OHI -S, and selected demographic characteristics. OM
ri ont I i a
an ral i in
Rion it r nUnited states
N,Cr-
CE4t,
NCHS(.1
%c.'
U. S. DEPARTMENT OFHEALTH, EDUCATION, AND WELFARE /
Public HealtherviceHealth Services and Mental Health Administratinn
Series 11 reports present findings from the National Health ExaminationSurvey, which obtains data through direct examination, tests, and meas-urements of samples of the U.S. population. Reports 1 through 38 relateto the adult program. Additional reports concerning this program will beforthcoming and will be numbered consecutively. The present report isone of a number of reports of findings from the children and youth pro-grams, Cycles II and III of the Health Examination Survey. These re-ports, emanating from the same survey mechanism, are being publishedin Series 11 but are numbered consecutively beginning with 101. It ishoped this will guide users to the data in which they are interested.
\
Vital and Health Statistics-Series 11-No. 117
For sale by the Superintendent of Documents, U.S. Government Printing Office, Washington, D.C. 20402 - Price 35 cents
Data from theNATIONAL HEALTH SURVEY
Series 11Number 117
Periodontal Disease
and Oral Hygiene
Among Children
United States
Estimates of the Periodontal index (PI) and the SimplifiedOral Hygiene Index (OHI-S) for noninstitutionalized childrenaged 6-11 years in the United States, by age, sex, race, familyincome, education of the head of household, and geographicregion, and a correlation analysis of the interrelation of thePI, OHI-S, and selected demographic characteristics.
DHEW Publication No. (HSM) 72-1060
U.S. DEPARTMENT OF HEALTH, EDUCATION, AND WELFAREPublic Health Service
U S, DEPARTMENT OF HEALTH.EDUCATION & WELFAREOFFICE OF EDUCATION
THIS DOCUMENT HAS BEEN REPRODUCED EXACTLY AS RECEIVED FROMTHE PERSON OR ORGANIZATION ORIGINATf NG IT POINTS OF VIEW OR OPINIONS STATED DO NOT NECESSARILYREPRESENT OFFICIAL OFFICE OF EDUCATION POSITION OR POLICY
Health Services and Mental Health AdministrationNational Center for Health StatisticsRockville, Md. June 1972
NATIONAL CENTER FOR HEALTH STATISTICS
THEODORE D. WOOLSEY, Director
PHILIP S. LAWRENCE, Sc.D., Associate DirectorOSWALD K. SAGEN ,Ph.D., Assistant Director for Health Statistics Development
WALT R. SIMMONS, M.A., Assistant Director for Research and Scientific DevelopmentJAMES E. KELLY, D.D.S., Dental Advisor
EDWARD E. MINTY, Executive Officer
ALICE HAYWOOD, Information Officer
DIVISION OF HEALTH EXAMINATION STATISTICS
ARTHUR J. McDOWELL, Director
HENRY W. MILLER, Chief, Operations and Quality Control BranchJEAN ROBERTS, Chief, Medical Statistics Branch
PETER V. V. HAMILL, M.D., Medical Advisor, Children and Youth ProgramLAWRENCE E. VAN KIRK, D.D.S., Dental Advisor
COOPERATION OF THE BUREAU OF THE CENSUS
In accordance with specifications established by the National Health Survey, theBureau of the Census, under a contractual agreement, participated in the design and se-lection of the sample, and carried out the first stage of the field interviewing and cer-tain parts of the statistical processing.
Vital and Health Statistics-Series 11-No. 117
DHEW Publication No. (HSM) 72.1060L:brary of Congress Catalog Card Number 72-190009
Introduction
CONTENTSPage
1
Periodontal Index Findings 2Age, Race, and Sex 3Other Demographic Characteristics 3
Simplified Oral Hygiene Index Findings 5Age, Race, and Se:: 5Other Demographic Characteristics 6
Discussion 7
Summary 9
References 11
List of Detailed Tables 12
Appendix 1. The Dental Examination 19The Periodontal Index (PI) 19The Simplified Oral Hygiene Index (OHI-S) 19Training of Examiners 20
Appendix II. Demographic and Socioeconomic Terms 22
Appendix III. Statistical Notes 23The Survey Design 23Reliability 23Sampling and Measurement Error 24Expected Values 25Small Numbers 25Tests of Significance 26
iii
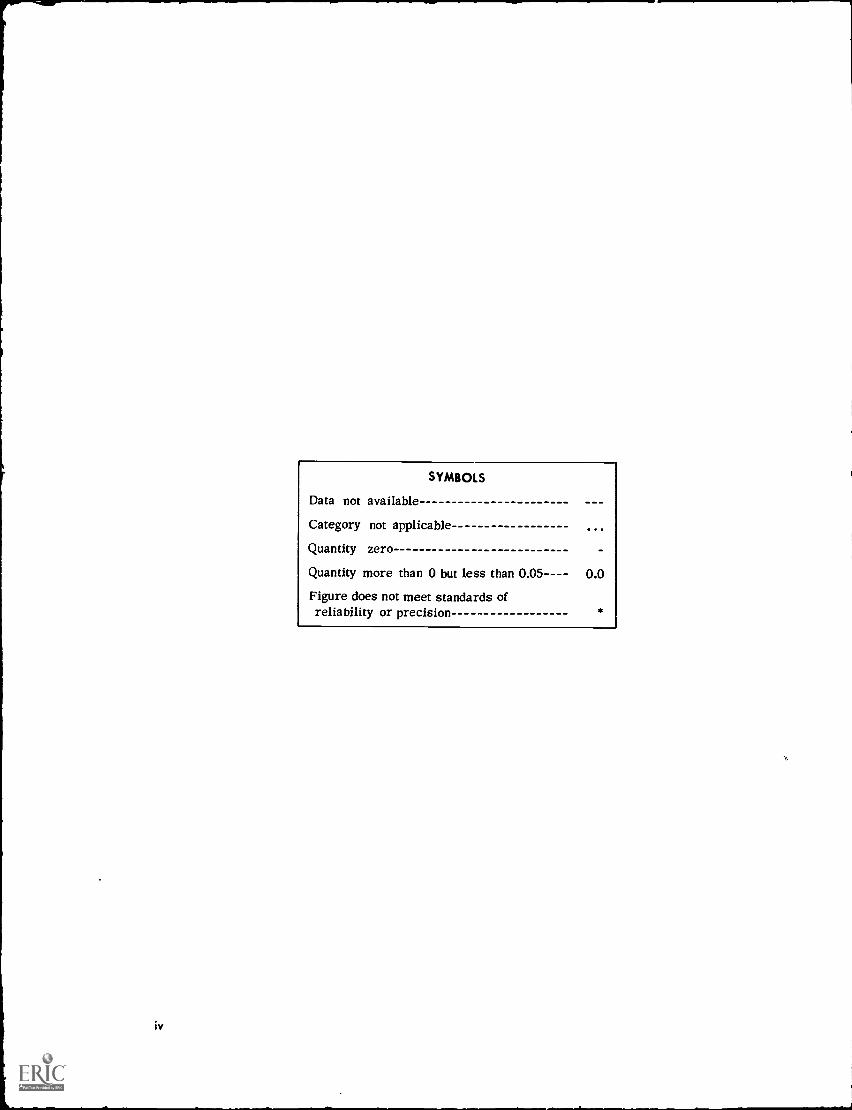
Data not available
SYMBOLS
Category not applicable
Quantity zero
Quantity more than 0 but less than 0.05---- 0.0
Figure does not meet standards ofreliability or precision *
iv
PERIODONTAL DISEASE AND ORAL HYGIENEAMONG CHILDREN
James E. Kelly, D.D.S., and Marcus J. Sanchez, Division of Health Examination Statistics
INTRODUCTION
During 1963-65 the Division of Health Exami-nation Statistics conducted a survey of the healthof the Nation's children aged 6-11 years .I Thesurvey was the second of a continuing series ofsample surveys, or examination "cycles," under-taken to produce statistical information about thehealth of specific segments of the U.S. populationthrough direct examination. In the initial cycle(1960-62) a probability sample of the Nation'sadults aged 18-79 was examined.'
The universe from which the sample for thesecond examination cycle was drawn contained ap-proximately 24 million children. It was definedasall noninstitutionalized children aged 6-11 yearsliving in the United States (including Alaska andHawaii) except those living on lands reserved forthe use of American Indians. A probability sampleof approximately 7,400 children (an average ofabout 185 at each of 40 locations) was designedand selected by a complex, scientific proceduredescribed in appendix III. Examinations wereconducted in mobile examination centers by phy-sicians, dentists, psychologists nur ses, and tech-nicians. Prior to the examination, information wasobtained from the parent of the child, includingdemographic and socioeconomic data on the house-hold members as well as medical history, behav-ioral, and related data on the child to be examined.
All sample children whose parents or guard-ians consented to their participation in the surveyreceived the same examination which lasted ap-proximately 3 h..)urs. The examination focused on
factors related to biological and psychologicalaspects of growth and development. Pediatriciansexamined the nose, throat, and ears; heart; andneuromuscular system of each child. The teethand their supporting structures were examinedby dentists, and school achievement, intellectualdevelopment, and personality development weremeasured by psychologists. Other proceduresincluded tests of vision, hearing, exercise toler-ance, grip stt ength, and breathing capacity. Bloodpressure levels and electrocardiograms were re-corded, as well as height, weight, and other bodymeasurements.
Five dentists employed at various times dur-ing the survey conducted the dental examinations.They obtained their findings on a uniform basisby following as closely as possible written, ob-jective standards. The standards were guidelineswhich, in effect, narrowed the range of examinervariability by eliminating several borderline orquestionable conditions that are persistent sourcesof examiner disagreement. To avoid proceduresthat might have introduced systematic bias, teethwere not dried or isolated, oral debris and cal-culus were not removed, and tooth surfaces werenot probed unless they were overtly decayed.
The prevalence and severity of periodontaldisease were measured by the Periodontal Index(PI), a system of classification proposed byRussell in 1956. By this method every tooth inthe mouth, unless it is a root, is scored on a scaleaccording to the presence or absence of manifestsigns of periodontal disease. When a portion of thefree gingiva is inflamed, a score of 1 is recorded.
1
When completely circumscribed by inflammation,teeth are scored 2. Teeth with frank periodontalpockets are scored 6 when their masticatory func-tion is unimpaired and 8 when it is impaired. Thearithmetic average of all scores is the individual'sPI, which ranges from a low of 0.0 (no inflamma-tion or periodontal pockets) to a high of 8.0 (allteeth with pockets and impaired function).
Oral hygiene was evaluated by the SimplifiedOral Hygiene Index (OHI-S), a method describedby Greene and Vermillion in 1964. In the simpli-fied method, the extent of oral debris and the ex-tent of oral calculus are measured on selectedsurfaces of at least two of six predesignatedteeth. The buccal surfaces of upper molars, thelingual surfaces of lower molars, and the labialsurfaces of upper and lower central incisorsare included. The proportion (in thirds) of thetotal surface area overlaid by debris and theproportion overlaid by calculus are averaged andthen summed to give the OHI-S, which rangesfrom a low of 0.0 (no debris, stain, or calculus)to a high of 6.0 (more than two-thirds of theexamined surfaces covered with both debris andcalculus). Appendix I describes in greater detailthe examining procedures for both oral hygieneand periodontal disease.
The PI and the OHI-S were also included inthe examinations conducted during the 1960-62survey of adults.5 The same two dentists whotrained new examiners during the adult surveyalso trained and periodically calibrated each ofthe other examiners during the survey of children.Thus, there is reason to believe that the findingscollected on children are comparable with thosepreviously collected on adults. In addition, a com-parison of findings from replicate examinationssuggests that interexaminer variability during thesurvey of children was adequately controlled, andthat it did not seriously affect the periodontaland oral hygiene findings. The training and cali-bration of examiners are described in appendixI, which also includes a comparison of the peri-odontal scores obtained during the replicateexaminations.
The dental examination also collected infor-mation about the occurrence of decayed, missing,and filled teeth. A report presenting national es-timates of decayed, missing, and filled permanentand primary teeth among children aged 6-11 waspublished earlier'
2
At the close of the survey in 1965, ',119children or 96 percent of 7,417 sample childrenhad been examined. Information about the dentalcondition of the 298 unexamined children is notavailable to the survey staff. There are grounds,however, for assuming that nonresponse did notseriously bias the estimates based on surveyfindings. Nonrespondents made up only a smallproportion of the entire sample. Moreover, infor-mation collected by household interview aboutboth respondents and nonrespondents revealed nomarked differentials in response rates associatedwith various demographic characteristics, includ-ing age, sex, race, geographic region, populationdensity, parents' education, and family income)
This report contains estimates of the PI andthe OHI-S for U.S. children aged 6-11 by variousdemographic characteristics. It also contains acorrelation analysis of the interrelation of the PI.OHI-S, and selected demographic characteristics.
PERIODONTAL INDEX FINDINGS
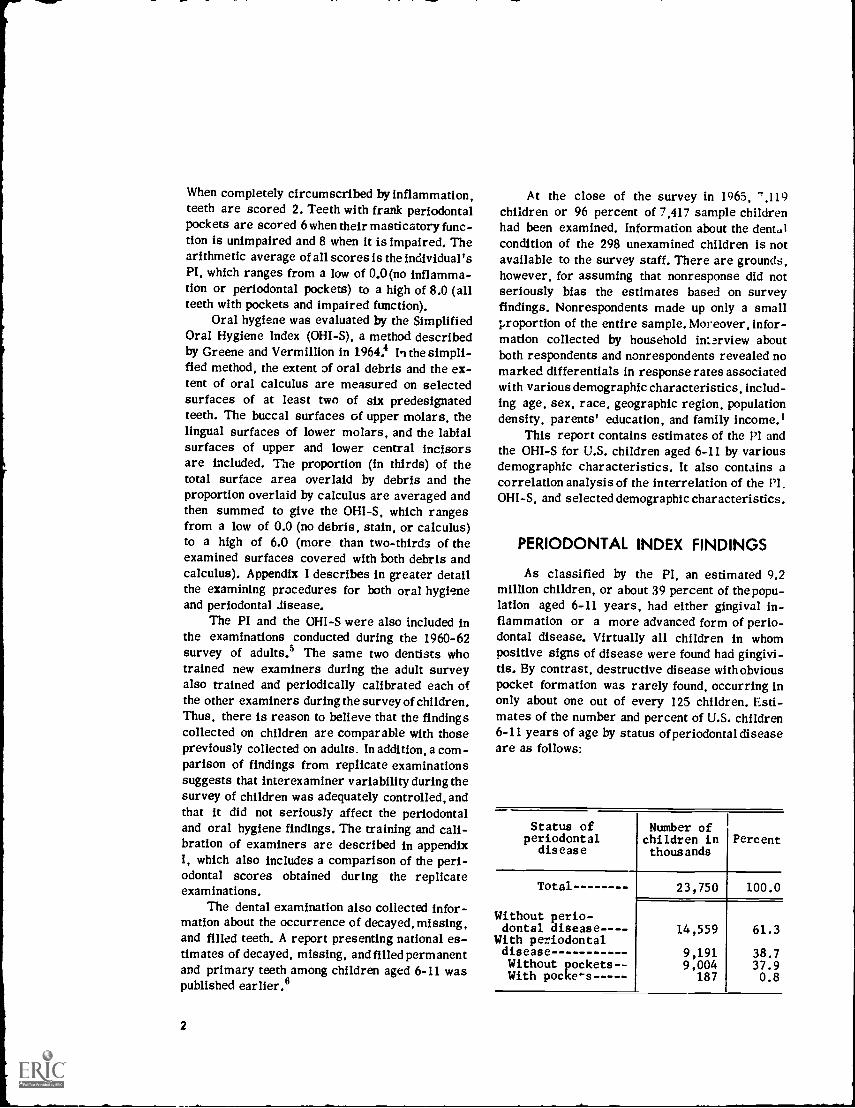
As classified by the PI, an estimated 9.2million children, or about 39 percent of the popu-lation aged 6-11 years, had either gingival in-flammation or a more advanced form of perio-dontal disease. Virtually all children in whompositive signs of disease were found had gingivi-tis. By contrast, destructive disease with obviouspocket formation was rarely found, occurring inonly about one out of every 125 children. Esti-mates of the number and percent of U.S. children6-11 years of age by status of periodontal diseaseare as follows:
Status ofperiodontal
diseaseNumber ofchildren inthousands
Percent
Total 23,750 100.0
Without perio-dontal disease--- - 14,559 61.3
With periodontaldisease 9,191 38.7Without pockets- - 9,004 37.9With pockcs 187 0.8
1
National estimates of the number of childrenwith specified levels of the PI are shown in table1. Periodontal disease, as measured by the PI,ranges from a mild inflammation of the marginalgingiva to a severe diffuse inflammation with ad-vanced destruction of the supporting bone. As fewas one tooth or as many as all the teeth normallypresent in the mouth may be involved. Althoughmany children were classified as having an ab-normal gingival or periodontal condition, the con-centration of low scores clearly indicates thatperiodontal disease is neither a serious nor animmediate threat to the dental health of mostchildren. For instance, about 95 percent of theestimated PI's of individual children were lessthan 0.6. The relatively few others ranged from0.6 to a high of only 2.9.
The PI was designed for epidemiologic use,and it is both rapid and simple to apply. It is alsoa relatively objective classification which makesit especially suitable for epidemiologic surveys.But even though the PI does not classify perio-dontal disease by clinical criteria, specifiedranges of the index among adults have been foundto correspond generally with various clinicalstages of gingivitis and chronic destructive dis-ease. The relationship is described by Russell asfollows: "Most persons considered to be normal,clinically, score from zero to .1 or .2; thosewith a clinical diagnosis of gingivitis, from .1 to1.0; those with severe gingivitis to incipient de-structive disease, from .5 to 1.9; those withfrankly-established destructive disease, from 1.5to 5.0; and those with disease in terminal stagesfrom about 4.0 to 8.0, the maximum score."7
Ranges of the PI and their correspondingclinical stages have not been established for chil-dren. However, the condition prevailing amongU.S. children can be described briefly as a mild,localized gingivitis which is transitory or wouldbe transitory with more frequent and more thor-ough toothbrushing. This clinical impression isreflected in the present findings by the abundanceof low scores and also by the narrow overallrange of scores. Although relatively small dif-ferences in the PI usually are not significantclinically, they may nevertheless indicate varia-tions in the prevalence and distribution of perio-dontal disease that may be significant epidemio-logically.
Age, Race, and Sex
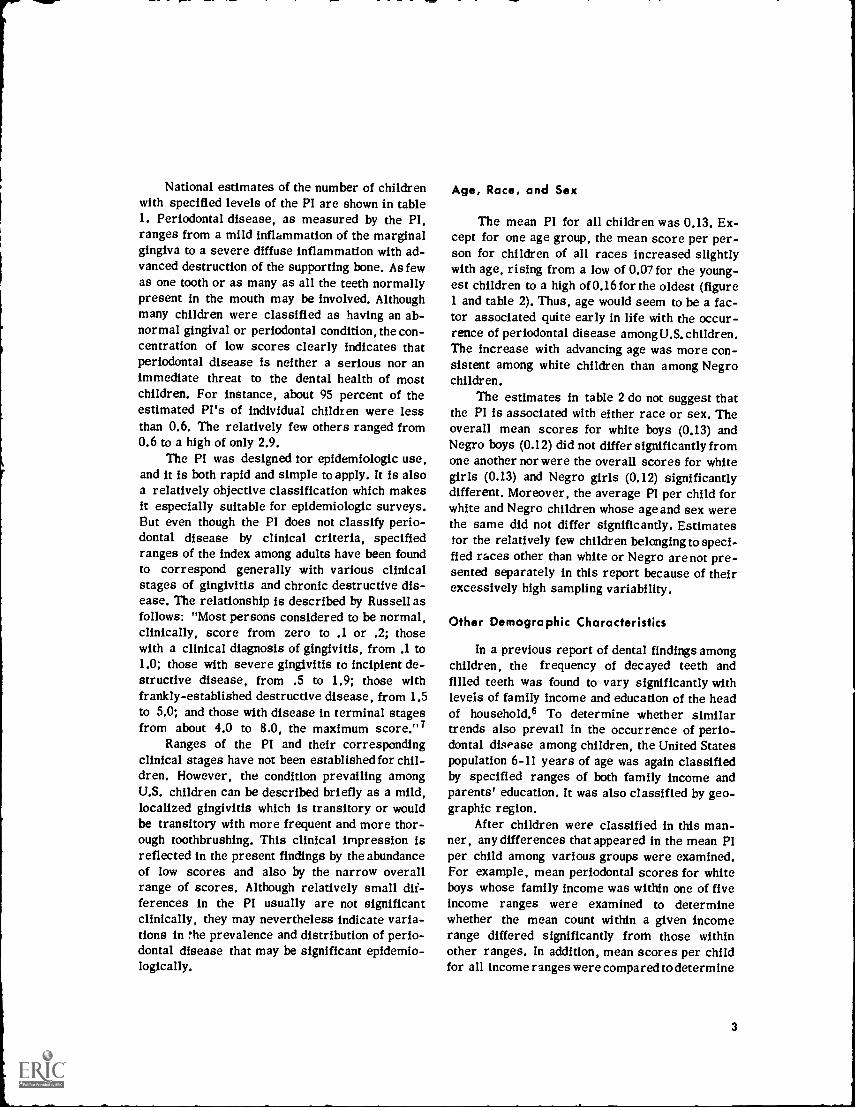
The mean PI for all children was 0.13. Ex-cept for one age group, the mean score per per-son for children of all races increased slightlywith age, rising from a low of 0.07 for the young-est children to a high of 0.16 for the oldest (figure1 and table 2). Thus, age would seem to be a fac-tor associated quite early in life with the occur-rence of periodontal disease among U.S. children.The increase with advancing age was more con-sistent among white children than among Negrochildren.
The estimates in table 2 do not suggest thatthe PI is associated with either race or sex. Theoverall mean scores for white boys (0.13) andNegro boys (0.12) did not differ significantly fromone another nor were the overall scores for whitegirls (0.13) and Negro girls (0.12) significantlydifferent. Moreover, the average PI per child forwhite and Negro children whose age and sex werethe same did not differ significantly. Estimatesfor the relatively few children belonging to speci-fied races other than white or Negro are not pre-sented separately in this report because of theirexcessively high sampling variability.
Other Demographic Characteristics
In a previous report of dental findings amongchildren, the frequency of decayed teeth andfilled teeth was found to vary significantly withlevels of family income and education of the headof households To determine whether similartrends also prevail in the occurrence of perio-dontal disease among children, the United Statespopulation 6-11 years of age was again classifiedby specified ranges of both family income andparents' education. It was also classified by geo-graphic region.
After children were classified in this man-ner, any differences that appeared in the mean PIper child among various groups were examined.For example, mean periodontal scores for whiteboys whose family income was within one of fiveincome ranges were examined to determinewhether the mean count within a given incomerange differed significantly from those withinother ranges. In addition, mean scores per childfor all income ranges were compared to determine
3
020
0.15
x
010
0
005
o.op L
re eie:.
1111
4,1 1.10'
Total'
Who
Negro
007 007 007
0.11 0.11
0.13
0.16 0.15 016 0150 14 0 14 0.14
016 0.16
AGt IN YEARS'badman Q. for ...het Wm" larch slows separaiely
Figure I. Average Periodontal Index for children, by race and age.
whether the PI trended higher or lower with in-creasing income. The comparisons were madeamong children of the same race and sex. Sinceperiodontal scores differed by age, adjustmentwas made for differences in the age distributionof the children within each income and educationgroup and within each geographic region by cal-culating age-adjusted values.
Expected (age-adjusted) values were calcu-lated by weighting the age-sex-race-specific meanPI per child for the total United States populationof children by the number of children in that age-sex-race group within specified ranges of incomeor education. Actual and expected values may dif-fer by chance. But, when the difference is signif-icant, one may conclude that the mean PI of agiven sex-race-income group or a sex-race-edu-cation group is excessively larger or smaller thanthe mean of that sex-race group for the UnitedStates and that this excess is independent of age.
Because of the relatively limited number ofsample children, sampling variability for specificage groups is usually quite large. It is for thisreason that summary comparisons of actual andexpected values were preferred to a comparisonof mean age-specific values.
Income and education.The occurrence ofgingival inflammation among children was in-
4
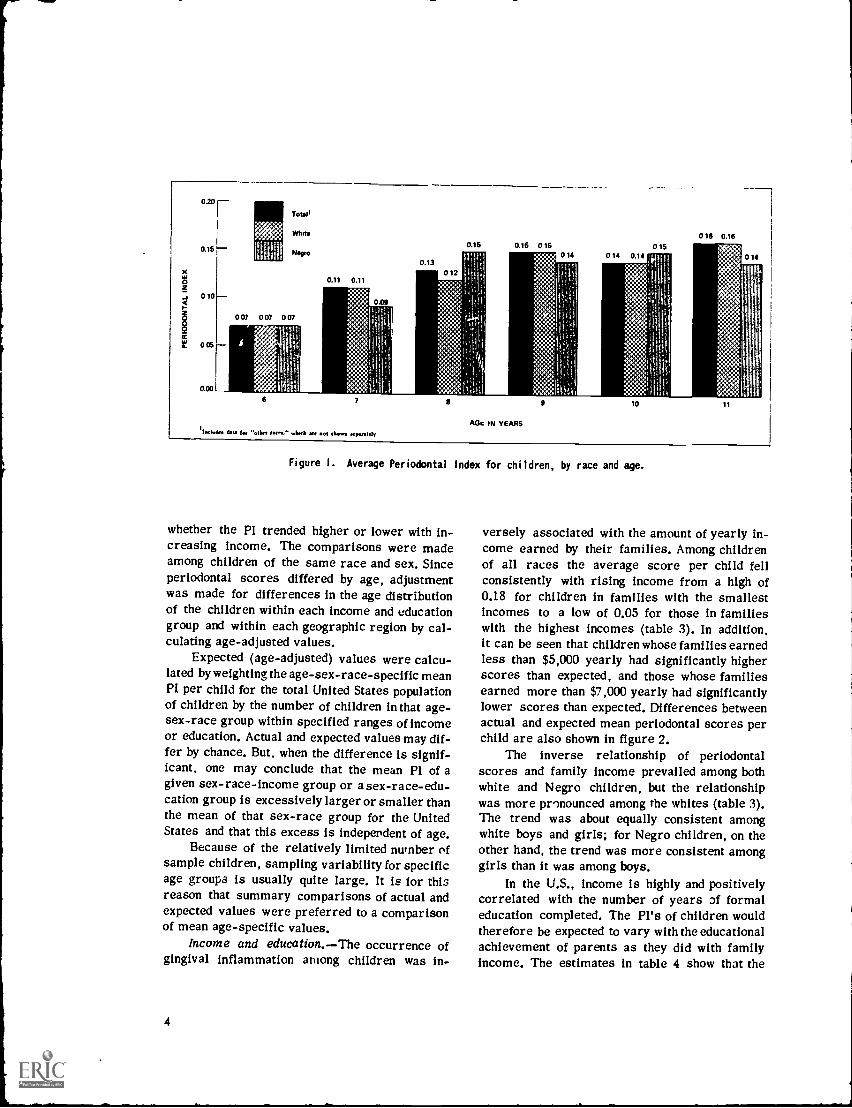
versely associated with the amount of yearly in-come earned by their families. Among childrenof all races the average score per child fellconsistently with rising income from a high of0.18 for children in families with the smallestincomes to a low of 0.05 for those in familieswith the highest incomes (table 3). In addition,it can be seen that children whose families earnedless than $5,000 yearly had significantly higherscores than expected, and those whose familiesearned more than $7,000 yearly had significantlylower scores than expected. Differences betweenactual and expected mean periodontal scores perchild are also shown in figure 2.
The inverse relationship of periodontalscores and family income prevailed among bothwhite and Negro children, but the relationshipwas more pronounced among the whites (table 3).The trend was about equally consistent amongwhite boys and girls; for Negro children, on theother hand, the trend was more consistent amonggirls than it was among boys.
In the U.S., income is highly and positivelycorrelated with the number of years of formaleducation completed. The PI's of children wouldtherefore be expected to vary with the educationalachievement of parents as they did with familyincome. The estimates in table 4 show that the
0 10
006
r cure 2. Differences between actual and expectedaverage Periodontal Index for chi ldren aged 6-11
years, by family income.
PI is indeed associated with parents' educationallevels and that the association parallels in mostrespects that of mean scores with family income.For example, children of all races whose parentshad completed 12 years of schooling or more hadsignificantly lower scores than expected, and thosewhose parents had completed 11 years of schoolingor less generally had higher scores than expected(figure 3). The association of periodontal scoreswith parents' education was more consistentamong white children than among Negro childrenand about equally consistent among white boysand girls.
Geographic region.Mean periodontal scoresper child were lower in the West (0.07) and Mid-west (0.09) than in the Northeast (0.17) and South(0.18), as shown in table 5. However, the onlysignificant differences between mean scores perchild were for children living in the South, whohad higher scores than those living in the Mid-west and West.
Table 5 also contains estimates of the aver-age PI for white and Negro children by sex andregion of residence. The mean Pl's for whitechildren did not vary significantly by region.Among Negro children boys and girls living inthe South had higher mean scores per person thandid those living in the West.
0.10
006
000
E6
.010
0 10
007
NavesNu than5 yaws
57Team
006
5 911 12 13 15 16Non tars yam yaws years
EDUCATION OF HEAD OF HOUSEHOLD
007
17 yawsOr MON
Figure 3. Differences between actual and expectedaverage Periodontal Index for children aged 6-11
years, by education of head of household.
SIMPLIFIED ORAL HYGIENE iNDEX
FINDINGS
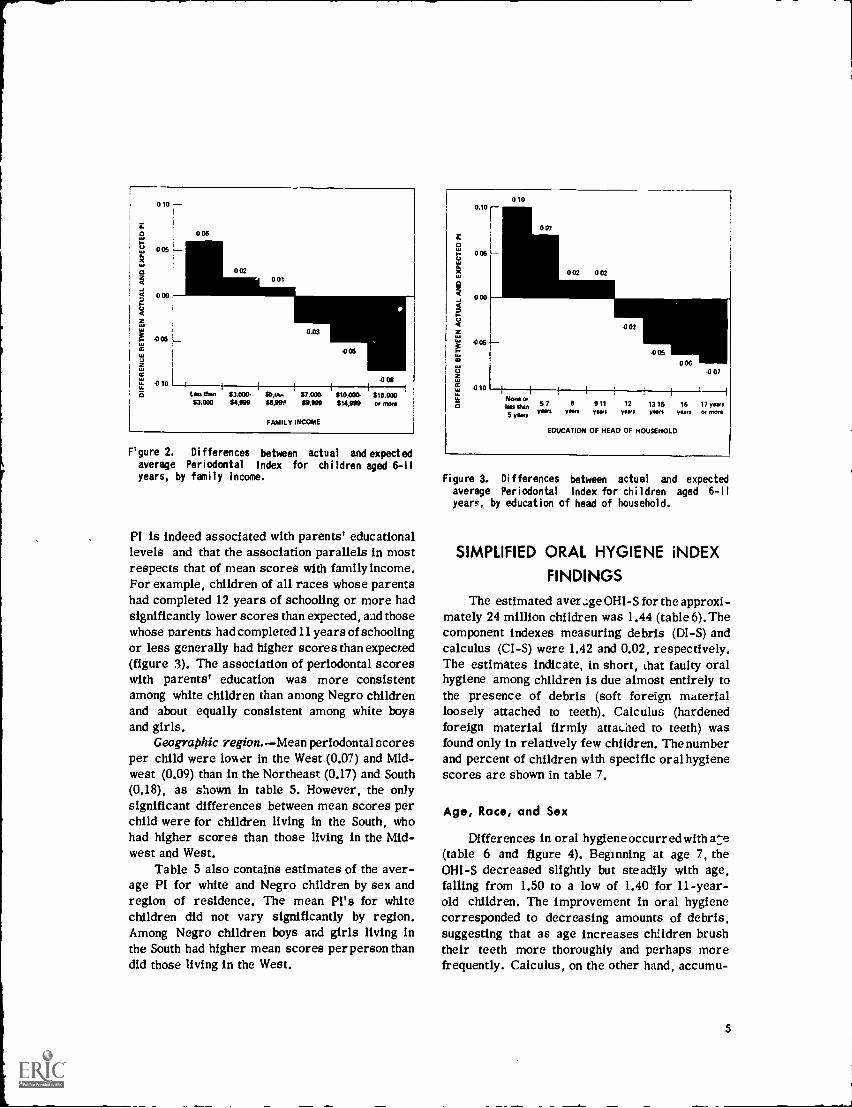
The estimated aver.:ge OHI-S for the approxi-mately 24 million children was 1.44 (table 6). Thecomponent indexes measuring debris (DI-S) andcalculus (CI-S) were 1.42 and 0.02, respectively.The estimates indicate, in short, that faulty oralhygiene among children is due almost entirely tothe presence of debris (soft foreign materialloosely attached to teeth). Calculus (hardenedforeign material firmly attaLsed to teeth) wasfound only in relatively few children. The numberand percent of children with specific oral hygienescores are shown in table 7.
Age, Race, and Sex
Differences in oral hygiene occurred with a:e(table 6 and figure 4). Beginning at age 7, theOHI-S decreased slightly but steadily with age,falling from 1.50 to a low of 1.40 for 11-year-old children. The improvement in oral hygienecorresponded to decreasing amounts of debris,suggesting that as age increases children brushtheir teeth more thoroughly and perhaps morefrequently. Calculus, on the other hand, accumu-
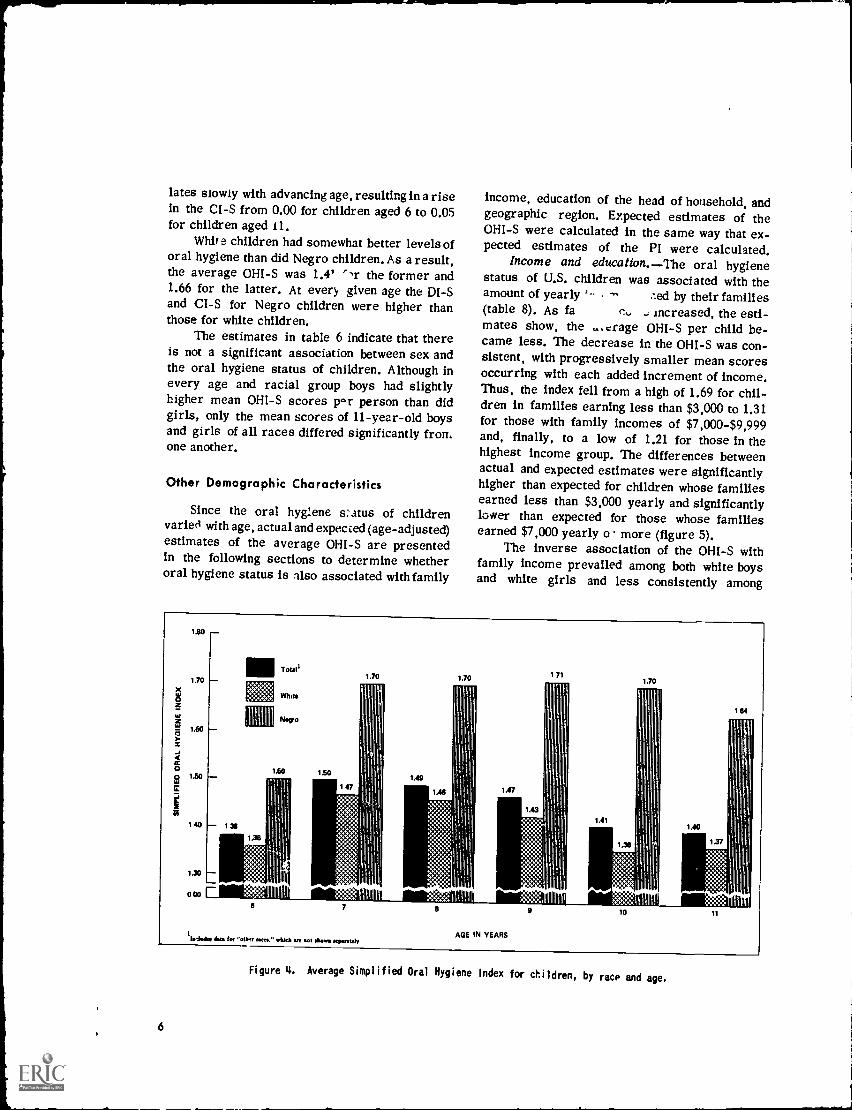
lates slowly with advancing age, resulting in a risein the CI-S from 0.00 for children aged 6 to 0.05for children aged 11.
Whit e children had somewhat better levels oforal hygiene than did Negro children. As a result,the average OHI-S was 1.4",r the former and1.66 for the latter. At every given age the DI-Sand CI-S for Negro children were higher thanthose for white children.
The estimates in table 6 indicate that thereis not a significant association between sex andthe oral hygiene status of children. Although inevery age and racial group boys had slightlyhigher mean OHI-S scores p.r person than didgirls, only the mean scores of 11-year-old boysand girls of all races differed significantly fromone another.
Other Demographic Characteristics
Since the oral hygiene status of childrenvaried with age, actual and expected (age-adjusted)estimates of the average OHI-S are presentedin the following sections to determine whetheroral hygiene status is llso associated with family
LSO
1.70
LSO
1.50
140 13,
1.30
000
income, education of the head of household, andgeographic region. Expected estimates of theOHI-S were calculated in the same way that ex-pected estimates of the PI were calculated.
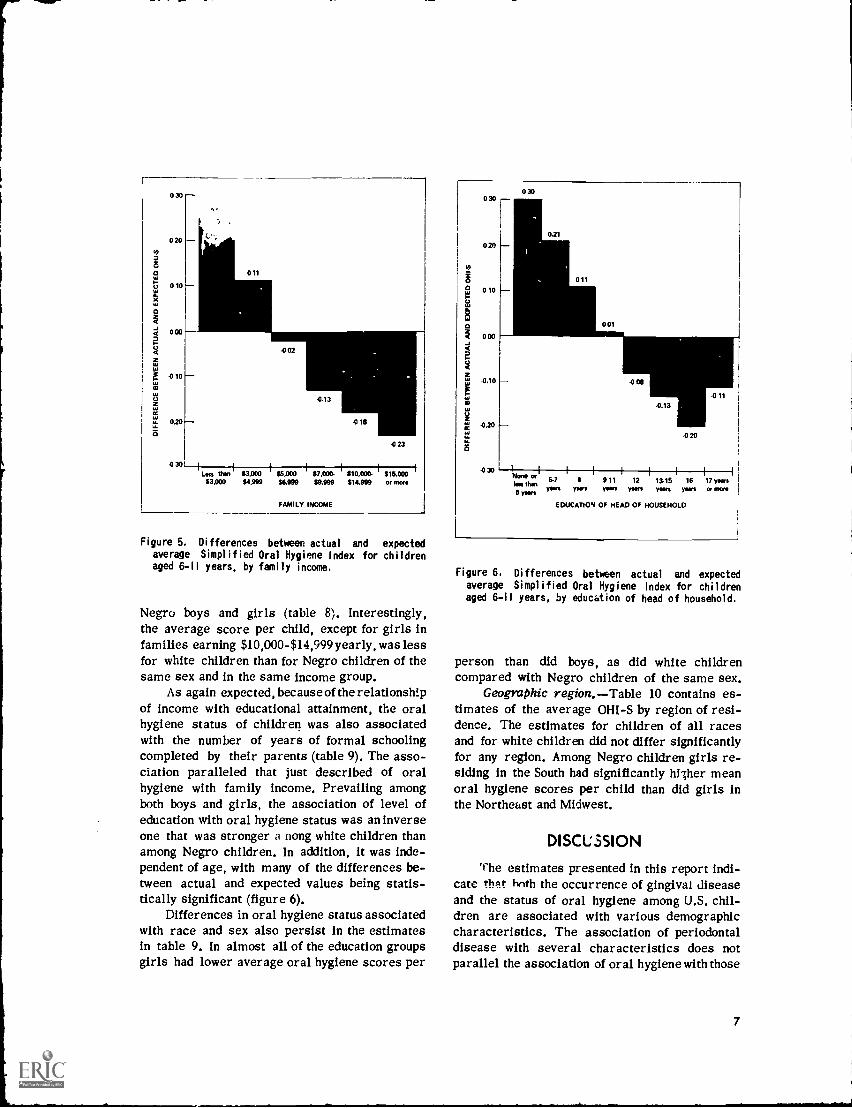
Income and education.The oral hygienestatus of U.S. children was associated with theamount of yearly .--ed by their families(table 8). As fa .; increased, the esti-mates show, the ,..crage OHI-S per child be-came less. The decrease in the OHI-S was con-sistent, with progressively smaller mean scoresoccurring with each added increment of income.Thus, the index fell from a high of 1.69 for chil-dren in families earning less than $3,000 to 1.31for those with family incomes of $7,000-$9,999and, finally, to a low of 1.21 for those in thehighest income group. The differences betweenactual and expected estimates were significantlyhigher than expected for children whose familiesearned less than $3,000 yearly and significantlylower than expected for those whose familiesearned $7,000 yearly o more (figure 5).
The inverse association of the OHI-S withfamily income prevailed among both white boysand white girls and less consistently among
'11'11! I II
Ilaludee 1sts tot 'WI,/ rotes." wirkb of sot Aolva *widelyAGE IN YEARS
9 10 11
Figure 4. Average Simplified Oral Hygiene Index for children, by race and age.
6
0 30
020
00 ow
0
40
6
0
LL
a
000
.010
0.20
-0 30
011
-002
-0.13
.0111
.0 23
Lass than $3.000 $6,000 I $7,000. i $10,000. $15,000$3,000 $4,999 56,999 59,999 614.999 or mots
FAMILY INCOME
Figure 5. Differences between actual and expectedaverage Simplified Oral Hygiene Index for childrenaged 6-11 years, by family income.
Negro boys and girls (table 8). Interestingly,the average score per child, except for girls infamilies earning $10,000-$14,999 yearly, was lessfor white children than for Negro children of thesame sex and in the same income group.
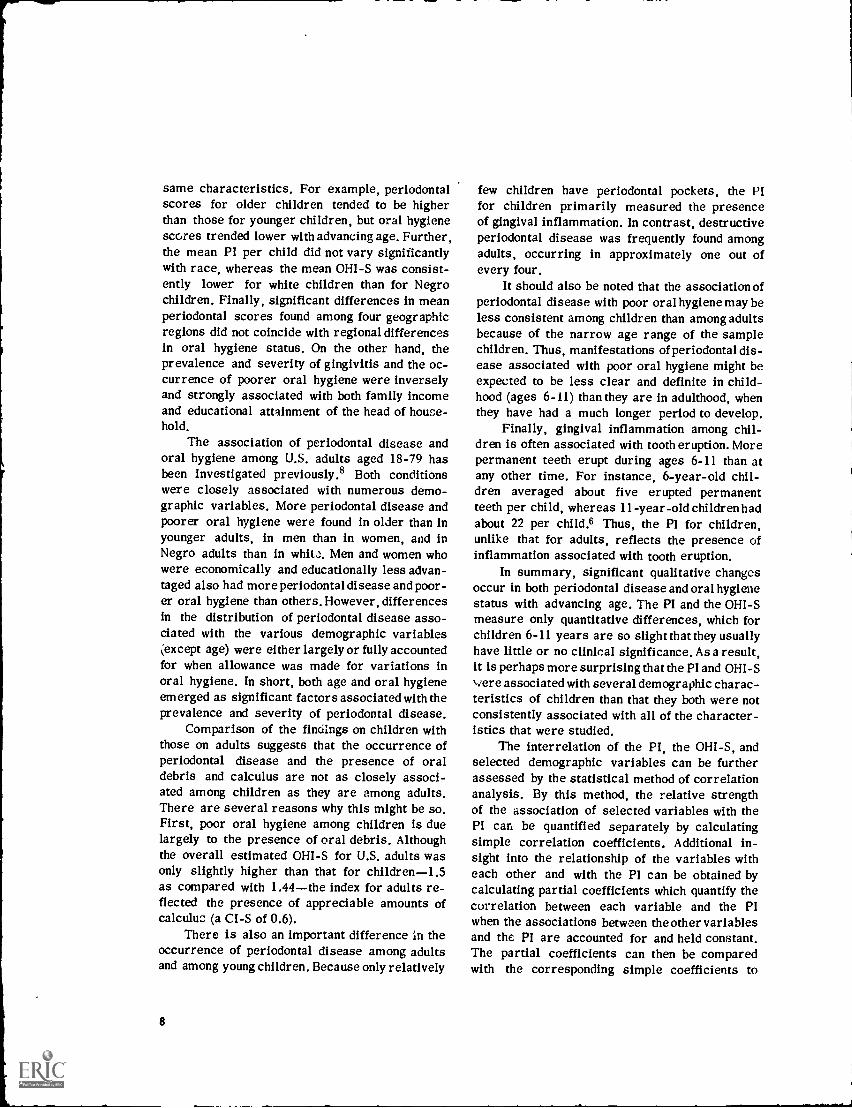
As again expected, because of the relationshipof income with educational attainment, the oralhygiene status of children was also associatedwith the number of years of formal schoolingcompleted by their parents (table 9). The asso-ciation paralleled that just described of oralhygiene with family income. Prevailing amongboth boys and girls, the association of level ofeducation with oral hygiene status was an inverseone that was stronger a nong white children thanamong Negro children. In addition, it was inde-pendent of age, with many of the differences be-tween actual and expected values being statis-tically significant (figure 6).
Differences in oral hygiene status associatedwith race and sex also persist in the estimatesin table 9. In almost all of the education groupsgirls had lower average oral hygiene scores per
0 30
020
0
a000
6
tS
LL
a
.0.10
.020
-030
030
EDUCATION OF HEAD OF HOUSEHOLD
Figure 6. Differences between actual and expectedaverage Simplified Oral Hygiene Index for childrenaged 6-11 years, by education of head of household.
person than did boys, as did white childrencompared with Negro children of the same sex.
Geographic region.Table 10 contains es-timates of the average OHI-S by region of resi-dence. The estimates for children of all racesand for white children did not differ significantlyfor any region. Among Negro children girls re-siding in the South had significantly hither meanoral hygiene scores per child than did girls inthe Northeast and Midwest.
DISCLSSION
The estimates presented in this report indi-cate that tenth the occurrence of gingival diseaseand the status of oral hygiene among U.S. chil-dren are associated with various demographiccharacteristics. The association of periodontaldisease with several characteristics does notparallel the association of oral hygiene with those
7
same characteristics. For example, periodontalscores for older children tended to be higherthan those for younger children, but oral hygienescores trended lower with advancing age. Further,the mean PI per child did not vary significantlywith race, whereas the mean OHI-S was consist-ently lower for white children than for Negrochildren. Finally, significant differences in meanperiodontal scores found among four geographicregions did not coincide with regional differencesin oral hygiene status. On the other hand, theprevalence and severity of gingivitis and the oc-currence of poorer oral hygiene were inverselyand strongly associated with both family incomeand educational attainment of the head of house-hold.
The association of periodontal disease andoral hygiene among U.S. adults aged 18-79 hasbeen investigated previously.8 Both conditionswere closely associated with numerous demo-graphic variables. More periodontal disease andpoorer oral hygiene were found in older than inyounger adults, in men than in women, and inNegro adults than in whit). Men and women whowere economically and educationally less advan-taged also had more periodontal disease and poor-er oral hygiene than others. However, differencesin the distribution of periodontal disease asso-ciated with the various demographic variablesexcept age) were either largely or fully accounted
for when allowance was made for variations inoral hygiene. In short, both age and oral hygieneemerged as significant factors associated with theprevalence and severity of periodontal disease.
Comparison of the findings on children withthose on adults suggests that the occurrence ofperiodontal disease and the presence of oraldebris and calculus are not as closely associ-ated among children as they are among adults.There are several reasons why this might be so.First, poor oral hygiene among children is duelargely to the presence of oral debris. Althoughthe overall estimated OHI-S for U.S. adults wasonly slightly higher than that for children-1.5as compared with 1.44the index for adults re-flected the presence of appreciable amounts ofcalculus (a CI-S of 0.6).
There is also an important difference in theoccurrence of periodontal disease among adultsand among young children. Because only relatively
8
few children have periodontal pockets, the PIfor children primarily measured the presenceof gingival inflammation. In contrast, destructiveperiodontal disease was frequently found amongadults, occurring in approximately one out ofevery four.
It should also be noted that the association ofperiodontal disease with poor oral hygiene may beless consistent among children than among adultsbecause of the narrow age range of the samplechildren. Thus, manifestations of periodontal dis-ease associated with poor oral hygiene might beexpected to be less clear and definite in child-hood (ages 6-11) than they are in adulthood, whenthey have had a much longer period to develop.
Finally, gingival inflammation among chil-dren is often associated with tooth eruption. Morepermanent teeth erupt during ages 6-11 than atany other time. For instance, 6-year-old chil-dren averaged about five erupted permanentteeth per child, whereas 11-year-old children hadabout 22 per child.6 Thus, the PI for children,unlike that for adults, reflects the presence ofinflammation associated with tooth eruption.
In summary, significant qualitative changesoccur in both periodontal disease and oral hygienestatus with advancing age. The PI and the 01-11-Smeasure only quantitative differences, which forchildren 6-11 years are so slight that they usuallyhave little or no clinical significance. Asa result,it is perhaps more surprising that the PI and 01-11-Swere associated with several demographic charac-teristics of children than that they both were notconsistently associated with all of the character-istics that were studied.
The interrelation of the PI, the OHI-S, andselected demographic variables can be furtherassessed by the statistical method of correlationanalysis. By this method, the relative strengthof the association of selected variables with thePI can be quantified separately by calculatingsimple correlation coefficients. Additional in-sight into the relationship of the variables witheach other and with the PI can be obtained bycalculating partial coefficients which quantify thecorrelation between each variable and the PIwhen the associations between the other variablesand the PI are accounted for and held constant.The partial coefficients can then be comparedwith the corresponding simple coefficients to
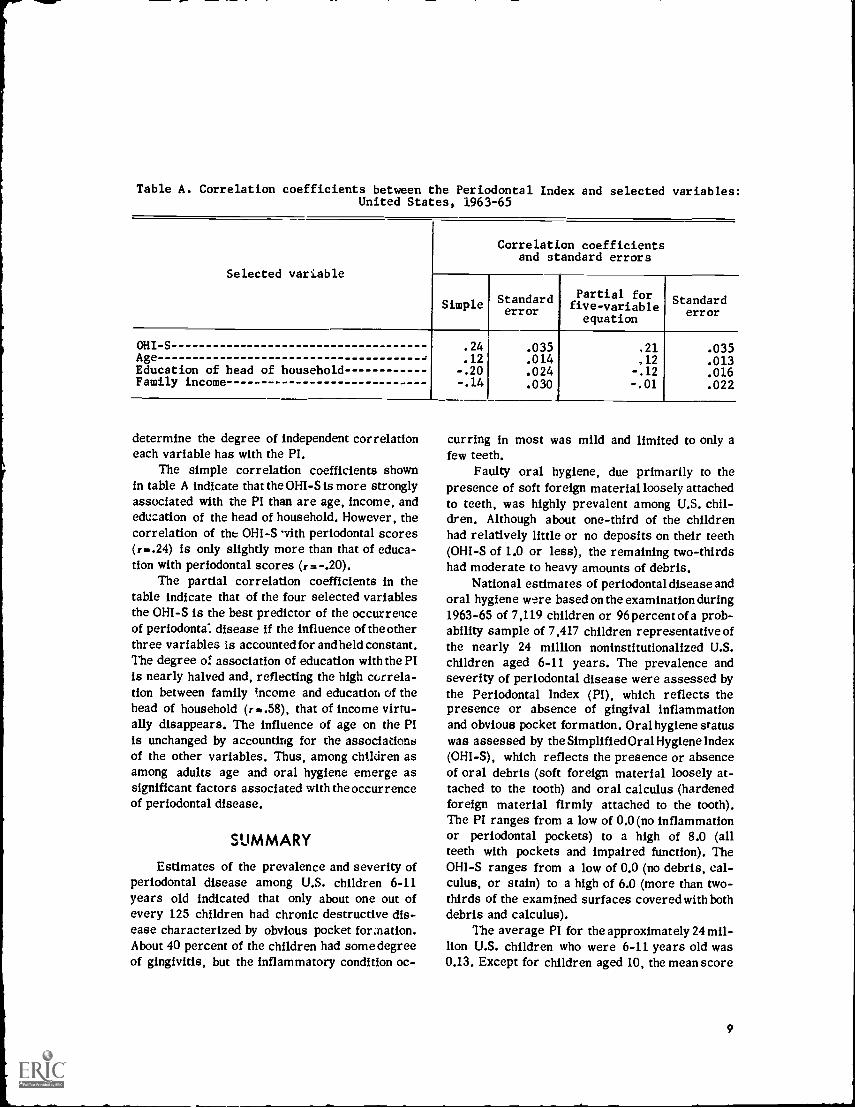
Table A. Correlation coefficients between the Periodontal Index and selected variables:United States, 1963-65
Selected variable
Correlation coefficientsand standard errors
Simple Standarderror
Partial forfive-variableequation
Standarderror
OHI-S .24 .035 .21 .035Age .12 .014 ,12 .013Education of head of household -.20 .024 -.12 .016Family income -.14 .030 -.01 .022
determine the degree of independent correlationeach variable has with the PI.
The simple correlation coefficients shownin table A indicate that the OHI-S is more stronglyassociated with the PI than are age, income, andeducation of the head of household. However, thecorrelation of the OHI-S vith periodontal scores(r..24) is only slightly more than that of educa-tion with periodontal scores (r.-.20).
The partial correlation coefficients in thetable indicate that of the four selected variablesthe OHI-S is the best predictor of the occurrenceof periodonta: disease if the influence of the otherthree variables is accounted for and held constant.The degree of association of education with the PIis nearly halved and, reflecting the high correla-tion between family income and education of thehead of household (r..58), that of income virtu-ally disappears. The influence of age on the PIis unchanged by accounting for the associationsof the other variables. Thus, among children asamong adults age and oral hygiene emerge assignificant factors associated with the occurrenceof periodontal disease.
SUMMARY
Estimates of the prevalence and severity ofperiodontal disease among U.S. children 6-11years old indicated that only about one out ofevery 125 children had chronic destructive dis-ease characterized by obvious pocket formation.About 40 percent of the children had some degreeof gingivitis, but the inflammatory condition oc-
curring in most was mild and limited to only afew teeth.
Faulty oral hygiene, due primarily to thepresence of soft foreign material loosely attachedto teeth, was highly prevalent among U.S. chil-dren. Although about one-third of the childrenhad relatively little or no deposits on their teeth(OHI-S of 1.0 or less), the remaining two-thirdshad moderate to heavy amounts of debris.
National estimates of periodontal disease andoral hygiene were based on the examination during1963-65 of 7,119 children or 96 percent of a prob-ability sample of 7,417 children representative ofthe nearly 24 million noninstitutionalized U.S.children aged 6-11 years. The prevalence andseverity of periodontal disease were assessed bythe Periodontal Index (PI), which reflects thepresence or absence of gingival inflammationand obvious pocket formation. Oral hygiene statuswas assessed by the Simplified Oral Hygiene Index(OHI-S), which reflects the presence or absenceof oral debris (soft foreign material loosely at-tached to the tooth) and oral calculus (hardenedforeign material firmly attached to the tooth).The PI ranges from a low of 0.0 (no inflammationor periodontal pockets) to a high of 8.0 (allteeth with pockets and impaired function). TheOHI-S ranges from a low of 0.0 (no debris, cal-culus, or stain) to a high of 6.0 (more than two-thirds of the examined surfaces covered with bothdebris and calculus).
The average PI for the approximately 24 mil-lion U.S. children who were 6-11 years old was0.13. Except for children aged 10, the mean score
9
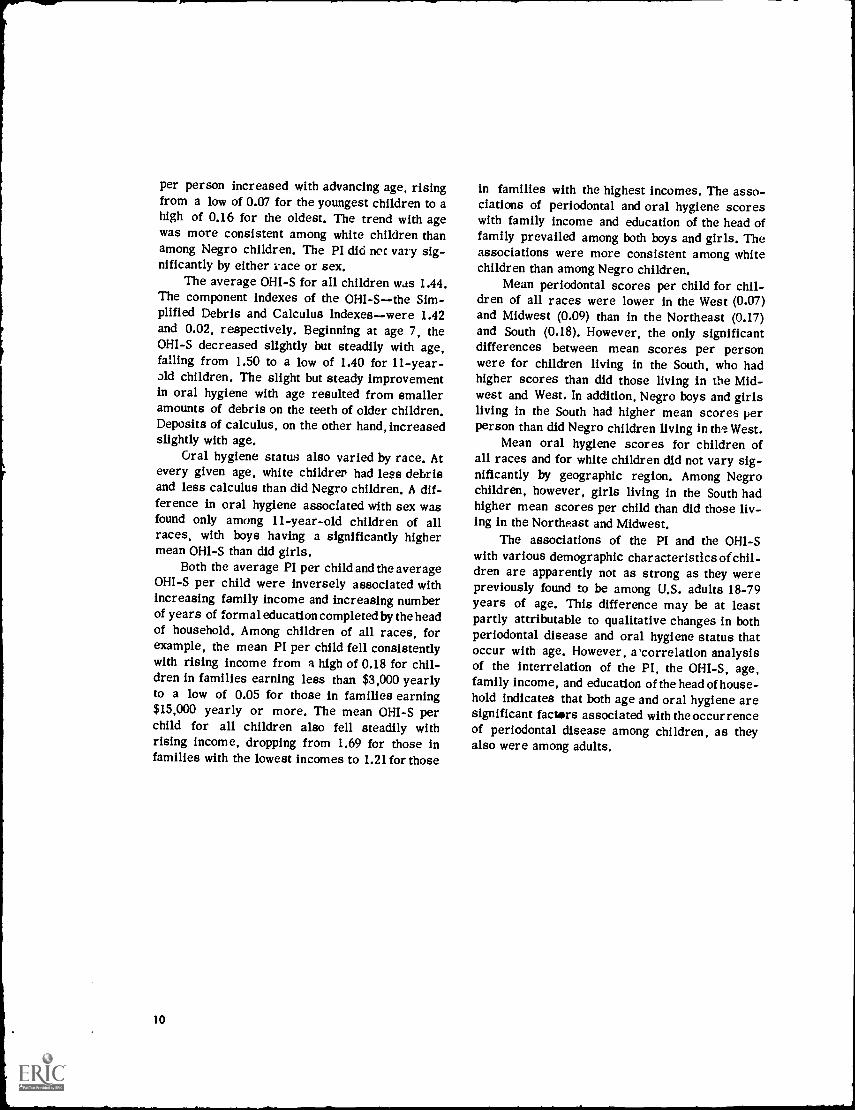
per person increased with advancing age, risingfrom a low of 0.07 for the youngest children to ahigh of 0.16 for the oldest. The trend with agewas more consistent among white children thanamong Negro children. The PI did net vary sig-nificantly by either vace or sex.
The average OHI-S for all children was 1.44.The component indexes of the OHI-Sthe Sim-plified Debris and Calculus Indexeswere 1.42and 0.02, respectively. Beginning at age 7, theOHI-S decreased slightly but steadily with age,falling from 1.50 to a low of 1.40 for 11-year-old children. The slight but steady improvementin oral hygiene with age resulted from smalleramounts of debris on the teeth of older children.Deposits of calculus, on the other hand, increasedslightly with age.
Oral hygiene status also varied by race. Atevery given age, white children had less debrisand less calculus than did Negro children. A dif-ference in oral hygiene associated with sex wasfound only among 11-year-old children of allraces, with boys having a significantly highermean OHI-S than did girls.
Both the average PI per child and the average011I-S per child were inversely associated withincreasing family income and increasing numberof years of formal education completed by the headof household. Among children of all races, forexample, the mean PI per child fell consistentlywith rising income from a high of 0.18 for chil-dren in families earning less than $3,000 yearlyto a low of 0.05 for those in families earning$15,000 yearly or more. The mean 0111 -S perchild for all children also fell steadily withrising income, dropping from 1.69 for those infamilies with the lowest incomes to 1.21 for those
10
in families with the highest incomes. The asso-ciations of periodontal and oral hygiene scoreswith family income and education of the head offamily prevailed among both boys and girls. Theassociations were more consistent among whitechildren than among Negro children.
Mean periodontal scores per child for chil-dren of all races were lower in the West (0.07)and Midwest (0.09) than in the Northeast (0.17)and South (0.18). However, the only significantdifferences between mean scores per personwere for children living in the South, who hadhigher scores than did those living in the Mid-west and West. In addition, Negro boys and girlsliving in the South had higher mean scores perperson than did Negro children living in the West.
Mean oral hygiene scores for children ofall races and for white children did not vary sig-nificantly by geographic region. Among Negrochildren, however, girls living in the South hadhigher mean scores per child than did those liv-ing in the Northeast and Midwest.
The associations of the PI and the OHI-Swith various demographic characteristics of chil-dren are apparently not as strong as they werepreviously found to be among U.S. adults 18-79years of age. This difference may be at leastpartly attributable to qualitative changes in bothperiodontal disease and oral hygiene status thatoccur with age. However, a.correlation analysisof the interrelation of the PI, the OHI-S, age,family income, and education of the head of house-hold indicates that both age and oral hygiene aresignificant factors associated with the occurrenceof periodontal disease among children, as theyalso were among adults.
REFERENCES
I National Center for Health Statistics: Plan, operation,and response results of a program of children's examinations.Vital and Health Statistics. PHS Pub. No. 1000-Series 1-No. 5.Public Health Service. Washington. U.S. Government PrintingOffice, Oct. 1967.
2NationJ Center for Health Statistics: Plan and initialprogram of the Health Examination Survey. Vital and HealthStatistics. PHS Pub. No. 1000-Series 1-No. 4. Public HealthService. Washington. U.S. Government Printing Office, July1965.
3Russell, A. L.: A system of classification and scoring forprevalence surveys of periodontal disease. J Dent. Res. 35(3):350-359, June 1956.
4 Greene, J. C., and Vermillion, J. R.: The Simplified OralHygiene Index. .1. Am. Dent. A. 68(1): 7-13, Jan. 1964.
5National Center for Health Statistics: Selected dentalfindings in adults by age, race, and sex, United States,1 960-1 962. Vital and Health Statistics. PHS Pub. No.1000-Series 11-No. 7. Public Health Service. Washington. U.S.Government Printing Office, Feb. 1965.
6National Center for Health Statistics: Decayed, missing,and filled teeth among children, United States. Vital andHealth Statistics. Series 11-No. 106. DHEW Pub. No. (HSM) 72-1003. Washington. U.S. Government Printing Office, Aug. 1971.
7Russell, A. L.: Some epidemiological characteristics ofperiodontal disease in a series of urban populations. J.Periodont. 28:286.293, Oct. 1957.
8National Center for Health Statistics: Oral Hygiene inAdults, United States, 1960-1962. Vital and Health Statistics.PHS Pub. No. 1000-Series 11-No. 16. Public Health Service.Washington. U.S. Government Printing Office, June 1966.
9National Center for Health Statistics: Sample design andestimation procedures for a national health examination surveyof children. frital and Health Statistics. Series 2-No. 43. DHEWPub. No. (HSM1 72-1005. Washington. U.S. GovernmentPrinting Office, Aug. 1971.
1 °National Center for Health Statistics:,Pseudoreplication, further evaluation and application of thebalanced half-sample technique. Vital and Health Statistics.PHS Pub. No. 1000-Series 2-No. 31. Public Health Service.Washington. U.S. Government Printing Office, Jan. 1969.
000
11

LIST OF DETAILED TABLES
Page
Table 1. Number and percent of children aged 6-11 years, by Periodontal Index and sex:United States, 1963-65- - 13
2. Average Periodontal Index for children, by race, sex, and age: United States,1963-65
13
3. Actual and expected average Periodontal Index for children aged 6-11 years, bysex, race, and family income: United States, 1963-65 14
4. Actual and expected average Periodontal Index for children aged 1)-11 years, bysex, race, and education of head of household: United States, 196:-65 14
5. Actual and expected average Periodontal Index for children nee. 6-11 years, bysex, race, and geographic region: United States, 1963-65 15
6. Average Simplified Oral Hygiene, Debris, and Calculus Indexet, for children, byrace, sex, and age: United States, 1963-65 15
7. Limber and percent of children aged 6-11 years, by Simplified Oral Hygiene Indexand sex: United States, 1963-65 - - 16
8. Actual and expected average Simplified Oral Hygiene Index fcr children aged 6-11years, by sox, race, and family income: United States, 1963-65 17
9. Actual and expected average Simplified Oral Hygiene Index for children aged 6-11years, by sex, race, and education of head of household: Inited States, 1963-65- 17
10. Actual and expected average Simplified Oral Hygiene Index for children aged 6-11years, by sex, race, and geographic. region: United State', 1963-65 18
12
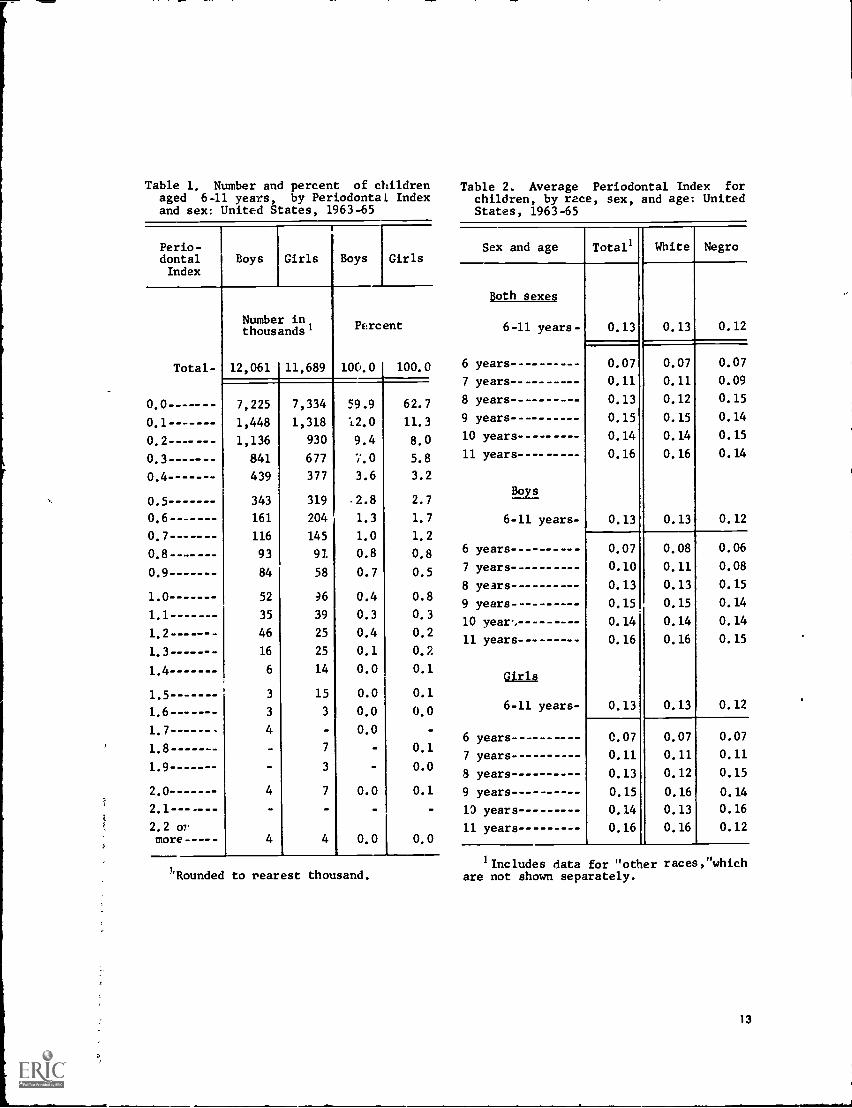
Table 1. Number and percent of childrenaged 6-11 years, by Periodontal Indexand sex: United States, 1963-65
Perio-dontalIndex
Boys Girls Boys Girls
Total-
Numberthousands'
12,061
in,
11,689
Percent
100.0 100.0
0.0 ----- -- 7,225 7,334 59.9 62.7
0.1 1,448 1,318 12.0 11.3
1,136 930 9.4 8.0
0.3----- 841 677 7.0 5.8
0.4 439 377 3.6 3.2
0.5 343 319 .2.8 2.7
0.6 161 204 1.3 1.7
0.7 - - - -- 116 145 1.0 1.2
93 91 0.8 0.8
0.9 84 58 0.7 0.5
1.0 52 ;6 0.4 0.8
1 . 1 35 39 0.3 0.3
46 25 0.4 0.2
1.3 16 25 0.1 0.2
1.4 6 14 0.0 0.1
1.5 3 15 0.0 0.1
1.6-- 3 3 0.0 0.0
4 0.0
1.8 7 0.1
1.9 3 0.0
2.0 4 7 0.0 0.1
2.2 07more ----- 4 4 0.0 0.0
'Rounded to rearest thousand.
Table 2. Average Periodontal Index forchildren, by race, sex, and age: UnitedStates, 1963-65
Sex and age Totals White Negro
Doth sexes
0.13 0.13 0.126-11 years-
6 years 0.07 0.07 0.07
7 years 0.11 0.11 0.09
8 years 0.13 0.12 0.15
9 years 0.15 0.15 0.14
10 years 0.14 0.14 0.15
11 years 0.16 0.16 0.14
Boys
6-11 years- 0.13 0.13 0.12
6 years 0.07 0.08 0.06
7 years 0.10 0.11 0.08
8 years 0.13 0.13 0.15
9 years 0.15 0.15 0.14
10 year, 0.14 0.14 0.14
11 years -- 0.16 0.16 0.15
Girls
6-11 years- 0.13 0.13 0.12
6 years 0.07 0.07 0.07
7 years 0.11 0.11 0.11
8 years 0.13 0.12 0.15
9 years 0.15 0.16 0.14
10 years 0.14 0.13 0.16
11 years 0.16 0.16 0.12
'Includes data for "other races, "whichare not shown separately.
13
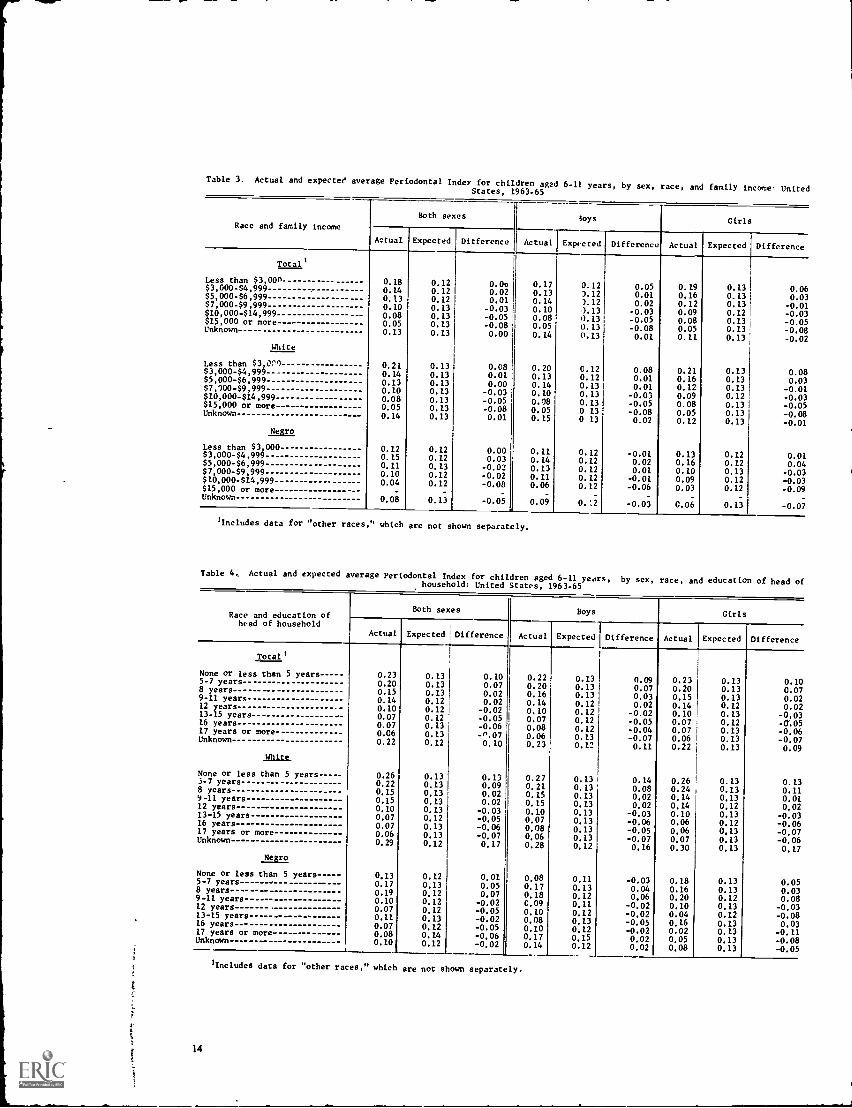
Table 3. Actual and expected average Periodontal 'elder for childrenagsd 6-11 years, by sex, race, and family income- UnitedStates, 1963-65
Race and family incomeBoth sexes toys Girls
Actual Expected Difference Actual Expected Difference Actual Expected Difference
Total)
Less than $3,00n 0.18 0.12 0.0o 0.17 0.12 0.05 0.19 0.13 0.06$3,000-$4,999 0.14 0.12 0.02 0.13 5.12 0.01 0.16 0.13 0.03$5,000-$6,999 ------ - ------ 0.13 0.12 0.01 0.14 ).12 0.02 0.12 0.13 -0.01$7,000-$9,999 ------ 0.10 0.13 -0.03 0.10 ).13 -0.03 0.09 0.12 -0.03$10,000-$14,999 0.08 0.13 -0.05 0.08 0.13 -0.05 0.08 0.13 -0.05$15,000 or more 0.05 0.13 -0.08 0.05 0.13 -0.08 0.05 0.13 -0.08Unknown 0.13 0.13 0.00 0.14 0.13 0.01 0.11 0.13 -0.02White
Less than $3,000_ 0.21 0.13 0.08 0.20 0.12 0.08 0.21 0.13 0.08$3,000-$4,999 0.14 0.13 0.01 0.13 0.12 0.01 0.16 0.13 0.03$5,000-$6,999 0.13 0.13 0.00 0.14 0.13 0.01 0.12 0.13 -0.01$7,10049,999 0.10 0.13 -0.03 0.10 0.13 -0.03 0.09 0.12 -0.03$10,000-$14,999 0.08 0.13 -0.05 0.08 0.13 -0.05 0.08 0.13 -0.05$15,000 or more 0.05 0.13 -0.08 0.05 0 13 -0.08 0.05 0.13 -0.08Unknown 0.14 0.13 0.01 0.15 0 13 0.02 0.12 0.13 -0.01
ISMLess than $3 000 0.12 0.12 0.00 0.11 0.12 -0.01 0.13 0.12 0.01$3,000-$4,999 0.15 0.12 0.03 0.14 0.12 0.02 0.16 0.12 0.04$5,000-$6,999 0.11 0.13 -0.02 0.13 0.12 0.01 0.10 0.13 -0.03$7,000-$9,999 0.10 0.12 -0,02 0.11 0.12 -0.01 0.09 0.12 -0.03$10,000414,999 0.04 0.12 -0,08 0.06 0.12 -0.06 0.03 0.12 -0.09$15,000 or more - - - _
- -Unknown 0.08 0.13 -0.05 0.09 0.:2 -0.03 0.06 0.13 -0.07
Includes data for "other races," which are not shown separately.
Table 4, Actual and expected average Periodontal Index for children aged 6-11 years, by sex, race, and education of head ofhousehold: United States, 1963-65
Race and education ofhead of household
Both sexes Boys Girls
Actual Expected . Difference Actual Expected Difference Actual Expected Difference
Total 1
None or less than 5 years 0.23 0.13 0.10 0.22 0.13 0.09 0.23 0.13 0.105-7 years 0.20 0.13 0.07 0.20 0.13 0.07 0.20 0.13 0.078 years 0.15 0.13 0.02 0.16 0.13 0.03 0.15 0.13 0.029-11 years 0.14 0.12 0.02 0.14 0.12 0.02 0.14 0.12 0.0212 years 0.10 0.12 -0.02 0.10 0.12 -0.02 0.10 0.13 -0,0313-15 years---- -- 0.07 0.12 -0.05 0.07 0.12 -0.05 0.07 0.12 -0.0516 years-- 0.07 0.13 -0.06 0.08 0.12 -0.04 0.07 0.13 -0.0617 years or more---- 0.06 0.13 -n.07 0.06 0.13 -0.07 0.06 0.13 -0.07Unknown
juts.
0.22 0.12 0.10 0.23 0.12 0.11 0.22 0.13 0.09
None or less than 5 years 0.26 0.13 0.13 0.27 0.13 0.14 0.26 0.13 0.135-7 years - 0.22 0.13 0.09 0.21 0.13 0.08 0.24 0.13 0.118 years- 0.15 0.13 0.02 0.15 0.13 0.02 0.14 0.13 0.019-11 years 0.15 0.13 0.02 0.15 0.13 0.02 0.14 0.12 0.0212 years 0.10 0.13 -0.03 0.10 0.13 -0.03 0.10 0.13 -0.0313-15 years 0.07 0.12 -0.05 0.07 0.13 -0.06 0.06 0.12 -0.0616 years 0.07 0.13 -0.06 0.08 0.13 -0.05 0.06 0,13 -0.0717 years or more-- -------- 0.06 0.13 -0.07 0.06 0.13 -0.07 0.07 0.13 -0.06Unknown 0.29 0.12 0.17 0.28 0.12 0.16 0.30 0.13 0.17
NUMNone or less than 5 years 0,13 0.12 0.01 0.08 0.11 -0.03 0.18 0.13 0.055-7 years 0.17 0.13 0.05 0.17 0.13 0.04 0.16 0.13 0.038 years-------- 0.19 0.12 0,07 0.18 0.12 0,06 0.20 0.12 0.089-11 years 0.10 0.12 -0.02 0.09 0.11 -0.02 0.10 0.13 -0.0312 years 0.07 0.12 -0.05 0.10 0,12 -0.02 0.04 0.12 -0.0813-15 years ----- -------- ------ 0.11 0.13 -0.02 0.08 0.13 -0.05 0.16 0.13 0.0316 years- 0.07 0.12 -0.05 0.10 0.12 -0.02 0.02 0.13 -0.1117 years or more 0.08 0.14 -0.06 0.17 0.15 0.02 0.05 0.13 -0.08Unknown-------- --------------- 0.10 0.12 -0.02 0.14 0.12 0.02 0.08 0.13 -0.05
Includes data for "other races," which are not shown separately.
14
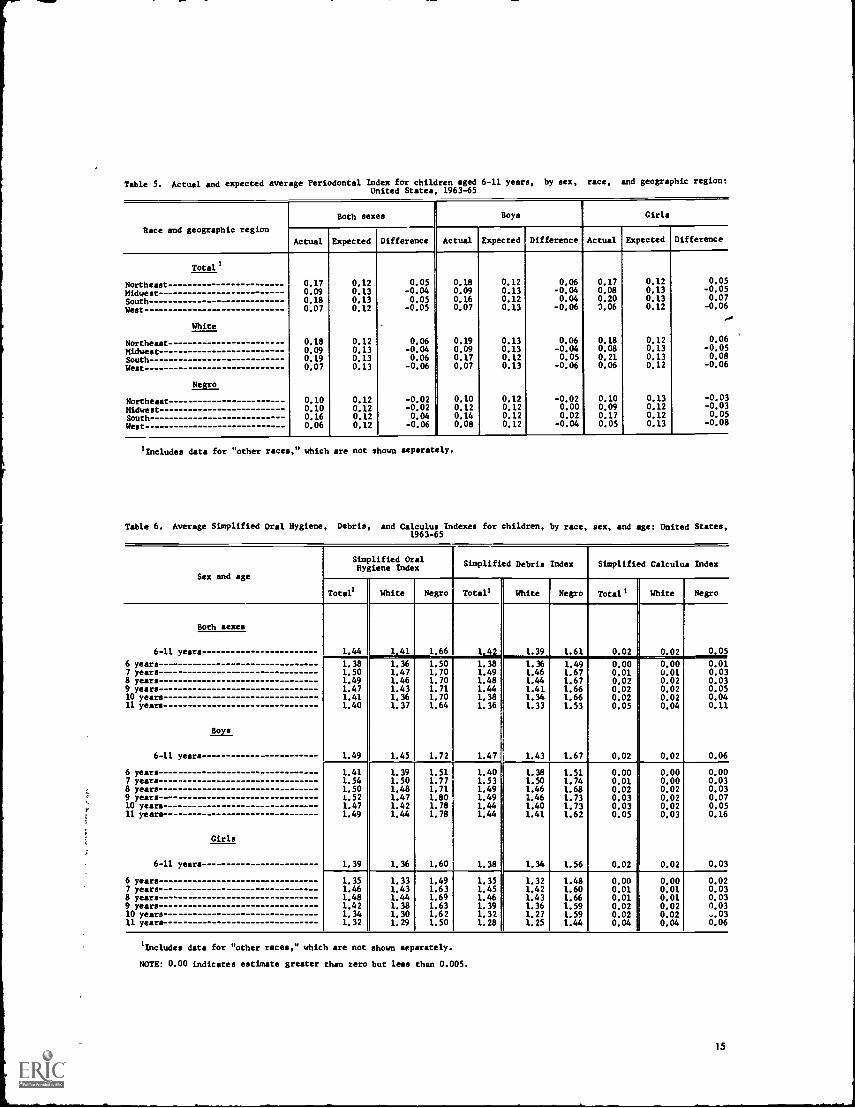
Table 5. Actual and expected average Periodontal Index for children aged 6-11 years, by sex, race, and geographic region:United States, 1963-65
Race and geographic region
Both sexesi
Boys Girls
Actual Expected Difference Actual Expected Difference Actual Expected Difference
Total'
Northeast 0.17 0.12 0.05 0.18 0.12 0.06 0.17 0.12 0.05
Midwest 0.09 0.13 -0.04 0.09 0.13 -0.04 0.08 0.13 -0.05
South 0.18 0.13 0.05 0.16 0.12 0.04 0.20 0.13 0.07
West 0.07 0.12 -0.05 0.07 0.13 -0.06 3.06 0.12 -0.06
White
Northeast 0.18 0.12 0.06 0.19 0.13 0.06 0.18 0.12 0.06
Midwest 0.09 0.13 -0.04 0.09 0.13 -0.04 0.08 0.13 -0.05
South 0.19 0.13 0.06 0.17 0.12 0.05 0.21 0.13 0.08
West 0.07 0.13 -0.06 0.07 0.13 -0.06 0.06 0.12 -0.06
Negro
Northeast 0.10 0.12 -0.02 0.10 0.12 -0.02 0.10 0.13 -0.03
MidwestSouthWest
0.100.160.06
0.120.120.12
-0.020.04-0.06
0.120.140.08
0.120.120.12
0.000.02-0.04
0.090.170.05
0.120.120.13
-0.030.05
-0.08
'Includes data for "other races," which are not shown separately.
Table 6. Average Simplified Oral Hygiene, Debris, and Calculus Indexes for children, by race, sex, and age: United States,1963-65
Sex and age
Simplified OralHygiene Index
Simplified Debris Index Simplified Calculus Index
Total' White Negro Total' White Negro Total' White Negro
Both sexes
6-11 years 1.44 1.41 1.66 1,42 1.39 1.61 0.02 0.02 0.05
6 years 1.38 1.36 1.50 1.38 1.36 1.49 0.00 0.00 0.017 years 1.50 1.47 1.70 1.49 1.46 1.67 0.01 0.01 0.038 years 1.49 1.46 1.70 1.48 1.44 1.67 0.02 0.02 0.039 years 1.47 1.43 1.71 1.44 1.41 1.66 0.02 0.02 0.0510 years 1.41 1.36 1.70 1.38 1.34 1.66 0.02 0.02 0.0411 years 1.40 1.37 1.64 1.36 1.33 1.53 0.05 0.04 0.11
Boys
6-11 years- 1.49 1.45 1.72 1.47 1.43 1.67 0.02 0.02 0.06
6 years 1.41 1.39 1.51 1.40 1.38 1.51 0.00 0.00 0.007 years 1.54 1.50 1.77 1.53 1.50 1.74 0.01 0.00 0.038 years 1.50 1.48 1.71 1.49 1.46 1.68 0.02 0.02 0.039 years- 1.52 1.47 1.80 1.49 1.46 1.73 0.03 0.02 0.0710 years 1.47 1.42 1.78 1.44 1.40 1.73 0.03 0.02 0.0511 years 1.49 1.44 1.78 1.44 1.41 1.62 0.05 0.03 0.16
Girls
6-11 years 1.39 1.36 1.60 1.38 1.34 1.56 0.02 0.02 0.03
6 years 1.35 1.33 1.49 1.35 1.32 1.48 0.00 0.00 0.027 years 1.46 1.43 1.63 1.45 1.42 1.60 0.01 0.01 0.038 years 1.48 1.44 1.69 1.46 1.43 1.66 0.01 0.01 0.039 years 1.42 1.38 1.63 1.39 1.36 1.59 0.02 0.02 0.0310 years 1.34 1.30 1.62 1.32 1.27 1.59 0.02 0.02 ..,.03
11 years 1.32 1.29 1.50 1.28 1.25 1.44 0.04 0.04 0.06
lIncludes data for "other races," which are not shown separately.
NOTE: 0.00 indicates estimate greater than zero but less than 0.005.
15
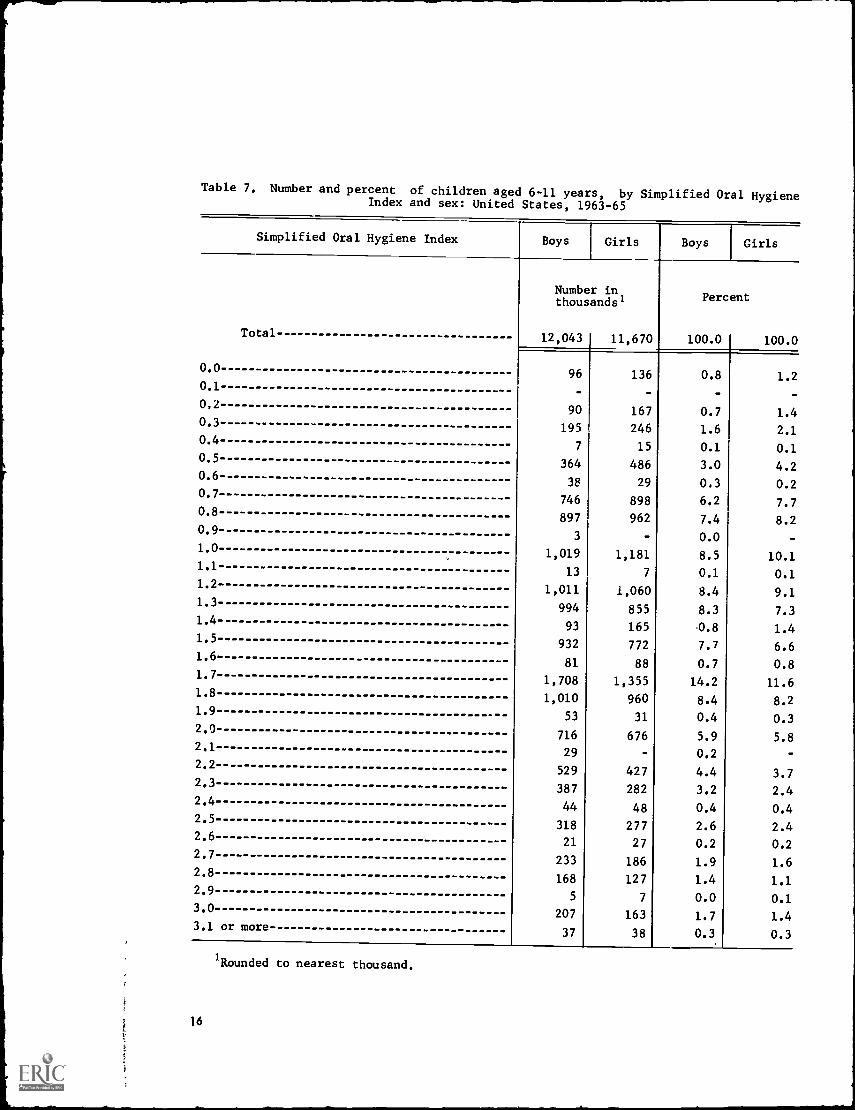
Table 7. Number and percent of children aged 6-11 years, by Simplified Oral HygieneIndex and sex: United States, 1963-65
Simplified Oral Hygiene Index Boys Girls Boys Girls
Number inthousands' Percent
Total 12,043 I 11,670 100.0 100.0
0.096 136 0.8 1.2
0.1
0,290 167 0.7 1.4
0.3195 246 1.6 2.1
0.47 15 0.1 0.1
0.5364 486 3.0 4.2
0.638 29 0.3 0.2
0.7746 898 6.2 7.7
0.8897 962 7.4 8.2
0.93 0.0 -
1.0 1,019 1,181 8.5 10.11.1
13 7 0.1 0.11.2
1,011 1,060 8.4 9.11.3
994 855 8.3 7.31.4
93 165 0.8 1.41.5 932 772 7.7 6.61.6
81 88 0.7 0.81.7 1,708 1,355 14.2 11.61.8 1,010 960 8.4 8.21.9 53 31 0.4 0.32.0
716 676 5.9 5.82.1
29 0.2 -2.2
529 427 4.4 3.72.3
387 282 3.2 2.42.4
44 48 0.4 0.42.5
318 277 2.6 2.42.6
21 27 0.2 0.22.7
233 186 1.9 1.62.8
168 127 1.4 1.12.9
5 7 0.0 0.13.0 207 163 1.7 1.43.1 or more
37 38 0.3 0.3
1Rounded to nearest thousand.
16
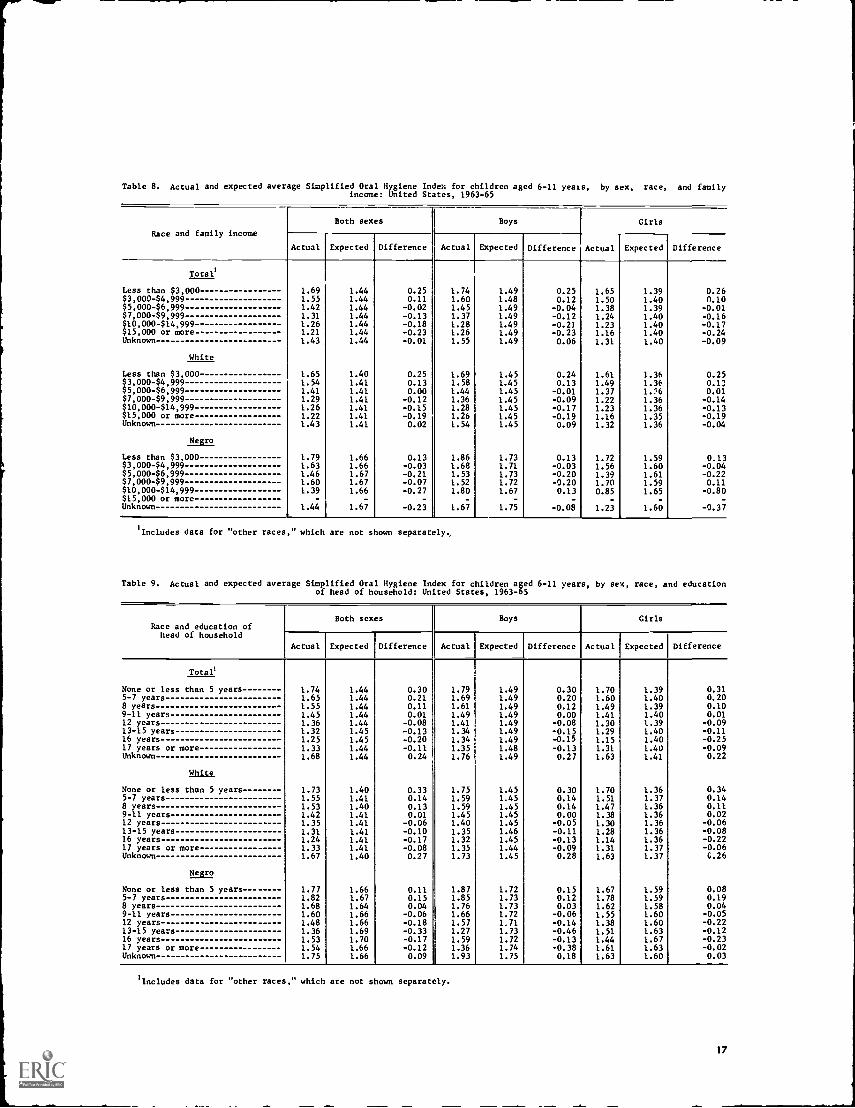
Table 8. Actual and expected average Simplified Oral Hygiene Index for children aged 6-11 years, by sex, race, and familyincome: United States, 1963-65
Race and family income
Both sexes Boys Girls
Actual Expected Difference Actual Expected I Difference Actual Expected Difference
Total
1.691.551.421.311.261.211.43
1.651.541.411.291.261.221.43
1.791.631.461.601.39
1.44
1.441.441.441.441.441.441.44
1.401.411.411.411.411.411.41
1.661.661.671.671.66
-
1.67
0.250.11
-0.02-0.13-0.18-0.23-0.01
0.250.130.00
-0.12-0.15-0.190.02
0.13-0.03-0.21-0.07-0.27
-0.23
1.741.601.451.371.281.261.55
1.691.581.441.361.281.261.54
1.861.681.531.521.80
-
1.67
1.491.481.491.491.491.491.49
1.451.451.451.451.451.451.45
1.731.711.731.721.67
1.75
0.250.12
-0.04-0.12-0.21-0.230.06
0.240.13
-0.01-0.09-0.17-0.190.09
0.13-0.03-0.20-0.200.13
-
-0.08
1.651.501.381.241.231.161.31
1.611.491.371.221.231.161.32
1.721.561.391.700.85
-
1.23
1.391.401.391.401.401.401.40
1.361.361.:=6
1.361.361.351.36
1.591.601.611.591.65
-
1.60
0.260.10
-0.01-0.16-0.17-0.24-0.09
0.250.130.01-0.14-0.13-0.19-0.04
0.13-0.04-0.220.11
-0.80-
-0.37
Less than $3,000$3,000-$4,999$5,000-$6,999$7,000-$9,999$10,000-$14,999$15,000 or moreUnknown
White
Less than $3,000$3,000-$4,999$5,000-$6,999$7,000-$9,999$10,000-$14,999$15,000 or moreUnknown
Negro
Less than $3,000$3,000-$4,999$5,000-$6,999$7,000-$9,999$10,000-$14,999$15,000 or moreUnknown
Includes data for "other races," which are not shown separately,
Table 9. Actual and expected average Simplified Oral Hygiene Index for children aged 6-11 years, by sex, race, and educationof head of household: United States, 1963-65
Race and education ofhead of household
Both sexes Boys Girls
Actual Expected Difference Actual Expected Difference Actual Expected Difference
To
None or less than 5 years 1.74 1.44 0.30 1.79 1.49 0.30 1.70 1.39 0.315-7 years 1.65 1.44 0.21 1.69 1.49 0.20 1.60 1.40 0.208 years 1.55 1.44 0.11 1.61 1.49 0.12 1.49 1.39 0.109-11 years 1.45 1.44 0.01 1.49 1.49 0.00 1.41 1.40 0.0112 years 1.36 1.44 -0.08 1.41 1.49 -0.08 1.30 1.39 -0.0913-15 years 1.32 1.45 -0.13 1.34 1.49 -0.15 1.29 1.40 -0.1116 years 1.25 1.45 -0.20 1.34 1.49 -0.15 1.15 1.40 -0.2517 years or more 1.33 1.44 -0.11 1.35 1.48 -0.13 1.31 1.40 -0.09Unknown 1.68 1.44 0.24 1.76 1.49 0.27 1.63 1.41 0.22
HULL
None or less than 5 years 1.73 1.40 0.33 1.75 1.45 0.30 1.70 1.36 0.345-7 years 1.55 1.41 0.14 1.59 1.45 0.14 1.51 1.37 0.148 years 1.53 1.40 0.13 1.59 1.45 0.14 1.47 1.36 0.119-11 years 1.42 1.41 0.01 1.45 1.45 0.00 1.38 1.36 0.0212 years 1.35 1.41 -0.06 1.40 1.45 -0.05 1.30 1.36 -0.0613-15 years 1.31 1.41 -0.10 1.35 1.46 -0.11 1.28 1.36 -0.0816 years 1.24 1.41 -0.17 1.32 1.45 -0.13 1.14 1.36 -0.2217 years or more 1.33 1.41 -0.08 1.35 1.44 -0.09 1.31 1.37 -0.06Unknown 1.67 1.40 0.27 1.73 1.45 0.28 1.63 1.37 G.26
Negro
None or less than 5 years 1.77 1.66 0.11 1.87 1.72 0.15 1.67 1.59 0.085-7 years 1.82 1.67 0.15 1.85 1.73 0.12 1.78 1.59 0.198 years 1.68 1.64 0.04 1.76 1.73 0.03 1.62 1.58 0.049-11 years 1.60 1.66 -0.06 1.66 1.72 -0.06 1.55 1.60 -0.0512 years 1.48 1.66 -0.18 1.57 1,71 -0.14 1.38 1.60 -0.2213-15 years 1.36 1.69 -0.33 1.27 1.73 -0.46 1.51 1.63 -0.1216 years 1.53 1.70 -0.17 1.59 1.72 -0.13 1.44 1.67 -0.2317 years or more 1.54 1.66 -0.12 1.36 1.74 -0.38 1.61 1.63 -0.02Unknown 1.75 1.66 0.09 1.93 1.75 0.18 1.63 1.60 0.03
'Includes data for "other races," which are not shown separately.
17
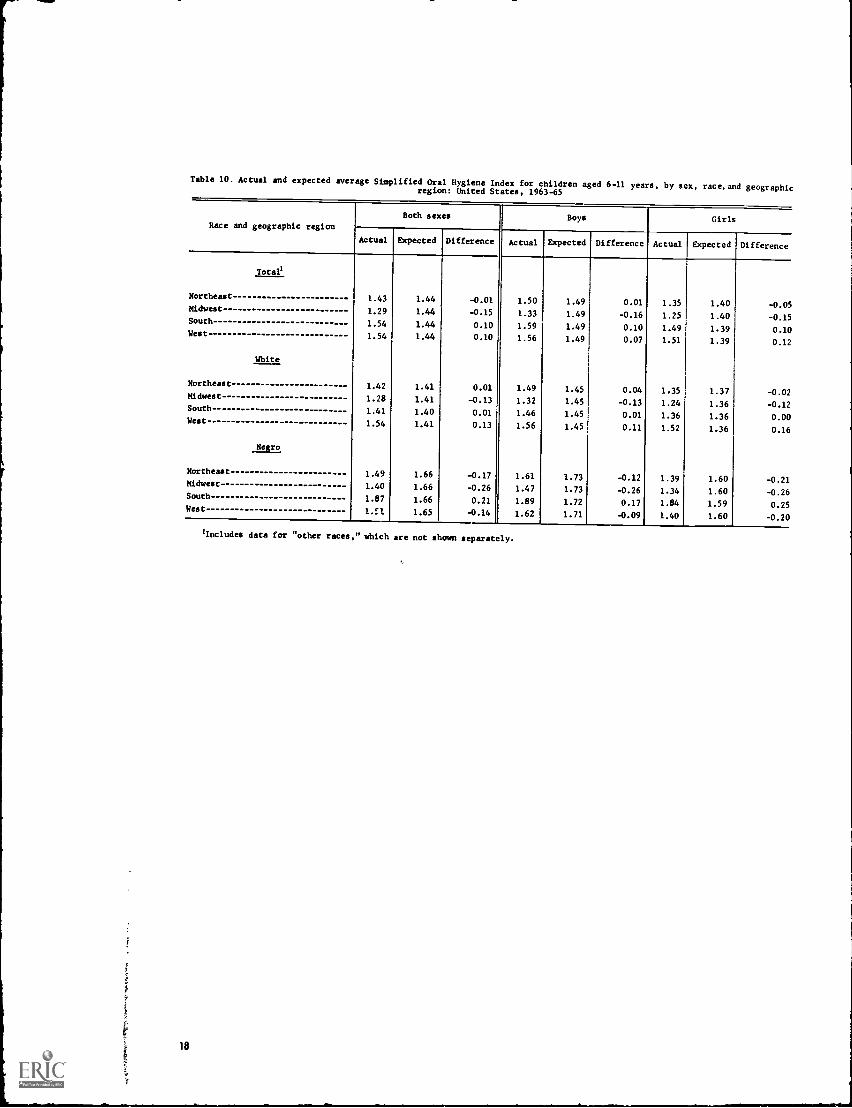
Table 10. Actual and expected average Simplified Oral HygieneIndex for children aged 6-11 years, by sex, race, and geographicregion: United States, 1963-65
Race and geographic regionBoth sexes Boys Girls
Actual Expected Difference Actual Expected Difference Actual Expected Difference
Total'
Northeast 1.43 1.44 -0.01 1.50 1.49 0.01 1.35 1.40 -0.05Midwest 1.29 1.44 -0.15 1.33 1.49 -0.16 1.25 1.40 -0.15South 1.54 1.44 0.10 1.59 1.49 0.10 1.49 1.39 0.1CWest 1.54 1.44 0.10 1.56 1.49 0.07 1.51 1.39 0.12
White
Northeast 1.42 1.41 0.01 1.49 1.45 0.04 1.35 1.37 -0.02Midwest 1.28 1.41 -0.13 1.32 1.45 -0.13 1.24 1.36 -0.12South 1.41 1.40 0.01 1.46 1.45 0.01 1.36 1.36 0.0(West 1.54 1.41 0.13 1.56 1.45 0.11 1.52 1.36 0.1E
Negro
Northeast 1.49 1.66 -0.17 1.61 1.73 -0.12 1.39 1.60 -0.21Midwest 1.40 1.66 -0.26 1.47 1.73 -0.26 1.34 1.60 -0.2fSouth 1.87 1.66 0.21 1.89 1.72 0.17 1.84 1.59 0.2!West 1.El 1.65 -0.14 1.62 1.71 -0.09 1.40 1.60 -0.2(
'Includes data for "other races," which are not shown separately.
18
APPENDIX I
THE DENTAL EXAMINATION
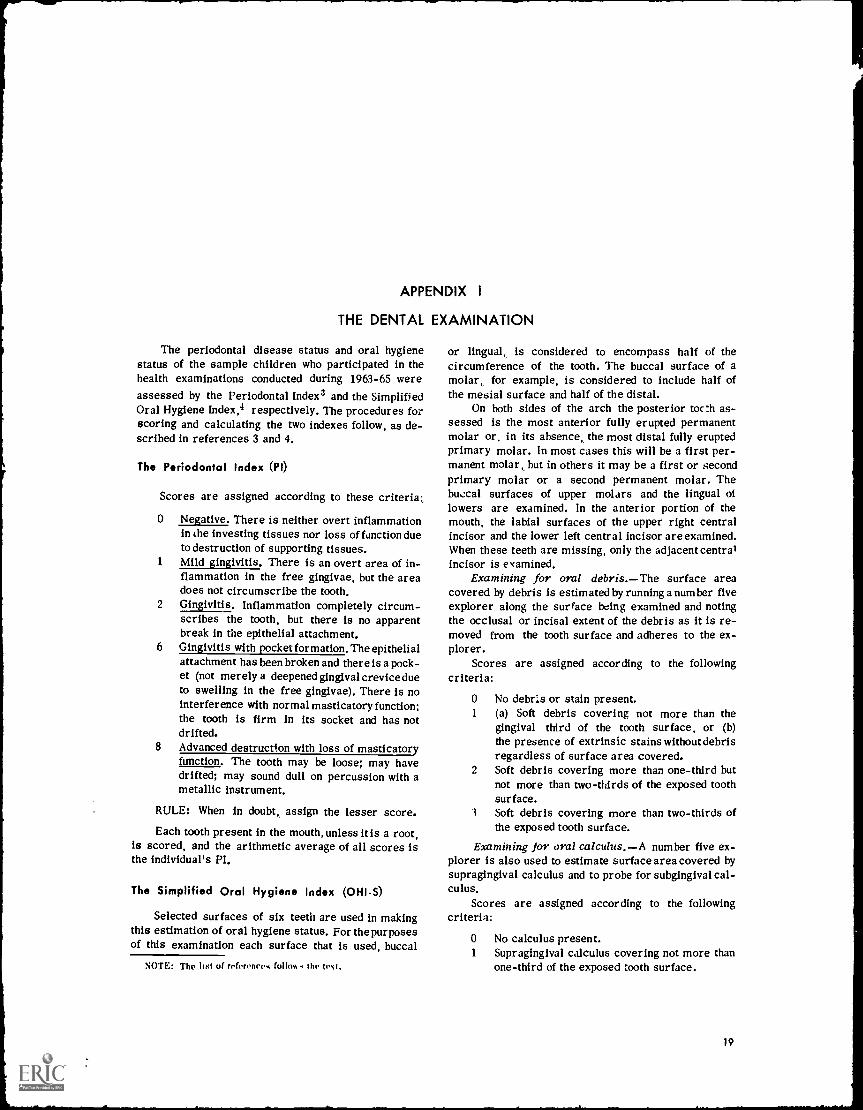
The periodontal disease status and oral hygienestatus of the sample children who participated in thehealth examinations conducted during 1963-65 wereassessed by the Periodontal Index3 and the SimplifiedOral Hygiene Index,4 respectively. The procedures forscoring and calculating the two indexes follow, as de-scribed in references 3 and 4.
The Periodontal Index (p1)
Scores are assigned according to these criteria:,
0 Negative. There is neither overt inflammationin the investing tissues nor loss of function dueto destruction of supporting tissues.
1 Mild gingivitis. There is an overt area of in-flammation in the free gingivae, but the areadoes not circumscribe the tooth.
2 Gingivitis. Inflammation completely circum-scribes the tooth, but there is no apparentbreak in the epithelial attachment.
6 Gingivitis with pocket formation. The epithelialattachment has been broken and there is a pock-et (not merely a deepened gingival crevice dueto swelling in the free gingivae). There is nointerference with normal masticatory function;the tooth is firm in its socket and has notdrifted.
8 Advanced destruction with loss of masticatoryfunction. The tooth may be loose; may havedrifted; may sound dull on percussion with ametallic instrument.
RULE: When in doubt, assign the lesser score.
Each tooth present in the mouth, unless it is a root,is scored, and the arithmetic average of all scores isthe individual's PI.
The Simplified Oral Hygiene Index (OHI-S)
Selected surfaces of six teeth are used in makingthis estimation of oral hygiene status. For the purposesof this examination each surface that is used, buccal
NOTE: The list of references folios. the text:
or lingual, is considered to encompass half of thecircumference of the tooth. The buccal surface of amolar, for example, is considered to include half ofthe mesial surface and half of the distal.
On both sides of the arch the posterior toc:h as-sessed is the most anterior fully erupted permanentmolar or, in its absence, the most distal fully eruptedprimary molar. In most cases this will be a first per-manent molar, but in others it may be a first or secondprimary molar or a second permanent molar. Thebuccal surfaces of upper molars and the lingual oflowers are examined. In the anterior portion of themouth, the labial surfaces of the upper right centralincisor and the lower left central incisor are examined.When these teeth are missing, only the adjacent centralincisor is examined.
Examining for oral debris.The surface areacovered by debris is estimated by running a number fiveexplorer along the surface being examined and notingthe occlusal or incisal extent of the debris as it is re-moved from the tooth surface and adheres to the ex-plorer.
Scores are assigned according to the followingcriteria:
0 No debris or stain present.1 (a) Soft debris covering not more than the
gingival third of the tooth surface, or (b)the presence of extrinsic stains without debrisregardless of surface area covered.
2 Soft debris covering more than one-third butnot more than two-thirds of the exposed toothsurface.
1 Soft debris covering more than two-thirds ofthe exposed tooth surface.
Examining for oral calculus.A number five ex-plorer is also used to estimate surface area covered bysupragingival calculus and to probe for subgingival cal-culus.
Scores are assigned according to the followingcriteria:
0 No calculus present.1 Supragingival calculus covering not more than
one-third of the exposed tooth surface.
19
2 Supragingival calculus covering more than one-third but not more than two-thirds of the ex-posed tooth surface, and/or the presence of in-dividual flecks of subgingival calculus aroundthe cervical portion of the tooth.
3 Supragingival calculus covering more than two-thirds of the exposed tooth surface and/or a.continc us heavy band of subgingival calculusaround the cervical portion of the tooth.
Calculating the index.-The debris scores are to-taled and divided by the number of surfaces scored toobtain the Simplified Debris Index. The Simplified Cal-culus Index is determined similarly. The debris andcalculus scores are then added to give the SimplifiedOral Hygiene Index.
Training of Examiners
Each of the 7,109 sample children who receiveddental examinations during 1963-65 was examined by oneof five dentists. The dentists included two senior ex-aminers, A and B, who trained and supervised the otherexaminers, C, D, and E.
Sample children were not assigned randomly orequally among the various examiners. At most surveylocations children were examined by only one dentist-C, D, or E. At 14 of 40 locations, however, a small sub-sample was examined by either A or B or, as occurredat three locations, by both A and B. Thus, the seniordentists examined relatively few sample children. Thenumber and percent of children examined by each dentistwere as follows:
ExaminerNumber ofsamplechildrenexamined
Percent ofsample
childrenexamined
All examiners- 7,109 100.0A 467 6.6B 394 5.5C 3,200 45.0D 2,188 30.8E 860 12.1
Most examinations completed by the senior dentistsresulted from a planned series of replicate exami-nations. As a rule, the findings of the senior dentistswere included in the sample child's examination record,and the findings of the dentist with whom he was pairedwere kept separate. The primary aim of the replicateexaminations was to correct any examiner divergencefrom the accepted examination procedures.
20
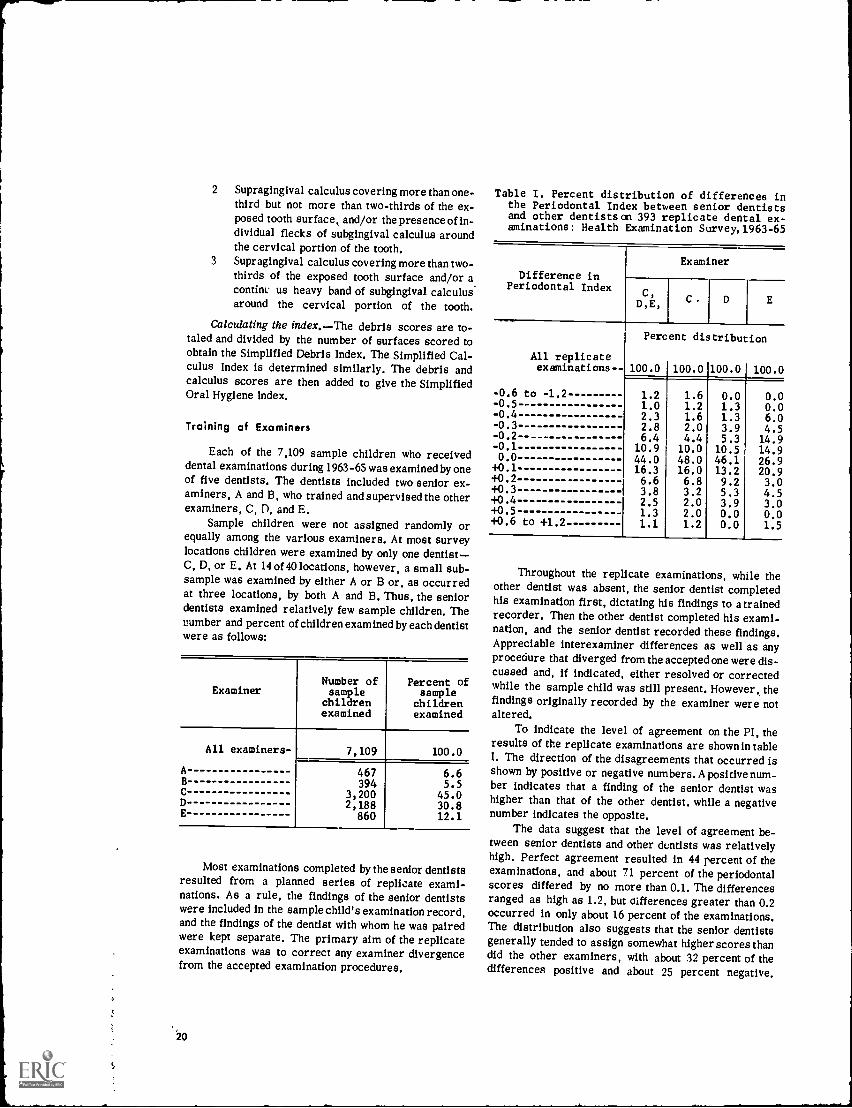
Table I. Percent distribution of differences inthe Periodontal Index between senior dentistsand other dentists on 393 replicate dental ex-aminations: Health Examination Survey, 1963-65
Difference inPeriodontal Index
Examiner
C,D,E, C D E
All replicate
Percent distribution
examinations-- 100.0 100.0 100.0 100.0
-0.6 to -1.2 1.2 1.6 0.0 0.0-0.5 1.0 1.2 1.3 0.0-0.4 2.3 1.6 1.3 6.0-0.3 2.8 2.0 3.9 4.5-0.2 - 6.4 4.4 5.3 14.9-0.1 10.9 10.0 10.5 14.90.0 44.0 48.0 46.1 26.9
+0.1 16.3 16.0 13.2 20.9+0.2 6.6 6.8 9.2 3.0+0.3 3.8 3.2 5.3 4.5+0.4 2.5 2.0 3.9 3.0+0.5 1.3 2.0 0.0 0.0+0.6 to +1.2 1.1 1.2 0.0 1.5
Throughout the replicate examinations, while theother dentist was absent, the senior dentist completedhis examination first, dictating his findings to a trainedrecorder. Then the other dentist completed his exami-nation, and the senior dentist recorded these findings.Appreciable interexaminer differences as well as anyprocedure that diverged from the accepted one were dis-cussed and, if indicated, either resolved or correctedwhile the sample child was still present. However, thefindings originally recorded by the examiner were notaltered.
To indicate the level of agreement on the PI, theresults of the replicate examinations are shown in tableI. The direction of the disagreements that occurred isshown by positive or negative numbers. A positive num-ber indicates that a finding of the senior dentist washigher than that of the other dentist, while a negativenumber indicates the opposite.
The data suggest that the level of agreement be-tween senior dentists and other dentists was relativelyhigh. Perfect agreement resulted in 44 percent of theexaminations, and about 71 percent of the periodontalscores differed by no more than 0.1. The differencesranged as high as 1.2, but differences greater than 0.2occurred in only about 16 percent of the examinations.The distribution also suggests that the senior dentistsgenerally tended to assign somewhat higher scores thandid the other examiners, with about 32 percent of thedifferences positive and about 25 percent negative.
Table I also gives the percent distribution ofdifferences between the PI's assigned by examinersC, D, and E individually and those assigned by thesenior examiners. Examiner E achieved perfect agree-ment less often than did examiners C and D. ExaminersC and D were lower than the senior examiners in about31 percent of the replicates and higher in about 21percent. By contrast, examiner E was lower about 33
percent of the time and higher about 40 percent of thetime.
Results of the replicate oral hygiene findings werealso examined. They are not presented here because theprocedure for determining the OHI-S (drawing an ex-plorer along the surfaces of specified teeth) systemati-cally biases the findings of a replicate examination byremoving at least some of any debris that is present.
-0 0 0---
21
APPENDIX II
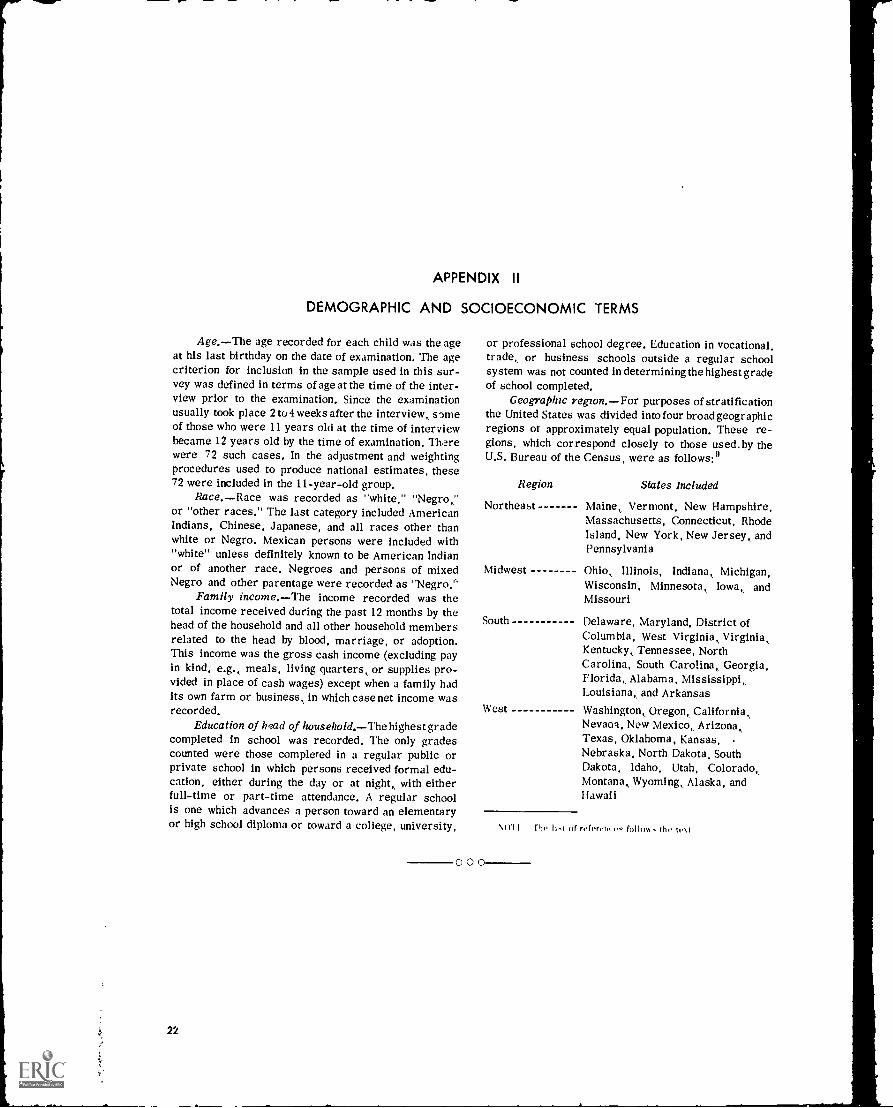
DEMOGRAPHIC AND SOCIOECONOMIC TERMS
Age.The age recorded for each child was the ageat his last birthday on the date of examination. The agecriterion for inclusion in the sample used in this sur-vey was defined in terms of age at the time of the inter-view prior to the examination. Since the examinationusually took place 2 to4 weeks after the interview, someof those who were 11 years old at the time of interviewbecame 12 years old by the time of examination. Therewere 72 such cases. In the adjustment and weightingprocedures used to produce national estimates, these72 were included in the 11-year-old group.
Race.Race was recorded as "white," "Negro,"or "other races." The last category included AmericanIndians, Chinese, Japanese, and all races other thanwhite or Negro. Mexican persons were included with"white" unless definitely known to be American Indianor of another race. Negroes and persons of mixedNegro and other parentage were recorded as "Negro."
Family income.The income recorded was thetotal income received during the past 12 months by thehead of the household and all other household membersrelated to the head by blood, marriage, or adoption.This income was the gross cash income (excluding payin kind, e.g., meals, living quarters, or supplies pro-vided in place of cash wages) except when a family hadits own farm or business,, in which case net income wasrecorded.
Education of head of household.The highest gradecompleted in school was recorded. The only gradescounted were those completed in a regular public orprivate school in which persons received formal edu-cation, either during the day or at night, with eitherfull-time or part-time attendance. A regular schoolis one which advances a person toward an elementaryor high school diploma or toward a college, university,
22
or professional school degree. Education in vocational,trade, or business schools outside a regular schoolsystem was not counted in determining the highest gradeof school completed.
Geographic region, For purposes of stratificationthe United States was divided into four broad geographicregions of approximately equal population. These re-gions, which correspond closely to those used.by theU.S. Bureau of the Census, were as follows:9
Region
Northeast
Midwest
South
West
GOO
States Included
Maine, Vermont, New Hampshire,Massachusetts, Connecticut, RhodeIsland, New York, New Jersey, andPennsylvania
Ohio, Illinois, Indiana, Michigan,Wisconsin, Minnesota, Iowa, andMissouri
Delaware, Maryland, District ofColumbia, West Virginia, Virginia,Kentucky, Tennessee, NorthCarolina, South Carolina, Georgia,Florida Alabama, Mississippi,Louisiana, and Arkansas
Washington, Oregon, California,Nevaoa, New Mexico, Arizona,Texas, Oklahoma, Kansas,Nebraska, North Dakota, SouthDakota, Idaho, Utah, ColoradoMontana, Wyoming, Alaska, andHawaii
n I PIP 11,1 ,f ralr0,11( tp\ (
APPENDIX III
STATISTICAL NOTES
The Survey Design
The sample design for the second cycle of theHealth Examination Survey, similar to the one used forthe first cycle, was that of a multistage, stratifiedprobability sample of loose clusters of persons in land-based segments. Successive elements dealt with in theprocess of sampling were the primary sampling unit(PSU), census enumeration district (ED), segment,household, eligible child (EC), and, finally, the samplechild (SC).
At the first stage the nearly 2,000 PSU's into whichthe United States (including Hawaii and Alaska) hadbeen divided and then grouped into 357 strata for usein the Current Population Survey and the Health Inter-view Survey were further grouped into 40 superstratafor use in Cycle II of the Health Examination Survey.The average size of each Cycle II stratum was 4.5million persons, and tll strata fell between the limitsof 3.5 and 5.5 million. Grouping into 40 strata was donein a way that maximized homogeneity of the PSU's in-cluded in each stratum, particularly with regard to de-gree of urbanization, geographic proximity, and degreeof industrialization. The 40 strata were classified intofour broad geographic regions (each with 10 strata) ofapproximately equal population and cross-classifiedinto four broad population density groups (each having10 strata). Each of the 16 cells contained either two orthree strata. A single stratum might include only onePSU, only part of a PSU (for example, New York City,which represented two strata), or several score PSU'F.
To account for the possible effect that the rate ofpopulation et ange between the 1950 and 1960 censusesmight have had on health, the 10 strata within each geo-graphic region were further classified into four classesranging from those with no increase to those with thegreatest relative increase. Each such class containedeither two or three strata.
One PSU was then selected from each of the 40strata. A controlled selection technique was used inwhich the probability of selection of a particular PSUwas proportional to its 1960 population. In the con-trolled selection an attempt was also made to maxi-mize the spread of the PSU's among the States. While
not every one of the 64 cells in the 4 x 4 x 4 grid con-tributed a PSU to the sample of 40 PSU's, the controlledselection technique ensured the sample's matching themarginal distributions in all three dimensions and beingclosely representative of all cross-classifications.
Generally, within a particular PSU, 20 ED's wereselected with the probability of selection of a particularED proportional to its population in the age group 5-9years in the 1960 censtr which by 1963 roughly ap-proximated the population in the target age group forCycle II. A similar method was used for selecting onesegment (a cluster of households) in each ED. Eachof the resultant 20 segments was either a bounded areaor a cluster of households (or addresses). All childrenin the age range properly resident at the address visitedwere EC's. Operational considerations made it neces-sary to reduce the number of prospective examineesat any one location to a maximum of 200. The EC'sto be excluded for this reason from the SC group weredetermined by systematic subsampling.
The total sample included 7,417 children from 25different States in the age group 6-11 years, with ap-proximately i,000 at each of the single years of age.9
Reliability
Measurement processes employed in the surveywere highly standardized and closely controlled. Ofcourse this does not mean that the correspondence be-tween the real world and the survey results is exact.Data from the survey are imperfect for three majorreasons: (1) results are subject to sampling error, (2)the actual conduct of a survey never agrees perfectlywith the design, and (3) the measurement processesthemselves are inexact even though standardized andcontrolled.
The first report on Cycle II 1 describes in detailthe faithfulness with which the sampling design wascarried out. It noses that of the 7,417 sample children,the 7,119 who were examineda response rate of 96percentgave evidence that they were a highly repre-sentative sample of children of this age in the noninsti-
NOTE. The list of references folloos the text.
23
tutionalized population of the United States. The responselevels for the various demographic subgroupsinclud-ing those for age, sex, race, region, populationdensity,parent's educational level, and family incomeshowedno marked differentials. Hence, it appears unlikelythat nonresponse could bias the findings much in theserespects.
Data recorded for each sample child were inflatedin the estimation process to characterize the largeruniverse of which the sample child was representative.The weights used in this inflation process were a prod-uct of the reciprocal of the probability of selectingthe child, an adjustment for nonresponse cases, and apoststratiffed ratio adjustment which increased preci-sion by bringing survey results into closer alignmentwith known U.S. population figures by race and sex forsingle years of age from 6 through 11.
In the second cycle of the Health Examination Sur-vey the sample was the result of three stages of selec-tionthe single PSU from each stratum, the 20 segmentsfrom each sample PSU, and the sample children fromthe eligible children. The probability of selecting an in-dividual child was the product of the probability ofselection at each stage.
Since the strata were roughly equal in populationsize and a nearly equal number of sample children wereexamined in each of the sample PSU's, the sampledesign was essentially self-weighting with respect to thetarget population; that is, each child 6-11 years oldhad about the same probability of being drawn intothe sample.
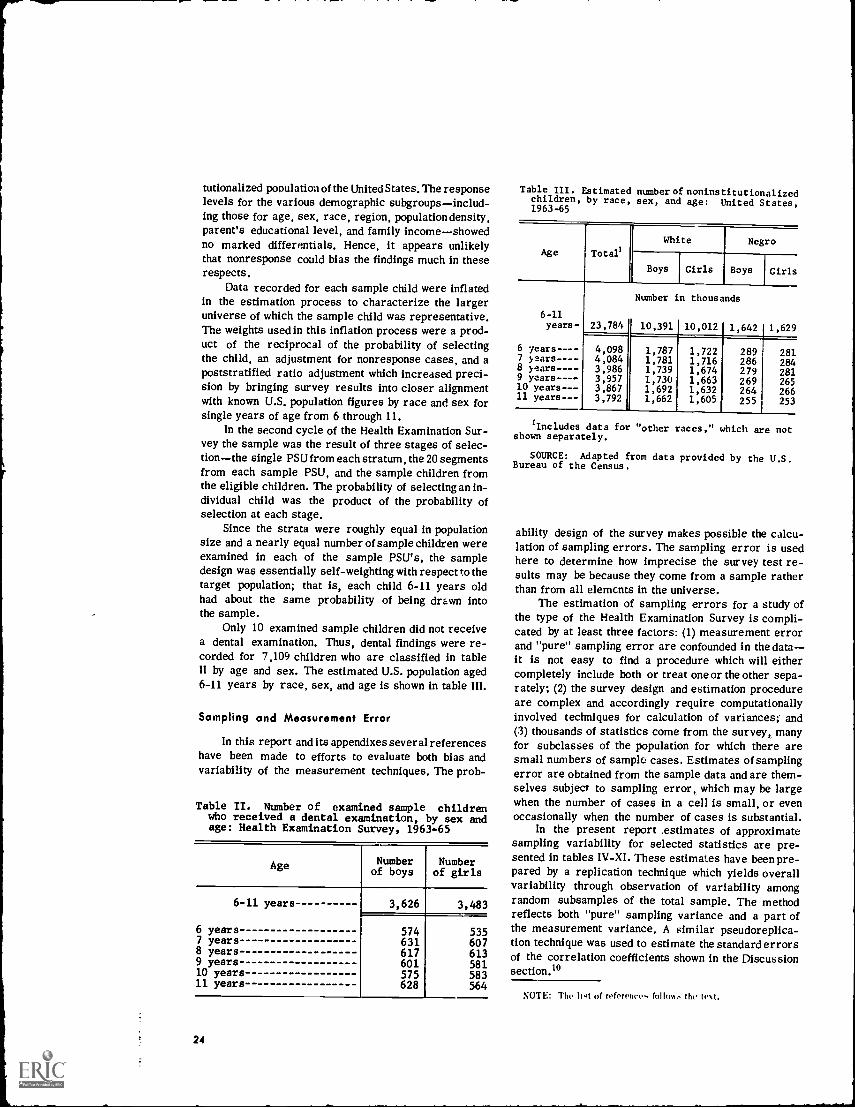
Only 10 examined sample children did not receivea dental examination. Thus, dental findings were re-corded for 7,109 children who are classified in tableII by age and sex. The estimated U.S. population aged6-11 years by race, sex, and age is shown in table III.
Sampling and Measurement Error
In this report and its appendixes several referenceshave been made to efforts to evaluate both bias andvariability of the measurement techniques. The prob-
Table II. Number of examined sample childrenwho received a dental examination, by sex andage: Health Examination Survey, 1963-65
Age Numberof boys
Numberof girls
6-11 years 3,626 3,483
6 years 574 5357 years 631 6078 years 617 6139 years 601 58110 years 575 58311 years 628 564
24
Table III. Estimated number of noninstitutionalizedchildren, by race, sex, and age: United States,1963-65
Age Total
White Negro
Boys Girls Boys Girls
6-11
Number in thousands
years- 23,784 10,391 10,012 1,642 1,629
6 years---- 4,098 1,787 1,722 289 2817 years - - -- 4,084 1,781 1,716 286 2848 years-- 3,986 1,739 1,674 279 2819 years---- 3,957 1,730 1,663 269 26510 years--- 3,867 1,692 1,632 264 26611 years--- 3,792 1,662 1,605 255 253
lIncludes data for "other races," which are notshown separately.
SOURCE: Adapted from data provided by the U.S.Bureau of the Census.
ability design of the survey makes possible the calcu-lation of sampling errors. The sampling error is usedhere to determine how imprecise the survey test re-sults may be because they come from a sample ratherthan from all elements in the universe.
The estimation of sampling errors for a study ofthe type of the Health Examination Survey is compli-cated by at least three factors: (1) measurement errorand "pure" sampling error are confounded in the datait is not easy to find a procedure which will eithercompletely include both or treat one or the other sepa-rately; (2) the survey design and estimation procedureare complex and accordingly require computationallyinvolved techniques for calculation of variances;' and(3) thousands of statistics come from the survey, manyfor subclasses of the population for which there aresmall numbers of sample cases. Estimates of samplingerror are obtained from the sample data and are them-selves subject to sampling error, which may be largewhen the number of cases in a cell is small, or evenoccasionally when the number of cases is substantial.
In the present report .estimates of approximatesampling variability for selected statistics are pre-sented in tables IV-XI. These estimates have been pre-pared by a replication technique which yields overallvariability through observation of variability amongrandom subsamples of the total sample. The methodreflects both "pure" sampling variance and a part ofthe measurement variance. A similar pseudoreplica-tion technique was used to estimate the standard errorsof the correlation coefficients shown in the Discussionsection.°
NOTE: The hit of oferen, follom:. the tt.
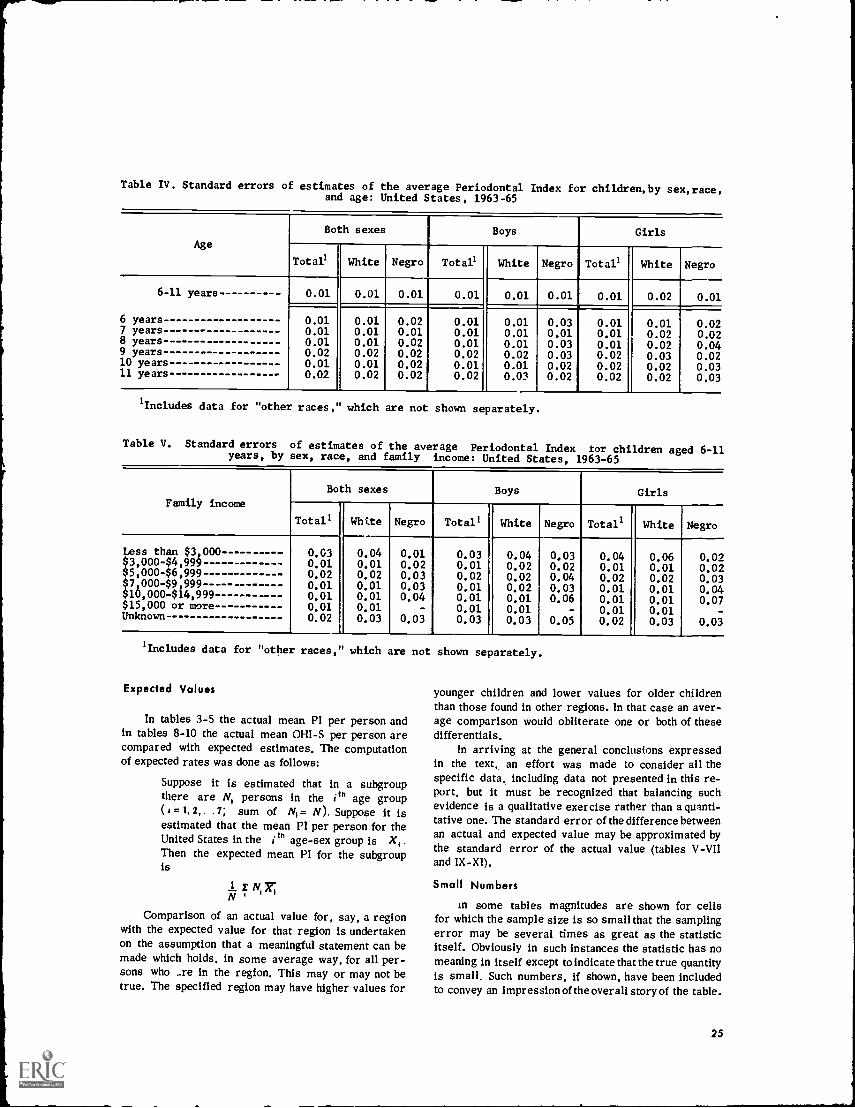
Table IV. Standard errors of estimates of the average Periodontal Index for children,by sex,race,and age: United States, 1963-65
Age
Both sexes Boys Girls
Total' White Negro Total' White Negro Total' White Negro
6-11 years 0.01 0.01 0.01 0.01 0.01 0.01 0.01 0.02 0.01
6 years 0.01 0.01 0.02 0.01 0.01 0.03 0.01 0.01 0.027 years 0.01 0.01 0.01 0.01 0.01 0.01 0.01 0.02 0.028 years 0.01 0.01 0.02 0.01 0.01 0.03 0.01 0.02 0.049 years 0.02 0.02 0.02 0.02 0.02 0.03 0.02 0.03 0.0210 years 0.01 0.01 0.02 0.01 0.01 0.02 0.02 0.02 0.0311 years 0.02 0.02 0.02 0.02 0.03 0.02 0.02 0.02 0.03
'Includes data for "other races, which are not shown separately.
Table V. Standard errors of estimates of the average Periodontal Index for children aged 6-11years, by sex, race, and family income: United States, 1963-65
Family income
Both sexes Boys Girls
Totals White Negro Total' White Negro Total' White Negro
Less than $3,000$3,000-$4,999$5,000-$6,999$7,000-$9,999$10,000414,999$15,000 or moreUnknown
0.630.010.020.010.010.010.02
0.040.010.020.010.010.010.03
0.010.020.030.030.04
-0.03
0.030.010.020.010.010.010.03
0.040.020.020.020.010.010.03
0.030.020.040.030.06
-
0.05
0.040.010.020.010.010.010.02
0.060.010.020.010.010.010.03
0.020.020.030.040.07
-0.03
Includes data for "other races, which are not shown separately.
Expected Values
In tables 3-5 the actual mean PI per person andin tables 8-10 the actual mean OHI-S per person arecompared with expected estimates. The computationof expected rates was done as follows:
Suppose it is estimated that in a subgroupthere are N, persons in the ith age group(a = 1, 2, . .7; sum of NI= N). Suppose it isestimated that the mean PI per person for theUnited States in the i th age-sex group is X,Then the expected mean PI for the subgroupis
E 3-e;N'Comparison of an actual value for, say, a region
with the expected value for that region is undertakenon the assumption that a meaningful statement can bemade which holds, in some average way, for all per-sons who _re in the region. This may or may not betrue. The specified region may have higher values for
younger children and lower values for older childrenthan those found in other regions. In that case an aver-age comparison would obliterate one or both of thesedifferentials.
In arriving at the general conclusions expressedin the text, an effort was made to consider all thespecific data, including data not presented in this re-port, but it must be recognized that balancing suchevidence is a qualitative exercise rather than a quanti-tative one. The standard error of the difference betweenan actual and expected value may be approximated bythe standard error of the actual value (tables V -VIIand IX-XI).
Small Numbers
in some tables magnitudes are shown for cellsfor which the sample size is so small that the samplingerror may be several times as great as the statisticitself. Obviously in such instances the statistic has nomeaning in itself except to indicate that the true quantityis small. Such numbers, if shown, have been includedto convey an impression of the overall story of the table.
25
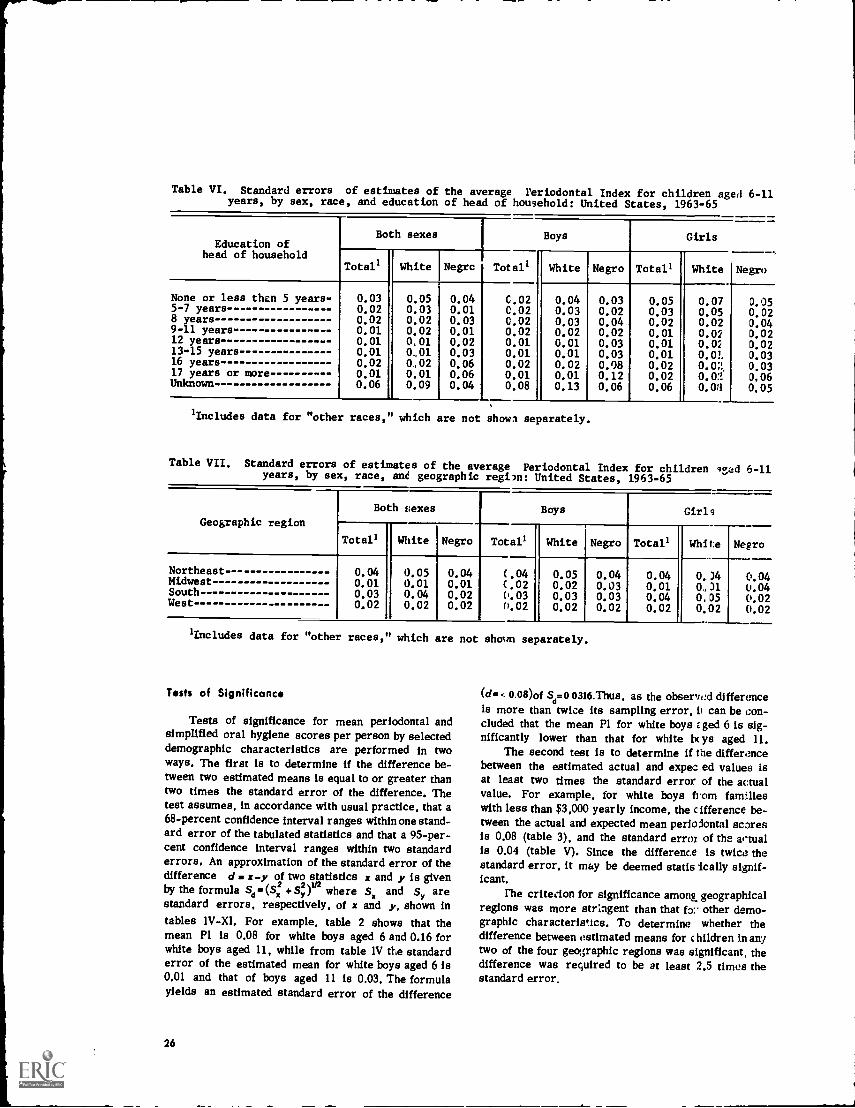
Table VI. Standard errors of estimates of the average Periodontal Index for children aged 6-11years, by sex, race, and education of head of household: United States, 1963-65
Education ofhead of household
Both sexes Boys Girls
Total' White Negrc Total' White Negro Total' White Negro
None or less then 5 years- 0.03 0.05 0.04 C.02 0.04 0.03 0.05 0.07 0.055-7 years- 0.02 0.03 0.01 0.02 0.03 0.02 0.03 0.05 0.028 years 0.02 0.02 0.03 0.02 0.03 0.04 0.02 0.02 0.049-11 years 0.01 0.02 0.01 0.02 0.02 0.02 0.01 0.02 0.0212 years 0.01 0,01 0.02 0.01 0.01 0.03 0.01 0,02 0.0213-15 years 0.01 0,.01 0.03 0.01 0.01 0.03 0.01 0.01 0.0316 years 0.02 0,02 0.06 0.02 0.02 0.08 0.02 0.02, 0,0317 years or more 0.01 0,01 0.06 0.01 0.01 0.12 0.02 0,02 0,06Unknown 0.06 0.09 0.04 0.08 0.13 0.06 0.06 0.03 0,05
lIncludes data for "other races,' which are not shown separately.
Table VII. Standard errors of estimates of the average Periodontal Index for children aged 6-11years, by sex, race, ant geographic region: United States, 1963-65
Geographic region
Both vexes Boys Girls
Total' White Negro Total' White Negro Total' White Negro
Northeast - -- 0.04 0.05 0.04 (.04 0.05 0.04 0.04 0,.)4 0.04Midwest 0.01 0.01 0.01 (.02 0.02 0.03 0.01 0,)1 0.04South 0.03 0.04 0.02 0.03 0.03 0.03 0.04 0,05 0.02West 0.02 0.02 0.02 0.02 0.02 0.02 0.02 0.02 0.02
'Includes data for "other races, which are not shown separately.
Tests of Significance
Tests of significance for mean periodontal andsimplified oral hygiene scores per person by selecteddemographic characteristics are performed in twoways. The first is to determine if the difference be-tween two estimated means is equal to or greater thantwo times the standard error of the difference. Thetest assumes, in accordance with usual practice, that a68-percent confidence interval ranges within one stand-ard error of the tabulated statistics and that a 95-per-cent confidence interval ranges within two standarderrors, An approximation of the standard error of thedifference d x-y of two statistics x and y is given
+sy2by the formula 5,- ) r2 where Sy and Sy arestandard errors, respectively, of x and y, shown intables 1V-XI. For example, table 2 shows that themean PI is 0,08 for white boys aged 6 and 0.16 forwhite boys aged 11, while from table 1V the standarderror of the estimated mean for white boys aged 6 is0,01 and that of boys aged 11 is 0.03, The formulayields an estimated standard error of the difference
26
(d. 0.08)0fd .0 0316.Thus, as the observed difference
is more than twice its sampling error, can be con-cluded that the mean P1 for white boys z ged 6 is sig-nificantly lower than that for white be aged 11.
The second test is to determine if the differencebetween the estimated actual and expec ed values isat least two times the standard error of the actualvalue, For example, for white boys from familieswith less than $3,000 yearly income, the cifference be-tween the actual and expected mean perioiontal scaresis 0,08 (table 3), and the standard error of the artualis 0,04 (table V). Since the difference is twice. thestandard error, it may be deemed statis 'tally signif-icant.
The criterion for significance among, geographicalregions was more stringent than that fa:. other demo-graphic characteristics. To determine whether thedifference between estimated means for c hildren in anytwo of the four geographic regions was significant, thedifference was required to be at least 2.5 times thestandard error.
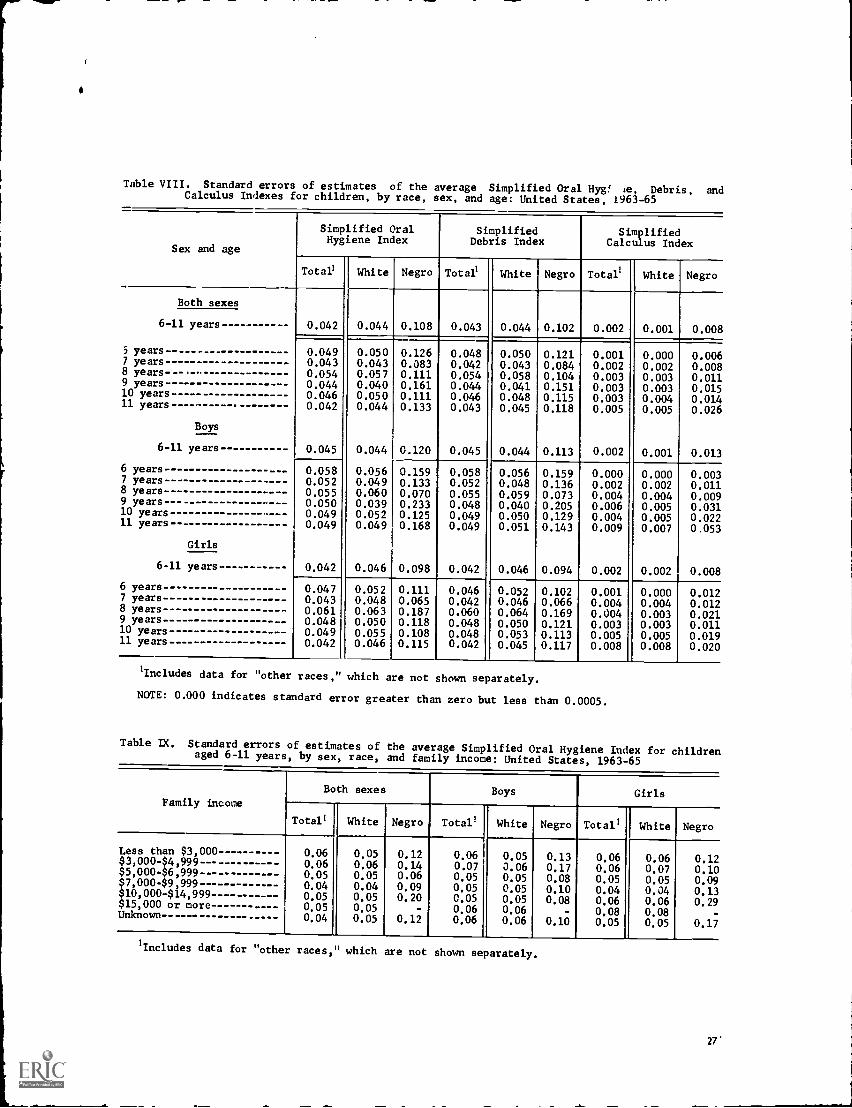
I
r
i
-.10.---.--.11.
Table VIII. Standard errors of estimates of the average Simplified Oral Hyg! le, Debris, andCalculus Indexes for children, by race, sex, and age: United States, 1963-65
Sex and age
Simplified OralHygiene Index
SimplifiedDebris Index
SimplifiedCalculus Index
Total' White Negro Total' White Negro Total' White Negro
Both sexes
6-11 years - 0.042 0.044 0.108 0.043 0.044 0.102 0.002 0.001 0.008-J5 years 0.049 0.050 0.126 0.048 0.050 0.121 0.001 0.000 0.0067 years 0.043 0.043 0.083 0.042 0.043 0.084 0.002 0.002 0.0088 years- 0.054 0.057 0.111 0.054 0.058 0.104 0.003 0.003 0.0119 years -- 0.044 0.040 0.161 0.044 0.041 0.151 0.003 0.003 0.01510 years 0.046 0.050 0.111 0.046 0.048 0.115 0.003 0.004 0.01411 years- 0.042 0.044 0.133 0.043 0.045 0.118 0.005 0.005 0.026
Boys
6-11 years 0.045 0.044 0.120 0.045 0.044 0.113 0.002 0.001 0.013
6 years 0.058 0.056 0.159 0.058 0.056 0.159 0.000 0.000 0.0037 years- 0.052 0.049 0.133 0.052 0.048 0.136 0.002 0.002 0.0118 years 0.055 0.060 0.070 0.055 0.059 0.073 0.004 0.004 0.0099 years 0.050 0.039 0.233 0.048 0.040 0.205 0.006 0.005 0.03110 years 0.049 0.052 0.125 0.049 0.050 0.129 0.004 0.005 0.02211 years- 0.049 0.049 0.168 0.049 0.051 0.143 0.009 0.007 0.053
Girls
6-11 years 0.042 0.046 0.098 0.042 0.046 0.094 0.002 0.002 0.008
6 years 0.047 0.052 0.111 0.046 0.052 0.102 0.001 0.000 0.0127 years 0.043 0.048 0.065 0.042 0.046 0.066 0.004 0.004 0.0128 years 0.061 0.063 0.187 0.060 0.064 0.169 0.004 0.003 0.0219 years -- 0.048 0.050 0.118 0.048 0.050 0.121 0.003 0.003 0.01110 years 0.049 0.055 0.108 0.048 0.053 0.113 0.005 0.005 0.01911 years 0.042 0.046 0.115 0.042 0.045 0.117 0.008 0.008 0.020
'Includes data for "other races,' which are not shown separately.
NOTE: 0.000 indicates standard error greater than zero but less than 0.0005.
Table IX. Standard errors of estimates of the average Simplified Oral Hygiene Index for childrenaged 6-11 years, by sex, race, and family income: United States, 1963-65
Family incomeBoth sexes Boys Girls
Total' White Negro Total' White Negro Total' White Negro
Less than $3,000$3,000- $4,999 - --$5,000-$6,999$7,000-$9,999$10,000-$14,999$15,000 or moreUnknown --
0.060.060.050.040.050.050.04
0.050.060.050.040.050.050.05
0.120.140.060.090.20
-
0.12
0.060.070.050.050.050.060.06
0.050.060.050.050.050.060.06
0.130.170.080.100.08
-
0.10
0.060.060.050.040.060.080.05
0.060.070.050.040.060,080.05
0.120.100.090.130.29
-
0.17
'Includes data for "other races,' which are not shown separately.
27'
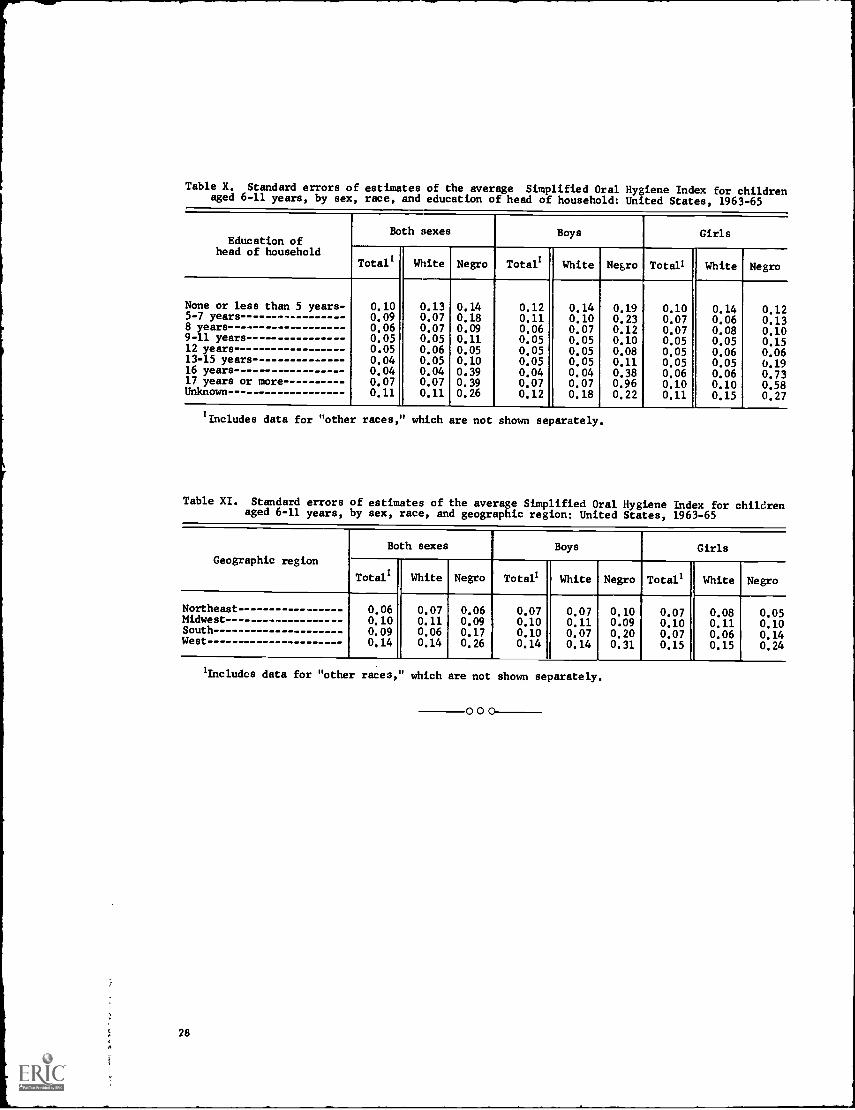
Table X. Standard errors of estimates of the average Simplified Oral Hygiene Index for childrenaged 6-11 years, by sex, race, and education of head of household: United States, 1963-65
Both sexes Boys GirlsEducation of
head of householdi
Totals White Negro Total! White Negro Total' White Negro
T
None or less than 5 years- 0.10 0.13 0.14 0.12 0.14 0.19 0.10 0.14 0.125-7 years 0.09 0.07 0.18 0.11 0.10 0.23 0.07 0.06 0.138 years 0.06 0.07 0.09 0.06 0.07 0.12 0.07 0.08 0.109-11 years 0.05 0.05 0.11 0.05 0.05 0.10 0.05 0.05 0.1512 years 0.05 0.06 0.05 0.05 0.05 0.08 0.05 0.06 0.0613-15 years 0.04 0.05 0.10 0.05 0.05 0.11 0.05 0.05 0.1916 years 0.04 0.04 0.39 0.04 0.04 0.38 0.06 0.06 0.7317 years or more 0.07 0.07 0.39 0.07 0.07 0.96 0.10 0.10 0.58Unknown 0.11 0.11 0.26 0.12 0.18 0.22 0.11 0.15 0.27
'Includes data for "other races,' which are not shown separately.
Table XI. Standard errors of estimates of the average Simplified Oral Hygiene Index for childrenaged 6-11 years, by sex, race, and geographic region: United States, 1963-65
Geographic region
Both sexes Boys Girls
Total! White Negro Totals White Negro Total1 White Negro
Northeast 0.06 0.07 0.06 0.07 0.07 0.10 0.07 0.08 0.05Midwest 0.10 0.11 0.09 0.10 0.11 0.09 0.10 0.11 0.10South 0.09 0.06 0.17 0.10 0.07 0.20 0.07 0.06 0.14West 0.14 0.14 0.26 0.14 0.14 0.31 0.15 0.15 0.24
1lncludcs data for "other races," which are not shown separately.
28
000
VITAL AND HEALTH STATISTICS PUBLICATION SERIES
Formerly Public Health Service Publication No. 1000
Series 1. Programs and collection procedures.Reports which describe the general programs of the NationalCenter for Health Statistics and its offices anddivisions, data collection methods used, definitions,and other material necessary for understanding the data.
oz, .es 2. Data evaluation and methods research.Studies of new statistical methodology including: experi-mental tests of new survey methods, studies of vital statistics collection methods, new analyticaltechniques, objective evaluations of reliability of collected data, contributions to statistical theory.
Series 3. Analytical studies.Reports presenting analytical or interpretive studies basedon vital and healthstatistics, carrying the analysis further than the expository types of reports in the other series.
Series 4. Documents and committee reports.Final reports of major committees concerned with vital andhealth statistics, and documents such as recommended model vital registration laws and revisedbirth and death certificates.
Series 10. Data from tne Health Interview Survey.Statistics on illness, accidental injuries, disability, useof hospital, medical, dental, and other services, and other health-related topics, based on datacollected in a continuing national household interview survey.
Series 11, Data from the Health Examination Survey.Data from direct examination, testing, and measure-ment of national samples of the civilian, noninstitutional population provide the basis for two typesof reports: (1) estimates of the medically defined prevalence of specific diseases in the UnitedStates and-the distributions of the population with respect to physical, physiological, and psycho-logical characteristics; and (2) analysis of relationships among the various measurements withoutreference to an explicit finite universe of persons.
Series 12. Data from the Institutional Population Surveys.Statistics relating to the health characteristics ofpersons in institutions, and their medical, nursing, and personal care received, based on nationalsamples of establishments providing these services and samples of the residents or patients.
Series 13. Data from the Hospital Discharge Survey.Statistics relating to discharged patients in short-stayhospitals, based on a sample of patient records in a national sample of hospitals.
Series 14. Data on health resources: manpower and factlaies.Statistics on the numbers, geographic distri-bution, and characteristics of health resources including physicians,dentists, nurses, other healthoccupations, hospitals, nursing homes, and outpatient facilities.
Series 20. Data on mortality.Various statistics on mortality other than as included in regular annual ormonthly reportsspecial analyses by cause of death, age, and other demographic variables, alsogeographic and time series analyses.
Series 21. Data on natality, marriage, and divorce.Various statistics on natality, marriage, and divorceother than as included in regular annual or monthly reportsspecial analyses by demographicvariables, also geographic and time series analyses, studies of fertility.
Series 22. Data from the National Natality and Mortality Surveys.Statistics on characteristics of birthsand deaths not available from the vital records, based on sample surveys stemming from theserecords, including such topics as mortality by socioeconomic class, hospital experience in thelast year of life, medical care during pregnancy, health insurance coverage, etc.
For a list of titles of reports published in these series, write to; Office of InformationNational Center for Health StatisticsPublic Heaith Service, liSMIIARockville, Md. 20852