ec1ricai method th^ measurement
TRANSCRIPT

H88
An E\ec1ricai Method For Th^ Measurement
Ot Th^ Flow Of Wqt^r

AN ELECTRICAL METHOD FOR THE MEASUREMENTOF THE FLOW OF WATER
BY
KENNETH B. HUMPHREY
THESIS
FOR THE
DEGREE OF BACHELOR OF SCIENCE
IN
ELECTRICAL ENGINEERING
IN
THE COLLEGE OF ENGINEERING
UNIVERSITY OF ILLINOIS
19 16

Digitized by the Internet Archive
in 2013
http://archive.org/details/electricalmethodOOhump

UNIVERSITY OF ILLINOIS
CM
May 30, 1916.
THIS IS TO CERTIFY THAT THE THESIS PREPARED UNDER MY SUPERVISION BY
Kenneth M. Humphrey
ENTITLED An JHectrical Method. ..f.or....th.e...JvIeasurement of the Flow
of Water
IS APPROVED BY ME AS FULFILLING THIS PART OF THE REQUIREMENTS FOR THE
DEGREE OF Baohelor of Science In. Electrical Engineering
Instructor in Charge
HEAD OF DEPARTMENT OF Eleetrical Engineering

TABLE OF CONTENTS
AN ELECTRICAL METHOD FOR THE MEASUREMENT OF THE FLOW OF V/ATER
Page
I Introduction 1
II Experiments Using the Bristol Thermometer o
III Experiments Using the Thermocouple 7
IV Experiments Using the Air Thermometer 13
V Experiments Using the Mercury Thermometer 13
VI Conclusion 33
VII Appendix 35

I
If
An Electrical Method for the Meaaurement of the Flow of Wat'^r
I INTRODUCTION
The ob,1ect of the experiments diacussed in thia theaia ia to
establish a relation between the heat loot by an element and the
velocity of the water in which it is submerged. Such a relation
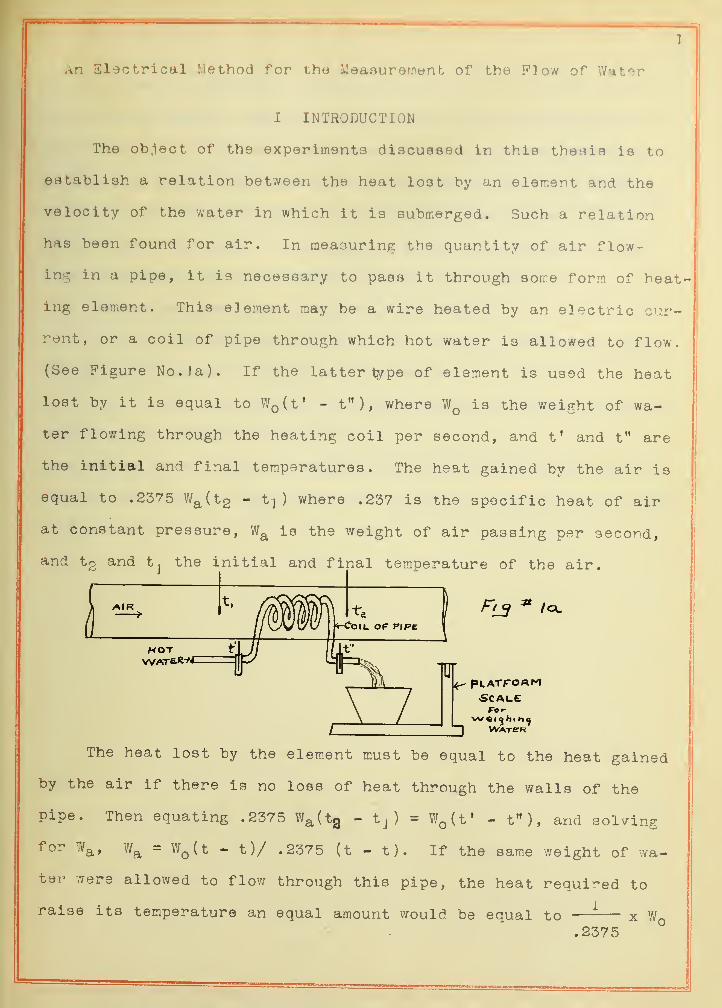
has been found for air. In measuring the quantity of air flow-
ing in a pipe, it is necessary to paaa it through some form of heat-
ing element. Thia e]ement may be a wire heated by an electric cur-
rent, or a coil of pipe through which hot water is allowed to flow.
(See Figure No. la). If the latter type of element is used the heat
lost by it is equal to Wo{t' - t"), where is the weight of wa-
ter flowing through the heating coil per second, and t' and t" are
the initial and final temperatures. The hsat gained by the air is
equal to .2375 W^^Ctg - t) ) where .237 is the specific heat of air
at constant pressure, Wg_ is the weight of air passing per second,
and t2 and t^ the initial and final temperature of the air.
^ pLATro«M'Scale
The heat lost by the element must be equal to the heat gained
by the air if there is no loss of heat through the walls of the
pipe. Then equating .2375 Wa(t3 - tj ) = W^Ct' - t" ) , and solving
for Wa, V/^ = WQ(t - t)/ .2375 (t - t). If the same weight of wa-
ter ;vere allowed to flow through this pipe, the heat required to
raise its temperature an equal amount would be equal to.2375

I
\
I

2
or 4.2 times as much heat. Becaime of the aniount of heat roquired,
this method becomea commercially imponflibla when large quantities of
water are to be rueaaured. It has now been proposed to determine the
velocity of the stream by measuring the heat loyt by the heating
element, and by ignoring the temperature of the stream. Velocity
of the water would then be a function of the heat input to the
element (Watts) and the temperature of the element.
Two methods were used in these experiments:
1 The element was kept at a constant temperature, and
the velocity varied directly with the watts.
2 The watts input was kept constant, and the velocity
varied with the temperature.
Several different types of thermometers were used to measure the
temperature, and the experiments are grouped according to the type
of instrument.

3
II SXPRRIMKNTS USING A BRISTOL THEsRMOMETER
The experiments uaing a Bristol thermometer to measure the
temperature *hd 'hd^ted element were made at the Lewis Institute
in Ghicap,o under the direction of C. W. Humphrey.
The apparatus consisted of a Bristol thermometer with a heat-
ing coil on the bulb, a rheostat, and suitable instruments for
measuring the energy consumed. The heating coil was made of No.'^,0
B&o gage Nichrome wire, insulated from the bulb by a layer of mica.
(See Figure J). To prevent grounds the coil was shellaced. The
heatlnp- coil had a resistance of approximately jOO ohms and was used
on a 1)0 volt D.C. circuit. The heating current was measured by an
ammeter and regulated with a rheostat. (See Fig. 2). The ther-
momtiter was suspended vertically in a channel of known cross section
and the quantity of water measured by a rectangular weir. A constant
temperature of 145 degrees Fahrenheit was maintained in the element
(bulb), but the heating current was varied with different velocities
of the water. The temperature of the water, however, remained at 70
degrees throughout the experiment.
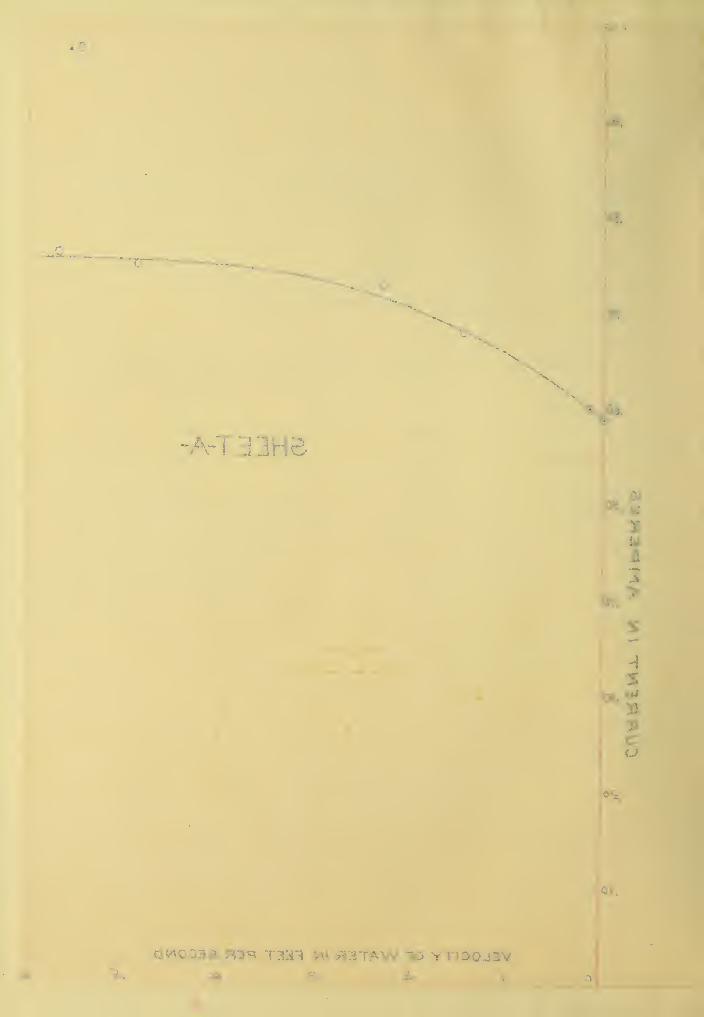
Prom the data (See Table I) it could not be determined whether
this type of instrum.ent was practical or not, as the curve (See
Sheet A) approaches an asymptote at a very low velocity. Possibly
if higher values of temperature were to be used, the curve would
become steep enough to provide accurate readings. The curve, (See
Sheet A), however, shows conclusively that a relation existc between
the heating current and the velocity of the water.


4


T A B L T^: I
Curve on Sheet A.
Temperature cf bulb 145° Fahrenheit
Head Discharge Current Mean Velocityin ft. cu.ft./sec. in Amperes in ft. /sec.
.1979 .C9P3 .76 .568
.1719 .0804 .75 .487
.0938 .0323 .726 .233
.0677 .0199 .683 .150
.00 .59


-J2„
-A-T33He
S
c

Ill EXPERIMENTS USING A THPJRMOGOUPLE
Experiments uoing the thermocouple to measure temperature were
carried on at the hydraulics laboratory of the Univeraity of
Illinois.
The apparatus consisted of a thermocouple, a heating coil, a
galvanometer, a storage battery, a rheostat, and instruments for
measuring the energy. The therm.ocouple consisted of two wires made
of copper and of Constantan respectively and placed in a glass tube
sealed at one end. One junction was placed at the sealed end; the
other about six inches from it. (See Fig. 3). A heating coil made
of round Manganin wire and having a resistance of .642 ohms was
wound cn the outside of the tube near the sealed end. When a cur-
rent from the storage battery was allowed to flow through the heat-
ing coil, an electromotive force was produced in the thermocouple
which was in proportion to the difference in temperature between
the two .junctions. The electromotive force of the thermocouple was
measured by m.eans of a galvanometer (See Pig. 5). No attempt was
CAIV. ^YSJeM
TetEsCOPE
A IVAN OM e TE,
TIT"
made to calibrate the thermocouple accurately, but an approximate
calibration was made by placing one junction in boiling water, the
other remaining at room temperature, and by noting the deflection
of the galvanometer the results showed that three-tenths of a divi-
sion of the scale was equal to one degree centigrade. The apparatus


8
wag suspended vertically in the water in such a manner that bnth
Junctions were submerged. (See Fig. 4). An ammeter and a voltmeter
were connected as shown in the diagram to measure the energy input*
The flow of water was measured by means of a suppressed weir. (See
Appendix).
This type of apparatus could not bo used in commercial work
without considerable refinement. The galvanometer was made chiefly
for bridge work and if accurate results are to be obtained, it must
be used in this way instead of a direct reading instrument. A bet-
ter method than the one employed would also have to be devised to
protect the thermocouple, as a glass tube is not rugged enough for
field work. Two representative curves (See Sheet B) are shown.
The data (see Tables II and III) are a trifle irregular on account
of variations in the galvanometer suspension. Watts input to the
heating coil was plotted against velocity in feet per second, and
the galvanometer (temperature) reading was kept constant at 1.1 scale-
divisions which is equivalent to approximately 2.6 degrees centi-
grade. This value is the temperature difference between the water
and the heating element. The data for these curves (See Sheet B)
were taken under practically the same conditions, except that a flat
heating coil was used in the instrument from which curve 2 was drawn,
These curves show that a small change in the shape of the heating
element will materially affect the results, and that each instrument
would have to be calibrated independently. The same form of curve
was obtained as in the experiments using the Bristol thermometer,
except that in the latter case they do not approach an asymptote at
the same values of velocity. Thus, steepness or lack of an asymp-
tote is a distinct advantage since it makes possible the accurate


9
He(xhn2 Coil
1
' Consfanfan W/re..
~" SaTtery
ermo couple JuYxctlorn
V


measuring of the velocity.
TAB L F, II
Galvanometer reading J . 1
Curve No.
1
Sheet B
Temperature of wator 240c
Amps
,
Volts Kookgage
Watts Velocityin ft/se(
I .98 1 .27 .'742 2.53 .02
2.28 1 .42 .786 3.20 . 06
2.63 1 .73 .838 4.60 . I 1
2.S6 1 .84 .892 5.2J . 162
2.91 1 .85 .937 5.40 .207
3.00 I .89 .977 5.65 .247
3.09 J .92 1.012 5.90 .285
3.17 I .98 . 1077 6.20 .352
3.25 2.00 1 . 104 6.51 .380
3.35 2.05 1 . 139 6.85 .420
3.37 2.07 1 . 165 6.95 .450
3.39 2.08 ! . 196 7.00 .485
3.39 2.09 1 .22) 7.02 .515
3.40 2.09 J . 244 7.09 .540
3.40 2.09 1 .268 7.05 .565
3.49 2.15 1 .285 7 .40 .585
3.5J 2.20 1 .306 7.60 .610
3.41 2.10 1 .228 7. 10 .520
3.20 1 .97 1 . 103 6.21 , .380
2.15 1 .93 1 .01 6.0 .280
2.93 ! .81 .9 19 5.39 . 190


1 1
T A B L E III
Curve No. 2 Sheet B
Galvanometer reading 1
.
1
Temperature of water 24° C
Ampsrea Vv'atta HookGage
Velocityin ft/sec.
205 2.62 .773 .0486
235 3.40 .827 . 104
2.55 4.00 .868 . 140
2.70 4.45 .9 15 . 185
2.84 4. PC .964 .232
2.85 4.92 1 .01 1 .280
2.96 5.35 ) .052 .324
3.01 5.5 1 .039 .363
3.12 5.87 1 . 17 1 .458
3.15 6.00 1 .217 .510
3.20 6.20 1 .251 .547
3.26 6.45 ) .235 .590
3.35 6.75 1 .326 .636
3.46 6.80 1 .337 .650
3.38 6.90 1 .369 .683

I

1

3\0
u
iX
-i
C
S
v
a
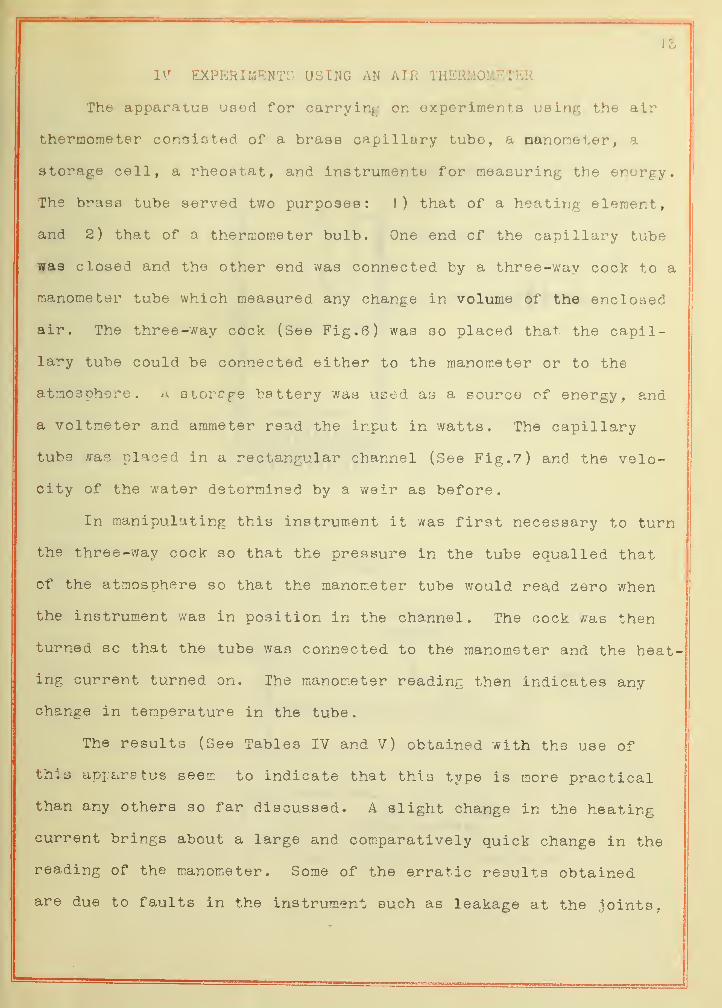
IV EXPERIUENTC USING AN AIR THERMOMETER
The apparatus used for carrying; on experiments using the air
thermometer consioted of a brass capillary tube, a manometer, a
storage cell, a rheostat, and instruments for measuring the energy.
The brass tube served two purposes: )) that of a heating element,
and 2) that of a thermometer bulb. One end of the capillary tube
was closed and the other end was connected by a three-way cock to a
manometer tube which measured any change in volume of the enclosed
air. The three-way cock (See Fig. 6) was so placed that the capil-
lary tube could be connected either to the manometer or to the
atmosphere, storcge battery was used as a source of energy, and
a voltmeter and ammeter read the input in watts. The capillary
tube was placed in a rectangular channel (See Fig. 7) and the velo-
city of the water determined by a weir as before.
In manipulating this instrum.ent it was first necessary to turn
the three-way cock so that the pressure in the tube equalled that
of the atmosphere so that the manometer tube would read zero when
the instrument was in position in the channel. The cock was then
turned so that the tube was connected to the manometer and the heat-
ing current turned on. The manometer reading then indicates any
change in temperature in the tube.
The results (See Tables IV and V) obtained with the use of
this apparatus seem to indicate that this type is more practical
than any others so far discussed. A slight change in the heating
current brings about a large and comparatively quick change in the
reading of the manometer. Some of the erratic results obtained
are due to faults in the instrument such as leakage at the joints,


14
-T^irce-vvAY CocK
«/e>£ vrflV OA- TUBE
If
\ /
^'7
/Rheostat
J_ 6 Vo/-f-
— StorageSaner/
W>^TeR CHANNEL.
Weir

I

15
but these imperfec tlona coulci very easily be corrected. An objec-
tion might be raised to the excesaive amount of energy required,
but thla al3o could be reduced if the tube were to be made of some
high resistance material such as Nichrome or Llanganin.
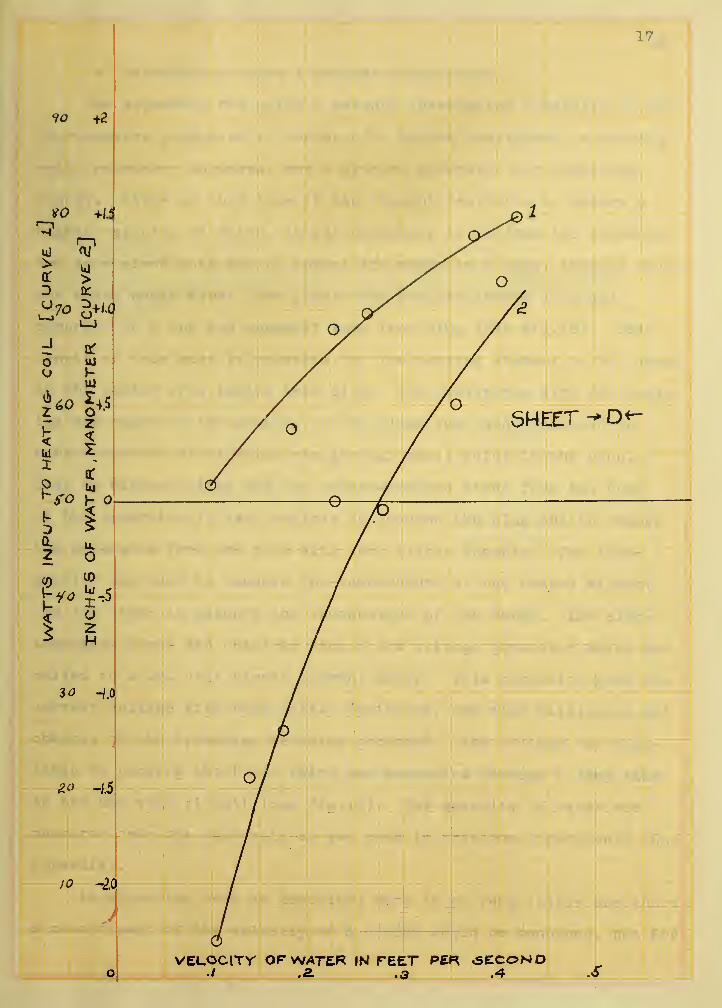
In one set of experiments the manometer readingwas kept con-
stant, which in equivalent to keeping the temperature of the ele-
ment constant, and the energy input was varied with the differentwas
velocities. Watts input, plot te-d against the velocity of the water
ir feet per second. (See Sheet D Curve I). This curve is fairly
steep and shows for ordinary velocities no tendency to approach an
asymptote
.
Another experiment was made in which the energy input was kept
constant and the manometer readine taken with the various values
of velocity. This method, while probably not as accurate as the
other because of introducing more variables when both volume and
pressure in the tube are changed, shows that with a little more re-
finement a very accurate instrument could be obtained.. The curve
(See Sheet D, curve 2) is plotted between the manometer readings
in inches of water and the velocity of the stream in feet per sec-
ond. Both plus (+) and minus (-) readings* are recorded as the
m.anometer was found to read in this way. It would be preferable
to have all positive readings as there would be less liability of
error. The horizontal line on the curve sheet indicates the pres-
sure of the air and is taken as a reference line.
(+) pressure above atmosphere; (-) pressure below atmosphere.

1

J6
T A B IV
Curve No. 1 , Sheet D
Tetnpe rature of water 24.80C
Manometwr reading 6.05 inches of water
No
.
Ampere Volts Hook gage Vi/atts
in ft/sec.
I 35.5 2.08 1 .204 73.7 .505
<~> 37.0 2.15 1 . 1 38 79 .5
3 36.0 2.14 1 .096 77.0
4 34.0 2.04 .994 69.4
5 31.0 1 .85 .9)7 R7 4-
29 .
5
1 .75 .828 5! .-^. ICO
T A B L E V
Curve II0.2, Sheet D
Temperature of water 27.40C
Watts 62
No
.
Manometer Hook Gage Pressure V t/ X O G X iiYRight Left inches of water. in ft/sec.
J 5.40 2.60 .828 -2.8 .107
2 4.P5 3.00 .873 -1 .95 . 142
3 4.85 3.15 .909 -) .70 . 178
4 4.25 3.75 .959 -.50 .230
5 4.25 3.70 f .004 -.55 .272
6 4.00 4.00 ! .079 0.00 .358
7 3.70 4.35 J . 125 + .465 .405
8 3.90 4. 10 1 . 074 + .35 .10

17

\\
\
s—
»
< ^an c
lu OH 'v.
lu
2
< cIt
s
rs»^o33i€, naq T33T hi ?iaTAW^o vTjoojav

J8
V EXPERIMENTS USING A MERCURY THERUOr.ETER
The apparatus for using a mercury thermometer consisted of two
thermoneters graduated to tenths of a degree centigrade, a heating
coil, necessary adjuncts, and a special generator for supplying
energy. Since at this time it was thought desirable to secure a
higher velocity of water, it was necessary to enclose the thermome-
ter in a glass tube and to insert the whole in a pipe, through which
the water would flow. The glass tube was six inches long and
cemented in a one and one-half inch iron plug (See Fig.J5). This
length of tube made it possible for che heating element to be placed
in the center of a twelve inch pipe. The resistance wire for heat-
ing was wound on the outside of the glass tube and connected to
rubber-covered wires which ran through small holes in the plug.
Then by disconnecting the two rubber-covered wires from the rest
of the apparatus ^it was possible to unscrew the plug and to remove
the apparatus from the pipe with very little trouble. One ther-
mometer was used to measure the tem.perature of the heated element
and the other to measure the temperature of the water. The elec-
tromotive force was obtained from a low voltage ganoratcr which was
belted to a 220 volt direct current motor. This generator gave the
correct voltage with very little variation, and also eliminated all
chances of the apparatus becoming grounded. The voltage was regu-
lated by varying the field which was connected through a lamp bank
to the 220 volt circuit (See Fig. J 5). The quantity of water was
measured over the same weir as was used in previous experiments (See
Appendix )
.
An apparatus such as described here is of very little use where
a measurement of the velocity of a stream would be required, but for

10
r
Co I I
azo o.c.
amall D.e 6 Ko/^Qenerafor driven
by SeoV. Afotor;
A-Therir\ory\eter
Col (

20
meawuring the velocity in pipes it would probably prove very satis-
factory. A large number of experiments were made, however, to dis-
cover what the effect would be of varying different factors, and as
all of these instruments use the same principle, they can be comparsc
with very little trouble. This set-up made it possible to obtain
velocities an hip;h as four feet per second or 2.73 miles per hour,
which is comparable with stream velocities.
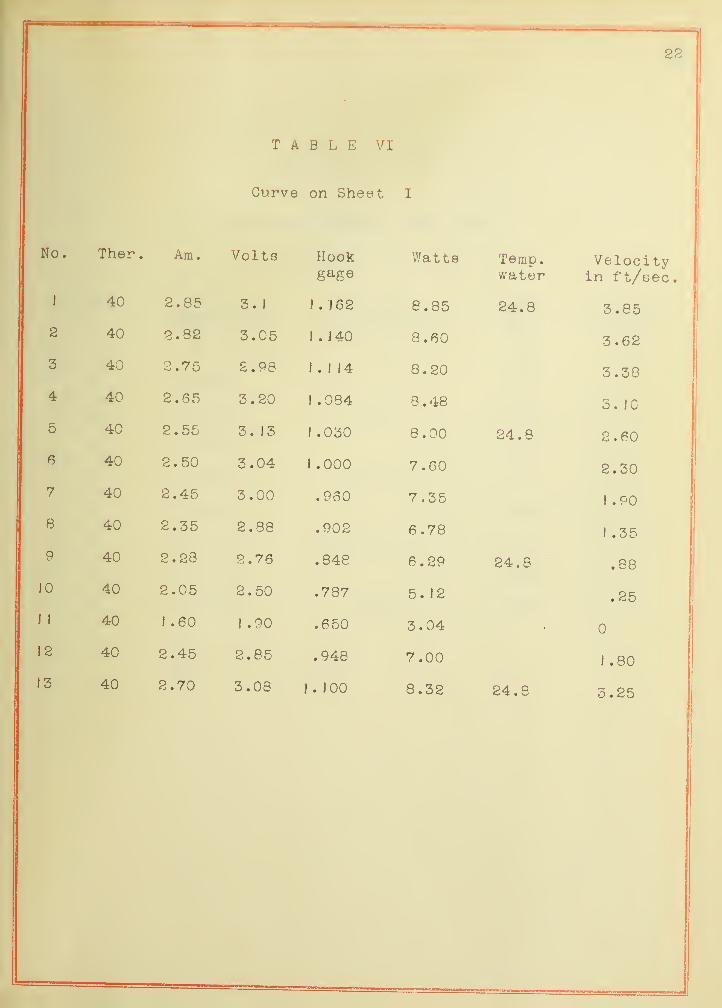
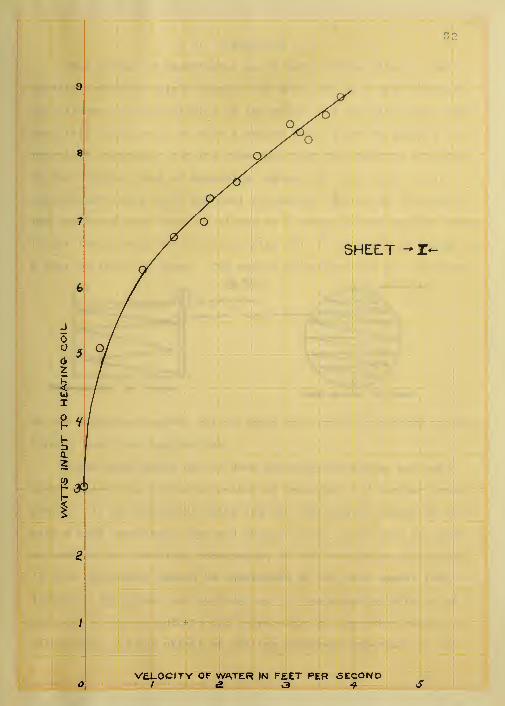
In the first experiment, the thermometer in the glass tube was
kept constant at 40 degrees Centigrade; the water temperature was
24.3 degrees Centierade. With a variation in velocity from zero to
3.85 feet per second, the energy input in watts varied from 3.04 to
3.85. This curve (See data in Table VI, Curve on Sheet I) is of
the same general form as obtained in previous experiments. Trouble
was experienced in keeping the temperature at a constant value on
account of the natural lag of the thermometer. The temperature
would invariably read too low when the velocity was being increased
and too high when decreased. To overcome this trouble in later ex-
periments the energy supplied was kept constant and the temperature
was allowed to vary.
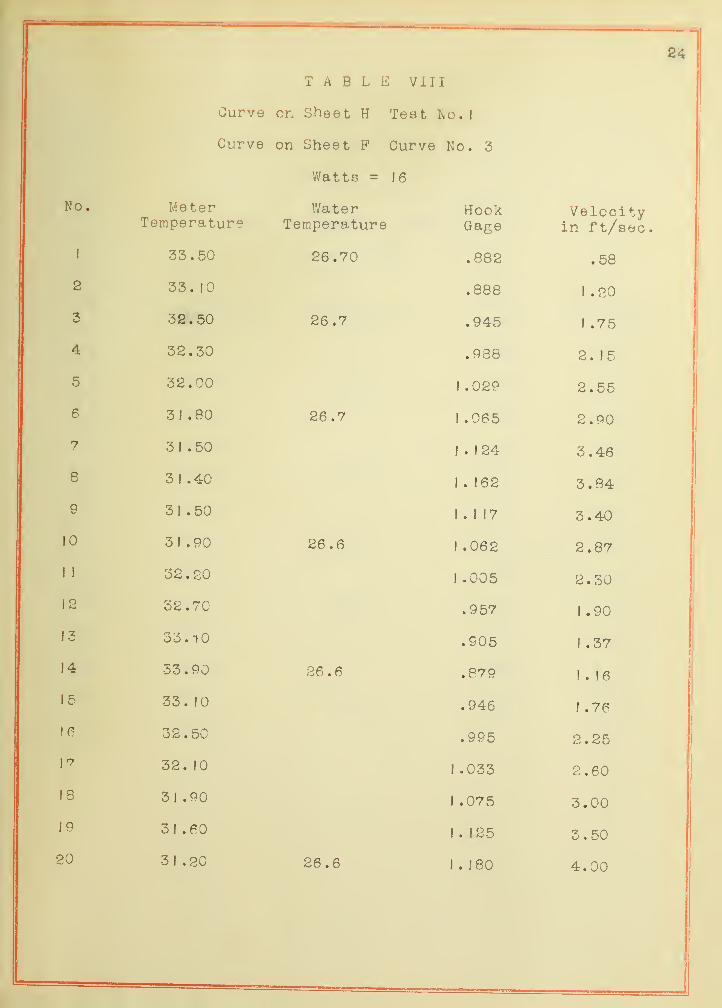
Two sets of data (See Table VII and VIII) are plotted together
(See Sheet H)with tem-perature as ordinates and the velocity of the
water as abscissa. This curve is plotted to show that if an instru-
ment were properly calibrated it could be depended upon to give the
same results every time it was used.
The curves (See Sheet F) were obtained by using different val-
ues of heating currents. The data (See Tables VIII, IX and X), are
in all cases good, the curve 2 is probably more accurate as the
conditions were m.ore favorable. No law, however, can be evolved


21
from the meager data obtained, between the different values of
watts input, the temperature and the velocity of water; but it is
plainly shown that there must be some relation. Pouoibly every
instrument would have to be calibrated separately for each value of
watts input. All of the curves (See Sheet F) show the same general
trend but do not exactly agree in slope.
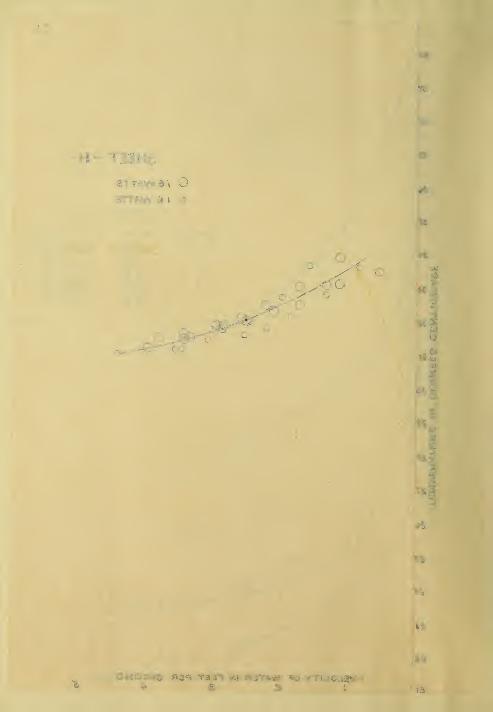
Four curves (See Sheet G, Tables XI, XII, XIII and XIV) were
plotted to show the effect of a heat insulating material placed on
the outside of the heating coil. When the experiments were per-
formed, no reason was apparent why the curves numbered 1 and 2
should be so high; but later, on removing the glass tube from the
pipe, it was found that it had becom.e covered with a thin layer of
fungus, which acted as a blanket to keep the heat in. Though the
curves were not changed materially in shape, they were much steeper
as may be observed, in comparison with the others. This steepness
of the curves is a material advantage; and it might be found that
in the final type of instrument some material could be found which
would bring about the same results as the fungus covering. Further
experiments were contemplated to fix this property, but net enough
time was found to do it.

1
22
TABLE VI
Curve on Sheet I
No. Ther
.
Am. Volts Hookgage
Watts Temp,water
Velocityin ft/sec.
1
1 40 2.85 3. 1 J . 162 8.85 24.8 3.85
2 40 ^.82 3.05 I . J40 8.60 3 .62
3 40 2.75 2.98 1.114 8.20 3.38
4 40 2.65 3.20 1 .084 8.48 3. 10
5 40 2.55 3.13 1 .030 8.00 24.8 2.60
6 40 2.50 3.04 1 .000 7.60 2.30
7 40 2.45 3.00 .960 7.351 .90
8 40 2.35 2.88 .902 6.781 .35
9 40 2.28 2.76 .848 6.29 24.8 .88
10 40 2.05 2.50 .787 5.12 .25
I 1 40 1 .60 I .90 .650 3.04
12 40 2.45 2.85 .948 7.001 .80
13 40 2.70 3.08 1 . JOO 8.32 24.8 3.25

TABLE VII
Curve on Sheet H Test No.
2
Watts = 16
MeterTemperature
WaterTemperature
HookCrfh CP
Veloc"i y -P + /ili i u /
33.65 26.7 .851 .88
32.80 .902 1 .36
32. 15 26.7 .958 1 .89
3 1 .80 .998 2.25
31 .60 26.7 1 .030 2.58
3 1 .451 .087 3. 12
3 1 . 1 G 26.7 1 . 140 3.62
31 .00J .226 4.45
31.15 26.7 1 .125 3.50

24
TABLE VIII
Curve on Sheet H Test 1^0. 1
Curve on Sheet F
Watts =
Curve
1 6
Ko . 3
No. Meter WaterTemperature
HookGage
Velocityin ft/sec.
1 33 . 50 26 .70 .882 .58
o 33.10 .888 i .20
O 32. 50 26 .7 .945 ! .75
O/d . 30 .988 2.15
0(S . 'JU1 .029 2.55
o 6 I . oU 26 .7 J .065 2.90
"2 1 K/^O 1 . oU! . 124 3.46
po o I . <tU1 . 162 3.84
Q O I . OU 1.117 3.40
O 1 . 9U 26 .
6
1 .062 2.87
t 1 0£i . 201 .005 2.30
(ic . (' .957 ) .90
I o OO . 1 (J .905 i .37
26 .6 .879! . 16
15 33. 10 .946
.995
1 .76
2.25
1'7
i' O 1 Ao-s . 1 U
1 .033 2.60
1 o o I . VJU1 .075 3.00
J -7 o J . r J1 . 125 3.50
20 31 .20 26.61 . 180 4.00

^ ; _
25
TABLE IX
Curve on Sheet F Test
Watts = 7.47
No. !
No. Meteri smperaT/urs
WaterTemperature
HookGage
Velocityin ft/aec.
11 25. 1 .963 ] .95
ii <co , 40 24.95 1 .009 2.30
O <;o . J1 .050 2.75
A or* c r»] . 1 14 3.35
O C, 1 ,7 24. 95 1 . 141 3.63
D on a1 . 1 9 1 4. 10
>i7 .
5
25.0 1.216 4.36
Q1 . 1 39 3.62
Q-c ^ . 25.0 1 . 100 3.25
1 n 1-iO . 11 .033 2.62
1 1J J
Q ^-od . .960
I .90
1 c<i9 .
5
25.0 .858 .95
13 42.5


T A D T U" Vi A D L) Tj a 26
Curve on Sheet FWatta = 10.07
Test No.
2
No. Meter Waterxwiii^.wi ctT^ui 1 empera t.ur6
HookGage
Velocityin ft/aec.
1 <5U.3J 26 . «i0 .959I .9
2 "^n in .997 2.27
3 0<J . uu •
I . 027 2.57
^-y • ' U <;6 • 30 1 .080 3.05
5I . 1 28 3.52
'-"^'OO -CD . 30 1 . 106 3.32
7I .085 3. 10
8 -y»-t' 26.30 1 .070 2.95
91 .050 2.75
1 PQ OR 'zn1 .024 2.50
1 1 OvJ . 1 u1 .000 2.30
1 2• ' 26 . 30 .985 2. i5
1 3 26.30 .9641 .95
1
4
.9391 .70
1 5 .9301 .63
1 6 .9 101 .42
1 7 .898 1 .30
I 3 'J 1 • 1 ^-^ 26 . 30 .88 ) 1.15
! 9 .863 .98
20 .856 .92
2 1' • c^*-' 26 . 30 .836 .75
22 .826 .68
23 .812 .50
24 '^P no o<^ 1 t-o<; , b J 26 . 1 5 .795 .31
25 33. JO .774 . 10

I
I

I'eterTemperature
4S.2
44.5
42.7
41 .9
4C.9
TABLE XI
Curve on Sheet G Teat lio.2
V;atts = 7.47
WaterTemperature
27.4
27.4
27.4
HookGage
.763
.823
.889
.927
.995
J .045
Veloci tyin ft/sec
.6
I .23
I .70
2.25
2.72
TABLE XII
Curve on Sheet G Test No
MeterTemperature
47.9
48. I
49.6
51 .5
52.2
53.6
55. I
67.0
WaterTemperature
27.4
27.4
27.4
HookGage
I .045
I .020
.988
. 944
.9J5
.884
.888
27.4
Velocityin ft /sec
.
2.72
2.48
2.16
I .75
I .48
I . IS
.55

28
TABLE XIII
Curve on Gheet G Test No.
3
WattB = 15.9
No. MeterTemperature
Vmter HookTemperature Gage
Velocityin ft/sec.
1 '^A 8 25.0 .848 .82
2 35.2 .848 .82
32.7 .946 I .80
4. 3 1.8 25.0 1.025 2.53
3 1.4 1 .078 3.08
3 ] . I] . 1 52 3.75
7 30.3 1 . !94 4. 14
p 30 .
5
25.0 1.247 4.65
Q 30 .4 1 .270 4.88
10
1
1
39.0
51.2
.832
TABLE XIV
.68
Curve on Sheet G Test No.
4
Watts =7.47
170. MeterTemperature
IVater HookTemperature Gage
Velocityin ft /sec.
! 27.42 22.75 1.077 3.85
28 . 1 5 1.054 3.56
3 28.67 .975 2.6!
4 29.72 .9 17 1 .91
5 31 .50 .859 1 .20
6 34.05 .799 .46
7
————
—
45.40
. I

29
¥9
V/
US
O<QC
hZhi
a
S7
ui
1
2C3
SHEET
vvatts input
7.4 6
10.07
16.00
WATER -retAP.
25" C
2 G.60*C
VCLOCiTV OF WATER IN FBET PER^^tCONOI 2. 3 4 *

^3 -. - ^-
VO.O I
oca I
6..,5
C .
>1
:5
SI 2
IS
4S

5H££:T -•G.-
WAT r«s
10307.47
15.30
7.47
IBM p. WATra
5 7.4
as.rc
.3^
^6VELOCITY OF WATER IN FEET PER 3ECOND
/ la 3 4

/!
X' ^
Kir.

^ 5HEET
O /6W/HTTS
O I 6 WATTS
3*


33
VI CONCLUSION
Thir. aeries of experimento woulfi aeem to ahow clearly that a
defirite relation existn between the heat lost by a body IrnnerBea
in a st^e^^.TT^. find the velocity of the vvator. Tt hay also beer shown
that this relation is of nuch a nature that it can be applied to a
practical instrument for the measurement of the velocity of water.
Of the various forms of apparatus tested, the one using the air
thermometer seems to be the most promising. With this instrument
the capillary tube could be placed in a flume and one reading taken
to get the average velocity (See Fig. 25), or it could be placed in
a pipe in the fcrm shown. The amount of energy used •.vat- ""oessive
in the apparatus tested, but no doubt this could be reduced to con-
form, to practical application.
These experiments do not seem, entirely conclusive and one
might suggest the following method of procedure for further investi-
gation: I ) An instrument using the air therm.om.e ter should be built
with a high resistance tube and made in such a form that it could
be used in the practical measurement of the velocities of a river.
2) This instrument should be- calibrated in the same manner that
standard flow meters are calibrated. 3) The relative effects of
humidity of the atmosphere and temperature of the water should be
determined. 4) The effect of placing different miaterials on the
t
i.
I

r33Ho
^ iAi R3~/\W "^O VTSOOJ3V

34
outside of the capillary tube ahoulri be noted, and (5) the equation
of the curve t^hould be aonurately deterrined.

35
VII APPENDJX
The quantity of water flowing was in every case measurerl by
r.eana of a suppressed weir. The head of water on the weir was rceas-
ured by ireans of a hook gage shielded from the direct action of the
flow. The formula used for calculating the quantity of water was
Q=3.33xbxh, where Q is the quantity of water flowing in oubto
feet per second, b is the width of the weir in feet, and h is the
head in feet. The velocity was calculated from the formula V = Q/A
where V is the velocity in feet per L^econd, and A is the area of
cross section of the stream in square feet. In experiments listed
under Parts III anrl IV, A is the area of the weir channel and in
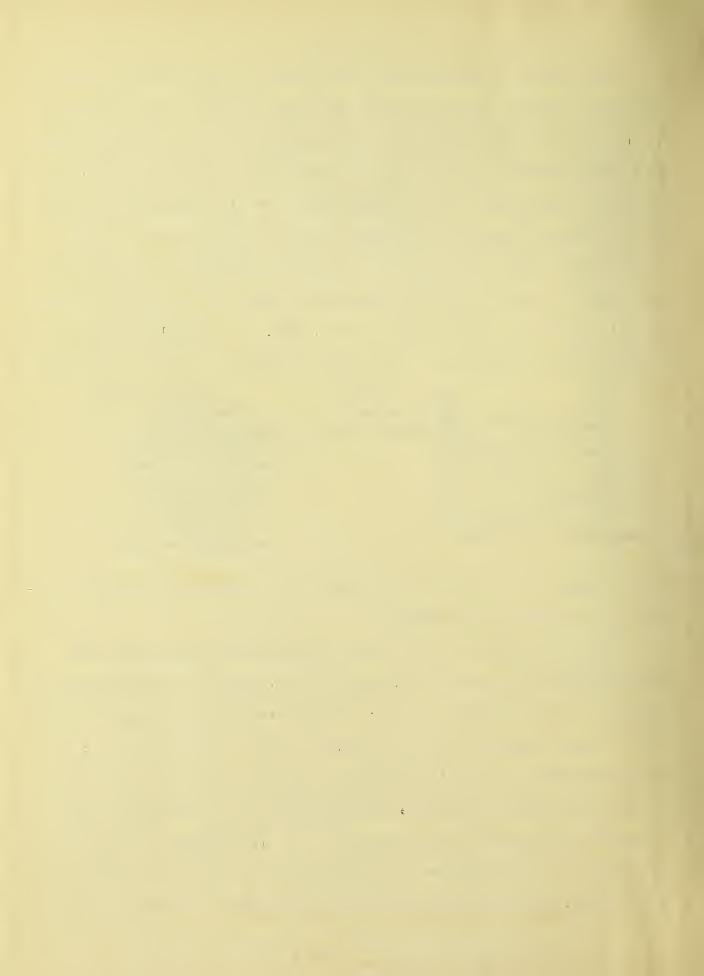
Part V, A is the area of the twelve inch pipe. Two curves were
plotted (See Sheet which gave the velocity of the water directly
fromi the different values of hook gage readings. Curve I gives the
values of velocity in the channel and Curve 2 the velocity in the
pipe.


UNIVERSITY OF ILLINOIS-URBANA
3 0112 086860258
«