energy 2018 pv module reliability scorecard · ser smrter greener energy 2018 pv module reliability...
TRANSCRIPT
SAFER, SMARTER, GREENER
ENERGY
2018 PV MODULE RELIABILITY SCORECARDDefining Quality. Guiding Industry.

ff
Authors:
Tara DoyleHead of Business Development and Project [email protected]
Contributors:Ken Sauer, Senior PV Engineer, [email protected] Gushansky, Project Manager, [email protected] Jones, Business Line Director - Renewables Advisory North America, [email protected] Moore, Head of Solar Technology, [email protected] Raymond Hudson, Senior Principal Consultant, [email protected]
Tristan Erion-Lorico Head of PV Module [email protected]
Ryan DesharnaisHead of [email protected]
INTRODUCTION __________________________________________________________________
SOLAR TIMELINE ____________________________________________________________
PV MODULE AGING MECHANISMS _________________________________________________
PV MODULE RELIABILITY & TESTING ________________________________________________
THE PV MODULE PRODUCT QUALIFICATION PROGRAM _________________________________
THE RESULTS _____________________________________________________________________
CASE STUDY: PID PERFORMANCE __________________________________________________ CASE STUDY: PAN & IAM PERFORMANCE ___________________________________________
INTERPRETING THE RESULTS _______________________________________________________
FACTORY LOCATIONS _____________________________________________________________
THE HISTORICAL SCORECARD _____________________________________________________
DNV GL BEST PRACTICES __________________________________________________________
CONCLUSION ____________________________________________________________________
CONTENTS
Thermal Cycling Overview & Results.................................................................................................................Damp Heat Overview & Results.........................................................................................................................
Mechanical Load + Thermal Cycling + Humidity Freeze Overview & Results..............................................
Potential Induced Degradation Overview & Results.......................................................................................
05
06
08
09
10
14 16
18
20
13
22
23
27
28
30
24
26
04 ENERGY 2018 PV Module Reliability Scorecard
2018 PV Module Reliability Scorecard ENERGY 05
INTRODUCTION
here has never been a more exciting time in the solar industry. Buyers are faced with increased technological advances, which test our understanding of what makes a
module “proven”, while energy pricing continues to fall, compressing project margins.
Ditlev Engel CEO DNV GL - Energy
Technologies that have been developed over recent years, including bifacial modules and PERC cells, are now available from many of the top module suppliers. India, China, Brazil, Mexico and Egypt are examples of some of the fastest growing PV markets that are themselves experiencing an emergence of new manufacturers. We no longer think about production in terms of megawatts per year, but in gigawatts.
Excitement can be equally joined with uncertainty. In the case of the solar industry, risk is often associated with new technologies and rapid development. New technologies mean uncharted territory in terms of module performance and long term reliability. The speed and volume at which these developments are introduced result in new risks associated with poor quality module construction, increasingly complicated logistics and limited field history.
In these exciting and sometimes challenging times, the industry moves forward by leaps and bounds. With 98 GW installed globally, up 29 percent from 2016, 2017 was another record year for new solar capacity. We expect 2018 to continue this record-setting growth, easily eclipsing the 100 GW milestone. At DNV GL’s Energy Labs, our experts have experienced the shift in the industry just as you have, and we remain one step ahead. We have tested everything from proven technologies to prototypes, with results ranging from reliable to risky, sometimes counter to conventional wisdom and expectations.
DNV GL first published this Scorecard in 2014 to show you, the market, what we found and learned through our testing. We are proud to present our fourth annual PV Module Reliability
Scorecard.
T
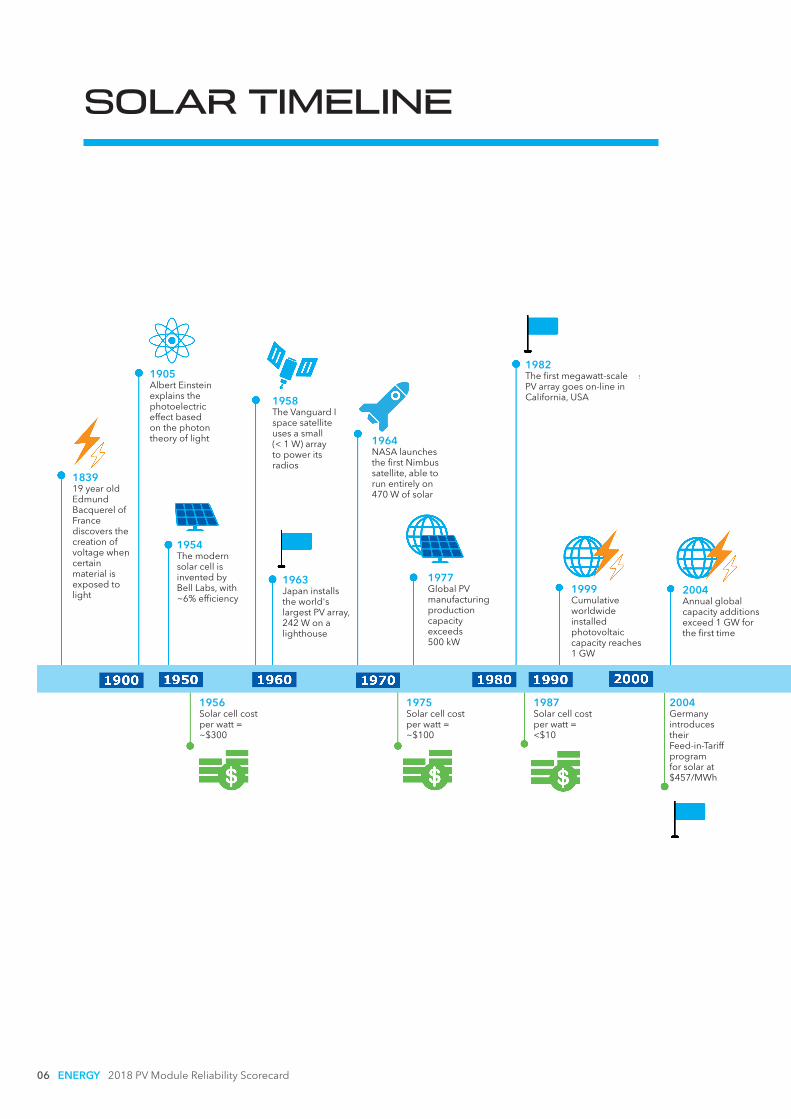
SOLAR TIMELINE
06 ENERGY 2018 PV Module Reliability Scorecard
1839 19 year old Edmund Bacquerel of France discovers the creation of voltage when certain material is exposed to light
1905 Albert Einstein explains the photoelectric effect based on the photon theory of light
1954 The modern solar cell is invented by Bell Labs, with ~6% efficiency
1956 Solar cell cost per watt = ~$300
1958 The Vanguard I space satellite uses a small (< 1 W) array to power its radios
1963 Japan installs the world's largest PV array, 242 W on a lighthouse
1975 Solar cell cost per watt = ~$100
1987 Solar cell cost per watt = <$10
1964 NASA launches the first Nimbus satellite, able to run entirely on 470 W of solar
1977 Global PV manufacturing production capacity exceeds 500 kW
1982 The first megawatt-scale PV array goes on-line in California, USA
1999 Cumulative worldwide installed photovoltaic capacity reaches 1 GW
2004 Annual global capacity additions exceed 1 GW for the first time
2004 Germany introduces their Feed-in-Tariff program for solar at $457/MWh
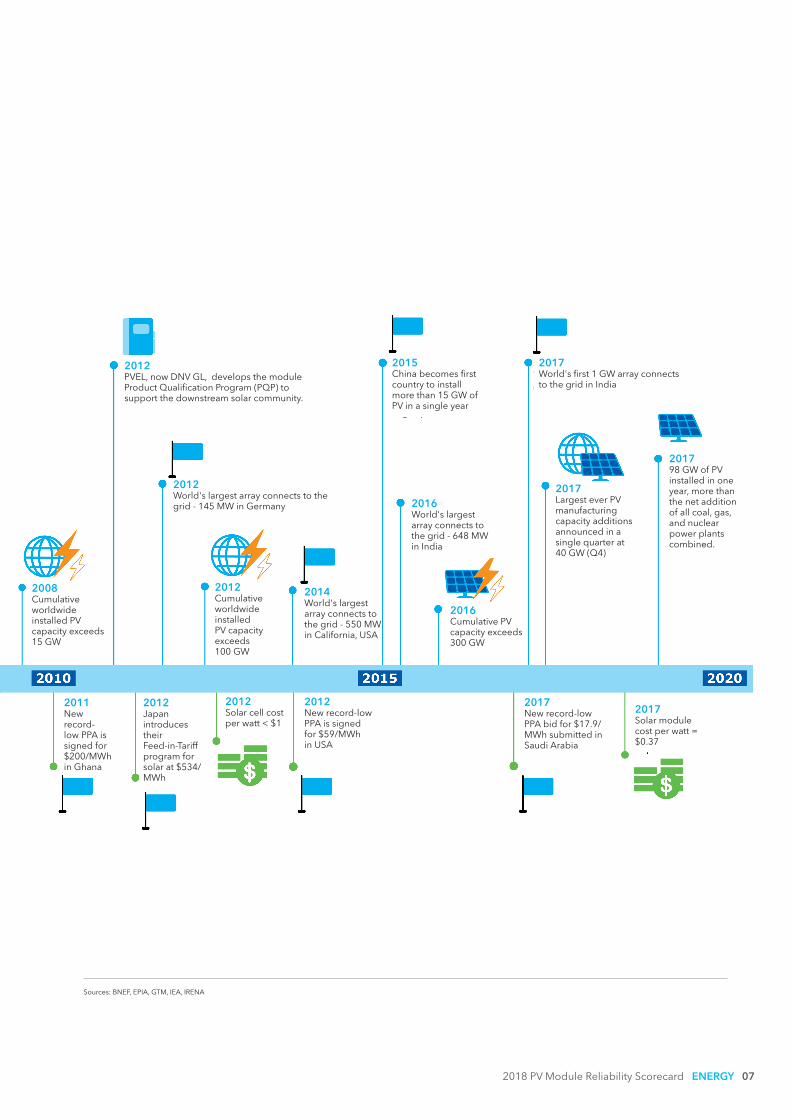
SOLAR TIMELINE
2018 PV Module Reliability Scorecard ENERGY 07
Sources: BNEF, EPIA, GTM, IEA, IRENA
2008 Cumulative worldwide installed PV capacity exceeds 15 GW
2011 New record-low PPA is signed for $200/MWh in Ghana
2012 Japan introduces their Feed-in-Tariff program for solar at $534/MWh
2012 PVEL, now DNV GL, develops the module Product Qualification Program (PQP) to support the downstream solar community.
2012 World's largest array connects to the grid - 145 MW in Germany
2012 Cumulative worldwide installed PV capacity exceeds 100 GW
2012 Solar cell cost per watt < $1
2012 New record-low PPA is signed for $59/MWh in USA
2014 World's largest array connects to the grid - 550 MW in California, USA
2016 World's largest array connects to the grid - 648 MW in India
2015 China becomes first country to install more than 15 GW of PV in a single year
2016 Cumulative PV capacity exceeds 300 GW
2017 World's first 1 GW array connects to the grid in India
2017 New record-low PPA bid for $17.9/MWh submitted in Saudi Arabia
2017 Largest ever PV manufacturing capacity additions announced in a single quarter at 40 GW (Q4)
2017 98 GW of PV installed in one year, more than the net addition of all coal, gas, and nuclear power plants combined.
2017 Solar module cost per watt = $0.37
08 ENERGY 2018 PV Module Reliability Scorecard
1 Source: IEA PVPS 2014
2 Source: “Compendium of Photovoltaic Degradation Rates”, D.C. Jordan, et al, NREL, 2016
3 Source: Sub-module failures on ground-mount sites courtesy of Heliolytics, 2018
4 Source: Courtesy of DuPont Photovoltaic Solutions, “Degradation of Fielded PV Modules from Across the Globe”, K.R. Choudhury, et al., 2018
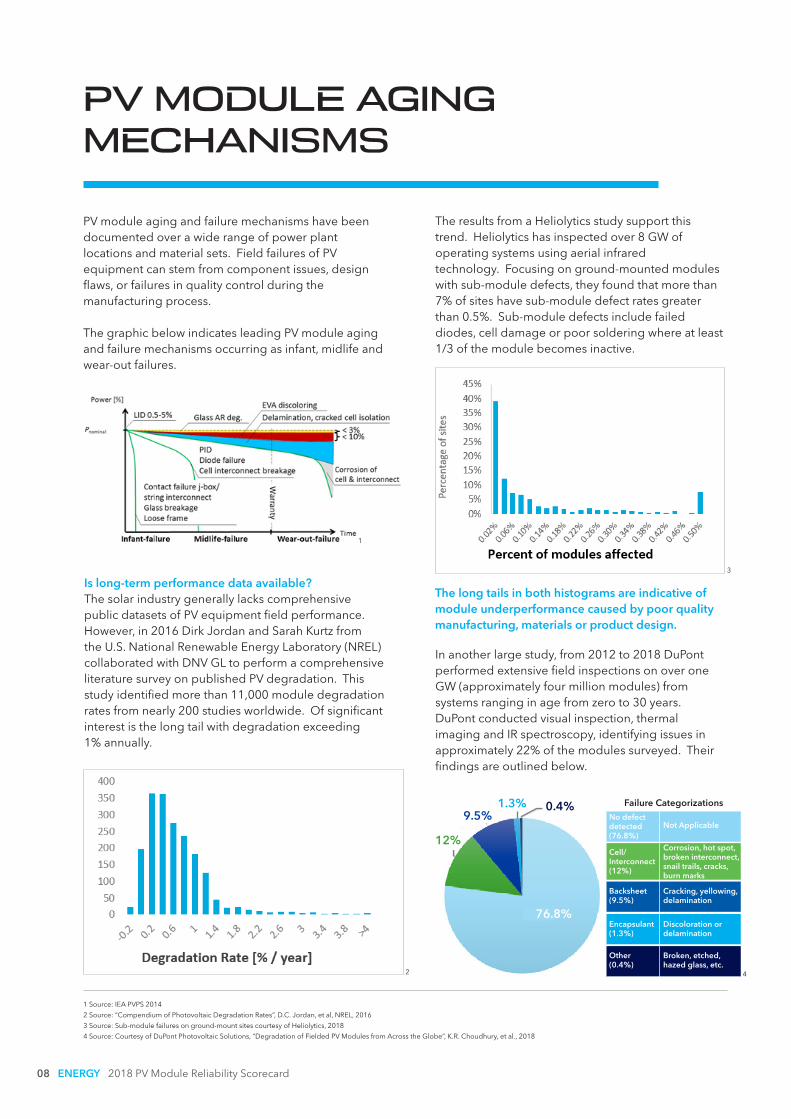
PV MODULE AGING MECHANISMS
PV module aging and failure mechanisms have been documented over a wide range of power plant locations and material sets. Field failures of PV equipment can stem from component issues, design flaws, or failures in quality control during the manufacturing process.
The graphic below indicates leading PV module aging and failure mechanisms occurring as infant, midlife and wear-out failures.
The results from a Heliolytics study support this trend. Heliolytics has inspected over 8 GW of operating systems using aerial infrared technology. Focusing on ground-mounted modules with sub-module defects, they found that more than 7% of sites have sub-module defect rates greater than 0.5%. Sub-module defects include failed diodes, cell damage or poor soldering where at least 1/3 of the module becomes inactive.
Is long-term performance data available? The solar industry generally lacks comprehensive public datasets of PV equipment field performance. However, in 2016 Dirk Jordan and Sarah Kurtz from the U.S. National Renewable Energy Laboratory (NREL) collaborated with DNV GL to perform a comprehensive literature survey on published PV degradation. This study identified more than 11,000 module degradation rates from nearly 200 studies worldwide. Of significant interest is the long tail with degradation exceeding 1% annually.
The long tails in both histograms are indicative of module underperformance caused by poor quality manufacturing, materials or product design.
In another large study, from 2012 to 2018 DuPont performed extensive field inspections on over one GW (approximately four million modules) from systems ranging in age from zero to 30 years. DuPont conducted visual inspection, thermal imaging and IR spectroscopy, identifying issues in approximately 22% of the modules surveyed. Their findings are outlined below.
No defect detected (76.8%)
Cell/ Interconnect (12%)
Backsheet (9.5%)
Encapsulant (1.3%)
Other (0.4%)
Not Applicable
Corrosion, hot spot, broken interconnect, snail trails, cracks, burn marks
Cracking, yellowing, delamination
Discoloration or delamination
Broken, etched, hazed glass, etc.
1
2 4
3
76.8%
12%
9.5%1.3% 0.4% Failure Categorizations

2018 PV Module Reliability Scorecard ENERGY 09
PV MODULE AGING MECHANISMS
PV MODULE RELIABILITY & TESTING
How was module testing developed? The U.S. Jet Propulsion Laboratory’s (JPL) Block Buy program started in the mid-1970s with the goal of developing environmental tests for crystalline silicon modules. This program established many of the tests that are still used for reliability assessment today.
The European Solar Test Installation (ESTI) project was initiated in the late 1970s and focused on both testing modules and creating standard performance metrics for solar cells.
These two programs formed a foundation for today’s basic module certification tests:
Are there limitations to the standards? Though most PV projects require UL and/or IEC certification to ensure a minimum level of module robustness and safety, it is widely accepted that these certification standards are not sufficient to demonstrate long-term PV module reliability for the following reasons:
1. UL 1703 (and the similar IEC 61730) are purely safety tests, to ensure that modules do not pose a hazard during operation. These tests do not address long-term reliability or performance.
2. The IEC 61215 tests are suitable only for identifying module defects that manifest within the first few operational years (i.e., defect screening).
3. Certification testing is performed on PV module samples selected by each manufacturer. This may result in sampling bias if manufacturers select only their best modules for certification testing.
How does degradation relate to module failure? Long-term module power degradation is built into project expectations and is warranted by manufacturers. Typical warranty terms provide a guarantee of 97% of the nameplate rating during the first year, reduced by 0.6-0.7% annually during the following 24 years.
Measuring power degradation in the field when the levels are small is extraordinarily difficult due to the uncertainty of measurement tools and sensors. Practically, this results in most PV module warranty claims being limited to excessive underperformance or complete failure. DNV GL notes that an allowance for uncertainty, typically according to EN 50380, is applied for warranty enforcement which effectively lowers the guaranteed level by a further amount (on the order of 3%).
Based on DNV GL’s experience and data, at least 7% of commercial PV modules do not pass the IEC 61215 humidity freeze test. This 7% figure pulls from the historical dataset that has grown from tens to thousands of modules.
Prior to PV module purchase, it is essential that a trustworthy source tests the selected product’s resilience to the most common degradation mechanisms.
■ International Electrotechnical Commission (IEC) 61215 “Crystalline silicon terrestrial photovoltaic (PV) modules – Design qualification and type approval”
■ Underwriters Laboratories (UL) 1703 “Standard for Flat-Plate Photovoltaic Modules and Panels”
Source: DNV GL
■ 7% of modules fail IEC 61215
10 ENERGY 2018 PV Module Reliability Scorecard
THE PV MODULE PRODUCT QUALIFICATION PROGRAM
In 2012, DNV GL developed the PV Module Product Qualification Program (PQP) to support the solar community with two aims:
Provide PV equipment buyers and power plant investors with independent and consistent reliability and performance data to support implementation of an effective supplier management process (such as an Approved Product or Vendor List).
Provide independent recognition to module manufacturers who outpace their competitors in product quality and durability.
The scope of the PQP aligns with requirements from DNV GL’s downstream partners, including developers, contractors, asset owners and financiers. The PQP has evolved to consider new insights in understanding field failure and degradation mechanisms, requests from DNV GL’s downstream partners, as well as feedback from PV module manufacturers. For example, beginning in 2018, an extended light soak test sequence was added to better quantify LID stabilization.
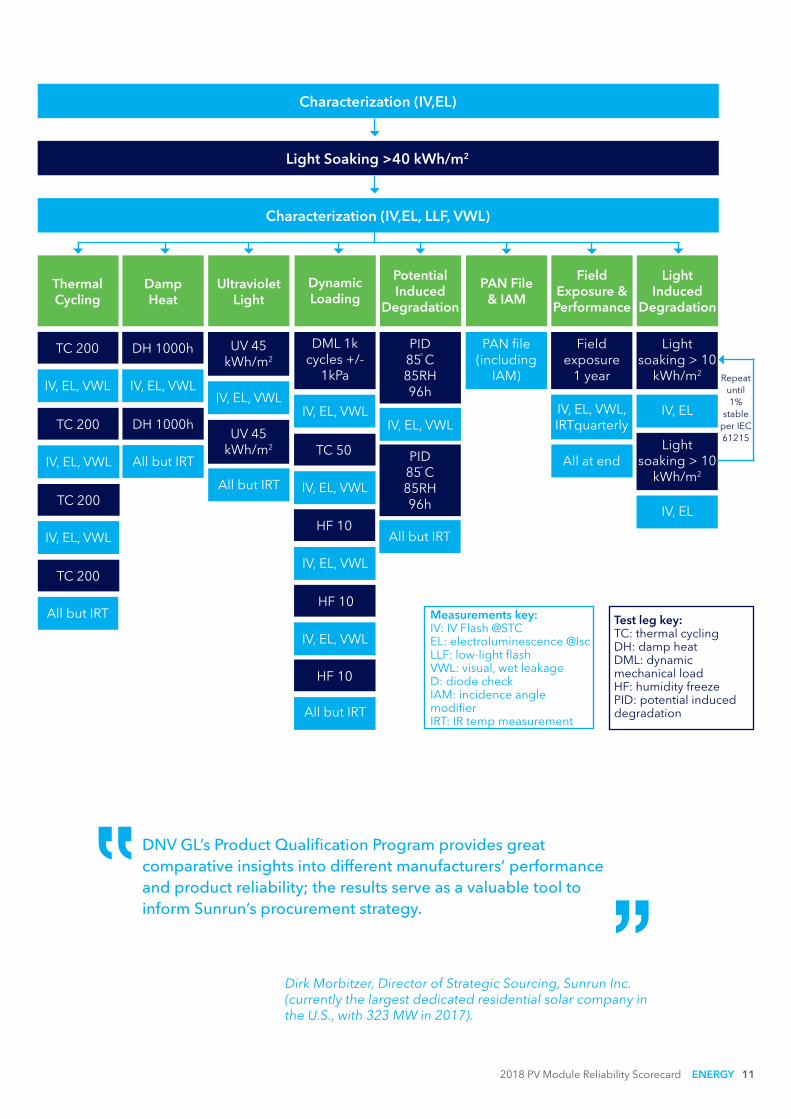
This PV Module Reliability Scorecard is a distillation of the past 18 months of PQP results. Each set of results is backed by a complete report on each product tested; these individual PV module reports are available to DNV GL downstream partners. All Bill of Materials (BOM) of modules submitted to PQP testing are witnessed in production and tested in the same way and in the same environment to enable a levelled comparison.
In the past five years, DNV GL has tested over 300 BOMs for more than 50 module manufacturers. Nine of the top ten global module manufacturers and more than 70% of the latest Bloomberg New Energy Finance (BNEF) “Tier 1” manufacturers have participated in the PQP.
2018 PV Module Reliability Scorecard ENERGY 11
DNV GL’s Product Qualification Program provides great comparative insights into different manufacturers’ performance and product reliability; the results serve as a valuable tool to inform Sunrun’s procurement strategy.
Dirk Morbitzer, Director of Strategic Sourcing, Sunrun Inc. (currently the largest dedicated residential solar company in the U.S., with 323 MW in 2017).
Characterization (IV,EL)
Light Soaking >40 kWh/m2
Characterization (IV,EL, LLF, VWL)
Thermal Cycling
Damp Heat
Ultraviolet Light
Dynamic Loading
PotentialInduced
Degradation
Field Exposure &
Performance
Light Induced
Degradation
TC 200 DH 1000h UV 45 kWh/m2
DML 1k cycles +/-
1kPa
PID 85 C 85RH 96h
Field exposure
1 year
Light soaking > 10
kWh/m2
IV, EL, VWL IV, EL, VWLIV, EL, VWL
IV, EL, VWLIV, EL, VWL
IV, EL, VWL, IRTquarterly
IV, EL
PAN File & IAM
PAN file (including
IAM)
TC 200 DH 1000h
All but IRTIV, EL, VWL
TC 200
IV, EL, VWL
TC 200
All but IRT
UV 45 kWh/m2
All but IRT
TC 50
IV, EL, VWL
HF 10
IV, EL, VWL
HF 10
IV, EL, VWL
HF 10
All but IRT
PID 85 C 85RH 96h
All but IRT
All at endLight
soaking > 10 kWh/m2
IV, EL
Measurements key: IV: IV Flash @STCEL: electroluminescence @IscLLF: low-light flash VWL: visual, wet leakageD: diode checkIAM: incidence angle modifier IRT: IR temp measurement
Test leg key:TC: thermal cyclingDH: damp heatDML: dynamic mechanical loadHF: humidity freezePID: potential induced degradation
Repeat until 1%
stable per IEC 61215
12 ENERGY 2018 PV Module Reliability Scorecard
2018 PV Module Reliability Scorecard ENERGY 13
THE RESULTS - OVERVIEW
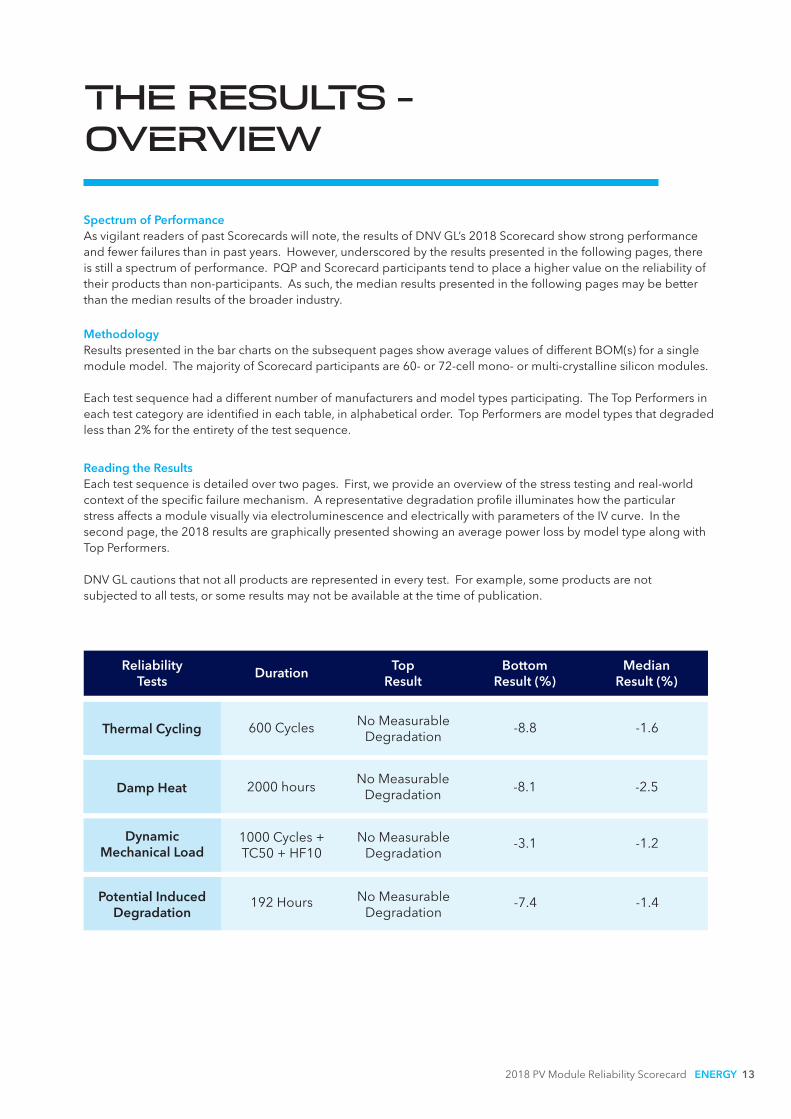
Spectrum of PerformanceAs vigilant readers of past Scorecards will note, the results of DNV GL’s 2018 Scorecard show strong performance and fewer failures than in past years. However, underscored by the results presented in the following pages, there is still a spectrum of performance. PQP and Scorecard participants tend to place a higher value on the reliability of their products than non-participants. As such, the median results presented in the following pages may be better than the median results of the broader industry.
Methodology Results presented in the bar charts on the subsequent pages show average values of different BOM(s) for a single module model. The majority of Scorecard participants are 60- or 72-cell mono- or multi-crystalline silicon modules.
Each test sequence had a different number of manufacturers and model types participating. The Top Performers in each test category are identified in each table, in alphabetical order. Top Performers are model types that degraded less than 2% for the entirety of the test sequence.
Reading the Results Each test sequence is detailed over two pages. First, we provide an overview of the stress testing and real-world context of the specific failure mechanism. A representative degradation profile illuminates how the particular stress affects a module visually via electroluminescence and electrically with parameters of the IV curve. In the second page, the 2018 results are graphically presented showing an average power loss by model type along with Top Performers.
DNV GL cautions that not all products are represented in every test. For example, some products are not subjected to all tests, or some results may not be available at the time of publication.
Reliability Tests
Duration Top Result
Bottom Result (%)
Median Result (%)
Damp Heat 2000 hours
600 Cycles
1000 Cycles + TC50 + HF10
192 Hours
No Measurable Degradation
No Measurable Degradation
No Measurable Degradation
No Measurable Degradation
-8.1
-8.8
-3.1
-7.4
-2.5
-1.6
-1.2
-1.4
Thermal Cycling
Dynamic Mechanical Load
Potential Induced Degradation
14 ENERGY 2018 PV Module Reliability Scorecard
THERMAL CYCLING OVERVIEW & RESULTS
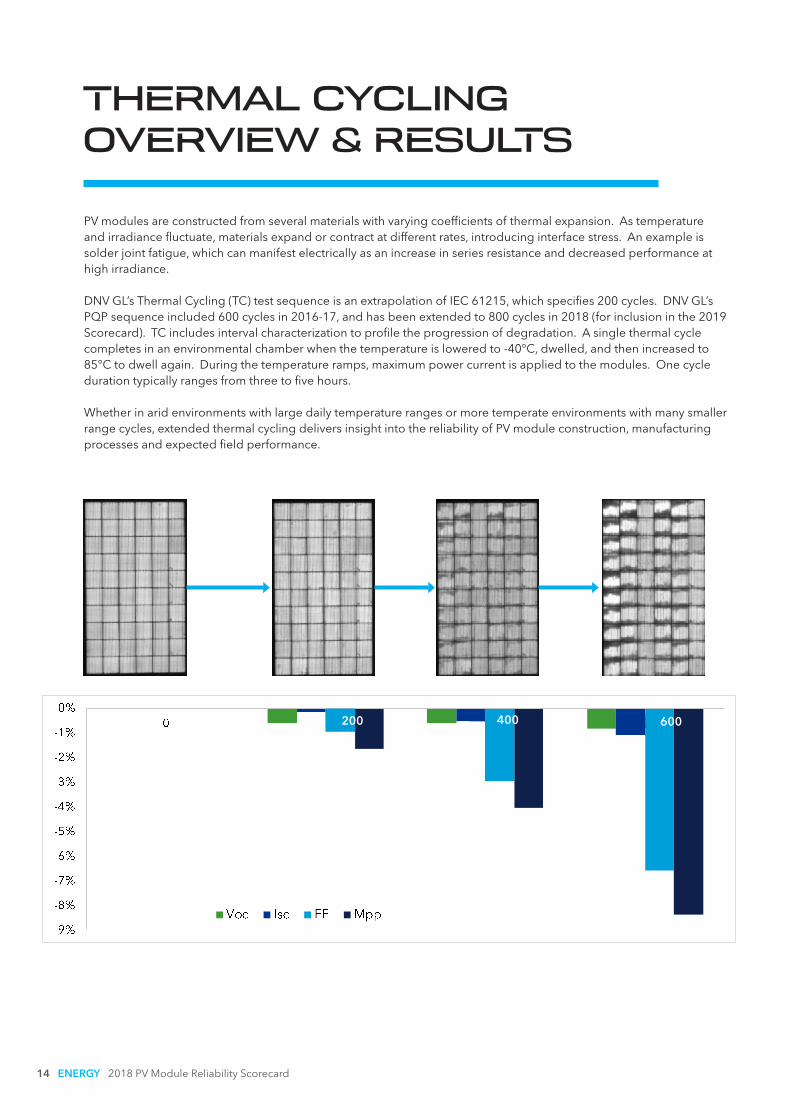
PV modules are constructed from several materials with varying coefficients of thermal expansion. As temperature and irradiance fluctuate, materials expand or contract at different rates, introducing interface stress. An example is solder joint fatigue, which can manifest electrically as an increase in series resistance and decreased performance at high irradiance.
DNV GL’s Thermal Cycling (TC) test sequence is an extrapolation of IEC 61215, which specifies 200 cycles. DNV GL’s PQP sequence included 600 cycles in 2016-17, and has been extended to 800 cycles in 2018 (for inclusion in the 2019 Scorecard). TC includes interval characterization to profile the progression of degradation. A single thermal cycle completes in an environmental chamber when the temperature is lowered to -40°C, dwelled, and then increased to 85°C to dwell again. During the temperature ramps, maximum power current is applied to the modules. One cycle duration typically ranges from three to five hours.
Whether in arid environments with large daily temperature ranges or more temperate environments with many smaller range cycles, extended thermal cycling delivers insight into the reliability of PV module construction, manufacturing processes and expected field performance.
Voc Isc FF MPP
200 400 600
2018 PV Module Reliability Scorecard ENERGY 15
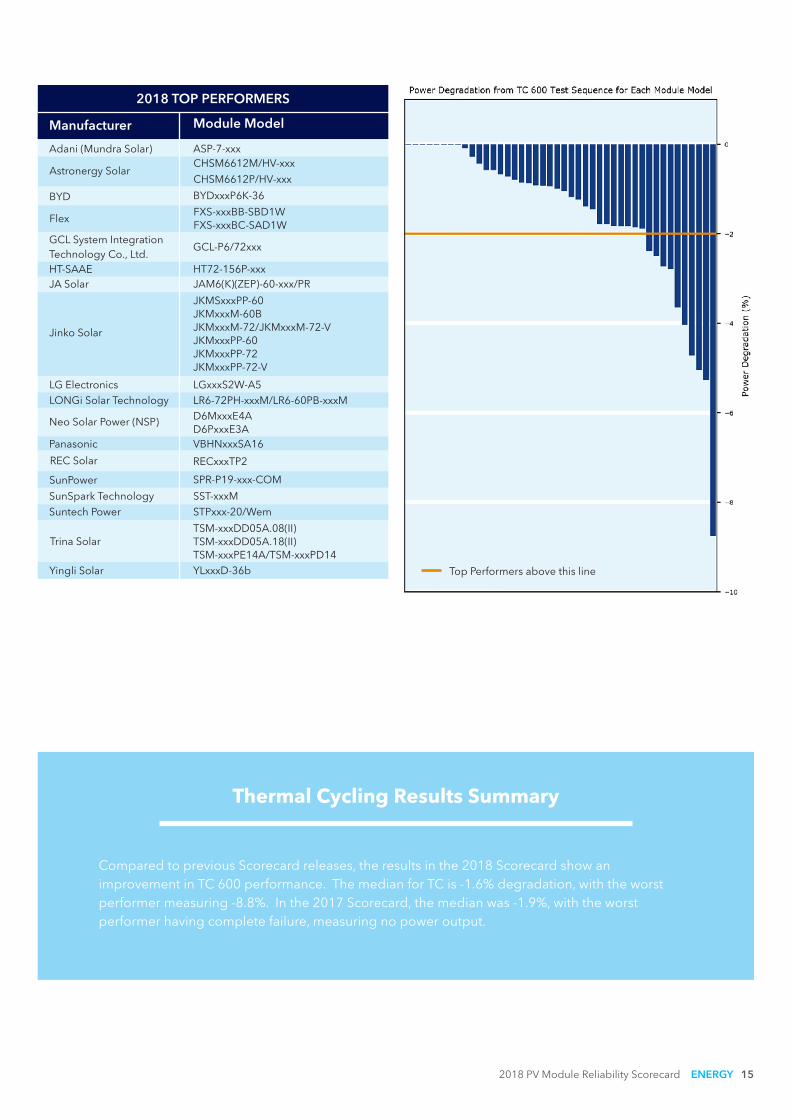
Thermal Cycling Results Summary
Compared to previous Scorecard releases, the results in the 2018 Scorecard show an improvement in TC 600 performance. The median for TC is -1.6% degradation, with the worst performer measuring -8.8%. In the 2017 Scorecard, the median was -1.9%, with the worst performer having complete failure, measuring no power output.
2018 TOP PERFORMERS
Manufacturer Module Model
Adani (Mundra Solar) ASP-7-xxx
Astronergy SolarCHSM6612M/HV-xxx
CHSM6612P/HV-xxx
BYD BYDxxxP6K-36
FlexFXS-xxxBB-SBD1WFXS-xxxBC-SAD1W
GCL System Integration Technology Co., Ltd.
GCL-P6/72xxx
HT-SAAE HT72-156P-xxxJA Solar JAM6(K)(ZEP)-60-xxx/PR
Jinko Solar
JKMSxxxPP-60JKMxxxM-60BJKMxxxM-72/JKMxxxM-72-VJKMxxxPP-60JKMxxxPP-72JKMxxxPP-72-V
LG Electronics LGxxxS2W-A5LONGi Solar Technology LR6-72PH-xxxM/LR6-60PB-xxxM
Neo Solar Power (NSP) D6MxxxE4A D6PxxxE3A
Panasonic VBHNxxxSA16
REC Solar RECxxxTP2
SunPower SPR-P19-xxx-COM
SunSpark Technology SST-xxxMSuntech Power STPxxx-20/Wem
Trina SolarTSM-xxxDD05A.08(II)TSM-xxxDD05A.18(II)TSM-xxxPE14A/TSM-xxxPD14
Yingli Solar YLxxxD-36b Top Performers above this line
16 ENERGY 2018 PV Module Reliability Scorecard
DAMP HEAT OVERVIEW & RESULTS
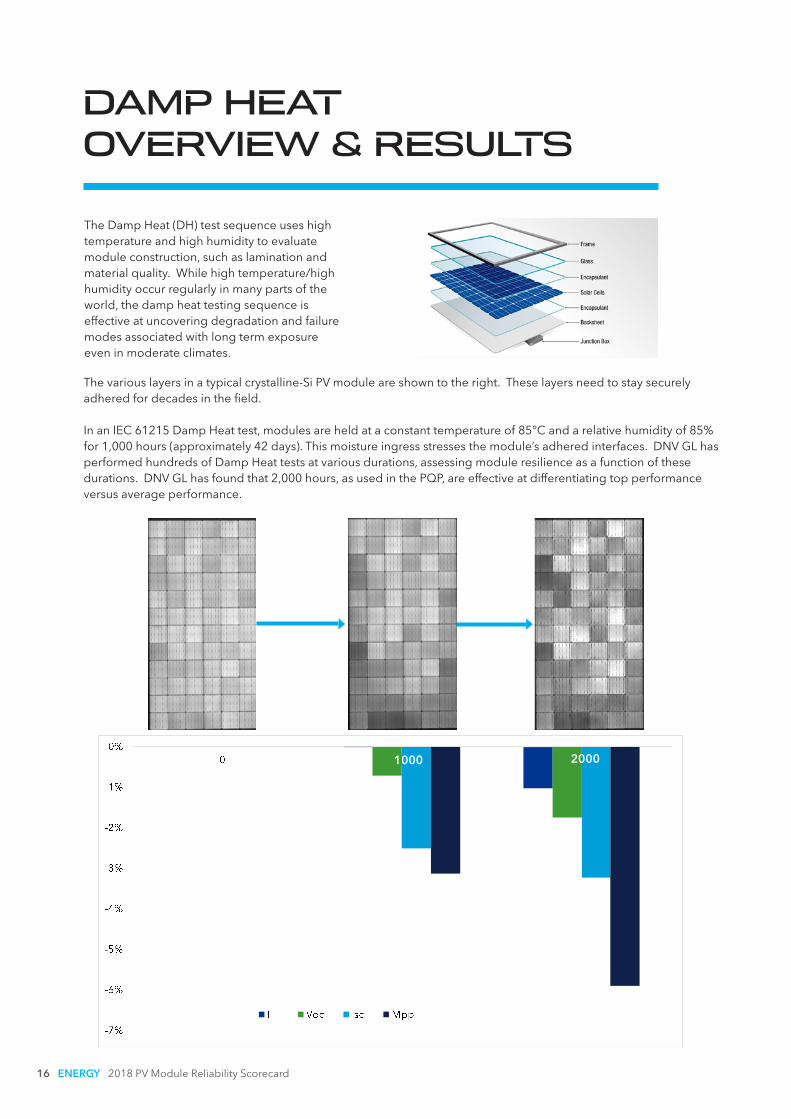
The Damp Heat (DH) test sequence uses high temperature and high humidity to evaluate module construction, such as lamination and material quality. While high temperature/high humidity occur regularly in many parts of the world, the damp heat testing sequence is effective at uncovering degradation and failure modes associated with long term exposure even in moderate climates.
The various layers in a typical crystalline-Si PV module are shown to the right. These layers need to stay securely adhered for decades in the field.
In an IEC 61215 Damp Heat test, modules are held at a constant temperature of 85°C and a relative humidity of 85% for 1,000 hours (approximately 42 days). This moisture ingress stresses the module’s adhered interfaces. DNV GL has performed hundreds of Damp Heat tests at various durations, assessing module resilience as a function of these durations. DNV GL has found that 2,000 hours, as used in the PQP, are effective at differentiating top performance versus average performance.
1000 2000
2018 PV Module Reliability Scorecard ENERGY 17
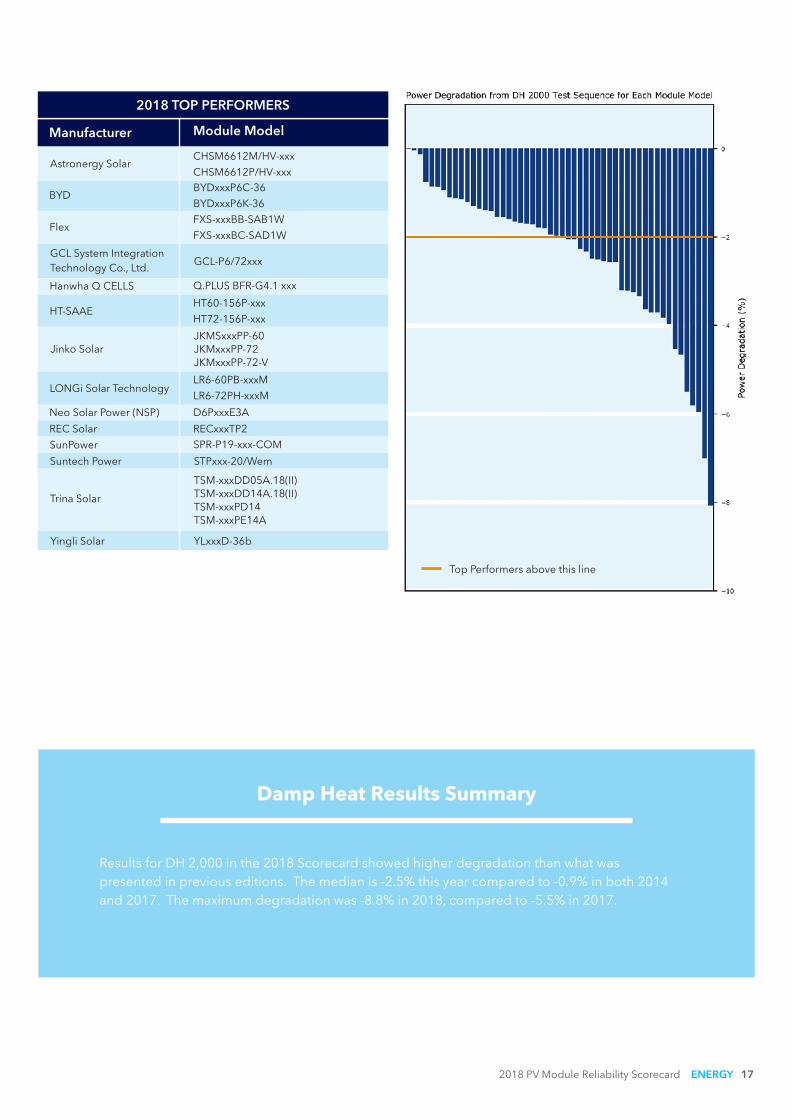
Damp Heat Results Summary
Results for DH 2,000 in the 2018 Scorecard showed higher degradation than what was presented in previous editions. The median is -2.5% this year compared to -0.9% in both 2014 and 2017. The maximum degradation was -8.8% in 2018, compared to -5.5% in 2017.
2018 TOP PERFORMERS
Manufacturer Module Model
Astronergy SolarCHSM6612M/HV-xxx
CHSM6612P/HV-xxx
BYDBYDxxxP6C-36
BYDxxxP6K-36
FlexFXS-xxxBB-SAB1W
FXS-xxxBC-SAD1W
HT-SAAEHT60-156P-xxx
HT72-156P-xxx
GCL System Integration Technology Co., Ltd.
GCL-P6/72xxx
Hanwha Q CELLS Q.PLUS BFR-G4.1 xxx
Jinko SolarJKMSxxxPP-60JKMxxxPP-72JKMxxxPP-72-V
Neo Solar Power (NSP) D6PxxxE3A
LONGi Solar TechnologyLR6-60PB-xxxM
LR6-72PH-xxxM
Trina Solar
TSM-xxxDD05A.18(II) TSM-xxxDD14A.18(II)TSM-xxxPD14 TSM-xxxPE14A
Yingli Solar YLxxxD-36b
REC Solar RECxxxTP2
SunPower SPR-P19-xxx-COM
Suntech Power STPxxx-20/Wem
Top Performers above this line
0 DML1000 DML1000-TC50 DML1000-TC50-HF10
18 ENERGY 2018 PV Module Reliability Scorecard
MECHANICAL LOAD + THERMAL CYCLING + HUMIDITY FREEZE OVERVIEW & RESULTS
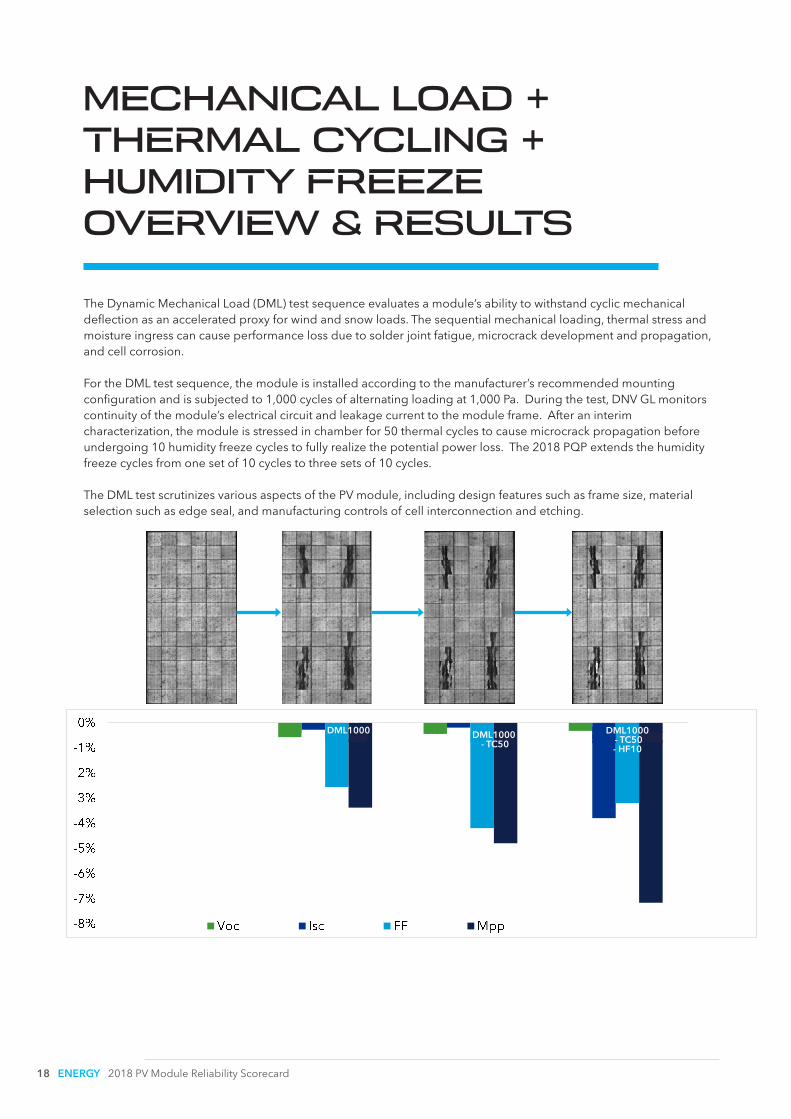
The Dynamic Mechanical Load (DML) test sequence evaluates a module’s ability to withstand cyclic mechanical deflection as an accelerated proxy for wind and snow loads. The sequential mechanical loading, thermal stress and moisture ingress can cause performance loss due to solder joint fatigue, microcrack development and propagation, and cell corrosion.
For the DML test sequence, the module is installed according to the manufacturer’s recommended mounting configuration and is subjected to 1,000 cycles of alternating loading at 1,000 Pa. During the test, DNV GL monitors continuity of the module’s electrical circuit and leakage current to the module frame. After an interim characterization, the module is stressed in chamber for 50 thermal cycles to cause microcrack propagation before undergoing 10 humidity freeze cycles to fully realize the potential power loss. The 2018 PQP extends the humidity freeze cycles from one set of 10 cycles to three sets of 10 cycles.
The DML test scrutinizes various aspects of the PV module, including design features such as frame size, material selection such as edge seal, and manufacturing controls of cell interconnection and etching.
DML1000 DML1000 - TC50
DML1000 - TC50 - HF10
2018 PV Module Reliability Scorecard ENERGY 19
MECHANICAL LOAD + THERMAL CYCLING + HUMIDITY FREEZE OVERVIEW & RESULTS
Dynamic Mechanical Load Results Summary
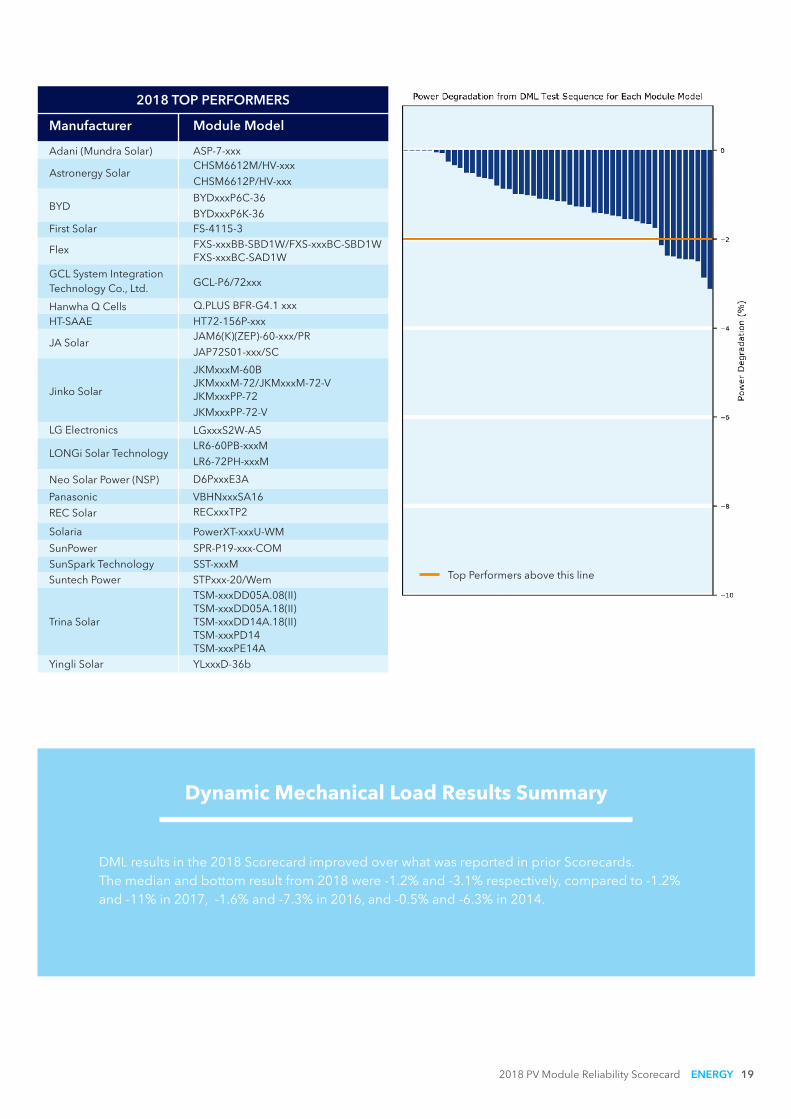
DML results in the 2018 Scorecard improved over what was reported in prior Scorecards. The median and bottom result from 2018 were -1.2% and -3.1% respectively, compared to -1.2% and -11% in 2017, -1.6% and -7.3% in 2016, and -0.5% and -6.3% in 2014.
2018 TOP PERFORMERS
Manufacturer Module Model
Adani (Mundra Solar) ASP-7-xxx
Astronergy SolarCHSM6612M/HV-xxx
CHSM6612P/HV-xxx
BYDBYDxxxP6C-36
BYDxxxP6K-36
Flex FXS-xxxBB-SBD1W/FXS-xxxBC-SBD1WFXS-xxxBC-SAD1W
GCL System Integration Technology Co., Ltd. GCL-P6/72xxx
HT-SAAE HT72-156P-xxx
JA SolarJAM6(K)(ZEP)-60-xxx/PR
JAP72S01-xxx/SC
Jinko Solar
JKMxxxM-60B JKMxxxM-72/JKMxxxM-72-V JKMxxxPP-72
JKMxxxPP-72-V
LG Electronics LGxxxS2W-A5
LONGi Solar TechnologyLR6-60PB-xxxM
LR6-72PH-xxxM
Neo Solar Power (NSP) D6PxxxE3A
Panasonic VBHNxxxSA16
REC Solar RECxxxTP2
Solaria PowerXT-xxxU-WM
SunPower SPR-P19-xxx-COM
Suntech Power STPxxx-20/Wem
Trina Solar
TSM-xxxDD05A.08(II)TSM-xxxDD05A.18(II)TSM-xxxDD14A.18(II) TSM-xxxPD14 TSM-xxxPE14A
Yingli Solar YLxxxD-36b
SunSpark Technology SST-xxxM
First Solar FS-4115-3
Hanwha Q Cells Q.PLUS BFR-G4.1 xxx
Top Performers above this line
20 ENERGY 2018 PV Module Reliability Scorecard
POTENTIAL INDUCED DEGRADATION (PID) OVERVIEW & RESULTS
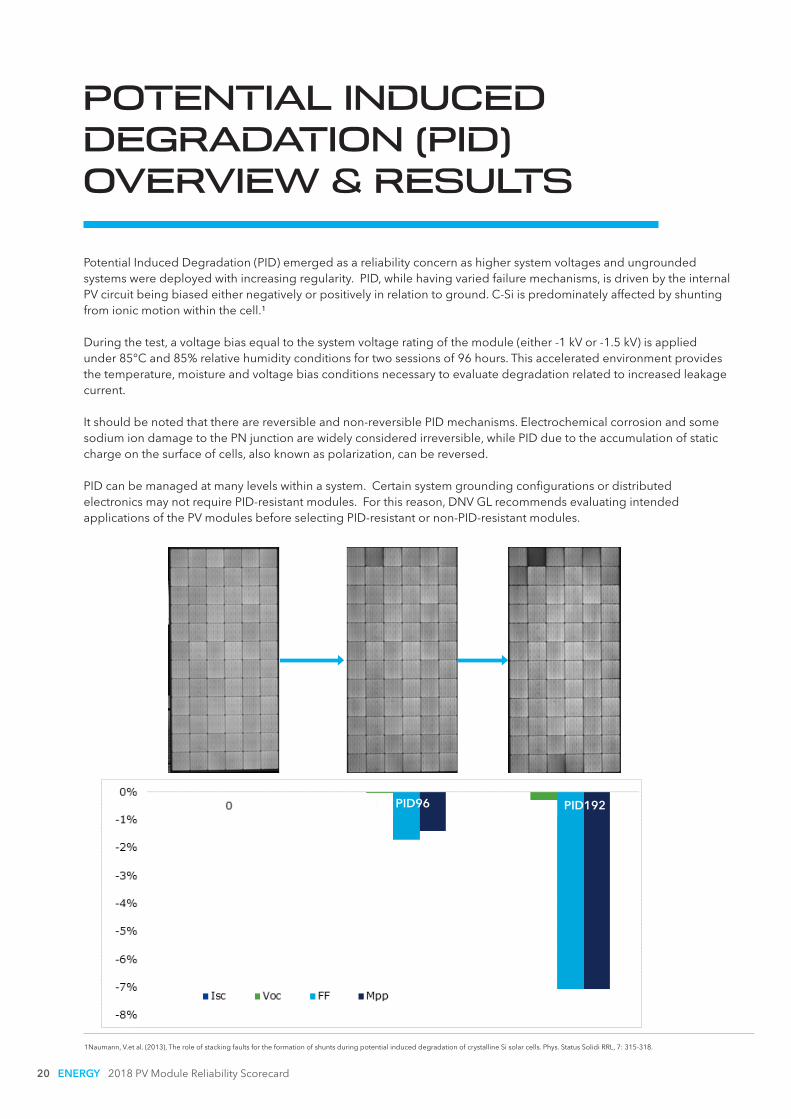
Potential Induced Degradation (PID) emerged as a reliability concern as higher system voltages and ungrounded systems were deployed with increasing regularity. PID, while having varied failure mechanisms, is driven by the internal PV circuit being biased either negatively or positively in relation to ground. C-Si is predominately affected by shunting from ionic motion within the cell.¹
During the test, a voltage bias equal to the system voltage rating of the module (either -1 kV or -1.5 kV) is applied under 85°C and 85% relative humidity conditions for two sessions of 96 hours. This accelerated environment provides the temperature, moisture and voltage bias conditions necessary to evaluate degradation related to increased leakage current.
It should be noted that there are reversible and non-reversible PID mechanisms. Electrochemical corrosion and some sodium ion damage to the PN junction are widely considered irreversible, while PID due to the accumulation of static charge on the surface of cells, also known as polarization, can be reversed.
PID can be managed at many levels within a system. Certain system grounding configurations or distributed electronics may not require PID-resistant modules. For this reason, DNV GL recommends evaluating intended applications of the PV modules before selecting PID-resistant or non-PID-resistant modules.
1Naumann, V.et al. (2013), The role of stacking faults for the formation of shunts during potential induced degradation of crystalline Si solar cells. Phys. Status Solidi RRL, 7: 315-318.
PID96 PID192
2018 PV Module Reliability Scorecard ENERGY 21
POTENTIAL INDUCED DEGRADATION (PID) OVERVIEW & RESULTS
Potential Induced Degradation Results Summary
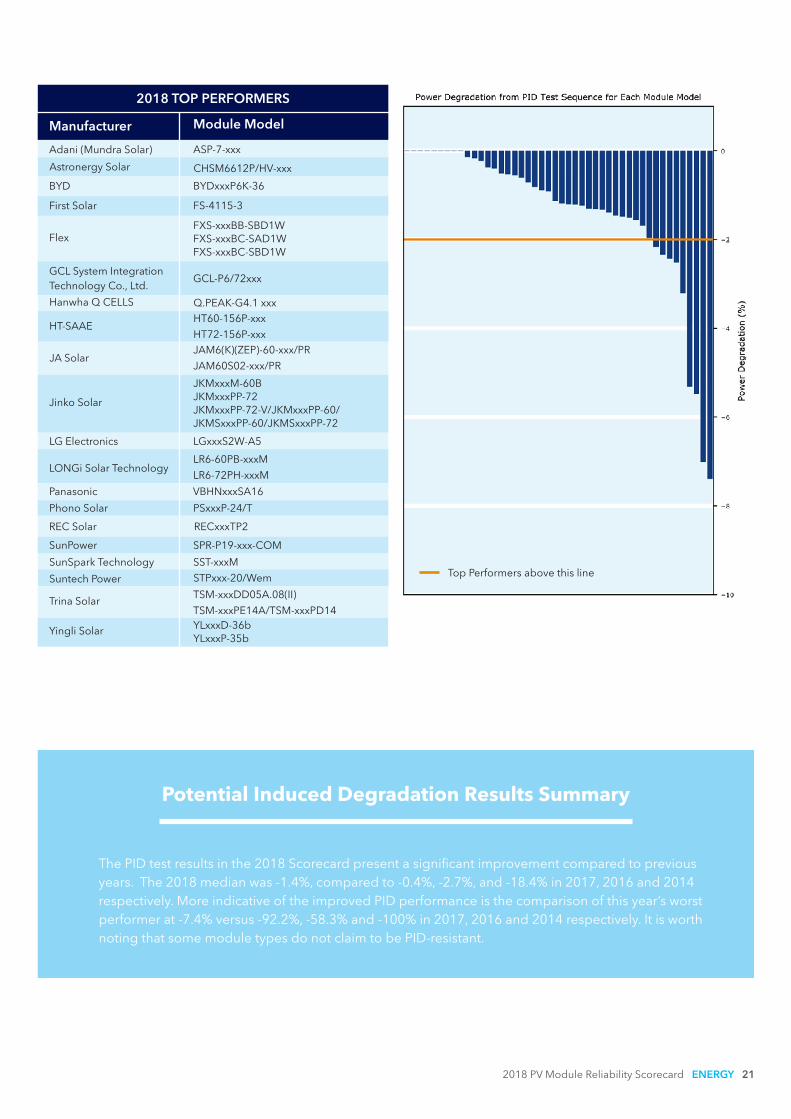
The PID test results in the 2018 Scorecard present a significant improvement compared to previous years. The 2018 median was -1.4%, compared to -0.4%, -2.7%, and -18.4% in 2017, 2016 and 2014 respectively. More indicative of the improved PID performance is the comparison of this year’s worst performer at -7.4% versus -92.2%, -58.3% and -100% in 2017, 2016 and 2014 respectively. It is worth noting that some module types do not claim to be PID-resistant.
2018 TOP PERFORMERS
Manufacturer Module Model
Adani (Mundra Solar) ASP-7-xxx
Astronergy Solar CHSM6612P/HV-xxx
BYD BYDxxxP6K-36
FlexFXS-xxxBB-SBD1WFXS-xxxBC-SAD1W FXS-xxxBC-SBD1W
GCL System Integration Technology Co., Ltd.
GCL-P6/72xxx
HT-SAAEHT60-156P-xxx
HT72-156P-xxx
JA SolarJAM6(K)(ZEP)-60-xxx/PR
JAM60S02-xxx/PR
Jinko Solar
JKMxxxM-60BJKMxxxPP-72 JKMxxxPP-72-V/JKMxxxPP-60/ JKMSxxxPP-60/JKMSxxxPP-72
LG Electronics LGxxxS2W-A5
LONGi Solar TechnologyLR6-60PB-xxxM
LR6-72PH-xxxM
Panasonic VBHNxxxSA16
Phono Solar PSxxxP-24/T
REC Solar RECxxxTP2
SunPower SPR-P19-xxx-COM
SunSpark Technology SST-xxxM
Trina SolarTSM-xxxDD05A.08(II)
TSM-xxxPE14A/TSM-xxxPD14
Yingli Solar YLxxxD-36bYLxxxP-35b
First Solar FS-4115-3
Hanwha Q CELLS Q.PEAK-G4.1 xxx
Suntech Power STPxxx-20/Wem Top Performers above this line
22 ENERGY 2018 PV Module Reliability Scorecard
CASE STUDY: PID PERFORMANCE
BOM Matters.As manufacturers diversify their supply chains and developers enter emerging markets, educated BOM selections and decisions become the cornerstone of PV plant reliability.
How BOM Matters.This PID case study underscores BOM criticality with a deeper look at how DNV GL’s extended PID test sequence could prevent a BOM selection with significant adverse consequences.
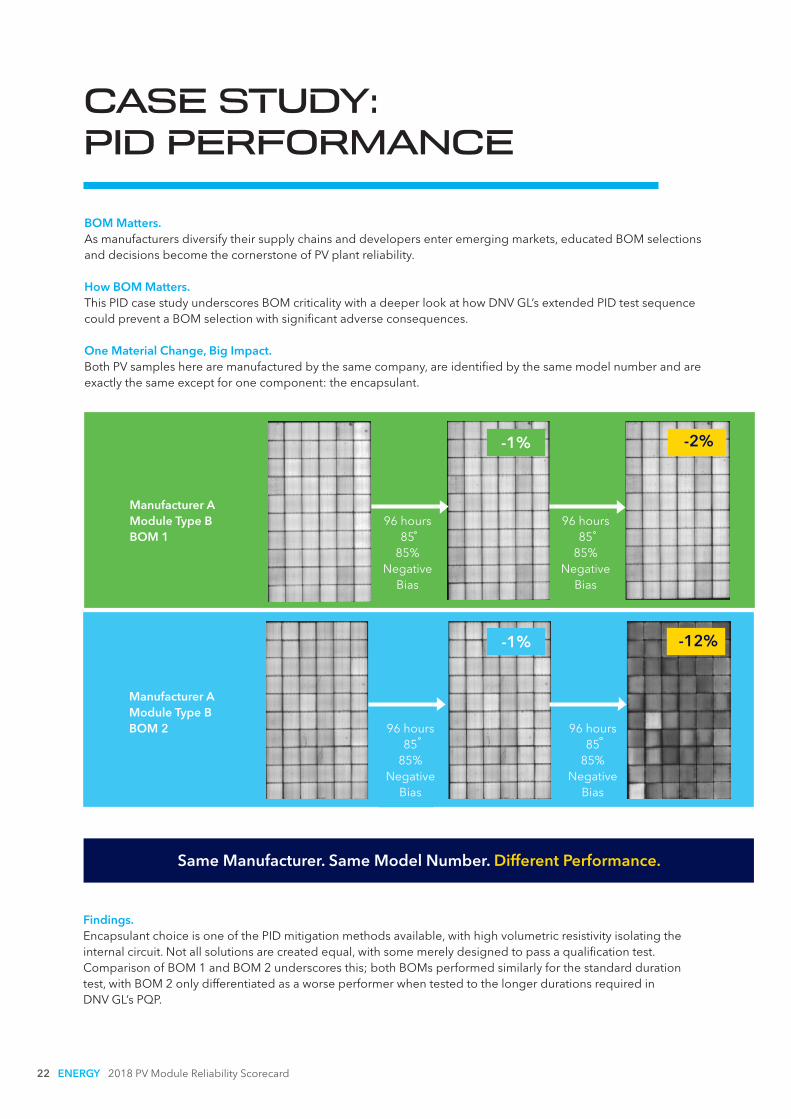
One Material Change, Big Impact.Both PV samples here are manufactured by the same company, are identified by the same model number and are exactly the same except for one component: the encapsulant.
■ Manufacturer A Module Type B
■ BOM 2
■ Manufacturer A Module Type B
■ BOM 1
■ 96 hours ■ 85 85%
Negative Bias
■ 96 hours ■ 85 85%
Negative Bias
■ 96 hours ■ 85 85%
Negative Bias
■ 96 hours ■ 85 85%
Negative Bias
-1%
-1% -2%
-12%
Same Manufacturer. Same Model Number. Different Performance.
Findings.Encapsulant choice is one of the PID mitigation methods available, with high volumetric resistivity isolating the internal circuit. Not all solutions are created equal, with some merely designed to pass a qualification test. Comparison of BOM 1 and BOM 2 underscores this; both BOMs performed similarly for the standard duration test, with BOM 2 only differentiated as a worse performer when tested to the longer durations required in DNV GL’s PQP.
2018 PV Module Reliability Scorecard ENERGY 23
CASE STUDY: PAN & IAM PERFORMANCE
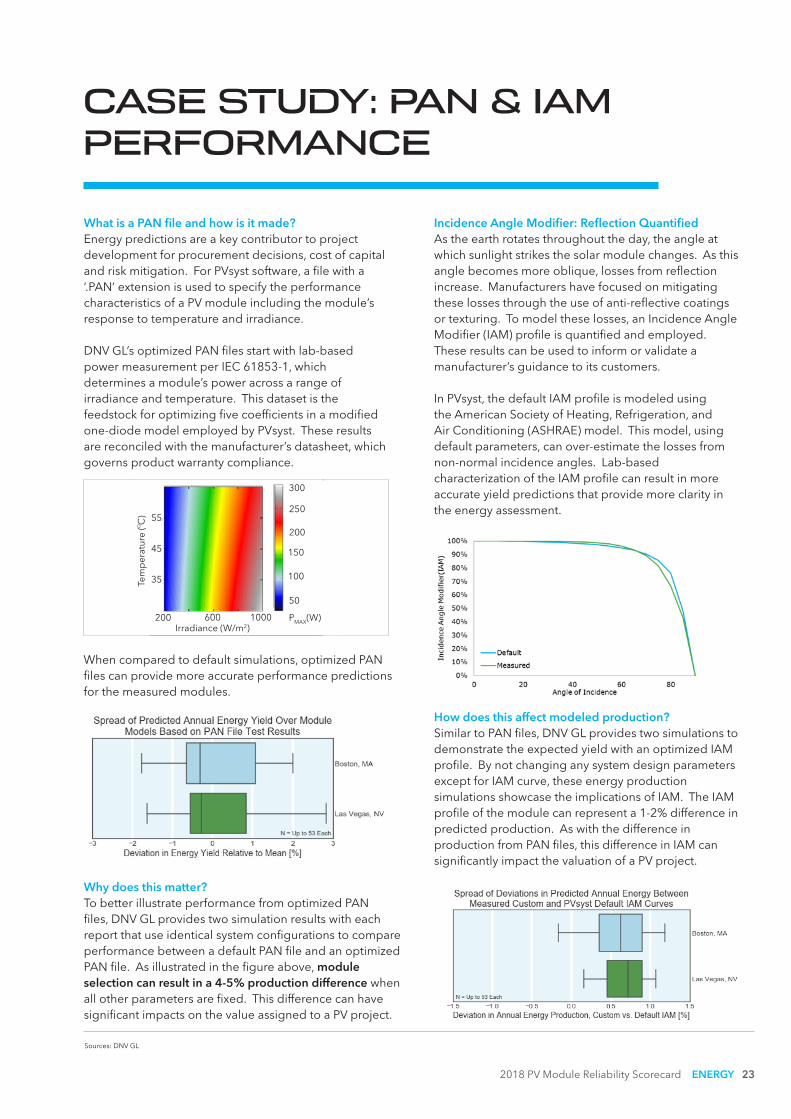
What is a PAN file and how is it made? Energy predictions are a key contributor to project development for procurement decisions, cost of capital and risk mitigation. For PVsyst software, a file with a ‘.PAN’ extension is used to specify the performance characteristics of a PV module including the module’s response to temperature and irradiance.
DNV GL’s optimized PAN files start with lab-based power measurement per IEC 61853-1, which determines a module’s power across a range of irradiance and temperature. This dataset is the feedstock for optimizing five coefficients in a modified one-diode model employed by PVsyst. These results are reconciled with the manufacturer’s datasheet, which governs product warranty compliance.
Incidence Angle Modifier: Reflection Quantified As the earth rotates throughout the day, the angle at which sunlight strikes the solar module changes. As this angle becomes more oblique, losses from reflection increase. Manufacturers have focused on mitigating these losses through the use of anti-reflective coatings or texturing. To model these losses, an Incidence Angle Modifier (IAM) profile is quantified and employed. These results can be used to inform or validate a manufacturer’s guidance to its customers.
In PVsyst, the default IAM profile is modeled using the American Society of Heating, Refrigeration, and Air Conditioning (ASHRAE) model. This model, using default parameters, can over-estimate the losses from non-normal incidence angles. Lab-based characterization of the IAM profile can result in more accurate yield predictions that provide more clarity in the energy assessment.
Why does this matter? To better illustrate performance from optimized PAN files, DNV GL provides two simulation results with each report that use identical system configurations to compare performance between a default PAN file and an optimized PAN file. As illustrated in the figure above, module selection can result in a 4-5% production difference when all other parameters are fixed. This difference can have significant impacts on the value assigned to a PV project.
How does this affect modeled production? Similar to PAN files, DNV GL provides two simulations to demonstrate the expected yield with an optimized IAM profile. By not changing any system design parameters except for IAM curve, these energy production simulations showcase the implications of IAM. The IAM profile of the module can represent a 1-2% difference in predicted production. As with the difference in production from PAN files, this difference in IAM can significantly impact the valuation of a PV project.
CASE STUDY: PID PERFORMANCE
When compared to default simulations, optimized PAN files can provide more accurate performance predictions for the measured modules.
Sources: DNV GL
Irradiance (W/m2) PMAX(W)
■Te
mp
erat
ure
( C)
50
100
150
200
250
300
200 600 1000
35
45
55
24 ENERGY 2018 PV Module Reliability Scorecard
INTERPRETING THE RESULTS
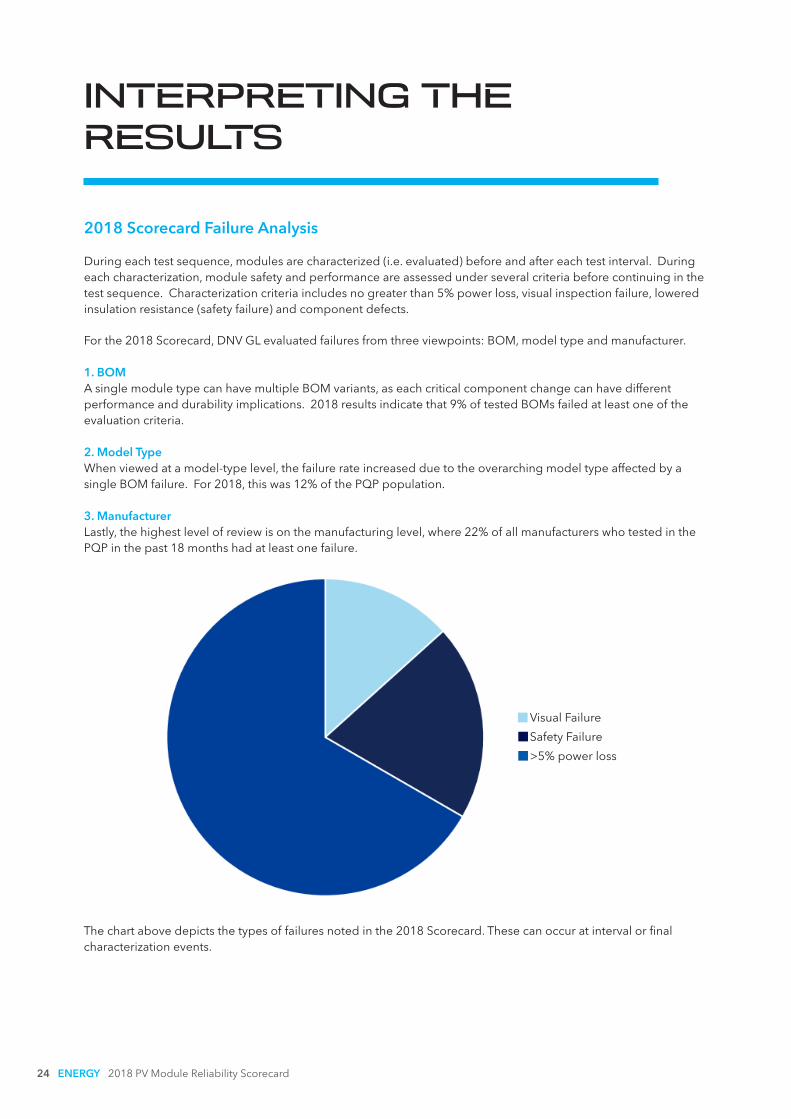
2018 Scorecard Failure Analysis During each test sequence, modules are characterized (i.e. evaluated) before and after each test interval. During each characterization, module safety and performance are assessed under several criteria before continuing in the test sequence. Characterization criteria includes no greater than 5% power loss, visual inspection failure, lowered insulation resistance (safety failure) and component defects.
For the 2018 Scorecard, DNV GL evaluated failures from three viewpoints: BOM, model type and manufacturer.
1. BOMA single module type can have multiple BOM variants, as each critical component change can have different performance and durability implications. 2018 results indicate that 9% of tested BOMs failed at least one of the evaluation criteria.
2. Model TypeWhen viewed at a model-type level, the failure rate increased due to the overarching model type affected by a single BOM failure. For 2018, this was 12% of the PQP population.
3. ManufacturerLastly, the highest level of review is on the manufacturing level, where 22% of all manufacturers who tested in the PQP in the past 18 months had at least one failure.
The chart above depicts the types of failures noted in the 2018 Scorecard. These can occur at interval or final characterization events.
Visual Failure
Safety Failure
>5% power loss
2018 PV Module Reliability Scorecard ENERGY 25
INTERPRETING THE RESULTS
Improvements in ResultsAs indicated in the previous pages, overall test results have improved since 2017. Continual attention to quality and robust ongoing evaluation appears to be driving PQP participants to new levels of performance. However, new technology and materials continually demand ongoing assessments with a test program that evolves with nuances and innovation. Therefore, it is important for buyers to be cognizant of BOM specification when sourcing PV modules, and to continually verify their durability. DNV GL’s PQP offers this adaptivity by actively evolving according to the needs of the downstream while also staying ahead of technological advances in manufacturing process and materials.
Obtain the Detailed ReportsMost PV modules on the market today utilize several different BOMs. This supply chain flexibility is necessary for PV module suppliers to remain competitive and to remove reliance on single source components. The use of many component suppliers is not a significant concern if the various combinations are equally tested and/or a buyer has full transparency of the proposed BOM and its associated test results. The same product label can be applied to a module with different materials and cells, made in different countries, and even produced by a different manufacturer (in the case of contract manufacturing).
To mitigate this risk, DNV GL recommends acquiring knowledge of the BOM and factory details (e.g., location, production line, etc.) for the specific modules being shipped to a project, and obtaining accelerated test results on that specific factory and BOM being procured. This knowledge provides more confidence than relying solely on manufacturing capacity and reputation of the supplier as measures of product quality.
Compare ResultsThe power degradation from the PQP results is based on accelerated testing, and as such the degradation results should not be used as a direct forecast of yearly degradation for fielded modules. The results should be used as a mechanism to evaluate PV modules and their associated BOMs and factory locations, and as a tool to compare expected module reliability and long-term performance qualitatively.
26 ENERGY 2018 PV Module Reliability Scorecard
FACTORY LOCATIONS
Module quality is affected by the equipment, process and quality control used when manufacturing the product. The DNV GL PQP includes a factory witness to verify the BOM and factory processes for the modules that are submitted to the PQP for testing. The factory witness results are documented in a comprehensive report. In addition to other reliability and performance reports, DNV GL downstream partners can have access to the witness reports to gain visibility into the BOM and factory.
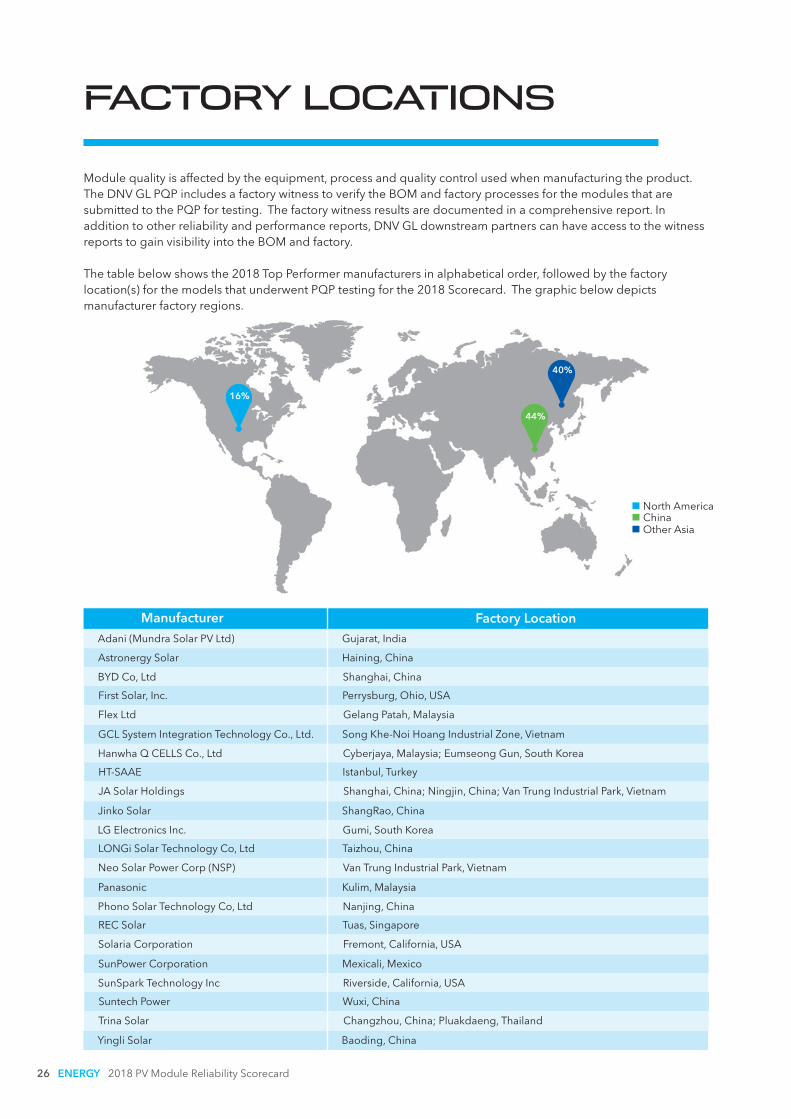
The table below shows the 2018 Top Performer manufacturers in alphabetical order, followed by the factory location(s) for the models that underwent PQP testing for the 2018 Scorecard. The graphic below depicts manufacturer factory regions.
16%
44%
40%
Manufacturer Factory LocationAdani (Mundra Solar PV Ltd) Gujarat, India
Astronergy Solar Haining, China
BYD Co, Ltd Shanghai, China
First Solar, Inc. Perrysburg, Ohio, USA
Flex Ltd Gelang Patah, Malaysia
GCL System Integration Technology Co., Ltd. Song Khe-Noi Hoang Industrial Zone, Vietnam
Hanwha Q CELLS Co., Ltd Cyberjaya, Malaysia; Eumseong Gun, South Korea
HT-SAAE Istanbul, Turkey
JA Solar Holdings Shanghai, China; Ningjin, China; Van Trung Industrial Park, Vietnam
Jinko Solar ShangRao, China
LG Electronics Inc. Gumi, South Korea
LONGi Solar Technology Co, Ltd Taizhou, China
Neo Solar Power Corp (NSP) Van Trung Industrial Park, Vietnam
Panasonic Kulim, Malaysia
Phono Solar Technology Co, Ltd Nanjing, China
REC Solar Tuas, Singapore
Solaria Corporation Fremont, California, USA
SunPower Corporation Mexicali, Mexico
SunSpark Technology Inc Riverside, California, USA
Suntech Power Wuxi, China
Trina Solar Changzhou, China; Pluakdaeng, Thailand
Yingli Solar Baoding, China
ChinaOther Asia
North America
FACTORY LOCATIONS
Artificial intelligence ENERGY 272018 PV Module Reliability Scorecard ENERGY 27
Jinko Solar
Trina Solar
Yingli Solar
THE HISTORICAL SCORECARD
Astronergy Solar
Hanwha Q CELLS Co., Ltd
JA Solar Holdings
REC Solar
BYD Co, Ltd
Flex Ltd
LONGi Solar Technology Co, Ltd
Neo Solar Power Corporation (NSP)
Phono Solar Technology Co, Ltd
Solaria Corporation
SunPower Corporation
SunSpark Technology, Inc
Suntech Power
Adani (Mundra Solar PV Ltd)
First Solar, Inc
HT-SAAE
LG Electronics, Inc
Panasonic
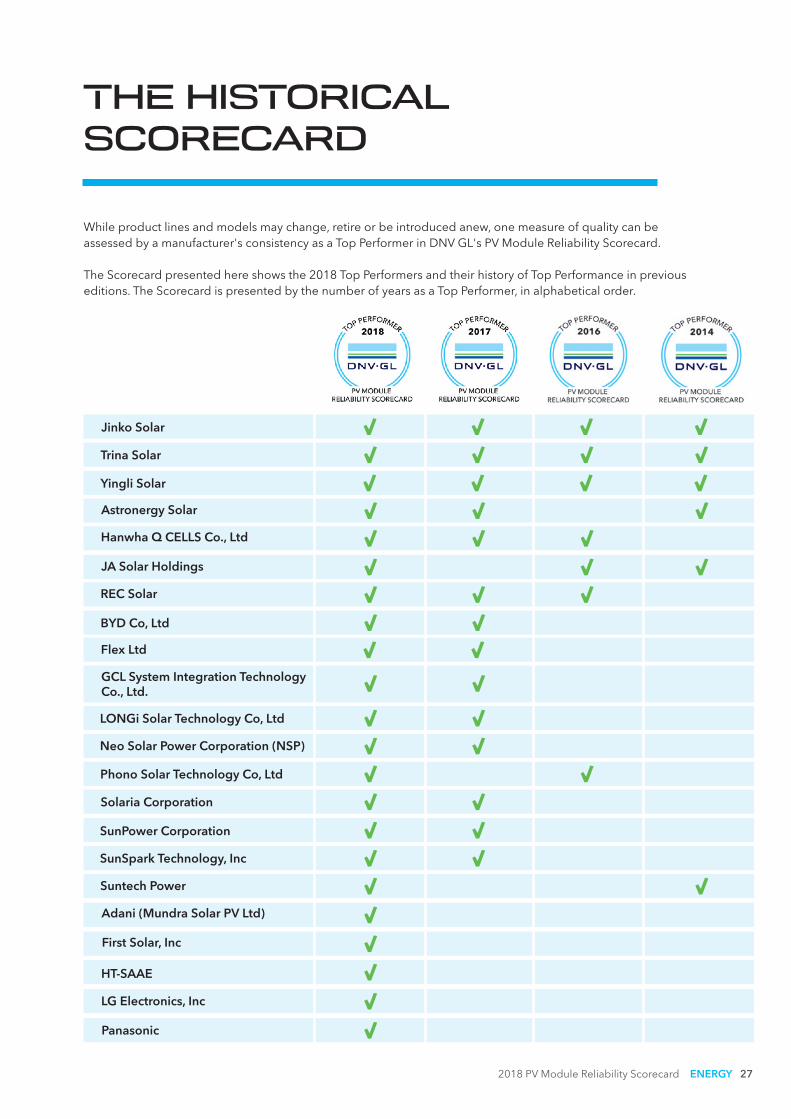
While product lines and models may change, retire or be introduced anew, one measure of quality can be assessed by a manufacturer's consistency as a Top Performer in DNV GL's PV Module Reliability Scorecard. The Scorecard presented here shows the 2018 Top Performers and their history of Top Performance in previous editions. The Scorecard is presented by the number of years as a Top Performer, in alphabetical order.
GCL System Integration Technology Co., Ltd.
DNV GL BEST PRACTICES
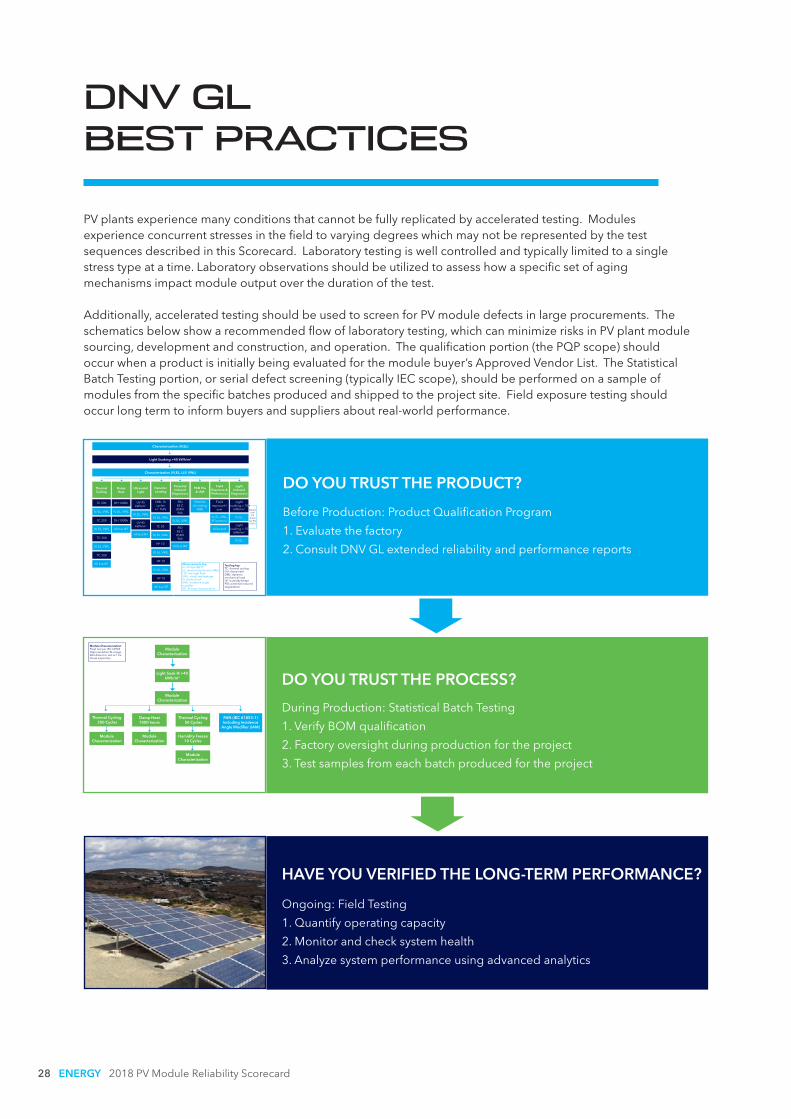
PV plants experience many conditions that cannot be fully replicated by accelerated testing. Modules experience concurrent stresses in the field to varying degrees which may not be represented by the test sequences described in this Scorecard. Laboratory testing is well controlled and typically limited to a single stress type at a time. Laboratory observations should be utilized to assess how a specific set of aging mechanisms impact module output over the duration of the test.
Additionally, accelerated testing should be used to screen for PV module defects in large procurements. The schematics below show a recommended flow of laboratory testing, which can minimize risks in PV plant module sourcing, development and construction, and operation. The qualification portion (the PQP scope) should occur when a product is initially being evaluated for the module buyer’s Approved Vendor List. The Statistical Batch Testing portion, or serial defect screening (typically IEC scope), should be performed on a sample of modules from the specific batches produced and shipped to the project site. Field exposure testing should occur long term to inform buyers and suppliers about real-world performance.
28 ENERGY 2018 PV Module Reliability Scorecard
Before Production: Product Qualification Program
1. Evaluate the factory
2. Consult DNV GL extended reliability and performance reports
DO YOU TRUST THE PRODUCT?
During Production: Statistical Batch Testing
1. Verify BOM qualification
2. Factory oversight during production for the project
3. Test samples from each batch produced for the project
DO YOU TRUST THE PROCESS?
Ongoing: Field Testing
1. Quantify operating capacity
2. Monitor and check system health
3. Analyze system performance using advanced analytics
HAVE YOU VERIFIED THE LONG-TERM PERFORMANCE?
Characterization (IV,EL)
Light Soaking >40 kWh/m2
Characterization (IV,EL, LLF, VWL)
Thermal Cycling
Damp Heat
Ultraviolet Light
Dynamic Loading
PotentialInduced
Degradation
Field Exposure & Performance
Light Induced
Degradation
TC 200 DH 1000h UV 45 kWh/m2
DML 1k cycles
+/- 1kPa
PID 85 C 85RH 96h
Field exposure1
year
Light soaking > 10
kWh/m2
IV, EL, VWL IV, EL, VWLIV, EL, VWL
IV, EL, VWLIV, EL, VWL
IV, EL, VWL, IRTquarterly
IV, EL
PAN File & IAM
PAN file (including
IAM)
TC 200 DH 1000h
All but IRTIV, EL, VWL
TC 200
IV, EL, VWL
TC 200
All but IRT
UV 45 kWh/m2
All but IRT
TC 50
IV, EL, VWL
HF 10
IV, EL, VWL
HF 10
IV, EL, VWL
HF 10
All but IRT
PID 85 C 85RH 96h
All but IRT
All at endLight
soaking > 10 kWh/m2
IV, EL
Measurements key: IV: IV Flash @STCEL: electroluminescence @IscLLF: low-light flash VWL: visual, wet leakageD: diode checkIAM: incidence angle modifier IRT: IR temp measurement
Test leg key:TC: thermal cyclingDH: damp heatDML: dynamic mechanical loadHF: humidity freezePID: potential induced degradation
Repeat until 1%
stable per IEC 61215
Module Characterization
Module Characterization
Light Soak @ >40 kWh/m2
Damp Heat 1000 hours
Thermal Cycling 50 Cycles
Thermal Cycling 200 Cycles
PAN (IEC 61853-1) Including Incidence
Angle Modifier (IAM)
Module Characterization
Module Characterization
Humidity Freeze 10 Cycles
Module Characterization
Module Characterization:Flash test per IEC 60904 High resolution EL image Wet dielectric test at 1 kV Visual inspection
2018 PV Module Reliability Scorecard ENERGY 29
DO YOU TRUST THE PRODUCT?
DO YOU TRUST THE PROCESS?
HAVE YOU VERIFIED THE LONG-TERM PERFORMANCE?
CONCLUSION
Product Qualification Program Defines QualityFull-life field performance data for modules requires at least 20 years of operation. Module warranty claims, when available and successful, typically only occur for extreme underperformance or defects that can be seen visually. Additionally, most module warranties only cover the replacement module costs and not the associated labor. DNV GL’s Product Qualification Program combined with project-level Statistical Batch Testing and Field Testing provide the global market with necessary analytics and due diligence to ensure that the sourced products have undergone stringent quality checks throughout the project lifecycle. PQP test results provide insight into how vendors, modules, BOMs, and factories compare with one another across a set of controlled accelerated test sequences targeting failure mechanisms encountered in the field.
Scorecard Guides IndustryIn its fourth year of publication, the PV Module Reliability Scorecard remains the leading guide to PV module reliability and performance. With its supplier-specific performance analysis, the Scorecard can help investors and developers generate quality-backed procurement strategies to ensure long-term project viability.
DNV GL generally recommends choosing vendors with lower degradation levels as this increases the likelihood of technical and financial success of the project. However, this evaluation should be based on the PQP test results of the specific model type, BOM, and factory location where the module was produced. DNV GL supports downstream stakeholders by providing this detailed information upon request.
DNV GL is your Trusted Partner With more than 1,000 renewable energy experts located globally, DNV GL is the world's largest independent energy & renewable advisory firm. DNV GL’s Energy Laboratory Services group provides the market unmatched services and expertise to help manufacturers make better products, help buyers make informed procurement decisions and illuminate market and supplier trends in photovoltaics.
Contact DNV GL if you wish to become a downstream partner or a manufacturer participant in the PQP.
Every major variant of a PV module entering the global solar industry in significant quantity should go through stringent reliability and performance testing so we ensure safety, prevent latent defects from undermining investment targets and generally protect our growing reliance on solar power infrastructure.
Jonathan Previtali, Director of Technology & Technical Services, Wells Fargo (one of the largest financers of renewable energy in the U.S., with more than $5 billion in solar and wind project investments)
30 ENERGY 2018 PV Module Reliability Scorecard
IMPORTANT NOTICE AND DISCLAIMER This document (“Report”) has been produced by DNV GL PVEL LLC (“DNV GL”) from information relating to dates and periods referred to herein. This document does not imply that any information is not subject to change. To the extent permitted by law, neither DNV GL nor any affiliate company (the "Group") assumes any responsibility whether in contract, tort or otherwise for use of the Report. This document is a summary and must be read in its entirety and is subject to any assumptions and qualifications expressed therein. This Report may contain detailed technical data which is intended for use only by persons possessing requisite expertise in its subject matter. Nothing in this Report is intended to confer upon any entity other than the Group any benefit and use of this document is at the user's sole risk. The trademark DNV GL is the property of DNV GL AS. This document is protected by copyright.
2018 PV Module Reliability Scorecard ENERGY 31
SAFER, SMARTER, GREENER
About DNV GLDNV GL is a global quality assurance and risk management company. Driven by our purpose of safeguarding life, property and the environment, we enable our customers to advance the safety and sustainability of their business. We provide classification, technical assurance, software and independent expert advisory services to the maritime, oil & gas, power and renewables industries. We also provide certification, supply chain and data management services to customers across a wide range of industries. Operating in more than 100 countries, our experts are dedicated to helping customers make the world safer, smarter and greener.
In the power and renewables industryDNV GL delivers world-renowned testing and advisory services to the energy value chain including renewables and energy management. Our expertise spans onshore and offshore wind power, solar, conventional generation, transmission and distribution, smart grids, and sustainable energy use, as well as energy markets and regulations. Our experts support customers around the globe in delivering a safe, reliable, efficient, and sustainable energy supply.
DNV GL - EnergyUtrechtseweg 310-B506812 AR Arnhem The NetherlandsTel: +31 26 356 9111Email: [email protected]
The trademarks DNV GL and the Horizon Graphic are the property of DNV GL AS. All rights reserved. This publication or parts thereof may not be reproduced or transmitted in any form or by any means, including photocopying or recording, without the prior written consent of DNV GL.
©DNV GL 05/2018