energy outlook 2035_presentation
TRANSCRIPT

© BP p.l.c. 2015
17th
February 2015
BP Energy Outlook 2035
bp.com/energyoutlook
#BPstats
© BP p.l.c. 2015
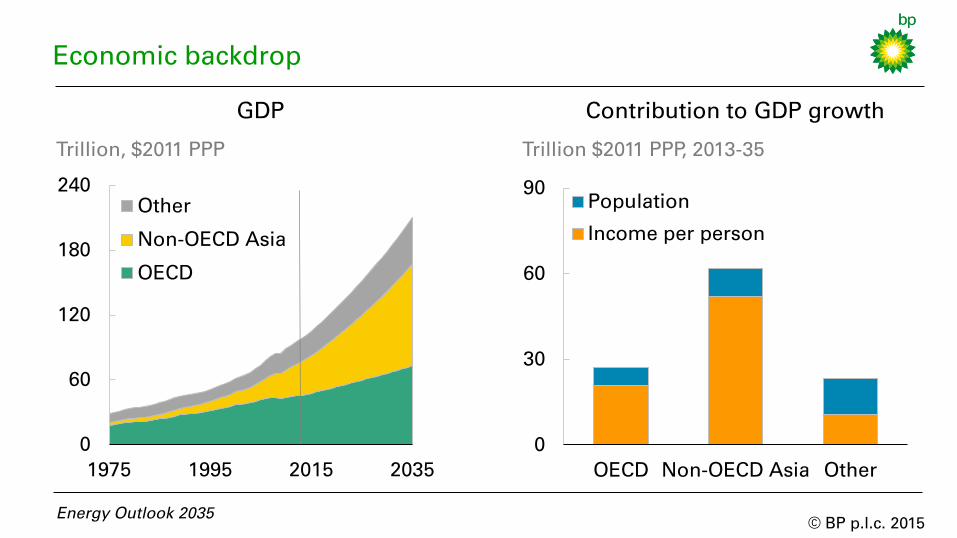
0
30
60
90
OECD Non-OECD Asia Other
Population
Income per person
0
60
120
180
240
1975 1995 2015 2035
Other
Non-OECD Asia
OECD
Trillion, $2011 PPP
GDP
Economic backdrop
Contribution to GDP growth
Energy Outlook 2035
Trillion $2011 PPP, 2013-35
© BP p.l.c. 2015
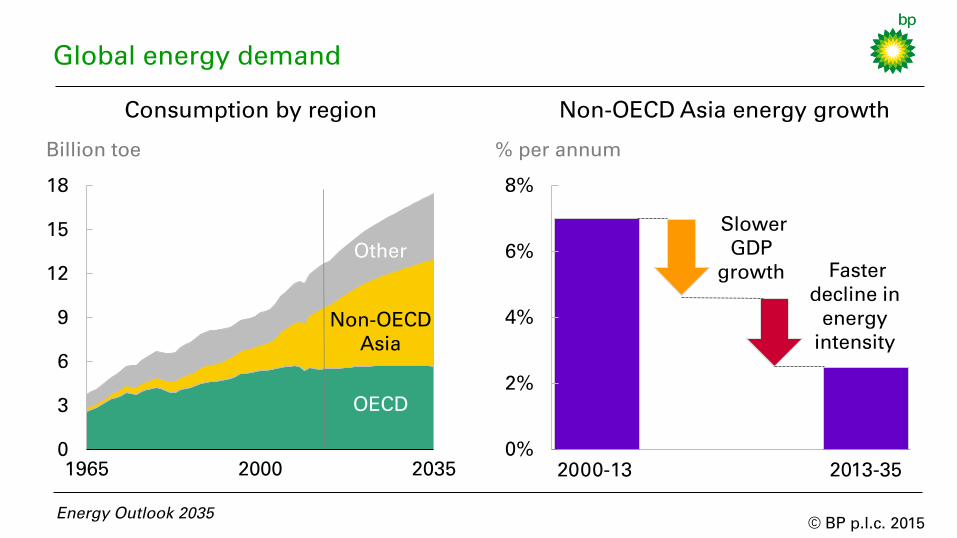
0%
2%
4%
6%
8%
Global energy demand
Billion toe
Consumption by region
0
3
6
9
12
15
18
1965 2000 2035
Energy Outlook 2035
% per annum
Non-OECD Asia energy growth
2000-13
Slower
GDP
growth
2013-35
Faster
decline in
energy
intensity
Other
Non-OECD
Asia
OECD
© BP p.l.c. 2015
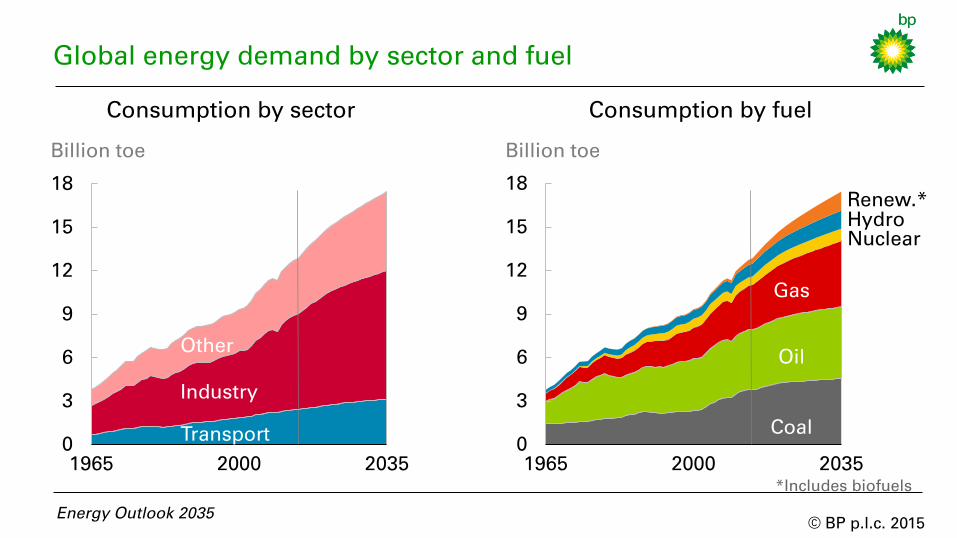
Global energy demand by sector and fuel
Energy Outlook 2035
Billion toe
Consumption by sector
Consumption by fuel
Billion toe
0
3
6
9
12
15
18
1965 2000 2035
Transport
Other
Industry
0
3
6
9
12
15
18
1965 2000 2035
Th
ou
sa
nd
s
Oil
Gas
Coal
Hydro
Nuclear
Renew.*
*Includes biofuels
© BP p.l.c. 2015
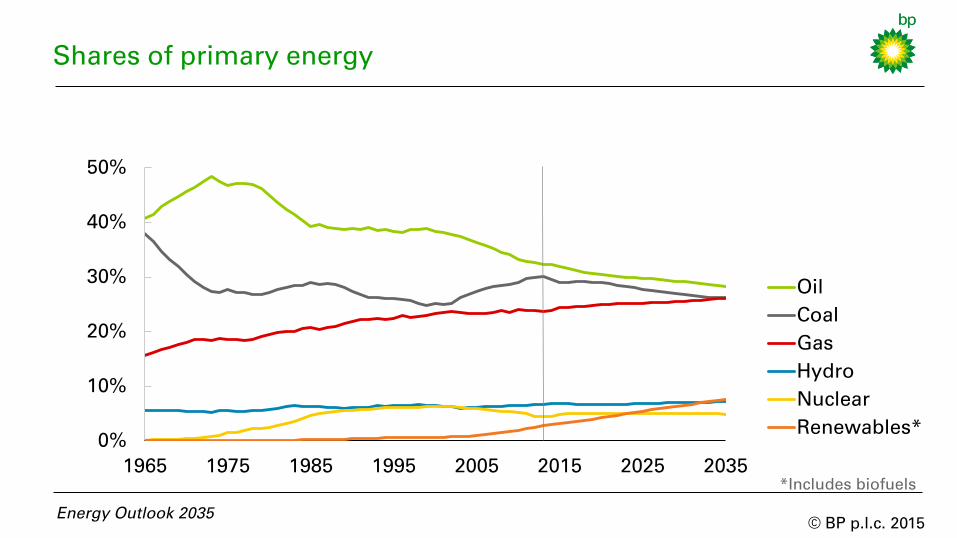
0%
10%
20%
30%
40%
50%
1965 1975 1985 1995 2005 2015 2025 2035
Oil
Coal
Gas
Hydro
Nuclear
Renewables*
Shares of primary energy
Energy Outlook 2035
*Includes biofuels
© BP p.l.c. 2015
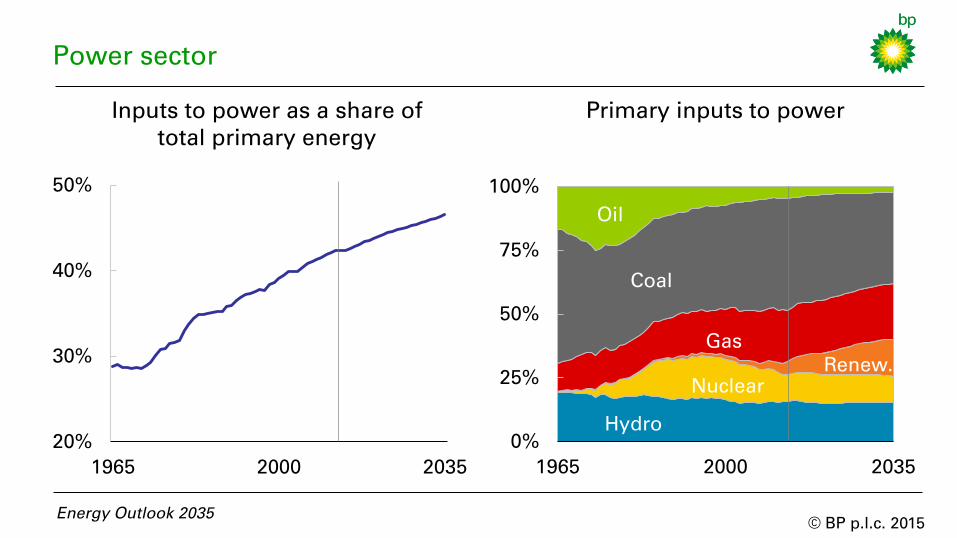
Power sector
0%
25%
50%
75%
100%
1965 2000 2035
Inputs to power as a share of
total primary energy
Primary inputs to power
20%
30%
40%
50%
1965 2000 2035
Energy Outlook 2035
Coal
Gas
Oil
Hydro
Nuclear
Renew.
© BP p.l.c. 2015
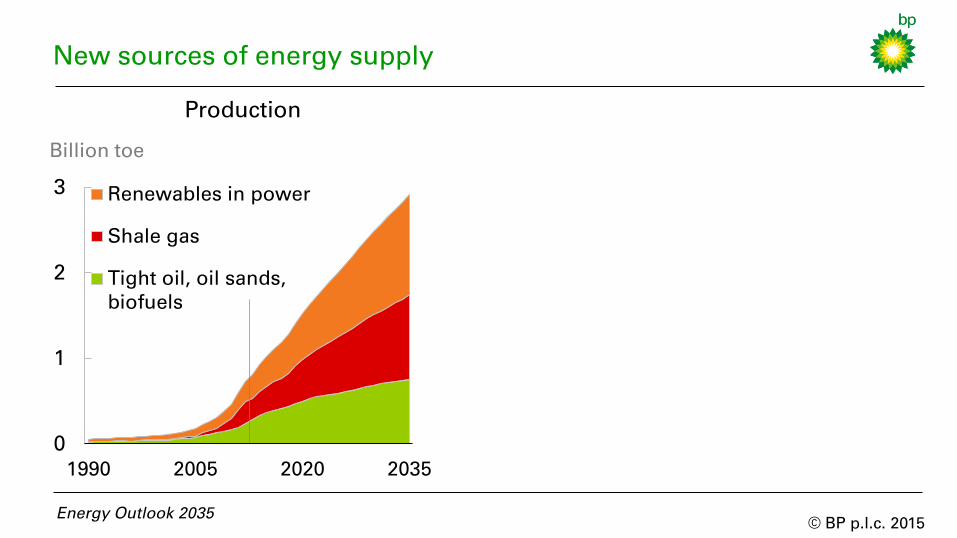
New sources of energy supply
Energy Outlook 2035
0
1
2
3
1990 2005 2020 2035
Renewables in power
Shale gas
Tight oil, oil sands,
biofuels
Production
Billion toe

© BP p.l.c. 2015
0 20 40 60
Middle East
Europe & Eurasia
Africa
S & C America
North America
Asia Pacific
Tight oil
Shale gas
New sources of energy supply
Energy Outlook 2035
0
1
2
3
1990 2005 2020 2035
Renewables in power
Shale gas
Tight oil, oil sands,
biofuels
Billion toe Billion toe
Technically recoverable resources
Source: © OECD/IEA 2014
Production
© BP p.l.c. 2015
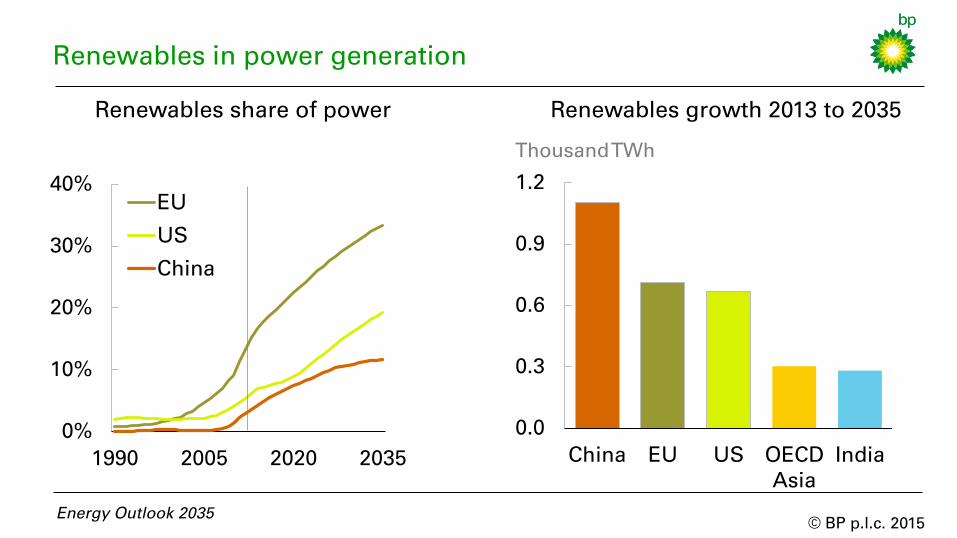
Renewables in power generation
Energy Outlook 2035
Renewables share of power
0%
10%
20%
30%
40%
1990 2005 2020 2035
EU
US
China
0.0
0.3
0.6
0.9
1.2
China EU US OECD
Asia
India
Renewables growth 2013 to 2035
Thousand TWh
© BP p.l.c. 2015
Oil and other liquid fuels
Energy Outlook 2035
© BP p.l.c. 2015
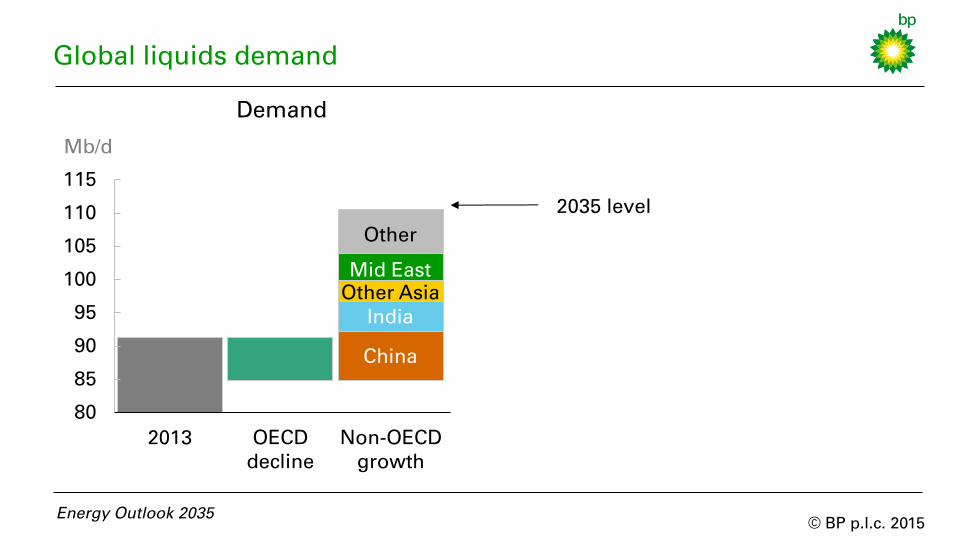
Global liquids demand
Mb/d
Energy Outlook 2035
80
85
90
95
100
105
110
115
2013 OECD
decline
Non-OECD
growth
2013 Non-OPEC
growth
OPEC
growth
India
Mid East
China
NGLs*
Crude
Other
Other Asia
2035 level
North
America
Other
Demand Supply
2035 level
© BP p.l.c. 2015
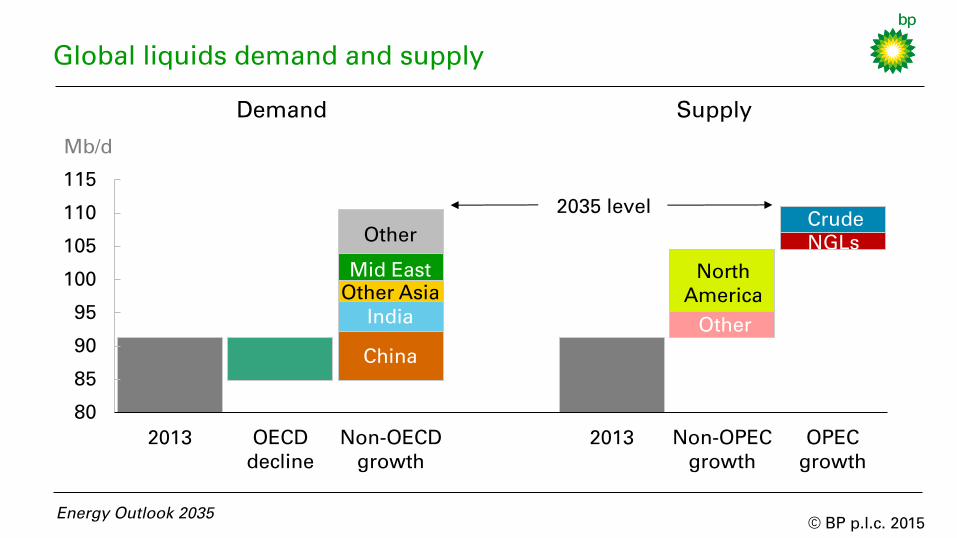
Global liquids demand and supply
Mb/d
Energy Outlook 2035
80
85
90
95
100
105
110
115
2013 OECD
decline
Non-OECD
growth
2013 Non-OPEC
growth
OPEC
growth
India
Mid East
China
NGLs
Crude
Other
Other Asia
2035 level
North
America
Other
Demand Supply
© BP p.l.c. 2015
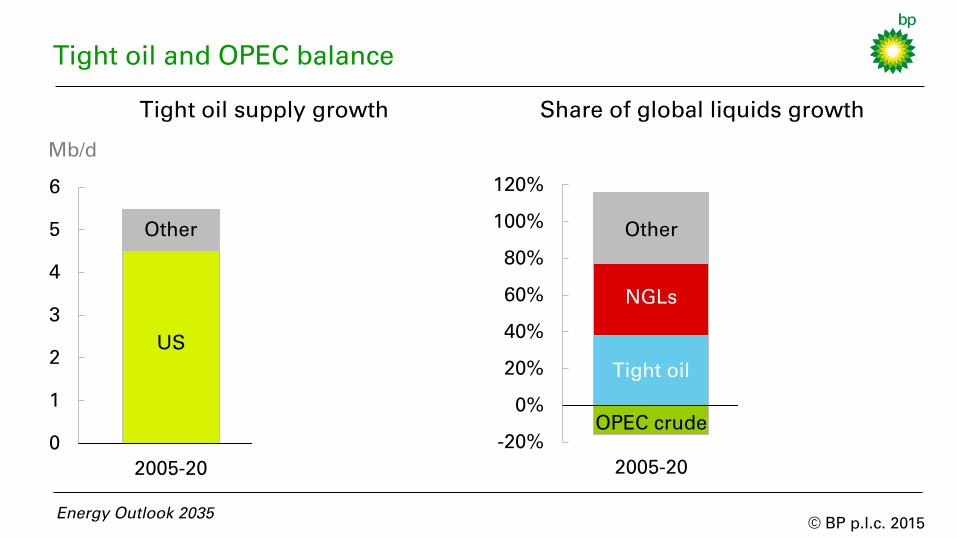
Tight oil and OPEC balance
0
1
2
3
4
5
6
2005-20 2020-35
Russia
S & C America
China
Canada & Mexico
US
US
Other
Tight oil supply growth
Mb/d
-20%
0%
20%
40%
60%
80%
100%
120%
2005-20 2020-35
Share of global liquids growth
Energy Outlook 2035
Other
NGLs
Tight oil
OPEC crude

© BP p.l.c. 2015
Tight oil and OPEC balance
0
1
2
3
4
5
6
2005-20 2020-35
Russia
S & C America
China
Canada & Mexico
US
US
Other
Tight oil supply growth
Mb/d
-20%
0%
20%
40%
60%
80%
100%
120%
2005-20 2020-35
Share of global liquids growth
Energy Outlook 2035
Other
NGLs
Tight oil
OPEC crude
© BP p.l.c. 2015
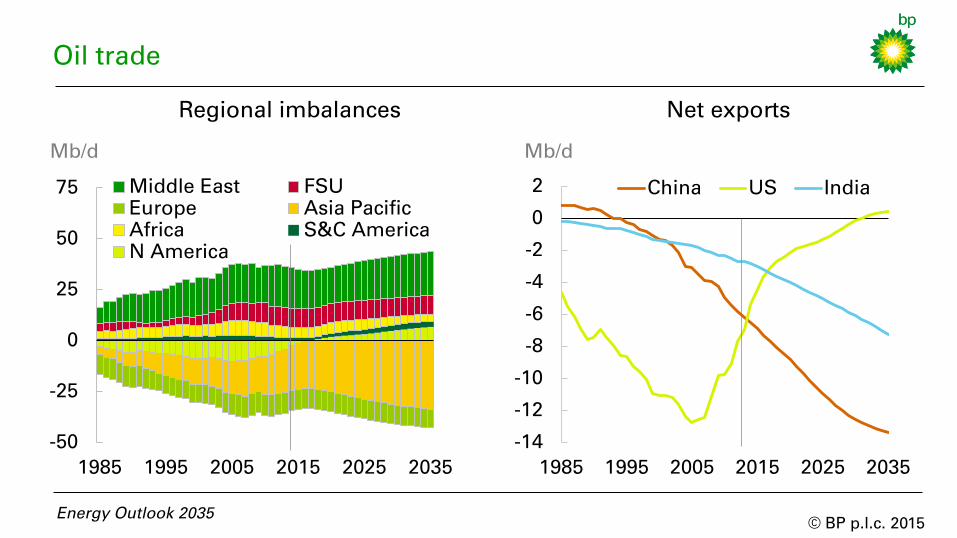
-14
-12
-10
-8
-6
-4
-2
0
2
1985 1995 2005 2015 2025 2035
China US India
Oil trade
Energy Outlook 2035
Mb/d
Net exports
-50
-25
0
25
50
75
1985 1995 2005 2015 2025 2035
Middle East FSU
Europe Asia Pacific
Africa S&C America
N America
Regional imbalances
Mb/d
© BP p.l.c. 2015
Natural gas
Energy Outlook 2035
© BP p.l.c. 2015
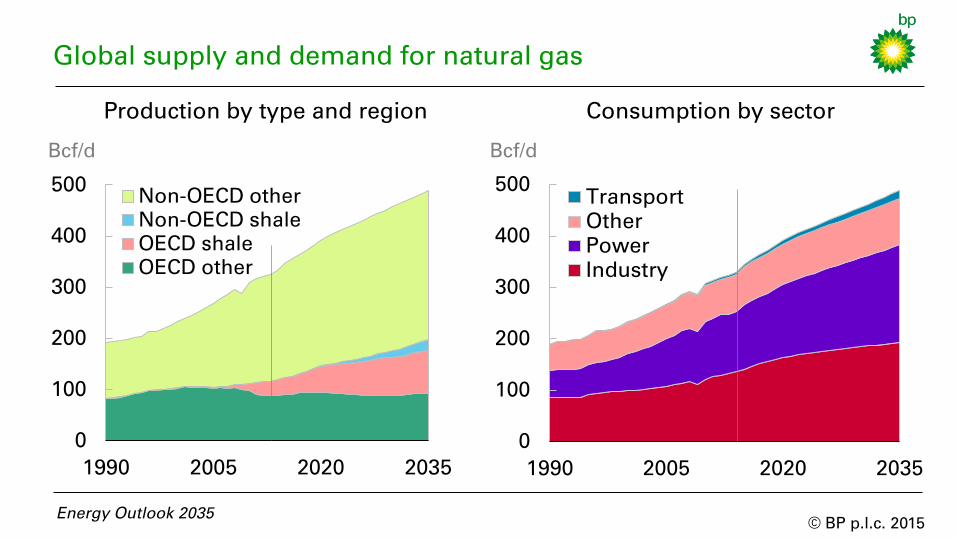
0
100
200
300
400
500
1990 2005 2020 2035
Non-OECD other
Non-OECD shale
OECD shale
OECD other
Energy Outlook 2035
Production by type and region
Bcf/d
0
100
200
300
400
500
1990 2005 2020 2035
Transport
Other
Power
Industry
Consumption by sector
Bcf/d
Global supply and demand for natural gas
© BP p.l.c. 2015
Energy Outlook 2035
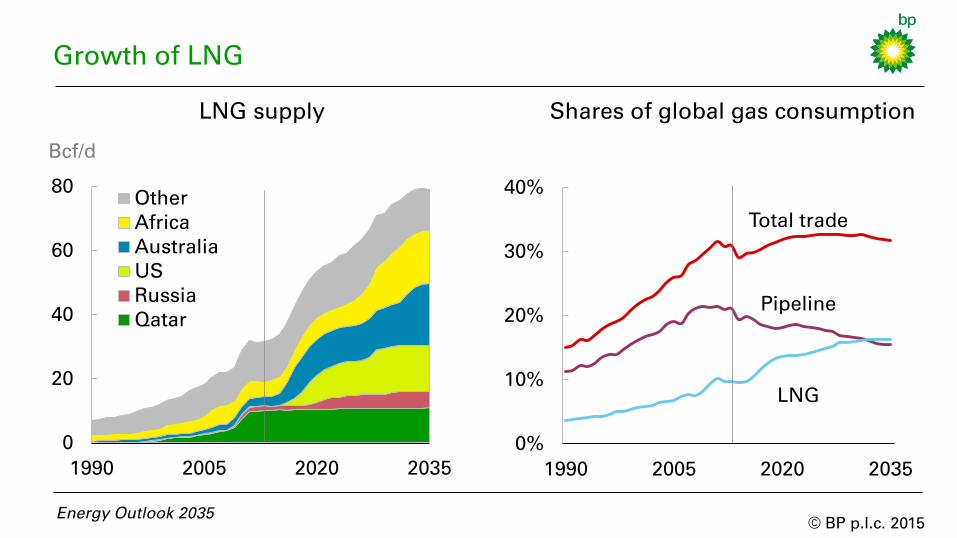
Bcf/d
LNG supply
0
20
40
60
80
1990 2005 2020 2035
Other
Africa
Australia
US
Russia
Qatar
0%
10%
20%
30%
40%
1990 2005 2020 2035
Total trade
Pipeline
LNG
Shares of global gas consumption
Growth of LNG
© BP p.l.c. 2015
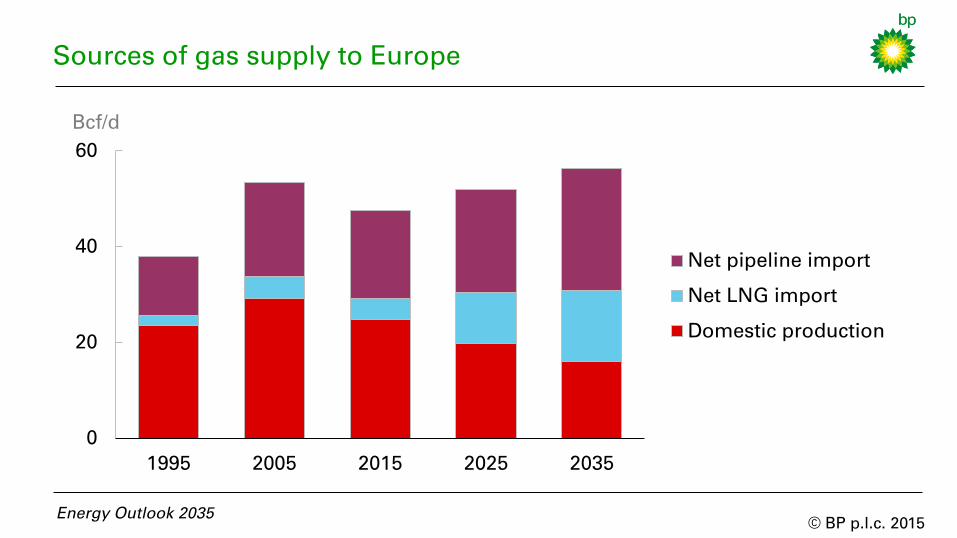
Sources of gas supply to Europe
Bcf/d
Energy Outlook 2035
0
20
40
60
1995 2005 2015 2025 2035
Net pipeline import
Net LNG import
Domestic production
© BP p.l.c. 2015
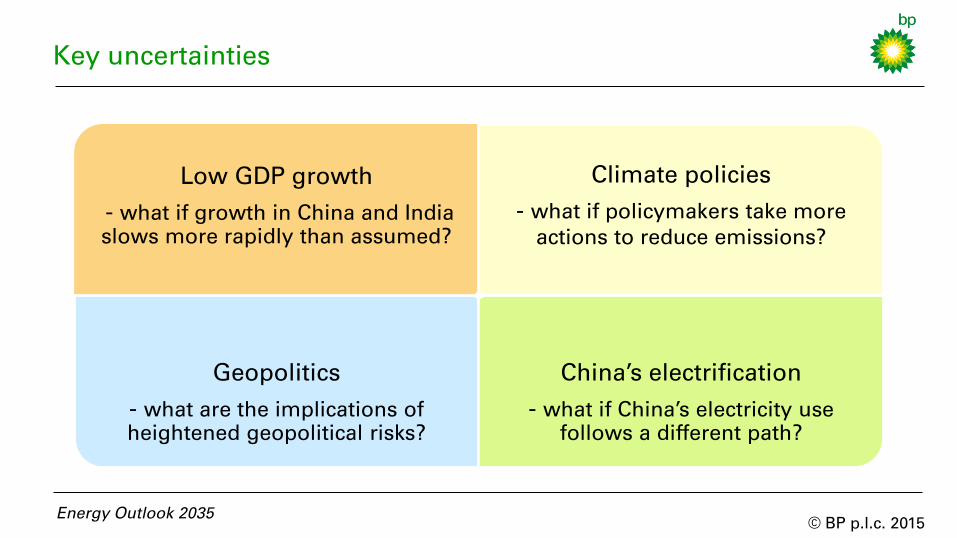
Low GDP growth
- what if growth in China and India
slows more rapidly than assumed?
Climate policies
- what if policymakers take more
actions to reduce emissions?
Geopolitics
- what are the implications of
heightened geopolitical risks?
China’s electrification
- what if China’s electricity use
follows a different path?
Key uncertainties
Energy Outlook 2035
© BP p.l.c. 2015
Low GDP growth
what if growth in China and India
slows more rapidly than assumed?
Energy Outlook 2035
© BP p.l.c. 2015
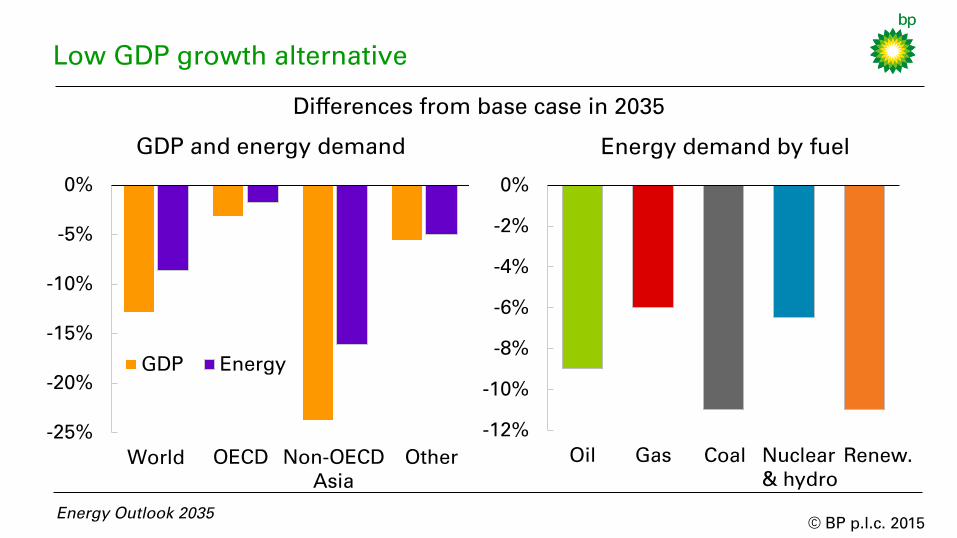
-25%
-20%
-15%
-10%
-5%
0%
World
GDP Energy
Low GDP growth alternative
Energy Outlook 2035
OECD
GDP and energy demand
Other
-12%
-10%
-8%
-6%
-4%
-2%
0%
Oil Gas
Energy demand by fuel
Nuclear
& hydro
Renew. Coal Non-OECD
Asia
Differences from base case in 2035
© BP p.l.c. 2015
Climate policies
what if policymakers take more
actions to reduce emissions?
Energy Outlook 2035

© BP p.l.c. 2015
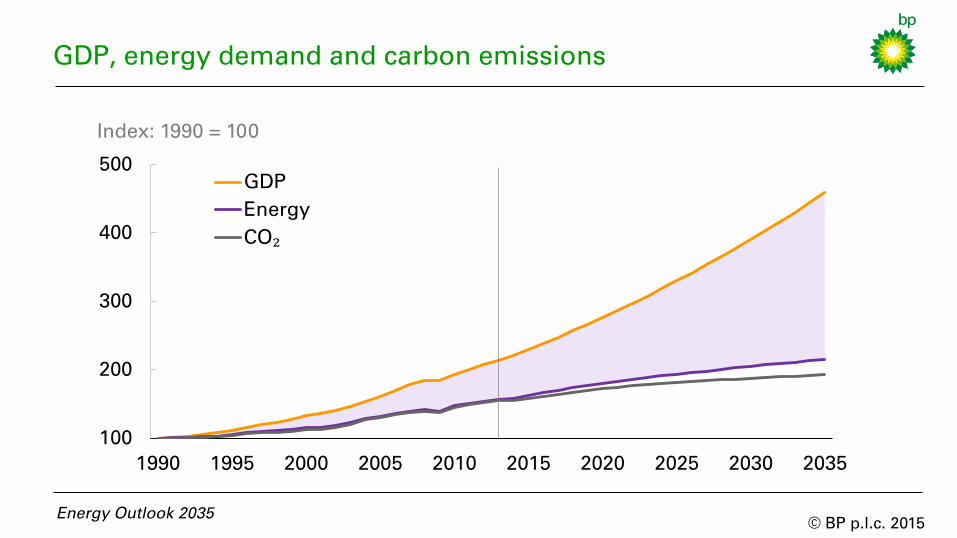
GDP, energy demand and carbon emissions
100
200
300
400
500
1990 1995 2000 2005 2010 2015 2020 2025 2030 2035
GDP
Energy
CO₂
Index: 1990 = 100
Energy Outlook 2035
© BP p.l.c. 2015
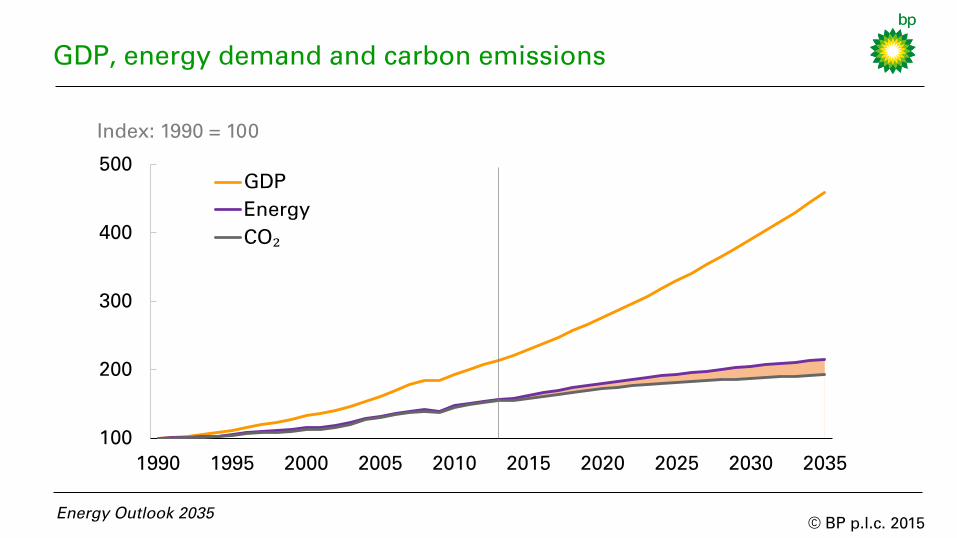
GDP, energy demand and carbon emissions
100
200
300
400
500
1990 1995 2000 2005 2010 2015 2020 2025 2030 2035
GDP
Energy
CO₂
Index: 1990 = 100
Energy Outlook 2035
© BP p.l.c. 2015
GDP, energy demand and carbon emissions
100
200
300
400
500
1990 1995 2000 2005 2010 2015 2020 2025 2030 2035
GDP
Energy
CO₂
Index: 1990 = 100
Energy Outlook 2035
© BP p.l.c. 2015
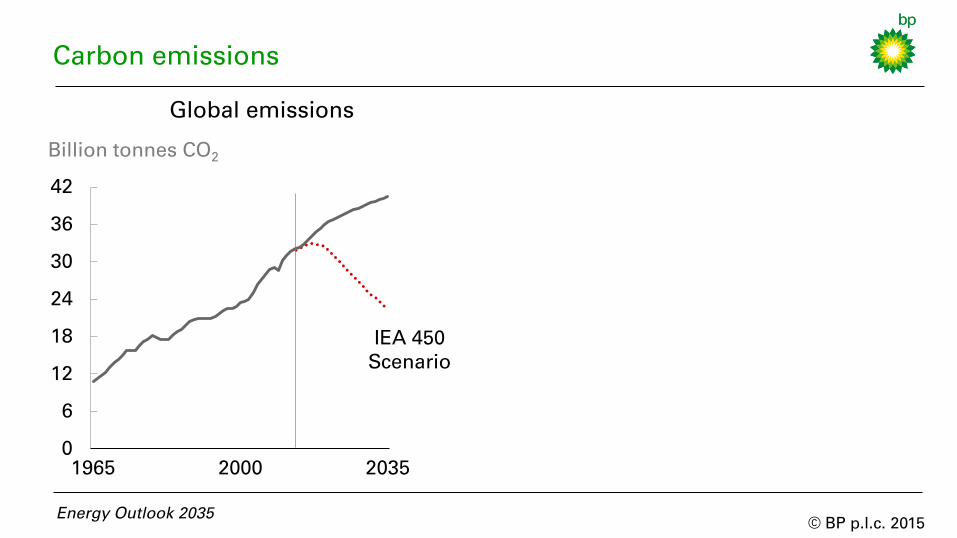
Carbon emissions
Options that achieve equal CO2
emissions reductions* Billion tonnes CO
2
Global emissions
0
6
12
18
24
30
36
42
1965 2000 2035
IEA 450
Scenario
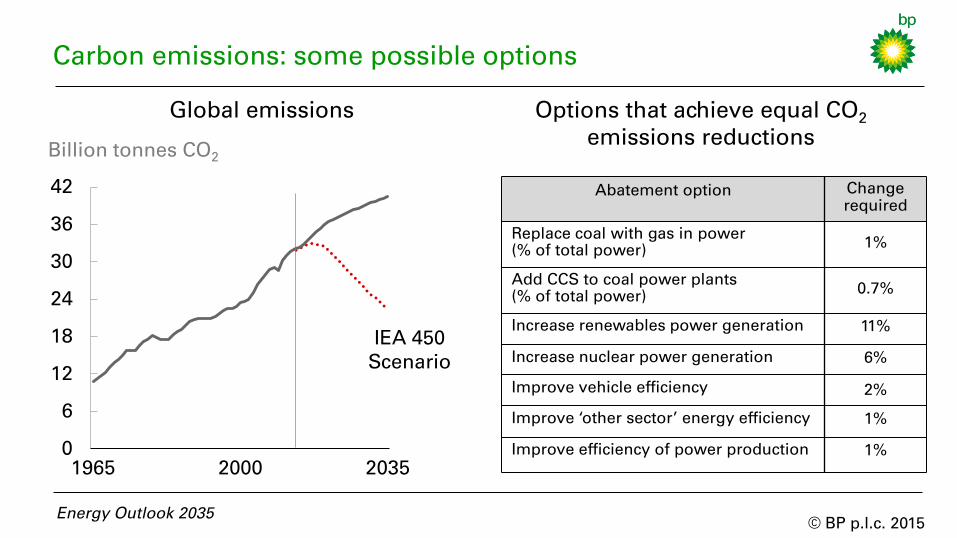
Abatement option Change
required
Replace coal with gas in power
(% of total power) 1%
Add CCS to coal power plants
(% of total power) 0.7%
Increase renewables power generation 11%
Increase nuclear power generation 6%
Improve vehicle efficiency 2%
Improve ‘other sector’ energy efficiency 1%
Improve efficiency of power production 1%
* Normalised for a 1% swing in the coal/gas mix in power generation,
equivalent to 110 Mt CO2. Estimates are based on energy shares in 2013.
Energy Outlook 2035
© BP p.l.c. 2015
Carbon emissions: some possible options
Options that achieve equal CO2
emissions reductions Billion tonnes CO
2
Global emissions
0
6
12
18
24
30
36
42
1965 2000 2035
IEA 450
Scenario
Abatement option Change
required
Replace coal with gas in power
(% of total power) 1%
Add CCS to coal power plants
(% of total power) 0.7%
Increase renewables power generation 11%
Increase nuclear power generation 6%
Improve vehicle efficiency 2%
Improve ‘other sector’ energy efficiency 1%
Improve efficiency of power production 1%
Energy Outlook 2035
© BP p.l.c. 2015
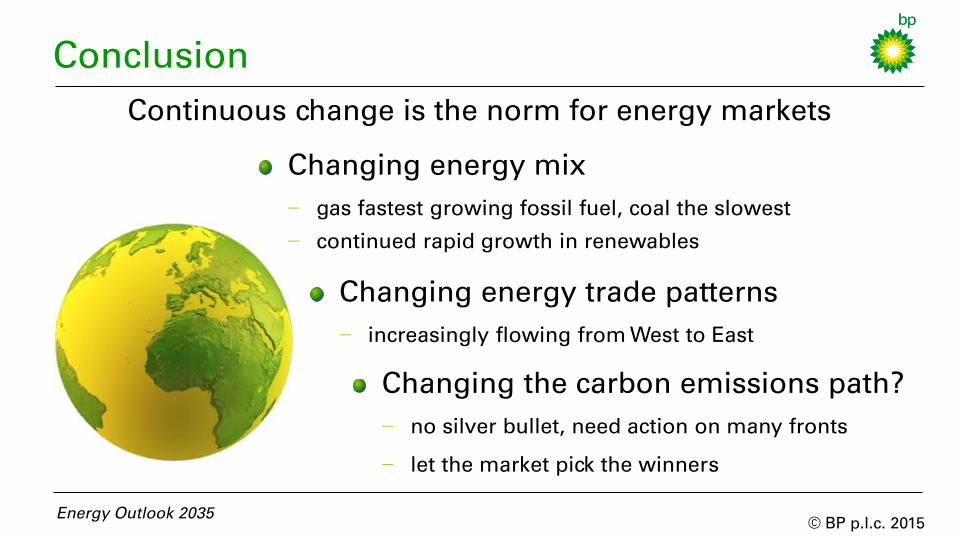
Conclusion
Energy Outlook 2035
Changing energy mix
− gas fastest growing fossil fuel, coal the slowest
− continued rapid growth in renewables
Continuous change is the norm for energy markets
Changing energy trade patterns
− increasingly flowing from West to East
Changing the carbon emissions path?
− no silver bullet, need action on many fronts
− let the market pick the winners
© BP p.l.c. 2015
17th
February 2015
BP Energy Outlook 2035
bp.com/energyoutlook
#BPstats