evaluation study of pradhan mantri gram sadak yojana
TRANSCRIPT

Evaluation study
of
Pradhan Mantri Gram Sadak Yojana (PMGSY)
in Maharashtra State
Study Conducted by
Centre for Technology Alternatives for Rural Areas (CTARA),
Indian Institute of Technology Bombay,
Powai, Mumbai – 400076
For
Directorate of Economics and Statistics,
Planning Department,
Government of Maharashtra
October 2017

Acknowledgement
The success and final outcome of this study required a lot of guidance and assistance from
many people and we are extremely privileged to have got this all along the completion of the
evaluation study.
We would first like to thank Planning Department, Maharashtra, MRRDA, and DES for giving
us an opportunity to take up this study and for their valuable guidance and for the support in
all difficulties faced during the course of completion of the project work.
We would also like to thank Mr. Sohole, Director, DES (Retired), Mr. R.R. Shinge, Director,
DES, Mr. Sarnaik, Former Additional Director, Mr. V. Aher, Additional Director, DES, Mr. S.
V. Muley, Asst. Director, DES, and Mr. Pandit, DES.
We are also thankful to Mr. Naik, CEO, MRRDA, Mr. Uphale CE, PMGSY, Mr. Shafee Jamal,
IT Nodal Officer, for providing necessary information and timely support during the evaluation
study.
We would not forget to thank all the DPIUs for the heartily welcome they had given at the time
of visit to their respective district and all the support in carrying out the survey. Mr. Peshave
(EE, PMGSY, Ahmednagar), Mr. Maske (SE, Ahmednagar), Mr. Biradar (EE, Parbhani), Mr.
Bande (DE, Parbhani), Mr. Jawanjal (EE, Yavatmal), Mr. Gupta (DE, Yavatmal), Mr. DPIU
Bhandara, Mr. Shelake (EE, Kolhapur), Mr. Gaikdwad (DE, Kolhapur), Mrs. Kalbar (DE,
Kolhapur), Mr. Muley (EE, Ratnagiri), Mr.Dhudhe (EE, Palghar), Mr. Vinod Gholap (JE
Palghar, Mr. Kishor Nalawade (JE, Palghar).
Finally, we would like to thank all who are supported with and without their presence in the
completion of the project work. The team which carried out the work comprise of people
namely Mr. Shahnawaz khan, Mr. Ganesh Raj, Mr. Vijay Bhoir, Mr. Sunil Patil, Mr. Dinesh
Raktate, Mr. Amol Wadje, and Mr. Ranjeet Alandkar with which the detailed field work would
be impossible. The main anchor for this project has been Mr. Meghraj Garad without which
the project would not be completed.
Bakul Rao
Contents
List of Tables .............................................................................................................. vii
List of Figures ............................................................................................................... xi
Abbreviation ............................................................................................................... xix
1 Introduction ...................................................................................................................... 1
1.1 Background .................................................................................................................... 1
1.2 Objectives and Scope ..................................................................................................... 1
1.3 Profile of Maharashtra .................................................................................................. 2
1.4 Transportation Profile of Maharashtra ......................................................................... 6
1.5 Details about PMGSY .................................................................................................... 8
1.6 Methodology of Study .................................................................................................. 10
1.6.1 Methodology for selection of roads for the evaluation study .............................. 10
1.6.2 Methodology for Technical Evaluation ............................................................... 14
1.6.3 Methodology for Physical and Financial Evaluation ........................................... 15
1.6.4 Methodology for Environmental Impact Evaluation ........................................... 16
1.6.5 Methodology for Socio-Economical Evaluation ................................................. 17
1.7 Work Plan .................................................................................................................... 19
1.8 Structure of the Report ................................................................................................. 21
2 Technical Evaluation of PMGSY ................................................................................. 23
2.1 Quality control set up and its implementation ............................................................. 26
2.1.1 Quality Control System........................................................................................ 26
2.1.2 Laboratory set up for quality testing .................................................................... 26
2.1.3 Technical support for PMGSY ............................................................................ 27
2.2 Findings of the study on quality control setup ............................................................. 30
2.3 Technical specification and standards followed by PMGSY ....................................... 31
2.4 Findings of the study on quality monitoring ................................................................ 38
2.5 Actual testing of on-going works ................................................................................. 38
2.6 Findings of the inspections on ongoing roads ............................................................. 39
2.7 Maintenance of roads .................................................................................................. 46
2.8 Findings of study on the completed roads ................................................................... 50
2.9 Condition of pavement ................................................................................................. 50
2.10 Findings of the study on PCI ................................................................................... 56

ii
2.11 SQM and NQM data analysis for performance in quality of construction .............. 57
2.11.1 SQM and NQM data comparison at National Level ........................................ 57
2.11.2 SQM and NQM data comparison at State Level ............................................. 62
2.12 Analysis of SQM and NQM data item-wise ............................................................. 69
2.12.1 SQM Works Item-wise .................................................................................... 69
2.12.2 NQM Works Item-wise.................................................................................... 71
2.13 Meri Sadak android app .......................................................................................... 73
3 Physical Progress and Financial Evaluation of PMGSY............................................ 75
3.1 Coverage under PMGSY in India ................................................................................ 75
3.2 Coverage under PMGSY in Maharashtra.................................................................... 76
3.3 Physical progress at the State Level ............................................................................ 78
3.4 Physical Progress at the District Level ....................................................................... 79
3.5 Financial Performance at the District Level ............................................................... 81
3.6 Expenditure per kilometre of road constructed at State Level .................................... 82
3.7 Financial spending on Long Span Bridges (LSB)........................................................ 85
3.8 Financial spending on Research and Development Project ........................................ 85
3.9 Financial Spending on New connectivity and Upgradation Works ............................. 86
4 Environmental Impact Assessment .............................................................................. 89
4.1 Introduction.................................................................................................................. 89
4.2 Energy usage in different phases of road life .............................................................. 90
4.3 Mid-point indicators. ................................................................................................... 95
4.3.1 Impact on climate change .................................................................................... 95
4.3.2 Impact on Terrestrial Acidification ...................................................................... 96
4.3.3 Marine eutrophication .......................................................................................... 97
4.3.4 Photochemical Oxidant Formation ...................................................................... 98
4.3.5 Particulate Matter Formation ............................................................................... 99
4.3.6 Human toxicity................................................................................................... 100
4.3.7 Marine Ecotoxicity............................................................................................. 101
4.3.8 Water Usage and Water Depletion .................................................................... 102
4.3.9 Fossil depletion .................................................................................................. 103
5 Socioeconomic Evaluation of PMGSY ....................................................................... 105
5.1 Introduction................................................................................................................ 105
5.2 Methodology .............................................................................................................. 105

iii
5.3 Stakeholders involved in PMGSY .............................................................................. 106
5.4 Sampling .................................................................................................................... 106
5.5 Sector and Indicator Framework ............................................................................... 106
5.6 Socioeconomic evaluation at State Level ................................................................... 108
5.6.1 Sample Size ........................................................................................................ 108
5.6.2 Impact on Transport sector ................................................................................ 110
5.6.3 Impact on Health Sector..................................................................................... 115
5.6.4 Impact on Education Sector ............................................................................... 119
5.6.5 Impact on Agricultural Sector ............................................................................ 122
5.6.6 Impact on Finance Sector ................................................................................... 125
5.6.7 Impact on Migration .......................................................................................... 127
5.6.8 Impact on Living ................................................................................................ 128
5.7 Socioeconomic Evaluation at District Level .............................................................. 129
5.7.1 Profile of Ahmednagar District .......................................................................... 129
5.7.2 Sample Size for Ahmednagar District ............................................................... 130
5.7.3 Impact on Transport Sector in Ahmednagar District ......................................... 132
5.7.4 Impact on Health Sector in Ahmednagar District .............................................. 136
5.7.5 Impact on Education Sector in Ahmednagar District ........................................ 138
5.7.6 Impact on Agriculture in Ahmednagar District ................................................. 140
5.7.7 Impact on Finance Sector in Ahmednagar District ............................................ 143
5.7.8 Impact on Migration in Ahmednagar District .................................................... 144
5.7.9 Impact on Living in Ahmednagar District ......................................................... 145
5.7.10 Profile of Parbhani District ............................................................................ 146
5.7.11 Sample Size .................................................................................................... 147
5.7.12 Impact on Transport Sector in Parbhani District ........................................... 149
5.7.13 Impact on Health Sector in Parbhani District ................................................ 152
5.7.14 Impact on Education Sector in Parbhani District ........................................... 155
5.7.15 Impact on Agriculture in Parbhani District .................................................... 157
5.7.16 Impact on Finance Sector in Parbhani District .............................................. 158
5.7.17 Impact on Migration in Parbhani District ...................................................... 160
5.7.18 Impact on Living in Parbhani District ........................................................... 161
5.7.19 Profile of Yavatmal District ........................................................................... 162
5.7.20 Sample Size .................................................................................................... 163
5.7.21 Impact on Transport Sector in Yavatmal District .......................................... 165
5.7.22 Impact on Health Sector in Yavatmal District ............................................... 168
5.7.23 Impact on Education Sector in Yavatmal District ......................................... 171
5.7.24 Impact on Agriculture in Yavatmal District .................................................. 173
5.7.25 Impact on Finance Sector in Yavatmal District ............................................. 175
5.7.26 Impact on Migration in Yavatmal District ..................................................... 177
5.7.27 Impact on Living in Yavatmal District .......................................................... 178

iv
5.7.28 Profile of Bhandara District ........................................................................... 179
5.7.29 Sample Size .................................................................................................... 180
5.7.30 Impact on Transport Sector in Bhandara District .......................................... 182
5.7.31 Impact on Health Sector in Bhandara District ............................................... 185
5.7.32 Impact on Education Sector in Bhandara District.......................................... 188
5.7.33 Impact on Agriculture in Bhandara District ................................................... 190
5.7.34 Impact on Finance Sector in Bhandara District ............................................. 191
5.7.35 Impact on Migration in Bhandara District ..................................................... 193
5.7.36 Impact on Living in Bhandara District .......................................................... 194
5.7.37 Profile of Kolhapur District ........................................................................... 195
5.7.38 Sample Size .................................................................................................... 196
5.7.39 Impact on Transport Sector in Kolhapur District .......................................... 198
5.7.40 Impact on Health Sector in Kolhapur District ............................................... 202
5.7.41 Impact on Education Sector in Kolhapur District .......................................... 205
5.7.42 Impact on Agriculture in Kolhapur district .................................................... 207
5.7.43 Impact on Finance Sector in Kolhapur District ............................................. 208
5.7.44 Impact on Migration in Kolhapur District ..................................................... 210
5.7.45 Impact on Living in Kolhapur District........................................................... 211
5.7.46 Profile of Ratnagiri District ........................................................................... 212
5.7.47 Sample Size .................................................................................................... 213
5.7.48 Impact on Transport Sector in Ratnagiri District ........................................... 215
5.7.49 Impact on Health Sector in Ratnagiri District................................................ 218
5.7.50 Impact on Education Sector in Ratnagiri District .......................................... 221
5.7.51 Impact on Agriculture in Ratnagiri District ................................................... 223
5.7.52 Impact on Finance Sector in Ratnagiri District .............................................. 224
5.7.53 Impact on Migration in Ratnagiri District ..................................................... 226
5.7.54 Impact on Living in Ratnagiri District ........................................................... 227
5.7.55 Profile of Palghar district ............................................................................... 228
5.7.56 Sample Size .................................................................................................... 228
5.7.57 Impact on Transport Sector in Palghar District ............................................. 230
5.7.58 Impact on Health Sector in Palghar District .................................................. 232
5.7.59 Impact on Education Sector in Palghar District ............................................. 233
5.7.60 Impact on Agriculture in Palghar District ...................................................... 234
5.7.61 Impact on Migration in Palghar District ........................................................ 235
5.7.62 Impact on Living in Palghar District ............................................................. 236
6 Summary and Recommendations ............................................................................... 237
6.1 Technical Evaluation of PMGSY roads ..................................................................... 237
6.1.1 Evaluation of on-going roads ............................................................................. 237
6.1.2 Evaluation of completed roads........................................................................... 239
6.1.3 Evaluation of the pavement condition of the roads ........................................... 240
6.1.4 SQM and NQM Inspections............................................................................... 241

v
6.2 Physical and financial progress evaluation ............................................................... 243
6.3 Environmental Impact assessment ............................................................................. 245
6.3.1 Energy Usage in different phases of road’s life ................................................. 245
6.3.2 Impact on Climate Change ................................................................................. 245
6.3.3 Impact on Terrestrial Acidification .................................................................... 246
6.3.4 Impact on Marine Eutrophication ...................................................................... 246
6.3.5 Photochemical Oxidant Formation .................................................................... 247
6.3.6 Particulate Matter Formation ............................................................................. 247
6.3.7 Human Toxicity and Marine Ecotoxicity .......................................................... 247
6.3.8 Water Depletion and Fossil Fuel Depletion ....................................................... 248
6.4 Socioeconomic evaluation of PMGSY roads ............................................................. 248
6.4.1 Transport Sector ................................................................................................. 248
6.4.2 Health Sector ...................................................................................................... 250
6.4.3 Education Sector ................................................................................................ 251
6.4.4 Agriculture Sector .............................................................................................. 253
6.4.5 Finance Sector .................................................................................................... 254
6.4.6 Migration............................................................................................................ 254
6.4.7 Type of House .................................................................................................... 255
6.5 Recommendations ...................................................................................................... 255
Annexures-I................................................................................................................ 259
Annexure-II ................................................................................................................ 263
Annexure-III .............................................................................................................. 270
References .................................................................................................................. 271


List of Tables Table 1.1 Population of Maharashtra rural and urban ............................................................... 4
Table 1.2 The total length of different types of Roads in Maharashtra and its percentage share
of India’s roads adapted from MoRTH ...................................................................................... 7
Table 1.3 Details about road statistics and vehicle statistics as per report of infrastructure
statistics of Maharashtra by Directorate of Economics and Statistics ....................................... 7
Table 1.4 Agro-Climatic Zones of Maharashtra ...................................................................... 11
Table 1.5 Activities to be taken up for the proposed work ...................................................... 19
Table 2.1 Quality laboratories staff and their capacity building .............................................. 31
Table 2.2 Items for inspection by SQM or NQM during field inspections ............................. 32
Table 2.3 Details of ongoing roads selected for inspection ..................................................... 38
Table 2.4 Abstract of items for quality inspection for ongoing roads ..................................... 41
Table 2.5 Observations made on the roads for maintenance of road ....................................... 47
Table 2.6 Road Condition Survey as per PMGSY guidelines for rating PCI .......................... 51
Table 2.7 Asphalt pavement distress parameters as per ASTM standards. ............................. 52
Table 2.8 Sample roads for the PCI rating ............................................................................... 54
Table 2.9 PCI results for sections and averaged for sample road ............................................ 56
Table 2.10 Frequency of U and SRI items leading overall grading as SRI for On-going works
.................................................................................................................................................. 69
Table 2.11 Frequency of U or SRI items leading overall grading as SRI for Completed Works
.................................................................................................................................................. 70
Table 2.12 Frequency of U or SRI items leading overall grading as U and SRI for Maintenance
Works ....................................................................................................................................... 71
Table 2.13 On-going works item wise distribution of U and SRI graded. .............................. 71
Table 2.14 Frequency of items with SRI and U grading for works graded with SRI and U ... 72
Table 3.1 Habitation coverage and balance habitations to be covered in PMGSY-I .............. 77
Table 5.1 Roads sampled for socioeconomic evaluation ....................................................... 108
Table 5.2 Number of villages in Ahmednagar district population wise ................................ 130
Table 5.3 Sample roads in Ahmednagar District surveyed for socioeconomic evaluation ... 130

viii
Table 5.4 List of Infrastructure availability before road and after road within habitation .... 131
Table 5.5 Frequency of visits by Doctor, Nurse and ASHA Worker to habitation ............... 136
Table 5.6 Special incidents happened due to bad condition of road ...................................... 138
Table 5.7 Status of Ambulance coming to Habitation ........................................................... 138
Table 5.8 Access to agriculture extension service ................................................................. 142
Table 5.9 Number of villages in Parbhani district population wise ....................................... 147
Table 5.10 Sample roads in Parbhani District for socioeconomic evaluation ....................... 147
Table 5.11 List of infrastructure availability before road and after road within habitation ... 148
Table 5.12 Trip of Health Workers and Doctors in the habitation ........................................ 153
Table 5.13 Special incidents happened due to bad condition of road .................................... 154
Table 5.14 Status of ambulance coming to Habitation .......................................................... 154
Table 5.15 Access to agriculture extension services ............................................................. 158
Table 5.16 Population wise village distribution in Yavatmal District ................................... 163
Table 5.17 Sample roads for socioeconomic evaluation in Yavatmal District ...................... 163
Table 5.18 List of infrastructure availability before road and after road within habitation ... 164
Table 5.19 Trip of Doctor Nurse and ASHA Worker per Month .......................................... 169
Table 5.20 Special incidents happened due to bad condition of road .................................... 170
Table 5.21 Status of ambulance coming to Habitation .......................................................... 170
Table 5.22 Access to agricultural extension services ............................................................ 175
Table 5.23 Population wise village distribution in Bhandara district .................................... 180
Table 5.24 Sample roads for socioeconomic evaluation in Bhandara district ....................... 180
Table 5.25 List of infrastructure availability before road and after road within habitation ... 181
Table 5.26 Trip of Health Workers and Doctors in the Habitation ....................................... 186
Table 5.27 Special incidents happened due to bad condition of road .................................... 187
Table 5.28 Status of ambulance coming to Habitation .......................................................... 187
Table 5.29 Access to agriculture extension services ............................................................. 191

ix
Table 5.30 Population wise villages distribution in Kolhapur District .................................. 196
Table 5.31 Sample roads for socioeconomic evaluation in Kolhapur district ....................... 196
Table 5.32 List of infrastructure availability before road and after road within habitation ... 197
Table 5.33 Trip of Health Workers and Doctors in the Habitation ....................................... 203
Table 5.34 Special incidents happened due to bad condition of road .................................... 204
Table 5.35 Details of Ambulance coming to village in Kolhapur ......................................... 204
Table 5.36 Access to agriculture extension services ............................................................. 208
Table 5.37 Population wise village distribution in Ratnagiri district .................................... 212
Table 5.38 Sample roads for socioeconomic evaluation in Ratnagiri District ...................... 213
Table 5.39 List of infrastructure availability before road and after road within habitation ... 214
Table 5.40 Trip of Health Workers and Doctors in the Habitation ....................................... 219
Table 5.41 Special incidents happened due to bad condition of road .................................... 220
Table 5.42 Status of Ambulance coming to Habitation. ........................................................ 220
Table 5.43 Access to agriculture extension services ............................................................. 224
Table 5.44 Population wise village distribution in Palghar District ...................................... 228
Table 5.45 Sample roads for socioeconomic evaluation in Palghar district .......................... 228
Table 5.46 List of infrastructure availability before road and after road within habitation ... 229
Table 5.47 Trip of Health Workers and Doctors in the Habitation ....................................... 232
Table 5.48 Special incidents happened due to bad condition of road .................................... 233
Table 5.49 Status of Ambulance coming to Habitation ......................................................... 233
Table 5.50 Access to agriculture extension services ............................................................. 235
Table 6.1Detailed results of the study.................................................................................... 258


List of Figures Figure 1.1a and 1.1b Agro-climatic zones of Maharashtra and Sampling Methodology Adopted
.................................................................................................................................................. 13
Figure 1.2 Indicators for Technical Evaluation ....................................................................... 15
Figure 1.3 Indicators for Financial Evaluation ........................................................................ 16
Figure 1.4 Indicators for Environmental Evaluation ............................................................... 17
Figure 1.5 Indicators for Socioeconomic Evaluation .............................................................. 19
Figure 1.6 Timelines for each of the activities for Evaluation of PMGSY ............................. 20
Figure 2.1 Map of sample roads for on-going testing as well as maintenance of works ......... 25
Figure 2.2 Quality Monitoring System in PMGSY ................................................................. 29
Figure 2.3 Inspection of Long Span Bridge in Parbhani district on ‘SH221 to Moregaon to
Brahmanwadi’ (date 25th May 2017) ....................................................................................... 43
Figure 2.4 Testing thickness of WBM layer on ‘Pimpalkauda to Nandgaon T2 Road’ in
Yavatmal District (date 30th May 2017) .................................................................................. 43
Figure 2.5 Field density testing on ‘NH06 Pimpalgaon to Khainy Ralegaon Road’ in Bhandara
district (date 31st May 2017) .................................................................................................... 44
Figure 2.6 Aggregate grading on ‘T14-Nandgaon Nagav Vadakshiwale Chuye To Kavannne
Road (ODR186)’ in Kolhapur district (date 8th June 2017) ..................................................... 44
Figure 2.7 Thickness of different layers on ‘SH-167 Wadilimbu to Baudhwadi to VR1
Approach road’ in Ratnagiri district (date 12th June 2017) ..................................................... 45
Figure 2.8 Road Width, Carriageway Width inspection on ‘T05-Vavar Wangani Jamsar
Nyahale bk Sh 30 Nyahadi kh Adoshi Khodala Road’ in Palghar district road.(date 21st June
2017) ........................................................................................................................................ 45
Figure 2.9 Actual field survey to assess condition of completed roads ................................... 56
Figure 2.10 NQM and SQM inspection comparison to Maharashtra and ‘All Other States’ in
India ......................................................................................................................................... 58
Figure 2.11 NQM and SQM inspection on completed roads comparison to Maharashtra and
‘All Other States’ in India ........................................................................................................ 59
Figure 2.12 Ongoing works SQM and NQM inspection comparison Maharashtra and all other
states ......................................................................................................................................... 60
Figure 2.13 NQM and SQM inspection on Maintenance works comparison to Maharashtra and
all other states in India ............................................................................................................. 61

xii
Figure 2.14 SQM inspections on ongoing works in Maharashtra ........................................... 62
Figure 2.15 SQM inspections on completed works in Maharashtra ........................................ 63
Figure 2.16 SQM Inspection on Maintenance Works in Maharashtra .................................... 64
Figure 2.17 District wise grading of on-going works inspected by NQM ............................... 66
Figure 2.18 NQM inspection on completed works in Maharashtra ......................................... 67
Figure 2.19 Maintenance works inspected by NQM showing SRI or U grading .................... 68
Figure 3.1 Coverage of Length (km) and Habitations (no.) through PMGSY-I...................... 75
Figure 3.2 Total habitation coverage in Maharashtra year wise through PMGSY-I & II ....... 76
Figure 3.3 Total habitation coverage in Maharashtra year wise through PMGSY-I & II (source:
OMMAS, PMGSY date 31st May 2017).................................................................................. 78
Figure 3.4 Physical progress of PMGSY-I for all states. ......................................................... 79
Figure 3.5 Physical progress of PMGSY-I & II at district level in Maharashtra ..................... 79
Figure 3.6 Physical Progress of PMGSY roads for sample districts of the current study ....... 80
Figure 3.7 Financial Progress for PMGSY-I & II for Maharashtra ......................................... 81
Figure 3.8 State wise Per Kilometer cost for upgradation and new connectivity works in lakh
Rupees ...................................................................................................................................... 82
Figure 3.9 District wise per kilometer cost for new connectivity and upgradation of roads in
lakh rupees ............................................................................................................................... 83
Figure 3.10 Average per kilometre cost for sample district only for pavement ...................... 84
Figure 3.11 Expenditure on LSB in and total expenditure in PMGSY-I (all values are in crores)
.................................................................................................................................................. 85
Figure 3.12 Expenditure on R & D Projects in Maharashtra ................................................... 86
Figure 3.13 Expenditure on New Connectivity and Upgradation works ................................. 87
Figure 4.1 Energy usage during road construction for all 26 PMGSY roads ......................... 91
Figure 4.2 Energy for Material Production and Transportation during construction ............. 93
Figure 4.3 Energy usage for material production during maintenance ................................... 95
Figure 4.4 Impact of climate change....................................................................................... 96

xiii
Figure 4.5 Impact on Terrestrial Acidification ........................................................................ 97
Figure 4.6 Impact on Marine Eutrophication .......................................................................... 98
Figure 4.7 Photochemical Oxidant Formation ........................................................................ 99
Figure 4.8 Particulate Matter Formation ............................................................................... 100
Figure 4.9 Impact of road on Human Toxicity ..................................................................... 101
Figure 4.10 Impact of road on Ecotoxicity ........................................................................... 102
Figure 4.11 Water Depletion................................................................................................. 103
Figure 4.12 Fossil Depletion ................................................................................................. 104
Figure 5.1 Stakeholders involved in PMGSY........................................................................ 106
Figure 5.2 Number of Habitations connected using the road ................................................ 110
Figure 5.3 Number of roads serving different number of habitations ................................... 111
Figure 5.4 Average number of days the road is closed before and after road ....................... 112
Figure 5.5 Availability of Public Transport facilities before and after PMGSY ................... 113
Figure 5.6 Number of habitations showing change in private vehicle due to road construction
................................................................................................................................................ 114
Figure 5.7 Increased participation of females in going outside village ................................. 115
Figure 5.8 Change in cooking energy pattern ........................................................................ 116
Figure 5.9 Availability of immunization facility ................................................................... 117
Figure 5.10 Special incidents happened due to bad condition of road .................................. 118
Figure 5.11 Status of Ambulance accessibility ...................................................................... 119
Figure 5.12 Improved access to education due to construction of road ................................. 120
Figure 5.13 Decrease in dropout rate and absentee rate of students ...................................... 121
Figure 5.14 Absentee rate of teachers .................................................................................... 122
Figure 5.15 Change in farm machinery usage, fertilizer usage, type of seed usage .............. 123
Figure 5.16 Change in farm produce selling pattern due to access to market in Ahmednagar
district .................................................................................................................................... 124
Figure 5.17 Access to agriculture extension service .............................................................. 125

xiv
Figure 5.18 Access to banking facility before and after road ................................................ 126
Figure 5.19 Status of arranging finances ............................................................................... 127
Figure 5.20 Increase or Decrease in Migration ...................................................................... 128
Figure 5.21 Change in type of house before and after road ................................................... 129
Figure 5.22 Sample Roads and Habitations Map................................................................... 131
Figure 5.23 Number of Habitations using the road ................................................................ 132
Figure 5.24 Average number of days the road is closed before and after road ..................... 133
Figure 5.25 Availability of Public Transport facilities .......................................................... 134
Figure 5.26 Increase in two-wheelers in the habitations........................................................ 135
Figure 5.27 Increased participation of females in going outside village ............................... 136
Figure 5.28 Change in cooking energy pattern ...................................................................... 136
Figure 5.29 Availability of immunization facility ................................................................. 137
Figure 5.30 Improved access to education due to construction of road ................................. 139
Figure 5.31 Decrease in dropout rate and absentee rate of students ...................................... 139
Figure 5.32 Absentee rate of Teachers .................................................................................. 140
Figure 5.33 Change in farm machinery usage, fertilizer usage, type of seed usage .............. 141
Figure 5.34 Change in farm produce selling pattern due to access to market in Ahmednagar
district .................................................................................................................................... 142
Figure 5.35 Access to banking facility before and after road ................................................ 143
Figure 5.36 Status of arranging finances ............................................................................... 144
Figure 5.37 Change in type of migration ............................................................................... 145
Figure 5.38 Increase or Decrease in Migration ...................................................................... 145
Figure 5.39 Change in type of house before and after road ................................................... 146
Figure 5.40 Sample Road and Habitation Map in Parbhani .................................................. 148
Figure 5.41 Number of habitations using the road ................................................................ 149
Figure 5.42 Average number of days the road is closed before and after road ..................... 150

xv
Figure 5.43 Availability of Public Transport facility............................................................. 150
Figure 5.44 Increase in two-wheelers in the habitations........................................................ 151
Figure 5.45 Increased participation of females in going outside village ............................... 152
Figure 5.46 Change in cooking energy pattern ...................................................................... 153
Figure 5.47 Immunization facility and status of immunization ............................................. 154
Figure 5.48 Improved access to education due to sample road ............................................. 155
Figure 5.49 Absentee rate for children .................................................................................. 156
Figure 5.50 Absentee rate for teacher .................................................................................... 156
Figure 5.51 Change in farm machinery usage, fertilizer usage, type of seed usage .............. 157
Figure 5.52 Change in farm produce selling pattern due to access to market in Parbhani .... 158
Figure 5.53 Improvement in banking facility ........................................................................ 159
Figure 5.54 Status of arranging finance ................................................................................. 160
Figure 5.55 Change in type of migration ............................................................................... 161
Figure 5.56 Change in migration ........................................................................................... 161
Figure 5.57 Change in-house type before and after road ....................................................... 162
Figure 5.58 Sample Road and Habitation in Yavatmal ......................................................... 164
Figure 5.59 Number of habitation using the road .................................................................. 165
Figure 5.60 average number of days the road is closed before and after road ...................... 166
Figure 5.61 Availability of Public Transport facility............................................................. 166
Figure 5.62 Increase in two-wheelers in the habitations........................................................ 167
Figure 5.63 Increased participation of females in going outside village ............................... 168
Figure 5.64 Change in cooking energy pattern ...................................................................... 169
Figure 5.65 Immunization facility and status of immunization ............................................. 170
Figure 5.66 Improved access to education due to sample road ............................................. 171
Figure 5.67 Decrease in dropout rate of students .................................................................. 172
Figure 5.68 Decrease in absentee rate of teachers ................................................................. 173
xvi
Figure 5.69 Change in farm machinery usage, fertilizer usage, type of seed usage .............. 174
Figure 5.70 Change in farm produce selling pattern due to access to market in Yavatmal... 175
Figure 5.71 Improvement in banking facility ........................................................................ 176
Figure 5.72 Status of arranging finance ................................................................................. 177
Figure 5.73 Change in type of migration ............................................................................... 178
Figure 5.74 Change in migration ........................................................................................... 178
Figure 5.75 Change in type of house before and after road ................................................... 179
Figure 5.76 Sample Road and Habitation Map in Bhandara ................................................. 181
Figure 5.77 Number of habitation using the road .................................................................. 182
Figure 5.78 Average number of days the road is closed before and after road ..................... 183
Figure 5.79 Availability of Public Transport facility............................................................. 183
Figure 5.80 Increase in number of vehicles in the habitation ................................................ 184
Figure 5.81 Increased participation of females in going outside village ............................... 185
Figure 5.82 Change in cooking energy pattern ...................................................................... 185
Figure 5.83 Immunization facility and status of immunization ............................................. 187
Figure 5.84 improved access to education due to sample road .............................................. 188
Figure 5.85 Decrease in dropout rate of students .................................................................. 189
Figure 5.86 Decrease in absentee rate for teachers ................................................................ 190
Figure 5.87 Change in farm machinery usage, fertilizer usage, type of seed usage .............. 190
Figure 5.88 Change in farm produce selling pattern due to access to market in Bhandara ... 191
Figure 5.89 Improvement in banking facility ........................................................................ 192
Figure 5.90 Status of arranging finance ................................................................................. 193
Figure 5.91 Change in type of migration ............................................................................... 193
Figure 5.92 Increase or decrease in migration ....................................................................... 194
Figure 5.93 Change in type of house ..................................................................................... 195
Figure 5.94 Sample Road and Habitations Map in Kolhapur ................................................ 197

xvii
Figure 5.95 Number of habitation using the road .................................................................. 198
Figure 5.96 Average number of days the road is closed before and after road ..................... 199
Figure 5.97 Availability of public transport facility in connected village ............................. 200
Figure 5.98 Increase in number vehicles in Habitation ......................................................... 201
Figure 5.99 Increased participation of females in going outside village ............................... 202
Figure 5.100 Change in cooking energy pattern in habitation ............................................... 203
Figure 5.101 Immunization facility and status of immunization ........................................... 204
Figure 5.102 Improved access to education due to sample road ........................................... 205
Figure 5.103 Decrease in dropout rate of students ................................................................ 206
Figure 5.104 Decrease in absentee rate of teacher ................................................................. 207
Figure 5.105 Change in farm machinery usage, fertilizer usage, type of seed usage ............ 207
Figure 5.106 Change in farm produce selling pattern due to access to market in Kolhapur . 208
Figure 5.107 Improved access to Banking facility in a village .............................................. 209
Figure 5.108 Status of arranging finances in a village........................................................... 210
Figure 5.109 Change in type of migration ............................................................................. 210
Figure 5.110 Increase or decreasing migration ...................................................................... 211
Figure 5.111 Change in type of house before and after road construction ............................ 211
Figure 5.112 Sample Road and Habitation Map in Ratnagiri ................................................ 214
Figure 5.113 Number of habitation using the road ................................................................ 215
Figure 5.114 Average number of days the road is closed before and after road ................... 216
Figure 5.115 Availability of Public Transport facility........................................................... 216
Figure 5.116 Increase in two-wheelers in the habitations...................................................... 217
Figure 5.117 Increased participation of females in going outside village ............................. 218
Figure 5.118 Change in cooking energy pattern .................................................................... 219
Figure 5.119 Immunization facility and status of immunization ........................................... 220
Figure 5.120 Access to education due to sample road ........................................................... 221

xviii
Figure 5.121 Decrease in dropout rate and absentee rate of students .................................... 222
Figure 5.122 Absentee rate of teachers .................................................................................. 222
Figure 5.123 Change in farm machinery usage, fertilizer usage, type of seed usage ............ 223
Figure 5.124 Change in farm produce selling pattern due to access to market in Ratnagiri . 224
Figure 5.125 Access to banking facility before and after road .............................................. 225
Figure 5.126 Status of arranging finances ............................................................................. 225
Figure 5.127 Change in type of migration ............................................................................. 226
Figure 5.128 Change in migration ......................................................................................... 227
Figure 5.129 Change in-house type before and after road ..................................................... 227
Figure 5.130 Sample Road and Habitation Map in Palghar .................................................. 229
Figure 5.131 Number of habitation using the road ................................................................ 230
Figure 5.132 Average number of days the road is closed before and after road ................... 231
Figure 5.133 Increase in number of two-wheelers in the habitation...................................... 231
Figure 5.134 Change in cooking energy pattern .................................................................... 232
Figure 5.135 Change in House type in Palghar ..................................................................... 236

Abbreviation
AE Assistant Engineer
ANMs Auxiliary Nurse Midwife
ASHA Accredited Social Health Activist
ASTM American Society for Testing and Materials
ASHTHO
American Association of State Highway and Transportation
Officials
ATR Action Taken Report
CBR California Bearing Ratio
CC Cement Concrete
CD Cross-Drainage
CDV Corrected Deduct Value
CRRI Central Road Research institute
CTARA Center for Technology Alternatives for Rural Areas
CVPD Commercial Vehicles Per Day
BRRP Block Rural Road Plan
DCP Dynamic Cone Penetration
DE Deputy Engineer
DES Directorate of Economics and Statistics
DPIU District Programme Implementation Unit
DPR Detailed Progress Report
DRRP District Rural Road Planning
EE Executive Engineer
GIS Geographic Information System
GSB Granular Sub-Base
HDV Highest Deduct Value
IITB Indian Institute of Technology Bombay
IRC Indian Road Congress
IS Indian Standard
JE Junior Engineer
JNPT Jawaharlal Nehru Port Trust
LCA Life Cycle Assessment
LPG Liquefied Petroleum Gas
LSB Long Span Bridge
MADC Maharashtra Airport Development Company Limited
MbPT Mumbai Port Trust
MB Measurement Book
MERI Maharashtra Engineering Research Institute
MDD Mean Dry Density
MIHAN Multi-modal International Hub Airport at Nagpur
MMRDA Mumbai Metropolitan Region Development Authority
MORD Ministry of Rural Development
MORTH Ministry of Road Transport & Highway

xx
MOSRTH Ministry of Shipping, Road Transport & Highways
MPM Modified Penetration Macadam
MUTP Mumbai Urban Transport Project
NQM National Quality Monitor
NRRDA National Rural Roads Development Agency
NRRDC National Rural Roads Development Committee
OMMAS Online Management, Monitoring and Accounting System
OPWD Other Public Works Department
PCI Pavement Condition Index
PCU Passenger car unit
PIU Program Implementation Unit
PMC Premix Carpet
PMGSY Pradhan Mantri Gram Sadak Yojana
PTA Principal Technical Agencies
PWD Public Works Department
QMS Quality Management System
RD Reduced Distance
ROMDAS Road Management and Data Acquisition System
RS Rapid Setting
S Satisfactory
SD Standard Deviation
SD Surface Dressing
SLCSA Strategic Life Cycle Sustainability Assessment tool
SQC State Quality Coordinator
SQM State Quality Monitor
SRI Satisfactory Requiring Improvement
SRRDA State Rural Road Development Agency
SS Slow Setting
STA State Technical Agencies
U Unsatisfactory
WBM Water bound macadam
QAH V-II Quality Assurance Handbook Volume-II

1 Introduction
1.1 Background
With reference to letter number जा. क्र. प्रग्रासयो/1116/ममूा/ 680 dated 23/12/2016 from Directorate
of Economics and Statistics, Planning Department, Government of Maharashtra, a request to
submit a proposal for evaluation study of PMGSY scheme was made to Indian Institute of
Technology Bombay (IIT Bombay). The IIT-Bombay team is led by the Centre for Technology
Alternatives for Rural Areas (CTARA), an academic and research body of IIT-Bombay, which
specializes in the field of technology and development.
CTARA has been active for 25 years now and has done several projects, extension activities,
prototype generation and monitoring & evaluation studies. CTARA IIT Bombay has been
working on assessment of PMGSY roads along with National Rural Road Development
Agency (NRRDA) under Ministry of Rural Development (MoRD) fellowship program from
past four years and hence, was interested in this project as the proposed assessment falls in line
with the on-going research. The CTARA IIT Bombay has been appointed as evaluating agency
by DES for “Evaluation study of Pradhan Mantri Gram Sadak Yojana (PMGSY) roads in
Maharashtra” implemented by Rural Development and Panchayati Raj Department in
Maharashtra on 24th April 2017 and the project period of 5 months.
Rural road connectivity and its sustained availability is a key component of rural
development as it assures continued access to economic and social services and thereby
generates an increase in agricultural incomes with productive employment opportunities. Rural
roads comprise over 60% (in 2010) of the road network in the country and keeping them in
serviceable condition is crucial to the rural/agricultural growth and to provide access to social
facilities viz. medical, education and markets (Planning Commission, 2011). “Evidence also
indicates that as the rural connectivity improves, the rural poverty levels come down”. As
indicated by a study, carried out by the International Food Policy Research Institute, on
linkages between government expenditure and poverty in rural India, an investment of Rs. 1
million (at 1993 constant prices) on roads lifts 124 persons above the poverty line. This
emphasizes the importance of providing a good quality road to maximum possible habitation.
Keeping in mind above mentioned social benefits, India has launched Pradhan Mantri Gram
Sadak Yojana (PMGSY) in the year 2000 in order to provide all-weather connectivity to all
unconnected habitation.
This study intended to evaluate the PMGSY roads for Maharashtra State with respect to
physical and financial progress, quality of the roads and socioeconomic impact on benefitted
habitations due to road.
1.2 Objectives and Scope
1. To carry out a technical evaluation of PMGSY roads for assessing the quality of
construction.

2
2. To evaluate physical and financial progress and find out any shortfalls in construction
or maintenance.
3. To evaluate the environmental impact of construction of rural roads and represent it in
the form of endpoint indicator using Strategic Life Cycle Sustainability Assessment
tool (SLCSA).
4. To evaluate the socio-economic impact of PMGSY roads on the lives of rural people in
selected habitations/villages.
The scope of the work is restricted to the state of Maharashtra.
1.3 Profile of Maharashtra
Maharashtra is the third-largest state by area in the India having an area of 3,07,713 km2 and
coastline of 720 km2 along the Arabian Sea. The spread of Maharashtra is between the latitudes
15.6o North and 22.1o North and longitudes 72.6o East and 80.9o East. Most of the area is
covered by Deccan plateau. One of the three major regions of the state is the Sahyadri range
with an elevation of 1000 meters above Mean Sea Level (MSL) lying between the Arabian Sea
and the Sahyadri Range, Konkan is narrow coastal lowland, just 50 km wide and with an
elevation below 200 meters. The third important region is the Satpura hills along the northern
border, and the Bhamragad-Chiroli-Gaikhuri ranges on the eastern border form a physical
barrier. Maharashtra has a typical monsoon climate, with hot, rainy and cold weather seasons.
The winter season is between September to January followed by the summer between February
and May and the monsoon season between June and September. Summers are extremely hot
in March, April and May with temperatures touching 48°C in a few areas. The average
temperature varies between 22 °C and 39 °C during this season. The temperature during winter
season varies between 12 °C and 34 °C. Rainfall in Maharashtra varies with regions with
Kokan receiving maximum rainfall of more than 2000mm while the central Maharashtra
receiving very less rainfall of the order of less than 500mm.
For administrative purpose, the state is divided into six revenue divisions, which are further
divided into 36 districts, 357 Tehsils/Blocks and 27,920 Gram Panchayats. The state is divided
into 6 divisions based on the agro climatic conditions.
1) Konkan Division: Mumbai City, Mumbai Suburban, Raigad, Ratnagiri, Sindhudurg,
Palghar and Thane.
2) Nashik Division: Ahmednagar, Dhule, Jalgaon, Nandurbar and Nashik.
3) Pune Division: Kolhapur, Pune, Sangli, Satara and Solapur.
4) Aurangabad Division (Marathwada): Aurangabad, Beed, Hingoli, Jalna, Latur, Nanded,
Osmanabad and Parbhani.
5) Amravati Division: Akola, Amravati, Buldhana, Washim and Yavatmal.
6) Nagpur Division: Bhandara, Chandrapur, Gadchiroli, Gondiya, Nagpur and Wardha.
The population statistics as per census 2011 are given below in the table 1.1

3

Table 1.1 Population of Maharashtra rural and urban
District No. of
Households Population
Average No of
people per
Household Male Population
Female
Population
Sex
Ratio
Population of
literates
Population of
illiterates
Rural
%
Urban
%
Rural
%
Urban
% Rural Urban
Rural
%
Urban
%
Rural
%
Urban
%
Rural
%
Urban
%
Rural
%
Urban
%
Mumbai 0.00 100.00 0.00 100.00 0.00 4.58 0.00 100.00 0.00 100.00 831.53 0.00 100.00 0.00 100.00
Mumbai
Suburban 0.00 100.00 0.00 100.00 0.00 4.44 0.00 100.00 0.00 100.00 859.74 0.00 100.00 0.00 100.00
Thane 21.41 78.59 23.01 76.99 4.70 4.28 22.17 77.83 23.97 76.03 885.76 18.72 81.28 35.50 64.50
Nagpur 32.64 67.36 31.69 68.31 4.34 4.53 31.80 68.20 31.58 68.42 951.20 29.21 70.79 41.01 58.99
Pune 36.25 63.75 39.01 60.99 4.72 4.19 38.66 61.34 39.39 60.61 914.95 36.56 63.44 46.77 53.23
Nashik 55.39 44.61 57.47 42.53 5.18 4.76 57.16 42.84 57.80 42.20 934.38 53.54 46.46 67.17 32.83
Aurangabad 55.98 44.02 56.23 43.77 4.94 4.90 56.21 43.79 56.24 43.76 923.27 51.65 48.35 65.79 34.21
Raigad 62.31 37.69 63.17 36.83 4.37 4.21 62.26 37.74 64.12 35.88 959.47 59.94 40.06 72.19 27.81
Akola 63.22 36.78 60.32 39.68 4.37 4.95 60.49 39.51 60.15 39.85 945.55 58.77 41.23 65.77 34.23
Chandrapur 66.38 33.62 64.82 35.18 4.01 4.30 64.61 35.39 65.05 34.95 961.42 60.96 39.04 74.56 25.44
Amravati 66.46 33.54 64.09 35.91 4.30 4.78 64.20 35.80 63.97 36.03 950.64 62.20 37.80 70.76 29.24
Kolhapur 67.66 32.34 68.27 31.73 4.65 4.53 68.10 31.90 68.44 31.56 956.93 65.60 34.40 75.43 24.57
Solapur 67.98 32.02 67.60 32.40 4.92 5.00 68.15 31.85 67.00 33.00 938.08 64.69 35.31 73.62 26.38
Wardha 68.58 31.42 67.46 32.54 4.13 4.35 67.61 32.39 67.30 32.70 946.14 65.24 34.76 75.50 24.50
Jalgaon 69.12 30.88 68.26 31.74 4.62 4.81 68.29 31.71 68.22 31.78 925.00 64.93 35.07 75.46 24.54
Parbhani 71.00 29.00 68.97 31.03 4.94 5.44 69.14 30.86 68.78 31.22 947.34 65.94 34.06 74.13 25.87
Dhule 72.57 27.43 72.16 27.84 4.99 5.09 72.00 28.00 72.32 27.68 945.73 66.27 33.73 82.22 17.78
Sangli 73.94 26.06 74.51 25.49 4.75 4.61 74.60 25.40 74.41 25.59 965.65 72.95 27.05 78.65 21.35
Nanded 74.29 25.71 72.81 27.19 4.95 5.34 72.72 27.28 72.90 27.10 942.86 69.85 30.15 78.34 21.66
Latur 75.46 24.54 74.53 25.47 5.03 5.29 74.60 25.40 74.47 25.53 927.67 72.39 27.61 78.95 21.05
Ahmadnagar 79.47 20.53 79.91 20.09 4.91 4.78 79.94 20.06 79.88 20.12 939.18 77.58 22.42 85.20 14.80
Yavatmal 79.69 20.31 78.42 21.58 4.22 4.55 78.53 21.47 78.31 21.69 952.41 75.94 24.06 85.11 14.89

5
Buldana 80.37 19.63 78.78 21.22 4.51 4.98 78.89 21.11 78.65 21.35 933.56 77.17 22.83 83.05 16.95
Satara 80.86 19.14 81.01 18.99 4.60 4.56 80.73 19.27 81.29 18.71 988.12 79.56 20.44 85.16 14.84
Bhandara 80.89 19.11 80.52 19.48 4.30 4.40 80.51 19.49 80.53 19.47 982.32 78.72 21.28 85.92 14.08
Beed 81.29 18.71 80.10 19.90 4.75 5.13 80.27 19.73 79.92 20.08 916.12 77.72 22.28 84.84 15.16
Jalna 81.93 18.07 80.73 19.27 4.93 5.33 80.80 19.20 80.66 19.34 936.82 77.92 22.08 85.15 14.85
Gondiya 83.40 16.60 82.92 17.08 4.50 4.66 82.83 17.17 83.01 16.99 999.09 81.50 18.50 87.40 12.60
Washim 84.17 15.83 82.34 17.66 4.51 5.15 82.50 17.50 82.17 17.83 929.96 81.24 18.76 85.25 14.75
Nandurbar 84.32 15.68 83.29 16.71 5.03 5.43 82.54 17.46 84.05 15.95 978.34 76.81 23.19 91.21 8.79
Osmanabad 84.40 15.60 83.04 16.96 4.64 5.13 83.13 16.87 82.95 17.05 923.98 81.39 18.61 86.67 13.33
Ratnagiri 84.44 15.56 83.67 16.33 4.03 4.27 82.80 17.20 84.45 15.55 1121.96 81.65 18.35 89.49 10.51
Hingoli 85.75 14.25 84.82 15.18 5.09 5.48 84.85 15.15 84.79 15.21 941.87 83.23 16.77 88.06 11.94
Sindhudurg 87.31 12.69 87.41 12.59 4.05 4.02 87.05 12.95 87.75 12.25 1035.91 86.52 13.48 90.62 9.38
Gadchiroli 88.81 11.19 89.00 11.00 4.29 4.21 88.91 11.09 89.09 10.91 982.06 86.65 13.35 93.57 6.43
(Source- Census 2011)

1.4 Transportation Profile of Maharashtra
The state has a large, multi-modal transportation system consisting of three modes roads,
railway and civil aviation. Besides these Maharashtra has two major ports at Mumbai and Navi
Mumbai. The details about each transportation means are summarised below:
The network of the railway in Maharashtra covers a length of 6,253 km of which 5,688 km. of
broad gauge lines, 459 km of narrow gauge lines & 106 km. of meter gauge lines. The rail
traffic in Maharashtra mainly falls under the Central, Western, Konkan, South-East Central and
South Central divisions. The railway route length per hundred sq.km of geographical area as
on 31st March 2013 was 2.03 km for the State. (Source-Infrastructure Statistics 2013-14 &
2014-15, by DES)
The State has three international airports and eight domestic airports for air travels. The
international airports are at Mumbai, Pune, & Nagpur and domestic airports at Aurangabad,
Akola, Nanded, Kolhapur, Solapur, Nashik, Amaravati, Jalgaon, Latur, Chandrapur and
Osmananbad (Source-Infrastructure statistics 2013-14 & 2014-15, by DES)
The State has two major ports i.e. Mumbai Port Trust (MPT) & Jawaharlal Nehru Port Trust
(JNPT) both located in Mumbai harbour. There are 12 minor ports handling cargo and 36 minor
ports handling passenger traffic. (Source-Infrastructure statistics 2013-14 & 2014-15, by DES)
Maharashtra has the largest road network in India. Maharashtra is the third state having highest
kilometre length of national highways after Uttar Pradesh and Rajasthan with seventeen
national highways connecting Maharashtra to the six neighbouring states with a total length of
7,048 km (7.20% of total national highway length in India). Maharashtra has a length of 40,144
km under state highway category and ranks first in having the largest network of state highways
in India covering around 24% of state highway length of India. In case of Other Public Works
Department (OPWD) roads, Maharashtra carries 2,51,787 km length and is 22.90% of total
length in India. Maharashtra state is first in India having 11% of all India Other PWD road
network. In case of rural roads network, Maharashtra ranks first having 11% of road length
i.e. approximately 2,67,402 km in length. Rural roads are categorised into two types;
Panchayati Raj roads and Pradhan Mantri Gram Sadak Yojana (PMGSY) roads.
Among the national highways and state highways, total length of the national highways in
Maharashtra are surfaced and only 97.72% of state highways are surfaced in Maharashtra. In
case of OPWD roads 78.38% of roads are surfaced and rural roads which are of almost equal
length as that of OPWD roads have 76.42% of them surfaced. Among the rural roads, for
PMGSY roads the % of surfaced roads increases to 86.71%. Apart from this, for the 21,072
kms of project roads in Maharashtra only 38.80% of roads are surfaced and remaining are still
either WBM or gravel roads. Thus overall of the 6,08,140 km of road length present in
Maharashtra 4,71,265 km of length are surfaced. As per the Annual Road Statistics Report,
MoRTH 2014-15, till March 2015, Maharashtra has constructed 31,012 kms of roads under the
PMGSY i.e. 5.12% of all PMGSY roads in India.

7
Overall Maharashtra has a road density of 97 km per 100 km2 of area and 255 km of length per
lakh population as on March 2015 (Infrastructure Statistics of Maharashtra 2014-15, by DES).
However, considering total road length as per MoRTH statistics as mentioned in Table 1.2 and
population of census 2011 the road density becomes 197km per 100km2 and 541km per lakh
population. The details of length of the different roads constructed in Maharashtra, the road
density in km per 100 km2 of area and per lakh population and the registered transport, non-
transport vehicle details are given in Table 1.2 and Table 1.3
Table 1.2 The total length of different types of Roads in Maharashtra and its percentage share
of India’s roads adapted from MoRTH
Sr. No. Maharashtra as on March 2015 2013-14 2014-15
1 National Highways (km) 6,249 7,048
2 State Highways (km) 39,588 40,144
3 Other PWD Roads (km) 2,55,484 2,51,787
4 Rural road (km) 2,66,904 2,67,402
4A Panchayati Raj Roads (km) 2,36,441 2,36,390
4B PMGSY (km) 30,463 31,012
5 Project Roads (km) 20,119 21,072
6 Urban roads (km) 20,346 20,687
Total 6,08,690 6,08,140
Source: Annual Road Statistics Report MoRTH 2014-15,
However, the report published by Directorate of economics and statistics has different numbers
than the report published by Ministry of Road Transport and Highways. The categorization of
roads for both the agencies is different. The numbers shown by DES reports are very less as
compared to MoRTH. The MoRTH has given details about each of subcategory of roads types
mentioned in Table 1.2. MoRTH has separated the roads that are surfaced and not surfaced as
well as categorised them into one lane, two-lane, etc. These large differences in the length of
roads is of concern as it leaves the reader confused about the exact length of the road in
Maharashtra. For the current study, as detailed information about each type road is available
with MoRTH report consistently, the same has been used in this report.
Table 1.3 Details about road statistics and vehicle statistics as per report of infrastructure
statistics of Maharashtra by Directorate of Economics and Statistics
Sr. No Road Transport 2013-14 2014-15
Road Length (in km)
1 National Highways 5,855 4,844
2 Major State Highways 6,338 6,163
3 State Highways 33,963 33,859
4 Major District Roads 50,232 50,285
5 Other District Roads 52,761 58,116
6 Village Roads 1,06,745 1,45,879

8
Total 2,63,708 2,99,446
Road Density
1 Kilometre Per 100 sq.km of area 86 97
2 Kilometre Per lakh population 228 255
No. of Registered Motor Vehicles (in thousands)
1
No. of motor vehicles per lakh
population 20,065 21,828
2 No. of vehicles per km road length 89 85
Total 23,394 25,592
Registered Transport Vehicles (in Thousands)
1 Multi Vehicles 427 448
2 L.M.V 803 869
3 Buses 108 107
4 Taxies 189 193
5 Auto rickshaws 659 696
Total 2,242 2,370
Registered Non-Transport Vehicles (in Thousands)
1 Two-wheelers 16,910 18,604
2 Cars 2,835 3,114
3 Jeep 472 496
4 Station Wagons 19 19
5 Tractors 520 572
6 Trailers 354 372
7 Others 42 45
Total 21,152 23,222
Source: Infrastructure Statistics of Maharashtra 2014-15, by DES
1.5 Details about PMGSY
In 1999, the National Rural Roads Development Committee (NRRDC) estimated the total
number of unconnected habitations in India, the length of roads required and the budget for
building those roads. Following this, the Pradhan Mantri Gram Sadak Yojana (PMGSY) was
planned and implemented through the central agency ‘National Rural Road Development
Agency’ (NRRDA) under the Ministry of Rural Development (MoRD). The Pradhan Mantri
Gram Sadak Yojana phase one (PMGSY-I) was started in 2000 to provide all-weather access
to unconnected habitations with a population >1000 by 2003 and with population >500 (>250
in case of hilly/desert/tribal areas) by 2007. In 2013, the Pradhan Mantri Gram Sadak Yojana’s
second phase (PMGSY-II) was rolled out, which aims to consolidate the existing rural roads
network and to upgrade existing rural roads which are prioritized as per their economic
potential.
In planning and prioritization of roads, every block had to prepare a Block Rural Road Plan
(BRRP) which has inventory of roads, connecting villages, traffic data, PCI obtained by visual

9
observation and other facilities connected by the road such as hospitals, schools, marketplaces
etc. The District Rural Road Plan (DRRP) is a combined plan of all BRRP’s for that particular
district.
For PMGSY-II, only those states which have completed 100% of new connectivity and 75%
of upgradation in PMGSY-I are being taken up. The selected roads under PMGSY–II expected
them to be mainly ‘Through Routes’. Though in the DRRP of PMGSY-I, there is no strict
definition of ‘Through Routes’ and ‘Link Routes’, the DRRP prepared under PMGSY-II was
needed to make this categorization. Roads catering to large populations by connecting
populations over a large area and which act as collectors of traffic from smaller roads were
treated as ‘Through routes’ for the purpose of PMGSY-II.
Every state has a dedicated unit for implementation of PMGSY called as State Rural Road
Development Agency (SRRDA). All the data is monitored through a portal ‘Online
Management, Monitoring and Accounting System’ (OMMAS)’ specially designed by Centre
for Development of Advanced Computing (C-DAC) and NRRDA. The quality monitoring
system in PMGSY is made up of three-tier with Program Implementation Unit (PIU), State
Quality Monitors (SQM) and National Quality Monitors (NQM). At a base level, Program
Implementation Unit (PIU) monitors the quality of construction. PIUs have to maintain records
of all materials testing in Quality Resister Volume-1 and Quality Register Volume-2 (abstract
of results). At second level, independent SQM visits a particular work and inspect the work
through various necessary tests & observations and reports to SRRDA as well as upload the
abstract of inspection on the OMMAS portal through mobile application.
In the third tier, independent NQM inspects the road. PMGSY has a strong technical support
from renowned state engineering colleges for verification of DPRs and resolves
implementation difficulties called State Technical Agencies (STA). Also, there are Principal
Technical Agencies (PTA) across India for technical assistance. The Central Road Research
Institute (CRRI) also helps out to PMGSY implementation by providing technical guidance on
design and implementation.
Every road is designed for a certain life after which it needs to be reconstructed. For
rural roads, the design life is 10 years for flexible pavement and 20 years for rigid pavement.
A road starts deteriorating from the day it is opened for traffic due to various parameters like
uses by vehicles, rainfall and climate factors. Thus, there is a need for continuous maintenance
of the roads with routine and periodic maintenance. But due to budget constraints, maintaining
approximately 39 lakh km rural roads in India (Source: Basic road statistics of India 2015-16,
MoRTH) is not efficiently taking place leading to deterioration at a faster rate resulting in a
reduced working life. Reduction in working life or fast deterioration can be controlled by
assuring quality of road during construction. If the quality is good, it requires less maintenance
and it provides longer service. Thus, it is important to have schemes or programs for
upgradation of deteriorating roads in order to keep villages connected.

10
A road is no longer usable when it either reaches the end of service life or faces heavy
deterioration. In such condition pavements will be no longer comfortable for driving at
designed speed or may lead to increased congestion and longer travel time as well as accidents.
Road can be maintained by periodic maintenance or depending on deterioration road have to
be rehabilitated. As the number of roads is very large, it is not possible to upgrade and
rehabilitate all roads every year due to insufficient funding. Only a few have to be chosen for
upgradation and rehabilitation through standard prioritization methods.
1.6 Methodology of Study
This study is to evaluate the PMGSY roads in terms of its quality of construction, physical and
financial progress, and its social and environmental impacts. The study is across the state and
the detailed methodology of study based on the type of evaluation is given in subsequent sub-
sections.
1.6.1 Methodology for selection of roads for the evaluation study
The design of roads is based on the traffic on it (in CVPD/PCI), base soil strength (in CBR),
and climatic zones (rainfall). This study selected samples based on different agro-climatic
zones of Maharashtra. The agro-climatic zone map of Maharashtra is adapted from Department
of Agriculture, Government of Maharashtra. There are nine different agro-climatic zones of
Maharashtra as listed in Table 1.4 and the detailed geographical spread of these agro-climatic
zones is shown in Figure 1.1a. In each of the agro-climatic zones, one district was selected.
The three agro-climatic zone Western Ghat zone, Sub Mountain zone and Western Maharashtra
Plain zone are represented within a very thin strip. Transition zones with a variation in rainfall
as well as terrain condition were covered in only Kolhapur district as it spread all over these
three zones. Thus, the study was carried out in various blocks of the seven districts based on
the terrain condition.
Sampling for the socioeconomic study was done based on different roads connectivity type i.e.
new connectivity and upgradation. The other parameter which was considered while sampling
was the population of habitations.
In each of the above-selected districts, four roads were selected for socioeconomic evaluation,
environmental impact assessment and performance purpose. Out of these four roads, two roads
were from New Connectivity and two roads from Upgradation. The selected two roads from
New Connectivity and Upgradation were further divided into different population size of each
500 and 1000 population. However, in case of hilly region population size of 250 was
considered. Further in particular district where either new connectivity or upgradation roads
alone were available, roads of different age were taken as samples with the population criteria
remaining the same. Figure 1.1b represents the sampling methodology adopted.

11
Table 1.4 Agro-Climatic Zones of Maharashtra
Sr.
No.
Name of the Zone Geographical spread of the zone/ Districts
and Tehsils included
Climatic conditions Average annual rainfall Sample
District
I Very high rainfall
zone with laterite
soils
Comprises mainly of Ratnagiri and
Sindhudurg Districts Total area of the zone is
13.20 lakh ha area under cultivation 3.5 lakh
ha.
Daily temperature above 20°C.
Throughout the year. May hottest
above 33°C. Rainfall due to S-W
monsoon from June to Sept.
3105 mm in 101 days Ratnagiri
II Very high rainfall
zone with non-
lateritic soils
Comprises of Thane & Raigad districts. Total
area 16.59 lakh ha. Net sown area 4.69 lakh
ha. With forest zone about 3%. 32% of the
land is under forest.
Average daily temp 22 to
30°C.Mini. temp 17 to 27°C.
Humidity 98% in rainy season &
winter-60%
2607 mm in 87 days.
Maximum rain received in
July i.e.41%
Palghar
III Western Ghat Zone
/Ghat zone
It includes hilly high lying terrains of
Kolhapur, Satara, Pune, Ahmednagar &
Nasik districts & small area of Sindhudurg
district. Altitude varies from 1000- 1900 mt
Maximum temp. ranges from 29-
39°C. Minimum temp ranges from
13-20°C
3000 to 6000 mm. Rainfall
recorded in different places
of the zone viz. Igatpuri,
Lonavala, Mahabaleshwar,
& Radhanagari
Kolhapur
IV Sub Montane Zone/
Transition Zone 1
Spreads over 19 Tahsils of five districts viz,
Nasik, Pune, Satara, Sangli & Kolhapur. The
area of the zone measures 10,289 Km2
Average maximum temperature is
between 28-35°C and minimum
14-19°C
700-2500 mm of Rains
received mostly from S-W
monsoon.
Kolhapur
V Western Maharashtra
Plain Zone
/Transition-2
This zone includes Tahsils of Dhule,
Ahmednagar, Sangli & central tahsils of
Nasik, Pune, Satara & Kolhapur districts
Water availability ranges from
120-150 days.Maximum
temperature 40°C & minimum 5°C.
Well distributed rainfall
700 to 1200 mm.
Kolhapur
VI Western Maharashtra
Scarcity Zone/
Scarcity Zone
This zone covers a geographical area of 73.23
lakh ha. The gross & net cultivated area is
58.42 and 53.0 lakh ha respectively.
Suffers from very low rainfall with
uncertainty & ill distribution. The
occurrence of drought is noted
once in three years. Dry spell varies
from 2-10 weeks. Water
Less than 750mm in 45
days. Two peaks of rainfall.
1) June/ July
Ahmednagar

12
availability 60-140 days. Which is
affected due to
1) delayed onset of monsoon 2) September. A bimodal
pattern of rainfall.
2) Early cessation of monsoon.
Maximum temperature 41°C
Minimum 14-15°C
VII Central Maharashtra
Plateau Zone
/Assured Rainfall
Zone
Comprises parts of Aurangabad, Jalna Beed
& Osmanabad districts. Major parts of
Parbhani & Nanded & complete Latur
Buldhana & parts of Akola, Amravati,
Yavatmal, Jalgaon, Dhule & Solapur.
Maximum temperature 41°C
Minimum temperature 21°C
700 to 900 mm 75 % rains
received in all districts of
the zone.
Parbhani
VIII. Central Vidarbha
Zone /Zone of
Moderate Rainfall
The zone includes entire Wardha, major parts
of Nagpur, Yavatmal Two Tahsils of
Chandrapur & parts of Aurangabad, Jalna,
Parbhani & Nanded districts.
Maximum temperature 33-38°C
Minimum temperature 16-26°C
Average daily humidity 72 % in a
rainy season, 53 % in winter &
35% in summer.
1130 mm. Bhandara
IX. Eastern Vidharbha
Zone/ High Rainfall
Zone
Includes entire Bhandara & Gadchiroli and
parts of Chandrapur and Nagpur districts. The
geographical area is 32.7 lakh Ha.
Mean Maximum temperature
varies from 32 to 37°C. Minimum
temperature 15 to 24°C. Daily
humidity 73% for rainy season 62
winter & 35 summer
950 to 1250 mm on the
western side. 1700 mm on
extreme east side No on
rainy days 59.
Yavatmal
Source: http://www.mahaagri.gov.in/CropWeather/AgroClimaticZone.htmldated12/1/17

13
Figure 1.1a and 1.1b Agro-climatic zones of Maharashtra and Sampling Methodology Adopted
14
1.6.2 Methodology for Technical Evaluation
The technical evaluation carried out included testing of roads on-site for on-going as per rural
roads specification provided by MoRD. The quality of the construction was tested by material
testing and the workmanship testing was done by following the format of State Quality
Monitors (SQM). The material testing was carried out for all used materials. The results were
validated against the standards provided by Indian Road Congress (IRC) as well as Quality
Assurance Manual Volume 1 and 2 by NRRDA.
For quality and serviceability evaluation of PMGSY built road, distresses were measured on
sample road sections with statistical sampling methods, using distress identification guide by
American Association of State Highways and Transportation Officials (ASHTHO) as well as
American Society for Testing and Materials ASTM D 6411-11 code. Based on this distress
data, the performance of the PMGSY road was found out and an overall Pavement Condition
Index (PCI) was arrived at which is an indicator for roads quality and maintenance. All the 19
types of distress were noted for asphalt pavement using visual observation. Parameters that
were studied for the technical evaluation of PMGSY roads are mentioned below
1. For on-going works and just completed works, material and workmanship testing as per
SQM report format validating results with IRC standards or records at PIU by actual
testing on sample road.
2. For roads in maintenance period validating all up to date records and their validation
on the actual field using visual observation.
3. For completed roads evaluating its performance using distress measurement as per
ASTM D-6433-11 or distress identification manual by ASHTHO and analysing the
performance.
4. Assessing secondary data available on OMMAS for analysis of SQM and NQM data
and inferences such as adequacy of sampling, their methodology of inspection, lack of
digitalization and analysis.

15
Figure 1.2 Indicators for Technical Evaluation
1.6.3 Methodology for Physical and Financial Evaluation
The financial evaluation of PMGSY roads was based on many parameters which are as follows.
1. Per kilometre cost (in different districts and reasons behind the difference.)
2. Bridges and roads cost evaluation.
3. Analysis of financial spending on new road and upgradation.
4. Investment per lakh rural population.
5. Based on annual targets does the financial needs of the state or district meets or not and
analysis of financial data for different types of road projects such as R & D roads.
6. Financial delays and issues pertaining to it.
7. Financial spending on labour.
The financial resources may be central government, state government, World Bank,
NABARD, and Asian Development Bank or any other agencies. All the data for
financial analysis was collected from secondary sources like PIU, OMMAS, MRRDA
and contractors.
For Completed Roads, Road Distress
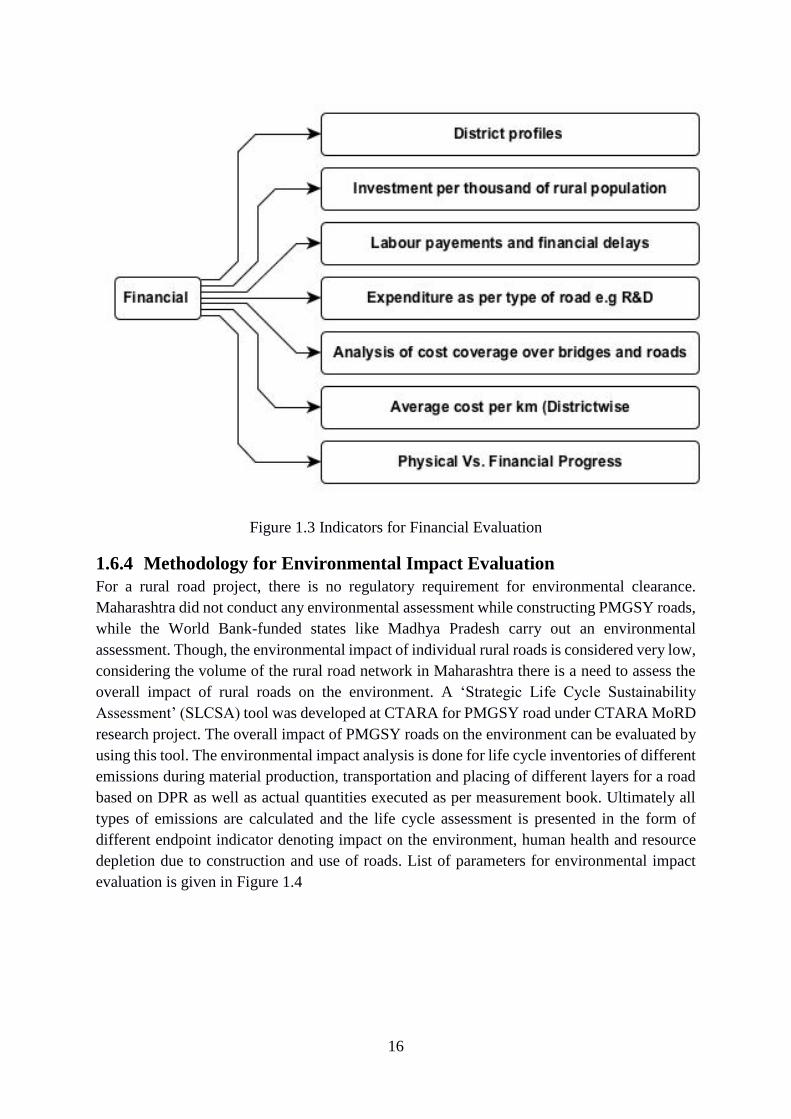
16
Figure 1.3 Indicators for Financial Evaluation
1.6.4 Methodology for Environmental Impact Evaluation
For a rural road project, there is no regulatory requirement for environmental clearance.
Maharashtra did not conduct any environmental assessment while constructing PMGSY roads,
while the World Bank-funded states like Madhya Pradesh carry out an environmental
assessment. Though, the environmental impact of individual rural roads is considered very low,
considering the volume of the rural road network in Maharashtra there is a need to assess the
overall impact of rural roads on the environment. A ‘Strategic Life Cycle Sustainability
Assessment’ (SLCSA) tool was developed at CTARA for PMGSY road under CTARA MoRD
research project. The overall impact of PMGSY roads on the environment can be evaluated by
using this tool. The environmental impact analysis is done for life cycle inventories of different
emissions during material production, transportation and placing of different layers for a road
based on DPR as well as actual quantities executed as per measurement book. Ultimately all
types of emissions are calculated and the life cycle assessment is presented in the form of
different endpoint indicator denoting impact on the environment, human health and resource
depletion due to construction and use of roads. List of parameters for environmental impact
evaluation is given in Figure 1.4

17
Figure 1.4 Indicators for Environmental Evaluation
1.6.5 Methodology for Socio-Economical Evaluation
The socioeconomic evaluation study was carried out using social surveys with social science
research methodology tools including individual household surveys using a closed-ended
questionnaire for primary data collection and secondary data collection from different agencies
in a participatory manner. The primary data was collected from the local community to
understand the various positive and negative impacts of a road on them. The qualitative analysis
of the socio-economic impacts of a rural road was done in this study. For the socioeconomic
evaluation following broad indicators were proposed. Each broad indicator is subdivided into
18
sub-indicators which are discussed in details in the chapter on socioeconomic evaluation
separately.
1. Transport Indicator: The several sub-indicator of transport were used to understand
the effect of traffic, fleet, trade, safety, revenue, accessibility, and much more due to
the construction of the road which may cause the change in the pattern of transportation.
2. Agriculture and allied sector: The parameters like agriculture production and
productivity helped us to understand the change in land usage, dependency on fertilizer,
change in production and productivity of crops, the price of goods, and the status of
beneficiaries.
3. Small-scale enterprise sector: In this part, we came to know the other sources of
income apart from agriculture, the introduction of new facilities or technology and other
available opportunities.
4. Employment and Livelihood generation: This indicator is focussed on the available
credit, local market, land price, livelihood and change in basic needs of the beneficiaries
in the day to day life.
5. Education sector: This sector helped us to understand the educational progress both
qualitative and quantitative. It will also help us to understand gender wise, age wise,
caste and religion wise change in educational pattern.
6. Health sector: It gave an idea about the health of the population. And also indicated
the ease of getting a medical facility, nutritional, mortality and morbidity, social and
mental assessment.
7. Social Interaction Indicators: This indicator helped us to understand the women
participation, social gathering, and beneficiary’s interaction with nearby habitation and
marketplaces.
8. Stakeholders involved in PMGSY construction: To understand the participation of
the locals during the construction of the road, various stakeholders were included in the
survey. This indicator mainly focussed on the various facilities provided, safety
measures taken and education available for their children during the period of road
construction. Their awareness regarding rules & regulation and gender-wise
involvement during the project was also observed.
9. Poverty Alleviation: From this indicator, we came to know to what extent that the
construction of the road has brought prosperity to the rural people and we also came to
know about the change in their per capita income, food habit, job availability,
empowerment and security.

19
Figure 1.5 Indicators for Socioeconomic Evaluation
1.7 Work Plan The entire work was divided into 12 activities, which are shown in Table 1.2 and the tentative
timeline proposed for each of the activities is given in Figure 1.5.
Table 1.5 Activities to be taken up for the proposed work
Activity Task
A Preparation of closed-ended survey forms for socio-economic survey and
different social science research methodology tools.
B Preparation of test and their standards for construction quality testing and
workmanship testing.
C Selecting the roads with satisfying sampling methodology so that it can be a
representative sample.
D Actual testing on site in different districts of Maharashtra for quality.

20
E Surveying the required households or pertained stakeholders for socioeconomic
study.
F Collection of data from DPR and MB from respective PIU.
G Collection of distress data from sites using equipment’s and techniques for
performance evaluation
H Collecting secondary data from agencies like MRRDA, PIU and State quality
controlled (SQC) for concerned roads.
I Digitalization of primary survey data and analysis of data.
J Analysis of data and representation of results.
K Report preparation and presentation.
Figure 1.6 Timelines for each of the activities for Evaluation of PMGSY
Activity W1 W2 W3 W4 W5 W6 W7 W8 W9 W10 W11 W12 W13 W14 W15 W16 W17 W17 W17 W17 W17 W17 W17 W17 W17 Total
44
46
45
55
55
512
55
812
78
66
610
Note Proposed Progess Actual Progress
G
H
I
J
K
F
C
A
B
D
E

21
1.8 Structure of the Report
Chapter 1 is an introduction which details about the PMGSY scheme, parameters for evaluation
of schemes, methodology adapted for evaluation in detail and sampling strategy used. Briefly
explain about socioeconomic, technical, environmental and physical and financial progress
parameters and the methodology used for its evaluation.
Chapter 2 gives the technical evaluation of PMGSY roads in terms of quality monitoring,
management and its implementation on field. This chapter deals with parameters used for
technical evaluation of brief and results obtained after the analysis of primary and secondary
data on quality.
Chapter 3 is related to physical and financial evaluation where all the data obtained from PIU,
OMMAS, MRRDA and contractors were evaluated. The parameters like physical progress at
the state level and district level, financial differences were analysed and interpretation was put
forth in this chapter.
Chapter 4 gives details about Environmental impact Evaluation which was carried out using
Strategic Life Cycle Sustainability Assessment (SLCSA) tool developed at CTARA, IITB and
NRRDA.
Chapter 5 is Socio-Economic Evaluation which was done by selecting seven districts of
Maharashtra. The analysis of socioeconomic survey data was done in order to find out the
indirect impact of PMGSY roads on different sectors like health sector, transport sector,
education, and agriculture, migration, and infrastructure availability.
Chapter 6 gives the conclusion of the overall PMGSY evaluation work.

23
2 Technical Evaluation of PMGSY
Introduction
Technical evaluation of PMGSY scheme involves assessing the quality of the works with
respect to material and workmanship as well as quality control mechanism/system. The quality
control system in PMGSY consist of three-tier system; the first tier composed of Project
Implementation Unit (PIU) keeps the records of all the tests as per guidelines and specification
for a particular quantity of work at the field laboratory as well as the district laboratory. In the
second tier, the State Quality Monitors (SQM) help to improve the quality during construction
by visiting at different stages of the work minimum three times for a particular work. Similarly,
there is the third tier independent quality monitors i.e. National Quality Monitors (NQM), who
visits every work minimum one time and inspect the work as per the format by National Rural
Road Development Agency (NRRDA).
Sub-objectives for technical evaluation
1. To review and assess quality monitoring system in PMGSY
2. To assess the quality standards and the inspection format followed by implementation
agency on field
3. To evaluate quality of on-going roads by onsite testing
4. To evaluate performance of completed roads in terms of maintenance after construction
5. To evaluate condition of pavement for competed roads and rating in terms of Pavement
Condition Index (PCI) as per ASTM D-6433
6. To analyse secondary data on quality inspection by SQM and NQM district wise to
assess the performance of districts with respect to quality
7. To analyse SQM and NQM inspection data from abstract on Online Management,
Monitoring, and Accounting System (OMMAS) item wise in order to find recurring
items leading to SRI and U grading
8. To review of “Meri Sadak” app a citizen feedback system
Methodology
The methodology consists of two types of works: first was a collection of primary data for the
third, fourth, and fifth sub-objective and second was an analysis of secondary data collected
from OMMAS and PIU for sub-objectives six, seven, and eight. The sub-objectives one and
two were evaluated based on literature survey and observations during the field visit. The
detailed methodology for each sub-objective is explained below.
1. The quality monitoring was reviewed by understanding the organization set up for
quality monitoring in PMGSY policy and verification of its efficient implementation on
the ground. A detailed literature review was done to find the quality control set up,
guidelines and standards used in PMGSY. This involved an on-field checking for a
project and its efficiency in terms of implementation and was checked during field visits
for various parameters. The parameters like quality monitoring system, availability of

24
laboratories as per guidelines, the periodic inspections carried out by various levels of
staff (JE, SE, CE) and the methodology and standards followed by the PMGSY in
Maharashtra.
2. The quality test methods and frequency standards followed by the DPIU were reviewed
and the formats followed by the quality inspector were evaluated. Comments regarding
the adequacy of the format were done based on onsite experiments and interaction with
PIU officials and SQM. These formats, if found adequate would be used as it is or with
changes for actual testing of on-going roads.
3. Onsite testing was done for two aspects, first, checking the format usage adequately or
not and second, assessing the implementation of quality guidelines and standards. In
each of the sample districts on one of the on-going road, material and workmanship tests
as per SQM standards were done with the help of PIU’s resources. The on-going roads
were tested for the quality by testing of construction quality. Checking the quality
control set up included maintenance of quality control register, testing of material
quality, adequate visits by DE, EE, SQM and NQM.
4. For completed roads or roads under maintenance stage, a separate inspection format was
prepared and used for the four roads in each district selected. The evaluation parameters
were subjective based on visual observation and were linked to maintenance of roads.
For the inspection, the whole road was first travelled in a vehicle and at several points,
visual observations were made and photograph taken.
5. The pavement condition was assessed using ASTM D-643-11 method “Standard
Practice for Roads and Parking Lots Pavement Condition Index Surveys”. Following
the standard guidelines, distress on four roads in each sample district were measured
and a Pavement Condition Index (PCI) for each roads were derived. The method to
derive PCI has mentioned in respective paragraph ahead.
6. In order to check quality and performance of districts, an analysis of SQM and NQM
data on quality at state and district level was done using the secondary data available on
the OMMAS website. Analysis of data was done for performance, based on overall
grading for all works inspected by SQM and NQM from the year 2010 to 30th May 2017.
7. An item wise analysis of SQM and NQM data at district level was done in order to find
out recurring causes leading to grading of road as Unsatisfactory (U) or Satisfactory
Requiring Improvement (SRI). The item wise grading for every road was extracted from
abstract of SQM and NQM inspection data available on OMMAS for all U and SRI
graded works only.
8. A review of Meri Sadak app for grievance redressal on quality of roads was done
through the secondary data available on OMMAS website.
Sampling
A sampling strategy was developed for the primary technical evaluation as mentioned in
methodology point numbers three, four, and five. For technical evaluation of PMGSY roads,
two types of roads, namely, on-going (in-progress) and completed roads were selected in each

25
district with the help of PIUs of each district. The on-going roads were selected in such a way
that road work should not be at an initial stage rather it should be at near completion stage so
that all the aspect of quality with respect all layers can be evaluated. Thus, based on the
discussion with PIU regarding the ongoing works progress, appropriate roads were selected in
six districts namely Parbhani, Bhandara, Yavatmal, Kolhapur, Ratnagiri and Palghar. The
completed roads considered for technical evaluation were for checking maintenance condition
and pavement condition of the roads and these roads must be of different age to get distinct
performance. In each district, four completed roads were selected for maintenance and
pavement condition evaluation. These four selected roads in each district were used for both
socioeconomic and technical evaluation simultaneously. The selection was done on discussion
with PIU keeping in mind sampling criteria for socioeconomic as well as technical evaluation.
The sample roads in each district for both on-going and completed roads are shown on the map
Figure 2.1
Figure 2.1 Map of sample roads for on-going testing as well as maintenance of works

26
2.1 Quality control set up and its implementation
2.1.1 Quality Control System
Quality management in PMGSY, which includes quality checks for every work including
material and workmanship is carried out by three different agencies. Project Implementation
Unit (PIU) at the district level is primarily responsible for the quality of roads. PIU is
responsible to ensure the establishment of site laboratory, workmanship quality and the
frequency of inspection. Visits to the site by PIU staff recommended while the work is in
progress are daily by JE in-charge of work, twice a week by assistance engineer, and once a
week by an executive engineer.
The independent monitoring of quality at the State level has been prescribed under the second
tier, wherein the States are required to monitor the quality of works by the deployment of quality
monitors, independent of the executing machinery. The works are required to be inspected at
three important stages of construction, i.e., formation, pavement construction and finishing or
completion stage. The State Quality Monitors (SQM) should be a graduate civil engineer not
below the rank of SE and must possess field experience of at least five years during last ten
years. The SQM visits are planned by State Quality Controller (SQC) for that State. SQC must
take care of that for every work, there must be atleast one SQM visit at all important stages of
the work at least. Each work is assessed by different SQMs during all its period such as
construction as well as maintenance period of five years as mentioned in guidelines for PMGSY
roads. The role of SQM is to oversee the satisfactory functioning of the quality control
mechanism within the State and at PIU level and follow up the reports and improvements
suggested by NQM to take appropriate actions.
The Third tier is an independent monitoring mechanism at the Central level. Under this tier, the
retired senior engineers termed as National Quality Monitors (NQMs) are engaged in
inspections of roadworks. For a road work there must be one NQM inspection and during the
visit, NQM inspects all the works previously completed but not inspected by any NQM before.
The basic objective of this tier is to identify systemic issues and bring it to the notice of the
executing agency to enable them to take appropriate steps so that the issues are not only
addressed for the work inspected but systemic improvements are also brought in the working
of PIUs. The reports of NQM are closely monitored for the action at all levels. It is mandatory
for the NQM to make observations on the basis of quality control tests or hand-feel tests or
measurements performed under his personal supervision.
2.1.2 Laboratory set up for quality testing
Field laboratory- For any work, a field laboratory must be set up within the first week of the
starting of the actual work and maintained by the contractor. Field laboratory should be nearby
to the construction site and must be fully equipped with all equipments as mentioned in “Quality
Assurance Handbook Volume-II (QAH V-II)” which is adapted from IRC: SP: 20-2002
Appendix 10.2. All the equipments should be adequate and calibrated using standards. There

27
must be a technician who can handle the laboratory. All tests are conducted by the civil engineer
of the contractor in presence of JE/AE.
District Laboratory- There must be one district laboratory where all the equipment related to all
stages of work are present as per the clause 120.1 to 120.7 of the QAH V-II. This laboratory
should be handled by trained technicians and in-charge of this laboratory is an engineer of the
level of assistant engineer. This laboratory takes independent testing of each stage of work and
sends the results to executive engineer to crosscheck results recorded on field laboratory.
Central Laboratory-The Central laboratory should have all equipment as mentioned in clause
number 121.1 to 121.6 of QAH V-II. This includes equipment for sampling, testing of soil,
aggregates, cement, concrete and bituminous mixes. The central laboratory is located at each
division and monitored by a civil engineer of the level of AE.
2.1.3 Technical support for PMGSY
There are different agencies to support the implementation of PMGSY efficiently with technical
guidance at different levels. Indian Road Congress (IRC) and Central Road Research Institute
(CRRI) at central level help out in the preparation of guidelines for implementation, standards
for quality monitoring and techniques for use of new materials. All the standards and procedures
right from designing to the construction of PMGSY roads are adapted from the various IRC
codes. Above all, each state is assigned to an engineering college for technical support and are
called Principal Technical Agency (PTA). Similarly, each district is assigned to a local regional
engineering college for technical support called as State Technical Agency (STA).
Central Road Research Institute (CRRI) - The appropriate work methods for rural road
construction and maintenance using local skills, local materials and light machinery are
developed by CRRI and IRC in coordination with MoRD. Under the sponsorship of NRRDA,
the CRRI is a key partner to provide overall technical support in mainstreaming of the current
technologies in the execution of PMGSY. CRRI also helps out in demonstration project i.e. R
& D projects to identify the need for instruments and evaluating the performance. Thus CRRI
is a key partner to NRRDA for preparation of manuals, hand-outs on current technology and
accredited materials that have successfully used in road construction. The CRRI and other
institutes of academic excellence helped in the capacity building of the PIUs and STAs.
Indian Road Congress (IRC) - The IRC has similar functions as that of CRRI, and in addition,
IRC also provides technical support through developing standard codes for construction of rural
roads. In order to achieve high quality in such roads, the IRC has prepared IRC: SP: 20-2002 –
“Special Publication on Rural Roads” and was solely designed for PMGSY in 2002. IRC
provides guidance to PIUs regarding use of newly introduced technology or materials to PIU.
The list of IRC specifications which are used in rural road construction is given Appendix-III
of book Quality Assurance Handbook V-I by MoRD.

28
Principal Technical Agency (PTA) - There are six Principal Technical Agencies (PTA),
including Indian Institute of Technology (Bhuvneshwar, Kharagpur, Roorkee), National
Institute of Technology, Warangal, Birla Institute of Technology, Pilani and College of
Engineering, Bangalore. These PTAs are assigned specific states in their region to provide
technical assistance to PIUs as well as STAs. Currently, CRRI is assigned to Maharashtra as
PTA after IIT Mumbai backed out its support. The roles and responsibilities of PTA are given
as below.
• To oversee the activities of the State Technical Agencies (STAs) in the region and
advise/ assist in resolving issues that may arise at the time of the scrutiny of District
Rural Road Plans (DRRP) and Project Proposals of the States.
• To organise orientation/refresher programmes to the STA personnel for proper scrutiny
of project proposals.
• To advise Project Implementing Units (PIUs) on any region-specific issues that will
have a bearing on the design, construction and performance of rural roads.
• To design and manage regional training programmes for the engineers of PIUs and
contractors by developing course material for different training modules and acting as
resource persons/ institutions.
• To manage regional quality control system and assist NRRDA with the analysis of
quality monitoring reports of State Quality Monitors (SQMs) and National Quality
Monitors (NQMs). It will also help in identifying and resolving the issues arising out of
Quality Monitoring System.
• To evaluate specifications, practices and the use of locally available materials for
making the proposals cost effective.
• To formulate design specifications for new and innovative technologies.
• To study the gaps in the existing practices in rural roads construction and to identify
areas for R&D. The PTA also assists NRRDA in processing the R&D Proposals and
entrusting the same to the reputed organizations.
State Technical Agency (STA) - There are 77 State Technical Agencies (STA) in India with
more than one STA in each state depending on geographical profile and division in the state.
STAs are envisaged as catalysing agents in the state level rural road programme, in order to
improve the management and execution at the field level. In Maharashtra, there are five STAs
namely Sardar Patel College of Engineering, Mumbai, Govt. College of Engineering,
Aurangabad; Govt. College of Engineering, Pune; Govt. College of Engineering, Amaravati;
and SVNIT, Nagpur. The roles and responsibilities of STAs are as follows
1. Verification of District Rural Road Plan (DRRP) prepared at the district level.
2. Post scrutiny of the core network is done by STA after finalisation of core network by
district panchayats.
3. Scrutiny of Detailed Project Reports (DPR) for any sanctioned road work. While
scrutinising the DPRs STA must ensure

29
a. That each DPR is made on the basis of thorough field investigation. If necessary
additional data may be asked for.
b. STA need to liaise with DPIUs to ensure proper phasing out of the process.
c. That the basic parameters viz, traffic and CBR are properly estimated.
d. That the design is appropriate and there is not overdesigning.
e. Investigate that all possible economics on the use of materials, including soil
stabilisation measures, use of alternative material like fly ash/ industrial waste
etc. have been fully explored and use appropriately wherever possible.
4. Provision of requisite technical support to the State / District Units on its demand in the
design of works involving a special problem. In all “cross drainage” (CD) works, the
PIU shall associate an STA, if the span exceeds 25meters. STA is to be involved in the
routine monitoring work. However, if the project uses new or innovative technology or
R&D project, district PIU may take technical services of STA in studying benefits in
order to make a general recommendation on utility.
5. Undertaking road design and quality control tests for district PIU can be done in the
STA laboratories by sending samples to STA laboratories. STA can cooperate with
other engineering colleges in the vicinity of the project so that routine testing for design
and estimation could be done.
6. Operationalization of training manual prepared by PTA by forming resource personnel
from own or another institute. STA is responsible for conducting training and evaluating
feedback for future training needs. STAs prepare audio-visual training material for
dissemination and use under overall specification and guidance of STA.
The overall set up of the Quality Management System in PMGSY is as shown in Figure 2.2
Figure 2.2 Quality Monitoring System in PMGSY
30
2.2 Findings of the study on quality control setup During the evaluation study, observations were made in order to check whether all the
arrangements are in place or not. A visit to district laboratory was made in each sample district
and an information sheet was shared to know adequacy and capacity building of laboratory
staff. The observation made to check the quality control system’s existence on the field and to
how strictly, and all necessary technical checks were carried or not. The detail observations
made on the field are enlisted below.
1. Every district surveyed had a laboratory at district level setup by PMGSY with all
necessary equipment. The facility is used for all testing of PMGSY roads in the district
as well as other departments. This is a source of revenue for PIU at the district level.
2. Every laboratory has one dedicated engineer as in-charge, who was responsible for all
the test result’s verification. However, on interaction with few site engineers, it was
found that, as they know the test results acceptance range they just put the results or
modify accordingly and pass the tests. Few of the PIU engineer told that only two or
three JE actually know the testing and their standards while, the rest are unaware of the
procedures for conducting the tests.
3. Most of the staff at PIU were Assistant Junior Engineer on a contractual agreement of
six months and almost all hold a diploma. There was no capacity building or training
provided to these contractual staff. NRRDA provides training only to permanent staff
but not to contractual staff.
4. Every project estimate needs to be verified by STA and on enquiring it was found that
every DPR was verified by concerned STA for each and every work.
5. As per the PMGSY guidelines, no payment would be released to the contractor until the
field laboratory is set up on-site with necessary equipments and as a part this quality
arrangement evaluation on all of the surveyed ongoing roads, an observation was made
about the presence of the laboratory. It was observed that for all the inspected works
there was an independent site laboratory established.
6. In Yavatmal, and Bhandara, site laboratories were set up for each road at the
construction site and in districts Kolhapur, Palghar, and Parbhani laboratory was setup
someone's house in the nearby village. However; during evaluation it was observed that
most of the laboratories equipment were arranged for the purpose of inspection and
made available during SQM or NQM inspection only so that the SQM/ NQM should
not grade the item in “Quality Arrangement” in inspection format as “U”. Even SQM
and NQM also grade it as “S” though they know about the equipment were not used for
the test.
7. One of the reasons for setting the laboratory in someone house was that there was lack
of electricity which prohibits several tests which are dependent on electricity.
8. In order to evaluate the SQM’s quality inspection, two visits were made with SQM in
the districts Yavatmal and Palghar. It was found that there was slight flexibility in
acceptance of results though the results are not as per the required standards.

31
Table 2.1 Quality laboratories staff and their capacity building
Sr. No. District Parameter Degree Diploma Total
1 Ahmednagar No. of Engineer 1 1 2
Training Received Yes
2 Parbhani No. of Engineer 1 1 2
Training Received No
3 Yavatmal No. of Engineer 1 1 2
Training Received Yes
4 Bhandara No. of Engineer 1 1 2
Training Received Yes
5 Kolhapur No. of Engineer 1 1 2
Training Received Yes
6 Ratnagiri No. of Engineer 1 1 2
Training Received Yes
7 Palghar No. of Engineer 0 1 1
Training Received Yes
Source: Information collected from PIU
2.3 Technical specification and standards followed by PMGSY The Quality standards followed under PMGSY are of Class Q-2 i.e. Normal Quality Assurance
as per IRC: SP:57-2000 standard. The Class Q-2 involve major district roads and other district
roads while Q-1 involves village roads and Q-3 is for the state highways & national highways.
Thus, though the roads built under PMGSY are village roads, standards followed are higher
than that for village roads. For some special project, still higher standards can be used by PIU.
Keeping in mind this class of quality standards, guidelines for PMGSY were prepared. All the
PMGSY guidelines are enumerated in “Specification for Rural Roads-2014”, which in turns
follows all the specifications as per various IRC standards. All the quality checks are to be
confirming to “Specification for Rural Roads-2014 (First Revision). Though PMGSY promotes
the use of the local material in construction, it tries to ensure the qualities of the material by
putting checks. For every material, there is a specification for checking the parameters of the
material which in turn impacts the quality of roads.
Two separate guidelines have been issued by MoRD for quality assurance. First volume details
about quality management system and quality control requirements named as “Quality
Assurance Handbook for Rural Roads Volume-I” (QAH V-I) issued in 2007 and the second
volume namely “Quality Assurance Handbook for Rural Roads Volume-II” (QAH V-II) details
about equipment and procedures for tests. Both the volumes follow the standards provided by
IRC specification and recollects them with simplified observation formats for all necessary tests
to ease site engineers.
The NRRDA, MoRD has issued two separate formats for keeping a record of observations for
quality control tests named as “Quality Control Register Part-I” and “Quality Control Register

32
Part-II”. The Part-I details about testing and record keeping of all observations in the specified
format of all the necessary tests on material and workmanship. Similarly, the Quality control
register Part-II is issued to keep a record of abstract of all the tests that are conducted and
recorded in Part-I. Both Part-I and Part-II need to be maintained by JE of PIU and contractor
combined. All the PMGSY quality tests need to be conducted by following the standard
procedure as per guidelines given in QAH V-I &II and observations were recorded in a specific
format given in Quality Control Register issued by NRRDA. The contractor must follow the
frequency of test that are needed to be conducted in the presence of Junior Engineer (JE),
Deputy Engineer (DE), and Executive Engineer (EE) for given quantity of materials or length
as specified in quality assurance handbook Part-I and II. If the material fails to satisfy the criteria
as per handbook, appropriate actions needs to be taken by the PIUs, example rejecting the
material or improving the quality of the material with alternatives.
The evaluation of this part in the study was done in 3 steps
1) Reviewing the PMGSY guidelines and crosschecking with IRC standards.
2) Checking of the SQM and NQM formats with the filled formats to know adequacy of
the form filled.
3) Checking the actual test results with the formats filled by the SQMs and NQMs.
The following table gives 13 items that a SQM or NQM needs to inspect during their field
visits, followed by details about each item.
Table 2.2 Items for inspection by SQM or NQM during field inspections
Item
No. In Progress Grading
1 Setting Out and Working Drawing S SRI U
2 Site Clearance and Grubbing S SRI U
3 Quality Arrangement S SRI U
4 Geometrics S U
5A Earth Work and Sub-grade in Embankment/ Cutting S U
5B Earthwork Cutting in Hilly/ Rolling Terrain S U
6 Sub-Base S U
7 Base Course - Water Bound Macadam S U
8 Bituminous Layer - Premix Carpet(PMC)/Surface
Dressing(SD) S U
9 Shoulders S SRI U
10 Cross Drainage Works - Causeways of all spans and
Culverts up to 6 m span S SRI U
11 Side Drain and Catch Water Drain S SRI U
12 CC/ Semi-Rigid Pavements and Associated Pukka Drains S U

33
Item
No. In Progress Grading
13 Road Furniture and Markings S U
Overall Grading (Web-generated) S SRI U
1. Setting out and working drawing
The check on road alignment is done with visual observation at all the stages of works. The
method to check the alignment is by setting the benchmark at 250m and centre line with proper
surveying tools. This item can be graded as Satisfactory (S) or Satisfactory Requiring
Improvement (SRI) or Unsatisfactory (U) by checking four parameters visually and if the road
is graded either SRI or U, clear reasons need to be mentioned. The four parameters used to
inspect this item are as follows
1. Whether 4 benchmarks per kilometre are established or not
2. Proper placing of benchmarks
3. Establishment of centerline with reference to marker pegs and chainage
4. Availability of working drawing for the in progress stage
2. Site Clearance and Grubbing
At the starting of the road construction, it is necessary to clear the site and cut all the shrubs and
trees. This item is checked for the only initial stage by inspecting following three parameters.
On grading as SRI or U, it is necessary to give appropriate reasons for dissatisfaction.
1. As per DPR clearing, grubbing and proper disposal of materials removed was done or not.
2. The removed materials were salvaged and reused or not.
3. If the material was reused then it's approximate quantity.
3. Quality Arrangements
The quality of construction as well as the material is important and needs to be checked with a
specific test at a specific frequency. There must be one field laboratory for every site with a
specified number of equipment for necessary tests as mentioned in “Quality Assurance
Handbook Volume-I” by PMGSY. The quality arrangements refer to the adequacy of
equipment for tests to be done at the ongoing stage of construction. Attention to quality is sub-
part of this item in which SQM has to crosscheck the results of tests carried on the inspection
day with the previous tests results and both to acceptable standards as per specification provided
in IRC standards.
1. Establishment of field laboratory is done or not
2. SQM has to check number of equipment are adequate or not and equipment is being used
or not as per the requirement of work
3. Based on the executed quantity of work, whether the mandatory tests on materials were
conducted or not and if conducted, the results were within an acceptable limit or not
4. Quality Control Register Part-I and Part-II was maintained as per the provisions or not

34
This item is graded as S or SRI or U and if it is U or SRI, clear reason must be mentioned in
the SQM inspection format. With the reason of dissatisfaction, suggestions for improvements
also need to be mentioned in this form so that PIU can take action to address the issue.
4. Geometrics
It’s mandatory to quality monitors to take at least two measurements in 1 km length of the
inspection length measuring geometric properties such as carriageway, roadway, and camber.
If it is found that the width of roadway or carriageway is inadequate, SQM may take more
observations. In the geometric item, following number of observations are mandatory:
1. Roadway width (m)
2. Carriageway width (m)
3. Camber in %
4. Superelevation
5. Extra widening at curves
If any of the above found unsatisfactory SQMs can check at more than two observations. If the
problem persists in other tests they can give grading to this item as U. There is no intermediate
grading for this item as like above items. SQM can grade this item either S or U. If it’s U, SQM
should mention the reason and suggestion for improvement in the space provided in SQM
format so that it can be checked that the problem is addressed or not, through the Action Taken
Report (ATR).
5. Earth Work and Sub-grade in Embankment/ Cutting
After the alignment of the centre line and Setting out working drawing, earthwork starts either
in the form of cutting or embankment depending on the formation level & the ground level.
Where ground level is above formation level there is need of cutting and where ground level is
lower than that of formation level there is need of filling/ embankment. This item includes
preparation of sub-grade with proper compaction in order to achieve requisite strength and item
is inspected under five main observations as explained below.
• The quality of material for embankment/ sub-grade: The material used for subgrade in
embankment may be loose material. Visual observation can be made to ideentify the
class or group symbol used material and quality is checked for its acceptability at
specific distance on the road.
• Workmanship for embankment and subgrade construction: With respect to specific
chainage i.e. Reduced Distance (RD). It is mandatory to check the quality of
workmanship by conducting a test of “Mean Dry Density (MDD)” in kN/cum.
Measuring field moisture content and degree of compaction in terms of field density
and dry density and checking it with acceptable limits specified in standards.
• Side slopes and profile: at embankment or cutting, the side slopes must have a proper
gradient as per the soil type and cutting area. Side slope is checked by visual observation

35
or by measuring side slope. Profile of road i.e. longitudinal as well as the transverse is
observed and graded S or U.
6. Earthwork cutting in Hilly/ Rolling Terrain
A special attention to earthwork in Hilly/ Rolling terrain or in the case of the high embankment
stability of cut sloped needs to be observed to avoid slide of the wedge. If the slope is not given
properly in the case of cutting, then whether adequate slope protection works executed or not
needs to be checked. In Hilly/Rolling terrain, attention needs to be given to formation width so
that traffic can be accommodated. As per geometric design standards for rural roads in Hilly
terrain, the longitudinal slopes must be maintained properly. Thus, by measuring side slopes,
observing slope protection works and longitudinal slope item is graded either S or U.
7. Sub-Base
Sub-Base is the second layer of road component from the bottom. After preparation of the
subgrade by compaction, a second layer is overlaid on it called as Granular Sub-Base (GSB).
Sub-base consists of gravels of size around 40mm to 90mm. Gravels must satisfy strength
characteristics such as impact value, abrasion resistance, and particle size distribution. The
suitability of GSB materials with respect to plasticity needs to be checked by SQM. Apart from
the material properties, other parameters like compaction and thickness of the layer are
measured by SQM/NQM and cross-checked as per DPR and standards required.
8. Base Course - Water Bound Macadam
The third layer from the bottom is the Base Course which is made of “Water Bound Macadam
(WBM)”. This layer is compacted with a sprinkling of water and made watertight thus called
Water Bound Macadam. This course is laid in two layers WBM-1 and WBM-II, with the
gradation being different in these layers. WBM-I is overlaid by WBM-II. WBM-I is with
coarser materials while WBM-II is of finer materials. SQM inspection includes the following
observations.
• The grain size analysis of course aggregate is done by taking a random pit of 50cm X 50cm
on the constructed or in progress road. The liquid limit and plasticity index testing is done
with the frequency of one test per km.
• Compaction of this layer is equally important as that of sub-base and sub-grade. This is
checked by taking a pit as mentioned in above point and volumetric analysis is done by
refilling in the same pit or a wooden box with the aggregates obtained from pit and based
on observation about % filling the adequacy of aggregates is checked.
• After compaction, the layer thickness of every layer i.e. WBM-I and WBM-II is measured
and crosschecked with design as per DPR. Layer thickness readings needs to be taken at
least two per kilometre by the quality monitors.
• The surface evenness can be checked with a straight edge and is acceptable if within the
permissible limit for that layer, or else required improvements are to be suggested. In the
case of roads not topped with bitumen, this would be the final surface course thus proper
compaction and surface evenness is very important in such cases.

36
• As the base course is overlaid with the bituminous course it must be free from dust. Thus,
cleanliness is important in order to integrate these two layers properly. Cleanliness should
be observed properly prior to application of bituminous layer.
9. Bituminous Layer - Premix Carpet (PMC)/Surface Dressing(SD)
• This is the top layer of the bituminous road and may contain prime coat, tack coat, Premix
carpet and surface dressing. In order to place Slow Setting (SS) or Rapid Setting (RS)
bitumen emulsion above WBM-II care should be taken to maintain cleanliness.
• The bitumen spraying in two layers named as tack coat and prime coat at a particular rate
on the WBM-II is done in order to plug the capillaries in WBM and provide a hard surface.
These two layers bind the loose particle on WBM and help to put the two layers i.e.
bituminous and WBM layers intact. These layers are to be observed in the field while
digging the pit.
• The gradation test for course aggregates which are used in PMC or SD should be done if
the work is in progress. For completed works, this test is not possible due to the setting of
bitumen and smaller aggregates.
• The grade of bitumen must be verified as per DPR and temperature at the time of placing
should be checked. This observation can be made only if the work is in progress.
• For completed PMC, bitumen extraction test should be conducted in order to find out the %
of binder bitumen added to the mix. The frequency of this test is one per kilometre and
should be checked with DPR design specification.
• Finally, the thickness of the PMC is checked for ongoing works by measuring using a scale
or a tape and for completed works by making a pit of size 50cm X 50cm thickness and
measuring using a scale or a tape.
• Being the final and topmost layer of road construction, the surface evenness should be very
good and is to be measured with a straight edge and visual observation and is graded as S
if acceptable or else graded as U with a suggestion for improvements.
By observing all the above observation SQM can grade the item as S in case all the observations
are within acceptable limit else graded as U with proper comments in the space provided. There
is no SRI grading for this item as like above items.
10. Quality of Shoulders
Shoulders are the side parts of carriageway which are used by vehicles for emergency purpose.
However, in the case of village roads as the width is the only 3.75m, the shoulders can be used
for crossing and overtaking purpose. Shoulders with a proper slope help to drain out the water
from the carriageway. As shoulders also bear the vehicular load, they must be prepared with
proper compaction and graded layers. While checking the quality of shoulders the SQM should
verify the thickness of layers laid under the shoulders, materials used in the shoulder are
acceptable or not and degree of compaction is adequate or not. To check the consistency of
shoulders with sub-base and base it is required to observe whether the shoulders were

37
constructed simultaneously with sub-base and base course. Based on these four observations,
the item is graded as S or SRI or U with proper reasons if not satisfactory.
11. Cross Drainage Works - Causeways of all spans and Culverts up to 6 m span
Cross drainage works are provided wherever necessary with proper causeways and culverts.
SQM should check the proper slope of culverts and note down type of Cross Drainage (CD)
work. The quality moniters should check the quality of materials used for construction is
acceptable or not as well as the quality of workmanship is acceptable or not. If the items are not
satisfactory, SQM/NQM should mention the reason for grading as SRI or U.
12. Side Drain and Catch Water Drain
This is an integral part of CD works. SQM should observe chainage of the side drains and their
proper integrity with CD works. The material quality used for construction and workmanship
of construction is checked and noted in the inspection format. Based on observation, the item
can be graded as S or SRI or U.
13. CC/ Semi-Rigid Pavements and Associated Pukka Drains
The PMGSY policy guidelines suggest that the stretch of the road which passes through the
village should be constructed with cement concrete. This provision is made in order to restrict
road excavation activity for piping and small works in the village by villagers. SQM should
observe the appropriate width of the carriageway, side drains build with rigid or semi-rigid
materials and thickness of the rigid or semi-rigid pavement. As like other items, this item should
also be inspected for the acceptability of material quality used and workmanship quality during
construction and should be graded as either S or U with appropriate comments.
14. Road Furniture and Markings
From the safety point of view, there should be mandatory cautionary sign boards denoting the
sharp curves, slope or anything that is pertinent to the safety, with proper visibility. There must
be 200m stones and one-kilometre stones properly placed at a right distance in the visible range.
Guard stones fixed at curves and logo board must be fixed. There must be a main information
board and citizen information board placed properly in the local language. If anything above
mentioned is not there the item can be graded as U with appropriate reasons else it was graded
as satisfactory.
15. Overall Grading
SQMs are provided with one application on their mobiles with unique login ID and password
through which they need to enter data online. They have to enter the abstract of grading for
each item in the form of S or SRI or U as per items requirement through the mobile for specific
work, for specific chainage. Photos of the road should also be clicked and uploaded with GIS
coordinates for the roads for verification purpose. The portal Online Monitoring, Management
and Accounting System (OMMAS) handles all the data and make it accessible online to all.
The overall grading is calculated by the application in the mobile, based on the grading of the
items for that work. If one of the items is graded as U, the overall grading comes out to be U.

38
Similarly, there is some algorithm in which if more than some number of items are graded as
SRI the overall grading comes out to be unsatisfactory. If minimum one item was SRI and no
U items, overall grading comes out to be SRI.
2.4 Findings of the study on quality monitoring 1. The format is adequate enough to cover all the necessary inspection regarding quality
and other parameters such as progress, delays, etc.
2. The grading scale i.e. three scale pattern for the items doesn’t represent the intensity of
performance and attention towards the quality of construction and thus most of the PIU
suggested it should be on the scale of 1 to 10 instead of S or SRI or U based on intensity
and repairability.
3. On discussion with SQMs and PIUs, it was observed that most of the other items except
pit test fit the acceptance criteria given by IRC standards. Pit test and grading of
aggregates usually fail. There is no strict rule or limit for exceedance of percentage
passing through sieves, the acceptance depends on SQM/NQM as few accept the
variation and grade as S and few grades as U without accepting variation. The
experienced SQMs during our field visit accepted the results that were varied from
standards and graded works as S by stating the reason that due to compaction, the
grading of aggregates change and there is variation of 10-15% depending on compaction
equipment used and number of rolling trips and other parameters. Thus, there is a
necessity to fix and reform standards for aggregate grading standards based on actual
field experience in different regions and for different types of materials.
2.5 Actual testing of on-going works Pavement construction involves a lot of materials as well as various methods of construction.
The performance and serviceability of road through its life is much dependent on construction
quality and thus there is need to pay attention towards construction quality. The construction
quality can be achieved and maintained by the testing material quality and workmanship
quality. There are too many materials used in the construction of a road including asphalt,
aggregates, rock, soil, cement and so on. Each of the materials need to possess few characteristic
properties and the norms for each of them are given in IRC codes. All such materials testing
standards were identified and current quality control setup was studied and we found that
PMGSY has its own three-tier quality control setup in which actual quality testing is done on
in-progress roads as well as completed roads with specific guidelines. The SQM format which
has been given in and discussed in earlier section is used to inspect the on-going roads. The in-
progress roads which were identified using sampling criteria described in the sampling section
of this chapter are summarized in Table 2.3.
Table 2.3 Details of ongoing roads selected for inspection
District Road Name Sanction
Year
Stage of
Construction
SQM
inspections &
NQM
Grading

39
Grading
Parbhani SH221 to Moregaon to
Brahmanwadi
2014-15 Completed Five-S and
One-SRI
Two-S
Yavatmal MRL22-MDR 38 To
Beldari Road
2013-14 Completed Four S and
One SRI
One-S
Bhandara NH06 Pimpalgaon to
Khainy Ralegaon Road
2013-14 Completed Two-S and
One- SRI
One-U
Kolhapur T14-Nandgaon Nagav
Vadakshiwale Chuye
To Kavannne Road
(ODR186)
2013-14 In-Progress Two SRI and
One S
No
Ratnagiri SH-167 Wadilimbu to
Baudhwadi to VR1
Approach road
2013-14 Completed Three S One-S
Palghar T05-Vavar Wangani
Jamsar Nyahale bk Sh
30 Nyahadi kh Adoshi
Khodala Road
2013-14 Completed Three S One-S
S-Satisfactory, SRI-Satisfactory Requiring Improvement, U-Unsatisfactory
By using the SQM format for inspection of works six roads in six district were inspected. In
Yavatmal, the roads are inspected with SQM named Mr. Kotambkar, and one formal discussion
was held with him as he was a retired engineer having a lot of experience in the road sector. On
that day two roads were inspected and only one is put forth in this report in order to maintain
uniformity of sample.
In Palghar district, accompanying with the SQM; Mr. Prakash Konde, inspection on the
completed road was carried out. On all another roads, independent inspections were carried out.
The results of all the roads were expressed in a concise form in the Table 2.3. All the
observations with respect to all the items inspected are discussed below.
2.6 Findings of the inspections on ongoing roads 1. Of the 6 roads surveyed in this study using the SQM format, it was found that 5 roads were
S (satisfactory) while one road in Kolhapur was SRI (satisfactory requiring improvement).
The Kolhapur road (T14- Nandgaon Nagav Vadakshiwale Chuye to Kavannne Road
(ODR186)) was SRI on account of four items, namely sub-base, shoulders, side drain and
U (unsatisfactory) on road furniture and markings. Thus, 83.3% of on-going roads surveyed
in this study were satisfactory.
2. In Kolhapur district, road visited was in progress and shoulders were not compacted yet. It
had rained the day before our inspection and hence, density tests were not conducted. The
thicknesses of different layers were found adequate but there was no proper embankment
and as it was sugarcane belt the low lying area was waterlogged. During the test pit due to

40
improper drainage on both sides, water was oozing out from test pit. Even the grading was
also varied too much from standards. And there was a need for improvement suggested by
SQM and NQM in alignment and embankment.
3. In case of Parbhani district for the on-going road surveyed, where all the observations were
made independently except test pit without the SQM accompanying, it was found that the
roads was just completed and all the set-up was moved by the contractor. As there was
SQM visit in the next 2-3 days, a separate test pit was not conducted as for the same road.
It was found that the quality of construction was good and all other items were graded as
“S”. Subsequently, the SQM also graded all the works as satisfactory and overall grading
as satisfactory.
4. In case of Yavatmal district, one of the roads selected for study (inspected along with SQM)
failed in sieve analysis largely as the road built was at WBM layer and work had stopped
from last two years due to delay in fund release from NRRDA. The traffic on the road
caused variation in grading and accumulation of dust on the road. Thus, this road was not
evaluated as it was an outlier. However, it is important to note that on time release of funds
is very crucial for building good roads. In case of the second road (MRL22-MDR 38 To
Beldari Road), all the tests were satisfactory except that approximately 200 meters from the
start of road, near the village where the roads was concretised, where a sharp curve was
present, there was negative superelevation. It was observed that no SQMs or NQMs (5
SQM inspections and 1 NQM inspection) has graded the road as U. However, the SQM
who was accompanied with in the current study suggested for improvement in
superelevation. Moreover, there was very less deviation for aggregate grading from
standards and on discussion with SQM, it was told that the issue was with the hand broken
aggregates and hence was accepted as it is and graded as satisfactory.
5. In Bhandara district, where the study did independent inspection (without SQM), it was
found that the quality of surface finish as very good and even grading was very close to the
standards. A little variation was there and this was due to compaction and traffic over this
road after construction. All the other tests were satisfactory. All the signboards CD works,
and CC drainages were satisfactory.
6. In Ratnagiri district the visited road (SH-167 Wadilimbu to Baudhwadi to VR1 Approach
road) was around one year old and it was observed that all other tests were satisfactory but
at the first test pit it was found that there was no proper thicknesses of layers, as it was
already compacted due to traffic for one year. Hence, a second test pit was taken to confirm
the thicknesses. The same difference in was observed in thickness layers in both the pits
and the grading of aggregates in Ratnagiri district also deviated slightly from the standards.
7. In Palghar district, the road visited was Vavar to Vangani (T05-Vavar Wangani Jamsar
Nyahale (bk) SH 30 Nyahadi kh Adoshi Khodala Road) and it showed all the parameters
satisfactory except shoulders, which needed to be properly sloped before monsoon, which
contractor had agreed to do and instead of grading it as SRI or U, the SQM accepted it and
graded it as S. It was noticed that such type of bias happens in case of SQM but not in case
of NQM.

41
Table 2.4 Abstract of items for quality inspection for ongoing roads
Sr.
No.
Item Parbha
ni
Yavatm
al
Bhandar
a
Kolhapu
r
Ratnagi
ri
Palgha
r
1 Setting Out and
Working Drawing
S S S S S S
2 Site Clearance and
Grubbing
NA NA NA S NA NA
3 Quality
Arrangement
S S S S NA NA
4 Geometrics S S S S S S
5A Earth Work and
Sub-grade in
Embankment/
Cutting
NA NA S S NA NA
5B Earthwork Cutting
in Hilly/ Rolling
Terrain
NA NA NA NA NA NA
6 Sub-Base NA S S SRI S S
7 Base Course -
Water Bound
Macadam
NA S S S S S
8 Bituminous Layer -
Premix
Carpet(PMC)/Surfa
ce Dressing(SD)
S S S S S S
9 Shoulders S S S SRI S S
10 Cross Drainage
Works - Causeways
of all spans and
Culverts up to 6 m
span
S NA S NA NA NA
11 Side Drain and
Catch Water Drain
S S S SRI S S
12 CC/ Semi Rigid
Pavements and
Associated Pukka
Drains
S NA S NA NA NA
13 Road Furniture and
Markings
S S S U S S
Overall Grading S S S SRI S S
Where S=Satisfactory, SRI=Satisfactory Requiring Improvement, U=Unsatisfactory, NA=Not
Applicable
Recommendations

42
1. The SQM format as of date contains 3 grading. There is the necessity of reforming the
SQM format and make it graded on the scale of 1 to 5 or 1 to 10 with proper standards
and acceptance limits so that there would be fewer chances of bias which depends on
the SQM’s perception about acceptance of results that varies from standards. The SQMs
with field experience have a tendency to accept the variations while those from
academic experience tend to be strict. This variation can be represented in a better way
if the SQM grading is made on Likert’s scale or of one to ten scales with specific
deviation from standards.
2. There is a necessity to separate out grading of works based on structural parameters and
other parameters such as signboards, road furniture etc. as it affects overall grading of
the work.
3. The tests covered under the SQM/NQM formats are time-consuming and need to be
upgraded to automated and quick tests that are uniform across all districts.
4. Grading of material related items need reforms as acceptance percentages for test pit
varies a lot in various regions. New acceptance criteria or new scale can be developed
based on the region-specific material, geographical condition and compaction
methodology by collecting and analyzing actual test results found in each district.
5. There was no seriousness about on-site laboratory as equipment arrangement was made
on the day or one day before SQM and NQM visit in any districts. Most of the
laboratories were in someone’s house in the village on the road for mere showing
purpose. The equipment seems to be not used many a times, and the SQM/NQM
accepting it as satisfactory. The equipments from districts laboratories equipment were
used for testing the materials on the day of SQM or NQM visit as the contractor's
equipment was not capable of conducting the tests.
6. On interaction with PIU of Parbhani and Ahmednagar, it was found that very few
contractors have their own engineer rest all have the only supervisor. There are very few
contractors who have their own engineers and it is necessary to make policy for staff
availability from contractor side who can stay on site and supervise.
7. “Usually SQM has a tendency to accept the recoverable errors due to systematic errors
like biasing but this is not easy in case of NQM and thus there is the necessity of more
frequent inspection of NQM to each and every road,” said one of the SQM

43
Figure 2.3 Inspection of Long Span Bridge in Parbhani district on ‘SH221 to Moregaon to
Brahmanwadi’ (date 25th May 2017)
Figure 2.4 Testing thickness of WBM layer on ‘Pimpalkauda to Nandgaon T2 Road’ in
Yavatmal District (date 30th May 2017)

44
Figure 2.5 Field density testing on ‘NH06 Pimpalgaon to Khainy Ralegaon Road’ in
Bhandara district (date 31st May 2017)
Figure 2.6 Aggregate grading on ‘T14-Nandgaon Nagav Vadakshiwale Chuye To Kavannne
Road (ODR186)’ in Kolhapur district (date 8th June 2017)

45
Figure 2.7 Thickness of different layers on ‘SH-167 Wadilimbu to Baudhwadi to VR1
Approach road’ in Ratnagiri district (date 12th June 2017)
Figure 2.8 Road Width, Carriageway Width inspection on ‘T05-Vavar Wangani Jamsar
Nyahale bk Sh 30 Nyahadi kh Adoshi Khodala Road’ in Palghar district road.(date 21st June
2017)
46
2.7 Maintenance of roads
After the construction of a road, the contractor is liable to maintain it for five years as per
contract guidelines by PMGSY. Maintenance involves clearing and maintaining shoulders,
drains cleaning, potholes filling etc. A tentative budget is estimated and kept aside for each road
for maintenance purpose and the SQM and NQM inspections are made on such roads up to five
year maintenance period. After five years, the road is handed over to Public Works Department
(PWD) after resurfacing. Pavements are continuously deteriorating and hence reduce in asset
value. Though, after 10 years, the value of pavement is zero, if maintained well, it will save a
lot of rehabilitation or reconstruction cost. Keeping in mind the importance of maintenance of
roads, simple visual observations the condition of the road and how well completed roads were
maintained were made on the selected road for both socioeconomic studies as well as
maintenance evaluation. Four roads in each district with a total of 28 roads were inspected
visually for maintenance and their physical condition, the details of which are given in Table
2.5
The parameters observed for maintenance and physical condition are not only related to
maintenance activities but also gives details about geometrics for the physical condition are a
bit different from SQM and NQM format provided as it is any one's liability after five years.
Thus, the parameters like camber, side shoulders, side drains, longitudinal profile, extra
widening, embankment, road surface, and super-elevation etc.

47
Table 2.5 Observations made on the roads for maintenance of road
District Road Name Connectivity Age
Maintenance
activity for
pavement
Cam
ber
Super
elevation
Extra
widening
Side
shoulders
Side
drains
Embank
ment
Road
surface
Longitudinal
Profile
Ahmednagar
Parner ODR 131 to Kutewadi New
Connectivity 2.56
No activity S NA NA S S S S S
Parner Hunga – Mungashi New
Connectivity 8.67
Yes S NA NA S S S SRI S
Ahmednagar Gundegaon to
Dhawadewasti
New
Connectivity 5.08
No activity S S S S SRI S S S
Ahmednagar Pimpalgaon Kauda -
Hivarebazar Upgradation 5.08
No activity S S S S S S S S
Parbhani
Parbhani SH44-Ithlapur Deshmukh
Raipur Road Upgradation 7.86
No activity S NA NA SRI SRI S SRI S
Palam SH 219 to Wadi (kh) New
Connectivity 10.12
Yes S S S SRI SRI S SRI S
Palam MSH 2 to Puini Adgaon
Wanbhujwadi Road Upgradation 7.82
Yes S NA NA SRI SRI S SRI S
Palam MSH 3 to Ramapur New
Connectivity 10.95
Yes S S S S S S SRI S
Yavatmal
Kalamb MDR 14 to Mategaon New
Connectivity 11.84
Yes S S S SRI S S S S
Kalamb MSH 3 to Sonegaon to
Wandli road Upgradation 9.09
Yes S NA NA U U S U S
Kalamb MSH 3 to Aloda Road Upgradation 9.18 Yes S S S SRI S S S S
Darwa Wagad (Bk) to Rajivnagar New
Connectivity 13.51
No activity S NA NA SRI SRI S SRI S
Bhandara
Bhandara Garada (Jangli) to Garada
(Bk) Upgradation 6.09
Yes S S S S S S S S
Bhandara SH 271 Bhandara to Warthi
SH 271 Upgradation 4.67
Yes S S S S SRI S S S

48
Tumsar Tumsar to Pipra Road Upgradation 6.09 No activity S S S S S S S S
Pauni MDR 35 to Chichal Chakra
Adyal Upgradation 2.19
No activity S S S S S S S S
Kolhapur
Shahuwadi SH 125 to Nandgaon
Sonurle Patilwada Upgradation 6.09
No activity S S S SRI SRI S S S
Shahuwadi MDR 9 to Parli New
Connectivity 10.09
No activity S S S S SRI S S S
Bhudarghad SH 120 to Tiravade
Devulwadi Devarde Upgradation 5.67
No activity S S S SRI SRI S U S
Bhudarghad Patgaon to Bhatwadi New
Connectivity 10.09
No activity S S S S S S S S
Ratnagiri
Sangamesh
war Pochari to Fungus Upgradation 7.92
No activity S S S S S S S S
Sangamesh
war
MDR 33 Dingani Agarwadi
Khadewadi to Guruvwadi Upgradation 6.09
No activity S S S S S S S S
Sangamesh
war
Dhamapur TF
Sangmeshwar to
Bhayjewadi Rautwadi
New
Connectivity 8.92
No activity S S S S S S SRI S
Guhagar Pacheri Agar Ramnewadi New
Connectivity 8.75
No activity S S S S S S U S
Palghar
Palghar NH 8 to Bahirifonda New
Connectivity 1.99
No activity S S S S S S S S
Palghar Valve to Chipatpada Road New
Connectivity 5.92
No activity S S S SRI SRI S U S
Jawhar SH 28 to Sagpani Pachgud
Road
New
Connectivity 5.92
No activity S S S S SRI S U S
Jawhar Jamsar - Kharvand Nyahale
BK to SH 30 Road Upgradation 8.01
No activity S S S S S S S S
Where S=Satisfactory, SRI=Satisfactory Requiring Improvement, U=Unsatisfactory


50
2.8 Findings of study on the completed roads
1. Among the 28 roads surveyed, only four roads were within maintenance period while
rest of the roads were handed over to PWD. However, in Yavatmal, PMGSY
PIU/MRRDA are still maintaining the roads.
2. Due to budget constraint in Yavatmal’s PMGSY PIU/MRRDA, they has not been able
to restore the heavy damage caused due to excessive usage by sand mining trucks on
Aloda and Wandli road.
3. Of the 4 roads surveyed in Ahmednagar district, 3 were satisfactory and good in all
aspects except the road to Mungashi. On the road to Mungashi there was some pavement
cracking and pavement worn out near river bridge and at several sections. Also, as there
are no proper drains on both sides at several sections for the road Gundegaon to
Dhawadewast, there is the necessity of clearing drains though it is not a heavy rainfall
area.
4. Roads in Parbhani were too old (between 7 and 11 years) and were not resurfaced after
5 years (end of maintenance period) and hence had a bad pavement condition. On
Ithlapur Deshmukh road there are no proper side shoulders due to unavailability of land.
5. A similar situation of pavements is there in the Yavatmal district where the age of the
roads is between 9 to 13 years especially the road Sonegaon to Wandli and Wagad (Bk)
to Rajivnagar which are not maintained properly. The Sonegaon to Wandli road of 1.75
km which was built by PMGSY (total road length 3-3.5 kms, partly built by ZP/PWD)
was found to be in very bad shape except the approximately 0.7 km portion which
PMGSY had rehabilitated.
6. In Bhandara district all the 3 roads are in very good condition except Warthi road which
has a few potholes and rutting though few potholes were filled.
7. In Kolhapur district, all the 4 roads surveyed showed that the pavement condition is not
bad. Due to lack of land availability for side shoulders it was observed that the roads
had very small shoulders and side drains were not properly maintained. People in the
district are a reluctance to give land and there are no side drains as it is sugar belt of
India.
8. Ratnagiri roads (4 numbers surveyed) were found 2 were in good condition. The road
connecting Devulwadi had damaged surface at most of the places while the
Ramanewadi road was totally warned out due to rainfall and needs resurfacing.
9. In Palghar district two roads are good in condition i.e. Radhanagari and Bahirifonda but
other two roads are bad in the condition in many aspects such as side shoulders, side
drains and road surface.
2.9 Condition of pavement The prioritization of roads for upgradation in PMGSY-II is done based on two parameters i.e.
one is Pavement Condition Index (PCI) and second is Growth Centres rank. The standard for
PCI in PMGSY is found as per the IRC standard designed for the gravel roads in the year 1988.

51
The PCI is calculated on a scale of one to five. Lower the PCI, the pavement condition is bad
and higher the priority for upgradation road will i.e. road with PCI one is preferred over road
with PCI with two for prioritization. After PCI parameters, the growth centre’s rank, is
considered i.e. higher the rank higher is the priority for upgradation.
In PMGSY, the road condition is assessed based on the three parameters, namely driving speed,
driving comfort and visual inspections. All the three parameters are subjective rating and are of
the Class-IV1 method. In such cases, there are chances of getting systematic2 errors such as
Leniency error, Halo effect and central tendency error. Such errors lead to variation in rating
person to person due to inspector’s perspective. The three parameters with a tentative rating
scale of one to five is given in Table 2.6. Final condition of the road is calculated based on the
average of all in the form of a scale of one to five with one becoming the worst and five
becoming good.
Table 2.6 Road Condition Survey as per PMGSY guidelines for rating PCI
Driving Speed Driving Comfort Visual Inspection
Speed PCI Comfortableness PCI Visual PCI
Over 40 kmph 5 Smooth & pleasant ride 5 Very good 5
30 to 40 kmph 4 Comfortable 4 Good 4
20 to 30 kmph 3 Slightly Uncomfortable 3 Fair 3
10 to 20 kmph 2 Rough & Bumpy 2 Poor 2
Less than 10 kmph 1 Dangerous 1 Very Poor 1
Source: Methodology of determining Pavement Condition Index, Annexure 14.7, Operation Manual PMGSY
MoRD 2005
In actual practice, the PCI is rated by JE at the district level using any vehicle available (either
four wheeler or two-wheelers). Most PIUs were requested to do PCI survey of whole network
in the district in a week or two and due to constraints of the time and funding, it is not possible
to survey the whole network. Thus, most of the PIUs either visit the respective road using a
two-wheeler or rate it based on their previous visit. The staff at PIU are no trained for visual
inspection and hence the observation can vary as per the inspector’s perception. Currently,
PMGSY has the data on PCI in Maharashtra only for the year 2013-14 and rest years is not
updated. However, for prioritization as well as for maintenance it is necessary to measure the
distress on roads. Therefore there is a necessity to adopt an alternative methodology for PCI.
An attempt is made to find out the PCI rating as per ASTM D-6433-11 for the visited roads in
the current study.
PCI as per ASTM D-6433-11
The American Society for Testing and Materials (ASTM) has defined a method to measure the
condition of the road in numerical form. The rating scale is from 0 to 100, where zero defines
the worst condition and 100 defines the good condition of the road. In this method, all the

52
distresses on the road were identified i.e. there are total 19 distresses available for asphalt road
which needs to be measured. According to this method, each distress has some impact on the
condition of the road and depending on the quantity and severity level of each distress some
deductions were made from 100 calculated from graphs given in the standard code. Deduced
value shows how much a particular distress has an impact in numerical form in reducing the
quality of road from 100 (Good). After all such deduction due to all distress, the remaining
score gives the road condition in a numerical form which is then categorised into qualitative
form as given in the standard. The parameters considered for asphalt roads are enlisted in Table
2.7.
Table 2.7 Asphalt pavement distress parameters as per ASTM standards.
Sl. No. Distress Unit of
Measurement
Distress
severity
1 Alligator Cracking Square meter Yes
2 Bleeding Square meter Yes
3 Block Cracking Square meter Yes
4 Bumps and Sags Linear meter Yes
5 Corrugation Square meter Yes
6 Depression Square meter Yes
7 Edge Cracking Linear meter Yes
8 Joint Reflection Cracking Linear meter Yes
9 Lane /Shoulder drop off Linear meter Yes
10 Longitudinal and Transverse Cracking Linear meter Yes
11 Patching and Utility Cut Square meter Yes
12 Polished Aggregates Square meter No
13 Potholes Number Yes
14 Railroad Crossing Square meter Yes
15 Rutting Square meter Yes
16 Shoving Square meter Yes
17 Slippage Cracking Square meter Yes
18 Swells Square meter Yes
19 Weathering/ Ravelling Square meter Yes
Source: ASTM D-6433, 2011
The detailed procedure followed to find out the PCI is summarised below with proper sampling
and of the sections. All the distresses, their severity and measurement method were reviewed
and followed for all the roads selected in this study. However, all the distressed were not
measurable through visual observation and by manual means thus it was necessary to adopt
some automated tools by PMGSY such as roughness measuring equipment.
53
Sampling
As per ASTM D-6433 for pavement condition index sampling is based on the 95% confidence
interval. The survey area is divided into equal sections of size more than 2500 ft2. From the
population of a number of such samples, few sections were selected based on the expected
standard deviation of 10 and standard error of 5 points on a score of 100 point PCI. But the
procedure followed for sampling was as per Clause 7.6 of the ASTM D-6433-11 which suggest
covering of the one sample up to five total samples, two samples for six to ten samples and
three for 11 to 15 sample unit. While selecting a number of samples care was taken to cover
10% of roads area. All the samples were taken in such way that that should be a representation
of the whole road. In our study sample unit selected was of length 150 m and depending on the
width of 3m or 3.75 the area varies.
A total of 20 roads has been inspected for the purpose of pavement condition indexing in detail.
The roads selected for socioeconomic study were inspected for PCI rating. Four roads in
Palghar district were not surveyed due to monsoon. Apart from this in Ahmednagar district the
road to Kutewadi and road to Hivarebazar doesn’t have any noticeable distresses and are good
in condition was also exempted from inspection. Similarly, in Yavatmal district road connecting
to Rajivnagar (Bk.) is not inspected because of time constraint during our field and the condition
of the road was completely warned out. The road in Bhandara district i.e. road to Chichal chakra
is only 1.5 years old and there was no any identifiable distress on the pavement which was in
good condition thus sections were not taken on this road. However, on the 20 roads listed below
the total of 39 sample sections were taken and distresses were measured manually. Each section
was of 150 m length and usually taken at identifiable places such as kilometre stone or 400m
stone in order to avoid bias and for future deterioration studies. The distress data collected using
a format which is attached in Annexure-III and total distress data is available in master table
attached in Table 6.1The detailed procedure followed for calculation of PCI as per ASTM D-
6433-11 was as follows.
1. Each section was of 150 m length and was divided into 30 sub-sections to measure and
record distress area. The length of each subsection was of 5 m.
2. On each such 5-metre length subsection distresses were measured in terms of respective
units as per their severity level and noted down.
3. All the calculations were made on finding out total distress quantity in each section on
any roads.
4. Total distress was added in respective severity levels and divided by total area of sample
and then multiplied by 100 in order to get the distress value in percentage
5. Based on graphs provided for each type of distress in ASTM D-6433, a deduct value for
each distress was determined.
6. Maximum Corrected Deduct Value (CDV) was determined using the separate procedure
as mentioned below.

54
7. If none or only one deduct value was greater than two, the total value was used in place
of maximum CDV in determining the PCI; otherwise, maximum CDV maximum CDV
is determined by an iterative process as below.
8. List all the deduct values in descending order and determine allowable number of
deducts, “m” from equation
𝑚 = 1 + (9
98) (100 − 𝐻𝐷𝑉) ≤ 10 Where HDV is highest deduct value.
9. Now the total number of Deduct Values (DV) was reduced to “m” including fraction. If
deduct values are less than “m”, all the values are used.
10. Now maximum CDV was determined iteratively by reducing one value from m and the
last deduct value to two using curve maximum CDV vs. “q” number of deducts.
11. For determining maximum CDV a sum of all the deduct values was required and “q”
number of deducts which will go on reduction in iteration till it goes to one.
12. By obtaining maximum CDV in each iteration, find the highest value of maximum CDV
and calculate PCI for that section by deducting this Maximum CDV from 100.
13. This is the PCI of the section which can be corrected for multiple severity cases for
more accuracy.
14. For a road’s PCI, an average of all the sections PCI was done.
Table 2.8 Sample roads for the PCI rating
Sr.
No. Road Name
District
PCI Rating
1 Pochari - Fungus Ratnagiri 72.5 Satisfactory
2
Dhamapur Tf. Sangameshwar - Bhayjewadi
Rautwadi
Ratnagiri
38 Very poor
3 MDR-33 Digani Agarwadi Khadewadi Guravawadi Ratnagiri 72 Satisfactory
4 Pacheri Agar - Ramanewadi Ratnagiri 43.5 Very poor
5 S H -44 - Ithlapur Deshmukh Raipur Road Parbhani 50 Fair
6 SH-219 to Wadi Kh Parbhani 54 Poor
7 M S H 2 - Puyani Adgaon Wanbhujwadi Road Parbhani 36.67 Serious
8 MSH-3 to Ramapur Parbhani 26.5 Serious
9 MDR 9 to Parli Kolhapur 72 Satisfactory
10 SH 120 - Tiravade Devulwadi Devarde Kolhapur 34 Serious
11 Patgaon to Bhatwadi Kolhapur 79 Satisfactory
12 SH 125 - Nandgaon Sonurle Patilwadi Kolhapur 40 Poor
13 Hanga - Mungshi Nagar 72 Satisfactory
14 Gundegaon - Dhawadewasti Nagar 86.3 Good
15 SH271 Bhandara - Warthi SH271 Bhandara 55 Fair
16 Tumsar - Pipara Bhandara 64 Fair
17 Pimpalgaon to Khambadi Bhandara 71.5 Satisfactory
18 MDR14 - Mategaon Yavatmal 64 Fair

55
19 MSH3 - to Sonegaon Wandali Road Yavatmal 17.5 Very poor
20 MSH-3 - Aloda Road Yavatmal 36 Fair

56
Figure 2.9 Actual field survey to assess condition of completed roads
Table 2.9 PCI results for sections and averaged for sample road
Pavement Condition Index Color code PCI Rating Scale No of
Section
No. of
Roads
85 to 100 Good 4 1
70 to 85 Satisfactory 8 6
55 to 70 Fair 9 5
40 to 55 Poor 10 2
25 to 40 Very Poor 3 3
10 to 25 Serious 4 3
0 to 10 Failed 1 0
Total 39 20
2.10 Findings of the study on PCI
1. The currently used method by PMGSY PIU is of Class IV as per IRC standard and are
very subjective. Hence, the ASTM method for PCI rating (ASTM D 6433) was used in
this study. The ASTM method gives very detailed distresses and helps in addressing
the problem more accurately.
2. As per the ASTM method for PCI rating (ASTM D 6433) of the 20 roads (out of 28
roads studied), it was found that only one road was in good condition having a PCI more
than 85, while, six roads were in satisfactory condition (PCI ranging from 70 to 85).
There are 3 roads whose PCI was below 25 and can be categorised as Serious while 5
roads are in Fair category. Five roads can be categorised as poor and very poor as per
ASTM’s PCI rating.
3. Among the 39 sections studied for the 20 roads (see Table 6.1 for details), 10 sections
were found to be poor in condition, 21 sections were above poor grading i.e. fair,
satisfactory and good in condition. Out of the remaining eight sections which were
below the poor grading, 1 section failed and 4 sections serious and 3 were in very poor
category.
4. The distresses that were dominating on PMGSY roads were ravelling and weathering
unlike the distresses like rutting, potholing, and cracking etc. which are found in
medium or high volume roads.
5. It must be noted that in the ASTM D 6433 methodology, the weightage given to deduct
values concerning ravelling and weathering are not that much i.e. for 100% medium
ravelling gives only a deduct value of 45 while for 100% high ravelling it shows 78
deduct value. Thus, signifying that a road with 100% ravelled with medium severity
would still have PCI of 55 which is Fair and with high severity 100% ravelling road will
have PCI of 22 and categorised as serious but not failed. As for the PMGSY roads, the
common distresses are ravelling and weathering, and thus due to this flaw in the
methodology, roads distresses are judged more lightly.

57
6. Most of the rural roads failed more because of ravelling & weathering and not of other
distresses. This is because of ageing of the road surface & heavy rainfall and not because
of only traffic.
7. The frequency of data collection of pavement as mentioned in PMGSY guidelines was
not followed by Maharashtra as it is very difficult to collect and keep an inventory of
the PCI of all roads. The major constraints suggested by PIU are lack of fund, vehicles,
manpower and time. The PCI inventory which OMMAS has last maintained is of the
year 2013-14 and which is not a true representation of road condition.
Recommendations
1) There is the necessity to know the health of such huge network in Maharashtra in terms
of PCI and need to be updated after minimum every two years with appropriate
methodology.
2) Need to get rid of class IV methods i.e. subjective rating right now used in PMGSY and
adaption of new techniques based on automated surveys such as Roughness measuring
devices etc.
3) There is a need for capacity building of staff for PCI collection and rating at regional or
divisional level. This may include an introduction to distresses and their identification
and measures.
4) Even in current PCI rating methodology there is need to provide proper resources to
collect data for the whole network in the district.
2.11 SQM and NQM data analysis for performance in quality of
construction
2.11.1 SQM and NQM data comparison at National Level
2.11.1.1 Comparison of SQM and NQM inspection data at the national level for all types
of works.
Secondary data on SQM and NQM inspection for all the works inspected after 2010 was
downloaded from OMMAS portal and analysis was done in order to know the performance of
each district and to find out a number of works inspected till date. A comparison at the national
level with respect to Maharashtra was made in the following paragraphs. The inspections were
divided into type of works or stage of works and frequency of a number of inspections was
identified. A detailed comparison of each type of work with Maharashtra and all other states
was given this sub-section.

58
Figure 2.10 NQM and SQM inspection comparison to Maharashtra and ‘All Other States’ in
India
• A total number of works all over India are 1,34,159 completed and 23,966 in progress to
date. Data available on OMMAS for NQM inspection is from 2010 only and all the works
before 2010 were not inspected. Similarly, SQM inspection data is available from 2010 and
data before is not available.
• The ratio of works inspected by SQM to NQM is 5.4 i.e. for every one inspection by NQM
there were more than five inspections by SQM for all over India.
• The highest numbers of inspections were made on in-progress works by both the monitors’
i.e. SQM as well as NQM.
• The second focus is on completed and maintenance works. But there is more focus by SQM
on completed works while in case of NQM, number of works inspected during maintenance
phase is more than completed.
• Maharashtra has less number of roads works that are inspected by SQM as compared to
Bridge works in comparison to India. Around 1,926 bridge works were inspected in
Maharashtra while in all other states the number was 4,555 i.e. one-third of bridge works
were present in Maharashtra and remaining two-thirds in all other states.
165
752
265
161
3,767
20,058
4,141
914
0 10,000 20,000 30,000
Completed Works
Ongoing Works
Maintenance Works
Bridge Works
NQM Inspections Maharashtra
vs. all other states (in numbers)
All other state Maharashtra
561
2,949
578
1,926
25,834
1,02,414
24,403
4,555
0 40,000 80,000 1,20,000
Completed Works
Ongoing Works
Maintenance Works
Bridge Works
SQM Inspections Maharashtra vs. all
other states (in numbers)
All other state Maharashtra

59
2.11.1.2 Comparison of SQM and NQM inspection data at the national level for
Completed roads.
Figure 2.11 NQM and SQM inspection on completed roads comparison to Maharashtra and
‘All Other States’ in India
1. Among the completed works inspected by SQM, Maharashtra shows 93% of works as
satisfactory an average of all other state show 84% which approximately 10% more than
that of ‘All Other State’. This shows that the comparatively more care was taken during
construction of roads towards quality in Maharashtra.
2. Similarly, NQM inspections in Maharashtra shows 84% ongoing works as satisfactory
compared to all other states 71% which is 13% more than that of the average of ‘All
Other State’.
3. Similarly, in case of works that are unsatisfactory Maharashtra has only 1% works as
unsatisfactory under NQM inspection while SQM it is a little bit higher .e. 7% but in
both cases, this percentage is less compared to ‘All Other State’s’ average.
4. Works that can be improved under after ATR are SRI has only 6% in case of NQM
inspection and is slightly less compared to All Other State, but it is 9% in case of SQM
inspection and is almost half in percentage compared to an average of ‘All Other State’.
93%
6%1%
89%
8%3%
SQM completed roads grading
Maharashtra vs. all other state
S SRI U
84%
9%7%
71%
17%
12%
NQM Completed roads grading
Maharashtra vs. all other states
S SRI U

60
2.11.1.3 Comparison of SQM and NQM inspection data at the national level for On-going
roads.
Figure 2.12 Ongoing works SQM and NQM inspection comparison Maharashtra and all other
states
1. While focusing on only on-going works total number of on-going works inspected by
SQM in all other state is 102,414 and that in Maharashtra are 2,949 only by SQM.
2. Maharashtra shows only 4% of that inspected by NQM among all over India and 3%
among SQM inspection.
3. Among 752 on-going works inspected by NQM in Maharashtra, 69% of works are
satisfactory and 61% for all other states, which shows performance based on NQM
inspection in Maharashtra is above average.
4. Similarly, in case of SQM inspection, 75% of works are satisfactory and only 4% are
unsatisfactory
5. In case of NQM inspection, 13% of works are unsatisfactory while in case of all other
states 14% is unsatisfactory.
6. NQM inspections show a higher percentage of unsatisfactory works compared to SQM
inspection. This may be because of systematic errors as mentioned in ongoing testing
of works.
516
136 100
12,261
5,0702,7272,210
614
125
76,450
19,828
6,136
1
10
100
1,000
10,000
1,00,000
S SRI U
Ongoing Works SQM and NQM grading
Maharashtra (NQM) All other state (NQM) Maharashtra (SQM) All other state(SQM)

61
2.11.1.4 Comparison of SQM and NQM inspection data at the national level for
Maintenance works.
Figure 2.13 NQM and SQM inspection on Maintenance works comparison to Maharashtra
and all other states in India
1. In case of Maintenance works inspections, Maharashtra shows 6% of total inspection
that was carried all over India by NQM while it is only 2% with respect to SQM
inspection.
2. The percentage of S graded works in SQM inspected works for Maharashtra is 71% but
for all other states, it is only 68%. Similarly in case of NQM inspected works it is 52%
for all other states and 58% for Maharashtra. Thus in both cases, the performance of
Maharashtra is above the average of all other states.
3. In case of SRI graded works the percentage of SRI graded NQM works in Maharashtra
is 21% and in all other states, it is 22% which shows slight difference only. However,
in case of SQM graded works, the same percentage is 13% for Maharashtra and 15%
for all other states.
4. In case of U graded works inspected by SQM in Maharashtra only 15% works are failed
and in all other states, the percentage is 17% which is slightly more than that of
Maharashtra. But in case of NQM graded works, the same percentage is 20% for
Maharashtra and 25% for all other states. This shows a significant difference in
percentage compared to an average of all other states.
5. As compared to SQM and NQM inspections, NQM inspections show 20% U graded
works and SQM only 15% but the situation is different in case of SRI grading.
413, 2%
77, 0%88, 0%
16,604,
67%
3,596,
14%4,203,
17% 578,
2%
SQM Maintenance Works Grading
Maharashtra vs. All other states
MH_S MH_SRI MH_U
ALL_S ALL_SRI ALL_U
155,
4%
57, 1%
53, 1%
2160,
49%
919,
21%
1062,
24%
265, 6%
NQM Maintenance Works Grading
Maharashtra vs. All other states
MH_S MH_SRI MH_U
ALL_S ALL_SRI ALL_U
62
6. In SRI grading SQM shows 15% works as SRI graded in Maharashtra while NQM
shows only 13%. This may be because of systematic errors like the central tendency of
SQM as compared to NQM.
2.11.2 SQM and NQM data comparison at State Level
2.11.2.1 SQM inspected works at state level
A. SQM inspected ongoing roads in Maharashtra district wise
Figure 2.14 SQM inspections on ongoing works in Maharashtra
1. The districts which show the highest number of inspection are Nandurbar, Gadchiroli
and Nashik and in that proportion, these three districts show the highest number of
satisfactory graded works. Ahmednagar shows greater number of works as satisfactory
though the number of works inspected is less.
2. By looking at the percentage of S graded works, the districts Nagpur, Nashik and
Jalgaon shows above 90% inspections as satisfactory. There are ten districts having
more than 80% as satisfactory works.
3. The district Solapur, and Nandurbar shows the highest number of U graded works but
looking at the percentage of U graded works the districts Solapur and Buldhana show
the highest percentage of U graded works i.e. more than 10% of works as U graded.

63
4. Parbhani and Osmanabad districts have the highest percentage of SRI graded works and
in case of a number of works, Parbhani shows 45 works as SRI graded followed by
Nandurbar, Gadchiroli and Pune.
5. The district has the lowest percentage of U graded works are Ahmednagar, Jalgaon, and
Nashik recording only 1% of works as U graded and the four districts viz. Osmanabad,
Amravati, Akola and Hingoli shows zero works graded as U.
6. The districts showing least percentage of S graded works are Beed, Bhandara and
Parbhani having less than 60% of works as S graded.
B. SQM inspected completed works in Maharashtra
Figure 2.15 SQM inspections on completed works in Maharashtra
1. The districts which show the highest number of inspection are Gondia and Palghar and
in that proportion, these two districts show the highest number of satisfactory graded
works. Beed is third in a total number of inspections in this category of inspection but
does not show proportionally that number of works as satisfactory.
2. By looking at the percentage of S graded works, the 21 districts shows 100% works as
satisfactory, 9 district shows more than 90% works satisfactory and only four districts
show below 80% as satisfactory grading works.

64
3. The districts Amravati, Gondia, Nanded, and Beed shows one work as U graded rest all
district does not have any work graded as U by SQM inspection at completion stage.
4. Beed and Bhandara district have the highest percentage of SRI graded works i.e. more
than 30% and in case of a number of works Beed shows 14 works as SRI graded
followed by Gondia and Parbhani.
5. The districts showing least percentage of S graded works are Parbhani, Dhule, Beed and
Bhandara having less than 75% of works as S graded.
C. SQM Inspected Maintenance works in Maharashtra
Figure 2.16 SQM Inspection on Maintenance Works in Maharashtra
1. In case of maintenance works inspection by SQM, the districts Sangli, Beed and Wardha
shows the highest number of works inspected and accordingly the highest number of
satisfactory graded works. Gadchiroli district is the fourth number having the highest
number of inspection but Pune district shows a number of satisfactory graded works
than that of Gadchiroli having the third rank in satisfactory graded works.
2. Palghar, Nanded, and Aurangabad show the highest number of unsatisfactory works and
the number of unsatisfactory works is nine. Parbhani and Nandurbar show the highest
percentage of U graded works having 83% and 75% respectively in this type of works.
3. Sindhudurga and Gadchiroli districts show the highest number of SRI graded works as
compared to all districts. Thane and Sindhudurga show the highest percentage of works
that are U graded among this type of inspections.
4. There ten districts having zero U graded works and six districts having only one U
graded work. Similarly, there are seven districts having zero SRI graded works and 12
districts having only one SRI graded work.
5. Nandurbar and Parbhani are two districts having the lowest number of S graded works
while in Parbhani no inspected work is of S graded.
0
10
20
30
40
50
60
San
gal
i
Bee
d
War
dha
Gad
chir
oli
Pal
gh
ar
Pun
e
Ko
lhap
ur
Lat
ur
Sin
dhu
du
rg
Nan
ded
Rat
nag
iri
Sat
ara
Au
rang
abad
Sola
pur
Go
nd
ia
Jalg
aon
Ak
ola
Bh
and
ara
Osm
anab
ad
Than
e
Dh
ule
Nag
pu
r
Was
him
Ch
and
rap
ur
Nas
hik
Rai
gad
Am
raw
ati
Bu
ldhan
a
Ah
med
nag
ar
Hin
go
li
Yav
atm
al
Nan
du
rbar
Par
bh
ani
Jaln
a
SQM Inspection on Maintenance works
S SRI U
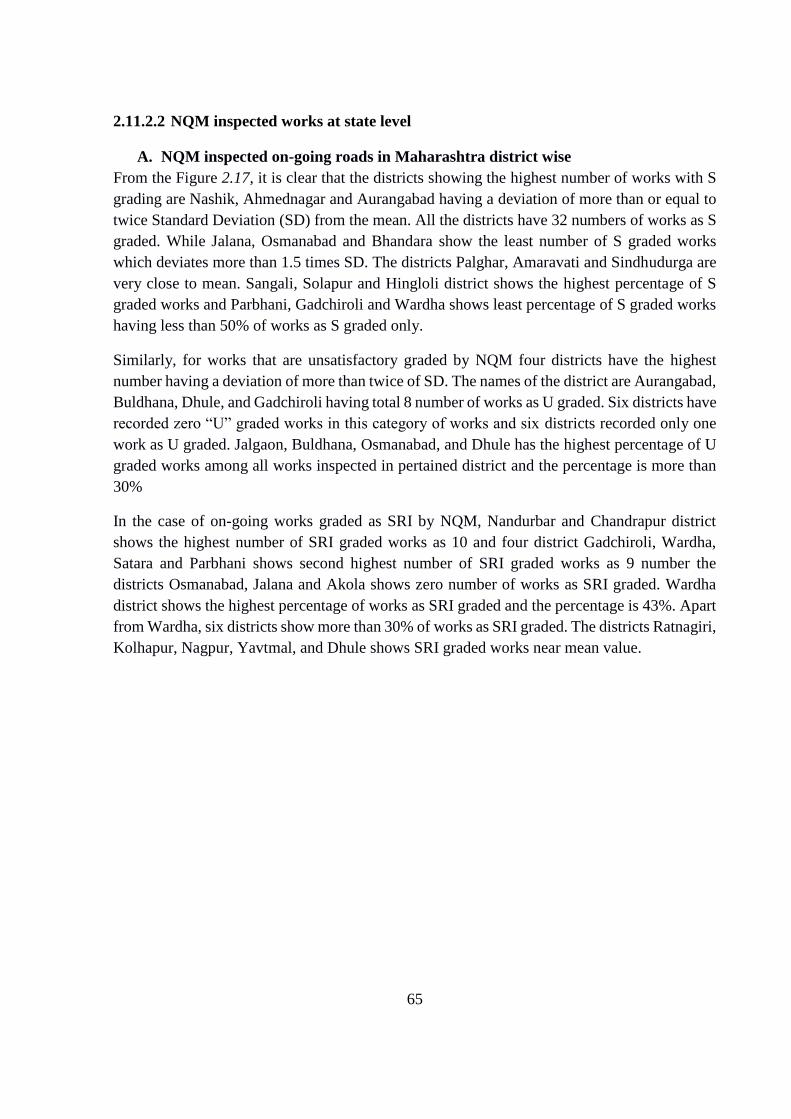
65
2.11.2.2 NQM inspected works at state level
A. NQM inspected on-going roads in Maharashtra district wise
From the Figure 2.17, it is clear that the districts showing the highest number of works with S
grading are Nashik, Ahmednagar and Aurangabad having a deviation of more than or equal to
twice Standard Deviation (SD) from the mean. All the districts have 32 numbers of works as S
graded. While Jalana, Osmanabad and Bhandara show the least number of S graded works
which deviates more than 1.5 times SD. The districts Palghar, Amaravati and Sindhudurga are
very close to mean. Sangali, Solapur and Hingloli district shows the highest percentage of S
graded works and Parbhani, Gadchiroli and Wardha shows least percentage of S graded works
having less than 50% of works as S graded only.
Similarly, for works that are unsatisfactory graded by NQM four districts have the highest
number having a deviation of more than twice of SD. The names of the district are Aurangabad,
Buldhana, Dhule, and Gadchiroli having total 8 number of works as U graded. Six districts have
recorded zero “U” graded works in this category of works and six districts recorded only one
work as U graded. Jalgaon, Buldhana, Osmanabad, and Dhule has the highest percentage of U
graded works among all works inspected in pertained district and the percentage is more than
30%
In the case of on-going works graded as SRI by NQM, Nandurbar and Chandrapur district
shows the highest number of SRI graded works as 10 and four district Gadchiroli, Wardha,
Satara and Parbhani shows second highest number of SRI graded works as 9 number the
districts Osmanabad, Jalana and Akola shows zero number of works as SRI graded. Wardha
district shows the highest percentage of works as SRI graded and the percentage is 43%. Apart
from Wardha, six districts show more than 30% of works as SRI graded. The districts Ratnagiri,
Kolhapur, Nagpur, Yavtmal, and Dhule shows SRI graded works near mean value.

66
Figure 2.17 District wise grading of on-going works inspected by NQM
B. NQM inspected completed roads in Maharashtra district wise
In the case of completed works, Jalna district shows the highest number of inspection on this
type of works followed by Latur, Beed and Gondia. In the districts Chandrapur, Nagpur,
Osmanabad, Raigad, and Thane there no work inspection on such works. Among remaining 29
districts, only nine districts shows U graded works and all other doesn’t have any U graded
work. Jalna and Dhule show 3 and 2 number of U graded works and remaining districts shows

67
only one work as U graded. Similarly, there are only nine districts have SRI graded works and
among these nine districts, five districts have two number of works as SRI graded and others
have only one. The districts Jalna, Latur and Beed shows the highest number of S graded works
and among 29 districts in which inspections were made 12 districts shows 100% works as S
graded. In Washim district only two works were inspected and both were graded as SRI.
Similarly, in Wardha district, only one work was inspected and it was found U thus, it shows
100% U graded works.
Figure 2.18 NQM inspection on completed works in Maharashtra
C. NQM inspected Maintenance roads in Maharashtra district wise
Ahmednagar and Aurangabad district reported the highest number of inspection on such
type of works followed by Pune and Solapur. Both the districts recorded the highest number
of S graded works having deviation more than 3SD from mean. While almost 21 districts
show the deviation of less than zero i.e. almost equal to mean. Districts Dhule, Bhandara,
and Raigad show zero number of works as S graded. Five districts namely, Gadchiroli,
Akola, Ratnagiri, Sangli, and Satara shows 100% works inspected under this type as S
graded.
In case of SRI graded works, Ahmednagar and Aurangabad show the highest number of
works graded as SRI followed by Pune and Bhandara. Nine districts show zero number of
SRI graded works and eight number of districts shows only one SRI graded works. The
highest numbers of SRI graded works are five and second highest is four. Raigad district
shows 100% Sri graded works and there are ten districts having more than 30% of SRI
graded works.
0
2
4
6
8
10
12
14
16
18
Jaln
a
Lat
ur
Bee
d
Go
nd
ia
Bh
and
ara
Pal
gh
ar
Nan
ded
Rat
nag
iri
Am
raw
ati
Dh
ule
Bu
ldhan
a
Pun
e
Ah
med
nag
ar
Gad
chir
oli
Sin
dhu
du
rg
Ko
lhap
ur
Par
bh
ani
Hin
go
li
Au
rang
abad
Nan
du
rbar
Yav
atm
al
Was
him
Nas
hik
Ak
ola
Jalg
aon
San
gal
i
Sat
ara
Sola
pur
War
dha
Ch
and
rap
ur
Nag
pu
r
Osm
anab
ad
Rai
gad
Than
e
NQM Completed Graded Works
S SRI U

68
Figure 2.19 Maintenance works inspected by NQM showing SRI or U grading
Similarly, U graded works are highest in Aurangabad district and the number is 14 among 22
works i.e. having percentage of 64%. Almost 18 districts show zero number of U graded works
and three districts have only one work as U graded. Dhule shows 71% of works inspected as U
graded. Eight districts have more than 50% of works as U graded and 18 districts have zero
percent.

69
2.12 Analysis of SQM and NQM data item-wise
2.12.1 SQM Works Item-wise
2.12.1.1 On-going works inspected by SQM
In-progress works or on-going works were checked with different items as given in SQM
format. A particular work is graded as S or SRI or U based on the grading of these items. Here
the interest is to know which among these items are leading to U or SRI as overall grading.
Even a single U or single SRI item lead to overall grading as U or SRI. To find out the reasons
for the failure of works there is a need to get item wise grading of the failed works. For this
analysis, data of SQM inspected works is taken from OMMAS for each and every work that
has overall grading as U or SRI. Each such work’s items with SRI or U found out for each
district of Maharashtra state from the year 2010 until July 2017. The final compiled data with
a frequency of items which are common for most of the SRI or U graded works is shown in
Table 2.10
Table 2.10 Frequency of U and SRI items leading overall grading as SRI for On-going works
On-going Works SRI Graded
works
U Graded
works
Item
No. Item\Grading U SRI U
S
RI
1 Setting Out and Working Drawing 30 135 12 24
2 Site Clearance and Grubbing 9 32 1 8
3 Quality Arrangement 25 202 17 44
4 Geometrics 28 7 24 4
5A Earth Work and Sub-grade in Embankment/ Cutting 0 0 35 0
5B Earth work Cutting in Hilly/ Rolling Terrain 0 0 3 0
6 Sub-Base 0 0 25 0
7 Base Course - Water Bound Macadam 0 0 58 0
8 Bituminous Layer - Premix Carpet(PMC)/Surface
Dressing(SD) 0 0 30 0
9 Shoulders 7 134 5 5
10 Cross Drainage Works - Causeways of all spans and
Culverts up to 6 m span 7 87 2 18
11 Item 10 - Side Drain and Catch Water Drain 3 135 2 12
12 CC/ Semi Rigid Pavements and Associated Pukka
Drains 8 0 0 0
13 Road Furniture and Markings 71 0 21 0
Overall Grading 593 122

70
On-going works inspected by SQM shows that 593 works were SRI graded and 122 works
graded as U. The works that were graded as U has the highest frequency of item base course
WBM is 58 i.e. nearly 50% of the U graded works were failed because of unsatisfactory work
of WBM layer. WBM layer is important structural layer and failure to this layer affect the
strength and performance of the road. Other items that contribute to the dissatisfaction of
inspection were earthwork, bituminous layer, geometrics and quality arrangements. It was
observed that SQM has shown attention towards structural components such as base course,
bituminous layers earthworks and sub base. Major reasons for on-going work to be
unsatisfactory were dissatisfaction in quality arrangement and road layers placing. However,
SQM has given lower importance to shoulders and CD work items grading them as SRI for the
highest number of times in SRI graded works. Quality arrangements showed the highest
contribution to SRI as well as U graded works. It was also observed during our field that actually
there was negligence to quality control set up and functionality of quality lab is not observed in
most of the roads field laboratory.
2.12.1.2 Completed works inspected by SQM
Table 2.11 Frequency of U or SRI items leading overall grading as SRI for Completed Works
Completed Works SRI Graded
Works
U Graded
Works
Item
No. Item\Grading U SRI U SRI
1 Geometrics 1 0 1 0
2A Earth Work and Sub-grade in Embankment/ Cutting 0 0 1 0
2B Earth work Cutting in Hilly/ Rolling Terrain 0 0 1 0
3 Sub-Base 0 0 0 0
4 Base Course - Water Bound Macadam 0 0 2 0
5 Bituminous Layer - Premix Carpet(PMC)/Surface
Dressing(SD) 0 0 4 0
6 Shoulders 0 17 1 1
7 Cross Drainage Works - Causeways of all spans and
Culverts up to 6 m span 0 3 0 2
8 Side Drain and Catch Water Drain 4 6 0 1
9 CC/ Semi Rigid Pavements and Associated Pukka
Drains 2 0 0 0
10 Road Furniture and Markings 11 0 2 0
Overall Grading 32 6
Table 2.11 Shows that 32 inspections on completed works were SRI graded and only six works
were graded as unsatisfactory. Four of six unsatisfactory works were due to unsatisfactory
bituminous layers and base course. Other two were due to a combination of other items. In the
case of SRI graded works 17 works were SRI due to SRI grading of shoulders and 10 works
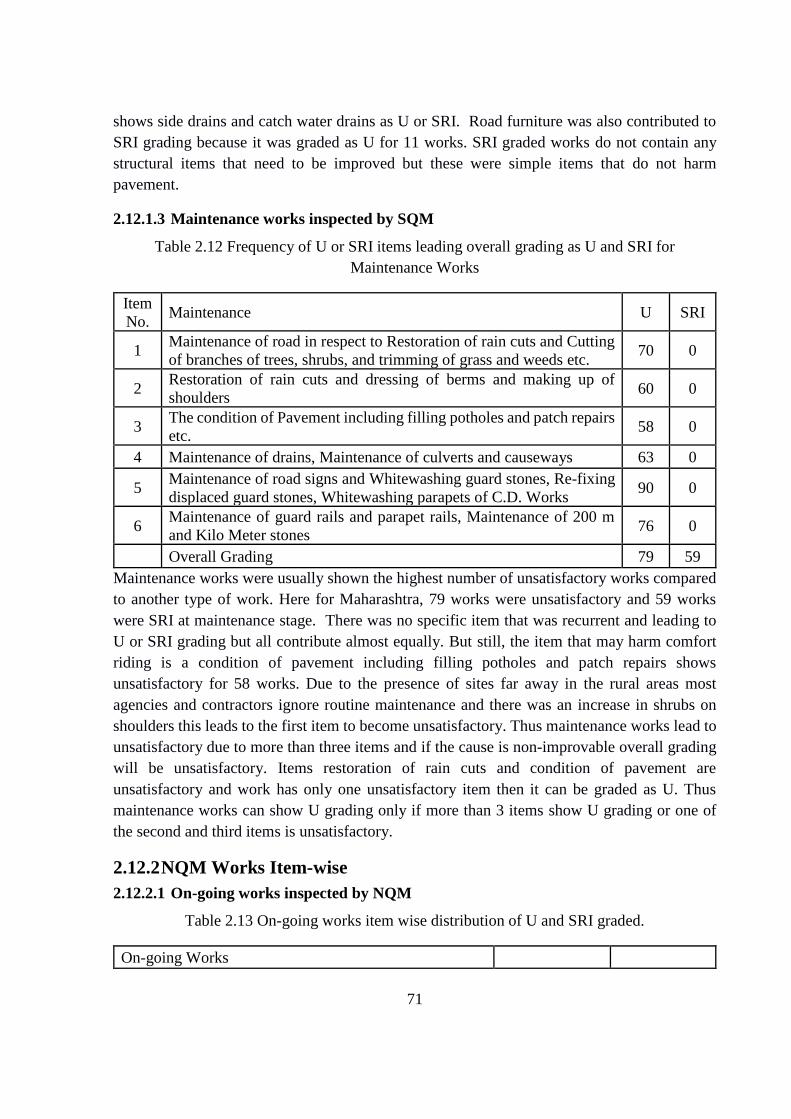
71
shows side drains and catch water drains as U or SRI. Road furniture was also contributed to
SRI grading because it was graded as U for 11 works. SRI graded works do not contain any
structural items that need to be improved but these were simple items that do not harm
pavement.
2.12.1.3 Maintenance works inspected by SQM
Table 2.12 Frequency of U or SRI items leading overall grading as U and SRI for
Maintenance Works
Item
No. Maintenance U SRI
1 Maintenance of road in respect to Restoration of rain cuts and Cutting
of branches of trees, shrubs, and trimming of grass and weeds etc. 70 0
2 Restoration of rain cuts and dressing of berms and making up of
shoulders 60 0
3 The condition of Pavement including filling potholes and patch repairs
etc. 58 0
4 Maintenance of drains, Maintenance of culverts and causeways 63 0
5 Maintenance of road signs and Whitewashing guard stones, Re-fixing
displaced guard stones, Whitewashing parapets of C.D. Works 90 0
6 Maintenance of guard rails and parapet rails, Maintenance of 200 m
and Kilo Meter stones 76 0
Overall Grading 79 59
Maintenance works were usually shown the highest number of unsatisfactory works compared
to another type of work. Here for Maharashtra, 79 works were unsatisfactory and 59 works
were SRI at maintenance stage. There was no specific item that was recurrent and leading to
U or SRI grading but all contribute almost equally. But still, the item that may harm comfort
riding is a condition of pavement including filling potholes and patch repairs shows
unsatisfactory for 58 works. Due to the presence of sites far away in the rural areas most
agencies and contractors ignore routine maintenance and there was an increase in shrubs on
shoulders this leads to the first item to become unsatisfactory. Thus maintenance works lead to
unsatisfactory due to more than three items and if the cause is non-improvable overall grading
will be unsatisfactory. Items restoration of rain cuts and condition of pavement are
unsatisfactory and work has only one unsatisfactory item then it can be graded as U. Thus
maintenance works can show U grading only if more than 3 items show U grading or one of
the second and third items is unsatisfactory.
2.12.2 NQM Works Item-wise
2.12.2.1 On-going works inspected by NQM
Table 2.13 On-going works item wise distribution of U and SRI graded.
On-going Works
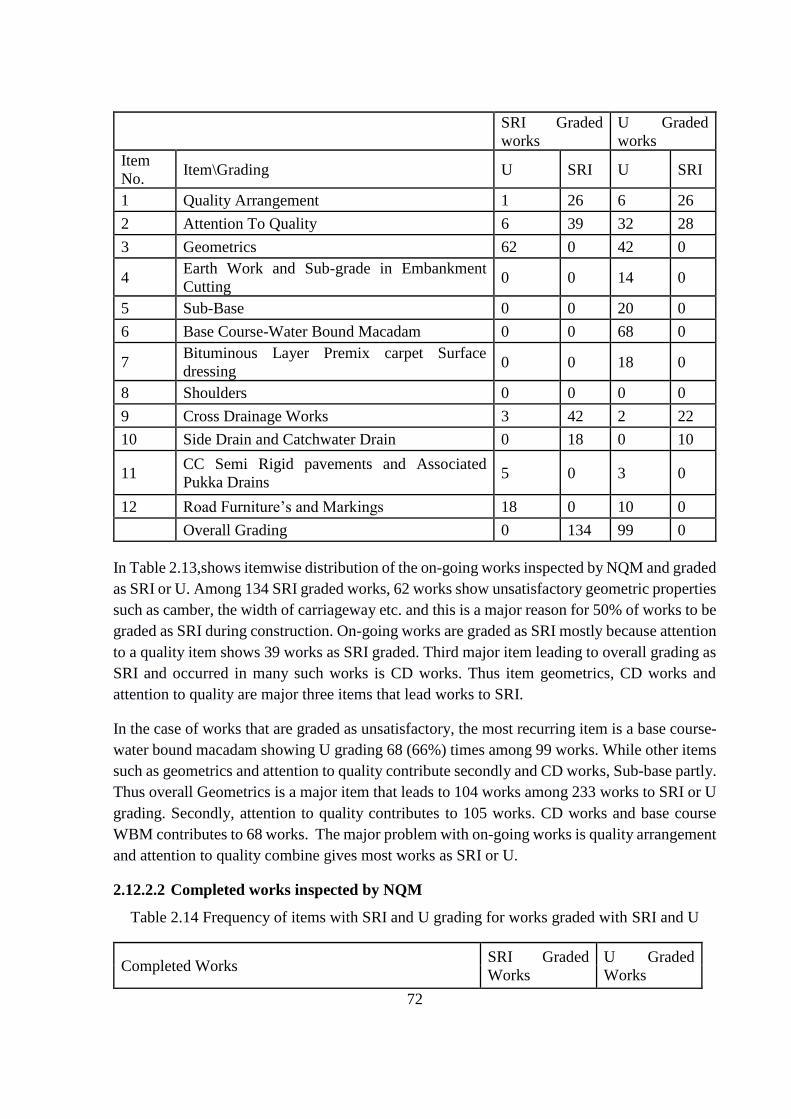
72
SRI Graded
works
U Graded
works
Item
No. Item\Grading U SRI U SRI
1 Quality Arrangement 1 26 6 26
2 Attention To Quality 6 39 32 28
3 Geometrics 62 0 42 0
4 Earth Work and Sub-grade in Embankment
Cutting 0 0 14 0
5 Sub-Base 0 0 20 0
6 Base Course-Water Bound Macadam 0 0 68 0
7 Bituminous Layer Premix carpet Surface
dressing 0 0 18 0
8 Shoulders 0 0 0 0
9 Cross Drainage Works 3 42 2 22
10 Side Drain and Catchwater Drain 0 18 0 10
11 CC Semi Rigid pavements and Associated
Pukka Drains 5 0 3 0
12 Road Furniture’s and Markings 18 0 10 0
Overall Grading 0 134 99 0
In Table 2.13,shows itemwise distribution of the on-going works inspected by NQM and graded
as SRI or U. Among 134 SRI graded works, 62 works show unsatisfactory geometric properties
such as camber, the width of carriageway etc. and this is a major reason for 50% of works to be
graded as SRI during construction. On-going works are graded as SRI mostly because attention
to a quality item shows 39 works as SRI graded. Third major item leading to overall grading as
SRI and occurred in many such works is CD works. Thus item geometrics, CD works and
attention to quality are major three items that lead works to SRI.
In the case of works that are graded as unsatisfactory, the most recurring item is a base course-
water bound macadam showing U grading 68 (66%) times among 99 works. While other items
such as geometrics and attention to quality contribute secondly and CD works, Sub-base partly.
Thus overall Geometrics is a major item that leads to 104 works among 233 works to SRI or U
grading. Secondly, attention to quality contributes to 105 works. CD works and base course
WBM contributes to 68 works. The major problem with on-going works is quality arrangement
and attention to quality combine gives most works as SRI or U.
2.12.2.2 Completed works inspected by NQM
Table 2.14 Frequency of items with SRI and U grading for works graded with SRI and U
Completed Works SRI Graded
Works
U Graded
Works
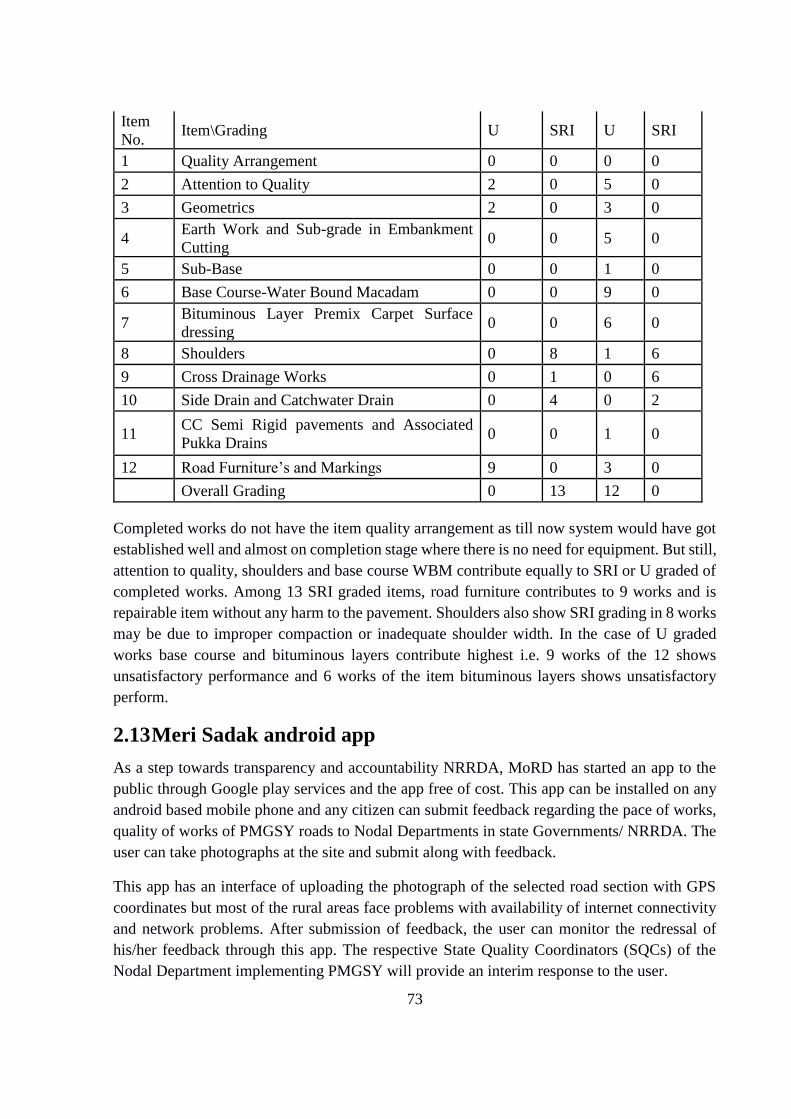
73
Item
No. Item\Grading U SRI U SRI
1 Quality Arrangement 0 0 0 0
2 Attention to Quality 2 0 5 0
3 Geometrics 2 0 3 0
4 Earth Work and Sub-grade in Embankment
Cutting 0 0 5 0
5 Sub-Base 0 0 1 0
6 Base Course-Water Bound Macadam 0 0 9 0
7 Bituminous Layer Premix Carpet Surface
dressing 0 0 6 0
8 Shoulders 0 8 1 6
9 Cross Drainage Works 0 1 0 6
10 Side Drain and Catchwater Drain 0 4 0 2
11 CC Semi Rigid pavements and Associated
Pukka Drains 0 0 1 0
12 Road Furniture’s and Markings 9 0 3 0
Overall Grading 0 13 12 0
Completed works do not have the item quality arrangement as till now system would have got
established well and almost on completion stage where there is no need for equipment. But still,
attention to quality, shoulders and base course WBM contribute equally to SRI or U graded of
completed works. Among 13 SRI graded items, road furniture contributes to 9 works and is
repairable item without any harm to the pavement. Shoulders also show SRI grading in 8 works
may be due to improper compaction or inadequate shoulder width. In the case of U graded
works base course and bituminous layers contribute highest i.e. 9 works of the 12 shows
unsatisfactory performance and 6 works of the item bituminous layers shows unsatisfactory
perform.
2.13 Meri Sadak android app
As a step towards transparency and accountability NRRDA, MoRD has started an app to the
public through Google play services and the app free of cost. This app can be installed on any
android based mobile phone and any citizen can submit feedback regarding the pace of works,
quality of works of PMGSY roads to Nodal Departments in state Governments/ NRRDA. The
user can take photographs at the site and submit along with feedback.
This app has an interface of uploading the photograph of the selected road section with GPS
coordinates but most of the rural areas face problems with availability of internet connectivity
and network problems. After submission of feedback, the user can monitor the redressal of
his/her feedback through this app. The respective State Quality Coordinators (SQCs) of the
Nodal Department implementing PMGSY will provide an interim response to the user.

74
Until date end of August’2017 this app has recorded 67,642 feedbacks among which only
20,808 feedbacks were accepted and remaining were rejected with a valid reason. Among
20,808 feedbacks/complaints 19,977 feedbacks were replied with a final reply and 748
complaints were under interim reply. Among all the states people of Maharashtra are second
most aware of PMGSY and recorded the highest number of complaints (8,401) and feedback
after Uttar Pradesh (12,348). But due lack of clarity about which complaints to be recorded i.e.
this app is for only PMGSY road and not for other roads, around 70% complaints are
unacceptable and hence rejected by NRRDA.
There complaints and feedbacks of around 3,233 which does not have state name included and
thus not addressed at all, this is a limitation of this app. Thus, there is a need for creation of
awareness and demo for registering a complaint. As well as there is the necessity of making
entry fields compulsory while accepting feedback in order to avoid feedback and complaint of
other roads just because of missing data like location, state or road name. Alternatively, the
total database can be made available through the app so that people can select road first and
then complain.
Maharashtra has accepted 2,344 complaints and among these complaints, 2,278 are sent with a
final reply and 66 with an interim reply. In Maharashtra, Pune and Thane district registered the
highest number of complaints and only very few of them were addressed because others were
not related to PMGSY roads.

75
3 Physical Progress and Financial Evaluation of PMGSY
3.1 Coverage under PMGSY in India
Figure 3.1 Coverage of Length (km) and Habitations (no.) through PMGSY-I
The Figure 3.1 shows that coverage of PMGSY in various states of the country. Madhya
Pradesh shows the highest coverage of length in km followed by Bihar, UP, and Odisha.
Maharashtra, despite being the third largest state ‘area wise’ and second largest ‘population-
wise’ the length and habitations coverage allocated under PMGSY was less as compared to
other states. Maharashtra stands 8th among all the states in lengthwise coverage. The habitation
coverage in Maharashtra state was also less when PMGSY was planned. Thus, the allocation
to Maharashtra is not proportionate to any of the parameters including population, area or road
density and though Maharashtra had a large number of habitations unconnected still, there was
no sanction of projects under any category like new connectivity or upgradation. Maharashtra’s
rural road network is very large and the roads covered through PMGSY before 2005 has also
reached the end of life becoming non-functional. .
0
10000
20000
30000
40000
50000
60000
0
10,000
20,000
30,000
40,000
50,000
60,000
70,000
80,000
Mad
hya
Pra
des
h
Raj
asth
an
Od
isha
Bih
ar
Utt
ar P
rades
h
Ch
hat
tisg
arh
Wes
t B
engal
Ass
am
Mah
aras
htr
a
Jhar
kh
and
Him
achal
Pra
des
h
Kar
nat
aka
Tam
iln
adu
Jam
mu
And
Kas
hm
ir
An
dh
ra P
rades
h
Utt
arak
han
d
Gu
jara
t
Tel
angan
a
Aru
nac
hal
Pra
des
h
Man
ipur
Pun
jab
Tri
pu
ra
Har
yan
a
Sik
kim
Nag
alan
d
Miz
ora
m
Ker
ala
Meg
hal
aya
Go
a
No
. o
f H
abit
atio
ns
Len
gth
in K
m
Coverage of Length (km) and Habitations (no.) through
PMGSY-I
Length No. of Habitations

76
3.2 Coverage under PMGSY in Maharashtra
Figure 3.2 Total habitation coverage in Maharashtra year wise through PMGSY-I & II
The Maharashtra Rural Road Development Authority (MRRDA) in Maharashtra has connected
1,540 villages from 2000 to till date through new connectivity. The pace for new connectivity
in Maharashtra was higher till 2009 and later on, it was nearly stagnant due to no sanction of
proposals under this type of roads. Though, there exists unconnected habitations, the focus has
not been given on new connectivity and the PMGSY-II got focused only on upgradation of
roads.
A total of 9,195 habitations got benefited through upgradation type of connectivity from 2000
to 2017 years through PMGSY-I and II. The pace of upgradation works was much higher from
2004 to 2009 and then for the period 2009 to 2014, there was no sanction of roads under
PMGSY-I for upgradation type of works. But after starting of PMGSY-II, the upgradation
works were sanctioned and the connectivity pace was increased. As of today, there were no
much more sanctions under PMGYS scheme. Currently, less funds were allocated to
Maharashtra despite having the largest network of rural roads in India. In order to maintain this
network in usable condition, there is a need for continued support from the centre through such
schemes either in the form of upgradation or new connectivity. Though PMGSY stopped
sanctioning of projects in Maharashtra, still there are lots of habitation unconnected whose
current population is more than 500 in plain terrain. These habitations were left out just because
of population criteria as per the census 2001. The Table 3.1 shows unconnected habitations
entered on OMMAS and still not connected.
0
2000
4000
6000
8000
10000
12000
No
. o
f hab
itat
ions
Years
Total habitation coverage in Maharashtra from
2000 to till date
New Connectivity Upgradation Total

77
Table 3.1 Habitation coverage and balance habitations to be covered in PMGSY-I
Number of Habitations with Population Range
Type >1000 999-
500
Eligible
499-
250
Total
Eligible
Total
499-
250
Eligible
249-
100
<250 Grand
Total
1 2 3 4 5=2+3+4 6 7 8 9=2+3+7+8
Total number of Habitations (As on 01-04-2000) 17477 13917 0 31394 13937 0 22554 67885
Total number of Habitations as per PIU 17493 13922 3852 35267 13937 468 22555 67907
Total number of Connected Habitations (As on 01-04-2000) 17268 12999 0 30267 11102 0 17514 58883
Total number of Connected Habitations Entered by PIU 17284 13004 3111 33399 11102 285 17515 58905
Total number of Unconnected Habitations (As on 01-04-2000) 209 918 0 1127 2835 0 5040 9002
Total number of Unconnected Habitations Entered by PIU 209 918 741 1868 2835 183 5040 9002
Status of connectivity of Habitations covered under State Scheme 36 155 70 261 732 31 879 1802
No of Unconnected Habitations after deducting Habitations
benefitted under State Program 173 763 671 1607 2103 152 4161 7200
Total Habitations Covered till 31st
May 2017 under PMGSY-I & II
New Connectivity 178 711 399 1288 516 2 135 1540
Upgradation 3498 2213 389 6100 1190 43 927 7828
Habitations Dropped and Eligible for
Reconsideration by NRRDA
New Connectivity 0 3 7 10 7 0 0 10
Upgradation 1 0 0 1 0 0 0 1
Habitations Dropped and not Eligible
for Reconsideration by NRRDA
New Connectivity 0 1 47 48 47 0 0 48
Upgradation 3 11 9 23 11 4 6 31
Balance Unconnected Habitations 31st May 2017 0 51 225 271 1540 150 4026 5612
Source- OMMAS, PMGSY, 31st May 2017

78
As per the survey, of the connectivity status proposed by each state, Maharashtra state had put
forth 7,200 habitations as unconnected under the eligibility criteria of PMGSY-I. Among these
7,200 habitations which were eligible for connectivity through PMGSY-II, only 5,620 habitations
were connected. There are still 5,612 habitations that are not connected to date. Apart from this,
there are lots of habitations whose populations were below 500 as per the census 2001 but have
crossed the 500 mark as per the census 2011 and are eligible for PMGSY connectivity.
Figure 3.3 Total habitation coverage in Maharashtra year wise through PMGSY-I & II (source:
OMMAS, PMGSY date 31st May 2017)
3.3 Physical progress at the State Level
The data regarding the physical progress of the work was taken from OMMAS on 31st may 2017.
The data show that, the states of Karnataka, Haryana, and Punjab have100% completion as of 31st
may 2017. The states J &K, Assam, Uttarakhand and Jharkhand are lowest performing states
having completion of only 54%, 64%, 67% and 69.7% respectively i.e. below 70%. Maharashtra
state has a physical progress of 95% and is among the better performing state and Maharashtra
stands 7th among all states in physical performance. Despite having a huge number of works,
Maharashtra states physical progress is significant as most of the works have not been delayed.
0
5000
10000
15000
20000
25000
30000
Len
gth
Year
Total length covered under PMGSY-I and II
Km completed
Km sanctioned

79
Figure 3.4 Physical progress of PMGSY-I for all states.
3.4 Physical Progress at the District Level
Figure 3.5 Physical progress of PMGSY-I & II at district level in Maharashtra
In Maharashtra, there are roadworks that are pending in few a district which were sanctioned
during PMGSY-I. The districts of Nanded, Latur and Washim show the lowest physical
performance having only 45%, 57% and 61% respectively. The districts Akola, Buldhana, Nashik,
Gondia, Sangli, Jalgaon and Dhule show approximately 100% completion of works sanctioned
during PMGSY-I. The physical performance of PMGSY-II works in the districts Yavatmal,
Osmanabad, and Latur show 100% completion of works. While Gadchiroli, Nandurbar, and
0
20
40
60
80
100
120K
arn
atak
a
Har
yan
a
Pu
nja
b
Gu
jara
t
Utt
ar P
rad
esh
Tel
angan
a
Mah
aras
htr
a
Raj
asth
an
Tam
iln
adu
An
dhra
Pra
des
h
Ker
ala
Mad
hy
a P
rad
esh
Nag
alan
d
Go
a
Chh
atti
sgar
h
Tri
pura
Bih
ar
Him
ach
al P
rad
esh
Miz
ora
m
Sik
kim
Od
ish
a
Wes
t B
eng
al
Meg
hal
aya
Man
ipur
Aru
nac
hal
Pra
des
h
Jhar
khan
d
Utt
arak
han
d
Ass
am
Jam
mu
And
…
State level Physical Progress for PMGSY-I as on 31may 2017
40
50
60
70
80
90
100
Ak
ola
Bu
ldhan
a
Nas
hik
Go
nd
ia
San
gal
i
Jalg
aon
Dh
ule
Bh
and
ara
War
dha
Rat
nag
iri
Hin
go
li
Pun
e
Bee
d
Sola
pur
Sin
dhu
du
rg
Rai
gad
Au
rang
abad
Jaln
a
Ko
lhap
ur
Than
e
Osm
anab
ad
Sat
ara
Yav
atm
al
Nag
pu
r
Nan
du
rbar
Par
bh
ani
Ah
med
nag
ar
Pal
gh
ar
Gad
chir
oli
Ch
and
rap
ur
Am
raw
ati
Was
him
Lat
ur
Nan
ded
Per
centa
ge
Physical Progress at District Level for PMGSY-I and PMGSY-II
PMGSY-I PMGSY-II

80
Nashik show the lowest performance i.e. 74%, 78%, and 88% respectively. Apart from this, all the
other districts show a performance in the range of 90% to 100%. Only seven districts have physical
progress less than 95% and more than 90% and the remaining 24 districts have physical
performance above 95%.
Figure 3.6 Physical Progress of PMGSY roads for sample districts of the current study
A detailed evaluation of physical progress in sample districts was done using the secondary data
collected from OMMAS and PIUs. Figure 3.6 shows details about the work’s progress in each of
the sample district for PMGSY-I and PMGSY-II separately. The bifurcation was made with a type
of work i.e. new connectivity and upgradation to identify which type of works were causing a
delay in execution and ultimately affecting performance in terms of physical progress. This shows
that there is slight delay in new connectivity type of works in each district lowered the overall
physical progress of the district despite having progress of upgradation works more than 95% in
every district except Palghar.
From the graph, it is clear that districts Ratnagiri, Yavatmal, Bhandara and Kolhapur show nearly
100% completion of new connectivity works sanctioned through PMGSY-I program. While the
districts Ahmednagar and Parbhani show physical completion below 80% and Palghar district
shows 92%. The performance is lower in case of new connectivity works, with one of the reason
being the issues in land acquisition. The upgradation works sanctioned during PMGSY-I program
were in completion stage in the districts Bhandara, Kolhapur, Ratnagiri, Parbhani, and Yavatmal
having the progress of more than 95%. However, the Palghar district shows 92% completion being
0%
10%
20%
30%
40%
50%
60%
70%
80%
90%
100%
Ahmednagar Bhandara Kolhapur Palgahar Parbhani Ratnagiri Yavatmal
Physical Progress of PMGSY roads for sample districts of the current
study
PMGSY-I NC PMGSY-I_UP PMGSY-II Overall

81
the lowest amongst the sample districts. The completion status of upgradation works in PMGSY-
I & II is above 90% for all sample districts and is satisfactory.
The roads sanctioned under PMGSY-II programs shows the lower progress as this includes on-
going works sanctioned during 2016-17 and are still in completion phase. The districts, Ratnagiri
and Bhandara were good performing districts having more than 95% physical completion and the
districts Ahmednagar, Palghar and Parbhani are lower performings having physical progress less
than 80%.
3.5 Financial Performance at the District Level
Figure 3.7 Financial Progress for PMGSY-I & II for Maharashtra
The Figure 3.7 shows financial performance at the state level for PMGSY-I and PMGSY-II.
Thirteen districts show an expenditure more than sanctioned under PMGSY-I. Among these
thirteen districts, the two districts where this study was conducted are Yavatmal showing 142%
and Parbhani shows 119%. Both these districts have black cotton soil with very less ‘California
Bearing Ratio (CBR)’ value leading to increase in design thickness and thus an over expenditure
due to requirement of the treatment of soil for stabilization which may not have been considered
during the DPR preparation. Similarly, the districts Nandurbar and Gadchiroli shows less than
80% of funds utilization for PMGSY-I.
In the program PMGSY-II, only Nashik district showed more than 100% utilization funds and
almost sixteen districts shows an expenditure of less than 80% as on 31st May 2017. This lower
utilization of fund may be due to the ongoing projects for PMGSY-II. The districts Amaravati and
Nanded recorded the lowest utilization of funds with 59% and 44% as on 31st May 2017. There
0
20
40
60
80
100
120
140
160
Yav
atm
al
Par
bh
ani
Sola
pur
Lat
ur
Bee
d
Pun
e
Jaln
a
War
dha
San
gal
i
Nag
pu
r
Hin
go
li
Ko
lhap
ur
Rai
gad
Nan
ded
Dh
ule
Osm
anab
ad
Am
raw
ati
Bh
and
ara
Rat
nag
iri
Sin
dhu
du
rg
Ak
ola
Bu
ldhan
a
Was
him
Au
rang
abad
Go
nd
ia
Jalg
aon
Sat
ara
Nas
hik
Ah
med
nag
ar
Pal
gh
ar
Than
e
Ch
and
rap
ur
Nan
du
rbar
Gad
chir
oli
% a
gin
st s
anct
ioned
co
st
Financial Progress for PMGSY-I & II for Maharashtra from 2000 to May
2017
PMGSY-I PMGSY-II

82
are six districts having utilization in the range of 60% to 70% and eight districts in the range of
70% to 80%.
3.6 Expenditure per kilometre of road constructed at State Level
Figure 3.8 State wise Per Kilometer cost for upgradation and new connectivity works in lakh
Rupees
The average per kilometre cost for each state varies due to lots of parameters such as geographical
conditions, type of technology, traffic, etc. The two separate lines shown in Figure 3.8 are for per
kilometre cost of new connectivity and upgradation type of road as per the secondary data collected
from OMMAS on 31st May 2017. It must be noted that the available data was not updated as all
the states have not filled it and thus need to be updated. Based on the data available, the average
per km cost is higher in few states including J & K, Kerala, Punjab, and Tamilnadu for upgradation
works than that of new connectivity works. The expenditure per kilometre of road constructed at
state level shows that J & K and Arunachal Pradesh show highest costs of construction per km
length of Rs. 91.46 lakh/km and 61.59 lakh/km respectively, the reason being that both are hilly
regions. The states Sikkim, Goa, and Mizoram show least per km cost of Rs.5.18 lakh/km, Rs.7.47
lakh/km, Rs.10.93 lakh/km. In case of per km cost for new connectivity type of road, Tripura,
Arunachal Pradesh and Sikkim show the highest cost while Karnataka, Punjab and Tamilnadu
show lowest per km cost.
0102030405060708090
100
Jam
mu
And
…
Aru
nac
hal
Pra
des
h
Tri
pu
ra
Ker
ala
Wes
t B
engal
Pun
jab
Meg
hal
aya
Jhar
kh
and
Od
isha
Bih
ar
Man
ipur
Har
yan
a
Utt
ar P
rades
h
Tam
iln
adu
Utt
arak
han
d
Ass
am
Mad
hya
Pra
des
h
Ch
hat
tisg
arh
Him
achal
Pra
des
h
Gu
jara
t
Mah
aras
htr
a
Nag
alan
d
Raj
asth
an
Kar
nat
aka
An
dh
ra P
rades
h
Tel
angan
a
Miz
ora
m
Go
a
Sik
kim
Per
centa
ge
State wise Per Kilometer cost for upgradation and new connectivity
works in lakh Rupees
Upgradation New Connectivity

83
Figure 3.9 District wise per kilometer cost for new connectivity and upgradation of roads in lakh
rupees
The data for per km cost was downloaded from OMMAS website as on 31st May 2017. The data
was not updated by all districts regularly and shows blank values for most of the years. Based on
the available data on OMMAS the graphs plotted for each district are shown in Figure 3.9. the per
km cost of new connectivity roads for the districts of Nandurbar, Dhule and Raigad were amongs
the highest in Maharashtra and the cost ranged from Rs.13.23 lakh/km to Rs. 52.90 lakh/km. For
the districts of Parbhani, Hingoli, Osmanabad, Wardha, and Jalana the cost per km length is less
than Rs.15 lakh/km. In case of upgradation type of works, Palghar district shows the highest cost
and is only one district having per km cost more than Rs. 40 Lakh/km. The districts Hingoli, Beed,
Bhandara, Osmanabad, and Latur shows least per km cost and is less than Rs. 20 lakh/km. The
detailed analysis of per km cost was done for sample districts separately and shown in subsequent
section in this chapter.
0
10
20
30
40
50
60
Nan
du
rbar
Dh
ule
Rai
gad
Than
e
Gad
chir
oli
Pal
gh
ar
Rat
nag
iri
Ah
med
nag
ar
Nas
hik
Ak
ola
Sat
ara
Yav
atm
al
Sin
dhu
du
rg
Nan
ded
Pun
e
Bee
d
Sola
pur
Am
raw
ati
Bu
ldhan
a
Au
rang
abad
Nag
pu
r
Ch
and
rap
ur
Was
him
Ko
lhap
ur
Lat
ur
San
gal
i
Go
nd
ia
Jaln
a
War
dha
Osm
anab
ad
Hin
go
li
Par
bh
ani
Bh
and
ara
Jalg
aon
in l
akh R
up
ees
Districtwise per kilometer cost for new connectivity and upgradation of
roads in lakh rupees
New Connectivity Upgradation

84
Figure 3.10 Average per kilometre cost for sample district only for pavement
The average cost for one kilometre of length varies work to work due to an existing condition,
geographical condition, traffic, the technology used etc. Figure 3.10 shows the average cost of
construction per kilometre in each district. This cost is calculated based on the total expenditure
occurred and length covered. The separate cost of construction was calculated for PMGSY-I and
PMGSY-II as PMGSY-I includes new connectivity and upgradation works while PMGSY-II
includes the only upgradation works. The costs were calculated separately one with only pavement
and one with the inclusion of CD work’s cost.
In PMGSY-I Palghar district show the highest per kilometre cost of construction followed by
Ratnagiri. The costs are higher because a large number of the roads in Palghar district sanctioned
after 2010 having higher costs of construction. Cost of construction was lowest for Bhandara
district. The percentage of CD works cost was higher in the districts Palghar, Ratnagiri, and
Parbhani. Ahmednagar has the highest number of CD works and Bhandara has least.
In general average per km cost for PMGSY-II is much higher than that of PMGSY-I. This is
because costs for PMGSY-I are average of costs from 2001 to till date and for PMGSY-II the costs
are an average of costs from 2011 only where the increase in commodity prices affect per km cost
annually. In case of PMGSY-II, there is a lot of difference in cost including CD works and
excluding CD works. Parbhani district shows the highest cost of construction for PMGSY-II roads
and Kolhapur district show the lowest cost of construction with and without CD work. In Bhandara
district, CD work’s cost is lower than that of all other districts followed by Ratnagiri district. The
percentage of CD work cost is highest in district Yavatmal i.e. 23% of the total value and lowest
in Ahmednagar district despite having more number of CD works. The reason behind the high cost
of construction in Parbhani district is black cotton soil which requires much more cost for
stabilization and same in Ratnagiri due to laterite soil which has good CBR value.
0.00
10.00
20.00
30.00
40.00
50.00
60.00
70.00
Ahmednagar Parbhani Yavatmal Bhandara Kolhapur Ratnagiri Palghar
Average Per km cost for PMGSY-I & II including and excluding CD work
Cost
PMGSY I_Pavement PMGSY I_Pavement_CD Works
PMGDY II_Pavement_CD Works PMGSY II_Pavement
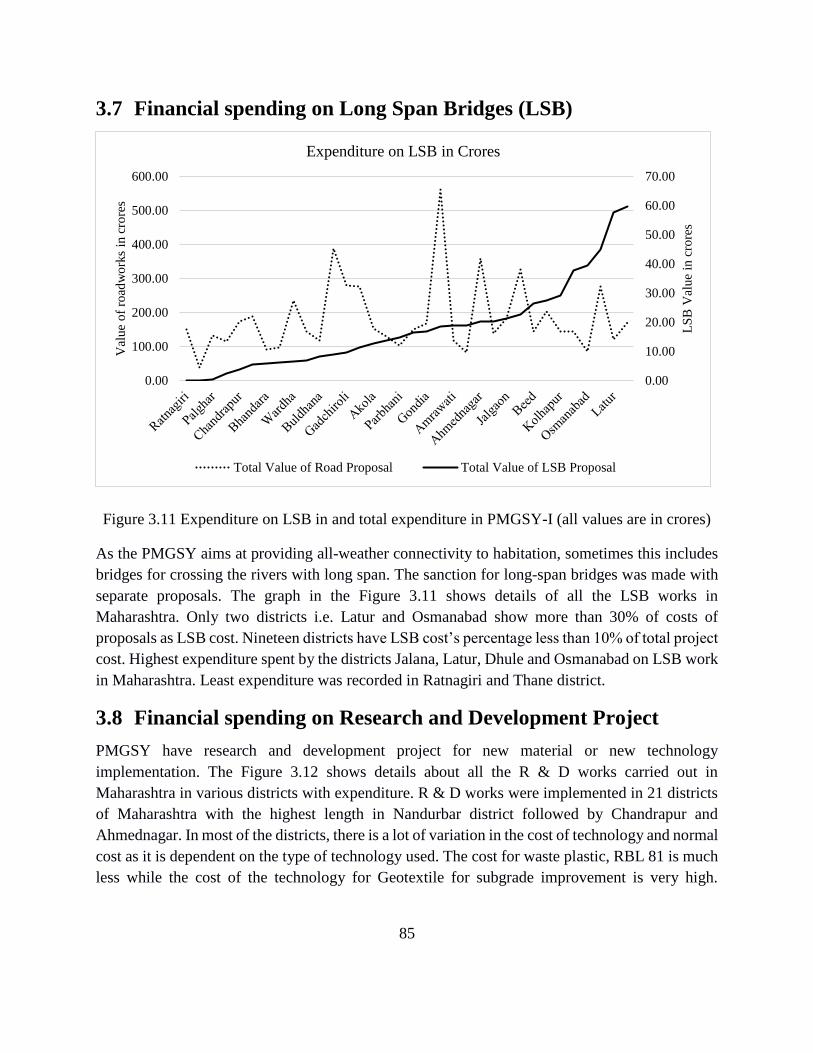
85
3.7 Financial spending on Long Span Bridges (LSB)
Figure 3.11 Expenditure on LSB in and total expenditure in PMGSY-I (all values are in crores)
As the PMGSY aims at providing all-weather connectivity to habitation, sometimes this includes
bridges for crossing the rivers with long span. The sanction for long-span bridges was made with
separate proposals. The graph in the Figure 3.11 shows details of all the LSB works in
Maharashtra. Only two districts i.e. Latur and Osmanabad show more than 30% of costs of
proposals as LSB cost. Nineteen districts have LSB cost’s percentage less than 10% of total project
cost. Highest expenditure spent by the districts Jalana, Latur, Dhule and Osmanabad on LSB work
in Maharashtra. Least expenditure was recorded in Ratnagiri and Thane district.
3.8 Financial spending on Research and Development Project
PMGSY have research and development project for new material or new technology
implementation. The Figure 3.12 shows details about all the R & D works carried out in
Maharashtra in various districts with expenditure. R & D works were implemented in 21 districts
of Maharashtra with the highest length in Nandurbar district followed by Chandrapur and
Ahmednagar. In most of the districts, there is a lot of variation in the cost of technology and normal
cost as it is dependent on the type of technology used. The cost for waste plastic, RBL 81 is much
less while the cost of the technology for Geotextile for subgrade improvement is very high.
0.00
10.00
20.00
30.00
40.00
50.00
60.00
70.00
0.00
100.00
200.00
300.00
400.00
500.00
600.00
LS
B V
alue
in c
rore
s
Val
ue
of
road
wo
rks
in c
rore
s
Expenditure on LSB in Crores
Total Value of Road Proposal Total Value of LSB Proposal

86
Ahmednagar district shows the highest cost of new technology followed by Dhule due to use of
geotextile for subgrade stabilization.
Figure 3.12 Expenditure on R & D Projects in Maharashtra
3.9 Financial Spending on New connectivity and Upgradation
Works
PMGSY-I program has two types of works i.e. New connectivity type and Upgradation type. The
funds were sanctioned separately for both types of roads. The detailed analysis of expenditure
spent on these two types of roads in sample district is shown in Figure 3.13. Bhandara district
doesn’t have any new connectivity road sanctioned and hence no expenditure spent on such type
of works. Only 16% of the total expenditure spend on all types of works was spent on new
connectivity type of works. Palghar district shows highest expenditure spends on new connectivity
type of road followed by Ahmednagar district. In the districts Parbhani and Yavatmal less than 5%
of the budget was spent allocated to new connectivity works while in the district Kolhapur and
Ratnagiri the percentage expenditure spent on new connectivity works was less than 10% but more
than 5%. Palghar is the district spending 70% of the amount for new connectivity and only 30%
on upgradation as there were lots of unconnected habitations in tribal blocks. Ahmednagar district
recorded the highest spending on upgradation type of works among all the seven sample districts
followed by Yavatmal. Bhandara, being a small district with the only upgradation works recorded
second lowest expenditure among all sampled district.
0
10
20
30
40
50
60
0.00
500.00
1,000.00
1,500.00
2,000.00
2,500.00
3,000.00
3,500.00
4,000.00
Len
gth
in K
m
Am
ount
in L
akh
Expenditure on R & D Projects
Technology Length Non Technology Length Sanctioned Cost Technology Cost

87
Figure 3.13 Expenditure on New Connectivity and Upgradation works
Recommendations
1) Due to low maintenance budget for such huge network in Maharashtra maintaining and
reconstruction of whole networks is not possible for the state alone. Thus, there is a need
for continued support from the centre for development of rural roads so that the optimal or
core network can be kept in all-weather accessible condition.
2) After complete connectivity to all the habitations with population more than 500 through
PMGSY, there is need to focus on habitations with a population less than 500 and need to
be covered by PMGSY or Mukhya Mantri Gram Sadak Yojana (MMGSY) in the state.
0.00
5000.00
10000.00
15000.00
20000.00
25000.00
30000.00
Ahmednagar Parbhani Yavatmal Bhandara Kolhapur Ratnagiri Palghar
Expenditure on New Connectivity and Upgradation works
New Connectivity Upgradation


89
4 Environmental Impact Assessment
4.1 Introduction The overall impact of PMGSY roads on the environment was evaluated by using the Strategic Life
Cycle Sustainability Tool (SLCSA) developed by CTARA, IIT Bombay in Association with
NRRDA, MoRD New Delhi. The environmental impact analysis was done for life cycle
inventories of different emissions during material production, transportation and placing a road
based on DPR as well as actual quantities executed as per measurement book. Ultimately all types
of emission were calculated and the life cycle assessment is presented in the form of endpoint
indicators denoting impact on the environment, human health and resource depletion due to
construction and uses of the road. The tool considers the emissions right from raw material
exploration, transportation to manufacturing plant, transportation to site and placing on the site to
uses by vehicles until the end of the roads life.
The input data needed for the tool is basic data used during the estimate preparation or actual
execution of items on the field. This tool calculates the required materials quantity using the
executed item. Emission during manufacturing and transportation are calculated for the required
materials quantity. The data has been divided into two forms i.e. preferred data and mandatory
data. The DPR data which was easily available with the PIU and which can be obtained from PIU
is called as Mandatory data and the data on which contractors payment is not dependent is not
recorded in DPR or MB and this data is needed for environmental impact assessment is called as
preferred data. Preferred data need to be maintained in inventory form by each PIU if the tool
needs to be fixed with their system to analyse the environmental impact of rural roads. The
preferred data can be calculated by the tool itself based on some assumptions mentioned in the
database of the tool. The detail list of data used i.e. both mandatory and preferred is given in the
Annexure-II at the end of the report.
For the current study, seven districts were selected for the environmental impact assessment. The
DPR and MB of the four roads from each district were collected except two DPR and two MB
from Kolhapur which were not received from the respective districts PIU. The quantities of
materials used during the construction and maintenance of road mainly during earthwork, wearing
surface (bituminous), cross drainage and gutter works, cement concrete pavements, restoration of
rain cuts, maintenance of shoulders, repair of potholes and patches etc. were calculated using
SLCSA tool based on executed quantity of these works. The transport of materials data was
collected from the lead chart of the DPR and traffic survey data was also collected from DPR based
on traffic survey. Environmental impact is expressed in terms of midpoint indicators such as
climate change, terrestrial acidification, marine eutrophication, photochemical oxidant formation,
particulate matter formation, human toxicity, marine ecotoxicity water depletion and fossil
90
depletion. The detail environmental impact of the 26 PMGSY roads in terms of different midpoint
indicators is explained further.
4.2 Energy usage in different phases of road life The energy is used for different activities such as transportation of raw materials, manufacturing
of materials, transportation of manufactured materials and used during the usage of road is
calculated in different phases of road life such as during construction of the road, maintenance of
the road and usage of the road. The chart below shows the total energy used in the different phase
of the roads lifecycle. The detail bifurcation of energy uses in each phase is described afterword
in the same chapter. The energy usage at different stages of road construction such as during
construction, maintenance and after construction of the road is given in Figure 4.1 for both DPR
and MB data. The energy is used in the form of fuel to run the machinery and vehicles which are
involved in the construction work. Though, most of the energy used in the usage phase i.e. after
the construction of the road, there is also some amount of energy used during construction and
maintenance of the road because of the use of vehicles and machinery for the work.
1. The highest energy is used in the usage phase and the contribution of energy uses is calculated
based on the current traffic survey and estimated traffic on the road with the assumption of 6%
annual growth as per IRC standards.
2. 65% of the energy uses is consumed in the usage phase of the lifecycle of the road.
3. Only 13% of the energy is used during the maintenance phase of the roads life.
4. 23% of the energy is used for the construction of the road and this energy is mainly utilised for
the material production and transportation.
5. The actual energy uses is less as predicted by the tool and need to be calculated based on the
actual traffic reached on the road. As most of the road has achieved traffic growth of 6%.
6. There is a slight difference in the energy uses as per DPR and as per MB i.e. particularly in the
construction phase of the road as the estimated items may vary and exceed or decrease during
execution of the road.
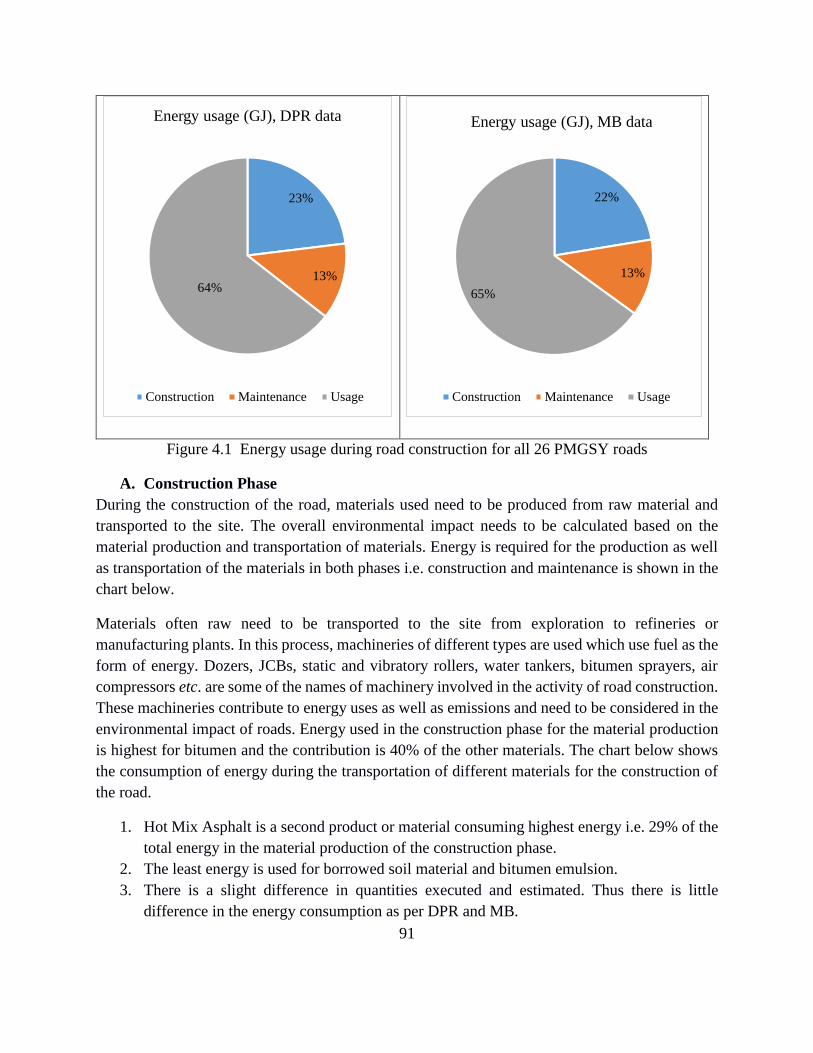
91
Figure 4.1 Energy usage during road construction for all 26 PMGSY roads
A. Construction Phase
During the construction of the road, materials used need to be produced from raw material and
transported to the site. The overall environmental impact needs to be calculated based on the
material production and transportation of materials. Energy is required for the production as well
as transportation of the materials in both phases i.e. construction and maintenance is shown in the
chart below.
Materials often raw need to be transported to the site from exploration to refineries or
manufacturing plants. In this process, machineries of different types are used which use fuel as the
form of energy. Dozers, JCBs, static and vibratory rollers, water tankers, bitumen sprayers, air
compressors etc. are some of the names of machinery involved in the activity of road construction.
These machineries contribute to energy uses as well as emissions and need to be considered in the
environmental impact of roads. Energy used in the construction phase for the material production
is highest for bitumen and the contribution is 40% of the other materials. The chart below shows
the consumption of energy during the transportation of different materials for the construction of
the road.
1. Hot Mix Asphalt is a second product or material consuming highest energy i.e. 29% of the
total energy in the material production of the construction phase.
2. The least energy is used for borrowed soil material and bitumen emulsion.
3. There is a slight difference in quantities executed and estimated. Thus there is little
difference in the energy consumption as per DPR and MB.
23%
13%64%
Energy usage (GJ), DPR data
Construction Maintenance Usage
22%
13%
65%
Energy usage (GJ), MB data
Construction Maintenance Usage
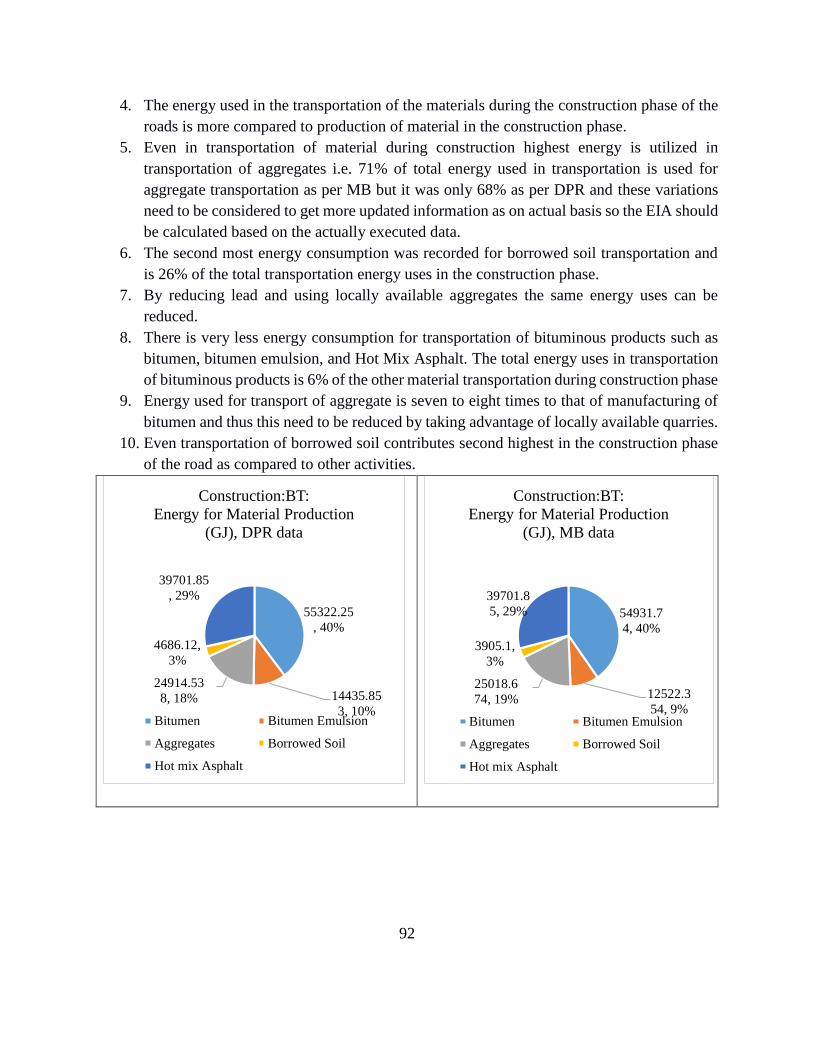
92
4. The energy used in the transportation of the materials during the construction phase of the
roads is more compared to production of material in the construction phase.
5. Even in transportation of material during construction highest energy is utilized in
transportation of aggregates i.e. 71% of total energy used in transportation is used for
aggregate transportation as per MB but it was only 68% as per DPR and these variations
need to be considered to get more updated information as on actual basis so the EIA should
be calculated based on the actually executed data.
6. The second most energy consumption was recorded for borrowed soil transportation and
is 26% of the total transportation energy uses in the construction phase.
7. By reducing lead and using locally available aggregates the same energy uses can be
reduced.
8. There is very less energy consumption for transportation of bituminous products such as
bitumen, bitumen emulsion, and Hot Mix Asphalt. The total energy uses in transportation
of bituminous products is 6% of the other material transportation during construction phase
9. Energy used for transport of aggregate is seven to eight times to that of manufacturing of
bitumen and thus this need to be reduced by taking advantage of locally available quarries.
10. Even transportation of borrowed soil contributes second highest in the construction phase
of the road as compared to other activities.
55322.25
, 40%
14435.85
3, 10%
24914.53
8, 18%
4686.12,
3%
39701.85
, 29%
Construction:BT:
Energy for Material Production
(GJ), DPR data
Bitumen Bitumen Emulsion
Aggregates Borrowed Soil
Hot mix Asphalt
54931.7
4, 40%
12522.3
54, 9%
25018.6
74, 19%
3905.1,
3%
39701.8
5, 29%
Construction:BT:
Energy for Material Production
(GJ), MB data
Bitumen Bitumen Emulsion
Aggregates Borrowed Soil
Hot mix Asphalt

93
Figure 4.2 Energy for Material Production and Transportation during construction
B. Maintenance Phase
During the maintenance phase of the road, there is a need for continuous repair of road periodically.
The maintenance work includes filling potholes, doing patchworks where ravelling is more,
removing branches of trees which do not permit smooth travelling, clearing the wastes along the
cross drainage and culverts etc. For such activates there is need of materials and machinery which
contributes to energy consumption. The energy is utilised for both productions as well as
transportation of the materials. The following figure shows energy used in the maintenance phase
of the roads life for different purposes such as material production and material transportation. The
uses of energy depend upon the maintenance activities are done. Right now the maintenance data
is not available that much accurately thus the energy uses is calculated based on the estimated
maintenance plan from DPR and need to be updated by PIU for more precise results. The energy
usage in transport during maintenance work is as shown in the figure for both DPR and MB data
separately. Maintenance work requires raw materials like bitumen, soil, aggregates of stone, metal,
rubble etc. and is not available near the site.
1. The highest energy is consumed for the transportation of borrowed soil during maintenance
activities i.e. during the cleaning the trenches and shoulders. The percentage is 44% of the
total energy used in the transportation of materials.
2. A second highest item that uses the energy is the transportation of Bitumen emulsion and
the third most item is the transportation of Hot Mix Asphalt.
11598.14
7, 2%13693.88
4, 2%
410269.8
06, 68%
157896.2
1, 26%
11624.18
1, 2%
Construction: BT:
Energy usage in Transport (GJ), DPR
data
Bitumen Bitumen Emulsion
Aggregates Borrowed Soil
Hot mix Asphalt
11598.1
47, 2% 9137.93
4, 2%
412131.
237,
71%
134595.
78, 23%
11624.1
81, 2%
Construction: BT:
Energy usage in Transport (GJ),
MB data
Bitumen Bitumen Emulsion
Aggregates Borrowed Soil
Hot mix Asphalt
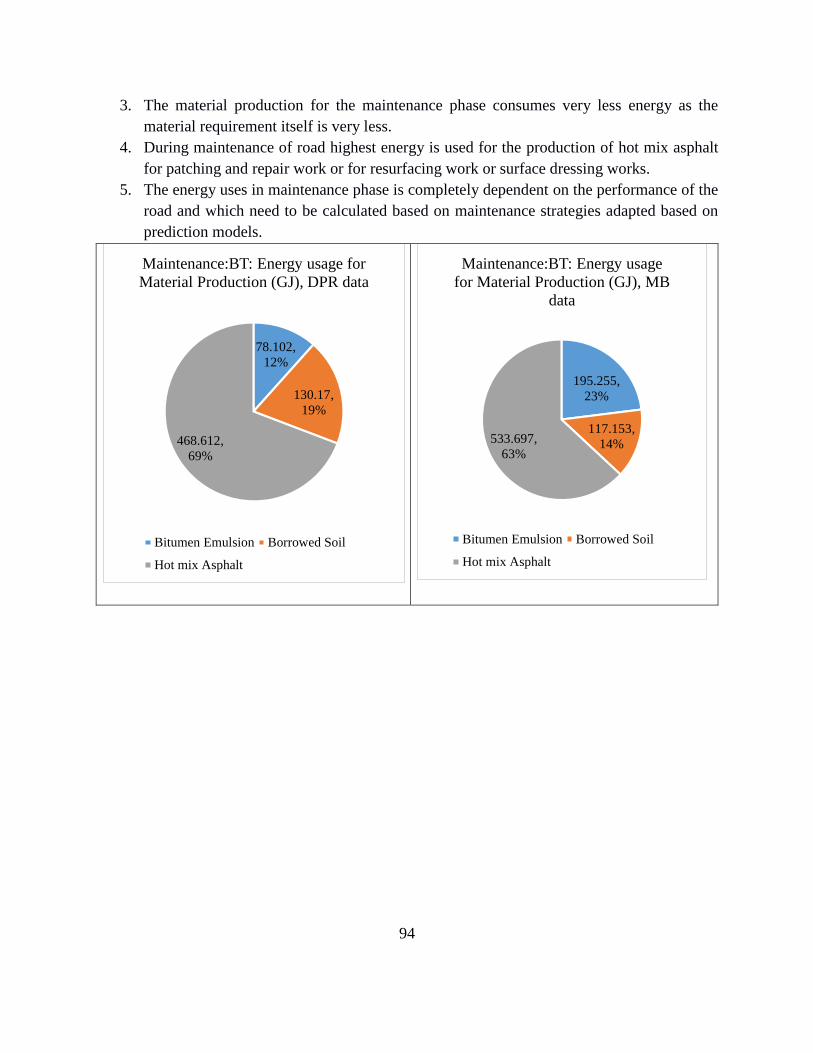
94
3. The material production for the maintenance phase consumes very less energy as the
material requirement itself is very less.
4. During maintenance of road highest energy is used for the production of hot mix asphalt
for patching and repair work or for resurfacing work or surface dressing works.
5. The energy uses in maintenance phase is completely dependent on the performance of the
road and which need to be calculated based on maintenance strategies adapted based on
prediction models.
78.102,
12%
130.17,
19%
468.612,
69%
Maintenance:BT: Energy usage for
Material Production (GJ), DPR data
Bitumen Emulsion Borrowed Soil
Hot mix Asphalt
195.255,
23%
117.153,
14%533.697,
63%
Maintenance:BT: Energy usage
for Material Production (GJ), MB
data
Bitumen Emulsion Borrowed Soil
Hot mix Asphalt

95
Figure 4.3 Energy usage for material production during maintenance
4.3 Mid-point indicators.
SLCSA tool gives EIA in the form of endpoint indicators which ultimately affect human health,
environment and resource depletion. The detailed impact in the form of endpoint indicator is listed
below with a comparison of data from MB and DPR for all the phases of roads life i.e. construction,
maintenance and uses.
4.3.1 Impact on climate change
Impact on climate change is due to emissions like CO2 and CH4 during production and
transportation of materials and uses by different vehicles. Impact on the climate change is denoted
in terms of kg of CO2 and all the other emissions are converted to kg equivalent of CO2. Climate
change is a measure of global warming and the gases that are responsible for global warming are
like CO2, CH4 comes out in all the phases of the roads life. The emission inventory was prepared
for all the activities such as transportation of raw materials, production of material and
transportation such materials to the site.
1. Highest emissions were estimated during the uses phase of the road due to uses by different
road users. The percentage contribution due to uses of the road is around 49% and these
are simply based on the estimated traffic as mentioned DPR.
4568.967
, 46%
4647.069
, 47%
650.85,
7%
Maintenance:BT: Energy usage in
transport (GJ), DPR data
Bitumen Emulsion Borrowed Soil
Hot mix Asphalt
4568.967
, 49%4178.457
, 44%
650.85,
7%
Maintenance:BT: Energy usage in
Transport (GJ), MB data
Bitumen Emulsion Borrowed Soil
Hot mix Asphalt

96
2. Secondly, 30% of the Green House gas emission was contributed in the maintenance phase.
The maintenance activities may vary and the percentage can be reduced if the performance
of the road is better.
3. At all the phases there is large emissions are contributed due to site emissions during
different activities and contribution during maintenance in percent is 29%.
4. There are minimum emissions during the production phase of all the phases of the road and
their contribution is less than one percent.
5. There is variation in the quantities executed but this does not have a considerable impact
on the Green House gas emission and thus based on the DPR quantities EIA can be
calculated to near approximate.
Figure 4.4 Impact of climate change
4.3.2 Impact on Terrestrial Acidification
Terrestrial acidification is mainly caused by atmospheric deposition of acidifying compounds. The
acidifying components are the one with SO2 and NO2. The emissions from all the activities were
calculated in the form of SO2 and NO2 and converted to SO2 equivalent. The terrestrial
acidification is measured in terms of kg SO2 equivalence. The results due to the construction of
the 26 roads are represented in the following figure. Interpretation of the graph is enumerated
below.
1. The terrestrial acidification is measured in terms of kg equivalence of SO2 and the highest
contribution is due to uses phase of the roads life. The contribution of uses phase of the
road in terrestrial acidification is 55% to that of all the other phase.
2. Site emissions during construction of the road contribute to 25% of terrestrial acidification
and there is a slight change in the quantities executed and estimated.
43.2
480.1
1430.2
0.6
14.1
2452.2
4174.8
43.2
453.8
1377.7
0.7
13.8
2451.6
4174.8
0 500 1000 1500 2000 2500 3000 3500 4000 4500
Production
Transport
Site Emissions
Production
Transport
Site Emission
Co
nst
ruct
ion
Mai
nte
nan
ce
Usa
g
e
100000 CO2 Eq.
MB
DPR

97
3. The variation of emissions from DPR and MB are 3% and these variations are due to
variation in the executed quantities.
4. Least contribution towards terrestrial acidification is due to the material production phase
of construction and maintenance phase and the percent contribution is less than three
percent.
5. Highest contribution to terrestrial acidification is due to uses phase of the road followed by
construction phase and lastly maintenance phase.
Figure 4.5 Impact on Terrestrial Acidification
4.3.3 Marine eutrophication
The marine eutrophication is caused due to nitrogen and ammonia and the emissions are released
into the marine during exploration or in the refinery. Marine eutrophication is mainly an
enrichment of water bodies with an excess amount of nutrients which induces growth of plants and
algae and may result in oxygen depletion of the water body. Marine Eutrophication is measured in
terms of kg of Nitrogen equivalent. All the ammonia and NOx are converted to kg equivalent of
Nitrogen.
1. The highest contribution to the marine eutrophication is by the users of the road during the
uses phase. The percentage contribution is 48% and totally based on the estimated traffic
in the DPR.
2. The construction phase of the road has a second highest contribution to the marine
eutrophication and the percentage of contribution is 44%.
47.6
302.7
878
0.4
6.8
326.5
1936.3
47.6
288
855.3
0.4
6.6
326.5
1936.3
0 500 1000 1500 2000 2500
Production
Transport
Site Emissions
Production
Transport
Site Emissions
Co
nst
ruct
ion
Mai
nte
nan
ceU
sage
1000 kg SO2 Eq.
MB DPR

98
3. During the construction phase of the road, the maximum emission is caused due to site
emissions and the percentage of site missions is 34%.
4. Least contribution to marine eutrophication is caused in the maintenance phase and the
percentage contribution is only 7%.
5. Material production phase does not have a significant impact on marine eutrophication as
compared to site emission and uses phase.
Figure 4.6 Impact on Marine Eutrophication
4.3.4 Photochemical Oxidant Formation
The photochemical oxidant formation occurs mainly because of the reaction of sunlight with
emissions from fossil fuel combustions. The fossil fuel combustion is happening in the combustion
engine of each vehicle which was used to supply materials to the site, machinery uses during
construction and maintenance of the road and uses of the road by vehicles throughout the life of
the road. The photochemical Oxidant Formation is measured in terms of kg equivalent of Non-
Methane Volatile Organic Compounds (NMVOC). All the other emissions i.e. CO, CH4, NOx and
SOx are converted to NMVOC equivalent with a factor of conversion. The chart below shows the
details about the photochemical oxidant formation due to 26 roads lifecycle impact.
1. In the photochemical oxidant formation is majorly due to the emission during the uses
phase of the road due to uses of the road various vehicles throughout the life of the road.
The percentage contribution of the uses phase of the road to the photochemical oxidant
formation is 56%.
27.4
147.1
575.4
0.2
2.3
129.3
808.4
27.4
141.9
561.1
0.3
2.2
129.1
808.4
0 200 400 600 800 1000
Production
Transport
Site Emissions
Production
Transport
Site Emissions
Co
nst
ruct
ion
Mai
nte
nan
ceU
sage
100 kg N eq
Marine Eutrophication
MB DPR

99
2. The second major phase of the road which contributes to the photochemical oxidant
formation is construction phase having 31% emissions of different potential gases.
3. Third and the last phase is maintenance phase having the contribution of only 12% to
photochemical oxidant formation.
4. In the construction phase, site emission contributes largely with 19% contribution and 10%
by transportation of materials during construction.
5. There is little variation in the percentage contribution in the construction phase as per DPR
data and MB data. MB data shows 0.5% less contribution in the transport of material and
0.8% less in site emission phase.
Figure 4.7 Photochemical Oxidant Formation
4.3.5 Particulate Matter Formation
Particulate matter also known as particle pollution is a complex mixture of extremely small
particles and liquid droplets that get into the air. These particles in the air are either directly emitted
when fuel is burnt or indirectly formed when gaseous pollutants turn into particulate matter. Once
inhaled, these particles can affect the body and cause serious health effects. As fuel is burnt during
the transportation there is more potential for particulate matter formation. Particulate matter
formation is majorly due to the emission of particles in the lifecycle of the road. Particulate matter
is measured in terms of kg equivalence of PM10 particles. The details about the impact of the road
on particulate matter formation are given in the chart below.
71.1
403.4
807.2
0.4
6.8
498.5
2358.6
71.3
386
772.6
0.4
6.6
498
2358.6
0 500 1000 1500 2000 2500
Production
Transport
Site Emissions
Production
Transport
Site Emissions
Co
nst
ruct
ion
Mai
nte
nan
ceU
sage
1000kg NMVOC eq
Photochemical Oxidant Formation
MB DPR

100
1. Particulate matter formation occurs in the construction phase itself during transportation of
the materials and placing of the materials. The percentage contribution of the construction
phase to particulate matter formation is 97%.
2. Maintenance phase and uses phase contributes only 3% and is negligible in comparison to
the construction phase.
3. The highest percentage contribution is due to transportation of the materials to the site
during the construction phase. The percentage of transportation is 92%.
4. There is still variation in the percentage shown by the DPR quantities and quantities
executed i.e. MB quantities. The variation is 3.4%.
Figure 4.8 Particulate Matter Formation
4.3.6 Human toxicity
Human toxicity is measured in kg 1,4-Dichloro-Benzene equivalent and is an index that reflects
the potential harm of a unit of chemical released into the environment. The major emission
responsible for human toxicity is phenolic compounds. Phenols with 1,4-Dichloro Benzene are
very harmful. The below chart shows the human toxicity caused due to 26 rural roads. Despite
having very less emission of such products the potential of harmfulness is very high and thus need
to be taken care of.
1. Human toxicity is caused during the only material production phase of the road as the during
the material production phase while refining the petroleum products such harmful compounds
are released.
2. There is no contribution of uses phase to human ecotoxicity indicator and even in construction
and maintenance phase, only material production phase has a contribution towards this
indicator.
191.6
3907.6
22.6
0.9
35.8
14
82.2
192.1
3763.6
21.5
1
32.7
14
82.2
0 1000 2000 3000 4000 5000
Production
Transport
Site Emissions
Production
Transport
Site Emissions
Co
nst
ruct
ion
Mai
nte
nan
ceU
sage
10000 kg PM10 eq
Particulate Matter Formation
MB DPR

101
3. Material production during construction has highest i.e. 98% and only 2% is contributed to
maintenance phase which can be varying depending on the maintenance activities.
Figure 4.9 Impact of road on Human Toxicity
4.3.7 Marine Ecotoxicity
Marine Ecotoxicity is caused by natural or synthetic pollutants which are released to the
environment. The ecotoxicity is measured in kg 1,4-Dichlorobenzene equivalent. Phenolic
compounds are responsible for the marine ecotoxicity. Phenolic compounds were used in the
refinery of bitumen extraction process. Thus, only production phase of maintenance and
construction is responsible for this type of endpoint indicator. The below chart shows the details
about ecotoxicity caused due to 26 rural roads. The marine ecotoxicity caused due to such large
number of roads is very less and is 0.1 mg equivalence of 1, 4, Dichloro Benzene and is very
negligible.
520.7
0
0
13.1
0
0
0
520.7
0
0
13.1
0
0
0
0 100 200 300 400 500 600
Production
Transport
Site Emissions
Production
Transport
Site EmissionsC
onst
ruct
ion
Mai
nte
nan
ce
Usa
g
e
10-3kg 1,4-Dichloro Benzene eq
Human Toxicity
MB DPR

102
Figure 4.10 Impact of road on Ecotoxicity
4.3.8 Water Usage and Water Depletion
The volume of water used per kilometre of road is shown in the figure for DPR and MB data.
About 99% of the total water is used at the time of material production for construction stage of
the road. The moisture content in the soil is important during compaction of the road and the degree
of compaction depends on the water content in the soil. Compaction is done to achieve maximum
density in the soil so that there would be no settlement in the future. And also at the time of
maintenance of the road, a small amount of water is used to avoid dust particles which are added
during the time of work to the surrounding area.
0.1
0
0
0
0
0
0
0.1
0
0
0
0
0
0
0 0.02 0.04 0.06 0.08 0.1 0.12
Production
Transport
Site Emissions
Production
Transport
Site EmissionsC
onst
ruct
ion
Mai
nte
nan
ceU
sage
10-3kg 1,4-DB eq
Marine Ecotoxicity
MB DPR

103
Figure 4.11 Water Depletion
4.3.9 Fossil depletion
The fossil depletion due to the construction of the road is given in the figure. Lots of vehicles and
different types of machinery were used during the construction of the road fossil fuel is extracted
from the ground and used as fuel for all types of equipment’s and machineries used on site. Fossil
fuel depletion is measured in terms of tonnes of oil equivalent or kg of oil equivalent. Highest
fossil fuel consumption was recorded in construction phase only for production of bitumen. The
overall 7913 tonne of crude oil was used for the construction of the 26 roads surveyed.
0
5000
10000
15000
20000
25000
ProductionTransport EmissionProductionTransport Emission
Construction Maintenance Usage
m3
Water Depletion
DPR MB
0
1000000
2000000
3000000
4000000
5000000
6000000
7000000
8000000
9000000
ProductionTransport EmissionProductionTransport Emission
Construction Maintenance Usage
kg o
il e
q
Fossil Depletion
DPR MB

104
Figure 4.12 Fossil Depletion

105
5 Socioeconomic Evaluation of PMGSY
5.1 Introduction PMGSY program was introduced to connect the unconnected villages which do not have much
traffic. Every road is meant to give returns in terms of reducing time, vehicle operating cost
and accident costs as direct benefits. The traffic on the rural roads is less, hence, the direct
benefits may not be enough for economic recovery. However, these roads help in uplifting
rural poverty i.e. socioeconomic benefits called as indirect benefits. Thus it is important to find
out indirect benefits of such roads. The socioeconomic impact is evaluated for this purpose in
this project.
5.2 Methodology The methodology adopted for socioeconomic evaluation was based on social science research
methodology. Firstly all stakeholders were identified who are directly or indirectly affected by
the construction of the road. Thereafter on focusing major stakeholders i.e. benefitted
inhabitants major sectors and indicators were identified for carrying out the socioeconomic
impact of the road. The indicator framework and stakeholder identification are discussed
further in this chapter. Based on potential sectors and indicators, a questionnaire was prepared
which contains qualitative as well as quantitative closed-ended questions regarding the
situation before and after road. The data was collected by using different approaches.
1. Individual interviews
2. Focused group discussions
3. Secondary data from PIU and other sources.
To collect the primary data, face to face individual interviews were carried out using closed-
ended questionnaire survey, while in habitations, household surveys were carried out. To get
a dispersed sample in a habitation, our team got distributed to different regions of the village
so that inclusion of all types of families were assured. However, in some habitations, where
household survey was not possible, in such circumstances, group discussions were carried out
to collect the data. The data is completely perception based and thus we tried with the varying
age of roads and avoided roads that were built recently or very old.

106
5.3 Stakeholders involved in PMGSY
Figure 5.1 Stakeholders involved in PMGSY
5.4 Sampling Sampling for the socioeconomic survey was discussed in the chapter one in sub-heading 1.6.
Sampling for the socioeconomic study was done based on different types of connectivity type
i.e. new connectivity and upgradation. The population of the habitation was the other parameter
considered in sampling. The Maharashtra state is divided into its agro-climatic zones. In
Maharashtra, we have nine agro-climatic zones. In each agro-climatic zone, one district was
selected. The Agro Climatic Zone Map of Maharashtra was adapted from Department of
Agriculture, Government of Maharashtra. The three agro-climatic zones i.e. Western Ghat
zone, Sub Mountain zone and Western Maharashtra Plain zone were represented with the very
thin strip. So within this three transition zone, only one district was selected.
In each of the above-selected district, four roads were selected for socioeconomic evaluation,
environmental impact assessment and performance purpose. Out of these four roads, two roads
were of New Connectivity type and two roads of Upgradation. The selected two roads from
New Connectivity and Upgradation were further divided into different population size one of
each 500 and 1000 population. But In case of hilly region population size of 250 was
considered. Further in particular district where either only New Connectivity or Upgradation
roads were available, the roads of different age were taken as sampling strategy but the
population criteria remain the same.
5.5 Sector and Indicator Framework In order to study the socioeconomic impact of the road, it was necessary to find out which
sector the connectivity affected the most. Major sectors were identified to include in a

107
questionnaire which could help to find the impact of the road in the day to day life of
beneficiaries. Each sector subclassified into indicators. Collecting data on all such sub-
indicators takes too much time in the survey and thus only a few of the indicators were selected
and analysed at state level and district level in the further sections.
1) Transport Indicator
The sub-indicators of transport were used to understand the effect of traffic, fleet, trade, safety,
revenue, and accessibility due to the construction of the road resulting in the change in the
pattern of transportation.
1 Increase in number of vehicles
2 State transport facility
3 Increase or decrease in frequency of travel
4 Gender wise travel pattern
5 Reduction in time due to road
6 Change in pattern of travelling
2) Agriculture and Allied sector
The parameters like agriculture production and productivity helped us to understand the change
in land usage, dependency on fertilizer, change in production and productivity of crops, the
price of goods, and the status of beneficiaries.
3) Small Scale enterprise Sector
To know the other source of income apart from agriculture and introduction of new facilities
or technology and other available opportunities.
4) Employment and livelihood generation
This indicator focused on the available credit, local market, land price, livelihood and change
in basic needs of the beneficiaries in the day to day life.
1 Land price change
2 Livelihood
3 New livelihood generated due to road
5) Education sector
Education sector helps us to understand the educational progress both qualitative and
quantitative. It can also help us to understand gender wise, age wise, caste and religion wise
change in educational pattern.
1 Change in education pattern gender wise
2 Dropout rate in schools
3 Rate of absentee of teachers
4 Change in education awareness
6) Health Sector

108
It gives an idea about the health of the population. It indicates the ease of getting a medical
facility such as doctors, vaccination etc.
1 Ease of getting medical facility
2 Increased frequency of doctor’s or ANM’s
3 Vaccination drive coverage
7) Social Network indicators/Social Interaction Indicator
This indicator helps to understand the women participation, social gathering, and beneficiary’s
interaction with nearby habitation and marketplaces.
8) Indicator for PMGSY workers/Stakeholders involved in PMGSY road construction
To understand the participation of the locals during the construction of the road, various
stakeholders included in the survey. The focus is on the facility provided safety, and education
available for them during their involvement in construction. Their awareness regarding rules
& regulation and gender-wise involvement during the project will throw light on their being
misled or discriminated.
9) Other indicators/Poverty Alleviation
These indicators indicate that construction of the road has brought prosperity to the lives or
not. Whether there is any change in there per capita income, food habit, job availability,
empowerment, security and much more will indicate whether the society is healthy or not.
5.6 Socioeconomic evaluation at State Level
5.6.1 Sample Size
The sampling criteria for the socioeconomic study was based on the three parameters named
type of connectivity, the age of the road and population of the habitation. The selected roads,
habitations benefited with the road, population of the habitation, number of households in the
habitation and sample size selected for the study of socioeconomic impact is given in Table
5.1
Table 5.1 Roads sampled for socioeconomic evaluation
Sr.
no Block Road Name Village/ Habitation
Populati
on
Househo
lds
Samp
le
1 Parner ODR 131 to Kutewadi Kutewadi 690 138 13
2 Parner Hunga - Mungashi Mungashi 812 162 14
3 Nagar Gundegaon to Dhawadewasti Dhavadewadi,
Chaudhariwadi 550 110 14
4 Nagar Pimpalgaon Kauda -
Hivarebazar Boyarepathar 995 199 20
5 Parbhani SH44-Ithlapur Deshmukh
Raipur Road Ithlapur Deshmukh 1412 282 26

109
6 Palam SH 219 to Wadi (kh) Wadi Kh 718 144 30
7 Palam MSH 2 to Puini Adgaon
Wanbhujwadi Road
Adgaon,
Wanbhujwadi 620 124 23
8 Palam MSH 3 to Ramapur Ramapur,
Ramapur Tanda 540 108 19
9 Kalamb MDR 14 to Mategaon Mategaon 653 131 27
10 Kalamb MSH 3 to Sonegaon Wandli
road Wandli 800 160 28
11 Kalamb MSH 3 to Aloda Road Donoda,Aloda 1052 210 14
12 Darwa Wagad (Bk) to Rajivnagar Rajivnagar 836 167 17
13 Bhandara Garada (Jangli) to Garada
(Bk)
Ravanwadi,
Kurshepar 1863 373 27
14 Bhandara SH 271 Bhandara to Warthi
SH 271 Pandarbodi 1015 203 28
15 Tumsar Tumsar to Pipra Road Pipara 993 199 14
16 Pauni MDR 35 to Chichal Chakra
Adyal Chichal 3000 600 19
17 Shahuwadi SH 125 to Nandgaon Sonurle
Patilwada Sonurle 1309 262 18
18 Shahuwadi MDR 9 to Parli Parali 1354 271 20
19 Bhudarghad SH 120 to Tiravade
Devulwadi Devarde
Deulwadi,
Kariwadi,
Simalwadi
896 179 30
20 Bhudarghad Patgaon to Bhatwadi
Bhatwadi Adye Tale,
Tambachiwadi,
Talewadi
669 134 13
21 Sangameshwar Pochari to Fungus Fungus,
Chalkewadi 674 135 6
22 Sangameshwar MDR 33 Dingani Agarwadi
Khadewadi to Guruvewadi
Agarwadi,
Kharandewadi,
Guruvewadi
195 39 14
23 Sangameshwar Dhamapur TF Sangmeshwar
to Bhayjewadi Rautwadi
Bhayajewadi,
Bhudwadi 578 116 GD*
24 Guhagar Pacheri Agar Ramnewadi Ramanewadi 539 108 GD*
25 Palghar NH 8 to Bahirifonda Jayshet 644 129 GD*
26 Palghar Valve to Chipatpada Road Chipatpada 418 84 GD*
27 Jawhar SH 28 to Sagpani Pachgud
Road Pachabud 262 52 GD*
28 Jawhar Jamsar - Kharvand Nyahale
BK to SH 30 Road Radhanagari 330 66 GD*
Total 24417 4885 440
*GD=Group Discussion

110
5.6.2 Impact on Transport sector
5.6.2.1 Usage of the road by other habitation as the primary route.
The road connected to the village is used by nearby habitations or the habitations beyond this
village when it is the shortest or fastest route to the nearby marketplace from that habitation.
The road surveyed in this evaluation study also give better connectivity to varying number of
habitations. The road in Bhandara ‘SH 271 Bhandara to Warthi SH 271’ which is near to
Bhandara town caters to traffic of approximately 8 habitations as per the residents. The graph
shown in Figure 5.2 Number of Habitations connected using the road the number of habitations
using the road.
• Among the selected roads, 35% roads targeted for single habitations are used by two
habitations.
• The percentage of roads that were used by three habitations is 30% and 19% roads are used
by four and more habitations
• Only 16% were dead-end roads and serving connectivity to only one habitation.
Thus, the roads used by PMGSY are used by other habitations as the main route due to faster
and shorter distance. Before the roads were built, most of the other habitations were using other
routes or the same route which took longer time.
Figure 5.2 Number of Habitations connected using the road
0123456789
Pan
dhar
bod
i
Chic
hal
Raw
anw
adi
Fu
ngu
s
Kh
urs
hep
ar
Dev
ulw
adi
Pip
ra
Bhat
wad
i
Bhay
ajew
adi
Bho
yar
epat
har
Do
nod
a
Ith
alpu
r…
Th
aku
rpad
a
Kar
ndew
adi
Rad
han
agar
i
Ram
apu
r T
and
a
So
nurl
e
Ram
apu
r
Ad
gao
n
Alo
da
Chip
atp
ada
Dh
avad
ewas
ti
Mat
egao
n
Mu
ng
ashi
Par
ali
Ram
anew
adi
Sim
alw
adi
Wad
i k
h
Wan
bh
ujw
adi
Wan
dli
Tal
ewad
i
Cho
udh
ariw
adi
Kar
iwad
i
Ku
tew
adi
Pac
hb
ud
Raj
ivnag
ar
Tam
bac
hiw
adi
No of Habitations Connected

111
Figure 5.3 Number of roads serving different number of habitations
5.6.2.2 Average number of days road closure for access before and after road
The habitations which have been connected for the first time i.e. ‘new connectivity road’ have
shown access closure many a times before the PMGSY connectivity mostly due to rains, during
monsoon. The details about each habitation are given in district wise analysis in this chapter
further. The Figure 5.4 shows that the number of habitations which reported the closing of
roads for a number of days per year before and after the construction of road under PMGSY.
Among the 37 habitations surveyed, only 9 habitations reported no closure of the road before
PMGSY road. The closure of the roads was mainly in the monsoon season, as the roads which
are made up of gravel and murum, due to heavy rainfall mud is left behind and the one and
only option is that of walking through mud. This has an impact on all the activities such as
education, health, and all market-related activities during such condition.
✓ Nine habitations i.e. 24% of the surveyed habitations had less than five days closure of the
road annually before the construction of PMGSY roads.
✓ There are 32% habitations i.e. total 12 habitations which reported closure of the road more
than 30 days annually before construction of the PMGSY road.
✓ Ten roads i.e. 27% of the roads were closed during monsoon for the period of 10-20 days
annually before the construction of PMGSY road.
✓ Three roads reported 5 to 10 days closure and remaining three roads reported 20-30 days
closure annually before construction of the road.
✓ After the construction of PMGSY road, there were no roads which were closed more than
5 days annually. However, few roads reported 3-5 days closure due to heavy rain as the
cross drainage work structure is of ‘submerged type’ and in such heavy rains, the water
floods over the bridge.
6, 16%
13, 35%11, 30%
7, 19%
Frequency of roads
One Two Three Four and More

112
Figure 5.4 Average number of days the road is closed before and after road
5.6.2.3 Availability of Public Transport facility
The connectivity to village improves transportation facility and when there is a good road, the
government extends its support by provisioning public transport facility to such villages.
Wherever there is good road and a well-populated village, the state transport bus starts to halt
in the village. Among all the surveyed habitations, very few habitations (five habitation)
already had access to public transport facility. Most of the habitations got benefited from public
transport facility after the construction of PMGSY road.
✓ Almost 32 i.e. 86% of the habitation reported that there was no public transport facility
before the construction of PMGSY road.
✓ Among the five habitations which already had access to public transport facility, the
frequency of buses has increased significantly to more than five in each case except
Bhoyarepathar in Ahmednagar district.
✓ There were only five habitations out of 37 which had an access to public transport facility
before the PMGSY road, among these five habitations, one habitation had three trips of
state transport bus and four habitations has two trips daily.
✓ After the construction of the PMGSY road, public transport facility is now available in 24
habitations out of 37 i.e. almost 65% habitations got connected through public transport
facility which previously was only 15% and now only 13 habitations still do not have any
public transport facility.
✓ As of now, four habitation shows public transport facility with more than four trips a day,
six habitations with thrice a day, ten habitations with twice a day, four habitations with
once in a day.
9
3
10
3
12
37
0 0 0 00
5
10
15
20
25
30
35
40
Less than 5 days 5 to 10 days 10 to 20 days 20 to30 days More than 30
days
Num
ber
of
Hab
itat
ions
Number of habitations vs. No of days road is closed
Before Road After Road

113
✓ The reason for the non-availability of public transport facility as per the responses of the
people is that of non-availability of sufficient passengers.
Figure 5.5 Availability of Public Transport facilities before and after PMGSY
5.6.2.4 Increase in number of private vehicles in the habitation
The road to any village triggers transportation by increasing both private and public
transportation facility. The above paragraph showed the increase in public transport facility.
The road has also increased the number of private vehicles especially those of two wheelers.
The Figure 5.6 shows the increase in a number of two wheelers as well as an increase in private
vehicles in the habitations before and after the construction of PMGSY road.
i. There were only six habitations out of 37 where there was a private transport facility
available before the PMGSY road while the remaining habitations were dependent on
the public transport and vehicles in the nearby villages.
ii. After construction of the PMGSY roads, there were only four habitations which still do
not have any private vehicle in the habitation as the habitations were very tribal and the
income of the people is very low. But due to availability of good road the inhabitants
are using vehicles of private operators from nearby habitations.
iii. There is a significant increase in the number of private operators in the habitations i.e.
around 22% habitations showed an addition of one private operator as compared to
before road, while 40% habitations showed an addition of two.
iv. Six habitations reported an addition of three private vehicle as compared to before road
situation and four habitations i.e. 11% habitations show an increase in private transport
vehicle by more than three.
32
0
4
1
0
13
4
10
6
4
0 5 10 15 20 25 30 35
Zero
Once in a day
Twice a day
Thrice a day
More than thrice a day
No. of Habitations
No. of Habitations with Frequency of Public transport facility
After Road Before Road

114
Figure 5.6 Number of habitations showing change in private vehicle due to road construction
5.6.2.5 Increased participation of females in travelling outside the village for various
purposes.
The road has brought a cheap and fast transportation means to the habitations. This has had a
positive impact on the female participation in travelling outside the habitation for various
purposes such as purchasing ornaments, clothes, marketing etc. When there were no roads,
only males from each family used to go to market for various purposes and usually the females
used to stay at homes.
i. Of the sample size of 440 households surveyed, only in 40 households (9%) it was
found that the women participated in activities that involved travel outside the village
before the construction of PMGSY road.
ii. After construction of PMGSY road, the same percentage has changed to 88% i.e. 387
households reported that both female and male participate in activities involving travel
outside the village.
iii. Prior to the roads, female participation was there in habitations which were closer to
marketplaces and had good road connectivity such as Chichal in Bhandara district, all
the habitations in Parbhani district and Bhoyarepathar in Ahmednagar district.
iv. However, in the tribal district, there was no female participation reported before
construction of PMGSY road which has increased after the construction of the road.
4, 11%
8, 22%
15, 40%
6, 16%
4, 11%
No. of Habitation showing addition of private operators
No change Increased by one
Increased by two Increased by three
Increased by more than three

115
Figure 5.7 Increased participation of females in going outside village
5.6.3 Impact on Health Sector
5.6.3.1 Change in Cooking Energy Pattern and Access to Clean Energy.
Most of the households were using firewood as the energy for cooking before roads as it was
locally available. Some households which were using LPG the delivery of the LPG cylinder
was not available to the habitation before the road, and hence it would be used sparingly. After
road, there is a considerable change in the fuel usage. The households previously using
firewood as cooking energy changed to LPG and some households are using both firewood
and LPG.
1. Before the construction of the PMGSY road cheap and easily available cooking fuel
firewood was used by 88% i.e. 389 households of the 440 surveyed. At the same time, there
were only 26 households which used only LPG gas as cooking fuel in before road scenario
and 25 households were using both LPG and firewood as cooking energy.
2. After construction of road and subsidised supply of LPG cylinders, the change in cooking
energy pattern was observed and the only firewood using households has reduced from 389
to 227 i.e. change of 37%.
3. The above scenario was for six districts namely Ahmednagar, Parbhani, Yavatmal,
Bhandara, Kolhapur and Ratnagiri. In the Palghar district, where the study was conducted
in the form of FGD, none of respondent reported use of LPG in any of the four habitations
before the road. However, in each habitation almost 10% of households were using LPG
after road.
400
53
40
387
0 50 100 150 200 250 300 350 400 450 500
Before Road
After Road
No. of Respondent
Participation of Females in going outside village
Only Male Both Male & Female

116
Figure 5.8 Change in cooking energy pattern
5.6.3.2 Immunization facility and status of immunization
Immunization to children is given in an Anganwadi or school and wherever there is no
accessibility to school or habitation the immunization was not given or the immunization camp
is set up in a nearby habitation. When asked about immunization given to children respondents
reported in the form of yes or no and the results are shown in the Figure 5.9. It is seen that the
roads have not brought significant changes in the extent of immunization as there was
immunization before road also though there is positive trend.
1. When asked whether immunization facility was available and accessible by inhabitants
before the road 81% respondent reported yes to the question.
2. After the construction of the roads, 86% of the respondent has reported access to
immunization facility to the child.
3. The percentage of respondent showing no immunization facility before the road was 19%.
Only 15% respondent reported that there is still no access to immunization as they have to
approach to a nearby school which is not connected by PMGSY road or any other road.
4. Apart from the immunization given in school through camp, not all the habitations have an
access to a government hospital for immunizing new born child and ASHA workers usually
assure a 100% immunization. As per the ASHA workers, the road is very beneficial not
only to all the inhabitants but even in case of visiting doctors and nurses from Public Health
Centres.
389
26 25
227
103 110
0
50
100
150
200
250
300
350
400
450
Firewood LPG Both
No
. o
f R
esp
ond
ents
Change in Cooking Energy Pattern
Before Road After Road

117
Figure 5.9 Availability of immunization facility
5.6.3.3 Incidents occurrences due to no road or bad condition of the road
Incidents such as the death of a new-born baby, the death of pregnant woman were not recorded
in any of the sample habitations. These situations occurred in yesteryears when there was no
quick access to hospital and people were reluctant to go to the hospital. In case of the
emergency situation because of unavailability of good and quick transport facility, there might
have been chances of special incidences. However, after the construction of the road, the
respondents felt that such situations have become less and risk has been lowered down.
1. Four habitations reported the death of an infant before the construction of the road though
the frequency was not that much and the cases were only one in each of the habitations.
2. Due to lack of quick transport and access to hospital three habitations reported the death of
pregnant women before the road and due to the bad condition of the road.
3. After the road no habitation has reported any such cases of such incidents and from every
respondent, the positive impact of the road has been reported stating that the biggest benefit
of the road to health.
358
82
378
62
0
50
100
150
200
250
300
350
400
Yes No
No
. o
f R
esp
ond
ets
Immunization to Child
Before Road After Road

118
Figure 5.10 Special incidents happened due to bad condition of road
5.6.3.4 Status of Accessibility to Ambulance Facility.
The information of accessibility to an ambulance for all the habitation before and after the road
is given in the Figure 5.11. Because of the unavailability of the road there was no private or
governmental ambulance reaching the habitations but after the construction of the roads and
governmental initiatives, ambulance now reach habitations in case of emergency.
1. Before the construction of the road, only seven (18%) habitations were having access to an
ambulance while the remaining 82% were inaccessible by an ambulance which was a major
disadvantage for the residents of the habitations in case of emergency.
2. The result of ambulance not reaching the habitation is that in case of an emergency, the
patient cannot reach the hospital on time and residents had to pay much more money to
private vehicle or in some of the habitations where there was no private operator
operational, people had to carry patient on stretcher.
3. After the construction of the road, not only ambulance but also private operators come to
help in case of emergency with a reasonable fare.
4. The number habitations which are accessible by ambulance and ambulance is coming to
the habitation in an emergency is 34 i.e. 92% of the habitations.
5. Still, there are 3 habitations where ambulance does not come in the emergency case also
but the reason is not that of the road but the habitations were far away and small.
4 3
33 34
0
5
10
15
20
25
30
35
40
New-Born Baby Dead Pregnant Woman Dead
Special Incidents happened due to inaccessibility to
Hospital
Yes No
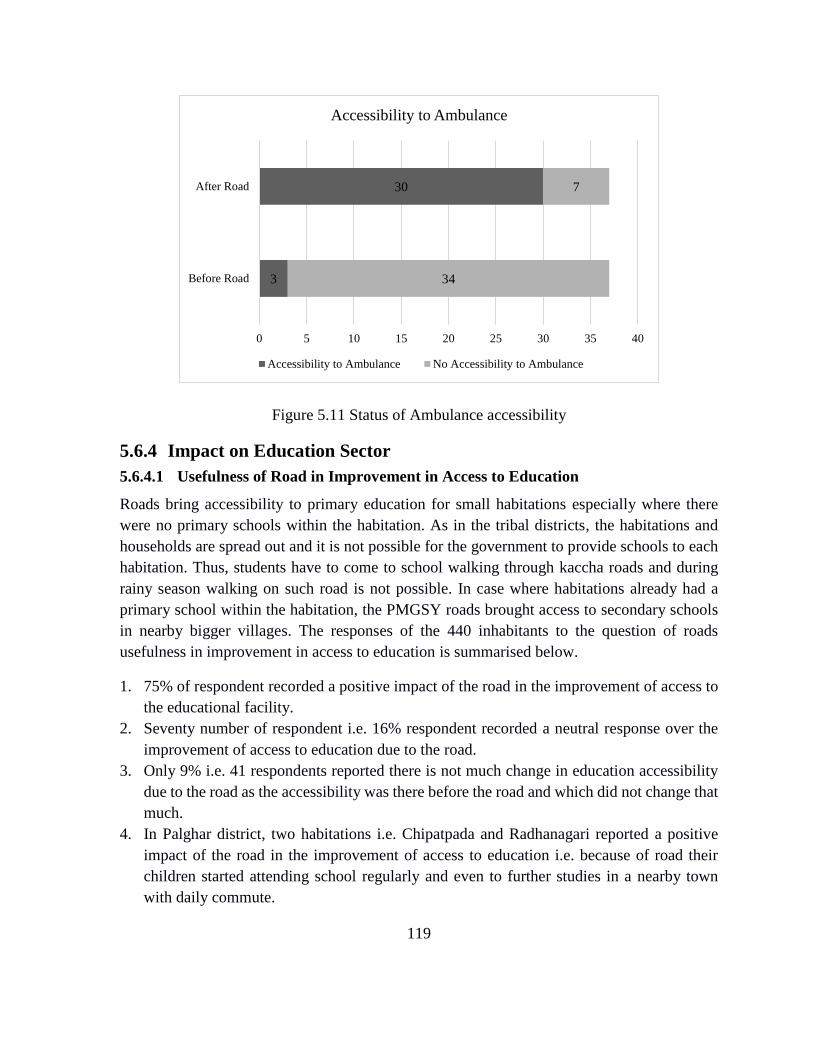
119
Figure 5.11 Status of Ambulance accessibility
5.6.4 Impact on Education Sector
5.6.4.1 Usefulness of Road in Improvement in Access to Education
Roads bring accessibility to primary education for small habitations especially where there
were no primary schools within the habitation. As in the tribal districts, the habitations and
households are spread out and it is not possible for the government to provide schools to each
habitation. Thus, students have to come to school walking through kaccha roads and during
rainy season walking on such road is not possible. In case where habitations already had a
primary school within the habitation, the PMGSY roads brought access to secondary schools
in nearby bigger villages. The responses of the 440 inhabitants to the question of roads
usefulness in improvement in access to education is summarised below.
1. 75% of respondent recorded a positive impact of the road in the improvement of access to
the educational facility.
2. Seventy number of respondent i.e. 16% respondent recorded a neutral response over the
improvement of access to education due to the road.
3. Only 9% i.e. 41 respondents reported there is not much change in education accessibility
due to the road as the accessibility was there before the road and which did not change that
much.
4. In Palghar district, two habitations i.e. Chipatpada and Radhanagari reported a positive
impact of the road in the improvement of access to education i.e. because of road their
children started attending school regularly and even to further studies in a nearby town
with daily commute.
3
30
34
7
0 5 10 15 20 25 30 35 40
Before Road
After Road
Accessibility to Ambulance
Accessibility to Ambulance No Accessibility to Ambulance

120
5. Pachbud village reported that there is not that much change in educational access as a
school already existed in the village and no one from the village has gone to higher studies
yet, due to non-availability of institutes near to this habitation.
Figure 5.12 Improved access to education due to construction of road
5.6.4.2 Decrease in dropout rate of students
Bad connectivity or no connectivity is one of the reasons for school dropout of students, as
they don’t have means of transportation to reach the school and also it is difficult in the rainy
season where the condition of road gets worse as compared to normal days. The rate of students
going to school increased considerably after road in all the habitations. Before the road, the
education of the most of the children was till seventh standard and to study further, students
had to move to nearby town or residential school. But after roads, students started going and
coming back from nearby town and this has decreased the dropout rate of the students.
1. Before the construction of the road the dropout rate was very high and 251 respondent i.e.
57% of the respondent reported that the children were not used to go to school daily or for
further education.
2. Only 189 respondents i.e. 43% have reported that the dropout rates as well as absentee rate
before the construction of the road were negligible.
3. In the after construction of road scenario, 90% of the respondents have reported that there
is a decrease in the dropout rate of the student and decrease in the absentee rate of the
student.
4. Forty-five respondents i.e. only 10% have reported still there is dropout rate and absentee
rate of students i.e. even after construction of the road and having good connectivity to an
educational facility.
329, 75%
41, 9%
70, 16%
Improved Access to Educational Facility
Yes No Neutral

121
5. There is significant change in dropout rate for girls as previously, i.e. before the roads
almost all the girls used to drop the school after primary school, but after roads, public
transport has become convenient and hence, there is an increased number of girls going for
further studies.
6. The dropout rate and absentee rate in tribal block i.e. Palghar district has reduced largely
and children are attending school regularly and pursuing further studies.
Figure 5.13 Decrease in dropout rate and absentee rate of students
5.6.4.3 Decrease in absentee rate of teachers
In every primary school, the teachers are mostly non-residents of the habitation and come from
nearby towns. Because of bad connectivity, there was irregular transport facility and teachers
have to be dependent on private operators or their own vehicle. Moreover, in the tribal area
despite having their own vehicle, teachers can’t reach school due to lack of connectivity. After
the construction of the road, almost every teacher owns a vehicle and reaches school in time.
1. In the scenario of before the road construction wherever there was no road at all the teachers
used to reach school too late in the rainy season or absentee rate was there before road but
after the road, the absentee rate has come down significantly.
2. 51% of the respondents have reported that teachers were not coming to school regularly
before the construction of the roads.
3. 49% respondents reported that teachers used to school daily and there was no absentee rate
before the road. These respondents were mostly from the habitations which were easily
accessible i.e. in case of upgradation of the road.
4. 93% of respondent reported that there is no absentee of a teacher after the road.
189
395
251
45
0
50
100
150
200
250
300
350
400
450
500
Before Road After Road
No
. o
f R
esp
ond
ent
Decrease in Drop out rate and Absentee Rate for Children
Yes No

122
5. Only 7% respondent i.e. 30 respondents have reported that the teacher absentee rate still
exists.
Figure 5.14 Absentee rate of teachers
5.6.5 Impact on Agricultural Sector
5.6.5.1 Change in Farming Pattern
Productivity in agriculture depends on the types of seeds used and the fertilizer dose applied.
To get the hybrid seeds and fertilizers, farmers have to go to the marketplace which is away
from their habitations and they need to depend on some means of transportation. Most of the
farmers were using bullock carts, organic fertilizers and a local variety of seeds for farming
purpose before the construction of the road. But after the roads because of good accessibility
to the marketplace, most of the farmers are using farm machinery instead of conventional
methods, chemical fertilizers in place of organic fertilizers and hybrid seeds were sown in place
of locally available seeds. The Figure 5.15Error! Reference source not found. shows a
change in farming pattern in the sample villages. The chart is based on the data collected from
the farmers only and the numbers of farmers amongst the 440 respondents were 298.
1. Before the construction of the road, 98% of the respondents were using traditional methods
for farming and only 2% were using farm machinery.
2. After the roads, the scenario got changed and now only 15% of the respondents were using
traditional methods and remaining 85% have shifted to farm machinery.
3. Fertilizers used before the construction of road were organic i.e. the fertilizers obtained
from animals and farm waste and 75% households were using the organic and remaining
25% were using chemical fertilizers.
224
410
216
30
0
50
100
150
200
250
300
350
400
450
Before Road After Road
No
.of
Res
po
nd
ent
Axis Title
Decrease in absentee rate for teachers
Yes No

123
4. The percentage of fertilizers uses has been shifted from organic to chemical after the
construction of the road and 85% households are now using chemical fertilizers as of now.
5. In case of use of seeds before the construction of the road, 84% household used to grow
their own seed in the farm and using them in cycles and only 16% of the households were
using hybrid seeds.
6. Use of hybrid seeds have increased after the construction of roads to the 92% of farmers
and only 8% farmers were still using local seeds.
7. In case of Palghar district, the farm holdings is very less and two habitations reported uses
of chemical fertilizers up to 20-30% before the construction of the road and two habitations
were using local seeds and organic fertilizers as both of these habitations are away from
town and highway.
Figure 5.15 Change in farm machinery usage, fertilizer usage, type of seed usage
5.6.5.2 Change in farm produce selling pattern i.e. direct to Mandi or middleman i.e.
accessibility to market facility
Before road, in all the habitations, most of the farmers sold their farm produce to the
middleman due to difficulty in taking the produce to the market on their own, because of bad
road conditions and improper transport facility. Because of this, they were getting lesser price
for their products and also had less information about the market price variations. After getting
good accessibility, they are now taking their farm produce to the markets on their own and
getting a better price for their farm produces. The responses collected during the study
regarding farm produce selling pattern is summarised below.
1. Among the 440 habitations surveyed, 142 i.e. 32% households reported no response due to
very small landholding or no land holding at all.
0
50
100
150
200
250
300
350
400
Traditional
Farming
Machinary
Use
Organic
Fertilizers
Chemical
Fertilizers
Local Seed Hybrid Seed
No
. o
f R
esp
on
den
t
Change in Farming Pattern
Before Road After Road

124
2. Among remaining 298 respondents, only 13% i.e. 61 respondents were selling their
products direct to market before the construction of the road.
3. After the construction of the road, 272 households i.e. 62% households reported they sold
farm produce directly to market.
4. Only 26 households i.e. 5% are still selling their farm produce to middlemen despite having
the road as they are getting a reasonable price at the habitation itself, saving transportation
cost and also because the farm produce is very small quantity.
Figure 5.16 Change in farm produce selling pattern due to access to market in Ahmednagar
district
5.6.5.3 Increased visits of Agricultural Officers to Habitation
The main occupation in the villages surveyed is agriculture. The agriculture officers appointed
to reach out to farmers and help in training or advising regarding crops, pesticides, harvesting
etc. are reluctant to go to the village and the inhabitants are deprived of agriculture extension
services. However, after the road, the agriculture officers started to visit village and guide and
advise the farmers. The data on habitations having access to agriculture extension services is
summarised below.
1. There were only 5 habitations having agricultural officers visit habitation for different
purposes before the PMGSY road i.e. only 16% of the habitations had access to agriculture
officers.
2. After the construction of the road, the number has been changed to 32 i.e. 86%. Due to the
construction of the road, the habitations were accessible to agricultural officers by private
vehicle or some other means and the trips of such officers started growing up.
237
26
61
272
0
50
100
150
200
250
300
350
Before Road After Road
No
. o
f R
esp
ond
ent
Change in agriculture product selling pattern
To Middleman Direct to Mandi

125
3. Only five habitations are there after the construction of the road which is still not visited
by agricultural officers despite having a road. The habitations are far away in the forest
area and very small.
Figure 5.17 Access to agriculture extension service
5.6.6 Impact on Finance Sector
5.6.6.1 Improvement in Banking Facility
A bank account helps in saving part earning and encourages people to save their earning and
utilize it properly. Most of the people didn’t have access to banking facility before the
construction of the road resulting in keeping money at home which was a risk for theft and
utilization for wrong purposes such as drinking liquor. But due to the Government’s approach
to reach poor through Jan Dhan Yojana, to people can now avail bank services. Before road
construction, no bank personnel would come to village and no people from habitation go to the
bank which has changed due to road. Having a bank account is useful in many cases such as
taking a loan, getting benefits of government subsidy, saving money, etc. The number of bank
accounts in the family is due to accessibility and increased participation of other members of
family i.e. excluding only the head of the family, in the outgoing activities. In the sampled
villages, the following statistics emerged.
1. Before the construction of roads, only 29% people had bank account in any of the banks
but after the construction of roads almost 90% of the people have a bank account.
2. There are few households (10%) who don’t have a bank account and these are mostly tribal
or habitations which are very far away from the main town.
6
32
31
5
0
5
10
15
20
25
30
35
40
Before Road After Road
Increased visit by agricultural officers to the habitation
Yes No

126
3. The number of bank account holding varies from one to more than four in a family. 33%
of respondent families have only one bank account in their family.
4. 28% households have 2 bank accounts in their family while 18% have three bank accounts
in the family and 11% of households have more than three bank accounts in their family.
5. In case of Palghar district, where habitations was very tribal it was found that households
have bank accounts in the habitation after the construction of the road which before the
road was less than 10%.
Figure 5.18 Access to banking facility before and after road
5.6.6.2 Status of Arranging Finance
Most of the inhabitants before road had no sources for arranging finances and many amongst
them depended on money lenders in the habitation, few would borrow money from banks and
rest would get money by some other means including from their relatives. After roads, a good
access to nearby habitations and towns became possible and now most of the inhabitants
depend on banks for arranging finance. The Figure 5.19 below shows the various means of
arranging finance by the households.
1. Before the road construction 302 households i.e. around 68% had no source for arranging
finances but after construction of road, the banking facility becoming available and the
same has been reduced to 80 households i.e. 18% only
2. The situation of the bank as the status of arranging finances before the road was only in 32
households i.e. only 7% but after the construction of the road banks are accessible and
people having bank accounts increased which facilitated in arranging for finances. Thus
after the construction of the road, the number of households having a bank as a source of
finances arrangement has increased to 62% i.e. to 273 households.
127
397
313
43
0
100
200
300
400
500
Before Road After Road
No
. o
f R
esp
ond
ent
Availability of Banking Facility
Without Having Bank Account
Having Bank Account
43, 10%
147,
33%125, 28%
77,
18%
48, 11%
Number of Households Vs. No. of
Bank Accounts
0 1 2 3 >3

127
3. In case of Palghar district still, people are not that much aware of loaning process and have
not approached banks for arranging finances for different reasons. There is some change
which has occurred due to the availability of bank account as they are now saving money
in the bank and using them in need situations.
Figure 5.19 Status of arranging finances
5.6.7 Impact on Migration
5.6.7.1 Change in Type of Migration
Migration of the inhabitants is seen often at times when there is no work in the agriculture
field. In most of the tribal areas, the migration was seasonal but the road has made changes in
seasonal migration as people can come back to home either weekly or twice a month. The
labours used to go to nearby towns have changed their pattern from weekly to daily by doing
to and fro due to a reduction in the time of travel. The following chart shows a change in
migration as well as a change in the type of migration.
1. There were 128 households i.e. 29% who did not migrate before road but after road, the
accessibility has increased and the migration in the form of permanent or temporary has
been increased and only 140 households reported no migration after the construction of the
road.
2. There were only 12 household i.e. 3% who before roads showed a permanent migration of
some of the family members while the same count has increased to 29% after the
construction of the road. The permanent migration is because of getting a good job in the
nearby city or town which in turn is because of either education or skills which were
accessible due to the road.
32
52
55
301
273
45
42
80
0 50 100 150 200 250 300 350
Bank
Money Lender within Habitation
Other than moneylender or banking
No source
Status of Arranging Finance
After Road Before Road
128
3. There were 128 households showing temporary i.e. either for 2-4 months or weekly
migration to nearby towns before the construction of the road but after the construction of
road this number has increased to 271 i.e. 62%.
4. For the temporary migrants, many households reported the benefit of the roads as they can
come to the home for Sunday or holidays from nearby places where they have migrated
which previously was not easily possible.
5. In case of Palghar district, where FGD was carried out, the pattern of migration has not
changed as these surveyed areas are in tribal blocks with very less land holdings and no
major town or city nearby for availing daily wage labour. However, one of the habitation,
Chipatpada, has shown a change in migration pattern to daily instead of weekly due to
roads.
Figure 5.20 Increase or Decrease in Migration
5.6.8 Impact on Living
5.6.8.1 Changes in Type of House
The change in the type of houses occurs due to the availability of new material such as bricks
and sand both due to accessibility via new roads and also resultant increase in income of the
family. The trends in the nearby cities also affect the house type and design which ultimately
lifts the standards of living. The changes in the type of houses i.e. Kachha, Pucca and Half
Pucca are listed in the below chart.
1. Before the construction of the road, there were 261 households i.e. 59% of sample size
reported Kachha house which has been reduced to 144 households i.e. 33% after the
construction of the road.
128
27112
29300
140
0
50
100
150
200
250
300
350
400
450
500
Before Road After Road
No
. o
f R
esp
ond
ents
Change in Migration due to Road
Temporary Migration Permanent Migration No Migration

129
2. A similar situation was there in case of Pucca houses, only 51 households i.e. 12% only
were Pucca before the road and after road, the number has changed to 142 i.e. 32%.
3. In case of Half Pucca households, before the road, there were 128 households i.e. 29%
households Half Pucca which have changed to 154 after road i.e. 35%.
4. It can be noticed that households prefer to shift from kachha house to pucca house directly.
5. But in case of Palghar district instead of a household survey, FGD was conducted and the
70-80 % households reported Half Pucca after road which before the road was zero percent
in all the four habitations
Figure 5.21 Change in type of house before and after road
5.7 Socioeconomic Evaluation at District Level
5.7.1 Profile of Ahmednagar District
Ahmednagar district comes in the Khandesh region of Maharashtra having its division
headquarters at Nashik and is located at 19.08°N 74.73°E. It has an average elevation of 649
metres. It is spread over an area of 17,413 Km2 and is the largest district of Maharashtra having
14 talukas. These talukas are Akole, Jamkhed, Karjat, Kopargaon, Nagar, Nevasa, Parner,
Pathardi, Rahata, Rahuri, Sangamner, Shevgaon, Shrigonda and Shrirampur. Situated in the
rain-shadow region of the Western Ghats, Ahmednagar experiences primarily hot and dry
climate through November to mid-June with average minimum and maximum temperature of
17.6o and 31.8o and it receives an average rainfall of 601mm in a year. Ahmednagar district is
having a population of 45, 43,159 people which contains 4.04% of the total Maharashtra’s
population. The growth rate is 12.43%. Among the total population, 19.67% of people live in
urban areas and the district has a population density of 266 people per square km area. The
261
51
128144 142
154
0
50
100
150
200
250
300
Kacha Pucca Half pucca
No
. o
f R
esp
ond
ents
Change in Type of House in due to road
Before Road After Road

130
literacy rate of the district is 80.22%.The majority of the population in Ahmednagar is Hindu,
but there were other religious groups such as Christians, Muslims, Sikhs, Buddhists, Jains and
Zoroastrians in smaller numbers. According to the census, Hindus were 84%, Muslims 7%,
Christians 4% and others were 4%.The sex ratio in Ahmednagar district is 941 female per 1000
male population. There are total 4633 habitations in the district. Among the total number of
habitations 118 habitations have more than 1000 population, 56 habitations have their
population in the range 500-999, 87 habitations have the population range of 250-499 and 4372
habitations have less than 250 population. Out of total habitations, 2752 habitations are
connected and 1846 habitations are unconnected. The connectivity of 35 habitations covered
under state scheme.
Table 5.2 Number of villages in Ahmednagar district population wise
Sr. No. Ahmednagar No of Rural Households No of Villages
1 Greater than 1000 population 681690 1181
2 Population between 750-999 31893 176
3 Population between 500-749 19010 145
4 Population between 250-499 6110 69
5 Population below 250 380 10
Total 739083 1581
5.7.2 Sample Size for Ahmednagar District
As per our sampling criteria, there was very few upgradation type of roads in Ahmednagar.
Four roads were selected in such a way that the villages with varying populations can be
covered. Among these four roads, three roads were of new connectivity and one is upgradation.
The population size and sample size for each village is mentioned in Table 5.3. Total 61
households were surveyed i.e. 10% of total households were covered.
Table 5.3 Sample roads in Ahmednagar District surveyed for socioeconomic evaluation
Sr.
no
.
Block Road Name Village/
Habitation
Populati
on
Households Sample
1 Parner ODR 131 to
Kutewadi
Kutewadi 690 138 13
2 Parner Hunga - Mungashi Mungashi 812 162 14
3 Nagar Gundegaon to
Dhawadewasti
Dhavadewadi,
Chaudhariwadi
550 110 14
4 Nagar Pimpalgaon Kauda
- Hivarebazar
Boyarepathar 995 199 20
Total 3047 609 61

131
Figure 5.22 Sample Roads and Habitations Map
Table 5.4 List of Infrastructure availability before road and after road within habitation
Ahmednagar
District
Kutewadi Mungashi Choudhari
wadi
Dhavadewad
i Bhoyarepathar
BR* AR BR* AR BR* AR BR* AR BR* AR
Primary School Yes Yes Yes Yes Yes Yes Yes Yes Yes Yes
Middle School No No No No No No No No Yes Yes
High School No No No No No No No No No No
Degree College No No No No No No No No No No
Health Services No No No No No No No No No No
PHCS No No No No No No No No No No
Veterinary
Hospital No No No No No No No No No No
Telegraph Office No No No No No No No No Yes Yes
Bus Service No No No No No Yes No No Yes Yes

132
Electricity Yes Yes Yes Yes Yes Yes Yes Yes Yes Yes
Panchayat Head
Quarter No No Yes Yes No No No No Yes Yes
* All information is from OMMAS website accessed on 31st March.
5.7.3 Impact on Transport Sector in Ahmednagar District
5.7.3.1 Usage of the road by other habitation as the primary route.
The road connected to the village is used by nearby habitations or the habitations beyond this
village. Each road connected in Ahmednagar district is used by more than one habitations
except the road to Kutewadi as it is used by only one habitation i.e. Kutewadi itself. The road
connecting to Mungashi used by two habitations, road to Dhawadewasti is used by two other
habitations and road to Bhoyarepathar is used by three habitations. The road connected to
Hivarebazar is upgradation and this village is already connected by two other PMGSY roads.
Thus, the political influence of Hivarebazar has an impact on policy of PMGSY which allowed
connecting more than two roads to the same village. The road to Kutewadi faced lots of
problems during land acquisition as there is no policy for provision of compensation to land
donors. Few farmers who have their land on both side of the road opposed the road
construction.
Figure 5.23 Number of Habitations using the road
5.7.3.2 Average number of days road closure for the access before and after road
The road connectivity to three of the sample villages is completely new connectivity. There
was no all-weather connectivity to these villages before the PMGSY road construction resulted
in complete closure of the road for vehicles leaving the option of passing the road by walking
through mud. This has an impact on all the activities such as education, health, and all market-
related activities during such condition. The scenario of the road before connecting through
PMGSY is better explained in Figure 5.24. The scenario before the road was asked to
respondent about the connectivity situation. The respondent in the habitations Mungashi and
1
2 2
3
0
1
2
3
4
No
. o
f H
abit
atio
ns
No of Habitations Connected
No of Habitations
Connected
133
Dhavadewasti told that the road was almost closed during monsoon due to a gravel road. The
road to Mungashi has a small river crossing which causes to the road to close whenever there
was heavy rain. Almost about 10 days a year road was closed for travelling till the flood gets
attenuated. But the road to Bhoyarepathar is upgradation and the previously there was a road
so no closure of road has been recorded by the respondent. Kutewadi is benefitted with new
connectivity and the people in Kutewadi faced the problem of road closure during monsoon
due to mud formation whenever there is continuous rain.
The situation after road shows that there is no village from which respondent reported closure
of the road due to monsoon or any other reason. However, the road to Mungashi has a small
river on which there is the small bridge which is submerged one and whenever there is heavy
rain the bridge got flooded for few hours only causing the road to close.
Figure 5.24 Average number of days the road is closed before and after road
5.7.3.3 Availability of Public Transport facility
The connectivity to village causes transportation facility to increase and when there is a good
road, the government extends his support by the provision of public transport facility to such
villages. In Ahmednagar district, the habitation visited by our team shows there was no public
transport facility to all villages except Bhoyarepathar, which has connectivity previously. But
now the Public transport facility is provided to all the three habitations connected through the
road Gundegaon to Dhavadewasti. But Kutewadi and Mungashi don't have any public transport
facility till date. Kutewadi is connected to the major road by only 2.5km and from there public
transport facility is available. The detail about the frequency of bus coming to the village is
shown in Figure 5.25 below.
20
10
45 45
00
10
20
30
40
50
No
. o
f D
ays
Average Number of Days Road is Closed
Before Road After Road

134
Figure 5.25 Availability of Public Transport facilities
5.7.3.4 Increase in number of vehicles in the habitation
The road to any village triggers transportation by increasing private or public transportation
facility. The parameters increase in public transportation facility above showed that the
increase in the frequency of public to outside places. The other parameter increase in a vehicle
in the village shows that increased frequencies and development. Most of the village showed
that increase in two-wheelers as these are less expensive and private property consuming less
fuel. Apart from two-wheelers, the others vehicle’s increase was very less in such small
habitations. In Ahmednagar district, Bhoyarepathar shows the highest number of two-wheelers
increment followed by Mungashi. The other habitations recorded few vehicles which was zero
before road as shown in Figure 5.26
0
1
2 2 2
0
0.5
1
1.5
2
2.5
No
. o
f ti
mes
co
min
g t
o v
illa
ge
Availability of Public Transport facility
Before Road
After Road

135
Figure 5.26 Increase in two-wheelers in the habitations
5.7.3.5 Increased participation of females in going outside village for different purposes.
Almost in all the four villages males were participating in the activities like going to market,
buying seeds and fertilizers, buying clothes and ornaments etc. before the road. But after road
along with the male, the females also participating in all the activities because of good
accessibility to the places away from the village and there is a considerable increase in the
female participation which is shown in Figure 5.27 below.
020406080
100120140160180
No
. o
f T
wo
Whee
eler
s
Increase in No. of Two Wheelers
Before Road
After Road
13
1
14
2
12
0
16
00
12
0
12
2
14
4
20
0
5
10
15
20
25
BR AR BR AR BR AR BR AR
Kutewadi Mungashi Dhavadewasti Bhoyarepathar
No
. o
f F
emal
e P
arti
cip
atio
n
Participation of Females in going outside village
Only Male
Both Male &
Female

136
Figure 5.27 Increased participation of females in going outside village
5.7.4 Impact on Health Sector in Ahmednagar District
5.7.4.1 Change in cooking energy pattern and access to clean energy.
Most of the households were using firewood as the energy for cooking before road as it was
locally available. However, some households were using LPG but the delivery of the LPG
cylinder was not available to the habitation before the road. After road, there is a considerable
change in the fuel usage. The households previously using firewood as cooking energy
changed to LPG and some households were using both firewood and LPG and the LPG
cylinders were supplied to all the habitations except Mungashi after road. Change in cooking
energy pattern is shown in Figure 5.28 below.
Figure 5.28 Change in cooking energy pattern
5.7.4.2 Increase in frequency of Health workers and Doctors in the habitation.
There was no availability of doctors and nurse in Mungashi village before and after road.
ASHA worker is staying in the habitation after road whose availability was not there before
the construction of the road. In Kutewadi village doctor and nurse are visiting the habitation
once in a month and ASHA worker is staying in the habitation after road. The same situation
is there in Dhavadewasti where ASHA worker is not staying in the habitation instead they visit
the habitation twice in a month. In Bhoyarepatar there is the availability of doctor after road
and ASHA worker is staying in the habitation before and after road.
Table 5.5 Frequency of visits by Doctor, Nurse and ASHA Worker to habitation
53
8
0
32
22
7
0
10
20
30
40
50
60
Firewood LPG Both
No
. o
f R
esp
ond
ents
Change in Cooking Energy Pattern
Before Road
After Road

137
Trip of Doctor, Nurse and ASHA Worker per month
Habitation Visitors Before road After road
Kutewadi
Doctor No 1
Nurse No 1
ASHA worker No Within Habitation
Mungashi
Doctor No No
Nurse No No
ASHA worker No Within Habitation
Dhavadewasti
Doctor No 1
Nurse No 1
ASHA worker No 2
Bhoyarepatar
Doctor No 1
Nurse No No
ASHA worker Within Habitation Within Habitation
5.7.4.3 Immunization facility and status of immunization
Immunization facility is provided to children in all the four sample habitations before and
after road. The Figure 5.29 shows an increase in the immunization provided in Mungashi
village. In Kutewadi, Dhavadewasti and Bhoyarepatar villages an equal number of
responses were recorded from all respondent for the immunization facility provided before
and after road.
Figure 5.29 Availability of immunization facility
12
1
13
1
14
0
20
0
12
1
14
0
14
0
20
00
5
10
15
20
25
Yes No Yes No Yes No Yes No
Kutewadi Mungashi Dhavadewasti Bhoyarepatar
No
. o
f re
spo
nd
ents
Immunization given to child
Before
Road
After
road

138
5.7.4.4 Special incidents happened due to no road or bad condition of the road.
Special incidents such as the death of a new-born baby, the death of pregnant woman are not
recorded in any of the sample habitations. Before road construction, there was no facility of
transportation to the nearby hospital in the three villages connected through new connectivity.
The people from village used to have made some stretcher using local cot carried by 4-6 people.
Despite such worse situation, no such bad incident has been recorded in any of habitations.
Table 5.6 Special incidents happened due to bad condition of road
Sr.No. Special incidents
happened
New-born baby
dead
Pregnant woman
dead
1 Kutewadi No No
2 Mungashi No No
3 Bhoyarepathar No No
4 Dhavadewasti No No
5.7.4.5 Status of Ambulance accessibility to habitation.
The information of accessibility to an ambulance for all the habitation before and after the road
is given in Table 5.7 below. None of the sample habitation was having ambulance facility
before road at the time of emergency. But after road ambulance is coming to the habitations of
Kutewadi, Dhawadewasti and Bhoyarepatar. But ambulance facility is still not there in
Mungashi even after the construction of the road.
Table 5.7 Status of Ambulance coming to Habitation
Sr. No.
Name of
Habitation Before Road After Road
1 Kutewadi No Yes
2 Mungashi No No
3 Dhavadewasti No Yes
4 Bhoyarepathar Yes Yes
5.7.5 Impact on Education Sector in Ahmednagar District
5.7.5.1 Usefulness of roads in improvement in access to education
After the road construction access to education has been improved well above 75% in all the
habitations. All the respondents in Kutewadi and Bhoyarepatar villages told that the road has
helped children to reach the school easily showing 100% improvement in the figure 1.11 shown

139
below. Also, Mungashi and Dhavadewasti villages show a good change in accessing the road
for education purpose after road construction.
Figure 5.30 Improved access to education due to construction of road
5.7.5.2 Decrease in dropout rate of students
Bad connectivity or no connectivity is one of the reasons for Dropout of students from the
school, as they can’t get means of transportation to reach the school and also it was difficult in
the rainy season where the condition of road gets worse than compared to normal days. The
rate of students going to school increased considerably after road in all the four sample villages
Kutewadi, Mungashi, Dhavadewasti and Bhoyarepatar as shown in the Figure 5.31 below.
Figure 5.31 Decrease in dropout rate and absentee rate of students
0
2
4
6
8
10
12
14
16
Kutewadi Mungashi Dhavadewasti Bhoyarepatar
No
. o
f R
esp
ond
ents
Improved Access to Educational Facility
Yes
No
Neutral
0
5
10
15
20
BR AR BR AR BR AR BR AR
Kutewadi Mungashi Dhavadewasti Bhoyarepatar
No. of
Res
ponden
ts
Decrease in Drop out rate and Absentee Rate for Children
Yes
No

140
5.7.5.3 Decrease in absentee rate of Teachers
Because of bad connectivity, there were more chances of not getting proper transport facility
for teachers to reach school in most of the days. After road construction, there is much
reduction in the absentee rate of teachers and they are coming to school more regularly. The
Figure 5.32 below shows the decrease in the absentee rate of teachers after road compared to
the before road condition.
Figure 5.32 Absentee rate of Teachers
5.7.6 Impact on Agriculture in Ahmednagar District
5.7.6.1 Change in Farming Pattern
Productivity in agriculture depends on the type of seed used and fertilizer applied. To get
those good seeds and fertilizers farmers had to go to the marketplace which is away from
0
5
10
15
20
25
BR AR BR AR BR AR BR AR
Kutewadi Mungashi Dhavadewasti Bhoyarepatar
No
. o
f R
esp
ond
ents
Decrease in Absentee Rate for Teachers
Yes
No

141
their habitations and they need to depend on some means of transportation. As seen from the
Figure 5.33 there is a change in the use of farm machinery, fertilizer and type of seed in all
the four sample villages for before road and after road condition. Most of the farmers were
using bullock carts, organic fertilizers and a local variety of seeds for farming purpose before
the construction of the road. But after road because of good accessibility to the marketplace,
most of the farmers were using tractors for ploughing land instead of bullock carts, chemical
fertilizers in place of organic fertilizers and hybrid seeds were sown in place of locally
available seeds.
Figure 5.33 Change in farm machinery usage, fertilizer usage, type of seed usage
0
10
20
30
40
50
60
Traditional Machineries Organic
Fertilizers
Chemical
Fertilization
Local Seed Hybrid Seed
No
. o
f R
esp
ond
ents
Change in Farming Pattern
Before Road After Road
0
10
20
30
40
50
60
Traditional Machineries Organic
Fertilizers
Chemical
Fertilization
Local Seed Hybrid Seed
No
. o
f R
esp
ond
ents
Change in Farming Pattern
Before Road After Road

142
5.7.6.2 Change in farm produce selling pattern i.e. direct to Mandi or middleman, to
reduce chain to get higher rate i.e. accessibility to market facility
Before road, in all the habitations most of the farmers sell their farm produce to the middleman
due to finding difficulty in taking to the market on their own because of bad road condition
and improper transport facility. Because of this, they are getting fewer prices for their products
and also have less information about the market price variations. After getting good
accessibility because of the good road they are now taking their farm produce to the markets
on their own and getting a good price for their farm products. The Figure 5.34,Table 5.16
shows the change in farm produce selling pattern and access to market facilities for all the four
sample villages in the district.
Figure 5.34 Change in farm produce selling pattern due to access to market in Ahmednagar
district
5.7.6.3 Increased visits of agricultural officers to habitation
In all the four sample habitations, farmers did not receive any training facility before the
construction of the road. After road except for Mungashi, all the sample habitations received
training regarding the change in crop pattern, farming techniques and improved seeds from
agricultural officers during their visit to each habitation.
Table 5.8 Access to agriculture extension service
Ahmednagar Access to agriculture extension services
Kutewadi Mungashi Dhavadewasti Bhoyarepatar
0
2
4
6
8
10
12
14
BR AR BR AR BR AR BR AR
Kutewadi Mungashi Dhavadewasti Bhoyarepatar
No
. o
f R
esp
ond
ents
Change in agriculture product selling pattern
To
Middleman
Direct to
Mandi

143
Before road No No No No
After road Yes No Yes Yes
5.7.7 Impact on Finance Sector in Ahmednagar District
5.7.7.1 Improvement in Banking Facility
Figure 5.35 shows the number of bank accounts used by the inhabitants before and after road
condition. Out of total inhabitants surveyed in four sample villages, 46 respondents were not
having a bank account and 15 respondents were having bank accounts before the road. But
after construction of road the total number of respondents having bank account has increased
to 54. The figure gives information about the number of bank accounts held by different
households. Out of total households surveyed 7 households have no bank account. One, two
and three number of bank accounts held by 16, 25 and 2 number of households respectively
and 11 households had more than 3 bank accounts.
Figure 5.35 Access to banking facility before and after road
5.7.7.2 Status of arranging finance
Most of the inhabitants before road have no sources for arranging finance and few among the
inhabitants depend on money lenders in the habitation, few borrow money from banks and
remaining inhabitants get money by some other means may be from their relatives. After road
a good access to nearby habitations and towns became possible and most of the inhabitants
depend on banks for arranging finance. The Figure 5.36 below shows various means of
arranging finance by the households.
0
20
40
60
Before Road After Road
Access to Banking Facility
Having Bank Account
Not having bank account
No. of Households Vs. No. of
bank accounts
0 1 2 3 >3

144
Figure 5.36 Status of arranging finances
5.7.8 Impact on Migration in Ahmednagar District
5.7.8.1 Change in type of migration
The migration of the inhabitants is seen often at the time when there is no work in the
agriculture field. There are also labourers who go in search of a job and work for daily wages.
The migration type may be seasonal or permanent. From the Figure 5.37, it can be seen that
the most of the migration is seasonal in almost all the habitations for both before road and after
road condition.
0 20 40 60
Bank
Money Lender within
Habitation
Other than these two
No source
No. of Respondents
Status of Arranging Finance
After Road
Before Road
0
5
10
15
20
25
30
35
40
45
50
Temporary
Migration
Permanent
Migration
No Migration
No
. o
f R
esp
ond
ents
Change in Migration due to Road
Before Road
After Road

145
Figure 5.37 Change in type of migration
5.7.8.2 Increase or Decrease in Migration
Compared to the before the road, the number of inhabitants migrating after road in search of a
job is increased in almost all the four sample habitations. There is more increase in the
migration of inhabitants in Dhavadewasti and Mungashi villages and the other two villages
also show little increase in migration of inhabitants after road.
Figure 5.38 Increase or Decrease in Migration
5.7.9 Impact on Living in Ahmednagar District
5.7.9.1 Changes in Type of House
Most of the households in all the four sample habitation were living in Kacha and Half Pucca
houses and a less number of households in the Pucca house before road construction. After
road construction due to good accessibility to construction materials and ease of transport,
there is an increase in Half Pucca and Pucca houses in all the four sample habitations and a
decrease in the number of Kachha houses. The Figure 5.39 below shows the changes in the
type of house for before and after road condition.
0
10
20
30
40
50
60
Before road After road
No
. o
f R
esp
ond
ents
No. of People Migrating

146
Figure 5.39 Change in type of house before and after road
5.7.10 Profile of Parbhani District
Parbhani district is located in the Marathwada region of Maharashtra having its division
headquarters at Aurangabad and is located at 19.27°N 76.78°E. It has an average elevation of
347 metres. It is spread over an area of 6251 Km2 and divided into 9 talukas. These talukas are
Gangakhed, Jintur, Manwath, Palam, Pathri, Parbhani, Purna, Selu and Sonpeth.
Parbhani's climate is classified as tropical. When compared with winter, the summers have
much more rainfall. The average minimum and maximum temperature in the district is
20.1°Cand 33.8°C and receives an average rainfall of 996.4 mm in a year.
Parbhani district is having a population of 18, 35,982 people, which contains 1.63% of the total
Maharashtra’s population. The growth rate is 20.18%. Among the total population, 31.8% of
people live in urban areas and have the population density of 295 people per square km area.
73.34% of the total population is literate. Hinduism is majority religion in Parbhani city with
45.11% followers. Islam is second major religion in the city of Parbhani with approximately
41.25% following it and Buddhism by 09.21%, Christianity is followed by 0.23%, Jainism by
0.93%, Sikhism by 0.21% and around 0.02% stated Other Religion. The sex ratio in Parbhani
district is 947 female per 1000 male population.
There are total 915 habitations in the district. Among the total number of habitations 83
habitations have more than 1000 population, 31 habitations have their population in the range
500-999, 12 habitations have the population range of 250-499 and 789 habitations have less
than 250 population. Out of total habitations, 844 habitations are connected and 43 habitations
are unconnected. The connectivity of 28 habitations covered under state scheme.
0
5
10
15
20
25
30
35
40
45
50
Kacha Half Pucca Pucca
No
. o
f R
esp
ond
ents
Change in Type of House due to road
Before Road
After Road

147
Table 5.9 Number of villages in Parbhani district population wise
Sr. No. Parbhani No of Rural households No of Villages
1 Greater than 1000 population 210155 473
2 Population between 750-999 21335 118
3 Population between 500-749 16275 126
4 Population between 250-499 7840 92
5 Population below 250 794 21
Total 256399 830
5.7.11 Sample Size
As per our sampling criteria, we have both new connectivity and upgradation roads in Parbhani
district and we have selected following roads and villages. Four roads were selected in such a
way that the villages with varying populations can be covered. Among these four roads, two
roads are of new connectivity and two are of upgradation. The population size and sample size
for each village is mentioned in Table 5.10. Total 95 households were surveyed i.e. 14% of
households were covered.
Table 5.10 Sample roads in Parbhani District for socioeconomic evaluation
Sr.
no. Block Road Name
Village/
Habitation Population Households Sample
1 Parbhani
SH44-Ithlapur
Deshmukh
Raipur Road
Ithlapur
Deshmukh 1412 282 23
2 Palam SH 219 to Wadi
(kh) Wadi Kh 718 144 30
3 Palam
MSH 2 to Puyani
Adgaon
Wanbhujwadi
Road
Adgaon,
Wanbhujwadi 620 124 23
4 Palam MSH 3 to
Ramapur
Ramapur,
Ramapur Tanda 540 108 19
Total 3290 658 95

148
Figure 5.40 Sample Road and Habitation Map in Parbhani
Table 5.11 List of infrastructure availability before road and after road within habitation
Parbhani
District
Ithlapur
Deshmukh Wadi kh Aadgaon
Wanbhujw
adi Ramapur
Ramapur
Tanda
BR* AR BR* AR BR* AR BR* AR BR* AR BR* AR
Primary School No Yes No Yes Yes Yes No Yes No Yes No Yes
Middle School No No No No Yes Yes No No No No No No
High School No No No No Yes Yes No No No No No No
Degree College No No No No No No No No No No No No
Health Services No No No No No No No No No No No No
PHCS No No No No No No No No No No No No
Veterinary
Hospital No No No No No No No No No No No No
Telegraph
Office No No No No No No No No No No No No
Bus Service No No No No No No No No No No No Yes
Electricity No Yes No Yes Yes Yes No Yes No Yes No Yes

149
Panchayat Head
Quarter No Yes No Yes Yes Yes No No No Yes No Yes
* All information is from OMMAS website accessed on 31st March.
5.7.12 Impact on Transport Sector in Parbhani District
5.7.12.1 Usage of the road by other habitation as the primary route.
Each road connected to the four villages in Parbhani district is used by more than one
habitations. The road connecting to Ithalpur Deshmukh is used by three habitations, the road
connecting to Wadi kh is used by two other habitations, two habitations were using the road
connected to Adgaon and Wanbhujwadi and the road to Ramapur Tanda is used by three
habitations.
Figure 5.41 Number of habitations using the road
5.7.12.2 Average number of days road closure for the access before and after road
The road connectivity to two of the sample villages is completely new connectivity. The
scenario of the road before connecting through PMGSY is better explained in the Figure 5.42.
Almost about 15 days a year road is closed for travelling in Ramapur Tanda and Ithalpur
Deshmukh. But the road to Adgaon, Wanbhujwadi is closed for 30 days and the road to Wadi
kh is closed for 35 days. The situation after road shows that no road is closed due to monsoon
or any other reason except Adgaon and Wanbhujwadi. The road connecting to Wanbhujwadi
is the same road that connects Adgaon, it extends to Wanbhujwadi after Adgaon. The road gets
closed during monsoon when it rains heavily for five days annually reported respondents. This
road has recorded the highest number of days closed due to the existing road was in the stream
and in monsoon there was a continuous flow of water in that path.
00.5
11.5
22.5
33.5
No
. o
f H
abit
atio
ns
No of Habitations Connected
No of Habitations
Connected

150
Figure 5.42 Average number of days the road is closed before and after road
5.7.12.3 Public Transport facility Availability
Usually in almost all the villages connected through PMGSY scheme the state has provided
state transport service to such village as the village possess population greater than 500. But in
Parbhani, there is no bus service still in any of the village connected by PMGSY roads noted
by respondent before and after road.
Figure 5.43 Availability of Public Transport facility
0
5
10
15
20
25
30
35
40
No
. o
f D
ays
Average number of days road is closed annually
Before Road
After Road
0
0.2
0.4
0.6
0.8
1
1.2
No
. o
f T
imes
Co
min
g t
o V
illa
ge
Public Transport facility
Before Road
After Road

151
5.7.12.4 Increase in number of vehicles in the habitation
In all the habitations the use of two-wheelers has increased in a good amount after the
construction of the road. There is a much increase in the usage of two-wheelers by the
inhabitants of Ithalpur Deshmukh. Most of the people were going to district headquarters for
the main purchases using their own vehicles. Also, there is an increase in the usage of two-
wheelers after road by the inhabitants of Ramapur Tanda, Wadi kh, Adgaon and Wanbhujwadi.
The Figure 5.44 shows the increase in a number of two-wheelers for before road and after road
condition. Ithlapur Deshmukh road recorded the highest number of two-wheelers and Wadi kh
recorded the lowest increase in a number of two-wheelers.
Figure 5.44 Increase in two-wheelers in the habitations
5.7.12.5 Increased participation of females for going outside village for different
purposes.
In all the four sample villages males were participating in the activities like going to market,
buying seeds and fertilizers, buying clothes and ornaments etc. before the road. The female
participation in all the activities was not mentioned by any of the respondents of all the
habitations. But after road along with the male, the female also participating in all the activities
because of good accessibility to the places away from the village and there is a considerable
increase in the female participation which is shown in the Figure 5.45 below.
020406080
100120140160180200
No
. o
f T
wo
Whee
lers
Increase in No. of Two Wheelers
Before Road
After Road

152
Figure 5.45 Increased participation of females in going outside village
5.7.13 Impact on Health Sector in Parbhani District
5.7.13.1 Change in Cooking Energy pattern and access to clean energy.
The main source of cooking energy before road was firewood due to easy availability except
few respondent using both LPG and firewood. Though some households were using LPG, there
was no delivery of the LPG cylinder available to the habitation before the road. But after road,
there is a considerable change in the fuel usage. The households previously using firewood as
cooking energy changed to LPG and some households were using both firewood and LPG.
Change in cooking energy pattern is shown in the Figure 5.46 below.
0
5
10
15
20
25
30
BR AR BR AR BR AR BR AR
Ithalpur
Deshmukh
Wadi kh Adgaon Ramapur
Tanda
No
. o
f F
ema
le P
art
icip
ati
on
Participation of Females in going outside village
Only Male
Both Male
& Female
0
20
40
60
80
100
120
Firewood LPG Both
No. of
Res
ponden
ts
Change in Cooking Energy Pattern
Before Road
After Road

153
Figure 5.46 Change in cooking energy pattern
5.7.13.2 Increase in frequency of Health workers and doctors in the habitation.
ASHA workers used to stay in the habitation before and after road in Ithalpur Deshmukh
village whereas doctor and nurse visit the village one or two times per month. There is no
availability of doctors and nurse before and after road in Adgaon and Ramapur Tanda villages.
ASHA worker visits one or two times per month in Ramapur Tanda village and in Adgaon
village Asha worker is in the habitation after road. In Wadi kh village nurse and Asha worker
used to visit the village one or two times before and after the road.
Table 5.12 Trip of Health Workers and Doctors in the habitation
Trip of Doctor, Nurse and ASHA Worker per month
Before road After road
Ithalpur Deshmukh
Doctor 1 2
Nurse 1 2
ASHA worker Within habitation Within habitation
Wadi Kh
Doctor No No
Nurse 1 2
ASHA worker 2 3
Adgaon
Doctor No No
Nurse No No
Asha workers No Within habitation
Ramapur Tanda
Doctor No No
Nurse No No
Asha workers 1 2
5.7.13.3 Immunization facility and status of immunization.
Immunization facility is provided to children in all the four sample habitations before and after
road. The Figure 5.47 shows an increase in the immunization provided in villages of Ithalpur
Deshmukh, Wadi kh and Ramapur Tanda. And in Adgaon village we get an equal number of
response from inhabitants for the immunization facility provided before and after road.

154
Figure 5.47 Immunization facility and status of immunization
5.7.13.4 Special incidents happened due to no road or bad condition of the road.
Special incidents such as the death of a new-born baby, death of pregnant woman happen in
Adgaon village in both before and after road condition. But no such incidents happened in the
remaining three villages.
Table 5.13 Special incidents happened due to bad condition of road
Special incidents happened New-born baby dead Pregnant woman dead
Ithalpur Deshmukh No No
Wadi Kh No No
Adgaon Yes Yes
Ramapur Tanda No No
5.7.13.5 Ambulance coming to the village or not.
The detail of ambulance availability for all the habitation before and after the road is given in
Table 5.14 below. None of the habitation was having ambulance facility before road at the time
of emergency but except Adgaon all other habitations got the facility of an ambulance after
road during an emergency.
Table 5.14 Status of ambulance coming to Habitation
Sr. No. Name of Habitation Before Road After Road
1 Ithalpur Deshmukh No Yes
2 Wadi kh No No
0
5
10
15
20
25
Yes No Yes No Yes No Yes No
Ithalpur
Deshmukh
Wadi kh Adgaon Ramapur
Tanda
No
. o
f R
esp
ond
ents
Immunization given to child
Before Road
After road

155
3 Adgaon No Yes
4 Wanbhujwadi No Yes
5 Ramapur Tanda No Yes
5.7.14 Impact on Education Sector in Parbhani District
5.7.14.1 Usefulness of Road in Improvement in Access to Education
After the road construction access to education has been improved well above 50% in all the
habitations. Ithalpur Deshmukh and Wadi kh villages show more improvement in accessing
the road for education purpose. Also, Adgaon, Wanbhujwadi and Ramapur Tanda habitations
show a good change in accessing the road for education purpose.
Figure 5.48 Improved access to education due to sample road
5.7.14.2 Decrease in Dropout rate of students
Bad connectivity or no connectivity of road is one of the reasons for Dropout of students from
the school, as they can’t get good means of transportation to reach the school and also it is
difficult in the rainy season where the condition of road gets worse than compared to normal
days. The rate of students going to school increased considerably after road in all the four
sample villages as shown in the Figure 5.49 below.
0
5
10
15
20
25
Ithalpur
Deshmukh
Wadi kh Adgaon Ramapur
Tanda
No
. o
f R
esp
ond
ents
Improved Access to Educational Facility
Yes
No
Neutral

156
Figure 5.49 Absentee rate for children
5.7.14.3 Decrease in absentee rate of teachers
Because of bad connectivity, there are more chances of not getting proper transport facility for
teachers to reach school in most of the days. After road construction, there is much reduction
in the absentee rate of teachers and they are coming to school more regularly. The Figure 5.50
below shows the decrease in the absentee rate of teachers after road compared to the before
road condition.
Figure 5.50 Absentee rate for teacher
0
5
10
15
20
25
30
BR AR BR AR BR AR BR AR
Ithalpur
Deshmukh
Wadi kh Adgaon Ramapur Tanda
No
. o
f R
esp
ond
ents
Decrease in Drop out rate and Absentee Rate for Children
Yes
No
0
5
10
15
20
25
30
BR AR BR AR BR AR BR AR
Ithalpur
Deshmukh
Wadi kh Adgaon Ramapur Tanda
No
. o
f R
esp
ond
ents
Decrease in Absentee Rate for Teachers
Yes
No

157
5.7.15 Impact on Agriculture in Parbhani District
5.7.15.1 Change in Farming Pattern
Productivity in agriculture depends on the type of seed used, fertilizer applied etc. To get those
good seeds and fertilizers farmers had to go to the marketplace which is away from their
habitations and they need to depend on some means of transportation. As seen from the Figure
5.51 there is a change in the use of farm machinery, fertilizer and type of seed in all the four
sample villages for before road and after road condition. Most of the farmers were using
bullock carts, organic fertilizers and a local variety of seeds for farming purpose before the
construction of the road. But after road because of good accessibility to marketplace, most of
the farmers were using tractors for ploughing land instead of bullock carts, chemical fertilizers
in place of organic fertilizers and hybrid seeds were sown in place of locally available seeds.
Figure 5.51 Change in farm machinery usage, fertilizer usage, type of seed usage
5.7.15.2 Change in farm produces selling pattern i.e. direct to Mandi or middleman, to
reduce chain to get a higher rate. i.e. accessibility to market facility
Before road, in all the habitations most of the farmers sell their farm produce to the middleman
finding difficulty in taking to the market on their own because of bad road condition and
improper transport facility. Because of this, they are getting fewer prices for their products and
also have less information about the market price variations. After getting good accessibility
because of the good road they are now taking their farm produce to the markets on their own
and getting a good price for their farm products. The Figure 5.52 shows the change in farm
produce selling pattern and access to market facilities for all the four sample villages.
0
10
20
30
40
50
60
70
80
90
Traditional Machineries Organic
Fertilizers
Chemical
Fertilization
Local Seed Hybrid Seed
No
. o
f R
esp
ond
ents
Change in Farming Pattern
Before Road After Road

158
Figure 5.52 Change in farm produce selling pattern due to access to market in Parbhani
5.7.15.3 Agricultural officers visits and training to farmers
From the visit of the agricultural officers, farmers get information regarding new technologies
and new cropping pattern. Before road, all the four sample villages have no access to the
agricultural extension services. But after road farmers are getting suitable information from the
agricultural officers in all the four sample villages.
Table 5.15 Access to agriculture extension services
Parbhani Access to agriculture extension services
Ithalpur Deshmukh Wadi kh Adgaon Ramapur
Before road No No No No
After road Yes Yes Yes Yes
5.7.16 Impact on Finance Sector in Parbhani District
5.7.16.1 Improvement in banking facility
Figure 5.53 shows the number of bank accounts used by the inhabitants before and after road
condition. Out of total inhabitants surveyed in four sample villages 67 inhabitants were not
having a bank account and 27 inhabitants were having bank accounts. But after road, the total
number of inhabitants having bank account increased to 86. The figure also gives information
about the number of bank accounts held by different households. Out of total households
surveyed 5 households have no bank account, one, two and three number of bank accounts
0
5
10
15
20
25
30
BR AR BR AR BR AR BR AR
Ithalpur
Deshmukh
Wadi Kh Adgaon Ramapur Tanda
No
. o
f R
esp
ond
ents
Change in Agriculture product selling pattern
To Middleman Direct to Mandi

159
held by 12, 32 and 19 number of households respectively and 26 households have more than 3
bank accounts.
Figure 5.53 Improvement in banking facility
5.7.16.2 Status of arranging finance
Most of the inhabitants before road have no sources for arranging finance and few among the
inhabitants depend on money lenders in the habitation, few borrow money from banks and
other few inhabitants get money by some other means may be from their relatives. After road
a good access to nearby habitations and towns became possible and most of the inhabitants
depend on banks for arranging finance. The Figure 5.54 below shows various means of
arranging finance by the households.
0
20
40
60
80
100
Having Bank
account
Without having
bank account
No
. o
f R
esp
ond
ents
Availability of Banking Facility
Before Road After Road
11
3829
8
12
Number of Households Vs. No. of
Bank Accounts
0 1 2 3 >4

160
Figure 5.54 Status of arranging finance
5.7.17 Impact on Migration in Parbhani District
5.7.17.1 Change in type of migration
The migration of the inhabitants is seen often at the time when there is no work in the
agriculture field. There are also labourers who go in search of a job and work for daily wages.
The migration type may be seasonal or permanent. From the Figure 5.55, it can be seen that
the most of the migration is seasonal in almost all the habitations for both before road and after
road condition.
4
1
8
85
65
2
16
15
0 10 20 30 40 50 60 70 80 90
Bank
Money Lender within Habitation
Other than these two
No source
No. of Respondent
Status of arranging finance
After Road Before Road
0
10
20
30
40
50
60
70
80
Temporary Migration Permanent Migration No Migration
No
. o
f R
esp
ond
ents
Change in Migration due to Road
Before Road After Road

161
Figure 5.55 Change in type of migration
5.7.17.2 Increase or decrease in migration
Compared to the before the road, the number of inhabitants migrating in search of a job is
increased in almost all the four sample habitations. There is more increase in the migration of
inhabitants in Ithlapur Deshmukh and Ramapur Tanda villages after road construction.
Figure 5.56 Change in migration
5.7.18 Impact on Living in Parbhani District
5.7.18.1 Change in Type of House
The type of house of the different households surveyed is given in the Figure 5.57 below. Most
of the households have kaccha houses and half pukka houses before road and very few
households are living in Pucca houses. After the construction of the road, there is a reduction
in the number of kaccha houses and the number of households has half Pucca and Pucca
houses.
0
10
20
30
40
50
60
Before road After road
No
. o
f R
esp
ond
ents
No. of People Migrating

162
Figure 5.57 Change in-house type before and after road
5.7.19 Profile of Yavatmal District
Yavatmal district comes in the Vidarbha region of Maharashtra having its division
headquarters at Amaravati and is located at 20.24°N 78.06°E. It has an average elevation of
445 metres. It is spread over an area of 13,584 Km2 and is the 6th largest district of Maharashtra
having 16 talukas. These talukas are Arni, Babhulgaon, Darwa, Digras, Ghatanji, Kalamb,
Mahagaon, Maregaon, Ner, Pandharkawada, Pusad, Ralegaon, Umarkhed, Wani, Yavatmal,
and Zari Jamani. The district's climate is hot and dry, and the winter is very cold. Most of the
total annual rainfall was due to the southwest monsoon rains. The average minimum
temperature will be 13°C and the average maximum temperature will be 42°C. The district
receives an average rainfall of 911mm. Yavatmal district is having a population of 27, 75,457
people which contains 2.46% of the total Maharashtra’s population. The growth rate is 12.9%.
Among the total population, 18.6% of people live in urban areas and have the population
density of 204 people per square km area. The literacy rate of the district is 82.82%. The
majority of the population in Yavatmal is Hindu, among the total population 81% of the people
are Hindu, 9% Buddhist and 8% Muslim. Yavatmal has a sex ratio of 942 females per every
1000 males. There are total 1855 habitations in the district. Among the total number of
habitations 24 habitations have more than 1000 population, 19 habitations have their
population in the range 500-999, 7 habitations have the population range of 250-499 and 1805
habitations have less than 250 population. Out of total habitations, 1743 habitations are
connected and 67 habitations are unconnected. The connectivity of 45 habitations covered
under state scheme.
0
10
20
30
40
50
60
70
Kacha Pucca Half pucca
No
. o
f R
esp
ond
ents
Change in Type of House due to road
Before Road After Road

163
Table 5.16 Population wise village distribution in Yavatmal District
Sr. No. Yavatmal No of Rural households No of villages
1 Greater than 1000 population 376320 781
2 Population between 750-999 54338 260
3 Population between 500-749 51274 339
4 Population between 250-499 26977 278
5 Population below 250 6593 195
Total 515502 1853
5.7.20 Sample Size
As per our sampling criteria, we have selected following roads and villages in Yavatmal
district. Four roads were selected in such a way that the villages with varying populations can
be covered. Roads connecting Mategaon and Rajivnagar are of new connectivity and two roads
in Wandli and Aloda are upgradation. The sample roads selected for socioeconomic evaluation
is given in Table 5.17 below. Out of 668 households in all the four sample habitations 86
households were surveyed i.e. around 13% of total households are surveyed.
Table 5.17 Sample roads for socioeconomic evaluation in Yavatmal District
Sr.
no. Block Road Name
Village/
Habitation Population Households Sample
1 Kalamb MDR 14 to
Mategaon Mategaon 653 131 27
2 Kalamb
MSH 3 to
Sonegaon Wandli
road
Wandli 800 160 28
3 Kalamb MSH 3 to Aloda
Road Donoda, Aloda 1052 210 14
4 Darwa Wagad (Bk) to
Rajivnagar Rajivnagar 836 167 17
Total 3341 668 86

164
Figure 5.58 Sample Road and Habitation in Yavatmal
Table 5.18 List of infrastructure availability before road and after road within habitation
Yavatmal District Mategaon Wandli Donoda Aloda Rajivnagar
BR* AR BR* AR BR* AR BR* AR BR* AR
Primary School Yes Yes Yes Yes Yes Yes Yes Yes Yes Yes
Middle School Yes Yes Yes Yes Yes Yes No No No No
High School No No No No No No No No No No
Degree College No No No No No No No No No No
Health Services Yes Yes No No Yes Yes No No No Yes
PHCS No No No No No No No No No No
veterinary Hospital No No Yes Yes Yes Yes No No No No
Telegraph Office No No Yes Yes No No Yes Yes No No
Bus Service No Yes No Yes Yes Yes Yes Yes No No
Electricity No Yes No Yes No Yes No Yes No Yes
Panchayat Head Quarter Yes Yes Yes Yes Yes Yes Yes Yes No No

165
* All information is from OMMAS website accessed on 31st March.
5.7.21 Impact on Transport Sector in Yavatmal District
5.7.21.1 Usage of the road by other habitation as the primary route.
The road connected to the habitation may be used by other habitations situated beyond the
habitation which is mainly connected. The road connected to Mategaon, Wandli and Aloda are
used by two habitations, the road connected to Donoda is used by three habitations and road
connected to Rajivngar is used by the inhabitants of Rajivnagar itself. The Figure 5.59 shows
the number of habitations connected to the sample roads.
Figure 5.59 Number of habitation using the road
5.7.21.2 Average number of days road is closed annually
The road is not accessible for few days in all the habitations before road because of blockage
of the road during the rainy season. The road connected to Rajivnagar habitation is blocked for
more days compared to all the other three habitations. However, there were no such incidents
happened in the habitations after the construction of the road.
0
1
2
3
4
No of Habitations Connected
No of Habitations
Connected

166
Figure 5.60 average number of days the road is closed before and after road
5.7.21.3 Public transport facility availability
Transport facility is very important in all the habitations for inhabitants to move out in search
of the basic needs. The public transport facility was not available in Mategaon, Wandli and
Rajivnagar habitations before road but in Donoda and Aloda habitations transport facility was
available before the road. After the construction of the road, all other habitations except
Rajivnagar got transportation facility. However, most of the inhabitants owned two-wheelers
for going out of the habitation.
Figure 5.61 Availability of Public Transport facility
0
5
10
15
20
25
30
35
40
45
Mategaon Wandli Donoda Aloda Rajivnagar
No
. o
f D
ays
Average number of days road is closed annually
Before Road After Road
0
1
2
3
4
5
6
7
Mategaon Wandli Donoda Aloda Rajivnagar
No
. o
f R
esp
ond
ents
Public Transport facility
Before Road After Road

167
5.7.21.4 Increase in number of vehicles in the habitation
The number of vehicles in the habitation was very less in Mategaon, Wandli and Donoda
villages and there are no private vehicles in Aloda and Rajivnagar habitations before the road.
Most of the inhabitants are using two-wheelers as a means of transportation as it is affordable
compared to other vehicles. All habitations showed an increase in a number of two-wheelers
after the construction of the road as seen from the Figure 5.62 below.
Figure 5.62 Increase in two-wheelers in the habitations
5.7.21.5 Increased participation of females for going outside village for different
purposes.
In all the habitations males were participating in the activities like going to market, buying
seeds and fertilizers, buying clothes and ornaments etc. before the road. But after road along
with the male, the female also participating in all the activities because of good accessibility
to the places away from the village and there is a considerable increase in the female
participation after road which is shown in the Figure 5.63 below.
0
10
20
30
40
50
60
70
80
90
Mategaon Wandli Donoda Aloda Rajivnagar
No
. o
f T
wo
Whee
eler
s
Increase in No. of Two Wheelers
Before Road After Road

168
Figure 5.63 Increased participation of females in going outside village
5.7.22 Impact on Health Sector in Yavatmal District
5.7.22.1 Change in Cooking Energy pattern and access to clean energy.
Firewood is used as the fuel for cooking in all the four sample habitations before road
construction. Also, some habitations were using LPG and some use both LPG and Firewood.
After road, there is a reduction in the use of firewood and increase in the use of LPG in many
habitations. Also, there is an increase in the number habitations using both firewood and LPG
as a fuel for cooking purpose as shown in the Figure 5.64 below.
0
5
10
15
20
25
30
BR AR BR AR BR AR BR AR
Mategaon Wandli Aloda Rajivnagar
No
. o
f F
emal
e P
arti
cip
atio
n
Participation of Females in going outside village
Only Male Both Male & Female
0
10
20
30
40
50
60
70
80
Firewood LPG Both
No
. o
f R
esp
ond
ents
Change in Cooking Energy Pattern
Before Road After Road

169
Figure 5.64 Change in cooking energy pattern
5.7.22.2 Increase in frequency of Health workers and doctors in the habitation.
The visit of doctor, nurse and ASHA worker has changed in a good amount as shown in Table
5.19 below. The availability of doctor was not there in all the four habitations before and after
road, whereas the visit of the nurse to the habitation has increased to two to three times a month.
ASHA worker is within the habitation in Mategaon before and after the road construction. In
Wandli, Donoda and Rajivnagar habitations there is no availability of ASHA worker before
road but after road, as the worker is staying within the habitation in Wandli, Donoda and
Rajivnagar habitations.
Table 5.19 Trip of Doctor Nurse and ASHA Worker per Month
Trip Of Doctor, Nurse and ASHA Worker Per Month
Before Road After Road
Mategaon
Doctor No No
Nurse 1 2
ASHA Workers Within Habitation Within Habitation
Wandli
Doctor No No
Nurse 1 3
ASHA Workers No Within Habitation
Donoda, Aloda
Doctor No No
Nurse 1 2
ASHA Workers No Within Habitation
Rajivnagar
Doctor No No
Nurse No 2
ASHA Workers No Within Habitation
5.7.22.3 Immunization facility and status of immunization
Child immunization facility is provided in all the four sample habitations before and after road.
The Figure 5.65 shows an increase in the immunization provided in the Donoda and Rajivnagar
habitations after road construction. The respondents from Mategaon and Wandli gave equal
responses before and after road regarding immunization facility.
170
Figure 5.65 Immunization facility and status of immunization
5.7.22.4 Special incidents happened due to no road or bad condition of the road.
As shown in the Table 5.20 below there are no incidents such as the death of new-born baby
and death of pregnant woman occurred in Mategaon, Wandli, Donoda, Aloda and Rajivnagar
sample habitations.
Table 5.20 Special incidents happened due to bad condition of road
Special incidents happened New-born baby dead Pregnant woman dead
Mategaon No No
Wandli No No
Donoda, Aloda No No
Rajivnagar No No
5.7.22.5 Ambulance coming to the village or not.
Availability of ambulance plays an important role in taking inhabitants to the hospitals in
emergency situations. Before road none of the four habitations had the facility of an ambulance
in an emergency but after road ambulance is coming to all the four sample villages at the time
of emergency because of good connectivity provided to the habitations.
Table 5.21 Status of ambulance coming to Habitation
Sr. No. Name of Habitation Before Road After Road
1 Mategaon No Yes
2 Wandli No Yes
0
5
10
15
20
25
30
Yes No Yes No Yes No Yes No
Mategaon Wandli Aloda Rajivnagar
No
. o
f R
esp
ond
ents
Immunization given to child
Before Road After road

171
3 Donoda No Yes
4 Aloda No Yes
5 Rajivnagar No Yes
5.7.23 Impact on Education Sector in Yavatmal District
5.7.23.1 Usefulness of Road in Improvement in Access to Education
In almost all the habitations the access of road for education purpose is increased above 60%
after the construction of the road. In Mategaon, Wandli, Aloda and Rajivnagar villages, a
number of respondents said that after the construction of road access to education is increased
and a number of children going to school safely compared to before road condition.
Figure 5.66 Improved access to education due to sample road
5.7.23.2 Decrease in Dropout rate of students
Bad connectivity or no connectivity of road is one of the reasons for Dropout of students from
the school, as they can’t get good means of transportation to reach the school and also it is
difficult in the rainy season where the condition of road gets worse than compared to normal
days. The rate of students going to school increased considerably after road in Mategaon,
Wandli, Aloda and Rajivnagar sample villages as shown in the Figure 5.67 below.
0
5
10
15
20
25
Mategaon Wandli Aloda Rajivnagar
No
. o
f R
esp
ond
ents
Improved Access to Educational Facility
Yes No Neutral
172
Figure 5.67 Decrease in dropout rate of students
5.7.23.3 Decrease in absentee rate of teachers
Because of bad connectivity, there are more chances of not getting proper transport facility for
teachers to reach school in most of the days. After road construction, there is much reduction
in the absentee rate of teachers and they are coming to school more regularly. The Figure 5.68
below shows the decrease in the absentee rate of teachers after road compared to the before
road condition.
0
5
10
15
20
25
30
BR AR BR AR BR AR BR AR
Mategaon Wandli Aloda Rajivnagar
No
. o
f R
esp
ond
ents
Decrease in Drop out rate and Absentee Rate for
Children
Yes No
0
5
10
15
20
25
30
BR AR BR AR BR AR BR AR
Mategaon Wandli Aloda Rajivnagar
No
. o
f R
esp
ond
ents
Decrease in Absentee Rate for Teachers
Yes No

173
Figure 5.68 Decrease in absentee rate of teachers
5.7.24 Impact on Agriculture in Yavatmal District
5.7.24.1 Change in Farming Pattern
To purchase good seeds and fertilizers farmers had to go to the marketplace which is away
from their habitations and they need to depend on some means of transportation. As seen
from
Figure 5.69Figure 5.69 there is a change in the use of farm machinery, fertilizer and type of
seed in all the four sample villages for before road and after road condition. Most of the farmers
were using bullock carts, organic fertilizers and a local variety of seeds for farming purpose
before the construction of the road. But after road because of good accessibility to the market,
most of the farmers were using tractors for ploughing land instead of bullock carts, chemical
fertilizers in place of organic fertilizers and hybrid seeds were sown in place of locally
available seeds.
0
10
20
30
40
50
60
70
Traditional Machineries Organic
Fertilizers
Chemical
Fertilization
Local Seed Hybrid Seed
No
. o
f R
esp
ond
ents
Change in Farming Pattern
Before Road After Road

174
Figure 5.69 Change in farm machinery usage, fertilizer usage, type of seed usage
5.7.24.2 Change in farm produces selling pattern i.e. direct to Mandi or middleman to
reduce chain to get higher rate i.e. access to the agricultural market.
Because of bad road condition and improper transport facility, most of the farmers sell their
farm produce to the middleman finding difficulty in taking to the market on their own. Because
of this, they are getting fewer prices for their products and also have less information about the
market price variations. After getting good accessibility because of the good road they are now
taking their farm produce to the markets on their own and getting a good price for their farm
products. The Figure 5.70 shows the change in farm produce selling pattern and access to
market facilities for all the four sample villages.
0
10
20
30
40
50
60
70
Traditional Machineries Organic
Fertilizers
Chemical
Fertilization
Local Seed Hybrid Seed
No
. o
f R
esp
ond
ents
Change in Farming Pattern
Before Road After Road

175
Figure 5.70 Change in farm produce selling pattern due to access to market in Yavatmal
5.7.24.3 Agricultural officers visits and training to farmers
The Table 5.22 below shows visit of agricultural officers to four sample habitations before and
after road. It is seen that farmers were not getting any training before road regarding new
technology, improved seeds and change in cropping pattern. But after road farmers of all the
habitations are getting access to agricultural extension services because of good connectivity
of road.
Table 5.22 Access to agricultural extension services
Yavatmal Access to agriculture extension services
Mategaon Wandli Donoda and Aloda Rajivnagar
Before road No No No No
After road Yes Yes Yes Yes
5.7.25 Impact on Finance Sector in Yavatmal District
5.7.25.1 Improvement in Banking Facility
Figure 5.71 shows the number of bank accounts used by the inhabitants before and after road
condition. Out of total inhabitants surveyed in four sample villages 33 inhabitants were not
having a bank account and 42 inhabitants were having bank accounts before the road. But after
road, the total number of inhabitants having a bank account has increased to 68. The figure
also gives information about the number of bank accounts held by different households. Out
of total households surveyed 3 households have no bank account, one, two and three number
0
2
4
6
8
10
12
14
16
BR AR BR AR BR AR BR AR
Mategaon Wandli Aloda Rajivnagar
No
. o
f R
esp
ond
ents
Change in Agriculture product selling pattern
To Middleman Direct to Mandi

176
of bank accounts held by 29, 18 and 13 number of households respectively and 13 households
had more than three bank accounts.
Figure 5.71 Improvement in banking facility
5.7.25.2 Status of arranging finance
Most of the inhabitants before road have no sources for arranging finance and few among the
inhabitants depend on money lenders in the habitation, few borrow money from banks and
other few inhabitants get money by some other means may be from their relatives. After road
a good access to nearby habitations and towns became possible and most of the inhabitants
depend on banks for arranging finance. The Figure 5.72 below shows various means of
arranging finance by the households in the sample villages.
0
10
20
30
40
50
60
70
80
90
Having Bank
account
Without having
bank account
No
. o
f R
esp
ond
ents
Availability of Banking Facility
Before Road After Road
Number of Households Vs. No. of
Bank Accounts
0 1 2 3 >4

177
Figure 5.72 Status of arranging finance
5.7.26 Impact on Migration in Yavatmal District
5.7.26.1 Change in type of Migration
The type migration occurring in the habitation is either seasonal migration or permanent
migration. From the Figure 5.73, it can be seen that the type of migration is seasonal in all the
habitations and there is less number of inhabitants who are migrated permanently. After road
construction habitants feel easy in accessing the road for searching jobs in nearby habitations
and towns. Out of four habitations, Wandli is having more number of seasonal migrations of
inhabitants.
0 10 20 30 40 50 60
Bank
Money Lender within Habitation
Other than these two
No source
No. of Respondents
Status of Arranging Finance
After Road Before Road
0
10
20
30
40
50
60
70
80
Temporary Migration Permanent Migration No Migration
No
. o
f R
esp
ond
ents
Change in Migration due to Road
Before Road After Road

178
Figure 5.73 Change in type of migration
5.7.26.2 Increase or decrease in migration
As seen from the Figure 5.74 there is more increase in migration of inhabitants in Wandli
village compared to other three habitations. Mategaon and Donoda villages show a
considerable change in the migration of inhabitants after road. In Rajivnagar habitation there
is no such migration seen before road but there is an increase in a number of inhabitants moving
out of habitation in search of a job after road.
Figure 5.74 Change in migration
5.7.27 Impact on Living in Yavatmal District
5.7.27.1 Change in Type of House
The type of house change in the sample habitations before and after the road is given in the
Figure 5.75 below. Most of the households were living in kaccha houses before road and very
few habitations were living in Pucca and Half Pucca houses. After the construction of road
number of households living in kaccha houses decreased by a good amount and there is an
increase in the number of Pucca and half pucca houses.
0
10
20
30
40
50
60
70
80
Before road After road
No
. o
f R
esp
ond
ents
No. of People Migrating

179
Figure 5.75 Change in type of house before and after road
5.7.28 Profile of Bhandara District
Bhandara district comes in the Vidarbha region of Maharashtra having its division
headquarters at Nagpur and is located at 21.17°N 79.65°E. It has an average elevation of 244
metres. It is spread over an area of 3717 Km2. Bhandara district consists two sub-divisions,
which are further divided into 7 talukas. Bhandara sub-division is divided into four talukas:
Bhandara, Tumsar Pauni and Mohadi. Sakoli sub-division is divided into three talukas: Sakoli,
Lakhani, and Lakhandur.
The weather is very extreme in all seasons with temperatures in summers as high as 45 degrees
Celsius and in winters as cool as 8 degrees Celsius. Average minimum and maximum
temperature in the district is 20.9°Cand 32.71°C and the district receives an average rainfall of
1388 mm in a year, because of this good rainfall Bhandara is known for its rice production.
Bhandara district is having a population of 11, 98,810 people which contains 1.06% of the total
Maharashtra’s population. The growth rate is 5.52%. Among the total population, 15.44% of
people live in urban areas and the district has a population density of 293 people per square
km area. Males constitute 51% of the population and females 49%. Bhandara has an average
literacy rate of 83.76, higher than the national average literacy rate, with male literacy of 85%
and female literacy of 75%. Bhandara is having the sex ratio of 982 females per 1000 male
population.
There are total 778 habitations in the district. Among the total number of habitations 312
habitations have more than 1000 population, 225 habitations have their population in the range
0
10
20
30
40
50
60
Kacha Pucca Half pucca
No
. o
f R
esp
ond
ents
Change in Type of House due to road
Before Road After Road

180
500-999, 93 habitations have the population range of 250-499 and 98 habitations have less than
250 population. Out of total habitations, all the 778 habitations are connected and there are no
habitations left unconnected.
Table 5.23 Population wise village distribution in Bhandara district
Sr. No. Bhandara No of Rural households No of villages
1 Greater than 1000 population 173579 362
2 Population between 750-999 23340 113
3 Population between 500-749 16581 114
4 Population between 250-499 8591 93
5 Population below 250 2842 89
Total 224933 771
5.7.29 Sample Size
As per our sampling criteria, we don’t have new connectivity roads in Bhandara district so all
four roads selected fall under upgradation. Four roads were selected in such a way that the
villages with varying populations can be covered. The population size and sample size for each
village is mentioned in Table 5.24. Total 95 households were surveyed i.e. 7% of households
were covered.
Table 5.24 Sample roads for socioeconomic evaluation in Bhandara district
Sr.
no Block Road Name Habitation Population Households Sample
1 Bhandara Garada (Jangli) to
Garada (Bk)
Rawanwadi
Khurshepar 1863 373 26
2 Bhandara SH 271 Bhandara to
Warthi SH 271 Pandarbodi 1015 203 29
3 Tumsar Tumsar to Pipra Road Pipara 993 199 20
4 Pauni MDR 35 to Chichal
Chakra Adyal Chichal 3000 600 20
Total 6871 1375 95

181
Figure 5.76 Sample Road and Habitation Map in Bhandara
Table 5.25 List of infrastructure availability before road and after road within habitation
Bhandara District Rawanwadi Khurshepar Pandharbodi Pipra Chichal
BR* AR BR* AR BR* AR BR* AR BR* AR
Primary School Yes Yes Yes Yes Yes Yes Yes Yes Yes Yes
Middle School No No No No Yes Yes No No Yes Yes
High School No No No No No No No No Yes Yes
Degree College No No No No No No No No No No
Health Services No No No No No No No No Yes Yes
PHCS No No No No No No No No Yes Yes
veterinary Hospital No No No No No No No No Yes Yes
Telegraph Office No No No No No No No No Yes Yes
Bus Service No Yes No Yes No No No Yes Yes Yes
Electricity Yes Yes Yes Yes Yes Yes Yes Yes Yes Yes
Panchayat Head Quarter Yes Yes Yes Yes No Yes Yes Yes Yes Yes * All information is from OMMAS website accessed on 31st March.

182
5.7.30 Impact on Transport Sector in Bhandara District
5.7.30.1 Usage of the road by other habitation as the primary route.
The road connected to each of habitation is used by nearby habitations. Each road connected
to the four villages in Bhandara district is used by more than one habitation as shown in the
Figure 5.77 below. The road connecting to Rawanwadi and Chichal is used by six habitations,
the road connecting to Khurshepar is used by four habitations, four habitations were using the
road connected to Pipra and the road to Pandharbodi is used by a maximum of eight habitations.
Figure 5.77 Number of habitation using the road
5.7.30.2 Average number of days road is closed annually
In four sample villages of Bhandara district except the roads connecting Pipra and Rawanwadi
all other roads were free to travel throughout the year. The road connecting to Pipra is closed
for more number of days before road and after the construction of road also it is closed for few
days during the rainy season. In Rawanwadi habitation previously the road is closed for few
days but after the road, it opened for travelling throughout the year.
0
1
2
3
4
5
6
7
8
9
No
. o
f H
abit
atio
ns
No of Habitations Connected
No of Habitations
Connected

183
Figure 5.78 Average number of days the road is closed before and after road
5.7.30.3 Public transport facility availability
From the Figure 5.79, it is seen that most of the habitation has no availability of public transport
before the construction of the road. Only Chichal habitation has the facility of public transport
before and after the construction of the road. Rawanwadi, Khurshepar and Pipra habitations
provided public transport facility after the construction of the road. In Pandharbodi most of the
inhabitants were using private vehicles for their personal use and they used to go to Bhandara
town which is not far from the habitation.
Figure 5.79 Availability of Public Transport facility
0
5
10
15
20
25
30
35
40
Rawanwadi Khurshepar Pandhrabodi Pipara chichal
No
. o
f D
ays
Average number of days road is closed annually
Before Road After Road
0
0.5
1
1.5
2
2.5
3
3.5
Rawanwadi Khurshepar Pandhrabodi Pipara chichal
No
. o
f T
imes
co
min
g t
o V
illa
ge
Public Transport facility
Before Road After Road

184
5.7.30.4 Increase in number of vehicles in the habitation
In all the habitations the use of two-wheelers has increased in a good amount after the
construction of the road. There is a much increase in the usage of two-wheelers by the
inhabitants of Pandharbodi. Most of the people were going to district headquarters for the main
purchases using their own vehicles. Also, there is a good increase in the usage of two-wheelers
after road by the inhabitants of Rawanwadi, Khurshepar, Pipra and Chichal. The Figure 5.80
shows the increase in a number of two-wheelers for before road and after road condition.
Figure 5.80 Increase in number of vehicles in the habitation
5.7.30.5 Increased participation of females for going outside village for different
purposes.
The female participation was considerably less in all the activities as mentioned by respondents
of all the habitations before the road. The male used to go out of habitation for all activities
like going to market, buying seeds and fertilizers, buying clothes and ornaments etc. before
road construction. But after road, both male and female were participating in all activities as
mentioned by the respondents of sample villages.
0
50
100
150
200
250
300
350
400
Rawanwadi Khurshepar Pandhrabodi Pipara chichal
No
. o
f T
wo
Whee
lers
Increase in No. of Two Wheelers
Before Road After Road

185
Figure 5.81 Increased participation of females in going outside village
5.7.31 Impact on Health Sector in Bhandara District
5.7.31.1 Change in cooking energy pattern and access to clean energy.
Before road firewood was the major cooking fuel in all the sample habitations. From the Figure
5.82, it is seen that most of the households were using firewood as the cooking fuel and very
few households were using both firewood and LPG as cooking fuel before the road. But after
the construction of road there is a change in the use of fuel from firewood to LPG and also
there is an increase in the number of households using both firewood and LPG as cooking fuel.
Figure 5.82 Change in cooking energy pattern
0
5
10
15
20
25
30
BR AR BR AR BR AR BR AR
Rawanwadi Pandharbodi Pipra Chichal
No
. o
f F
emal
e P
arti
cip
atio
n
Participation of Females in going outside village
Only Male Both Male & Female
0
10
20
30
40
50
60
70
80
90
Firewood LPG Both
No
. o
f R
esp
ond
ents
Change in Cooking Energy Pattern
Before Road After Road

186
5.7.31.2 Increase in frequency of Health workers and doctors in the habitation.
The availability of health workers and doctors in all the four sample habitations is as shown in
the Table 5.26 below. Doctor and nurse used to stay in the habitation before and after road and
Asha worker availability are there after road in Chichal habitation. In Rawanwadi, Pandharbodi
and Pipra habitations there is considerable change in the visit of health workers and doctors
after road compared to before road condition
Table 5.26 Trip of Health Workers and Doctors in the Habitation
Trip of Doctor, Nurse and Asha Worker per Month
Before Road After Road
Rawanwadi
Doctor No 1
Nurse 1 2
Asha Workers No Within Habitation
Pandharbodi
Doctor 1 2
Nurse 3 5
Asha Workers No Within Habitation
Pipra
Doctor No No
Nurse 2 3
Asha Worker No Within Habitation
Chichal
Doctor Within Habitation Within Habitation
Nurse Within Habitation Within Habitation
Asha Worker No Within Habitation
5.7.31.3 Immunization facility and status of immunization
Immunization facility is provided to children in all the four sample habitations before and after
road. The Figure 5.83 shows an increase in the immunization provided in Rawanwadi and
Pandharbodi villages. In Pipra and Chichal villages we get an equal number of responses from
inhabitants for the immunization facility provided before and after road.

187
Figure 5.83 Immunization facility and status of immunization
5.7.31.4 Special incidents happened due to no road or bad condition of the road.
Special incidents such as the death of a new born baby, the death of pregnant woman are not
recorded in any of the sample habitations in Bhandara district.
Table 5.27 Special incidents happened due to bad condition of road
Special incidents happened New-born baby dead Pregnant woman dead
Rawanwadi No No
Pandharbodi No No
Pipra No No
Chichal No No
5.7.31.5 Ambulance coming to the village or not.
The information of ambulance availability for all the habitation before and after the road is
given in the Table 5.28 below. None of the sample habitation except Pandharbodi was having
ambulance facility before road at the time of emergency. But after road because of good access
to the habitation ambulance is coming to the villages of Rawanwadi, Khurshepar, and Pipra
during the time of emergency.
Table 5.28 Status of ambulance coming to Habitation
Sr. No. Name of Habitation Before Road After Road
0
5
10
15
20
25
30
Yes No Yes No Yes No Yes No
Rawanwadi Pandharbodi Pipra Chichal
No
. o
f R
esp
ond
ents
Immunization given to child
Before Road After road

188
1 Rawanwadi No Yes
2 Khurshepar No Yes
3 Pandharbodi Yes Yes
4 Pipra No Yes
5 Chichal Yes Yes
5.7.32 Impact on Education Sector in Bhandara District
5.7.32.1 Usefulness of Road in Improvement in Access to Education
After the road construction access to education has been improved well above 70% in all the
habitations. All the respondents in Pandharbodi village said that the road has helped children
to reach the school easily showing 100% improvement as shown in the Figure 5.84 below.
Also, Rawanwadi, Pipra and Chichal villages show a good change in accessing the road for
education purpose after road construction.
Figure 5.84 improved access to education due to sample road
5.7.32.2 Decrease in Dropout rate of students
If there is no good connectivity the inhabitants can’t get good means of transportation to reach
the school and also it is difficult in the rainy season where the condition of road gets worse
than compared to normal days. The rate of students going to school increased considerably
after road in all the four sample villages Rawanwadi, Pandharbodi, Pipra and Chichal as shown
in the Figure 5.85 below.
0
5
10
15
20
25
30
Rawanwadi Pandharbodi Pipra Chichal
No
. o
f R
esp
ond
ents
Improved Access to Educational Facility
Yes No Neutral

189
Figure 5.85 Decrease in dropout rate of students
5.7.32.3 Decrease in absentee rate of teachers
The bad connectivity of road leads to improper transport facility because of this teachers face
difficult to reach school in most of the days. After road construction, there is much reduction
in the absentee rate of teachers and they are coming to school more regularly. The Figure 5.86
below shows the decrease in the absentee rate of teachers after road compared to the before
road condition.
0
5
10
15
20
25
30
BR AR BR AR BR AR BR AR
Mategaon Wandli Aloda Rajivnagar
No
. o
f R
esp
ond
ents
Decrease in Drop out rate and Absentee Rate for Children
Yes No
0
5
10
15
20
25
30
BR AR BR AR BR AR BR AR
Mategaon Wandli Aloda Rajivnagar
No
. o
f R
esp
ond
ents
Decrease in Absentee Rate for Teachers
Yes No

190
Figure 5.86 Decrease in absentee rate for teachers
5.7.33 Impact on Agriculture in Bhandara District
5.7.33.1 Change in Farming Pattern
Productivity in agriculture depends on the type of seed used, fertilizer applied etc. To get those
good seeds and fertilizers farmers had to go to the marketplace which is away from their
habitations and they need to depend on some means of transportation. As seen from the Figure
5.87 there is a change in the use of farm machinery, fertilizer and type of seed in all the four
sample villages for before road and after road condition. Most of the farmers were using
bullock carts, organic fertilizers and a local variety of seeds for farming purpose before the
construction of the road. But after road because of good accessibility to marketplace most of
the farmers were using tractors for ploughing land instead of bullock carts, chemical fertilizers
in place of organic fertilizers and hybrid seeds were sown in place of locally available seeds.
Figure 5.87 Change in farm machinery usage, fertilizer usage, type of seed usage
5.7.33.2 Change in farm produce selling pattern i.e. direct to Mandi or middleman, to
reduce chain to get higher rate i.e. accessibility to marketplace
Before road, in all the habitations most of the farmers sell their farm produce to the middleman
finding difficulty in taking to the market on their own because of bad road condition and
improper transport facility. Because of this, they are getting fewer prices for their products and
also have less information about the market price variations. After getting good accessibility
because of the good road they are now taking their farm produce to the markets on their own
and getting a good price for their farm products. The Figure 5.88 shows the change in farm
produce selling pattern and access to market facilities for all the four sample villages.
0
10
20
30
40
50
60
70
80
90
Traditional Machineries Organic
Fertilizers
Chemical
Fertilization
Local Seed Hybrid Seed
No
. o
f R
esp
ond
ents
Change in Farming Pattern
Before Road After Road

191
Figure 5.88 Change in farm produce selling pattern due to access to market in Bhandara
5.7.33.3 Agricultural officers visits and training to farmers
In Rawanwadi and Pipra habitations farmers did not receive any training facility before the
construction of the road. In Pandharbodi and Chichal farmers were getting agricultural
extension services both before and after road. After construction of road Rawanwadi and
Chichal habitations also received training regarding the change in crop pattern, farming
techniques and improved seeds from agricultural officers during their visit to each habitation.
Table 5.29 Access to agriculture extension services
Bhandara Access to agriculture extension services
Rawanwadi Pandharbodi Pipra Chichal
Before road No Yes No Yes
After road Yes Yes Yes Yes
5.7.34 Impact on Finance Sector in Bhandara District
5.7.34.1 Improvement in Banking Facility
Figure 5.89 shows the number of bank accounts used by the inhabitants before and after road
condition. Out of total inhabitants surveyed in four sample villages 52 inhabitants were not
having a bank account and 35 inhabitants were having bank accounts before the road. After
road total number of inhabitants having bank account increased to 84. The figure also gives
information about the number of bank accounts held by different households. Out of total
0
2
4
6
8
10
12
14
16
18
20
BR AR BR AR BR AR BR AR
Rawanwadi Pandharbodi Pipra Chichal
No
. o
f R
esp
ond
ents
Change in Agriculture product selling pattern
To Middleman Direct to Mandi

192
households surveyed 3 households have no bank account, one, two and three number of bank
accounts held by 10, 29 and 18 number of households respectively and 33 households had
more than 3 bank accounts.
Figure 5.89 Improvement in banking facility
5.7.34.2 Status of Arranging Finance
The inhabitants of the four sample villages are less dependent on banks for arranging money
before the road. Few of them borrow money from banks and other few inhabitants get money
by some other means may be from their relatives. From the Figure 5.90, it is seen that after the
construction of road there is an increase in the number of inhabitants borrowing money from
the banks due to the good accessibility of road.
35
59
83
11
0
10
20
30
40
50
60
70
80
90
Having Bank
account
Without having bank
account
No
. o
f R
esp
ond
ents
Availability of Banking Facility
Before Road After Road
11
29
18
33
3
Number of Households Vs. No. of
Bank Accounts
0 1 2 3 >4

193
Figure 5.90 Status of arranging finance
5.7.35 Impact on Migration in Bhandara District
5.7.35.1 Change in Type of Migration
There was no incident of migration in Pipra and Chichal habitation before road whereas in
Rawanwadi and Pandharbodi both seasonal and permanent migration recorded before
construction of the road. From the Figure 5.91, it is seen that migration has been increased in
all the habitations after road construction compared to the before road condition.
Figure 5.91 Change in type of migration
0 10 20 30 40 50 60
Bank
Money Lender within Habitation
Other than these two
No source
No. of Respondents
Status of Arranging Finance
After Road Before Road
20
4
70
37
6
51
0
10
20
30
40
50
60
70
80
Temporary Migration Permanent Migration No Migration
No
. o
f R
esp
ond
ents
Change in Migration due to Road
Before Road After Road

194
5.7.35.2 Increase or Decrease in Migration
Compared to the before road, the number of inhabitants migrating in search of a job is increased
in almost all the four sample habitations. There is more increase in the migration of inhabitants
in Rawanwadi and Pandharbodi villages and the other two villages Pipra and Chichal also show
an increase in migration of inhabitants after road whereas in before road condition no migration
occurred in these two villages.
Figure 5.92 Increase or decrease in migration
5.7.36 Impact on Living in Bhandara District
5.7.36.1 Change in Type of House
In all the four sample habitations of Bhandara district, the inhabitants are living in kaccha and
half Pucca houses and a less number of households in the pucca house before road construction.
After road due to good accessibility to construction materials and ease of transport, there is an
increase in half Pucca and Pucca houses in all the four sample habitations and a decrease in
the number of kaccha houses. The Figure 5.93 below shows the changes in the type of house
for before and after road condition.
24
43
0
10
20
30
40
50
Before road After road
No
. o
f R
esp
ond
ents
Axis Title
No. of people migrating

195
Figure 5.93 Change in type of house
5.7.37 Profile of Kolhapur District
Kolhapur district comes in the western Maharashtra region having its division headquarters at
Pune and is located at 16.41°N 74.14°E. It has an average elevation of 546 metres. It is spread
over an area of 7685 Km2. Kolhapur district consists 12 talukas namely Kagal, Karveer,
Bhudargad, Panhala, Gadhinglaj, Shirol, Hatkanangale, Ajara, Chandgad, Gaganbawada,
Radhanagari, Shahuwadi.
Kolhapur's climate is a blend of coastal and inland elements common to Maharashtra. The
temperature has a relatively narrow range between 10 °C to 35 °C. Summer in Kolhapur is
comparatively cooler but much more humid, than neighbouring inland cities. Maximum
temperatures rarely exceed 38 °C and typically range between 33 and 35 °C. Lows during this
season are around 24 °C to 26 °C. The average minimum and maximum temperatures are
19.6°C and 30.7°C. The city receives abundant rainfall from June to September due to its
proximity to the Western Ghats. The average rainfall in the district is 996mm.
Kolhapur district is having a population of 3874015 people which contains 3.4% of the total
Maharashtra’s population. The growth rate is 9.96%. Among the total population, 15.44% of
people live in urban areas and the district has a population density of 504 people per square
km area. Hinduism is majority religion in Kolhapur city with 83.89% followers. Islam is
second most popular religion in the city of Kolhapur with approximately 10.88% following it.
In Kolhapur city, Christianity is followed by 0.96%, Jainism by 3.35%, Sikhism by 0.11% and
0
10
20
30
40
50
60
Kacha Pucca Half pucca
No
. o
f R
esp
ond
ents
Change in Type of House due to road
Before Road After Road

196
Buddhism by 0.11%. Around 0.04% stated Other Religion. The literacy rate in the district is
81.51%. Kolhapur is having the sex ratio of 957 females per 1000 male population.
There are total 2657 habitations in the district. Among the total number of habitations 715
habitations have more than 1000 population, 444 habitations have their population in the range
500-999, 518 habitations have the population range of 250-499 and 980 habitations have less
than 250 population. Out of total habitations, 2311 habitations are connected and 341
habitations are unconnected. The connectivity of 5 habitations covered under state scheme.
Table 5.30 Population wise villages distribution in Kolhapur District
Sr. No. Kolhapur No of Rural households No of Villages
1 Greater than 1000 population 510011 761
2 Population between 750-999 27191 143
3 Population between 500-749 20484 151
4 Population between 250-499 9885 113
5 Population below 250 948 27
Total 568519 1195
5.7.38 Sample Size
As per our sampling criteria, four roads were selected in Kolhapur district. Among these four
roads, two roads of new connectivity and two roads of upgradation, the roads to Parali and
Bhatwadi are of new connectivity and the rest two are of upgradation. The population of
habitation connected through these roads are shown in Table 5.31. The sample size in each
habitation is also mentioned in the same table. A total of 81 samples covered in these four
villages and in each village one separate focused group discussion was conducted with a group
of 8-10 people.
Table 5.31 Sample roads for socioeconomic evaluation in Kolhapur district
Sr.
no Block Road Name
Village/
Habitation
Populati
on Households Sample
1 Shahuwadi SH 125 to Nandgaon
Sonurle Patilwada Sonurle 1309 262 18
2 Shahuwadi MDR 9 to Parli Parali 1354 271 20
3 Bhudarghad SH 120 to Tiravade
Devulwadi Devarde
Deulwadi,
Kariwadi,
Simalwadi
896 179 30

197
4 Bhudarghad Patgaon to Bhatwadi
Bhatwadi
Adye Tale,
Tambachiwad
i,
Talewadi
669 134 13
Total 4228 846 81
Figure 5.94 Sample Road and Habitations Map in Kolhapur
Table 5.32 List of infrastructure availability before road and after road within habitation
Kolhapur District Sonurle Parali Deulwadi Simalwadi Kariwadi, Bhatwadi Tambachiwadi Talewadi
BR* AR BR* AR BR* AR BR* AR BR* AR BR* AR BR* AR BR* AR
Primary School No Yes No Yes No Yes Yes Yes No Yes No Yes Yes Yes No Yes
Middle School No Yes No No No No No No No No No No Yes Yes No No
High School No No No No No No No No No No No No No No No No
Degree College No No No No No No No No No No No No No No No No
Health Services No No No No No No No No No No No No No No No No

198
PHCS No No No No No No No No No No No No No No No No
Veterinary
Hospital No Yes No No No No No No No No No No No No No No
Telegraph Office No No No No No No No No No No No No Yes Yes No Yes
Bus Service No Yes No Yes No Yes No Yes No Yes No Yes No Yes No Yes
Electricity No Yes No No No No Yes Yes No Yes No Yes Yes Yes Yes Yes
Panchayat Head
Quarter No Yes No Yes No Yes Yes Yes No Yes No Yes Yes Yes No Yes
Source: OMMAS, PMGSY and primary data collection
5.7.39 Impact on Transport Sector in Kolhapur District
5.7.39.1 Usage of the road by other habitation as the primary route.
The roads constructed for a particular village can facilitate other habitation nearby by indirectly
connecting to marketplace or important facilities. This resulted in increased usage by other
habitations as an alternative or primary route. The Figure 5.95 shows a total number of
habitations using the constructed road. The road connected to Kariwadi through Simalwadi
and Devulwadi shows the highest number of habitation using this road. However, the road
connected to Tambachiwadi through Bhatwadi shows the least number of habitation using this
road.
Figure 5.95 Number of habitation using the road
5.7.39.2 Average number of days road is closed annually
The condition of the road before connecting through PMGSY was not all weather connectivity
and often gets closed for travel due to monsoon rain. Figure 5.96 shows the status of each road
in terms of closure for travel in an average number of days. The road to Tambachiwadi was
almost closed for 45 days in monsoon as the road before was only gravel road and passes
through the forest area. After connecting through PMGSY there was no closure of road
recorded by respondent. The road to Devulwadi, Kariwadi was Kachha road and up to
0
1
2
3
4
5
No
. o
f H
abit
atio
ns
No of Habitations Connected
No of Habitations
Connected

199
Devulwadi it had good connectivity thus no closure of road was reported by respondent from
Devulwadi but the same road passes till Kariwadi and the habitations after Devulwadi reported
closure of road before PMGSY road for about 45 days in monsoon season. But no closure of
road recorded in any of the habitation after connecting through PMGSY scheme.
Figure 5.96 Average number of days the road is closed before and after road
5.7.39.3 Public transport facility availability
Only two habitation among sample has public transport facility before construction of the road
i.e. Sonurle and Devulwadi. But after the construction of PMGSY road, the public transport
facility started in all the sample habitation. While in the habitations where there was public
transport facility available, the frequency of state transport has increased considerably in
Devulwadi. But in case of Sonurle, the frequency has increased from two per day to three after
the construction of the road. Even in Bhatwadi, being isolated habitation in the forest the state
transport bus comes twice a day before it was zero. There are no private transport service
available in Bhatwadi and only mean of transportation is public transport else they have to hire
private vehicle with heavy charges which are not affordable to people.
0
5
10
15
20
25
30
35
40
45
50
Sonurle Parali Deulwadi Simalwadi Kariwade Bhatwadi Tambachi
wadi
No
. o
f D
ays
Average number of days road is closed annually
Before Road After Road

200
Figure 5.97 Availability of public transport facility in connected village
5.7.39.4 Increase in number of vehicles in the habitation
Another means of transportation in the habitation is private transport facility or having own
vehicle. The easiest way is to have own two wheelers with comparatively cheaper to private
and avoids dependability on public transport. The increase in two wheelers has shown
significantly after the construction of a road in all the habitations connected. Sonurle recorded
the highest increase in two wheelers followed by Devulwadi. Almost 70% of the habitation
have two wheeler in the Sonurle. In Bhatwadi village, there was no vehicle recorded before
road but now there are 4 vehicles in the habitation. Similarly, in Devulwadi, the number of two
wheelers has increased to approximately 100. Parli also showed increase in two wheelers after
road construction.
0
0.5
1
1.5
2
2.5
3
3.5
4
4.5
Sonurle Parali Deulwadi Simalwadi Kariwade Bhatwadi Tambachi
wadi
No
. o
f T
imes
co
min
g t
o V
illa
ge
Public Transport facility
Before Road After Road
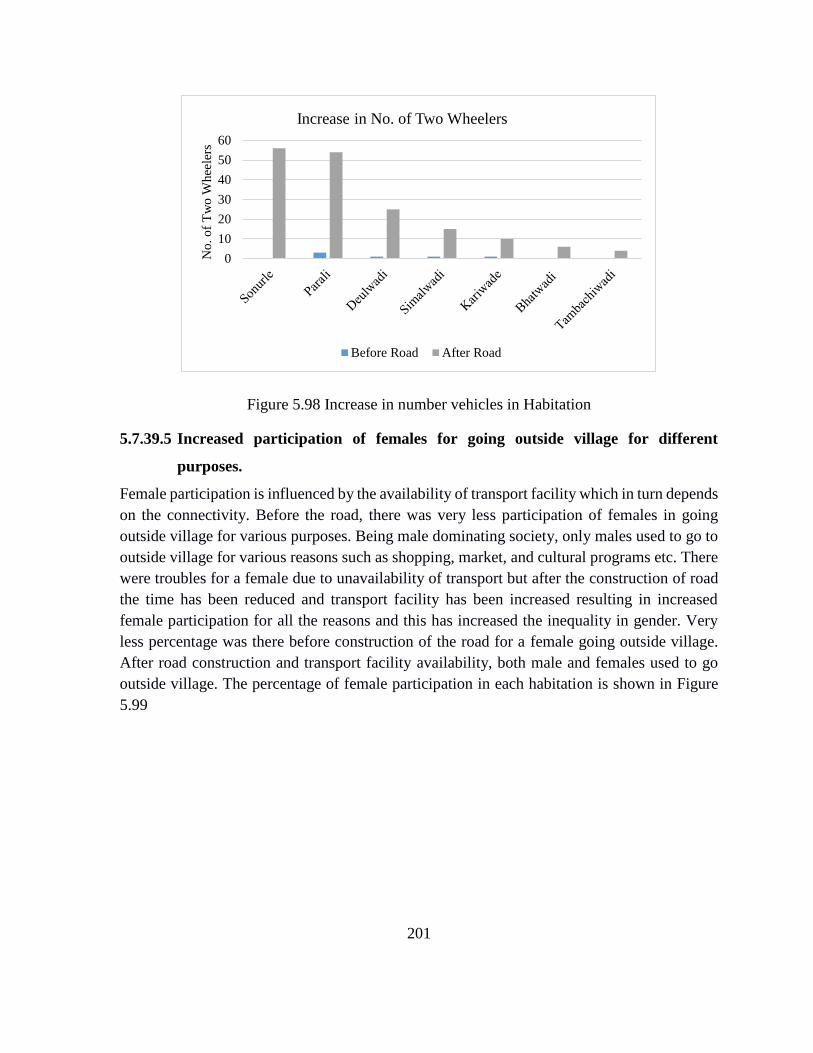
201
Figure 5.98 Increase in number vehicles in Habitation
5.7.39.5 Increased participation of females for going outside village for different
purposes.
Female participation is influenced by the availability of transport facility which in turn depends
on the connectivity. Before the road, there was very less participation of females in going
outside village for various purposes. Being male dominating society, only males used to go to
outside village for various reasons such as shopping, market, and cultural programs etc. There
were troubles for a female due to unavailability of transport but after the construction of road
the time has been reduced and transport facility has been increased resulting in increased
female participation for all the reasons and this has increased the inequality in gender. Very
less percentage was there before construction of the road for a female going outside village.
After road construction and transport facility availability, both male and females used to go
outside village. The percentage of female participation in each habitation is shown in Figure
5.99
0
10
20
30
40
50
60
No
. o
f T
wo
Whee
lers
Increase in No. of Two Wheelers
Before Road After Road

202
Figure 5.99 Increased participation of females in going outside village
5.7.40 Impact on Health Sector in Kolhapur District
5.7.40.1 Change in cooking energy pattern and access to clean energy.
Change in cooking energy i.e. fuel for cooking has been noticed in all the three habitations.
There were no families completely dependent on LPG before road but after the construction of
the road around 10 families are completely dependent on LPG only. There were few families
using both firewood and LPG as a source of cooking energy. But this percentage has also
increased after road. Similarly, there is considerable change in usage of firewood before and
after the construction of the road.
0
5
10
15
20
25
30
35
BR AR BR AR BR AR BR AR
Sonurle Parli Devulwadi Bhatwadi
No
. o
f F
emal
e P
arti
cip
atio
n
Participation of Females in going outside village
Only Male Both Male & Female
0
10
20
30
40
50
60
70
80
Firewood Firewood and LPG LPG
No
. o
f R
esp
ond
ents
Change in Cooking Energy Pattern
Before Road After Road

203
Figure 5.100 Change in cooking energy pattern in habitation
5.7.40.2 Increase in frequency of Health workers and doctors in the habitation.
The habitations that were not connected or connected with a road having a bad condition were
deprived of health facility provided by the government as doctors or nurses can’t visit such
habitations in such condition of the road. But after the construction of the road change has been
recorded in frequencies of visits to habitation by doctor, nurse and health workers. In Kolhapur
district, there is an increase in frequencies of visits by a nurse in the habitation Parli,
Devulwadi, and Bhatwadi. None of the habitation was previously visited by a doctor but after
road construction the habitations Parli and Bhatwadi show two visits in six months.
Table 5.33 Trip of Health Workers and Doctors in the Habitation
Trip of Doctor, Nurse and Asha Worker per Month
Before Road After Road
Sonurle
Doctor No No
Nurse No No
Asha Worker Within Habitation Within Habitation
Parli
Doctor No 2 In Six Month
Nurse No 2
Asha Worker Within Habitation Within Habitation
Devulwadi
Doctor No No
Nurse 1 2
Asha Worker No Within Habitation
Bhatwadi
Doctor No 2 In Six Month
Nurse No 2
Asha Worker No No
5.7.40.3 Immunization facility and status of immunization
The immunization facility was there in all the four habitations visited for common vaccine
such as polio. But for the newborn child and vaccination of infant, most of the inhabitants have
to go to the nearby hospital and ASHA worker keeps follow up of such cases. Before the
construction of road, the vaccination was not carried out on time due to inaccessibility to
hospital. But as of now, almost every child is vaccinated in a nearby hospital. The common
vaccines were given in Anganwadi in the habitation and hence respondent gave 100% yes to
immunization before and after road.

204
Figure 5.101 Immunization facility and status of immunization
5.7.40.4 Special incidents happened due to no road or bad condition of the road.
Table 5.34 Special incidents happened due to bad condition of road
Sr.No. Special incidents happened New-born baby dead Pregnant woman dead
1 Sonurle No No
2 Parali No No
3 Devulwadi No No
4 Bhatwadi No No
5.7.40.5 Ambulance coming to the village or not.
The road plays an important role in the health sector by providing access to the patient through
comfortable driving on the road. The government has started to provide ambulance service free
of cost through free dial number 108. If the road is not in good condition the ambulance can’t
come to village or habitations. Almost all the habitations in the Kolhapur district didn’t have
access to ambulance serve before construction of the road but after construction of the road six
habitations among seven showed access to ambulance facility
Table 5.35 Details of Ambulance coming to village in Kolhapur
Sr. No. Name of Habitation Before Road After Road
1 Sonurle No Yes
2 Parali No Yes
3 Devulwadi No Yes
4 Simalwadi No Yes
0
5
10
15
20
25
30
35
Yes No Yes No Yes No Yes No
Sonurle Parli Devulwadi Bhatwadi
No
. o
f R
esp
ond
ents
Immunization given to child
Before Road After road
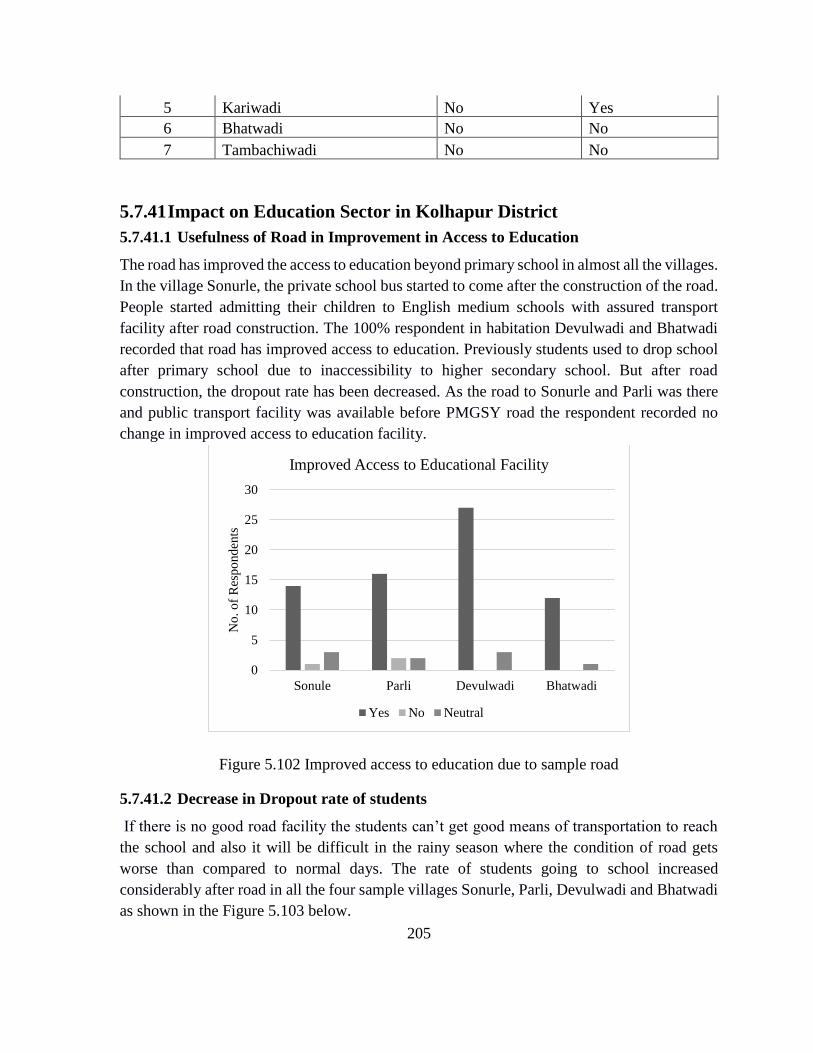
205
5 Kariwadi No Yes
6 Bhatwadi No No
7 Tambachiwadi No No
5.7.41 Impact on Education Sector in Kolhapur District
5.7.41.1 Usefulness of Road in Improvement in Access to Education
The road has improved the access to education beyond primary school in almost all the villages.
In the village Sonurle, the private school bus started to come after the construction of the road.
People started admitting their children to English medium schools with assured transport
facility after road construction. The 100% respondent in habitation Devulwadi and Bhatwadi
recorded that road has improved access to education. Previously students used to drop school
after primary school due to inaccessibility to higher secondary school. But after road
construction, the dropout rate has been decreased. As the road to Sonurle and Parli was there
and public transport facility was available before PMGSY road the respondent recorded no
change in improved access to education facility.
Figure 5.102 Improved access to education due to sample road
5.7.41.2 Decrease in Dropout rate of students
If there is no good road facility the students can’t get good means of transportation to reach
the school and also it will be difficult in the rainy season where the condition of road gets
worse than compared to normal days. The rate of students going to school increased
considerably after road in all the four sample villages Sonurle, Parli, Devulwadi and Bhatwadi
as shown in the Figure 5.103 below.
0
5
10
15
20
25
30
Sonule Parli Devulwadi Bhatwadi
No
. o
f R
esp
ond
ents
Improved Access to Educational Facility
Yes No Neutral

206
Figure 5.103 Decrease in dropout rate of students
5.7.41.3 Decrease in absentee rate of teachers
The bad connectivity of road leads to more chances of not getting proper transport facility for
teachers to reach school in most of the days. After road construction the accessibility to other
habitations and nearby towns became easy and there is much reduction in the absentee rate of
teachers and they are coming to school more regularly. The Figure 5.32 below shows the
decrease in the absentee rate of teachers after road compared to the before road condition.
0
5
10
15
20
25
30
BR AR BR AR BR AR BR AR
Sonurle Parli Devulwadi Bhatwadi
No
. o
f R
esp
ond
ents
Decrease in Drop out rate and Absentee Rate for
Children
Yes No
0
5
10
15
20
25
30
BR AR BR AR BR AR BR AR
Sonurle Parli Devulwadi Bhatwadi
No
. o
f R
esp
ond
ents
Decrease in Absentee Rate for Teachers
Yes No

207
Figure 5.104 Decrease in absentee rate of teacher
5.7.42 Impact on Agriculture in Kolhapur district
5.7.42.1 Change in Farming Pattern
To get improved seeds and fertilizers farmers have to go to the market which is away from
their habitation and it was difficult for them to get those things during bad road condition. As
seen from the Figure 5.105 there is a change in the use of farm machinery, fertilizer and type
of seed in all the four sample villages for before road and after road condition. Most of the
farmers were using bullock carts, organic fertilizers and a local variety of seeds for farming
purpose before the construction of the road. But after road because of good accessibility to the
marketplace, most of the farmers were using tractors for ploughing land instead of bullock
carts, chemical fertilizers in place of organic fertilizers and hybrid seeds were sown in place of
locally available seeds.
Figure 5.105 Change in farm machinery usage, fertilizer usage, type of seed usage
5.7.42.2 Change in farm produce selling pattern i.e. direct to Mandi or middleman, to
reduce chain to get higher rate i.e. access to market
In all the habitations most of the farmers sell their farm produce to the middleman finding
difficulty in taking to the market on their own because of bad road condition and improper
transport facility. From this farmer used to have less information about the market price
variations. After getting good accessibility to marketplaces and ease of travelling they are now
taking their farm produce to the markets on their own and getting a good price for their farm
products. The Figure 5.106 shows the change in farm produce selling pattern and access to
market facilities for all the four sample villages.
0
10
20
30
40
50
60
70
80
Traditional Machineries Organic
Fertilizers
Chemical
Fertilization
Local Seed Hybrid Seed
No
. o
f R
esp
ond
ents
Change in Farming Pattern
Before Road After Road
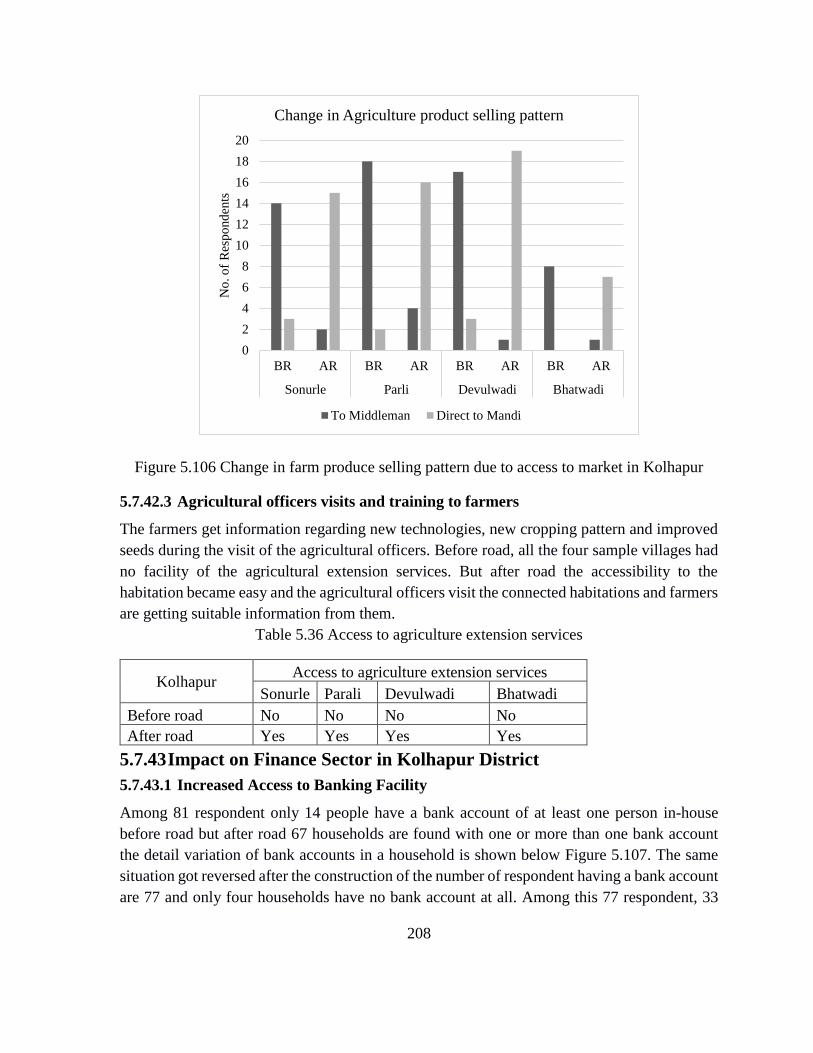
208
Figure 5.106 Change in farm produce selling pattern due to access to market in Kolhapur
5.7.42.3 Agricultural officers visits and training to farmers
The farmers get information regarding new technologies, new cropping pattern and improved
seeds during the visit of the agricultural officers. Before road, all the four sample villages had
no facility of the agricultural extension services. But after road the accessibility to the
habitation became easy and the agricultural officers visit the connected habitations and farmers
are getting suitable information from them.
Table 5.36 Access to agriculture extension services
Kolhapur Access to agriculture extension services
Sonurle Parali Devulwadi Bhatwadi
Before road No No No No
After road Yes Yes Yes Yes
5.7.43 Impact on Finance Sector in Kolhapur District
5.7.43.1 Increased Access to Banking Facility
Among 81 respondent only 14 people have a bank account of at least one person in-house
before road but after road 67 households are found with one or more than one bank account
the detail variation of bank accounts in a household is shown below Figure 5.107. The same
situation got reversed after the construction of the number of respondent having a bank account
are 77 and only four households have no bank account at all. Among this 77 respondent, 33
0
2
4
6
8
10
12
14
16
18
20
BR AR BR AR BR AR BR AR
Sonurle Parli Devulwadi Bhatwadi
No
. o
f R
esp
ond
ents
Change in Agriculture product selling pattern
To Middleman Direct to Mandi

209
respondent have two bank accounts in their house, 25 respondent have only one bank account,
11 respondent have three accounts in their house and 8 respondent have more than three bank
accounts in their house.
Figure 5.107 Improved access to Banking facility in a village
5.7.43.2 Status of arranging finance
The means of finance arrangement of respondents in sample habitations of Kolhapur district is
given in the Figure 5.108 below. Before road the less number of respondents borrowed money
and among them, more people took money from relatives and money lenders in the village.
After road construction, there is an increase in the number of respondents borrowing money
and mainly they are using bank facility for finance arrangement.
0
10
20
30
40
50
60
70
80
90
Having Bank
account
Without having
bank account
No
. o
f R
esp
ond
ents
Availability of Banking Facility
Before Road After Road
Number of Households Vs. No. of
Bank Accounts
0 1 2 3 >4
0 10 20 30 40 50 60
Bank
Money Lender within Habitation
Other than these two
No source
No. of Respondents
Status of Arranging Finance
After Road Before Road

210
Figure 5.108 Status of arranging finances in a village
5.7.44 Impact on Migration in Kolhapur District
5.7.44.1 Change in Type of Migration
The migration type may be seasonal or permanent depending upon the condition and facilities
available in the village. The migration of the inhabitants is seen often at the time when there is
no work in the agriculture field. There are also labourers who go in search of a job and work
for daily wages. From the Figure 5.109, it can be seen that the most of the migration is seasonal
in almost all the habitations for both before road and after road condition
Figure 5.109 Change in type of migration
5.7.44.2 Increase or Decrease in Migration
The migration of inhabitants is recorded both before and after road in Devulwadi and Bhatwadi
villages and there is no migration before the construction of the road in Sonurle and Parli
villages. Compared to the before road condition, the number of inhabitants migrating after road
in search of a job is increased in almost all the four sample habitations. There is more increase
in the migration of inhabitants in Devulwadi village and the other three villages also show an
increase in migration of inhabitants after road.
0
10
20
30
40
50
60
70
Temporary Migration Permanent Migration No Migration
No
. o
f R
esp
ond
ents
Change in Migration due to Road
Before Road After Road

211
Figure 5.110 Increase or decreasing migration
5.7.45 Impact on Living in Kolhapur District
5.7.45.1 Change in Type of House
With the change in accessibility to the village it’s easier to bring new materials for building a
house and people get rid of the use of local material. In Kolhapur district, there were 36 houses
Half Pucca and 39 houses were Kachha and only six houses were Pucca. The same situation
changed after the construction of road increasing Pucca house to 19 from six and reducing
Kachha houses to 26. There is no change in a number of Half Pucca houses recorded in
Kolhapur district.
Figure 5.111 Change in type of house before and after road construction
0
10
20
30
40
50
60
Before road After road
No
. o
f R
esp
ond
ents
No. of People Migrating
0
10
20
30
40
50
60
Kacha Pucca Half pucca
No
. o
f R
esp
ond
ents
Change in Type of House due to road
Before Road After Road
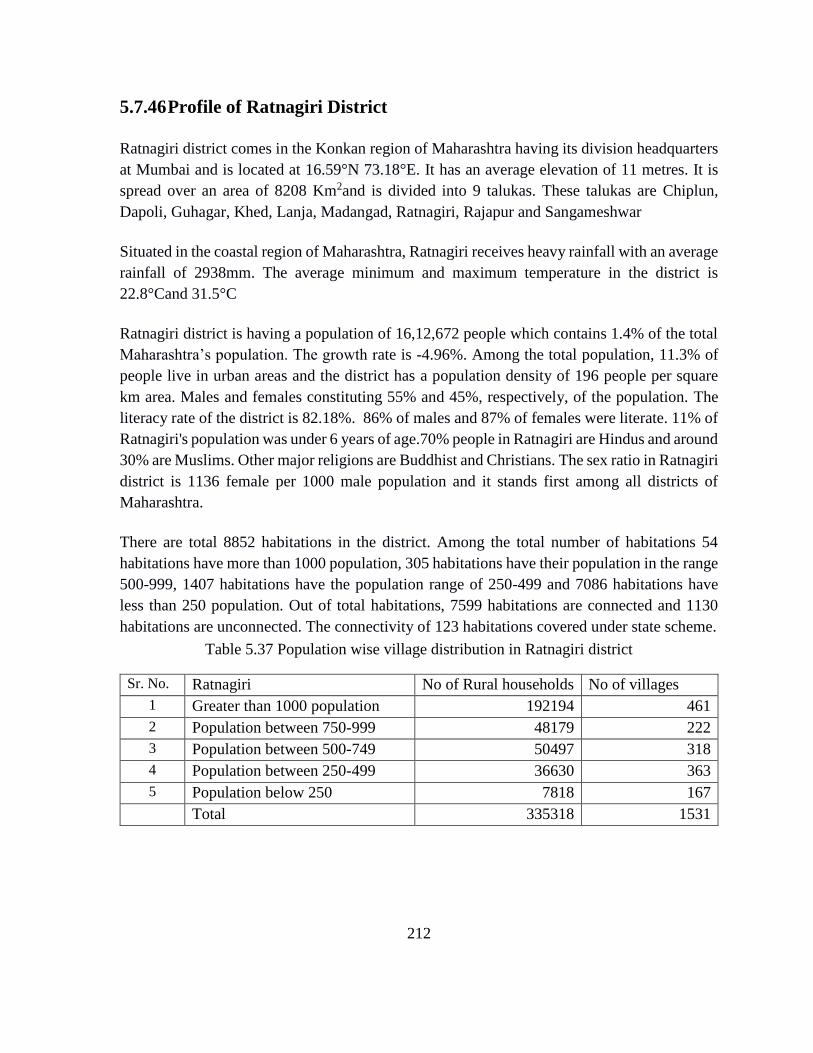
212
5.7.46 Profile of Ratnagiri District
Ratnagiri district comes in the Konkan region of Maharashtra having its division headquarters
at Mumbai and is located at 16.59°N 73.18°E. It has an average elevation of 11 metres. It is
spread over an area of 8208 Km2and is divided into 9 talukas. These talukas are Chiplun,
Dapoli, Guhagar, Khed, Lanja, Madangad, Ratnagiri, Rajapur and Sangameshwar
Situated in the coastal region of Maharashtra, Ratnagiri receives heavy rainfall with an average
rainfall of 2938mm. The average minimum and maximum temperature in the district is
22.8°Cand 31.5°C
Ratnagiri district is having a population of 16,12,672 people which contains 1.4% of the total
Maharashtra’s population. The growth rate is -4.96%. Among the total population, 11.3% of
people live in urban areas and the district has a population density of 196 people per square
km area. Males and females constituting 55% and 45%, respectively, of the population. The
literacy rate of the district is 82.18%. 86% of males and 87% of females were literate. 11% of
Ratnagiri's population was under 6 years of age.70% people in Ratnagiri are Hindus and around
30% are Muslims. Other major religions are Buddhist and Christians. The sex ratio in Ratnagiri
district is 1136 female per 1000 male population and it stands first among all districts of
Maharashtra.
There are total 8852 habitations in the district. Among the total number of habitations 54
habitations have more than 1000 population, 305 habitations have their population in the range
500-999, 1407 habitations have the population range of 250-499 and 7086 habitations have
less than 250 population. Out of total habitations, 7599 habitations are connected and 1130
habitations are unconnected. The connectivity of 123 habitations covered under state scheme.
Table 5.37 Population wise village distribution in Ratnagiri district
Sr. No. Ratnagiri No of Rural households No of villages
1 Greater than 1000 population 192194 461
2 Population between 750-999 48179 222
3 Population between 500-749 50497 318
4 Population between 250-499 36630 363
5 Population below 250 7818 167
Total 335318 1531

213
5.7.47 Sample Size
As per our sampling criteria, we have selected four roads in Ratnagiri district. The details of
roads selected along with the population size and number of households is given in the Table
5.38 below. Out of four roads two roads in Fungus and Digani village are new connectivity
and two in Dhamapur and Ramanewadi are upgradation.
Table 5.38 Sample roads for socioeconomic evaluation in Ratnagiri District
Sr.
no Block Road Name
Village/
Habitation Population Households Sample
1 Sangamesh
war
Pochari to
Fungus
Fungus,
Chalkewadi 674 135 6
2 Sangamesh
war
MDR 33
Dingani
Agarwadi
Khadewadi to
Guruvwadi
Agarwadi,
Kharandewa
di,
Guravwadi
195 39 14
3 Sangamesh
war
Dhamapur Tf
Sangmeshwar to
Bhayjewadi
Rautwadi
Bhayajewadi
, Bhudwadi 578 116 FGD
4 Guhagar Pacheri Agar
Ramnewadi Ramanewadi 539 108 FGD
Total 1986 398 20
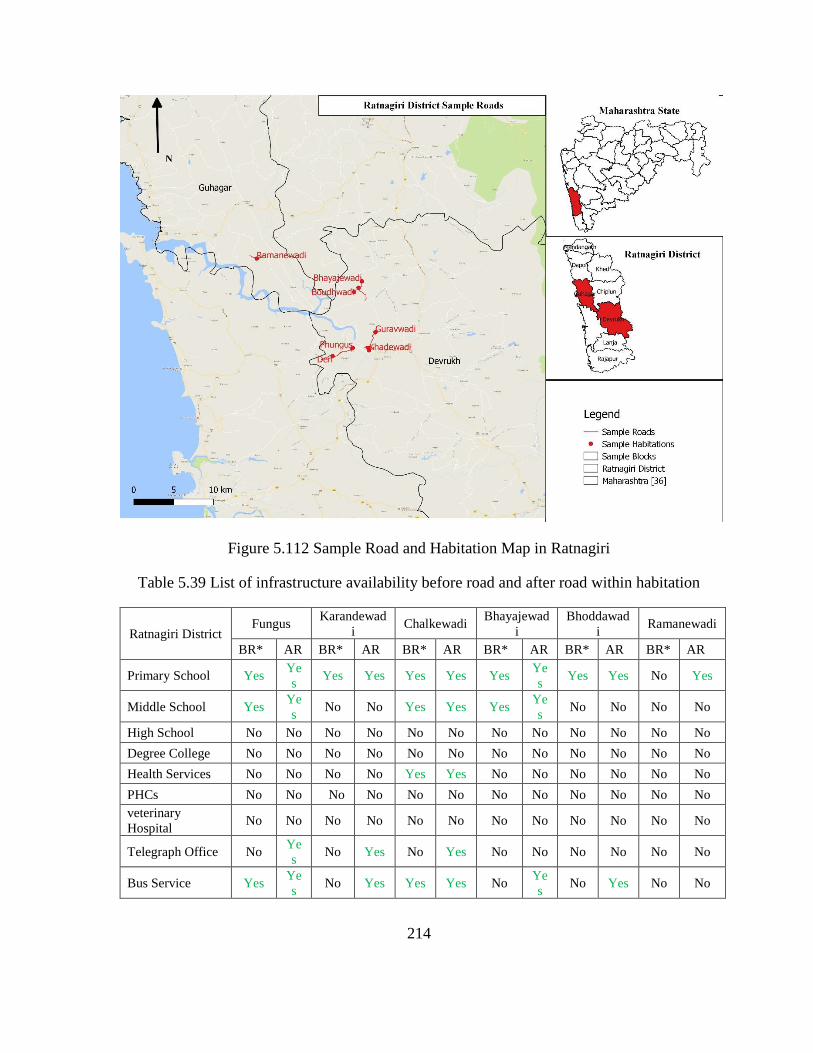
214
Figure 5.112 Sample Road and Habitation Map in Ratnagiri
Table 5.39 List of infrastructure availability before road and after road within habitation
Ratnagiri District Fungus
Karandewad
i Chalkewadi
Bhayajewad
i
Bhoddawad
i Ramanewadi
BR* AR BR* AR BR* AR BR* AR BR* AR BR* AR
Primary School Yes Ye
s Yes Yes Yes Yes Yes
Ye
s Yes Yes No Yes
Middle School Yes Ye
s No No Yes Yes Yes
Ye
s No No No No
High School No No No No No No No No No No No No
Degree College No No No No No No No No No No No No
Health Services No No No No Yes Yes No No No No No No
PHCs No No No No No No No No No No No No
veterinary
Hospital No No No No No No No No No No No No
Telegraph Office No Ye
s No Yes No Yes No No No No No No
Bus Service Yes Ye
s No Yes Yes Yes No
Ye
s No Yes No No
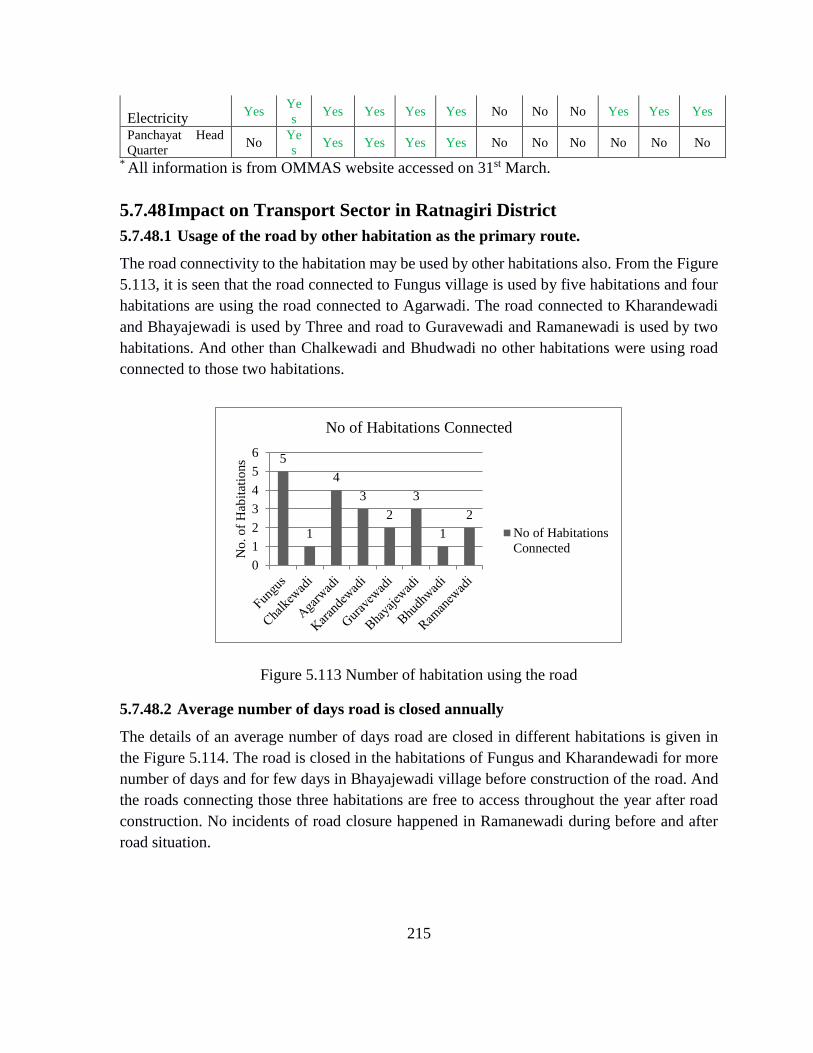
215
Electricity Yes
Ye
s Yes Yes Yes Yes No No No Yes Yes Yes
Panchayat Head
Quarter No
Ye
s Yes Yes Yes Yes No No No No No No
* All information is from OMMAS website accessed on 31st March.
5.7.48 Impact on Transport Sector in Ratnagiri District
5.7.48.1 Usage of the road by other habitation as the primary route.
The road connectivity to the habitation may be used by other habitations also. From the Figure
5.113, it is seen that the road connected to Fungus village is used by five habitations and four
habitations are using the road connected to Agarwadi. The road connected to Kharandewadi
and Bhayajewadi is used by Three and road to Guravewadi and Ramanewadi is used by two
habitations. And other than Chalkewadi and Bhudwadi no other habitations were using road
connected to those two habitations.
Figure 5.113 Number of habitation using the road
5.7.48.2 Average number of days road is closed annually
The details of an average number of days road are closed in different habitations is given in
the Figure 5.114. The road is closed in the habitations of Fungus and Kharandewadi for more
number of days and for few days in Bhayajewadi village before construction of the road. And
the roads connecting those three habitations are free to access throughout the year after road
construction. No incidents of road closure happened in Ramanewadi during before and after
road situation.
5
1
4
3
2
3
1
2
0
1
2
3
4
5
6
No
. o
f H
abit
atio
ns
No of Habitations Connected
No of Habitations
Connected

216
Figure 5.114 Average number of days the road is closed before and after road
5.7.48.3 Public transport facility availability
There is no bus service in any of the village connected by PMGSY roads except Fungus and
Chalkewadi as said by respondents before the construction of the road. After construction of
road, all habitations got public transport facility because of the good condition of road and ease
of travelling. The Figure 5.115 shows the availability of public transport facility for before and
after road condition.
Figure 5.115 Availability of Public Transport facility
0
10
20
30
40
50
Fungus Karndewadi Bhayajewadi Ramanewadi
No
. o
f D
ays
Average number of days road is closed annually
Before Road After Road
0
1
2
3
4
5
6
No
. o
f T
imes
Co
min
g t
o V
illa
ge
Public Transport facility
Before Road After Road

217
5.7.48.4 Increase in number of vehicles in the habitation
In all the habitations the use of two-wheelers has increased in a good amount after the
construction of the road. There is a much increase in the usage of two-wheelers by the
inhabitants of Fungus village. Also, there is an increase in the usage of two-wheelers after road
by the inhabitants of Karandewadi, Chalkewadi, Bhayajewadi, Bhoddawadi and Ramanewadi.
The Figure 5.116 shows the increase in a number of two-wheelers for before road and after
road condition.
Figure 5.116 Increase in two-wheelers in the habitations
5.7.48.5 Increased participation of females for going outside village for different
purposes.
The increase in participation of females is given for Fungus and Khadewadi villages in the
Figure 5.117. In the remaining two villages group discussion was carried out and the
information was collected from the respondents involved in the discussion. Both in Fungus
and Khadewadi villages there is an increase in the participation of female is found after the
construction of the road. Also from group discussion, we came to know females were
participating in all the activities actively after road compared to the before road condition.
0
5
10
15
20
25
30
35
No
. o
f T
wo
Whee
lers
Increase in No. of Two Wheelers
Before Road After Road

218
Figure 5.117 Increased participation of females in going outside village
5.7.49 Impact on Health Sector in Ratnagiri District
5.7.49.1 Change in Cooking Energy pattern and access to clean energy.
Most of the households were using firewood as the energy for cooking before road as it is
locally available. However, some households were using LPG before the road. But after road,
there is a considerable change in the fuel usage. The households previously using firewood as
cooking energy changed to LPG and some households were using both firewood and LPG and
the cooking fuel. Change in cooking energy pattern for the sample district Ratnagiri is shown
in the Figure 5.118 below.
0
2
4
6
8
10
12
14
16
BR AR BR AR
Fungus Karandewadi
No
. o
f F
emal
e P
arti
cip
atio
n
Participation of Females in going outside village
Only Male Both Male & Female
0
2
4
6
8
10
12
14
16
18
20
Firewood LPG Both
No
. o
f R
esp
ond
ents
Change in Cooking Energy Pattern
Before Road After Road

219
Figure 5.118 Change in cooking energy pattern
5.7.49.2 Increase in frequency of Health workers and doctors in the habitation.
Doctor and nurse were not coming to Fungus and Agarwadi habitations before road whereas
Asha workers are staying in the habitation before and after the road construction. There is a
change in the two habitations after the road that frequent visit of doctor and nurse is noticed in
Agarwadi village and the visit of the nurse is noticed in Fungus village. Also from group
discussion, we got to know that very rarely health workers and doctors visit Bhayajewadi and
Ramanewadi habitations before the road. And after the road construction, the inhabitants of
both the villages are moving out of the habitation to get treatment facility for minor illness.
Table 5.40 Trip of Health Workers and Doctors in the Habitation
Trip Of Doctor, Nurse And Asha Worker Per Month
BR AR
Fungus
Doctor No No
Nurse No 2
Asha Workers Within Habitation Within Habitation
Agarwadi
Doctor No 2
Nurse No 2
Asha Workers Within Habitation Within Habitation
5.7.49.3 Immunization facility and status of immunization
Immunization facility is provided to children in all the four sample habitations before and after
road. The Figure 5.119 shows immunization provided in villages of Fungus and Agarwadi. In
Fungus village there is no change recorded for before road and after road condition. And in
Bhayajewadi and Ramanewadi villages also inhabitants in the group discussion told that child
immunization has increased after road as compared to the before road condition.

220
Figure 5.119 Immunization facility and status of immunization
5.7.49.4 Special incidents happened due to no road or bad condition of road
As reported by the respondents no incidents such as the death of a pregnant woman, the death
of a new born baby have occurred in all the four sample habitations of Ratnagiri district because
of the bad condition of the road.
Table 5.41 Special incidents happened due to bad condition of road
Sr.No. Special incidents happened New-born baby dead Pregnant woman dead
1 Fungus No No
2 Agarwadi No No
3 Bhayajewadi No No
4 Ramanewadi No No
5.7.49.5 Ambulance coming to the village or not.
The detail of ambulance availability for all the habitation before and after the road is given in
Table 5.42 below. None of the habitation was having ambulance facility before road at the time
of emergency. After the construction of road except for Guruvewadi and Bhudhwadi all other
habitations got the ambulance facility at the time of emergency.
Table 5.42 Status of Ambulance coming to Habitation.
Sr. No. Name of Habitation Before Road After Road
1 Fungus No Yes
2 Chalkewadi No yes
3 Agarwadi No Yes
0
2
4
6
8
10
12
14
Yes No Yes No
Fungus Karandewadi
No
. o
f R
esp
ond
ents
Immunization given to child
Before Road After road

221
4 Karandewadi No Yes
5 Guravewadi No No
6 Bhayajewadi No Yes
7 Bhudhwadi No No
8 Ramanewadi No Yes
5.7.50 Impact on Education Sector in Ratnagiri District
5.7.50.1 Usefulness of Road in Improvement in Access to Education
In the Figure 5.120 improved access to education in Fungus and Agarwadi habitations is given.
It is seen that 100 % of respondents in Fungus and 90% of respondents in Agarwadi said yes
regarding improved access to education. Also from group discussion at Bhayajewadi and
Ramanewadi habitations, respondents said that there is 100% improvement in access to
education due to sample road.
Figure 5.120 Access to education due to sample road
5.7.50.2 Decrease in Dropout rate of students
The rate of students going to school increased considerably after road in Fungus and Agarwadi
sample villages as shown in Figure 5.121. In Bhyajewadi and Ramanewadi habitations also
there is a considerable increase in students going to school after road as told by the respondents
at the time of group discussion.
0
1
2
3
4
5
6
7
8
9
10
Yes No Neutral
No
. o
f R
esp
ond
ents
Improved access to educational facility
Fungus Karandewadi

222
Figure 5.121 Decrease in dropout rate and absentee rate of students
5.7.50.3 Decrease in absentee rate of teachers
After road construction, there is much reduction in the absentee rate of teachers and they are
coming to school more regularly. The Figure 5.122 shows the decrease in the absentee rate of
teachers after road compared to the before road condition for Fungus and Agarwadi
habitations, also there is a decrease in the absentee rate of teachers in Bhayajewadi and
Ramanewadi as said by respondents in a group discussion at each habitation.
Figure 5.122 Absentee rate of teachers
0
2
4
6
8
10
12
14
16
BR AR BR AR
Fungus Karandewadi
No
. o
f R
esp
ond
ents
Decrease in Drop out rate and Absentee Rate for
Children
Yes No
0
2
4
6
8
10
12
14
16
BR AR BR AR
Fungus Karandewadi
No
. o
f R
esp
ond
ents
Decrease in Absentee Rate for Teachers
Yes No

223
5.7.51 Impact on Agriculture in Ratnagiri District
5.7.51.1 Change in Farming Pattern
As seen from the Figure 5.123 there is a change in the use of farm machinery, fertilizer and
type of seed in Fungus and Khadewadi villages for before road and after road condition. Most
of the farmers were using bullock carts, organic fertilizers and a local variety of seeds for
farming purpose before the construction of the road. But after road because of good
accessibility to the marketplace, most of the farmers were using tractors for ploughing land
instead of bullock carts, chemical fertilizers in place of organic fertilizers and hybrid seeds
were sown in place of locally available seeds. And from group discussion in Bhayajewadi and
Ramanewadi respondents told that farm machinery and improved seeds are not used for
farming, however, there is a change in use of fertilizers by the farmers.
Figure 5.123 Change in farm machinery usage, fertilizer usage, type of seed usage
5.7.51.2 Change in farm produce selling pattern i.e. direct to Mandi or middleman to
reduce chain to get higher rate and access to market
As the inhabitants of sample villages in Ratnagiri district have very less land for cultivation
the farm produce is sufficient for their use and the few inhabitants who have more land used
to sell sell their farm produce to the middleman before road finding difficulty in taking to the
market on their own. After getting good accessibility because of the good road they are now
taking their farm produce to the markets and getting a good price for their farm products in
Ramanewadi, Bhayajewadi, Agarwadi and Fungus villages. The Figure 5.124 shows the
change in farm produce selling pattern and access to market facilities for Fungus and Agarwadi
sample villages.
0
2
4
6
8
10
12
14
16
Traditional Machineries Organic
Fertilizers
Chemical
Fertilization
Local Seed Hybrid Seed
No
. o
f R
esp
ond
ents
Change in Farming Pattern
Before Road After Road
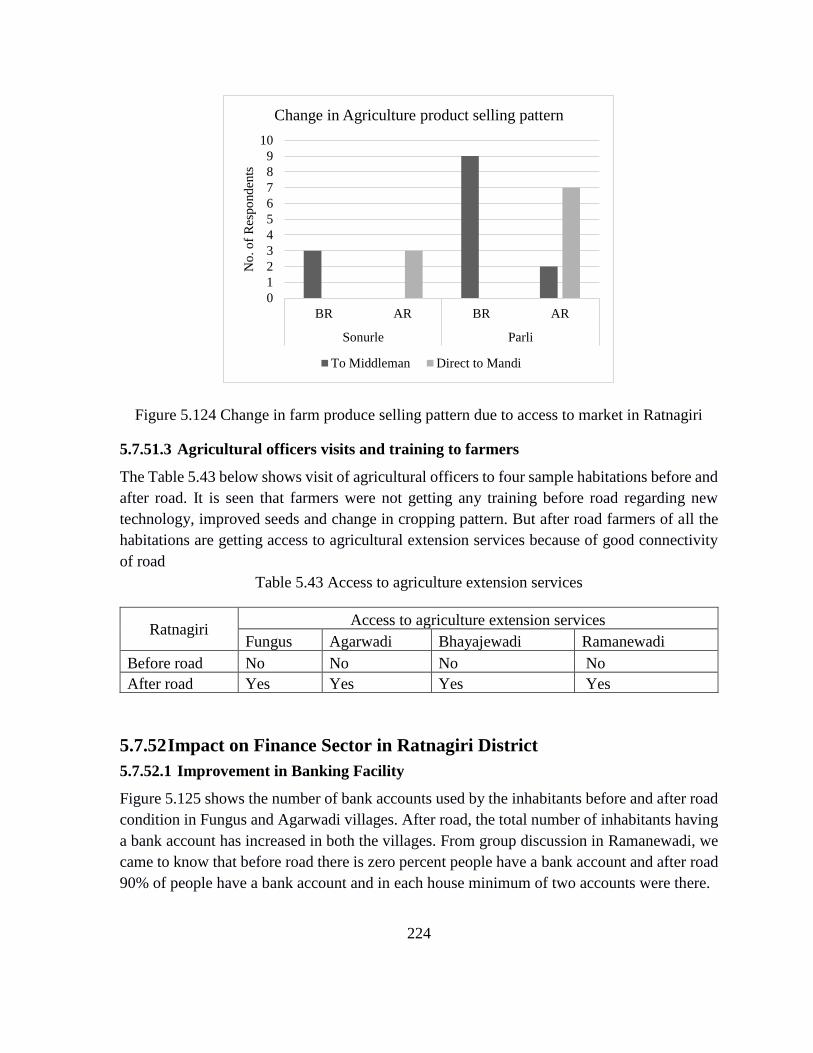
224
Figure 5.124 Change in farm produce selling pattern due to access to market in Ratnagiri
5.7.51.3 Agricultural officers visits and training to farmers
The Table 5.43 below shows visit of agricultural officers to four sample habitations before and
after road. It is seen that farmers were not getting any training before road regarding new
technology, improved seeds and change in cropping pattern. But after road farmers of all the
habitations are getting access to agricultural extension services because of good connectivity
of road
Table 5.43 Access to agriculture extension services
Ratnagiri Access to agriculture extension services
Fungus Agarwadi Bhayajewadi Ramanewadi
Before road No No No No
After road Yes Yes Yes Yes
5.7.52 Impact on Finance Sector in Ratnagiri District
5.7.52.1 Improvement in Banking Facility
Figure 5.125 shows the number of bank accounts used by the inhabitants before and after road
condition in Fungus and Agarwadi villages. After road, the total number of inhabitants having
a bank account has increased in both the villages. From group discussion in Ramanewadi, we
came to know that before road there is zero percent people have a bank account and after road
90% of people have a bank account and in each house minimum of two accounts were there.
0
1
2
3
4
5
6
7
8
9
10
BR AR BR AR
Sonurle Parli
No
. o
f R
esp
ond
ents
Change in Agriculture product selling pattern
To Middleman Direct to Mandi

225
Figure 5.125 Access to banking facility before and after road
5.7.52.2 Status of arranging finance
After road construction, a good access to nearby habitations and towns became possible using
own vehicles or by public transport vehicles. Because of this good access, most of the
inhabitants depend on banks which are situated in nearby towns and habitations for arranging
finance. The Figure 5.126 below shows various means of arranging finance by the households
in the sample villages.
Figure 5.126 Status of arranging finances
0
2
4
6
8
10
12
14
16
18
20
Having Bank account Without having bank
account
No
. o
f R
esp
ond
ents
Availability of Banking Facility
Before Road After Road
1
8
2
8
1
Number of Households Vs. No. of
Bank Accounts
0 1 2 3 >4
0 2 4 6 8 10 12 14 16
Bank
Money Lender within Habitation
Other than these two
No source
No. of Respondents
Status of Arranging Finance
After Road Before Road

226
5.7.53 Impact on Migration in Ratnagiri District
5.7.53.1 Change in Type of Migration
From the Figure 5.127, it can be seen that the type of migration is seasonal in all the habitations
and there is less number of inhabitants who are migrated permanently. After road construction
habitants feel easy in accessing the road for searching jobs in nearby habitations and towns.
Most of the people in all the four sample habitations migrate to Mumbai in search of a job.
Also from group discussion in Ramanewadi and Agarwadi migration of inhabitants was
recorded after the road construction.
Figure 5.127 Change in type of migration
5.7.53.2 Increase or Decrease in Migration
The Figure 5.128 shows a change in migration in Fungus and Agarwadi sample villages. After
construction of the road, there is an increase in the inhabitants going out of habitation mainly
to Mumbai city in search of a job. In Ramanewadi and Bhayajewadi habitations also it is
recorded that there is an increase in the migration after road construction.
0
2
4
6
8
10
12
14
16
18
Temporary Migration Permanent Migration No Migration
No
. o
f R
esp
ond
ents
Change in Migration due to Road
Before Road After Road

227
Figure 5.128 Change in migration
5.7.54 Impact on Living in Ratnagiri District
5.7.54.1 Change in Type of House
The type of house change in the sample habitations of Ratnagiri district before and after the
road is given in the Figure 5.129 below. Most of the households were living in kaccha houses
before road and very few habitations were living in Half Pucca houses. After the construction
of road number of households living in kaccha houses decreased by a good amount and there
is an increase in the number of households living in Pucca houses.
Figure 5.129 Change in-house type before and after road
0
5
10
15
20
25
30
Before road After road
No
. o
f R
esp
ond
ents
No. of People Migrating
0
2
4
6
8
10
12
14
16
18
Kacha Pucca Half pucca
No. of
Res
ponden
ts
Change in Type of House due to road
Before Road After Road

228
5.7.55 Profile of Palghar district
Palghar district comes in the Konkan region of Maharashtra having its division headquarters
at Mumbai and is located at 19.69°N, 72.76°E. It has an average elevation of 7 metres. It is
spread over an area of 5344 Km2 and is divided into 8 talukas. These talukas are Dahanu,
Jawhar, Mokhada, Palghar, Talasari, Vada, Vasai-Virar and Vikramgad.
Palghar has a tropical climate. When compared with winter, the summers have much more
rainfall. The average annual temperature in Palghar is 26.5°C and average minimum and
maximum temperature of 22.4°C and 30.6°C. As Palghar comes in the coastal regions, like
Ratnagiri it receives more rainfall. In a year, the average rainfall is 2101 mm.
Palghar district is having a population of 16, 46,714 people which contains 1.4% of the total
Maharashtra’s population. Among the total population, 52.9% are males and 47.1% are female.
The literacy rate of the district is 77.52%. The male literacy rate is 81.2% and the female
literacy rate is 73.35%.The majority of the population follows the Hindu religion with a sizable
portion of Jains, Buddhists and Muslims. There is also a small Christian and Sikh community.
There are total 4059 habitations in the district. Among the total number of habitations 153
habitations have more than 1000 population, 451 habitations have their population in the range
500-999, 755 habitations have the population range of 250-499 and 2700 habitations have less
than 250 population. Out of total habitations, 3540 habitations are connected and 519
habitations are unconnected.
Table 5.44 Population wise village distribution in Palghar District
Sr. No. Palghar No of Rural households No of villages
1 Greater than 1000 population 250175 543
2 Population between 750-999 22686 118
3 Population between 500-749 16401 121
4 Population between 250-499 8027 93
5 Population below 250 815 22
Total 298104 897
5.7.56 Sample Size
As per our sampling criteria, we have very few new connectivity roads in Ahmednagar district
thus we have selected following roads and villages.
Table 5.45 Sample roads for socioeconomic evaluation in Palghar district

229
Sr.
no
Block Road Name Village/
Habitation
Populatio
n
Househol
ds
Sample
1 Palghar NH 8 to Bahirifonda Jayshet 644 129 GD
2 Palghar Valve to Chipatpada Road Chipatpad
a
418 84 GD
3 Jawhar SH 28 to Sagpani Pachgud
Road
Pachabud 262 52 GD
4 Jawhar Jamsar - Kharvand Nyahale
BK to SH 30 Road
Radhanag
ari
330 66 GD
Total 1654 331
Figure 5.130 Sample Road and Habitation Map in Palghar
Table 5.46 List of infrastructure availability before road and after road within habitation
Palghar District Jayshet Chipatpada Pachabud Radhanagari
BR* AR BR* AR BR* AR BR* AR
Primary School Yes Yes No No Yes Yes Yes Yes

230
Middle School No No No No No No No No
High School No No No No No No No No
Degree College No No No No No No No No
Health Services No No No No No No No No
PHCS No No No No No No No No
veterinary Hospital No No No No No No No No
Telegraph Office No No No No No No No No
Bus Service No No No No No No No No
Electricity No Yes Yes Yes Yes Yes Yes Yes Panchayat Head
Quarter No No No No No No No
No * All information is from OMMAS website accessed on 31st March.
5.7.57 Impact on Transport Sector in Palghar District
5.7.57.1 Usage of the road by other habitation as the primary route.
Figure 5.131 Number of habitation using the road
The Figure 5.131 shows a total number of habitations using the constructed road. The road
connected to Radhanagari and Jayshet shows the highest number of habitation using this road.
Two habitations in Chipatpada and one habitation in Pachbud were using the road after
construction.
0
1
2
3
4
Jayshet Chipatpada Pachbud RadhanagariNo
. o
f H
abit
atio
ns
No of Habitations Connected

231
5.7.57.2 Average Number of days road is closed annually
Figure 5.132 Average number of days the road is closed before and after road
There was no road to three of the habitations and one habitation i.e. Radhanagari which is close
to the highway and it has connectivity before upgradation. The roads in all the remaining
habitations were closed for around 10 to 30 days during monsoon. As the roads were kachha
it was very difficult to drive any vehicle on such vehicle during monsoon but after the
construction of roads through PMGSY the roads are accessible in the all-weather using vehicle
as well as bicycle. The road to Chipatpada still remains closed for 4-5 days depending on the
intensity of monsoon due to submerged CD works.
5.7.57.3 Public transport facility availability
There is no public transport facility available in any of the habitation till date. However; for
the Habitations like Radhanagari and Thakurpada the State Bus is coming to nearby habitation
which is within a 2km range. The benefit of this facility was not there before the construction
of the road.
5.7.57.4 Increase in number of vehicles in the habitation
Figure 5.133 Increase in number of two-wheelers in the habitation
0
10
20
30
40
Thakurpada Chipatpada Pachabud Radhanagari
No
. o
f D
ays
Average number of days road is closed annually
Before Road After Road
0
5
10
15
20
Thakurpada Chipatpada Pachabud RadhanagariNo
. o
f T
wo
Whee
lers
Increase in Two wheelers in the habitations
Before Road After Road

232
The Palghar district is a most tribal block in Maharashtra. The habitations selected were very
much interior. No habitations have a single vehicle in the habitation before road except
Radhanagari which is 2km away from the highway to Nashik. There is a change in vehicle
numbers after the construction of the road. Tough the income is very fewer people from
habitation have purchased two-wheelers for ease of transportation and every habitation has at
least a small or mini auto or jeep for transportation. This change is occurred due to the
construction of the road. These vehicles serve as the emergency need of the village such as in
case of serious injury or sickness and helped in improving their status of health.
5.7.58 Impact on Health Sector in Palghar District
5.7.58.1 Change in Cooking Energy Pattern and Access to Clean Energy.
Figure 5.134 Change in cooking energy pattern
From the Figure 5.134 Pachbud has shown the least increase in usage of LPG after the
construction of road as the people using locally available wood for cooking purpose. And in
Chipatpada also there is little increase in usage of LPG and the people are using both Firewood
and LPG as the fuel for cooking after road. But in Radhanagari and Thakurpada there is
considerable increase in usage of LPG and some are using only LPG for cooking purpose.
5.7.58.2 Increase in frequency of Health Workers and Doctors in the Habitation.
Table 5.47 Trip of Health Workers and Doctors in the Habitation
Trip of Doctor, Nurse and ASHA worker per month
Before road After road
Thakurpada/
Jayshet
Doctor No No
Nurse No No
ASHA worker Within Habitation Within Habitation
Chipatpada
Doctor No 2 in six month
Nurse No 2
ASHA worker Within Habitation Within Habitation
75%
80%
85%
90%
95%
100%
105%
BR AR BR AR BR AR BR AR
Chipatpada Pachbud Radhanagari Thakurpada
Change in cooking energy pattern
Firewood LPG Both
233
Pachbud
Doctor No Yes
Nurse 1 2
ASHA worker No Within Habitation
Radhanagari
Doctor No 2 in six month
Nurse No 2
ASHA worker No No
5.7.58.3 Special incidents happened due to no road or bad condition of the road.
Table 5.48 Special incidents happened due to bad condition of road
Sr.No. Special incidents happened New-born baby dead Pregnant woman dead
1 Thankurpada/Jayshet No No
2 Chipatpada No No
3 Pachbud Yes Yes
4 Radhanagari Yes Yes
5.7.58.4 Status of Accessibility to Ambulance Facility
Table 5.49 Status of Ambulance coming to Habitation
Sr. No. Name of Habitation Before Road After Road
1 Jayshet No Yes
2 Chipatpada No Yes
3 Pachbud No No
4 Radhanagari No Yes
5.7.59 Impact on Education Sector in Palghar District
5.7.59.1 Usefulness of Road in Improvement in Access to Education
When it comes to improved access to education, all the tribal habitations are of 30-40
households spread over large area. There are no primary schools at each habitation. Particularly
in case of Bahirifonda the Jayshet dam has rehabilitated the village into smaller habitations
which were dispersed widely making small children difficult to go to school. There were no
Pucca roads to each and every habitation but PMGSY has made a significant difference in
improving their attendance in school. Every year teacher need to fetch student in the tribal area
by going to everyone’s house. But the roads have eased the teacher in collection of students
for the school for new admission as well as daily attendance. Previously there was no road to
Bahirifonda and teacher has to walk for 4-5 km to reach the school and on rainy days teacher
used to reach in the afternoon as recorded by one of the teacher from Jayshet itself. But now
every teacher can access the school using their own two wheelers. Similarly, in case of Pachbud

234
there is problem to reach out the teacher to school during monsoon but after road construction
there is no any difficulty in reaching there. This has reduced the absentee rate considerably. In
case of Chipatpada the school is not there in this habitation but it is in the nearby village and
there is a small river on the way thus still it is submerged Cross drainage work by PMGSY and
during heavy rain it get over flooded and thus the parent doesn’t allow the children to go alone
to school thus they need accompany of parent but no parent is there to accompany them as they
have already gone outside for employment. However, as compared to before road children
absentee rate has decreased considerably as recorded in Focused group discussion. In the
habitation Radhanagari the school is in Nhyahale which is at 2km away from habitation and
there was good road to village previously. This has not noticed any major changes in improved
education access after construction of the road.
5.7.60 Impact on Agriculture in Palghar District
5.7.60.1 Change in Farming Pattern
The land holding in the tribal habitation is very less i.e. around 90% habitants have less than
one acre of land. In all the four habitations surveyed there was no road to the habitations before
and thus people used to take fertilizers from a nearby access point on the head. But the
construction of the road has given access to vehicles and this has reduced the drudgery. But
there is no significant increase in crop yield has noticed the fertilizer use was there before
construction of the road.
5.7.60.2 Accessibility to Marketplaces
For Radhanagari and Chipatpada, the nearest road was at around 3km while for Pachbud and
Thakurpada the road connectivity before PMGSY road construction was at more than 3 km.
There was no accessibility to the marketplace before construction of a road to the habitations
through PMGSY. However, in order to purchase the goods for day to day life they have nearby
marketplaces where they used to go by walk but now a days every village have some passenger
vehicles such as tum-tum or mini Rickshaw. These vehicles are coming to village due to
construction of the road. But before construction of the road people used to walk till the next
large village up to where road access was there.
5.7.60.3 Change in farm produces selling pattern i.e. direct to Mandi or Middleman i.e.
Accessibility to market facility
The land holding in all the habitations is very less and they produce only small amount of rice.
Apart from rice there is no other crop in this area. The area is not irrigated and farming is only
dependent on monsoon. There is no double cropping and thus people don’t have excess
produce from farming. The productivity is not even enough to feed their family and thus there
is no need to sell the farm produce to any market. In all the four habitation there is no farm
produce to sell to market.

235
5.7.60.4 Increased Visits of Agricultural officers to Habitations
Table 5.50 Access to agriculture extension services
Ratnagiri Access to Agriculture Extension Services
Fungus Agarwadi Bhayajewadi Ramanewadi
Before road No No No No
After road Yes Yes Yes Yes
5.7.61 Impact on Migration in Palghar District
5.7.61.1 Change in Type of Migration
In all the four habitations in Palghar district Focused Group Discussion was held to understand
the impact of PMGSY roads on the life of the people in the habitation. Details scenario about
migration pattern was discussed with the people from habitations. All the habitations have
highest percentage of tribal people having very less land holding and as a survival option they
are labourer. But there are no labour opportunities in the habitations thus they have to migrate
to nearby areas such as Palghar industrial area or Virar in suburban Mumbai area or in Nashik
district as agriculture labourer in grapes farming. In the habitations such as Chipatpada and
Thakurpada people used to migrate to Palghar and Virar for employment and used to come
back weekly once to their own habitation. In Chipatpada people used to leave early in the
morning by 4 am to 5am for employment but after construction of the road they can ride on
bicycle or using private vehicle and the need not to leave in such early in morning. Now a days
they own bicycle and few own two wheeler. Their temporary migration has changed to daily
up down. While in case of the Pachbud and Radhanagari they still migrate seasonally. But he
frequency of coming home i.e. habitation has increased due construction of road and
availability of transport facility till nearby habitations. But road did not brought any
employment opportunity in the habitation.
5.7.61.2 Increase or Decrease in Migration
The tribal habitations visited have very small landholding capacity and their families cannot
survive on the income generated from such small farming and need assistance through
labouring. Thus after the monsoon, the young members of each and every family needs to
migrate to nearby cities like Palghar or Mumbai or Nashik in search of labour opportunity. In
the habitations like Pachbud and Radhanagari people used to migrate to Nashik grapes farming
as a labourer and in Nashik city. While the habitations nearer to the Palghar industrial area
move to the Palghar and Dahanu for a labour opportunity.
It was observed from the focused group discussion that the persons in Chipatpada habitation
used to travel to the city and come back once in a week but nowadays due to road public
transport bus is coming to the nearby village and people used to go daily instead of staying at
work location. Even previously few people used to travel to the nearby vehicular access point
by walk but this has replaced by bicycle nowadays reducing too much time.

236
5.7.62 Impact on Living in Palghar District
5.7.62.1 Change in Type of House
Figure 5.135 Change in House type in Palghar
Change in house type is observed after the construction of the road to habitations. In all the
four habitations group discussion was carried out in order to get the information regarding
changes happened in the habitation due to the construction of the road. Change in house type
was recorded from the people in a group discussion in the percentage form. The details about
the change in house type in each of the above habitations are shown in above chart. Being
tribal habitation with very less income the house types are majorly kachha before and after
road. However, there is a change in the type of house after the construction of a road from
kachha to half Pukka. As people are upgraded their houses to bricks and cement instead of mud
and stone or low-quality material for floor, roof and walls. The change is observed maximum
in Thakurpada as it is nearby to the highway.
0%
20%
40%
60%
80%
100%
BR AR BR AR BR AR BR AR
Chipatpada Pachbud Radhanagari Thakurpada
Change in Type of House in Palghar
Kachha Half Pakka
237
6 Summary and Recommendations
This Chapter provides a summary of the evaluation work carried out as well as gives certain
recommendations. The study was conducted in 7 districts of Maharashtra covering 9 agro-climatic
conditions, for 28 completed roads (14 new connectivity and 13 upgradation roads) involving 37
habitations and 6 ongoing roads during the period of March – October 2017. The Table 6.1 gives
the detailed list of the roads, villages, technical, social, financial and environmental data. For each
of the subsections a detailed summary is given below.
6.1 Technical Evaluation of PMGSY roads
6.1.1 Evaluation of on-going roads
Evaluation of on-goings works were done for 6 roads in 7 districts. The district of Ahmednagar
did not have any on-going roads. During the evaluation study it was found that the SQM formats
were adequate and the same were used to evaluate the roads. The SQM format contains 13 items
for inspection to grade the road. The detail results are given in Table 6.1. In additions the historical
data on number of SQM and NQM inspections were also studied to find their adequacy as per the
requirements. Following are the observations of this part of study:
1. Every district surveyed had a laboratory at district level setup by PMGSY with all necessary
equipment. The facility is used for all testing of PMGSY roads in the district as well as other
departments. This is a source of revenue for PIU at the district level.
2. Every laboratory has one dedicated engineer as in-charge, who was responsible for all the test
result’s verification. However, on interaction with few site engineers, it was found that, as
they know the test results acceptance range they just put the results or modify accordingly and
pass the tests. Few of the PIU engineer told that only two or three JE actually know the testing
and their standards while, the rest are unaware of the procedures for conducting the tests.
3. Most of the staff at PIU were Assistant Junior Engineer on a contractual agreement of six
months and almost all hold a diploma. There was no capacity building or training provided to
these contractual staff. NRRDA provides training only to permanent staff but not to
contractual staff.
4. Every project estimate needs to be verified by STA and on enquiring it was found that every
DPR was verified by concerned STA for each and every work.
5. As per the PMGSY guidelines, no payment would be released to the contractor until the field
laboratory is set up on-site with necessary equipments and as a part this quality arrangement
evaluation on all of the surveyed ongoing roads, an observation was made about the presence
of the laboratory. It was observed that for all the inspected works there was an independent
site laboratory established.

238
6. In Yavatmal, and Bhandara, site laboratories were set up for each road at the construction site
and in districts Kolhapur, Palghar, and Parbhani laboratory was setup someone's house in the
nearby village. However; during evaluation it was observed that most of the laboratories
equipment were arranged for the purpose of inspection and made available during SQM or
NQM inspection only so that the SQM/ NQM should not grade the item in “Quality
Arrangement” in inspection format as “U”. Even SQM and NQM also grade it as “S” though
they know about the equipment were not used for the test.
7. One of the reasons for setting the laboratory in someone house was that there was lack of
electricity which prohibits several tests which are dependent on electricity.
8. In order to evaluate the SQM’s quality inspection, two visits were made with SQM in the
districts Yavatmal and Palghar. It was found that there was slight flexibility in acceptance of
results though the results are not as per the required standards.
9. Of the 6 roads surveyed in this study using the SQM format, it was found that 5 roads were S
(satisfactory) while one road in Kolhapur was SRI (satisfactory requiring improvement). The
Kolhapur road (T14- Nandgaon Nagav Vadakshiwale Chuye To Kavannne Road (ODR186))
was SRI on account of four items, namely sub-base, shoulders, side drain and U
(unsatisfactory) on road furniture and markings. Thus, 83.3% of on-going roads surveyed in
this study were satisfactory.
10. In Kolhapur district, road visited was in progress and shoulders were not compacted yet. It had
rained the day before our inspection and hence, density tests were not conducted. The
thicknesses of different layers were found adequate but there was no proper embankment and
as it was sugarcane belt the low lying area was waterlogged. During the test pit due to improper
drainage on both sides, water was oozing out from test pit. Even the grading was also varied
too much from standards. And there was a need for improvement suggested by SQM and NQM
in alignment and embankment.
11. In case of Parbhani district for the on-going road surveyed, where all the observations were
made independently except test pit without the SQM accompanying, it was found that the roads
was just completed and all the set-up was moved by the contractor. As there was SQM visit
in the next 2-3 days, a separate test pit was not conducted as for the same road. It was found
that the quality of construction was good and all other items were graded as “S”. Subsequently,
the SQM also graded all the works as satisfactory and overall grading as satisfactory.
12. In case of Yavatmal district, one of the roads selected for study (inspected along with SQM)
failed in sieve analysis largely as the road built was at WBM layer and work had stopped from
last two years due to delay in fund release from NRRDA. The traffic on the road caused
variation in grading and accumulation of dust on the road. Thus, this road was not evaluated
as it was an outlier. However, it is important to note that on time release of funds is very
crucial for building good roads. In case of the second road (MRL22-MDR 38 To Beldari
Road), all the tests were satisfactory except that approximately 200 meters from the start of
road, near the village where the roads was concretised, where a sharp curve was present, there
239
was negative superelevation. It was observed that no SQMs or NQMs (5 SQM inspections
and 1 NQM inspection) has graded the road as U. However, the SQM who was accompanied
with in the current study suggested for improvement in superelevation. Moreover, there was
very less deviation for aggregate grading from standards and on discussion with SQM, it was
told that the issue was with the hand broken aggregates and hence was accepted as it is and
graded as satisfactory.
13. In Bhandara district, where the study did independent inspection (without SQM), it was found
that the quality of surface finish as very good and even grading was very close to the standards.
A little variation was there and this was due to compaction and traffic over this road after
construction. All the other tests were satisfactory. All the signboards CD works, and CC
drainages were satisfactory.
14. In Ratnagiri district the visited road (SH-167 Wadilimbu to Baudhwadi to VR1 Approach road)
was around one year old and it was observed that all other tests were satisfactory but at the
first test pit it was found that there was no proper thicknesses of layers, as it was already
compacted due to traffic for one year. Hence, a second test pit was taken to confirm the
thicknesses. The same difference in was observed in thickness layers in both the pits and the
grading of aggregates in Ratnagiri district also deviated slightly from the standards.
15. In Palghar district, the road visited was Vavar to Vangani (T05-Vavar Wangani Jamsar
Nyahale bk Sh 30 Nyahadi kh Adoshi Khodala Road) and it showed all the parameters
satisfactory except shoulders, which needed to be properly sloped before monsoon, which
contractor had agreed to do and instead of grading it as SRI or U, the SQM accepted it and
graded it as S. It was noticed that such type of bias happens in case of SQM but not in case of
NQM.
6.1.2 Evaluation of completed roads
1. Among the 28 roads surveyed, only four roads were within maintenance period while rest
of the roads were handed over to PWD. However, in Yavatmal, PMGSY PIU/MRRDA are
still maintaining the roads.
2. Due to budget constraint in Yavatmal’s PMGSY PIU/MRRDA, they has not been able to
restore the heavy damage caused due to excessive usage by sand mining trucks on Aloda
and Wandli road.
3. Of the 4 roads surveyed in Ahmednagar district, 3 were satisfactory and good in all aspects
except the road to Mungashi. On the road to Mungashi there was some pavement cracking
and pavement worn out near river bridge and at several sections. Also, as there are no
proper drains on both sides at several sections for the road Gundegaon to Dhawadewast,
there is the necessity of clearing drains though it is not a heavy rainfall area.

240
4. Roads in Parbhani were too old (between 7 and 11 years) and were not resurfaced after 5
years (end of maintenance period) and hence had a bad pavement condition. On Ithlapur
Deshmukh road there are no proper side shoulders due to unavailability of land.
5. A similar situation of pavements is there in the Yavatmal district where the age of the roads
is between 9 to 13 years especially the road Sonegaon to Wandli and Wagad (Bk) to
Rajivnagar which are not maintained properly. The Sonegaon to Wandli road of 1.75 km
which was built by PMGSY (total road length 3-3.5 kms, partly built by ZP/PWD) was
found to be in very bad shape except the approximately 0.7 km portion which PMGSY had
rehabilitated.
6. In Bhandara district all the 3 roads are in very good condition except Warthi road which
has a few potholes and rutting though few potholes were filled.
7. In Kolhapur district, all the 4 roads surveyed showed that the pavement condition is not
bad. Due to lack of land availability for side shoulders it was observed that the roads had
very small shoulders and side drains were not properly maintained. People in the district
are a reluctance to give land and there are no side drains as it is sugar belt of India.
8. Ratnagiri roads (4 numbers surveyed) were found 2 were in good condition. The road
connecting Devulwadi had damaged surface at most of the places while the Ramanewadi
road was totally warned out due to rainfall and needs resurfacing.
9. In Palghar district two roads are good in condition i.e. Radhanagari and Bahirifonda but
other two roads are bad in the condition in many aspects such as side shoulders, side drains
and road surface.
6.1.3 Evaluation of the pavement condition of the roads
1) The currently used method by PMGSY PIU is of Class 4 as per IRC standard and are very
subjective. Hence, the ASTM method for PCI rating (ASTM D 6433) was used in this
study. The ASTM method gives very detailed distresses and helps in addressing the
problem more accurately.
2) As per the ASTM method for PCI rating (ASTM D 6433) of the 20 roads (out of 28 roads
studied), it was found that only one road was in good condition having a PCI more than
85, while, six roads were in satisfactory condition (PCI ranging from 70 to 85). There are
3 roads whose PCI was below 25 and can be categorised as Serious while 5 roads are in
Fair category. Five roads can be categorised as poor and very poor as per ASTM’s PCI
rating.
3) Among the 39 sections studied for the 20 roads (see Table 6.1 for details), 10 sections were
found to be poor in condition, 21 sections were above poor grading i.e. fair, satisfactory
and good in condition. Out of the remaining eight sections which were below the poor
grading, 1 section failed and 4 sections serious and 3 were in very poor category.

241
4) The distresses that were dominating on PMGSY roads were ravelling and weathering
unlike the distresses like rutting, potholing, and cracking etc which are found in medium
or high volume roads.
5) It must be noted that in the ASTM D 6433 methodology, the weightage given to deduct
values concerning ravelling and weathering are not that much i.e. for 100% medium
ravelling gives only a deduct value of 45 while for 100% high ravelling it shows 78 deduct
value. Thus, signifying that a road with 100% ravelled with medium severity would still
have PCI of 55 which is ‘Fair’ and with high severity 100% ravelling road will have PCI
of 22 and categorised as serious but not failed. As for the PMGSY roads, the common
distresses are ravelling and weathering, and thus due to this flaw in the methodology, roads
distresses are judged more lightly.
6) Most of the rural roads failed more because of ravelling & weathering and not of other
distresses. This is because of ageing of the road surface & heavy rainfall and not because
of only traffic.
7) The frequency of data collection of pavement as mentioned in PMGSY guidelines was not
followed by Maharashtra as it is very difficult to collect and keep an inventory of the PCI
of all roads. The major constraints suggested by PIU are lack of fund, vehicles, manpower
and time. The PCI inventory which OMMAS has last maintained is of the year 2013-14
and which is not a true representation of road condition.
6.1.4 SQM and NQM Inspections
1. SQM and NQM inspection data is available on OMMAS in digital format from 2010 to
till date only in abstract form for a total number of 30,223 NQM and 1,63,220 SQM
inspection for all works in India. However; only 1,343 i.e. 4.4% of the NQM inspections
and 6,014 i.e. 3.7% were in Maharashtra state.
2. More focus was on ongoing works during SQM inspection with 49% of works inspected
by SQM in Maharashtra were ongoing and remaining three types of works (completed,
maintenance and bridge works) inspection contributes to 51%.
3. For the NQM inspection, out of total works inspected (30,223), 56% works were ongoing
works and remaining 44% works were other types such as completed, maintenance, and
bridge works.
4. Among the ongoing works inspected by NQM in Maharashtra, 69% works were
satisfactory in Maharashtra which was higher than average of 61% satisfactory for all the
remaining states. In case of SQM inspections on ongoing roads 75% of the works inspected
were satisfactory for Maharashtra as well as for all the remaining states.
5. SQM inspections on completed roads shows 92.9% of the works as satisfactory in
Maharashtra and only 0.7% as unsatisfactory

242
6. In case of SQM inspections on ongoing roads, only three districts viz. Nagpur, Nashik and
Jalgaon shows more than 90% inspections as satisfactory and the districts Solapur and
Buldhana have more than 10% inspection with grading as Unsatisfactory.
7. In case of NQM inspections on ongoing roads, the districts Ahmednagar, Nashik, and
Aurangabad shows highest number of satisfactory inspection results and Amravati,
Palghar, and Sindhudurga shows lowest number of Satisfactory inspections while
Aurangabad
8. Among the inspections on ongoing roads by SQM, 593 inspections were SRI graded and
122 inspections were U graded. The major items leading to “U” grading were “quality
arrangement “ and “Base course” contributing to more than 50% of U graded works. In
case of SRI graded inspections the items “quality arrangement”, “Setting out and working
drawing”, “Shoulders” and “side drain & catch water drain” contribute highest number of
times as U/SRI graded.
9. However in case of inspection on ongoing works by NQM the major items leading to U/SRI
grading were “Base course”, “Geometrics”, “attention to the quality” and “cross drainage
works”
10. The completed works inspected by SQM have 32 inspections were SRI and only 6 were U
graded. The recurrent items leading to SRI and U grading were “shoulders” and “road
furniture and markings”; however in case of NQM inspections the major items leading to
U/SRI grading were “Base course” and “road furniture and marking” while all other items
contribute equally for U graded inspections.
11. The SRI/U graded Maintenance works were high in case of SQM inspection and very less
in case of NQM and thus only SQM works were considered to find out recurring items
leading to SRI/U grading of works. Item no. 5-Maintanance of road signs and
whitewashing and re-fixing guard stones graded as SRI and contribute to more than 60%
SRI/U graded inspections and all other items contribute almost equally.
12. “Meri Sadak” an android app developed by for citizen feedback on pace and quality of
work has reported 67,642 number of feedback / complaint till the end of August’17 and the
user interface is easily accessible for rural citizens. Among these only 20,808 were
accepted and remaining were not related to PMGSY roads.
13. Maharashtra state showed better awareness about Meri Sadak and reported second highest
in using this app with 8,401 feedback / complaint but among these only 2,344 feedback
/complaint were valid and remaining were rejected because of incomplete information or
not related to PMGSY road.

243
6.2 Physical and financial progress evaluation
1. Maharashtra state has been allocated only 24,588 km of road length covering 9368
habitations. This is based on unconnected habitations provided by state as of 2001 as per
NRRDA guidelines. This may be due to the fact that though Maharashtra state has second
highest in population and is third highest in area, it also has the highest road length
coverage.
2. Maharashtra state shows 95.02% of physical completion of works as on 31st July 2017.
Maharashtra ranks 7th highest in physical completion of works sanctioned when compared
to other states.
3. Despite having large number of works, the physical completion was within reasonable
range and counts in top 12 states with more than 90% physical completion.
4. In Maharashtra, different districts show variation in physical completion of works
sanctioned till date with Akola and Buldhana having 100% physical completion of
sanctioned works under PMGSY-I.
5. There are five districts showing physical completion of less than 70% for PMGSY-I
sanctioned works viz. Nanded, Latur, Washim, Amaravati, and Chandrapur.
6. In case of PMGSY-II works, three districts namely Yavatmal, Osmanabad, and Latur have
100% completed works and all other districts completed more than 90% of work physically
except three districts Nashik, Nandurbar, and Gadchiroli.
7. Among sample districts, Ratnagiri and Bhandara have completed nearly 100% all works
sanctioned under PMGSY-I and PMGSY-II
8. Ahmednagar district has physical completion of all works in the range of 70% to 90%
completions except upgradation works sanctioned under PMGSY-I. Parbhani district has
physical completion of less than 80% for new connectivity roads under PMGSY-I and all
sanctioned roads under PMGSY-II.
9. Thirteen of the 34 districts showed over expenditure against sanctioned amount varying
from 100% to 142%. Yavatmal shows highest expenditure of 142% and Parbhani shows
120% while in all the remaining 11 districts expenditure is less than 110% for the works
sanctioned under PMGSY-I. The reason may the black cotton soil leading to over
expenditure.
10. Districts Nandurbar and Gadchiroli have less than 80% expenditure against sanctioned
amount for PMGSY-I works while all other districts shows expenditure in the range of
80% to 100%.
11. In case of PMGSY-II, only one district i.e. Nashik having highest over expenditure of
104% only i.e. only 4% extra and Nanded district shows lowest expenditure with 44%. Six
districts shows expenditure in the range of 60% to 64%, eight districts show expenditure
in the range of 70% to 80% and the remaining 17 districts show expenditure in the range
of 80% to 100%.

244
12. Average per kilometer cost for the new connectivity type road is Rs. 32.68 Lakh per km
and for upgradation work is Rs. 23.67 Lakh per km.
13. The average cost for upgradation type of roads is less as compared to most other states and
Maharashtra ranks 9th in minimum per km cost for upgradation type roads.
14. In case of new connectivity type of roads, Maharashtra has average per km cost in the
middle range as almost 15 states have higher average per km cost than Maharashtra and 13
states have.
15. The states Tripura and Arunachal Pradesh have highest per km cost and Karnataka and
Punjab have lowest per km cost of new connectivity type road construction.
16. However, in case of upgradation type of works, Jammu and Kashmir, Arunachal Pradesh,
and Tripura have the highest per km cost of construction with more than Rs. 60 lakh per
km and Goa and Sikkim have the least per km cost below Rs.10lakh per km.
17. In Maharashtra, Nandurbar and Dhule have the highest per km cost of construction, nearly
about Rs. 50 lakh per km for new connectivity type road and Palghar and Sindhudurga
have highest per km cost, nearly about Rs. 30 lakh per km for upgradation type of works.
18. The districts Hingoli and Parbhani show lowest per km cost for new connectivity type road
with cost of around Rs. 14 Lakh and for upgradation type of roads Hingoli and Beed district
record lowest per km cost of around Rs. 17 Lakh.
19. Among the sample districts, the average per km costs for PMGSY-II roads were higher
than those of PMGSY roads. Palghar district shows highest costs including CD work cost
and Bhandara district shows least per km cost for PMGSY-I and Parbhani district shows
highest cost per km and Kolhapur district shows least cost per km for PMGSY-II roads.
20. Financial spending on long span bridge is highest in Latur district with more than Rs. 60
crore and least in Ratnagiri and Palghar district. The highest percent was spent on the long
span bridge in the district Latur and Osmanabad with 32% and 31% of the total value of
proposal cost.
21. Research and Development projects were sanctioned in only 21 districts with highest
technology cost in Ahmednagar and Dhule with Rs. 1,423 lakh and Rs. 1,182 lakh
respectively. Buldhana and Thane districts implemented research and development
projects with least technology cost of Rs. 8 Lakh and Rs. Lakh respectively.
22. Highest length was covered by districts Nandurbar and Ahmednagar with research and
development technology.
23. Among the sample districts, Ahmednagar spent highest amount on upgradation type of
works and least amount was spent by Palghar.
24. However; in case of new connectivity type roads Palghar district spent highest amount and
Parbhani district spent least among sample districts.

245
6.3 Environmental Impact assessment Environmental impact assessment was carried out based on DPR quantities for a particular road.
As the rural roads are very small in length having very small impact on environment but cumulative
impact of PMGSY roads on environment would be significant. Thus, environmental impact was
calculated using a tool developed by CTARA, IIT Bombay which is completely based on quantities
executed or estimated whichever available. This tool calculates emissions based on quantities used
for the construction of roads. However; this tool doesn’t give accurate emissions as it is based on
estimated quantities, predicted traffic and not on actual executed quantities. In actual practice
traffic doesn’t grow at the rate of six percent on all the rural roads.
For old roads, getting DPR was a difficult task from most PIU due to unorganised documentation
and file system. From PIU like Parbhani, Ratnagiri and Bhandara the DPR and MB was received
well in time as they have well organised documentation and file system but from other PIU it took
too much time to get DPR and MB. Following are the highlights of cumulative environmental
impact of 28 roads based on the DPR.
6.3.1 Energy Usage in different phases of road’s life
1. The highest energy was used in the usage phase and the contribution of energy used was
calculated based on traffic survey at the time of estimate and projected traffic on the road
with the assumption of 6% annual growth as per IRC standards.
2. 65% of the energy was consumed in the usage phase of the roads life, 23% during
construction phase and only 13% during maintenance phase.
3. There is a slight difference in energy uses as per DPR and as per MB, particularly in the
construction phase of the road as the estimated items may vary and exceed or decrease
during construction.
6.3.2 Impact on Climate Change
1. Highest greenhouse gas emission affecting climate change was during the usage phase
of the road due to usage by different road users. The percentage contribution was
48.6%.
2. 28.7% of the Green House gas emission was during the maintenance phase and this
percentage can be reduced if the performance of the road was improved by quality.
3. During construction phase of road there was only 22.7% greenhouse gas emission.
4. The activity that contributes to highest greenhouse gas emission was on site
construction and maintenance phase contributing 99% of all emissions during
maintenance phase and 73% of all emissions during construction phase.
5. The activity that contribute least was production of materials during construction phase
and maintenance phase contributing to less than 3% in both phase.

246
6. There was variation of quantities executed with respect to estimated quantities and this
has led to 4% less emissions during construction and maintenance phase.
6.3.3 Impact on Terrestrial Acidification
1. Terrestrial acidification is measured in terms of kg equivalence of SO2 and the highest
contribution was during usage phase of the road’s life. The contribution during usage
phase of the road to terrestrial acidification was 55.3%.
2. Secondly, construction phase contribution was 35.2% and only 9.5% emissions were
during maintenance phase of road’s life.
3. During the construction phase and maintenance phase the activity site emission
contributes highest in emissions with 98% in maintenance phase and 73% during
construction phase.
4. Least emissions related to terrestrial acidification was released during production of
maintenance and construction
5. Least contribution towards terrestrial acidification was due to the material production
of construction and maintenance phase and the percent contribution is less than four
percent.
6. The variation in emissions calculated based on DPR and MB was observed during
transport of materials and placing on site during construction phase and the variation
were only 3% less with MB to that of using DPR quantities.
6.3.4 Impact on Marine Eutrophication
1. The highest contribution to the marine eutrophication was during the usage phase of
the road due to emissions by vehicles using the road. The percentage contribution was
47.8%.
2. The construction phase of the road has the second highest contribution to marine
eutrophication with 44.4% and maintenance phase has least contribution to the marine
eutrophication with only 7.8%.
3. During the construction phase and maintenance phase the activity site emission
contributes highest in emissions with 98% in maintenance phase and 73% during
construction phase.
4. Least contribution towards marine eutrophication was due to the material production
of construction and maintenance phase and the percent contribution is less than four
percent.
5. The variation in emissions calculated based on DPR and MB was observed only during
transport of materials and placing on site during construction phase and the variation
was only 2.7% less with MB to that of using DPR quantities.

247
6.3.5 Photochemical Oxidant Formation
1. Photochemical oxidant formation was majorly due to the emission during the usage
phase of the road. The percentage contribution during usage phase of the road to the
photochemical oxidant formation was 56.9%.
2. The second major phase of the road which contributes to the photochemical oxidant
formation was construction phase having 30.9% emissions of different potential gases
and lastly least contribution was during maintenance phase with 12.2% only.
3. Activities during placing of the road causes site emission which contributes highest
during construction and maintained phase with 98.6% of maintenance phase and 73.2%
of construction phase.
4. Least contributions towards photochemical oxidant formation was caused due to
production of materials during construction and maintenance phase with less than
5.5%.
5. There was little variation to percentage contribution during construction phase and
maintenance phase as per DPR data and MB data. MB data shows 4.3% less
contribution in the production & transportation of materials and site emission.
6.3.6 Particulate Matter Formation
1. Particulate matter formation occurs during construction phase. Particulate matters were
formed majorly during two activities i.e. material production and transportation of
material such as aggregates, cement, and sand. The highest contribution was during
construction phase with 96.9%.
2. Maintenance phase and usage phase contributes only 1.2% and 1.9% respectively and
negligible in comparison to the construction phase.
3. The highest percentage contribution was due to transportation of the materials to the
site during the construction phase. The percentage of transportation is 92%.
4. The variation in the percentage shown by the DPR quantities and quantities executed
during construction and maintenance phase with percentage contribution of less than
5% less with MB quantities.
6.3.7 Human Toxicity and Marine Ecotoxicity
1. The emissions related to Human toxicity and ecotoxicity were released during
production of materials such as bitumen while refining the petroleum products.
2. The contribution to human toxicity was 97.5% during construction phase with only
material production activity, only 2.5% during production of material for maintenance
phase and there was no contribution during usage phase of road’s life.
3. The contribution to marine ecotoxicity was 100% during production of materials during
construction phase only and there was not contribution during maintenance and usage
phase of road life.

248
4. The marine ecotoxicity caused due to such large number of roads is very small and is
0.1 mg equivalence of 1, 4, Dichloro Benzene which is very negligible.
6.3.8 Water Depletion and Fossil Fuel Depletion
1. About 99.4% of the total water was used at the time of material production during
construction phase of the road and remaining 0.6% during material production for
maintenance phase.
2. For the construction of the 26 roads only 20,915 cubic metres of water was utilised.
3. The overall 7,913 tonne of crude oil was used for the construction of the 26 roads
surveyed and fossil depletion was during production phase of the construction and
maintenance phase.
6.4 Socioeconomic evaluation of PMGSY roads Socioeconomic survey was carried out in 37 habitations in seven districts, which were selected for
evaluation using social science research methodology tools like structured interview and Focused
Group Discussion (FGD). Total of 440 household surveys were conducted, though in the Ratnagiri
and Palghar district only FGD was carried out as rainy season had started and individual surveys
were not possible.
Socioeconomic survey was conducted for finding out the indirect benefit of roads in the form of
social upliftment in various sectors. In the study, all types of habitations such as varying population
varying from 250 to over 1000 as per PMGSY guidelines, tribal and non-tribal, unconnected before
road and having bad connectivity before upgradation of road, were covered.
Socioeconomic study focused on the impact of road connectivity on the various sectors such as
health, education, agriculture, transportation, and livelihood. A questionnaire is prepared and
interviews were carried out with persons from a particular age group, person. Most of the questions
are perception based, defining condition in each sector before and after construction of the road.
6.4.1 Transport Sector
Construction of road in a village has transformed the mode of transportation to great extent. Many
habitations which were unconnected previously and connected through PMGSY i.e. the villages
benefitted with new connectivity showed change in mode of transportation from pedestrian to
vehicular, saving time and drudgery. Following are the observations made during the study with
respect to impact on transport sector.
1. Among the selected roads, 35% roads targeted for single habitations are used by two
habitations.
2. The percentage of roads that were used by three habitations is 30% and 19% roads are used by
four and more habitations

249
3. Only 16% were dead-end roads and serving connectivity to only one habitation.
4. Before the construction of PMGSY road twelve habitations i.e. 32% of the surveyed
habitations were inaccessible for more than 30 days a year, three habitations for 20 to 30 days
annually, ten habitation i.e. 24% were inaccessible for 10-20 days annually and three
habitations remained inaccessible for 10-20 days while remaining nine habitations i.e. 24%
were inaccessible for less than five days during year.
5. After the construction of PMGSY road, there was no road which is closed for more than 5 days
annually and hence no habitation is inaccessible. However, few roads reported 3-5 days closure
due to heavy rain as the cross drainage work structure is of a submerged type and in such heavy
rain, water flows over the bridge.
6. There were only five habitations i.e. 14% which had access to public transport facility before
the PMGSY road. Among these five habitations, one habitation had three trips per day of state
transport bus and four habitations had two trips daily and remaining 32 i.e. 86% habitations
didn’t have access to Public transport facility before the construction of PMGSY road.
7. After construction of PMGSY road, public transport facility is available in 24 i.e. 65%
habitations i.e. increased by 50% to that of previous condition.
8. In five i.e. 14% habitations which already had access to public transport facility, the frequency
has increased by twice after construction of PMGSY road.
9. As of now, four i.e. 11% habitations have public transport facility with more than four trips a
day, six i.e. 16% habitations with thrice a day, ten i.e. 27% habitations with twice a day, and
four habitations with once in a day, while remaining 13 i.e. 35% habitations are still deprived
of public transport facility.
10. There were only six i.e. 16% habitations with private transport facility before the PMGSY road
while remaining 84% habitations were dependent on either public transport or vehicles in the
nearby village.
11. After construction of the PMGSY road, there were only four habitations lacking any private
vehicle in the habitation. But private operators from nearby habitations can come to habitation
due to good road.
12. There is a significant increase in a number of private operators in the habitations after PMGSY
road. 22% habitations reflect an increase in private operator by one compared to before road,
and 40% habitations reflected an increase by two.
13. Six i.e. 16% habitations reported an increase in number of private vehicles as three compared
to before road situation and four i.e. 11% habitations reported an increase in number of private
transport vehicle by more than three.
14. In the sample size of 440, only 40 i.e. 9% households had female participation in outgoing (out
of habitation) activities before the construction of PMGSY road.
15. After construction of PMGSY road, the same percentage has increased to 88% i.e. 387
households reported that both female and male travelled out of habitation for different purposes
regularly.

250
16. Female participation was prevalent in habitations close to marketplace and with good road
connectivity, such as Chichal in Bhandara district, all the habitations in Parbhani district and
Bhoyarepathar in Ahmednagar district, before PMGSY road construction.
17. However, in tribal districts, there was no female participation reported before construction of
PMGSY road while on construction of the road there is an increase in participation of females
in activates that need going out of habitation.
6.4.2 Health Sector
In health sector, most of the respondents from villages which were unconnected before
construction of the road have responded with significant benefits of the road. Since before
construction of the road, when there were emergency cases like childbirth, people had to use old
traditional risky methods of delivery without presence of doctor, or in critical condition four to six
people carried the pregnant women to nearby hospital on homemade stretcher. Respondents stated
the major troubles faced by them before the road were delivery on way to the hospital, death of
pregnant women, and higher transportation cost for private vehicles. Even there was trouble in
getting private vehicles as no one was ready to drive on such bad road. Now the situation has
changed drastically due PMGSY road and there is no need to wait too long for private vehicle to
come from outside village as vehicles are available in habitation itself. Even ambulance also comes
in village when called through 108 toll free service, from the nearest Public Health Centre which
previously was reluctant to drive through such bad roads.
Construction of PMGSY roads has increased the frequency of visits of ANN and Doctors to
habitations and maintained regularity. Personally owned two wheelers increased drastically in
most of the habitations which helped in increase in visits to nearby hospital in case of minor illness.
The detailed reactions on health benefits due to PMGSY road collected from respondent are listed
below.
1. Being cheap and easily available, firewood was used by 88% i.e. 389 households as cooking
fuel before construction of PMGSY road and there were only 26 i.e. only 5.9% households
using LPG gas and 25 i.e. 5.6% households were using both LPG and firewood as cooking fuel
before the road
2. After construction of road and subsidised supply of LPG cylinders, the change in cooking
energy pattern was observed distinctly with reduction in percentage of households using
firewood as cooking energy from 88.4% to 51.6% i.e. change by 37%
3. Similarly, in case of Tribal Districts such as Palghar, the FGD, reported that no households
were using LPG before the road but after the road, 10% households were using LPG.
4. 81% respondent reported, there was immunization facility available and accessible by
inhabitants before the road.

251
5. After construction of the road, 86% of the respondent has reported access to immunization
facility to the child.
6. Only 15% respondent reported that there is still no access to immunization as they have to
approach to a nearby school which is not connected by PMGSY road.
7. Apart from immunization in schools through camps, habitations are not accessible to a
government hospital for immunizing new born child but due to aggressive health sector
policies and accessibility to road, ANN and ASHA workers are ensuring 100% immunization.
8. Four i.e. 11% habitations reported the death of an infant and three i.e. 8% habitations reported
death of pregnant women due to lack of access to medical facilities before the construction of
the road.
9. On construction of road, no habitation has reported any such cases of the special incident and
from respondents, and this positive impact of road has been specifically reported by
respondents as the biggest benefit of road to health.
10. Before construction of the road, only seven i.e. 18% habitations were accessible by an
ambulance and the remaining 82% were inaccessible by an ambulance which was one of the
major disadvantage to residents of the habitations in case of emergency.
11. After construction of the road, not only ambulance but private operators are willing to help in
case of emergency with reasonable fare.
12. The number habitations where ambulance is coming in case of emergency on calling to
government free calling number 108 is 34 i.e. 92% now.
13. Still, there are three i.e. 8% habitations where ambulance does not come in emergency cases
but the reason is the habitations are located far away and not bad or no road.
6.4.3 Education Sector
The benefit to education sector is seen in those habitations which were unconnected previously, as
they had no option except walking to school. In few habitations where school is distant away from
habitation, small kids’ absentee rate was high during the monsoon season. In the perception of
respondents, after construction of PMGSY road the absentee rate got reduced. Tribal households
are not clustered and school is located in one of the cluster away from other clusters where the
absentee rate was high but construction of the road has reduced student absentee rate. Similarly,
tribal districts like Palghar schools are far away from main road and teachers staying in nearby city
or town, didn’t reach on time to school when road was not there or condition of road was bad. But
now it was observed that the situation is improved and teachers have their own two wheeler using
which they can reach the school on time. Even in tribal habitations schools are only upto 4th grade
and after that students have to go to nearby village which was very difficult due to walking on such
roads, increasing dropout rate after 4th grade. But after construction of the road the dropout rate is
reduced and students are going to school using bicycle or walking on the road.

252
1. The 75% of respondent recorded positive impact of the road in improving access to the
educational facility.
2. Seventy i.e. 16% respondent replied with neutral response to the improvement of access to
education due to the road.
3. Only 9% i.e. 41 respondents replied that there is not much change in accessibility to education
due to PMGSY road and most of the respondent are from habitations which were connected
already and taken under upgradation works.
4. In tribal districts such as Palghar, two habitations i.e. Chipatpada and Radhanagari reported
very positive impact of the road in improvement of access to education. Because of road their
children started going to school regularly and even for further studies in a nearby town with
daily to and fro travel. However, the habitations which were far away from town such as
Pachbud reported very small change; primary school is located in habitations itself and no one
has gone for higher studies from that habitation.
5. Before construction of the road, the dropout rate was very high. 251 i.e. 57% respondent replied
that children were not used to going school daily and for further studies.
6. In the before road scenario, where there were no road at all, the teachers used to reach school
very late in the rainy season or absentee rate was there. But after the road, the absentee rate has
come down significantly.
7. 51% of the respondent replied that teachers did not come to school regularly before the
construction of the road and remaining 49% respondents reported that there was no absentee
rate before the road. Similar scenario was in the habitations which were easily accessible i.e.
in case of upgradation of the road.
8. After construction of the road, 93% of respondent reported that there is no absentee of teachers
and only 7% respondent i.e. 30 respondents have reported that there is still teacher absenteeism.
9. Only 189 respondent i.e. 43% have reported that there was no dropout rate as well as absentee
rate and remaining 57% respondent replied with absentee and dropout of students before the
construction of road.
10. In after road scenario, 90% of the respondent reported there is a decrease in the dropout rate of
student and decrease in absentee rate of student and only 45 i.e. 10% respondents have reported
still there is dropout rate and absentee rate of students.
11. There is significant change in dropout rate for girls as compared to before the road. Almost all
the girls used to dropout the school after primary school but after road, public transport has
become convenient and there is an increased number of girls going for further studies.
12. Using focused group discussion, it was observed that the dropout rate and absentee rate in tribal
block i.e. Palghar district have reduced significantly and children are going to school and for
further studies regularly.
253
6.4.4 Agriculture Sector
In districts such as Nagar, Parbhani, Yavatmal, Bhandara, and Kolhapur, where agriculture is
dominating and land holding per capita is large, PMGSY roads brought changes in agriculture
practices. But in case of habitations in Ratnagiri and Palghar district the land holding per capita is
very low which doesn’t produce sufficient output to sustain and there the road had no impact in
agricultural sector.
However, there is shift in use of fertilizers in most of the habitations from organic or animal manure
to chemical fertilizers and pesticides. Also, there is shift in use of hybrid seeds instead of using
traditional seeds conserved from farm produce. This has resulted in increased productivity to some
extent.
1. Before construction of the road, 98% of the respondent were using traditional methods for
farming and only 2% were using farm machinery.
2. After the road, the scenario got changed and only 15% of respondents are using traditional
methods and remaining 85% shifted to use of farm machinery.
3. Fertilizers used before the construction of road were organic i.e. the fertilizers obtained from
animals and farm waste. 75% households were using the organic and remaining 25% were
using chemical fertilizers.
4. The prevalence of fertilizer used has shifted from organic to chemical after the construction of
the road and currently, 85% households are using chemical fertilizers.
5. Before construction of the road, 84% household used to grow their own seeds in the farm and
used these for next year and only 16% of the households were using hybrid seeds.
6. Use of hybrid seeds has spread after construction of a road to 92% of households and only 8%
households were still using local seeds.
7. In case of tribal district like Palghar, the land holding is very less and only two habitations
which are near to highway or big town reported use of chemical fertilizers by 20-30%
households before road and remaining two habitations which were far away from highway or
big towns were using local seeds and organic fertilizers. The situation has not changes even
after construction of road in either groups.
8. Among the 440 respondents surveyed, 142 i.e. 32% respondents gave no response to
agriculture related questions due to very small landholding or no land holding at all.
9. Among remaining 298 respondents, only 61 i.e. 20.5% respondents were selling their products
direct to market before construction of the road and remaining 237 i.e. 79.5% were selling to
middleman.
10. After construction of the road, 272 among 298 i.e. 91.2% respondents reported farm produce
sale directly to market and only 26 i.e. 8.7% were selling to middleman.
11. There were only 5 habitations where agricultural officers used to visit before the PMGSY road
i.e. only 16% of the habitations had access to agriculture officers.

254
12. After construction of the road, the same number has increased to 32 i.e. 86%. Due to
construction of the road, the habitations were accessible to agricultural officers by private
vehicle or some other means and the frequency of agricultural officers’ visit increased.
13. Only five habitations are still not visited by agricultural officers despite having a road. The
habitations are far away in the forest and are very small.
6.4.5 Finance Sector
1. Before construction of the road, only 29% people had bank account in any of the banks but
after construction almost 90% of the people have their bank account.
2. Still after construction of road, there are few households who don’t have any bank account.
The percentage of such households is 10% and most of the households are from tribal
habitation which are far away from the main town.
3. The number of bank accounts held varies from one to eight in a family. There are 33% people
with only one bank account in their family.
4. There are 28% households having two accounts in their family, 18% with three and 11% of
households have more than three bank accounts in their family.
5. In case of tribal district like Palghar, the habitation was very remote and still they have 80%
bank account coverage in the habitation after construction of the road, which before the road
was less than 10%.
6. Before construction of the road, 302 i.e. 68% households had no source of arranging finances
but after construction, banking facility has come and the same percentage of no access to
arranging finances reduced to 80 i.e. 18% only.
7. Only 32 i.e. 7% respondents replied with bank as main source of arranging finances before the
road. Construction of the road provided accessibility to bank and people are having bank
accounts which helped them in arranging finances. Thus, after construction of the road, the
number of households having a bank as a source of finance arrangement has increased to 273
i.e. 62%.
8. In case of tribal district like Palghar, people are not aware and they do not approach the bank
for arranging finances for different reasons. But small change has occurred due to availability
of bank account as they are saving the money in the bank and using it in need.
6.4.6 Migration
1. There were 300 i.e. 68.2% households which did migrate before road but after road, the
accessibility has increased migration in the form of permanent or temporary and only 140
i.e.31.8% households reported no migration after construction of the road.
2. There were only 12 i.e. 2.7% households having permanent migration of some family members
before road while the same count has increased to 29 i.e. 6.5% after construction of the road.
The permanent migration is because of getting a good job in the nearby city or town.
255
3. There were 128 i.e. 29.1% households having temporary migration which is either for 2-4
months or weekly migration to nearby towns before construction of the road but after the
construction this number has increased to 271 i.e. 62%.
4. The respondents with temporary migration reported benefit of the road as they can come home
for weekly holidays from nearby town or city where they were working which previously was
not easily possible.
5. In case of tribal region like Palghar district where FGD was carried out, the migration has not
changed at all as there is no major town or city nearby for daily wage based labour. But one of
the habitation which was nearer to town has shown a change in migration pattern to daily
instead of weekly i.e. Chipatpada because of road construction.
6.4.7 Type of House
1. Before construction of the road, there were 261 i.e. 59% households having in Kachha house
which has reduced to 144 households i.e. 33% after construction of the road.
2. A similar situation was there in case of Pucca houses, only 51 i.e. 12% households were Pucca
before the road and after the construction of road, the number has increased to 142 i.e. 32%.
3. In case of Half Pucca households, before the road, there were 128 i.e. 29% households Half
Pucca which after road changed to 154 i.e. 35%.
4. But in case of tribal area like Palghar district, where instead of a household survey. FGD was
conducted 70-80 % households reported Half Pucca after road which before the road was zero
percent in all four habitations.
6.5 Recommendations 1. There is a necessity to reform the SQM format and make it graded on a scale of 1 to 5 or 1
to 10, with proper standards and acceptance limits so that there would be fewer chances of
bias which varies with SQM’s perception about acceptance of results that differs from
standards. SQM with field experience has a tendency to accept the variations while those
from academic experience tend to be strict. This variation can be represented in a better
way if the SQM grading is made on Likert’s scale or on one to ten scale with specification
of deviation from standards.
2. Reform in the item related to grading of material is needed as acceptance percentages for
test pit varies a lot in various regions. New acceptance criteria or new scale can be
developed based on region-specific material, geographical condition and compaction
methodology by collecting and analyzing actual test results found in each district.
3. There is no seriousness about on-site laboratory as equipment arrangement was made on
the day or one day before SQM and NQM visit in any districts. Most of the laboratories
were in someone’s house in the village on the road for mere showing purpose. The
equipment seems to be not used most of the times but still, SQM/NQM accept it as
256
satisfactory. Districts laboratories equipment were used for testing materials on the day of
SQM or NQM visit as the contractor's equipment was not capable of conducting the tests.
4. There are very few contractors who have their own engineers and it is necessary to make
policy for staff availability from contractor side who can stay on site and supervise. On
interaction with PIU of Parbhani and Ahmednagar, it was found that very few contractors
have their own engineer, rest all have only supervisors.
5. There is the necessity to know the health of such huge network in Maharashtra in terms of
PCI and need to be updated after minimum every two years with appropriate methodology.
6. Need to get rid of class IV methods i.e. subjective rating which is currently used in
PMGSY, and adaption of new techniques based on automated surveys such as Roughness
measuring devices, etc.
7. There is a need for capacity building of staff for PCI collection and rating at regional or
divisional level. This may include an introduction to distresses and their identification and
measures.
8. Even in current PCI rating methodology there is need to provide proper resources to collect
data for the whole network in the district.
9. There is a need for capacity building for assessing PCI of the core network which is used
as a predominant parameter in the prioritization of roads for upgradation in PMGSY.
10. EIA, PIU needs to maintain inventory of usage of equipment for various construction
activities. Also there is need to precise the maintenance activities in order get precise
environmental impact and for lifecycle assessment there is need to record annual traffic
count with respect to different types of vehicle so that environmental impact during uses
phase can be calculated
11. There is necessity to simplify the interface of Meri Sadak with visual demo by making
IVRS system in local language to avoid incomplete complaints and rejecting the complaint
if it is incomplete at the same instant.
12. The other way to avoid the feedback or complaints not related to PMGSY roads is by
constraining the user with GIS tagging (and acceptance if only the point is in the vicinity
of PMGSY road) or listing of only PMGSY road name as mandatory field.
13. There is the necessity to know the health of such huge network in Maharashtra in terms of
PCI and need to be updated after every two years with appropriate methodology.
14. Need to get rid of class IV methods i.e. subjective rating right now used in PMGSY and
adaption of new techniques based on automated surveys such as Roughness measuring
devices etc.
15. There is a need for capacity building of staff for PCI collection and rating at regional or
divisional level. This may include an introduction to distresses and their identification and
measures.
16. Even in current PCI rating methodology there is need to provide proper resources to collect
data for the whole network in the district.

257
17. Due to low maintenance budget for such huge network in Maharashtra maintaining and
reconstruction of whole networks is not possible for the state alone. Thus, there is a need
for continued support from the centre for development of rural roads so that the optimal or
core network can be kept in all-weather accessible condition.
18. After complete connectivity to all the habitations with population more than 500 through
PMGSY, there is need to focus on habitations with a population less than 500 and need to
be covered by PMGSY or Mukhya Mantri Gram Sadak Yojana (MMGSY) in the state.

258
Table 6.1Detailed results of the study

259
Annexures-I SQM format for Inspection of quality of PMGSY Roads
The SQM format is of 18 pages with detailed observation on various parameters under 13 number
of items. Following is the summarized format for items and sub-items of the work inspection.
(Source: http://pmgsy.nic.in/downloads/NQM%20Guidelines-07.pdf)
# Sub item for observation In case of work Awardable
Grades
Awarded
Grade
1 2 3 4 5
Item 1 - Quality Arrangements
Quality Arrangements On-going S/RI/U
Item Grading S/RI/U
Item 2 - Attention to Quality
a Maintenance of QC Registers On-going S/RI/U
b Verification of test results On-going/
Complete S/U
Item Grading S/RI/U
Item 3 – Geometrics
a Road way width
Ongoing or
complete
S/U
b Carriageway width S/U
c Camber S/U
d Superelevation & Extra Widening at
Curves S/U
e Longitudinal Gradient in case of road in
hilly/ rolling terrain.
Ongoing/
complete S/U
Item Grading S/U
Item 4 - Earth Work and Sub-grade in Embankment/ Cutting
a Quality of Material for Embankment/
Sub-grade Ongoing or
complete
S/U
b Compaction S/U
c Side Slopes and Profile Complete S/U

260
d
Stability and Workmanship of Cut Slopes
(in case of hilly/ rolling terrain) Ongoing or
complete
S/U
e
Adequacy of Slope Protection (in case of
high embankments/hilly/ rolling terrain) S/U
Item Grading S/U
Item 5 - Sub-Base
a Grain Size Ongoing or
complete
S/U
b Plasticity S/U
c Compaction Ongoing or
complete S/U
d Total Thickness of Layer Ongoing or
complete S/U
Item Grading S/U
Item 6 - Base Course – Water Bound Macadam
a Grain Size of Course Aggregate
Ongoing or
complete
S/U
b Plasticity of Crushable Aggregate used as
fillers S/U
c Adequacy of Compaction through
volumetric analysis. S/U
d Thickness of every layer of WBM. S/U
Item Grading S/U
Item 7 - Bituminous Layer – Premix Carpet (PMC)/ Surface Dressing (SD)
a Gradation of Aggregate Ongoing S/U
b Mixing Temperature of Mix. Ongoing S/U
c Laying Temperature of Mix. Ongoing S/U
d Thickness of layer Ongoing or
complete S/U
e Surface Evenness Ongoing or
complete S/U
Item Grading S/U

261
Item 8 – Shoulders
a Quality of material for shoulders Complete S/RI/U
b Degree of compaction Complete S/RI/U
c Camber. Complete S/RI/U
Item Grading S/RI/U
Item 9 - Cross Drainage Works
a
Quality of Material – Concrete, Stone/
brick masonry, Hume pipes including size
etc. Ongoing or
complete
S/RI/U
b
Quality of Workmanship such as
positioning of pipes, wing walls, cushion
over H Pipes etc. S/RI/U
Item Grading S/RI/U
Item 10 - Side Drain and Catch Water Drain
General quality of Side Drains/ Catch
Water Drains and their integration with
CDs.
Ongoing or
complete S/RI/U
Item Grading S/RI/U
Item 11 - CC/ Semi Rigid Pavements and Associated Pukka Drains
a Quality of Material – Concrete, Stone/
Concrete Block Pavement etc.
Ongoing or
complete S/U
b Strength of CC in Concrete Pavement/
Concrete Block Pavement S/U
c
Quality of Workmanship – Wearing
surface texture, Adequacy of setting of
concrete, Joints, Edges etc.
S/U
d Thickness of Layer S/U
Item Grading S/U
Item 12 - Road Furniture and Markings
a
Citizen Information Board, Main
Informatory Board, Quality and whether
fixed during construction.
Ongoing S/U

262
b
Logo boards, 200 m stones and Km
stones, quality and whether fixed after
completion.
Complete S/U
c Whether the information in boards is
given in local language.
Complete/
Ongoing S/U
Item Grading S/U
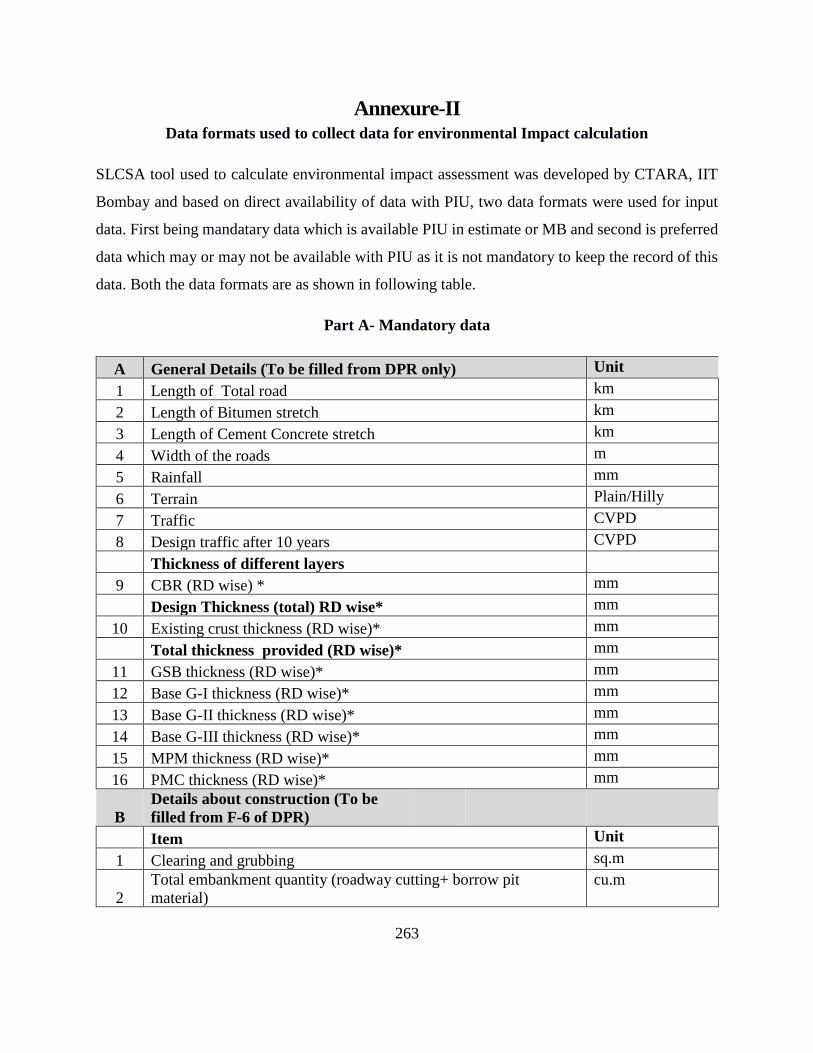
263
Annexure-II Data formats used to collect data for environmental Impact calculation
SLCSA tool used to calculate environmental impact assessment was developed by CTARA, IIT
Bombay and based on direct availability of data with PIU, two data formats were used for input
data. First being mandatary data which is available PIU in estimate or MB and second is preferred
data which may or may not be available with PIU as it is not mandatory to keep the record of this
data. Both the data formats are as shown in following table.
Part A- Mandatory data
A General Details (To be filled from DPR only) Unit
1 Length of Total road km
2 Length of Bitumen stretch km
3 Length of Cement Concrete stretch km
4 Width of the roads m
5 Rainfall mm
6 Terrain Plain/Hilly
7 Traffic CVPD
8 Design traffic after 10 years CVPD
Thickness of different layers
9 CBR (RD wise) * mm
Design Thickness (total) RD wise* mm
10 Existing crust thickness (RD wise)* mm
Total thickness provided (RD wise)* mm
11 GSB thickness (RD wise)* mm
12 Base G-I thickness (RD wise)* mm
13 Base G-II thickness (RD wise)* mm
14 Base G-III thickness (RD wise)* mm
15 MPM thickness (RD wise)* mm
16 PMC thickness (RD wise)* mm
B
Details about construction (To be
filled from F-6 of DPR)
Item Unit
1 Clearing and grubbing sq.m
2
Total embankment quantity (roadway cutting+ borrow pit
material)
cu.m

264
3 Material obtained from borrow pits for embankment cu.m
4 Cutting/Excavation (soil+ordinary rock) cu.m
5 Excavation (hard rock) cu.m
6
Unsuitable soil (total roadway soil cutting- roadway soil cutting
used in filling)
cu.m
7 Construction of subgrade and shoulders (borrowed material) cu.m
8 GSB cu.m
9 WBM cu.m
Wearing surface (BT)
10 Primer coat sq.m
11 Tack coat sq.m
12 MPM sq.m
13
Type of bitumen used Type 1 for bulk
and 2 for packed
14
Hot mix plant Type 1 for'on site'
and 2 for 'away
from site'
15 PMC (using hot mix asphalt only) sq.m
16 Seal coat sq.m
Cross drainage/CC gutter/protection works
17 PCC (M10 grade) cu.m
18 PCC (M15 grade) cu.m
19 PCC (M20 grade) cu.m
20 RCC pipes (any diameter and grade) m
21 Stone masonry in cement mortar cu.m
22 Cement concrete pavement cu.m
C Maintenance (To be filled from Format F-8 of DPR)
Item Unit
1 Restoration of rain cuts cu.m
2 Maintenance of shoulders (filling with fresh soil) sq.m
3 Maintenance of shoulders (stripping excess soil) sq.m
4 Repair to potholes(75 mm BM+ tack coat+ prime coat) cu.m
5 Patch repair (20 mm PMC+ seal coat) sq.m
D Traffic Survey
Type of motorized traffic Unit
1 Two wheelers No.
2 Cars and jeeps No.
3 Light motor vehicles (goods) No.
4 Trucks and lorries No.

265
5 Trailers and tractors No.
6 Bus No.
E Travel (During construction and maintenance)
1 Number of two wheelers No.
2 Average one way distance travelled to site km
3 Number of four wheelers No.
4 Average one way distance travelled to site km
5 Number of days of travel days
F Transport of materials ( to be filled from lead hart in DPR)
Material From To Mode Unit
1 Bulk bitumen Refinery Site Road km
2 Packed bitumen
Local
supplier Site Road
km
3 Bitumen emulsion
Emulsion
plant Site Road
km
4 Borrowed soil Borrow pit Site Road km
5
Aggregates (metal,
rubble, stone chips,
stone grit) Crusher Site Road
km
6
Hot mix plant away
from worksite HMA plant Site Road
km
8 Sand
Sand mining
quarry Site Road
km
7
RCC pipes for CD
work
Local
supplier Site Road
km
8 Cement
Local
supplier Site Road
km
9 Steel
Local
supplier Site Road
km
10 Water Water source Site Road km
11 Unsuitable soil Site
Dispo
sal
site Road
km

266
Part B- Preferred data
Activity and equipment used Engine
power
(hp)
Hours of
equipme
nt use
(hrs)
A Construction of BT road
1 Earthwork
1.1 Cutting and grubbing
Dozer (D-50)
Tractor with trolley (3t)
1.2
Construction of embankment (roadway cutting+ borrowed
material)
Dozer (D-50)
Tractor with grader
Water tanker (6kl)
Vibratory roller (80-100 kN)
1.3 Excavation in soil and ordinary rock
Hydraulic excavator (1 m3 bucket capacity)
1.4 Excavation in hard rock
Air compressor- 210 cfm
1.5 Construction of Subgrade and earthen shoulders
Tractor with grader
Water tanker (6kl)
Vibratory roller (80-100 kN)
2 GSB
Tractor with grader
Tractor with rotavator
Vibratory roller (80-100 kN)
Water tanker (6kl)
3 WBM
Vibratory roller (80-100 kN)
Water tanker (6kl)
4 Wearing surface (BT)
4.1 Prime coat

267
Hydraulic broom
Air compressor
Bitumen emulsion pressure distributor (driving unit+
air compressor)
Water tanker (6kl)
4.2 Tack coat
Hydraulic broom
Air compressor
Bitumen emulsion pressure distributor (driving unit+
air compressor)
4.3 Modified Penetration Macadam
Static roller (80-100 kN)- rolling done two times
Fuel for heating bitumen
Bitumen pressure distributor (driving unit+ air
compressor)
4.4 PMC (using hot mix asphalt only)
Paver finisher
Static roller (80-100 kN)
4.5 Seal coat
Fuel for heating bitumen
Bitumen pressure distributor (driving unit+ air
compressor)
Static roller (80-100 kN)
Water pump
5 Cross drainage/CC gutter/protection works
5.1 PCC (all grades)
Concrete mixer (0.4 m3 capacity)
Water tanker (6kl)
Water pump
B Maintenance of BT road
1 Restoration of rain cuts
Static Roller (80-100 kN)
Water tanker (6kl)
2 Patch work on repaired potholes
Static Roller (80-100 kN)
Water pump
C Construction of CC pavement
1 Earthwork
Cutting and grubbing
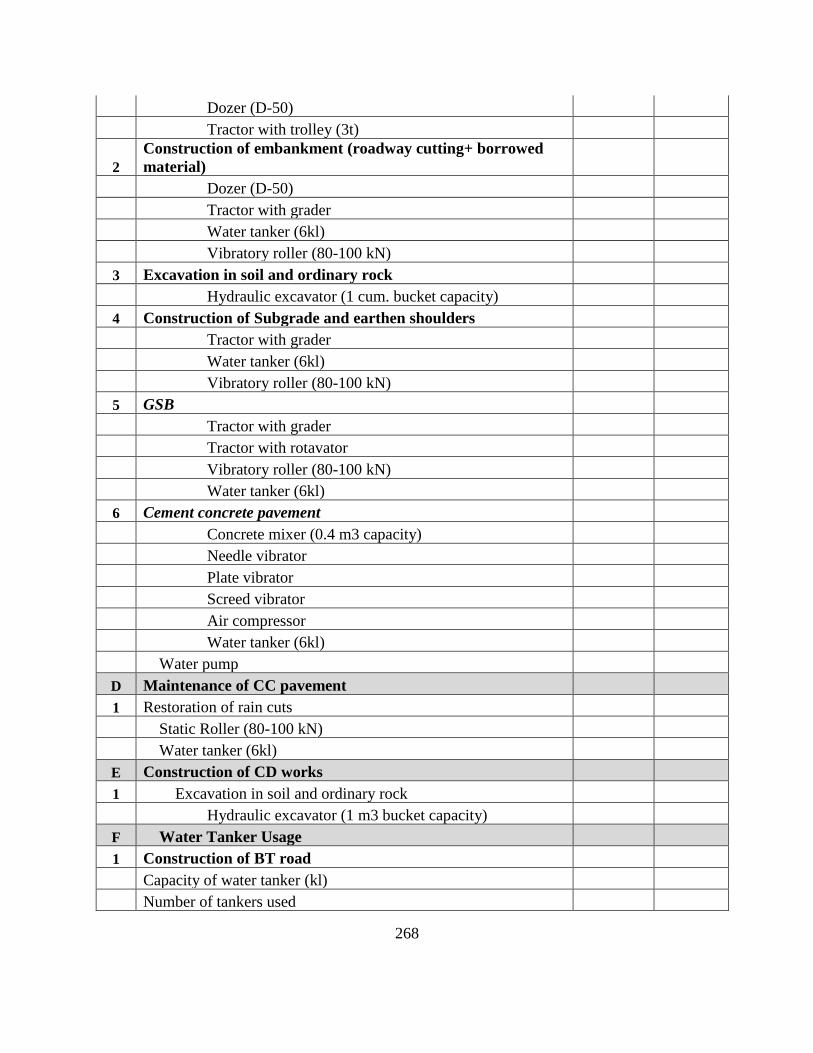
268
Dozer (D-50)
Tractor with trolley (3t)
2
Construction of embankment (roadway cutting+ borrowed
material)
Dozer (D-50)
Tractor with grader
Water tanker (6kl)
Vibratory roller (80-100 kN)
3 Excavation in soil and ordinary rock
Hydraulic excavator (1 cum. bucket capacity)
4 Construction of Subgrade and earthen shoulders
Tractor with grader
Water tanker (6kl)
Vibratory roller (80-100 kN)
5 GSB
Tractor with grader
Tractor with rotavator
Vibratory roller (80-100 kN)
Water tanker (6kl)
6 Cement concrete pavement
Concrete mixer (0.4 m3 capacity)
Needle vibrator
Plate vibrator
Screed vibrator
Air compressor
Water tanker (6kl)
Water pump
D Maintenance of CC pavement
1 Restoration of rain cuts
Static Roller (80-100 kN)
Water tanker (6kl)
E Construction of CD works
1 Excavation in soil and ordinary rock
Hydraulic excavator (1 m3 bucket capacity)
F Water Tanker Usage
1 Construction of BT road
Capacity of water tanker (kl)
Number of tankers used

269
2 Maintenance of BT road
Capacity of water tanker (kl)
Number of tankers used (sum of tankers used over 5 year period)

270
Annexure-III Distress data collection format used for Pavement Condition Index (PCI)

271
References
1. http://omms.nic.in/Home/CitizenPage/#
2. http://pmgsy.nic.in/
3. http://www.censusindia.gov.in/2011-common/census_2011.html
4. SQM guidelines as per PMGSY
5. Specification for rural roads
6. ASTM D 6433-11. Standard Practice for Roads and Parking Lots Pavement Condition Index
Survey, American Society for Testing and Materials, United States.
7. IRC: 73 (1980). Geometric Design Standards for Rural (Non-Urban) Highways, Indian
Road Congress, New Delhi.
8. IRC: SP: 20 (2002). Special publication on rural roads manual. Indian Road Congress,
New Delhi
9. IS: 2386 (1963). Specification for tests on aggregates Indian standards, Bureau Indian
standard, Government of India, New Delhi.
10. MORD (1), (2007). Quality assurance handbook for rural roads vol-I ‘Quality
management system & quality control requirement’ National rural road development
agency, MORD, New Delhi
11. MORD (1), (2007). Quality assurance handbook for rural roads vol-II ‘Equipment & Test
procedures’ National rural road development agency, MORD, New Delhi
12. MoRTH, (2015). Report on “Basic road statistics of India 2014-15” Ministry of road
transport and highway, New Delhi.
13. ASHTHO distress identification guide
14. IRC for PCI of roads
15. UN specification for evaluation of projects
16. List of IRC codes for different standards of tests
17. Unpublished M.Tech report of Miss. Sandhya on strategic life cycle sustainability
assessment tool
18. Unpublished report on “Assessment of quality of PMGSY roads in Maharashtra and its linkage to
SLCSA”
19. Annual road statistics 2014-15 by DES
20. Basic road statistics by MoRTh
21. Annual road statistics