evanescent wave dna-aptamer biosensor based on long period gratings for the specific recognition of...
TRANSCRIPT
Biosensors and Bioelectronics 62 (2014) 227–233
Contents lists available at ScienceDirect
Biosensors and Bioelectronics
http://d0956-56
n CorrE-m
rqueiros
journal homepage: www.elsevier.com/locate/bios
Evanescent wave DNA-aptamer biosensor based on long periodgratings for the specific recognition of E. coli outer membrane proteins
R.B. Queirós a,n, C. Gouveia a, J.R.A. Fernandes a,b, P.A.S. Jorge a
a INESC TEC (Coordinated by INESC Porto), Rua do Campo Alegre, 687, 4150-179 Porto, Portugalb Universidade de Trás-os-Montes e Alto Douro, Apartado 1013, 5001-801 Vila Real, Portugal
a r t i c l e i n f o
Article history:Received 25 March 2014Received in revised form9 June 2014Accepted 12 June 2014Available online 3 July 2014
Keywords:AptamerBiosensorE. coliLabel-freeLPGs
x.doi.org/10.1016/j.bios.2014.06.06263/& 2014 Elsevier B.V. All rights reserved.
esponding author. Tel.: þ351 220 402 301; faail addresses: [email protected],@inescporto.pt (R.B. Queirós).
a b s t r a c t
An evanescent wave fiber optic sensor for detection of Escherichia coli (E. coli) outer membranes proteins(EcOMPs) using long period gratings (LPGs) as a refractometric platform is presented. The sensing probeswere attained by the functionalization of LPGs inscribed in single mode fiber using two differentmethods of immobilization; electrostatic assembly and covalent binding. The resulting label-freeconfiguration enabled the specific recognition of EcOMPs in water by monitoring the resonancewavelength shift due to refractive index changes induced by binding events. The sensors displayedlinear responses in the range of 0.1 nM to 10 nM EcOMPs with sensitivities of �0.156370.005 nmdecade�1 [EcOMP, M] (electrostatic method) and �0.159770.004 nm decade�1 [EcOMP, M] (covalentmethod). The devices could be regenerated (under low pH conditions) with a deviation less than 0.1% forat least three subsequent detection events. The sensors were also applied to spiked environmental watersamples.
& 2014 Elsevier B.V. All rights reserved.
1. Introduction
The increasing need for devices capable of performing reliable,fast and in situ measurements in the field of biochemical detectionis guiding researchers to look for new technologies (Baldini et al.,2012). One possibility is provided by optical refractometers, whichmeasure the change in refractive index associated with a bio-chemical response. In these type of sensors the crucial phenom-enon is interaction, typically evanescent, of an optical signal with asensitive layer which experiences a change on its own refractiveindex in the presence of an analyte. This variation will cause achange in light propagation conditions leading to a change in theproperties of the transmitted optical wave (intensity, frequency,phase). In the specific case of biological sensors the binding eventscause an increase of the mass on the surface which results in anincrease of the effective refractive index of the propagated opticalwave. Fiber optic refractometers are increasingly popular due tothe benefits that optical fiber technology offers such as: immunityto electromagnetic interferences, chemical and biological inert-ness, small size, and capability for in-situ, real-time, remote, anddistributed sensing. Among the most popular fiber optic refracto-metric devices for biosensing application are surface plasmonresonance (Slavík et al., 2001), fiber tapers (Zibaii et al., 2010),
x: þ351 220 402 437.
etched fiber Bragg gratings (Chryssis et al., 2005) and LPGs (DeLisaet al., 2000). Among these, LPGs is the only one where the physicalintegrity of the fiber is preserved thus increasing the robustness ofthe sensor to use and handling (Pilla et al., 2012).
A LPG consists of a periodic modulation of the fiber corerefractive index with a period (Λ) in the range of hundreds ofmicrons. This perturbation must comply with the phase matchingcondition between the core fundamental mode and a forwardpropagating cladding mode for the optical fiber. Thereby, in anLPG, the core mode can be coupled into one or more of the severalcladding modes of the fiber whenever the matching condition isverified, resulting in several resonances centered at discretewavelengths in the transmitted spectrum (Bhatia andVengsarkar, 1996). This mechanism provides the possibility ofinteraction between the optical signal and the external mediumthrough the evanescent field of the cladding modes and alsomeans that these devices are intrinsically sensitive to the sur-rounding refractive index (SRI) (Patrick et al., 1998). LPGs areamong the most promising fiber optic-based RI transducers to beemployed for unlabeled biochemical assays (Fan et al., 2008). LPGspresent high sensitivity to refractive index measurement, whichcan be increased and tuned by properly choosing the fabricationparameters (Shu et al. 2002) and/or using high refractive indexoverlays (Pilla et al., 2012). In terms of fabrication, they are easierand less expensive to obtain when compared with surface plas-mon resonance-based fiber optic sensors which, in turn, areusually more sensitive. Nevertheless, although this is a promising
R.B. Queirós et al. / Biosensors and Bioelectronics 62 (2014) 227–233228
platform, several aspects regarding the practical implementationof biosensors using LPGs require further investigation. In thiswork, practical aspects of biosensors implementation using LPGsare investigated in a bacterial detection application. Namely, theinfluence of the type of functionalization strategy, calibration,quantification and specific detection are addressed. In particular,the present work describes the use of an Escherichia coli DNAaptamer (herein called ECA) for the determination of E. coli inwater by the identification of EcOMPs using a LPG as a refracto-metric platform. The aptamer raised against EcOMPs (Bruno et al.,2010) containing 36 nucleotides was immobilized using twodifferent methods of immobilization: electrostatic assembly (usinga cationic polymer) and with covalent binding (using an organo-functional alkoxysilane molecule). The functionalization of thebare LPG by these two different methods of immobilizationoriginate sensing heads with different characteristics that werecharacterized and tested against EcOMPs and validated withspiked environmental water samples.
2. Materials and methods
2.1. Apparatus
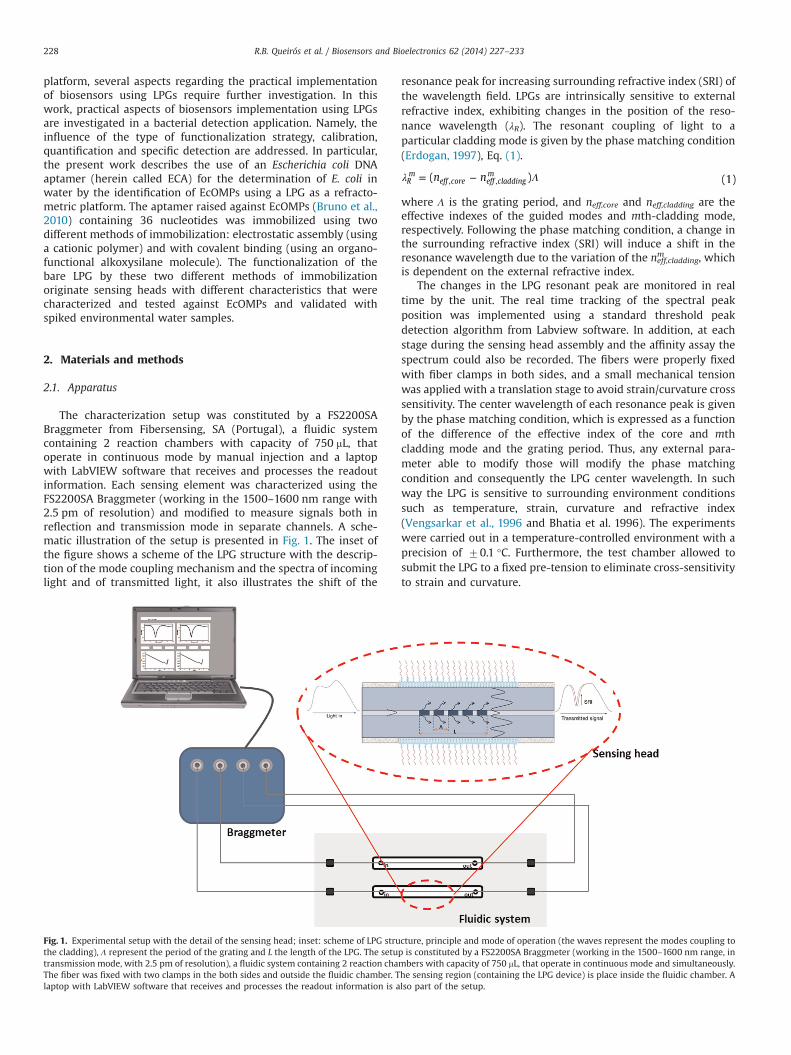
The characterization setup was constituted by a FS2200SABraggmeter from Fibersensing, SA (Portugal), a fluidic systemcontaining 2 reaction chambers with capacity of 750 mL, thatoperate in continuous mode by manual injection and a laptopwith LabVIEW software that receives and processes the readoutinformation. Each sensing element was characterized using theFS2200SA Braggmeter (working in the 1500–1600 nm range with2.5 pm of resolution) and modified to measure signals both inreflection and transmission mode in separate channels. A sche-matic illustration of the setup is presented in Fig. 1. The inset ofthe figure shows a scheme of the LPG structure with the descrip-tion of the mode coupling mechanism and the spectra of incominglight and of transmitted light, it also illustrates the shift of the
Fig. 1. Experimental setup with the detail of the sensing head; inset: scheme of LPG struthe cladding), Λ represent the period of the grating and L the length of the LPG. The setutransmission mode, with 2.5 pm of resolution), a fluidic system containing 2 reaction chaThe fiber was fixed with two clamps in the both sides and outside the fluidic chamber. Tlaptop with LabVIEW software that receives and processes the readout information is a
resonance peak for increasing surrounding refractive index (SRI) ofthe wavelength field. LPGs are intrinsically sensitive to externalrefractive index, exhibiting changes in the position of the reso-nance wavelength (λR). The resonant coupling of light to aparticular cladding mode is given by the phase matching condition(Erdogan, 1997), Eq. (1).
n n( ) (1)Rm
eff core eff claddingm
, ,λ Λ= −
where Λ is the grating period, and neff,core and neff,cladding are theeffective indexes of the guided modes and mth-cladding mode,respectively. Following the phase matching condition, a change inthe surrounding refractive index (SRI) will induce a shift in theresonance wavelength due to the variation of the nmeff,cladding, whichis dependent on the external refractive index.
The changes in the LPG resonant peak are monitored in realtime by the unit. The real time tracking of the spectral peakposition was implemented using a standard threshold peakdetection algorithm from Labview software. In addition, at eachstage during the sensing head assembly and the affinity assay thespectrum could also be recorded. The fibers were properly fixedwith fiber clamps in both sides, and a small mechanical tensionwas applied with a translation stage to avoid strain/curvature crosssensitivity. The center wavelength of each resonance peak is givenby the phase matching condition, which is expressed as a functionof the difference of the effective index of the core and mthcladding mode and the grating period. Thus, any external para-meter able to modify those will modify the phase matchingcondition and consequently the LPG center wavelength. In suchway the LPG is sensitive to surrounding environment conditionssuch as temperature, strain, curvature and refractive index(Vengsarkar et al., 1996 and Bhatia et al. 1996). The experimentswere carried out in a temperature-controlled environment with aprecision of 70.1 °C. Furthermore, the test chamber allowed tosubmit the LPG to a fixed pre-tension to eliminate cross-sensitivityto strain and curvature.
cture, principle and mode of operation (the waves represent the modes coupling top is constituted by a FS2200SA Braggmeter (working in the 1500–1600 nm range, inmbers with capacity of 750 mL, that operate in continuous mode and simultaneously.he sensing region (containing the LPG device) is place inside the fluidic chamber. Also part of the setup.
R.B. Queirós et al. / Biosensors and Bioelectronics 62 (2014) 227–233 229
2.2. Reagents and solutions
A lawn of E. coli ATCCs 8739™ was purchased from ATCC (USA)and EcOMPs were extracted according to Bruno et al., (2010). TheE. coli ATCCs 8739™ is a fecal strain non-pathogenic. Nonetheless,the targeted proteins are expressed in both non-pathogenic andpathogenic E. coli, so the pathogenic nature of the strain used toobtain the analyte does not involve a change in the analyticalcharacteristic of the assay. “36 mer DNA oligo (5′-amine-GTC TGCGAG CGG GGC GCG GGC CCG GCG GGG GAT GCG-3′) synthesisscale: 0.2 mM, purification HPLC, 5′ modification-amine was pur-chased from Sigma-Aldrich (Spain). Salts for buffer solutions wereprepared in double-deionized water, o2 MΩ cm at 25 °C fromELGASTAT-UHQ (UK). Hydrochloric acid (HCl) was purchased fromMerck (Germany), magnesium chloride was purchased from Pan-reac (Spain), (Tris(hydroxymethyl)aminomethane (Tris) wereobtained from Fluka (Germany), (3-aminopropyl)triethoxysilane97% (APTES) was obtained from ABCR (Germany), 0.1% (W/V) poly-L-lysine (PLL), dimethyl suberimidate (DMSI), potassium chloride(KCl), sodium chloride (NaCl), SSPE buffer 20x concentrate(1� ¼0.150 M sodium chloride, 0.010 M sodium phosphate,0.001 M EDTA), Tris–EDTA, microcystin-LR (Mcyst-LR) wereobtained from Sigma (Germany). The buffers used in this workwere: resuspension buffer: TE (10 mM Tris pH 7.5–8.0; 1 mMEDTA); immobilization buffer: SSPE (1:10), (diluted from20� SSPE); affinity buffer (50 mM Tris/HCl pH 7.4, 250 mM NaCl,5 mM MgCl2) and measurement buffer (10 mM Tris/HCl pH 7.4,100 mM KCl). All the reagents were of analytical grade.
2.3. Experimental methods
2.3.1. Extraction and determination of EcOMPs concentrationA lawn of E. coli ATCCs 8739™was grown on a blood agar plate
overnight at 37 °C. Bacteria were washed from the plate with theextraction buffer and transferred to 10 ml of cold 1.5 M MgCl2 insterile nuclease-free water. The suspension of bacteria was leftovernight at 4 °C to allow the chaotropic action of MgCl2 to extractthe membrane proteins. The resultant pellet was washed againwith buffer and centrifuged (Bruno et al. 2010). The liquid wascollected and the final concentration of EcOMPs was estimatedspectrophotometrically at 280 nm (Jing and Bowser, 2011).
2.3.2. LPGs fabrication and characterizationThe gratings were fabricated in-house by using an electric-arc
setup (Rego et al. 2001). The LPGs were written in a standard SMF-28 fiber (Corning, USA) using the following set of fabricationparameters: an axial tension of 50.0 mN, arc discharges with anelectric current of 9 mA and arc duration of 0.5 s.
The fiber is illuminated with a white light source and thespectrum is monitored in real time by using an optical spectrumanalyzer (OSA), Ando AQ-6315B, with a maximum wavelengthresolution of 0.5 nm. The sequence arc discharge/fiber displace-ment is repeated several times until a required attenuation valuefor the resonance peak (monitored with the OSA) is obtained. Asthe discharges are being made the resonance peak increases indepth and becomes narrower until a maximum loss is reached.The grating period was 396 mm in order to produce a resonantwavelength at approximately 1560 nm, corresponding to the 6thorder cladding mode. The period of the grating was chosenaccording with previous work (Caldas et al., 2009). The length ofthe used LPGs are around 40 mm depending on the number ofperiods necessary to achieve the desired resonant wavelength andloss (between 80–90 periods). This way, deriving from thisfabrication process, the particular LPGs may differ in their spectralshape and precise value of attenuation. Nevertheless their sensi-tivity to refractive index depends specifically on the cladding order
mode excited and is identical for all LPG fabricated. From this pointforward, whenever LPG resonance will be referred, it will berelatively to the 6th order cladding mode.
The sensitivity of the LPG to the SRI was also studied for therange between 1.321–1.345 (Fig. S1), corresponding to the range ofinterest for biological measurements (Zibaii et al., 2010), and wasfound to be about 14773 nm RIU�1. The LPG was characterized interms of SRI and its transmission spectra for different SRIs wererecorded. The SRI was changed by using solutions of distilledwater with different percentages of ethylene glycol at constanttemperature (25 °C). Each liquid sample had its RI previouslycharacterized with an Abbe refractometer using the sodium D line(589 nm). The necessary adjustments, considering the sensinghead operation at 1550 nm, can be made using the Cauchyequation with the respective coefficients (Fogg et al., 1955; El-Kashef, 2000). The corrected sensitivity of the device consideringthe wavelength of the studied resonance is around 150 nm RIU�1
(Gouveia, 2013). The LPGs have also a known sensitivity totemperature variations and a characterization was performed todetermine if their thermal behavior was within the expectedvalues. By monitoring its behavior while immersed in coolinghot water, the thermal sensitivity of the sensing device wasobtained. From the slope of the calibration curve presented inFig. S2 it can be estimated a sensitivity of 11371 pm °C�1.Therefore, during the experiments the thermal fluctuations waskept below 70.1 °C, thus avoiding cross-sensitivity to thisparameter.
2.3.3. Sensing heads assemblyThe LPGs surface were functionalized using two different
processes; an electrostatic method, using PLL as cationic polymerand a covalent method, using APTES. Prior to functionalization ofthe LPG, they were cleaned by immersion in 5 M HCl for 30 min atroom temperature, followed by rinsing in DD water and with Tris–HCl buffer. The sensing head of type 1 SH1 were coated with 0.1%PLL for 30 min at room temperature and then were washed withTris–HCl buffer. The silanization of the LPG's surface, for theassembly of sensing head of type 2 (SH2), was performed byimmersing the cleaned grating sample in fresh 10% APTES (inethanol) for 1 h, also at room temperature. For activation of thefiber surface, the silanized LPGs were immersed in 25 mM DMSI inTris–HCl buffer solution for 30 min at room temperature. Bothsensing heads were incubated with 200 nM of ECA overnight at 4 °C. The sensing heads were rinsed between all steps with Tris–HClbuffer.
2.3.4. EcOMPs detection assayThe sensing heads were incubated with several varying con-
centrations of EcOMPs, in the affinity buffer for 1 h. The sensorresponse was tested in the concentration range from 0.1 nM to30 nM. Between all concentrations steps the sensing heads werewashed with Tris–HCl buffer and then the wavelength shift of theresonance peak was acquired with the FS2200SA and recordedwith the laptop with the fiber immersed in the measurementbuffer. After a complete assay the sensing heads were washed witha 2 M HCl solution for 30 min, to regenerate the DNA probe for re-use.
3. Results and discussion
3.1. Sensing heads characterization – SEM and AFM analysis
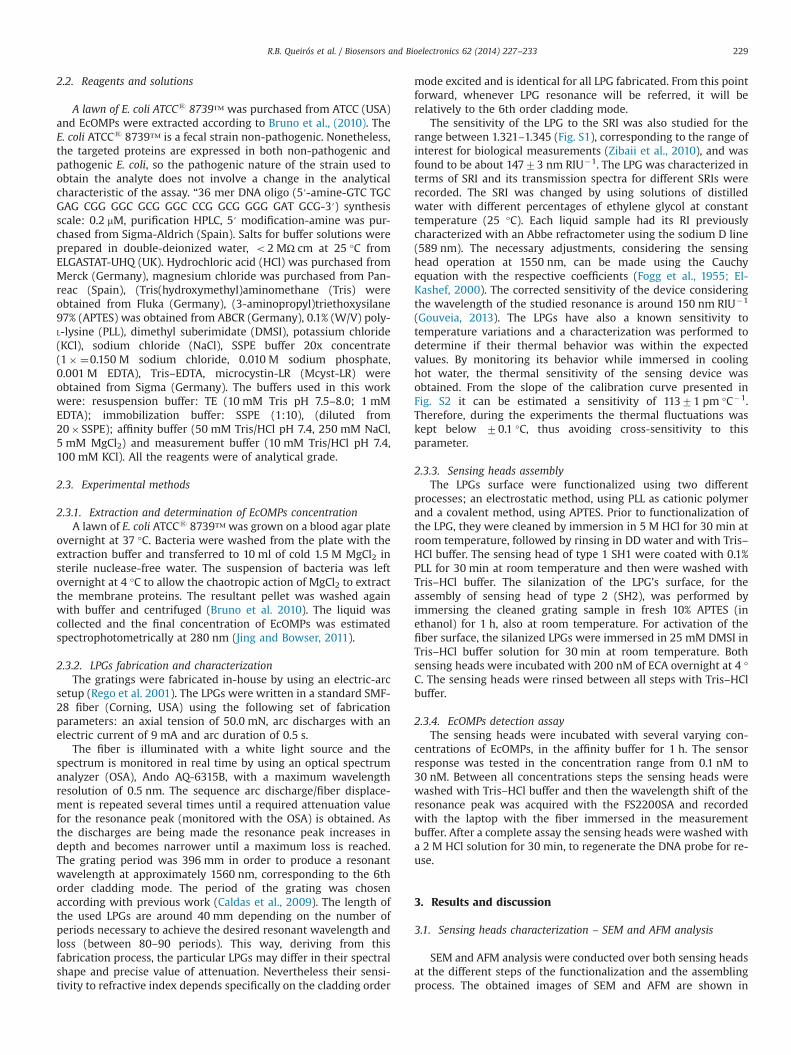
SEM and AFM analysis were conducted over both sensing headsat the different steps of the functionalization and the assemblingprocess. The obtained images of SEM and AFM are shown in
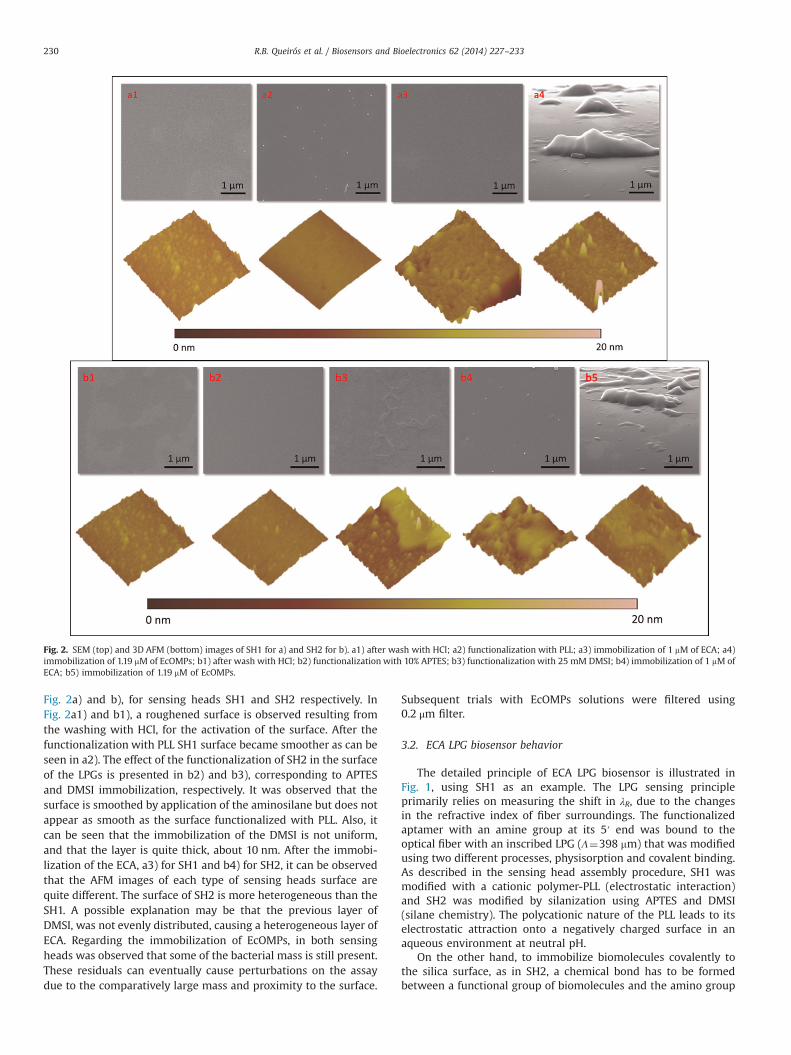
Fig. 2. SEM (top) and 3D AFM (bottom) images of SH1 for a) and SH2 for b). a1) after wash with HCl; a2) functionalization with PLL; a3) immobilization of 1 mM of ECA; a4)immobilization of 1.19 mM of EcOMPs; b1) after wash with HCl; b2) functionalization with 10% APTES; b3) functionalization with 25 mM DMSI; b4) immobilization of 1 mM ofECA; b5) immobilization of 1.19 mM of EcOMPs.
R.B. Queirós et al. / Biosensors and Bioelectronics 62 (2014) 227–233230
Fig. 2a) and b), for sensing heads SH1 and SH2 respectively. InFig. 2a1) and b1), a roughened surface is observed resulting fromthe washing with HCl, for the activation of the surface. After thefunctionalization with PLL SH1 surface became smoother as can beseen in a2). The effect of the functionalization of SH2 in the surfaceof the LPGs is presented in b2) and b3), corresponding to APTESand DMSI immobilization, respectively. It was observed that thesurface is smoothed by application of the aminosilane but does notappear as smooth as the surface functionalized with PLL. Also, itcan be seen that the immobilization of the DMSI is not uniform,and that the layer is quite thick, about 10 nm. After the immobi-lization of the ECA, a3) for SH1 and b4) for SH2, it can be observedthat the AFM images of each type of sensing heads surface arequite different. The surface of SH2 is more heterogeneous than theSH1. A possible explanation may be that the previous layer ofDMSI, was not evenly distributed, causing a heterogeneous layer ofECA. Regarding the immobilization of EcOMPs, in both sensingheads was observed that some of the bacterial mass is still present.These residuals can eventually cause perturbations on the assaydue to the comparatively large mass and proximity to the surface.
Subsequent trials with EcOMPs solutions were filtered using0.2 μm filter.
3.2. ECA LPG biosensor behavior
The detailed principle of ECA LPG biosensor is illustrated inFig. 1, using SH1 as an example. The LPG sensing principleprimarily relies on measuring the shift in λR, due to the changesin the refractive index of fiber surroundings. The functionalizedaptamer with an amine group at its 5′ end was bound to theoptical fiber with an inscribed LPG (Λ¼398 mm) that was modifiedusing two different processes, physisorption and covalent binding.As described in the sensing head assembly procedure, SH1 wasmodified with a cationic polymer-PLL (electrostatic interaction)and SH2 was modified by silanization using APTES and DMSI(silane chemistry). The polycationic nature of the PLL leads to itselectrostatic attraction onto a negatively charged surface in anaqueous environment at neutral pH.
On the other hand, to immobilize biomolecules covalently tothe silica surface, as in SH2, a chemical bond has to be formedbetween a functional group of biomolecules and the amino group
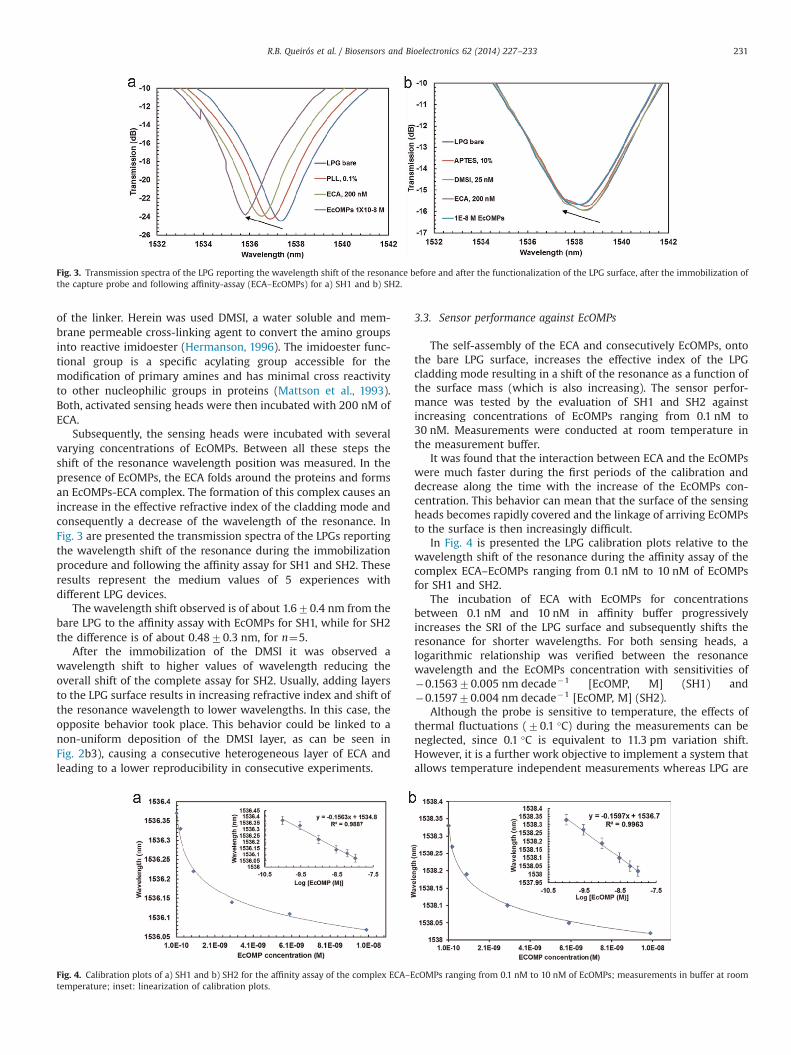
Fig. 3. Transmission spectra of the LPG reporting the wavelength shift of the resonance before and after the functionalization of the LPG surface, after the immobilization ofthe capture probe and following affinity-assay (ECA–EcOMPs) for a) SH1 and b) SH2.
R.B. Queirós et al. / Biosensors and Bioelectronics 62 (2014) 227–233 231
of the linker. Herein was used DMSI, a water soluble and mem-brane permeable cross-linking agent to convert the amino groupsinto reactive imidoester (Hermanson, 1996). The imidoester func-tional group is a specific acylating group accessible for themodification of primary amines and has minimal cross reactivityto other nucleophilic groups in proteins (Mattson et al., 1993).Both, activated sensing heads were then incubated with 200 nM ofECA.
Subsequently, the sensing heads were incubated with severalvarying concentrations of EcOMPs. Between all these steps theshift of the resonance wavelength position was measured. In thepresence of EcOMPs, the ECA folds around the proteins and formsan EcOMPs-ECA complex. The formation of this complex causes anincrease in the effective refractive index of the cladding mode andconsequently a decrease of the wavelength of the resonance. InFig. 3 are presented the transmission spectra of the LPGs reportingthe wavelength shift of the resonance during the immobilizationprocedure and following the affinity assay for SH1 and SH2. Theseresults represent the medium values of 5 experiences withdifferent LPG devices.
The wavelength shift observed is of about 1.670.4 nm from thebare LPG to the affinity assay with EcOMPs for SH1, while for SH2the difference is of about 0.4870.3 nm, for n¼5.
After the immobilization of the DMSI it was observed awavelength shift to higher values of wavelength reducing theoverall shift of the complete assay for SH2. Usually, adding layersto the LPG surface results in increasing refractive index and shift ofthe resonance wavelength to lower wavelengths. In this case, theopposite behavior took place. This behavior could be linked to anon-uniform deposition of the DMSI layer, as can be seen inFig. 2b3), causing a consecutive heterogeneous layer of ECA andleading to a lower reproducibility in consecutive experiments.
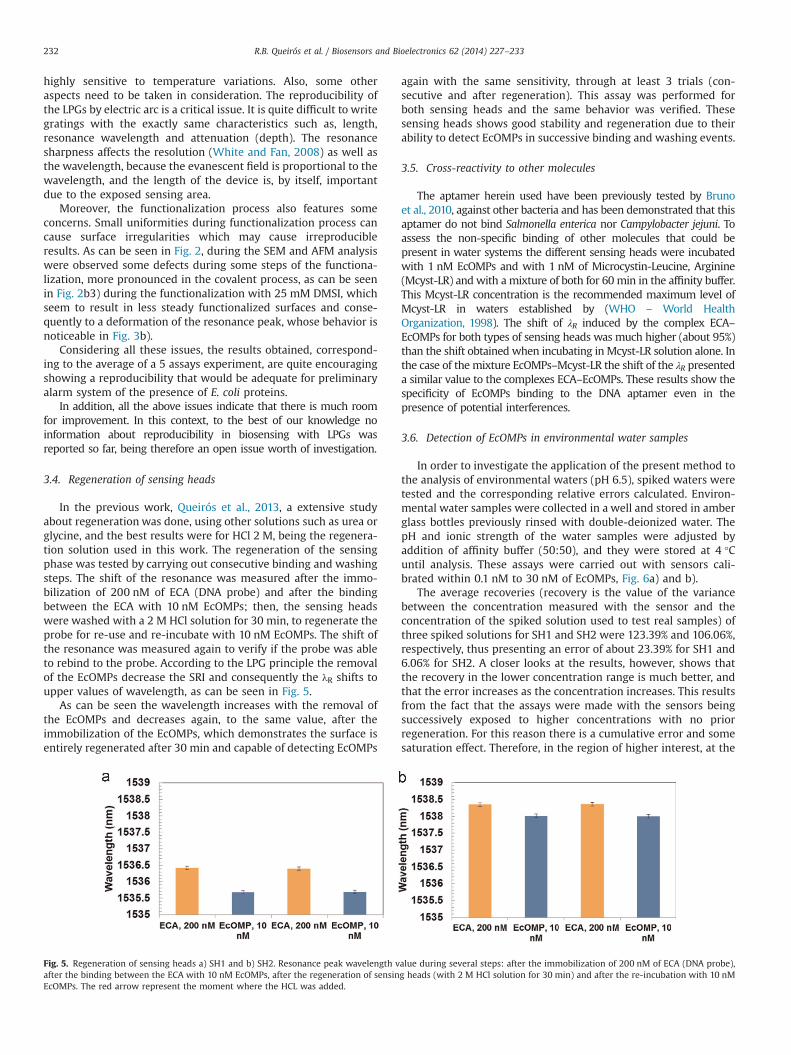
Fig. 4. Calibration plots of a) SH1 and b) SH2 for the affinity assay of the complex ECA–Etemperature; inset: linearization of calibration plots.
3.3. Sensor performance against EcOMPs
The self-assembly of the ECA and consecutively EcOMPs, ontothe bare LPG surface, increases the effective index of the LPGcladding mode resulting in a shift of the resonance as a function ofthe surface mass (which is also increasing). The sensor perfor-mance was tested by the evaluation of SH1 and SH2 againstincreasing concentrations of EcOMPs ranging from 0.1 nM to30 nM. Measurements were conducted at room temperature inthe measurement buffer.
It was found that the interaction between ECA and the EcOMPswere much faster during the first periods of the calibration anddecrease along the time with the increase of the EcOMPs con-centration. This behavior can mean that the surface of the sensingheads becomes rapidly covered and the linkage of arriving EcOMPsto the surface is then increasingly difficult.
In Fig. 4 is presented the LPG calibration plots relative to thewavelength shift of the resonance during the affinity assay of thecomplex ECA–EcOMPs ranging from 0.1 nM to 10 nM of EcOMPsfor SH1 and SH2.
The incubation of ECA with EcOMPs for concentrationsbetween 0.1 nM and 10 nM in affinity buffer progressivelyincreases the SRI of the LPG surface and subsequently shifts theresonance for shorter wavelengths. For both sensing heads, alogarithmic relationship was verified between the resonancewavelength and the EcOMPs concentration with sensitivities of�0.156370.005 nm decade�1 [EcOMP, M] (SH1) and�0.159770.004 nm decade�1 [EcOMP, M] (SH2).
Although the probe is sensitive to temperature, the effects ofthermal fluctuations (70.1 °C) during the measurements can beneglected, since 0.1 °C is equivalent to 11.3 pm variation shift.However, it is a further work objective to implement a system thatallows temperature independent measurements whereas LPG are
cOMPs ranging from 0.1 nM to 10 nM of EcOMPs; measurements in buffer at room
R.B. Queirós et al. / Biosensors and Bioelectronics 62 (2014) 227–233232
highly sensitive to temperature variations. Also, some otheraspects need to be taken in consideration. The reproducibility ofthe LPGs by electric arc is a critical issue. It is quite difficult to writegratings with the exactly same characteristics such as, length,resonance wavelength and attenuation (depth). The resonancesharpness affects the resolution (White and Fan, 2008) as well asthe wavelength, because the evanescent field is proportional to thewavelength, and the length of the device is, by itself, importantdue to the exposed sensing area.
Moreover, the functionalization process also features someconcerns. Small uniformities during functionalization process cancause surface irregularities which may cause irreproducibleresults. As can be seen in Fig. 2, during the SEM and AFM analysiswere observed some defects during some steps of the functiona-lization, more pronounced in the covalent process, as can be seenin Fig. 2b3) during the functionalization with 25 mM DMSI, whichseem to result in less steady functionalized surfaces and conse-quently to a deformation of the resonance peak, whose behavior isnoticeable in Fig. 3b).
Considering all these issues, the results obtained, correspond-ing to the average of a 5 assays experiment, are quite encouragingshowing a reproducibility that would be adequate for preliminaryalarm system of the presence of E. coli proteins.
In addition, all the above issues indicate that there is much roomfor improvement. In this context, to the best of our knowledge noinformation about reproducibility in biosensing with LPGs wasreported so far, being therefore an open issue worth of investigation.
3.4. Regeneration of sensing heads
In the previous work, Queirós et al., 2013, a extensive studyabout regeneration was done, using other solutions such as urea orglycine, and the best results were for HCl 2 M, being the regenera-tion solution used in this work. The regeneration of the sensingphase was tested by carrying out consecutive binding and washingsteps. The shift of the resonance was measured after the immo-bilization of 200 nM of ECA (DNA probe) and after the bindingbetween the ECA with 10 nM EcOMPs; then, the sensing headswere washed with a 2 M HCl solution for 30 min, to regenerate theprobe for re-use and re-incubate with 10 nM EcOMPs. The shift ofthe resonance was measured again to verify if the probe was ableto rebind to the probe. According to the LPG principle the removalof the EcOMPs decrease the SRI and consequently the λR shifts toupper values of wavelength, as can be seen in Fig. 5.
As can be seen the wavelength increases with the removal ofthe EcOMPs and decreases again, to the same value, after theimmobilization of the EcOMPs, which demonstrates the surface isentirely regenerated after 30 min and capable of detecting EcOMPs
Fig. 5. Regeneration of sensing heads a) SH1 and b) SH2. Resonance peak wavelength vafter the binding between the ECA with 10 nM EcOMPs, after the regeneration of sensinEcOMPs. The red arrow represent the moment where the HCL was added.
again with the same sensitivity, through at least 3 trials (con-secutive and after regeneration). This assay was performed forboth sensing heads and the same behavior was verified. Thesesensing heads shows good stability and regeneration due to theirability to detect EcOMPs in successive binding and washing events.
3.5. Cross-reactivity to other molecules
The aptamer herein used have been previously tested by Brunoet al., 2010, against other bacteria and has been demonstrated that thisaptamer do not bind Salmonella enterica nor Campylobacter jejuni. Toassess the non-specific binding of other molecules that could bepresent in water systems the different sensing heads were incubatedwith 1 nM EcOMPs and with 1 nM of Microcystin-Leucine, Arginine(Mcyst-LR) and with a mixture of both for 60 min in the affinity buffer.This Mcyst-LR concentration is the recommended maximum level ofMcyst-LR in waters established by (WHO – World HealthOrganization, 1998). The shift of λR induced by the complex ECA–EcOMPs for both types of sensing heads was much higher (about 95%)than the shift obtained when incubating in Mcyst-LR solution alone. Inthe case of the mixture EcOMPs–Mcyst-LR the shift of the λR presenteda similar value to the complexes ECA–EcOMPs. These results show thespecificity of EcOMPs binding to the DNA aptamer even in thepresence of potential interferences.
3.6. Detection of EcOMPs in environmental water samples
In order to investigate the application of the present method tothe analysis of environmental waters (pH 6.5), spiked waters weretested and the corresponding relative errors calculated. Environ-mental water samples were collected in a well and stored in amberglass bottles previously rinsed with double-deionized water. ThepH and ionic strength of the water samples were adjusted byaddition of affinity buffer (50:50), and they were stored at 4 °Cuntil analysis. These assays were carried out with sensors cali-brated within 0.1 nM to 30 nM of EcOMPs, Fig. 6a) and b).
The average recoveries (recovery is the value of the variancebetween the concentration measured with the sensor and theconcentration of the spiked solution used to test real samples) ofthree spiked solutions for SH1 and SH2 were 123.39% and 106.06%,respectively, thus presenting an error of about 23.39% for SH1 and6.06% for SH2. A closer looks at the results, however, shows thatthe recovery in the lower concentration range is much better, andthat the error increases as the concentration increases. This resultsfrom the fact that the assays were made with the sensors beingsuccessively exposed to higher concentrations with no priorregeneration. For this reason there is a cumulative error and somesaturation effect. Therefore, in the region of higher interest, at the
alue during several steps: after the immobilization of 200 nM of ECA (DNA probe),g heads (with 2 M HCl solution for 30 min) and after the re-incubation with 10 nM
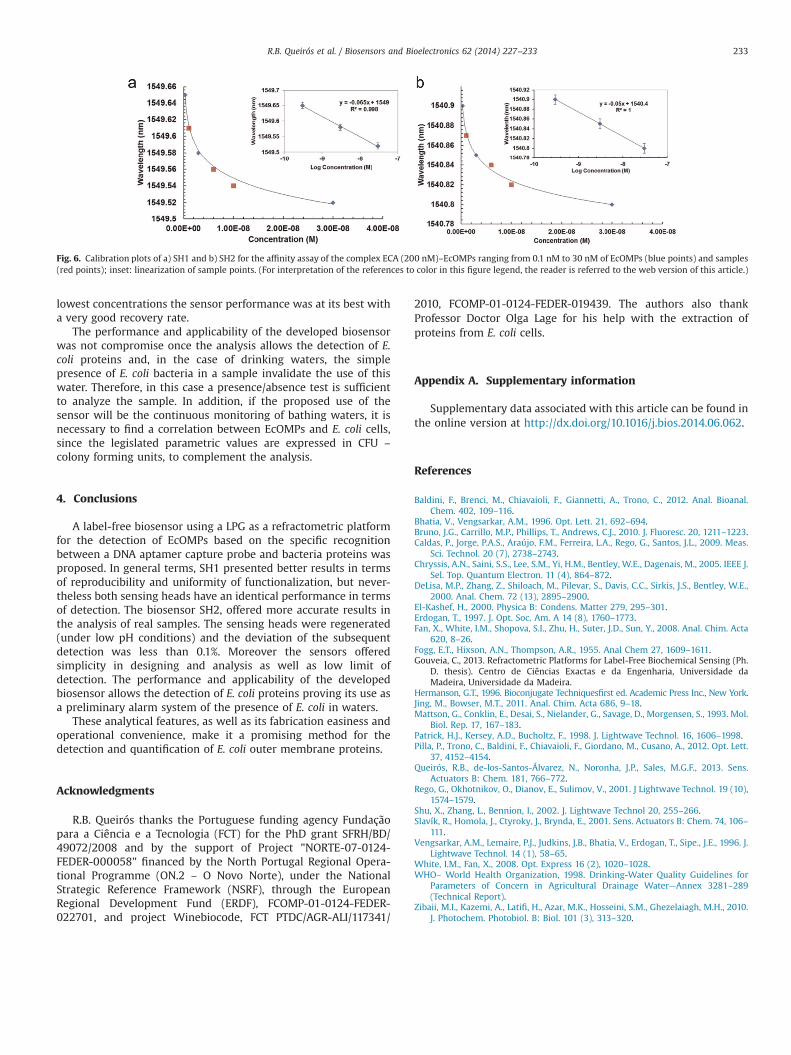
Fig. 6. Calibration plots of a) SH1 and b) SH2 for the affinity assay of the complex ECA (200 nM)–EcOMPs ranging from 0.1 nM to 30 nM of EcOMPs (blue points) and samples(red points); inset: linearization of sample points. (For interpretation of the references to color in this figure legend, the reader is referred to the web version of this article.)
R.B. Queirós et al. / Biosensors and Bioelectronics 62 (2014) 227–233 233
lowest concentrations the sensor performance was at its best witha very good recovery rate.
The performance and applicability of the developed biosensorwas not compromise once the analysis allows the detection of E.coli proteins and, in the case of drinking waters, the simplepresence of E. coli bacteria in a sample invalidate the use of thiswater. Therefore, in this case a presence/absence test is sufficientto analyze the sample. In addition, if the proposed use of thesensor will be the continuous monitoring of bathing waters, it isnecessary to find a correlation between EcOMPs and E. coli cells,since the legislated parametric values are expressed in CFU –
colony forming units, to complement the analysis.
4. Conclusions
A label-free biosensor using a LPG as a refractometric platformfor the detection of EcOMPs based on the specific recognitionbetween a DNA aptamer capture probe and bacteria proteins wasproposed. In general terms, SH1 presented better results in termsof reproducibility and uniformity of functionalization, but never-theless both sensing heads have an identical performance in termsof detection. The biosensor SH2, offered more accurate results inthe analysis of real samples. The sensing heads were regenerated(under low pH conditions) and the deviation of the subsequentdetection was less than 0.1%. Moreover the sensors offeredsimplicity in designing and analysis as well as low limit ofdetection. The performance and applicability of the developedbiosensor allows the detection of E. coli proteins proving its use asa preliminary alarm system of the presence of E. coli in waters.
These analytical features, as well as its fabrication easiness andoperational convenience, make it a promising method for thedetection and quantification of E. coli outer membrane proteins.
Acknowledgments
R.B. Queirós thanks the Portuguese funding agency Fundaçãopara a Ciência e a Tecnologia (FCT) for the PhD grant SFRH/BD/49072/2008 and by the support of Project "NORTE-07-0124-FEDER-000058" financed by the North Portugal Regional Opera-tional Programme (ON.2 – O Novo Norte), under the NationalStrategic Reference Framework (NSRF), through the EuropeanRegional Development Fund (ERDF), FCOMP-01-0124-FEDER-022701, and project Winebiocode, FCT PTDC/AGR-ALI/117341/
2010, FCOMP-01-0124-FEDER-019439. The authors also thankProfessor Doctor Olga Lage for his help with the extraction ofproteins from E. coli cells.
Appendix A. Supplementary information
Supplementary data associated with this article can be found inthe online version at http://dx.doi.org/10.1016/j.bios.2014.06.062.
References
Baldini, F., Brenci, M., Chiavaioli, F., Giannetti, A., Trono, C., 2012. Anal. Bioanal.Chem. 402, 109–116.
Bhatia, V., Vengsarkar, A.M., 1996. Opt. Lett. 21, 692–694.Bruno, J.G., Carrillo, M.P., Phillips, T., Andrews, C.J., 2010. J. Fluoresc. 20, 1211–1223.Caldas, P., Jorge, P.A.S., Araújo, F.M., Ferreira, L.A., Rego, G., Santos, J.L., 2009. Meas.
Sci. Technol. 20 (7), 2738–2743.Chryssis, A.N., Saini, S.S., Lee, S.M., Yi, H.M., Bentley, W.E., Dagenais, M., 2005. IEEE J.
Sel. Top. Quantum Electron. 11 (4), 864–872.DeLisa, M.P., Zhang, Z., Shiloach, M., Pilevar, S., Davis, C.C., Sirkis, J.S., Bentley, W.E.,
2000. Anal. Chem. 72 (13), 2895–2900.El-Kashef, H., 2000. Physica B: Condens. Matter 279, 295–301.Erdogan, T., 1997. J. Opt. Soc. Am. A 14 (8), 1760–1773.Fan, X., White, I.M., Shopova, S.I., Zhu, H., Suter, J.D., Sun, Y., 2008. Anal. Chim. Acta
620, 8–26.Fogg, E.T., Hixson, A.N., Thompson, A.R., 1955. Anal Chem 27, 1609–1611.Gouveia, C., 2013. Refractometric Platforms for Label-Free Biochemical Sensing (Ph.
D. thesis). Centro de Ciências Exactas e da Engenharia, Universidade daMadeira, Universidade da Madeira.
Hermanson, G.T., 1996. Bioconjugate Techniquesfirst ed. Academic Press Inc., New York.Jing, M., Bowser, M.T., 2011. Anal. Chim. Acta 686, 9–18.Mattson, G., Conklin, E., Desai, S., Nielander, G., Savage, D., Morgensen, S., 1993. Mol.
Biol. Rep. 17, 167–183.Patrick, H.J., Kersey, A.D., Bucholtz, F., 1998. J. Lightwave Technol. 16, 1606–1998.Pilla, P., Trono, C., Baldini, F., Chiavaioli, F., Giordano, M., Cusano, A., 2012. Opt. Lett.
37, 4152–4154.Queirós, R.B., de-los-Santos-Álvarez, N., Noronha, J.P., Sales, M.G.F., 2013. Sens.
Actuators B: Chem. 181, 766–772.Rego, G., Okhotnikov, O., Dianov, E., Sulimov, V., 2001. J Lightwave Technol. 19 (10),
1574–1579.Shu, X., Zhang, L., Bennion, I., 2002. J. Lightwave Technol 20, 255–266.Slavík, R., Homola, J., Ctyroky, J., Brynda, E., 2001. Sens. Actuators B: Chem. 74, 106–
111.Vengsarkar, A.M., Lemaire, P.J., Judkins, J.B., Bhatia, V., Erdogan, T., Sipe., J.E., 1996. J.
Lightwave Technol. 14 (1), 58–65.White, I.M., Fan, X., 2008. Opt. Express 16 (2), 1020–1028.WHO– World Health Organization, 1998. Drinking-Water Quality Guidelines for
Parameters of Concern in Agricultural Drainage Water—Annex 3281–289(Technical Report).
Zibaii, M.I., Kazemi, A., Latifi, H., Azar, M.K., Hosseini, S.M., Ghezelaiagh, M.H., 2010.J. Photochem. Photobiol. B: Biol. 101 (3), 313–320.