fargo-moorhead metropolitan area flood risk … · 2014-04-30 · fargo-moorhead metropolitan area...
TRANSCRIPT
US Army Corps of Engineers
BUILDING STRONG®
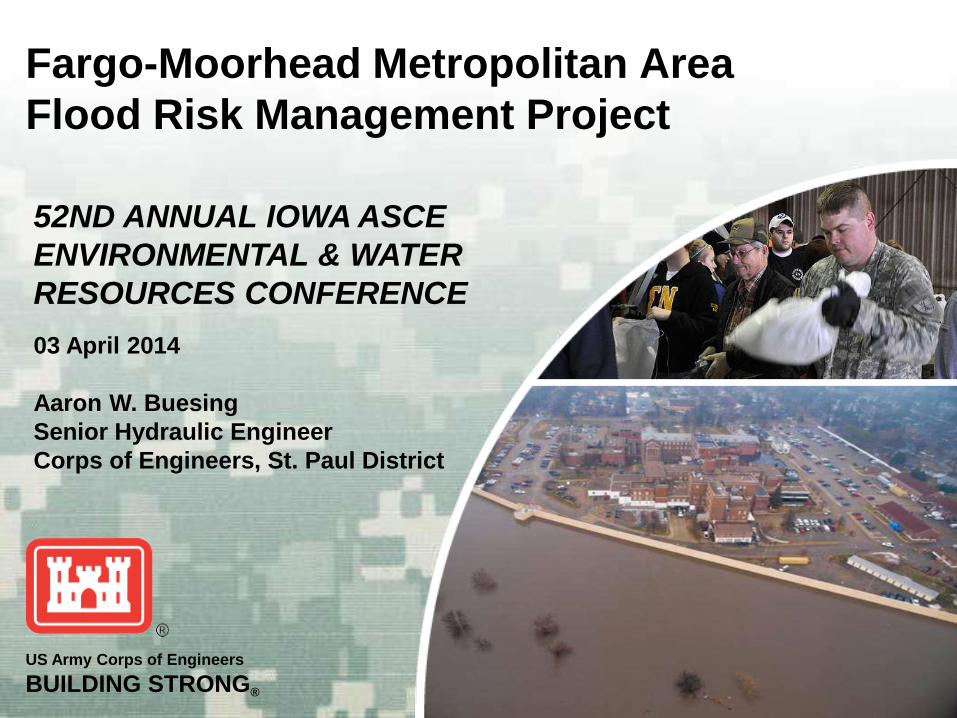
Fargo-Moorhead Metropolitan Area
Flood Risk Management Project
52ND ANNUAL IOWA ASCE
ENVIRONMENTAL & WATER
RESOURCES CONFERENCE
03 April 2014
Aaron W. Buesing
Senior Hydraulic Engineer
Corps of Engineers, St. Paul District
BUILDING STRONG®
Presentation Outline
Reason for Project
Summary of Feasibility and Environmental Impact Study (FEIS)
Changes since the FEIS and subsequent Environmental Assessment (EA)
Ongoing studies and design efforts
Project status
2
BUILDING STRONG®
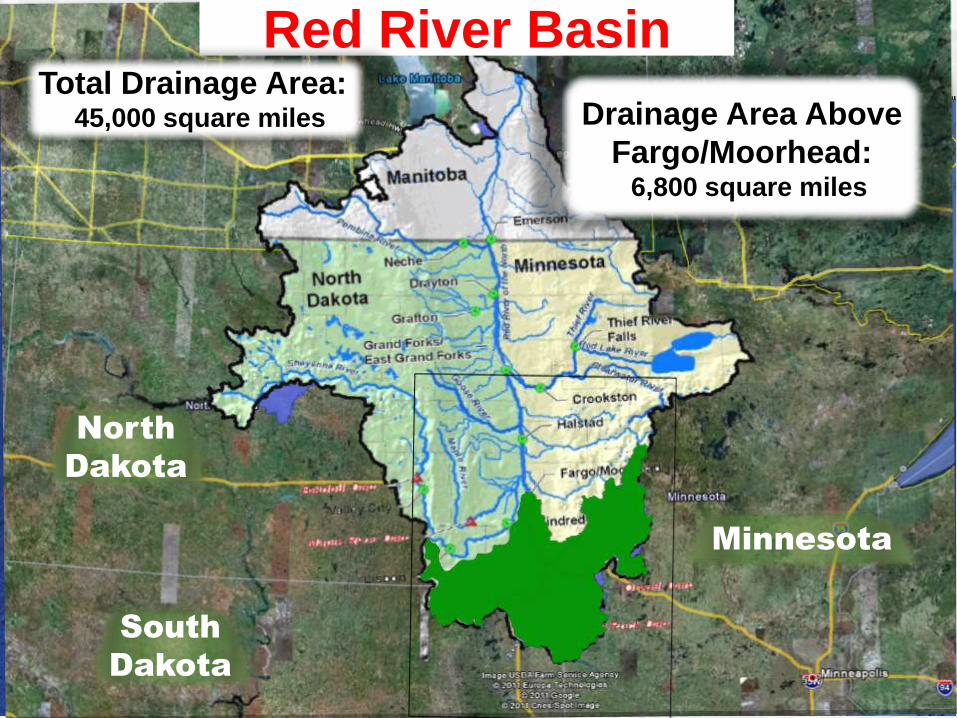
Drainage Area Above
Fargo/Moorhead:6,800 square miles
Red River Basin
North
Dakota
South
Dakota
Minnesota
Total Drainage Area:45,000 square miles
BUILDING STRONG®4
BUILDING STRONG®5
BUILDING STRONG®6
BUILDING STRONG®7
BUILDING STRONG®8
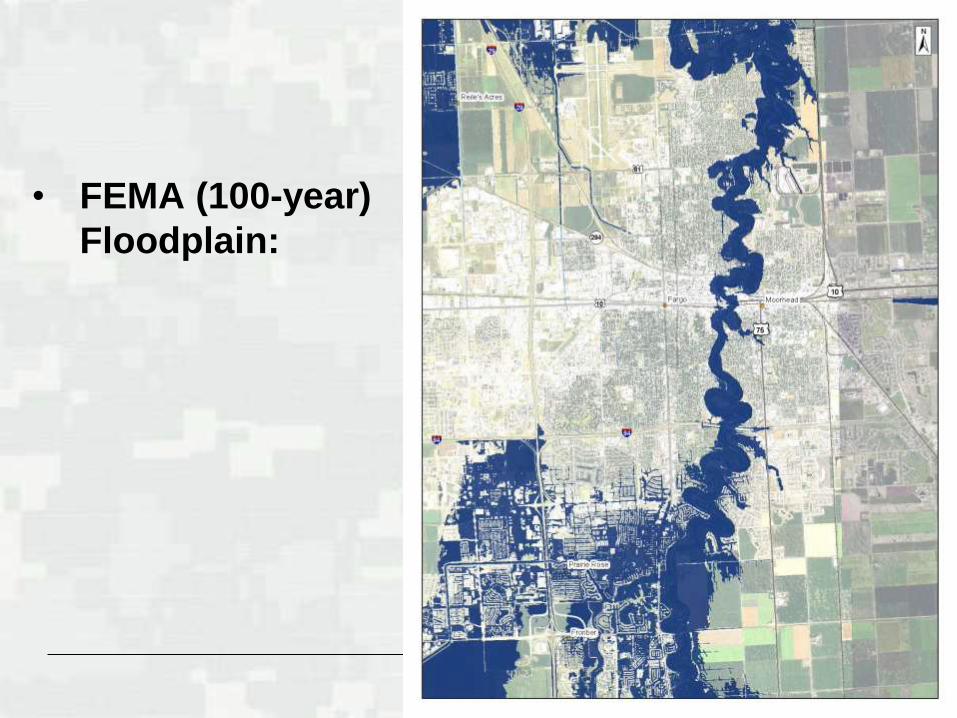
• FEMA (100-year)
Floodplain:
BUILDING STRONG®9
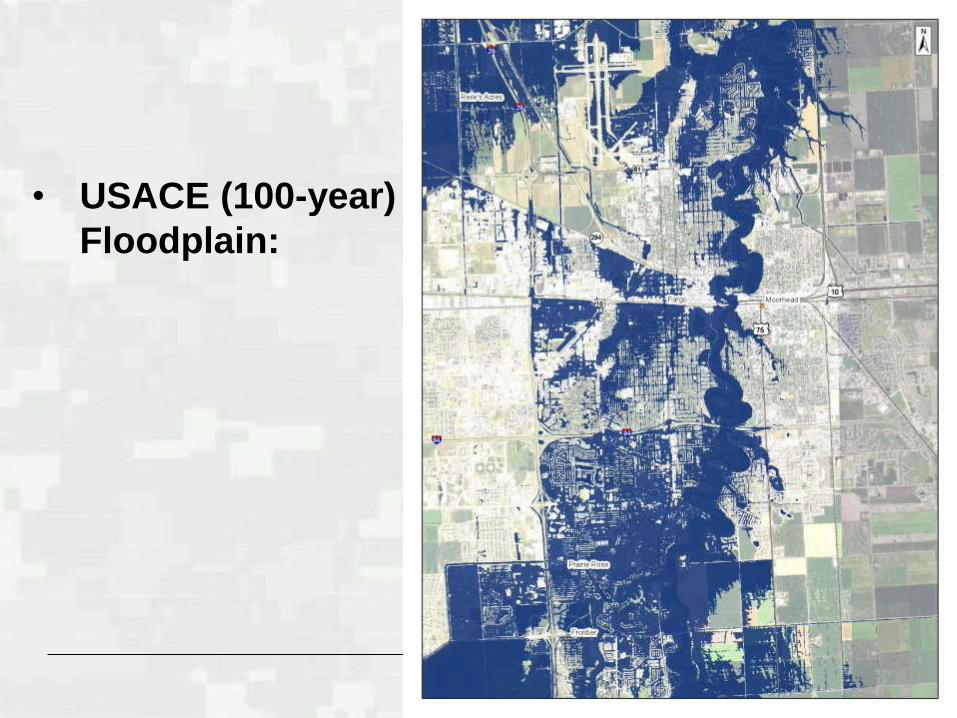
• USACE (100-year)
Floodplain:
BUILDING STRONG®
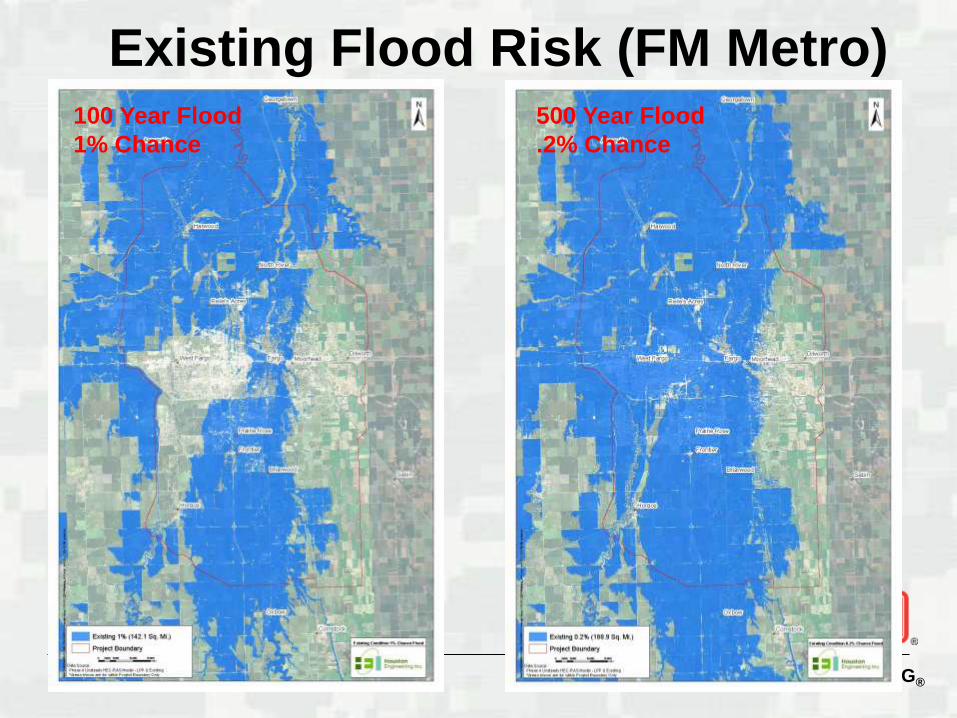
Existing Flood Risk (FM Metro)100 Year Flood
1% Chance
500 Year Flood
.2% Chance
BUILDING STRONG®11
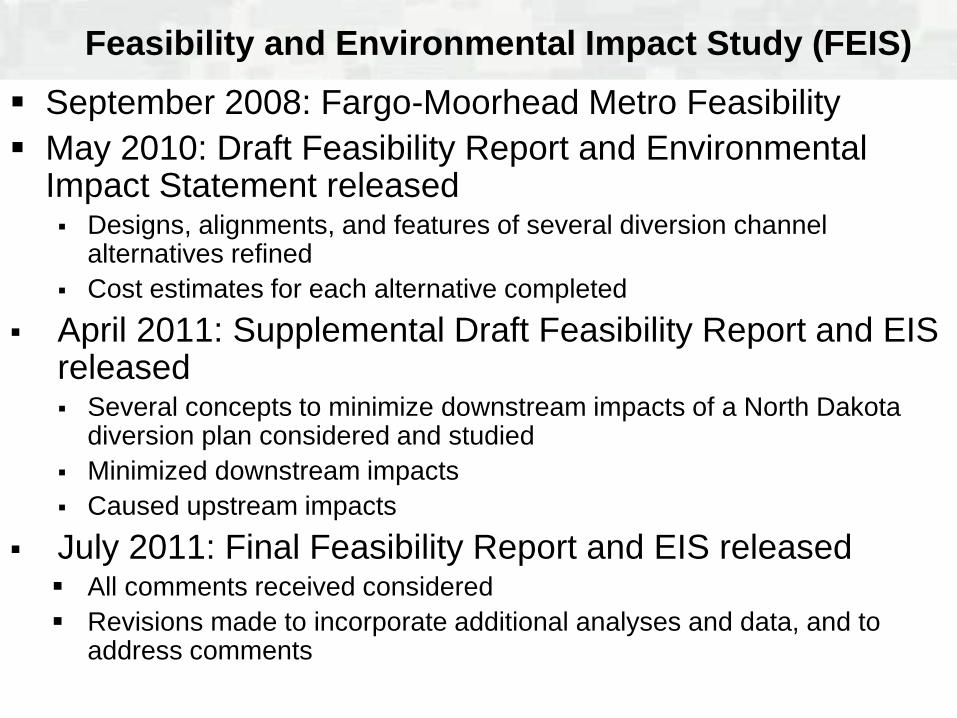
September 2008: Fargo-Moorhead Metro Feasibility
May 2010: Draft Feasibility Report and Environmental Impact Statement released Designs, alignments, and features of several diversion channel
alternatives refined
Cost estimates for each alternative completed
April 2011: Supplemental Draft Feasibility Report and EIS released Several concepts to minimize downstream impacts of a North Dakota
diversion plan considered and studied
Minimized downstream impacts
Caused upstream impacts
July 2011: Final Feasibility Report and EIS released All comments received considered
Revisions made to incorporate additional analyses and data, and to address comments
Feasibility and Environmental Impact Study (FEIS)
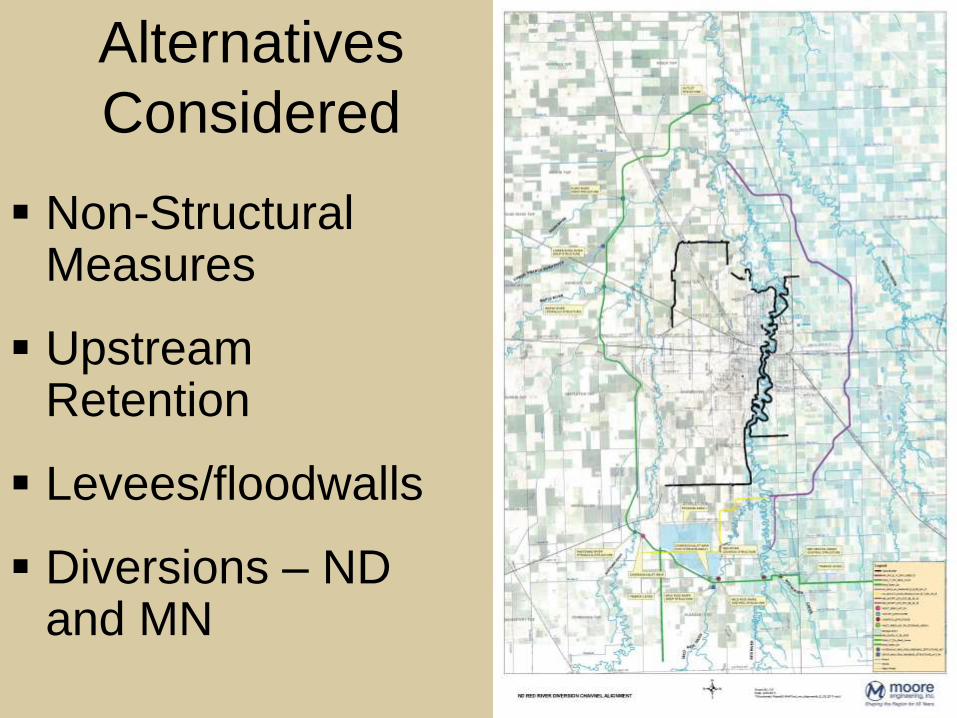
Alternatives
Considered
Non-Structural Measures
Upstream Retention
Levees/floodwalls
Diversions – ND and MN
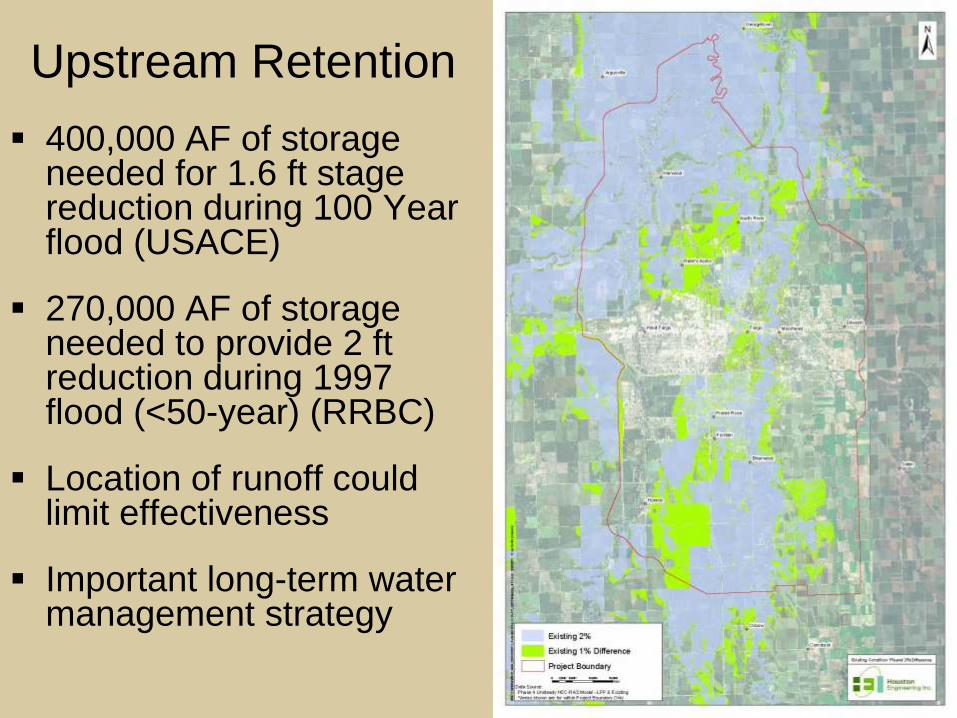
Upstream Retention
400,000 AF of storage needed for 1.6 ft stage reduction during 100 Year flood (USACE)
270,000 AF of storage needed to provide 2 ftreduction during 1997 flood (<50-year) (RRBC)
Location of runoff could limit effectiveness
Important long-term water management strategy
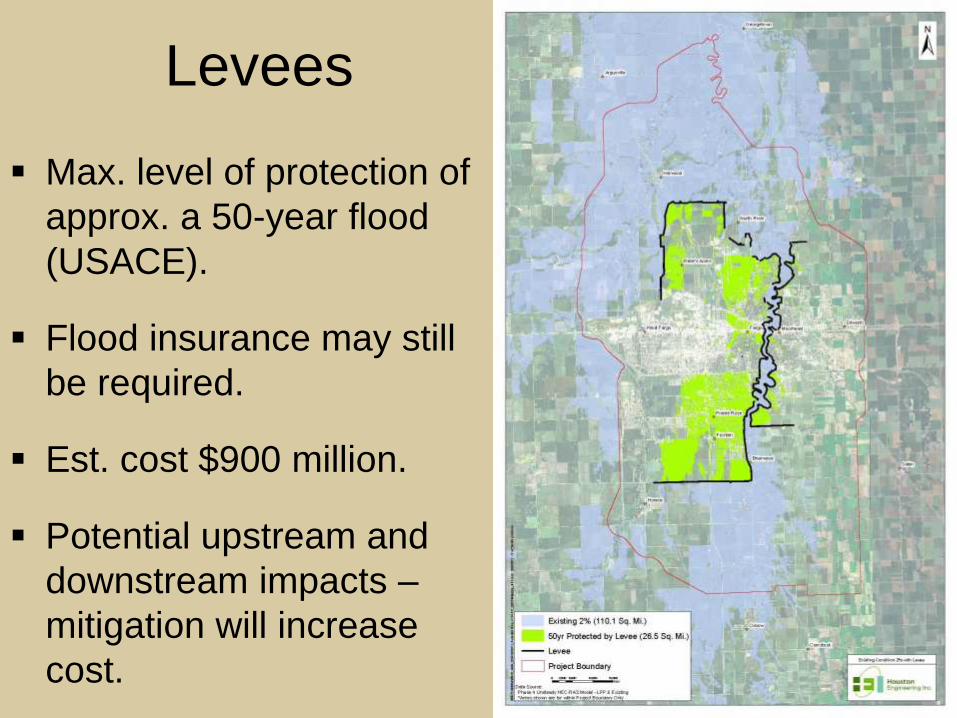
Levees
Max. level of protection of
approx. a 50-year flood
(USACE).
Flood insurance may still
be required.
Est. cost $900 million.
Potential upstream and
downstream impacts –
mitigation will increase
cost.
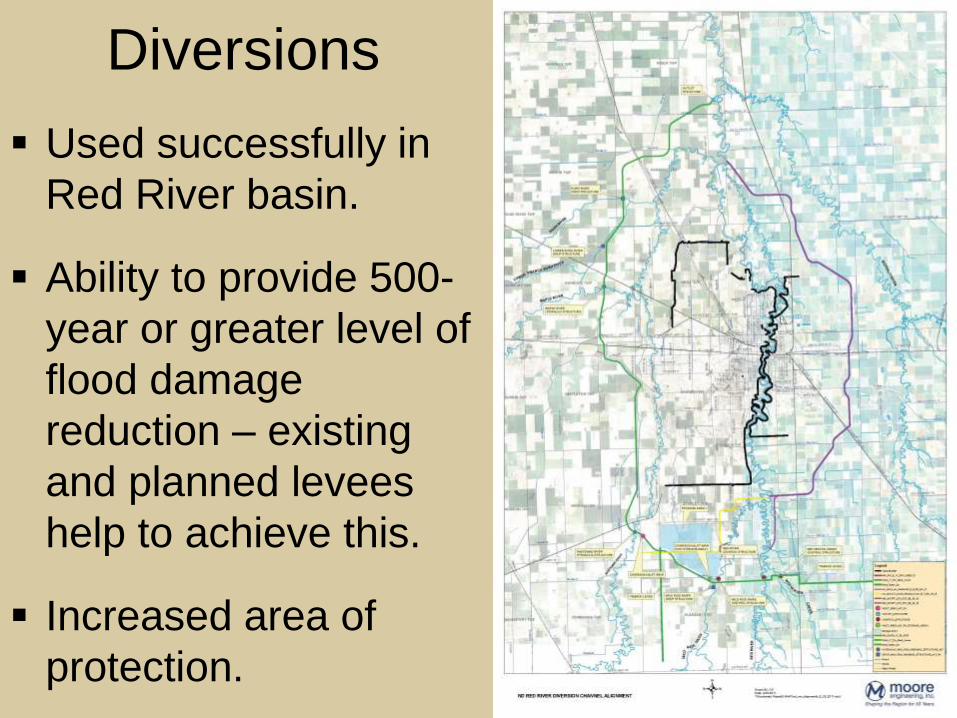
Diversions
Used successfully in
Red River basin.
Ability to provide 500-
year or greater level of
flood damage
reduction – existing
and planned levees
help to achieve this.
Increased area of
protection.
BUILDING STRONG®
Hydrology
• Full Period of Record at USGS Gage
►1882, 1897, and 1902 to 2009
• Investigated Stationarity
►Expert Opinion Elicitation (EOE) Panel
16
BUILDING STRONG®
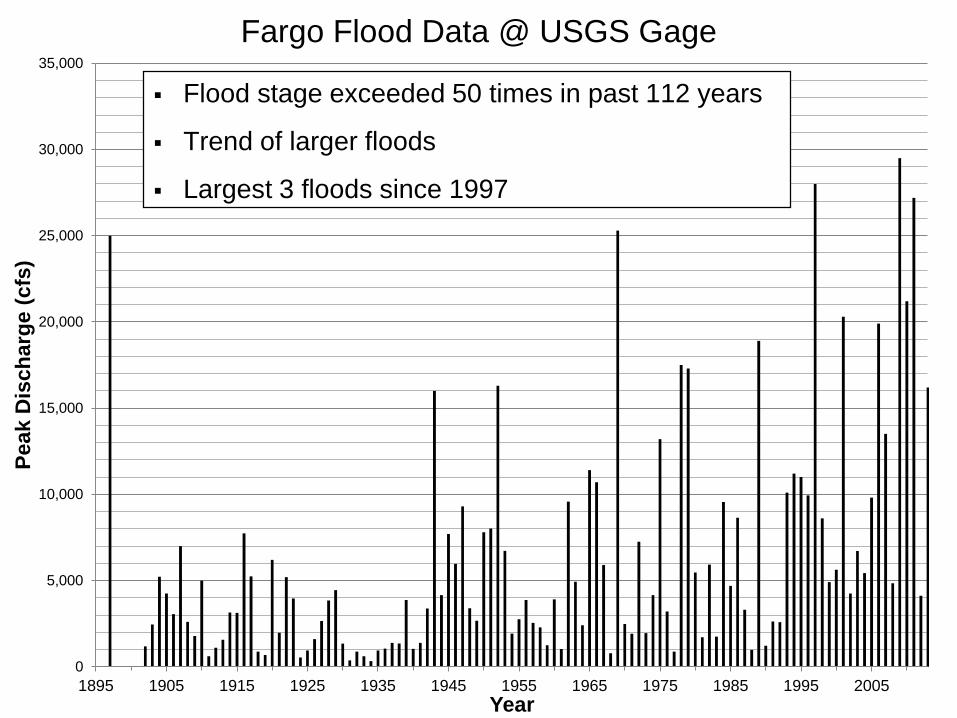
Fargo Flood Data @ USGS Gage
0
5,000
10,000
15,000
20,000
25,000
30,000
35,000
1895 1905 1915 1925 1935 1945 1955 1965 1975 1985 1995 2005
Peak
Dis
ch
arg
e (
cfs
)
Year
Flood stage exceeded 50 times in past 112 years
Trend of larger floods
Largest 3 floods since 1997
BUILDING STRONG®0
10,000
20,000
30,000
40,000
50,000
60,000
70,000
1900 1905 1910 1915 1920 1925 1930 1935 1940 1945 1950 1955 1960 1965 1970 1975 1980 1985 1990 1995 2000 2005 2010 ?
Ma
xim
um
Da
ily F
low
Ra
te (
cu
bic
-fe
et
pe
r s
ec
on
d)
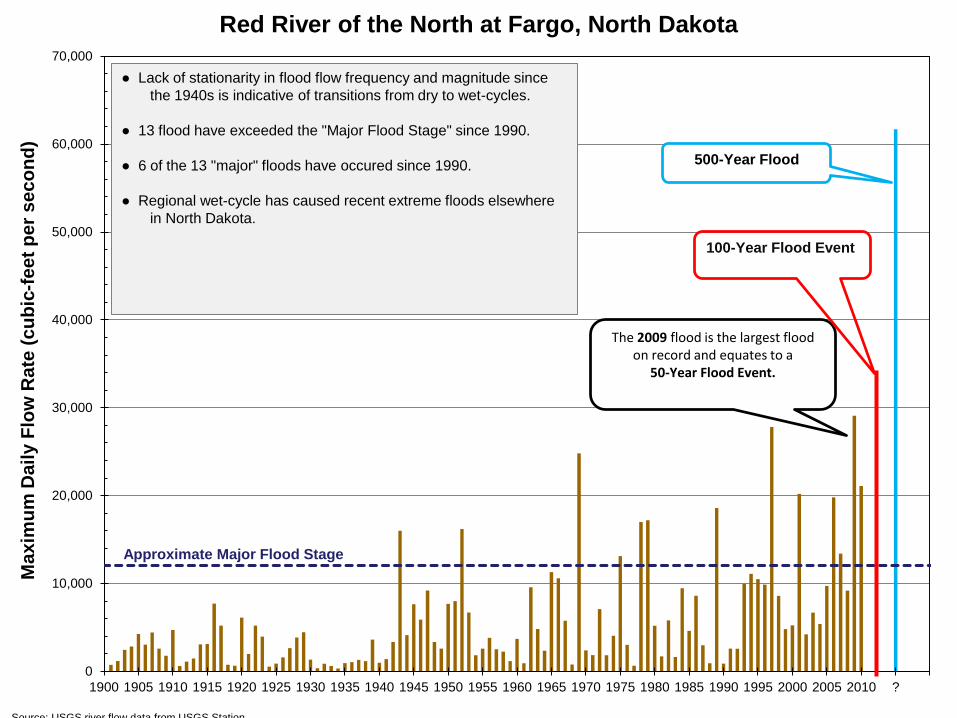
Red River of the North at Fargo, North Dakota
500-Year Flood
The 2009 flood is the largest floodon record and equates to a
50-Year Flood Event.
Source: USGS river flow data from USGS Station
Approximate Major Flood Stage
● Lack of stationarity in flood flow frequency and magnitude since
the 1940s is indicative of transitions from dry to wet-cycles.
● 13 flood have exceeded the "Major Flood Stage" since 1990.
● 6 of the 13 "major" floods have occured since 1990.
● Regional wet-cycle has caused recent extreme floods elsewhere
in North Dakota.
100-Year Flood Event
BUILDING STRONG®
0
5,000
10,000
15,000
20,000
25,000
30,000
35,000
1900 1905 1910 1915 1920 1925 1930 1935 1940 1945 1950 1955 1960 1965 1970 1975 1980 1985 1990 1995 2000 2005 2010 ?
Ma
xim
um
Da
ily F
low
Ra
te (
cu
bic
-fe
et
pe
r s
ec
on
d)
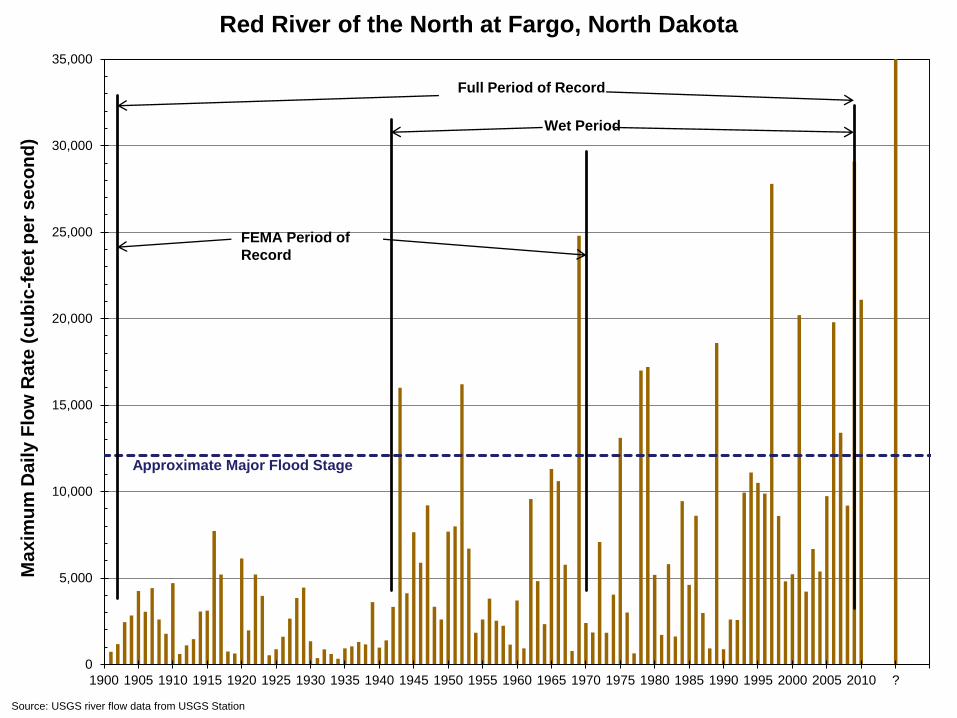
Red River of the North at Fargo, North Dakota
Source: USGS river flow data from USGS Station
Approximate Major Flood Stage
Full Period of Record
FEMA Period of
Record
Wet Period

BUILDING STRONG®
EOE Experts David Ford, PhD Facilitator, David Ford Consultants
Michael Deering, PE, D.WRE Senior Hydraulic Engineer, Water
Resource System Division, USACE Hydrologic Engineering Center
Scott Dummer, Hydrologist-in-Charge, National Weather Service
North Central River Forecast Center, Chanhassen, MN
Robert Hirsch, PhD Research Hydrologist, US Geological Survey
(USGS) National Research Program
Rolf Olsen, PhD Water Resources Systems Engineer, USACE
Institute for Water Resources
David Raff, PhD, PE Technical Specialist, Flood Hydrology and
Emergency Management Group, Technical Services Center, US
Bureau of Reclamation (USBR)
Aldo (Skip) Vecchia, PhD Research Statistician, USGS North
Dakota
BUILDING STRONG®
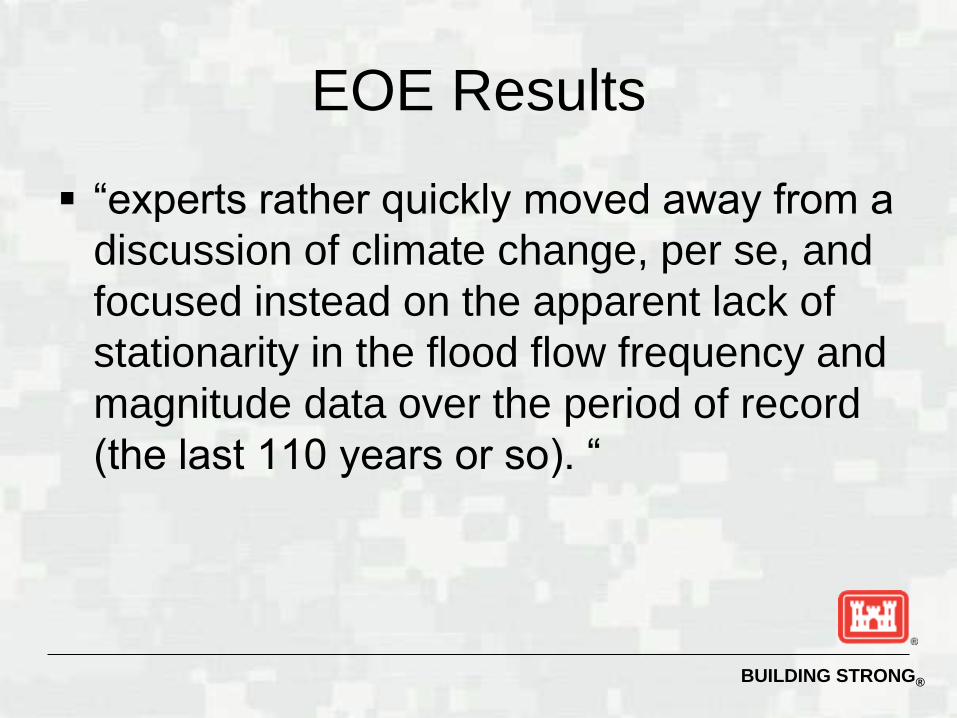
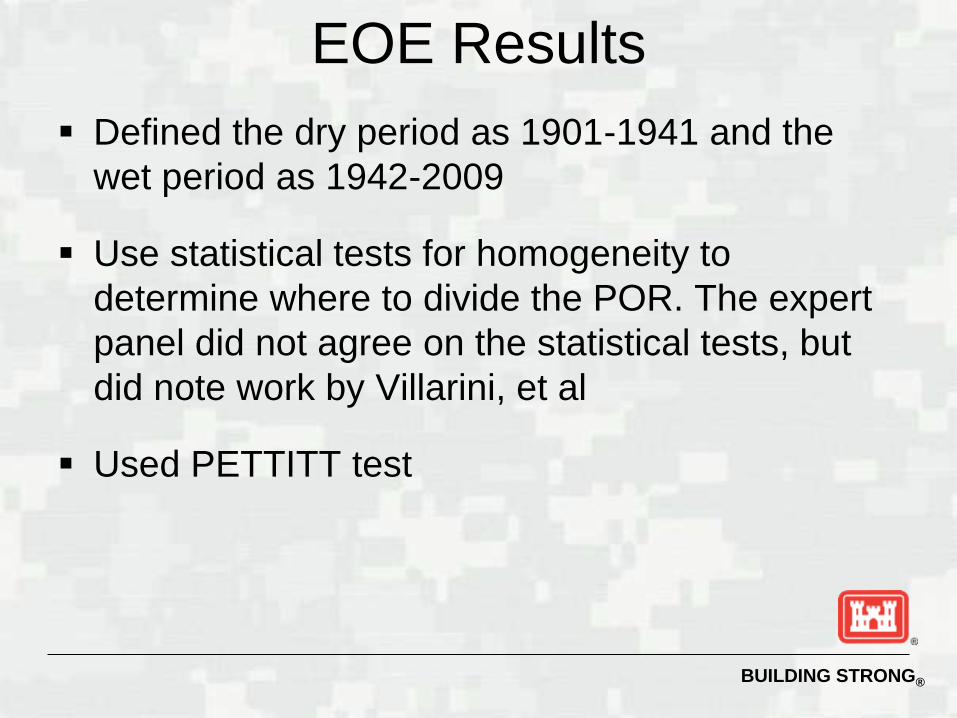
EOE Results
“experts rather quickly moved away from a
discussion of climate change, per se, and
focused instead on the apparent lack of
stationarity in the flood flow frequency and
magnitude data over the period of record
(the last 110 years or so). “
BUILDING STRONG®
EOE Results
Defined the dry period as 1901-1941 and the
wet period as 1942-2009
Use statistical tests for homogeneity to
determine where to divide the POR. The expert
panel did not agree on the statistical tests, but
did note work by Villarini, et al
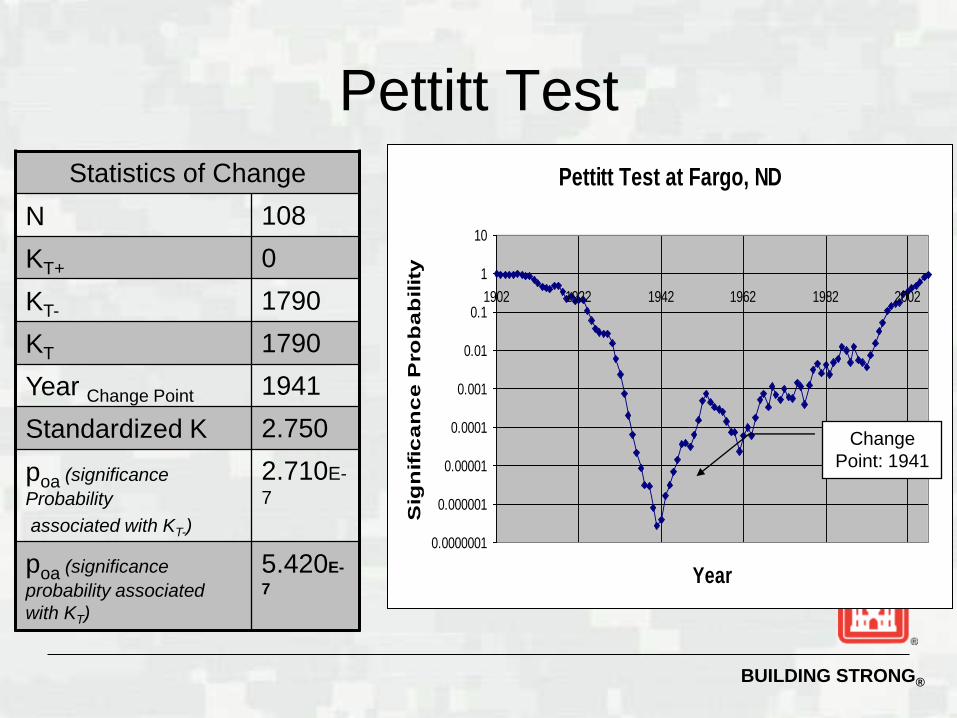
Used PETTITT test
BUILDING STRONG®
Pettitt Test
Statistics of Change
N 108
KT+ 0
KT- 1790
KT 1790
Year Change Point 1941
Standardized K 2.750
poa (significance
Probability
associated with KT-)
2.710E-
7
poa (significance
probability associated
with KT)
5.420E-
7
Pettitt Test at Fargo, ND
0.0000001
0.000001
0.00001
0.0001
0.001
0.01
0.1
1
10
1902 1922 1942 1962 1982 2002
Year
Sig
nif
ica
nc
e P
ro
ba
bilit
y
Change
Point: 1941
BUILDING STRONG®
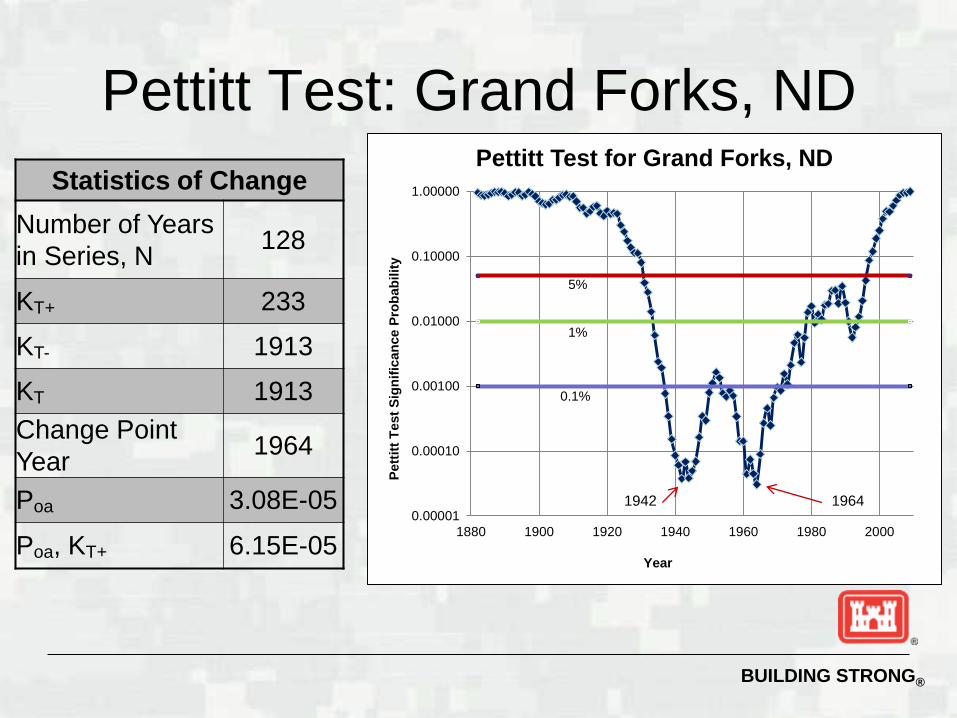
Pettitt Test: Grand Forks, ND
Statistics of Change
Number of Years
in Series, N128
KT+ 233
KT- 1913
KT 1913
Change Point
Year1964
Poa 3.08E-05
Poa, KT+ 6.15E-05
0.00001
0.00010
0.00100
0.01000
0.10000
1.00000
1880 1900 1920 1940 1960 1980 2000
Pett
itt
Test
Sig
nif
ican
ce P
rob
ab
ilit
y
Year
Pettitt Test for Grand Forks, ND
1942 1964
5%
1%
0.1%
BUILDING STRONG®
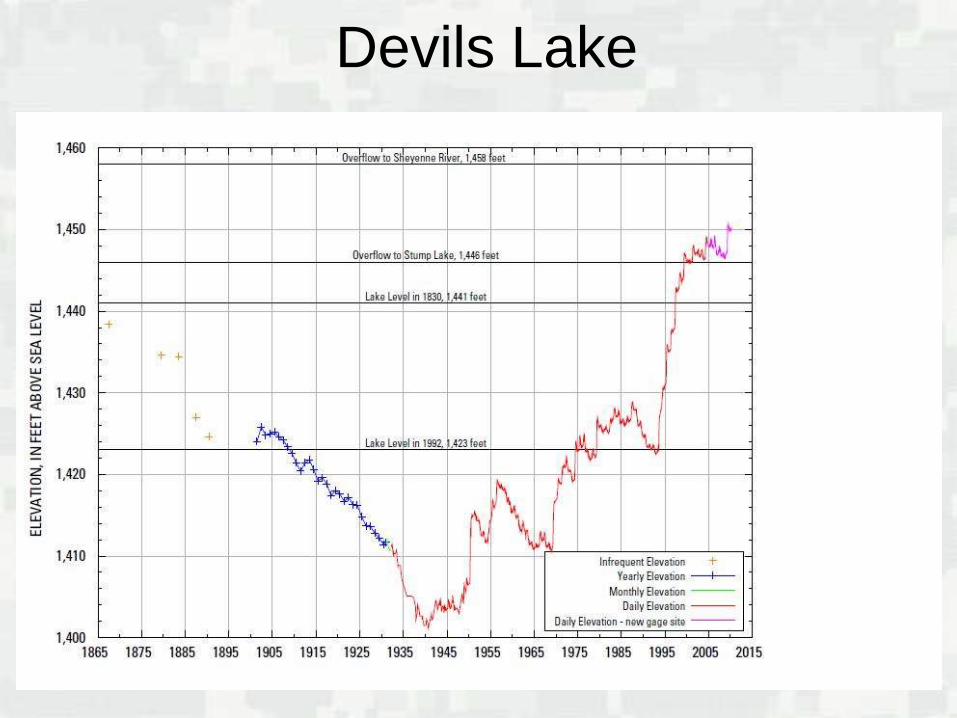
Devils Lake
BUILDING STRONG®
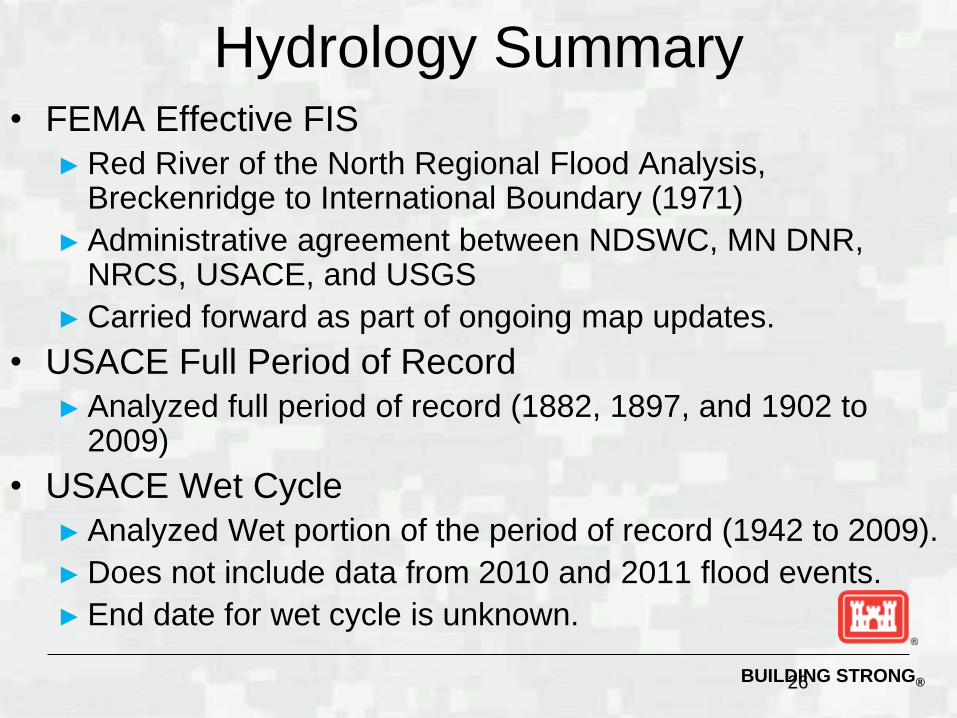
Hydrology Summary• FEMA Effective FIS
► Red River of the North Regional Flood Analysis, Breckenridge to International Boundary (1971)
► Administrative agreement between NDSWC, MN DNR, NRCS, USACE, and USGS
► Carried forward as part of ongoing map updates.
• USACE Full Period of Record
► Analyzed full period of record (1882, 1897, and 1902 to 2009)
• USACE Wet Cycle
► Analyzed Wet portion of the period of record (1942 to 2009).
► Does not include data from 2010 and 2011 flood events.
► End date for wet cycle is unknown.
26
BUILDING STRONG®
Fargo Flood Data @ USGS Gage
0
5,000
10,000
15,000
20,000
25,000
30,000
35,000
1895 1905 1915 1925 1935 1945 1955 1965 1975 1985 1995 2005
Peak
Dis
ch
arg
e (
cfs
)
Year
10-yr
10-yr COE, Period of
10-yr COE, Expert
50-yr
50-yr COE, Period of
50-yr COE, Expert
100-yr 100-yr COE, Period of 100-yr COE, Expert
BUILDING STRONG®
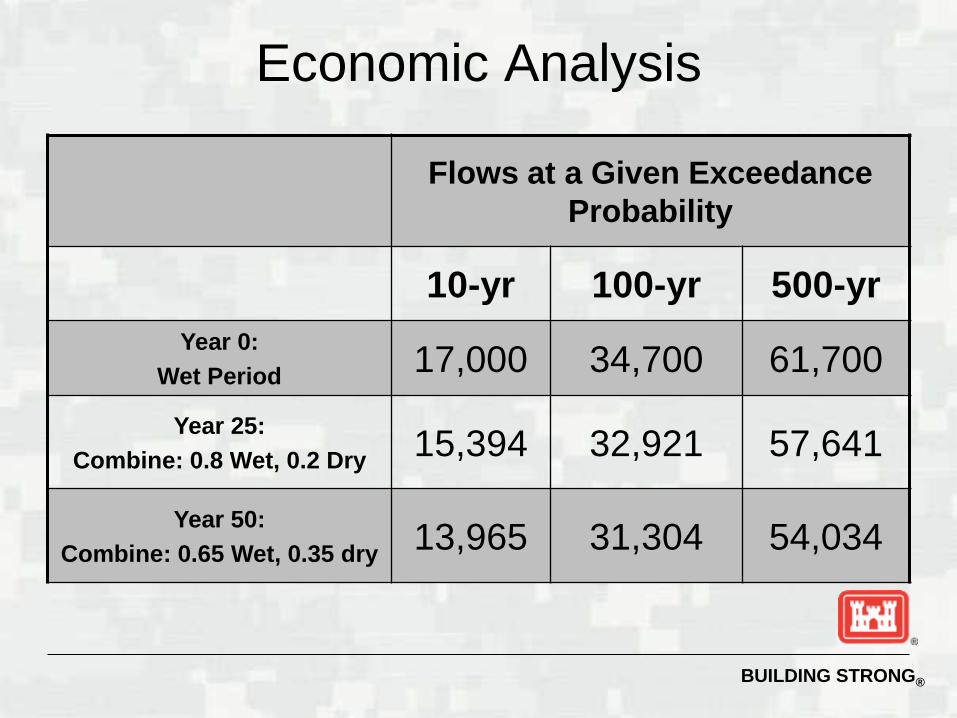
Economic Analysis
Flows at a Given Exceedance
Probability
10-yr 100-yr 500-yr
Year 0:
Wet Period17,000 34,700 61,700
Year 25:
Combine: 0.8 Wet, 0.2 Dry15,394 32,921 57,641
Year 50:
Combine: 0.65 Wet, 0.35 dry13,965 31,304 54,034
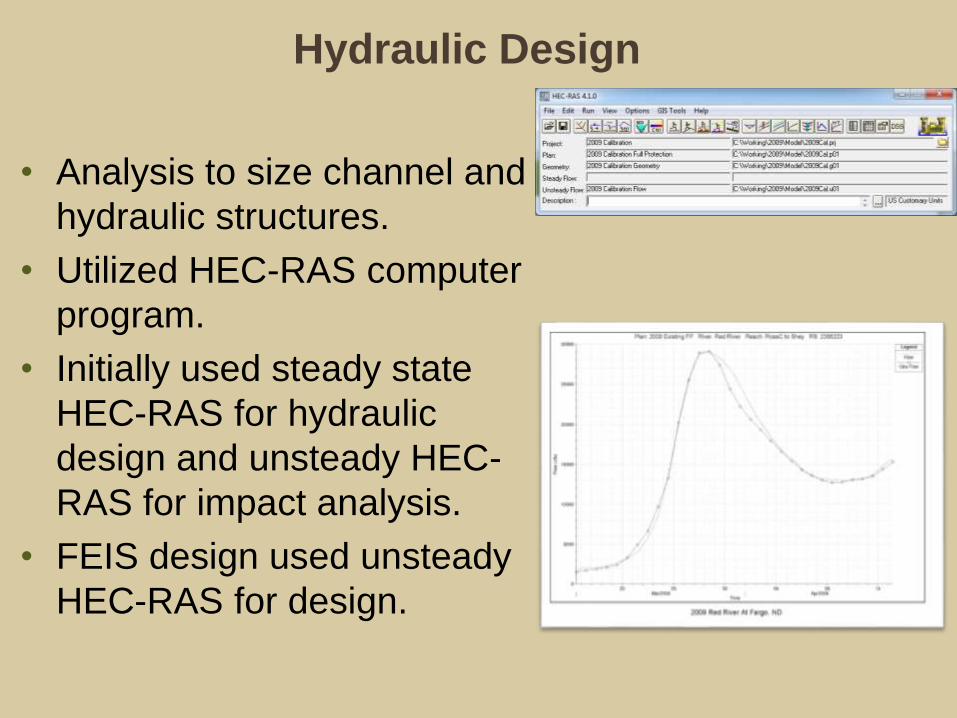
• Analysis to size channel and
hydraulic structures.
• Utilized HEC-RAS computer
program.
• Initially used steady state
HEC-RAS for hydraulic
design and unsteady HEC-
RAS for impact analysis.
• FEIS design used unsteady
HEC-RAS for design.
Hydraulic Design
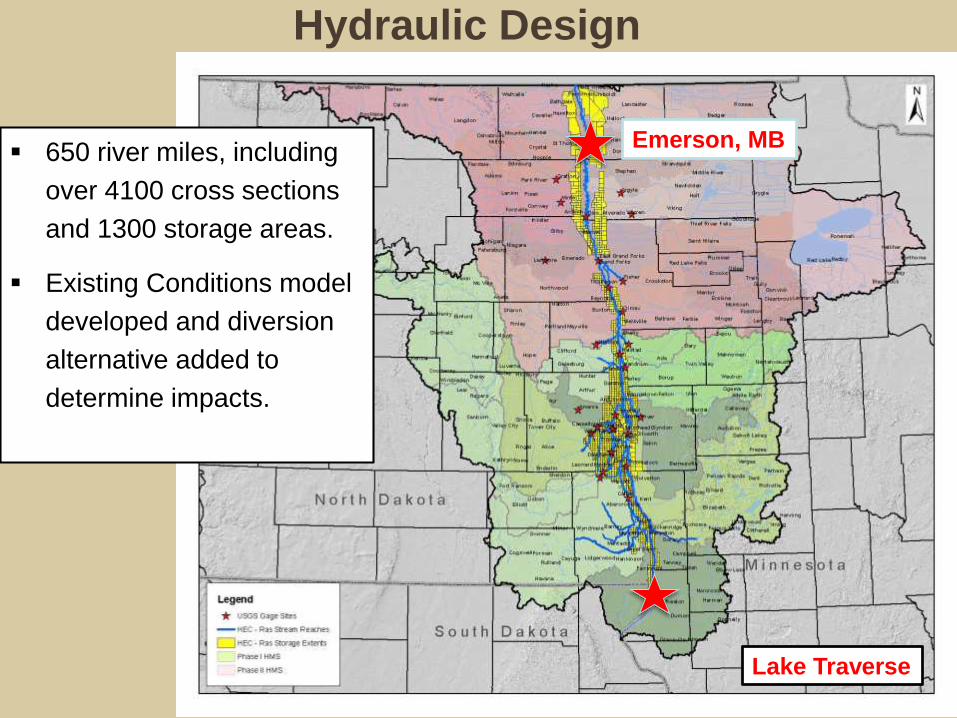
Lake Traverse
Emerson, MB
Hydraulic Design
650 river miles, including
over 4100 cross sections
and 1300 storage areas.
Existing Conditions model
developed and diversion
alternative added to
determine impacts.
BUILDING STRONG®31
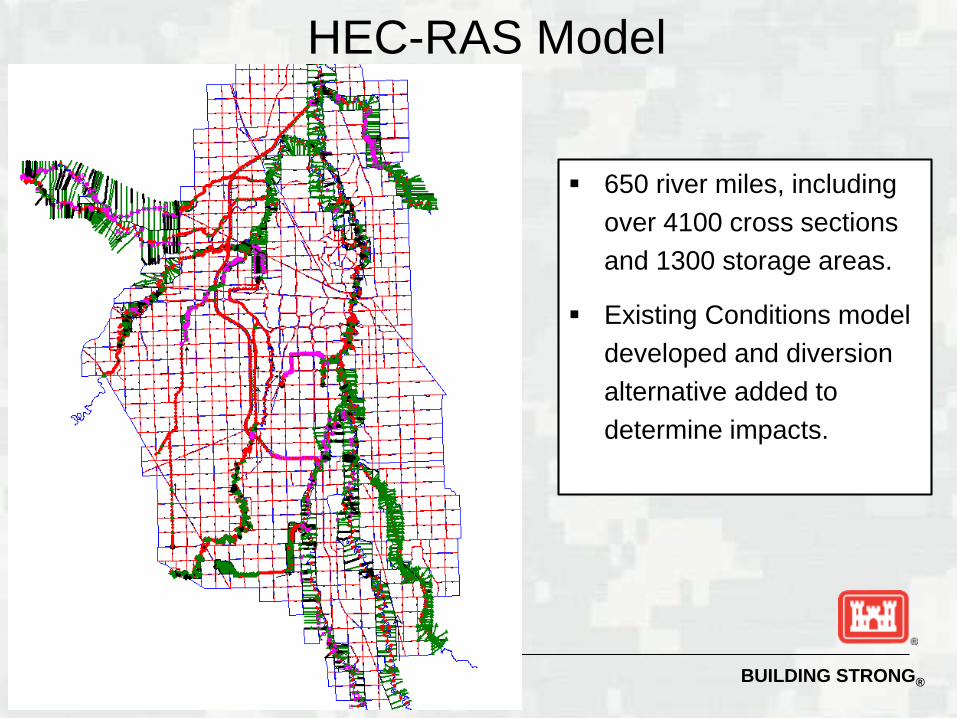
HEC-RAS Model
650 river miles, including
over 4100 cross sections
and 1300 storage areas.
Existing Conditions model
developed and diversion
alternative added to
determine impacts.
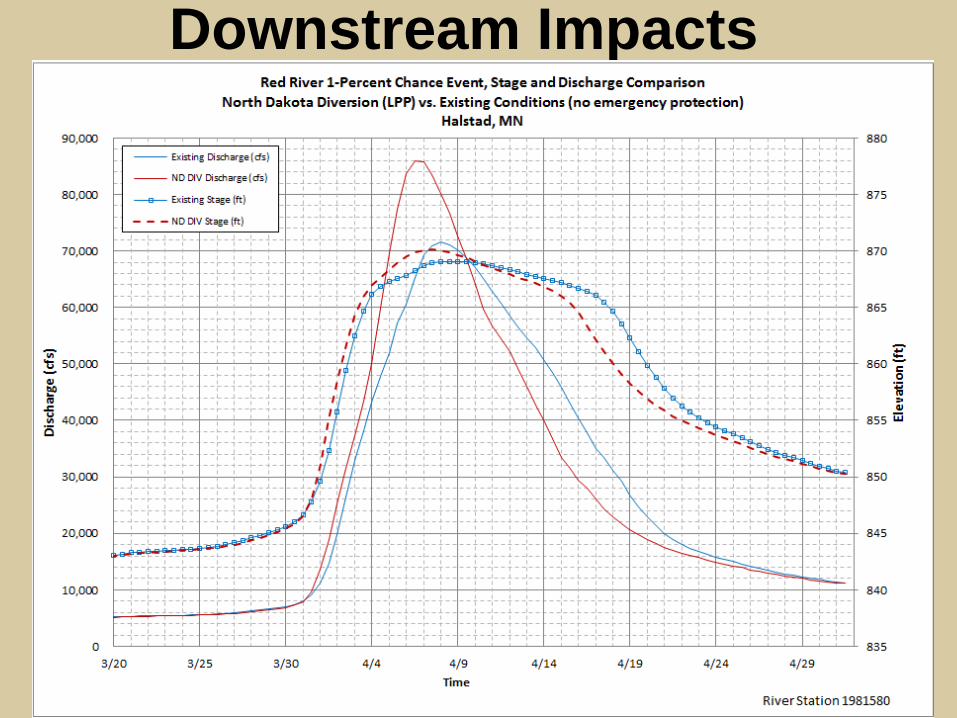
Downstream Impacts
BUILDING STRONG®
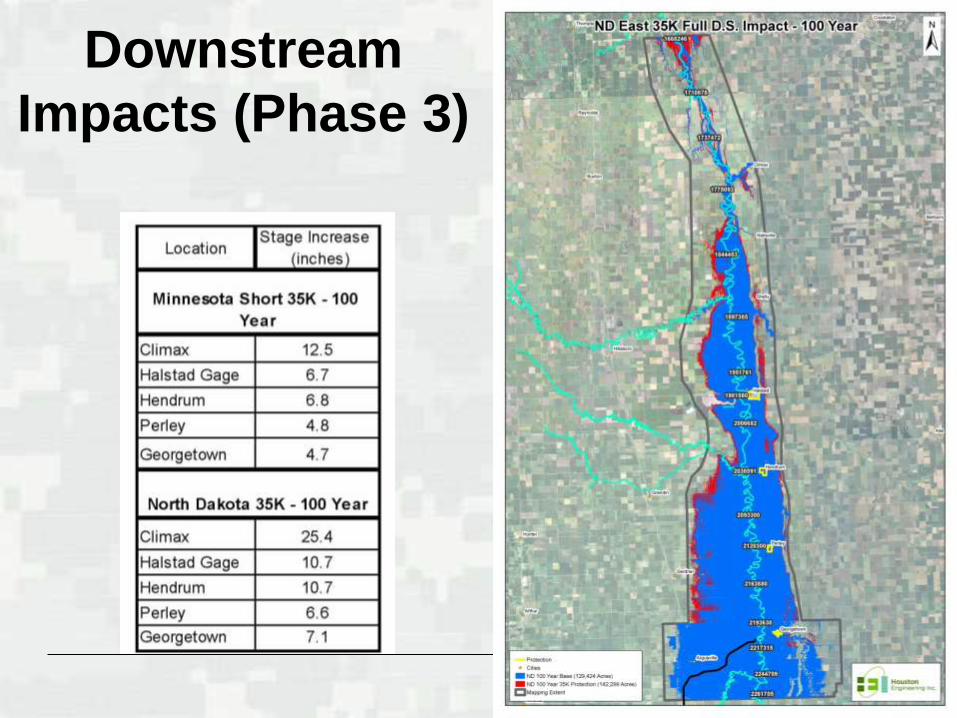
Downstream
Impacts (Phase 3)
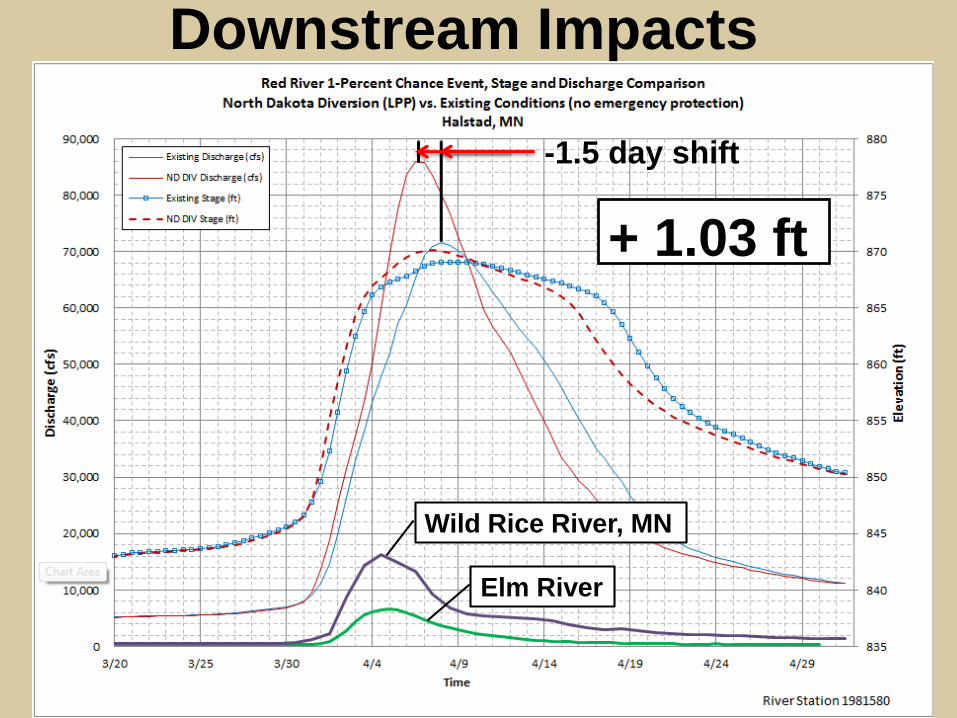
Downstream Impacts
-1.5 day shift
+ 1.03 ft
Wild Rice River, MN
Elm River
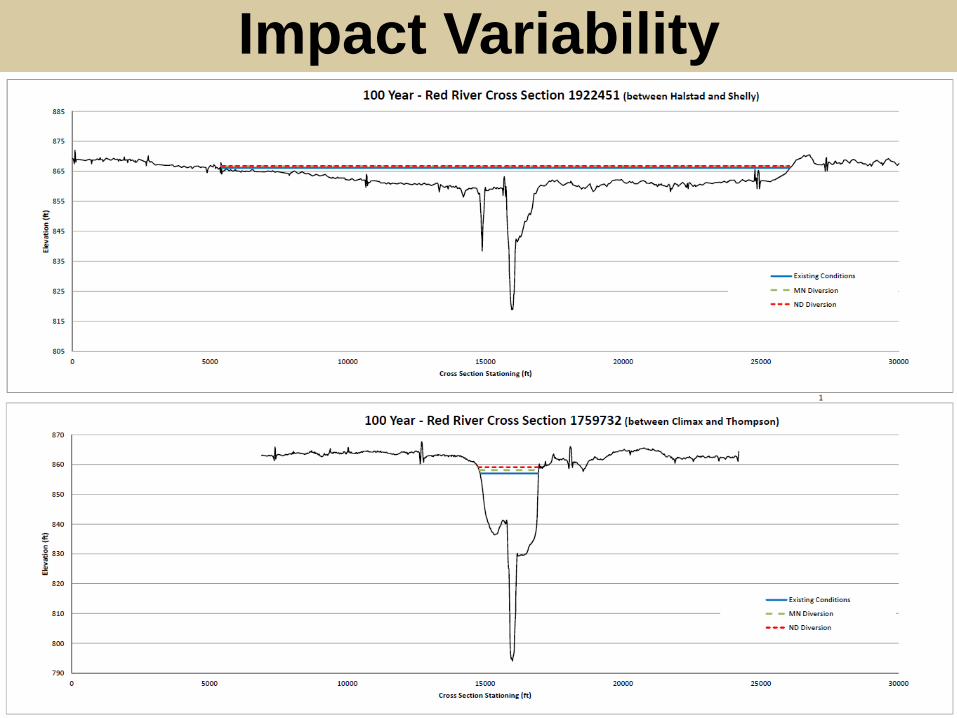
Impact Variability
BUILDING STRONG®36
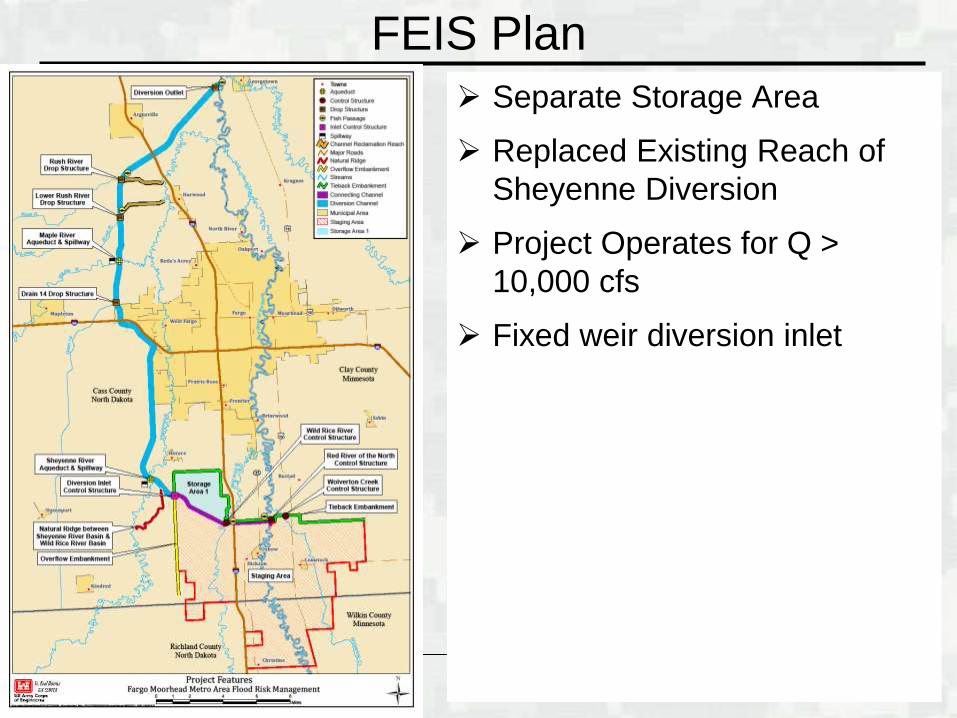
FEIS Plan
Separate Storage Area
Replaced Existing Reach of
Sheyenne Diversion
Project Operates for Q >
10,000 cfs
Fixed weir diversion inlet
BUILDING STRONG®37
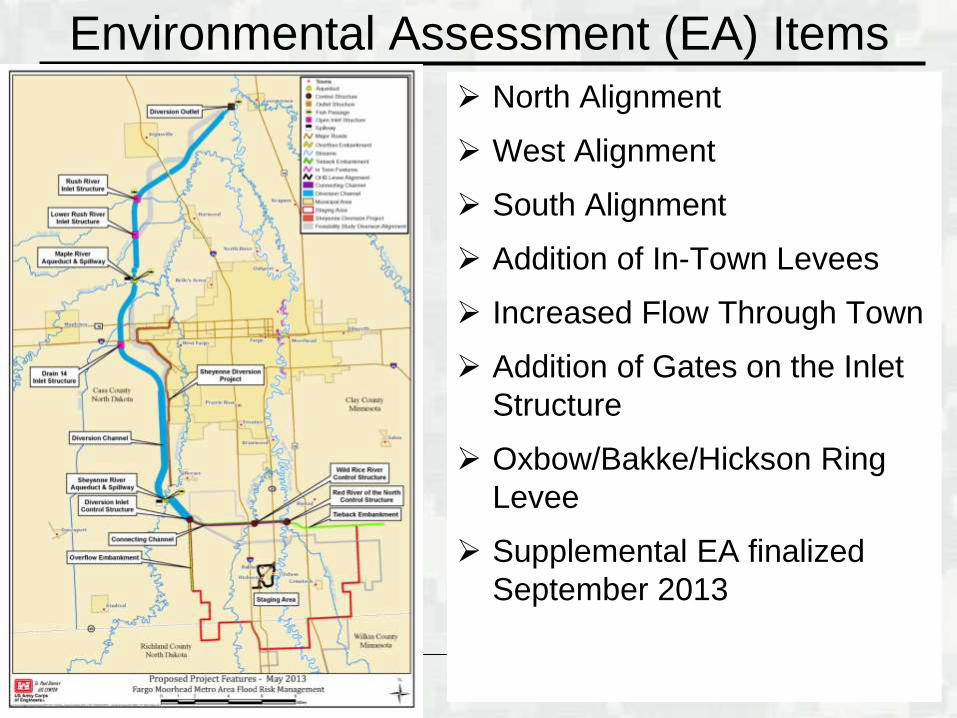
Environmental Assessment (EA) Items
North Alignment
West Alignment
South Alignment
Addition of In-Town Levees
Increased Flow Through Town
Addition of Gates on the Inlet
Structure
Oxbow/Bakke/Hickson Ring
Levee
Supplemental EA finalized
September 2013
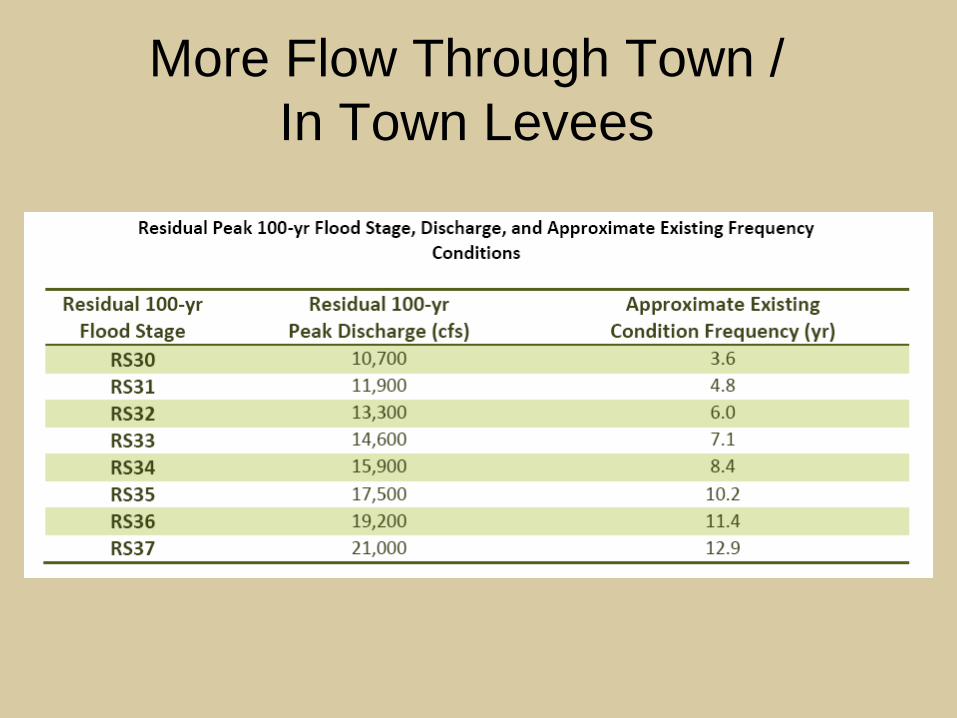
More Flow Through Town /
In Town Levees
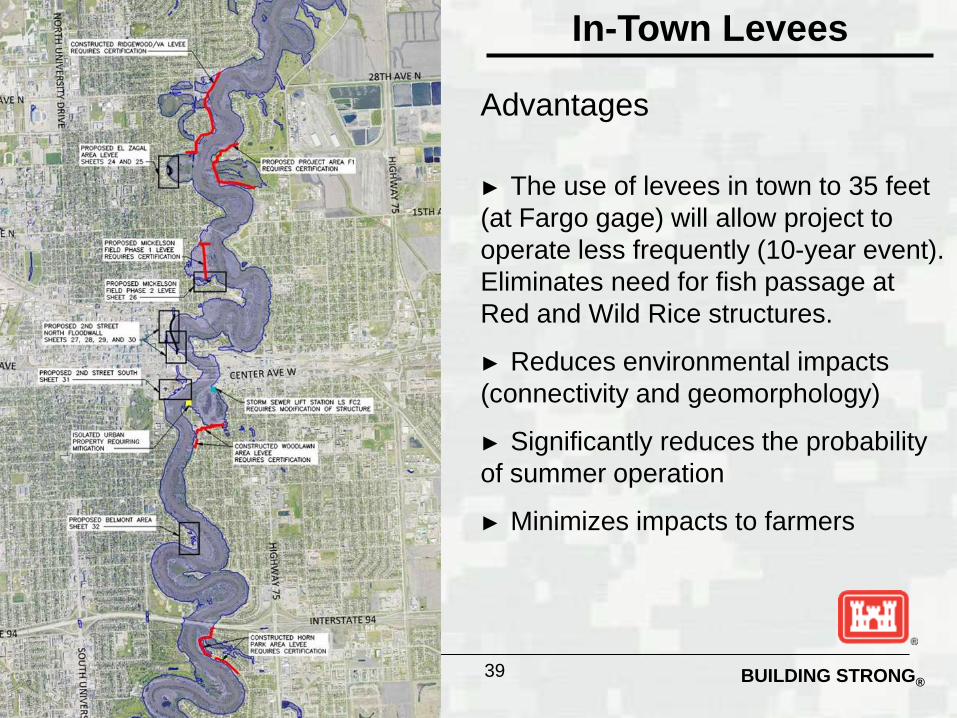
BUILDING STRONG®
In-Town Levees
Advantages
► The use of levees in town to 35 feet
(at Fargo gage) will allow project to
operate less frequently (10-year event).
Eliminates need for fish passage at
Red and Wild Rice structures.
► Reduces environmental impacts
(connectivity and geomorphology)
► Significantly reduces the probability
of summer operation
► Minimizes impacts to farmers
39
Diversion Inlet Gates
• Feasibility Study Included 90 foot wide fixed weir
• Advantages of adding adjustable gates
o Reduces upstream staging elevations
o Adds flexibility in operations
o Affects timing of flows in diversion
o Provides more control of flow (within design constraints)
• Variable flows to better match downstream conditions
• Ability to drawdown staging area faster.
Gates will be similar to
gates on the Red River
Control Structure
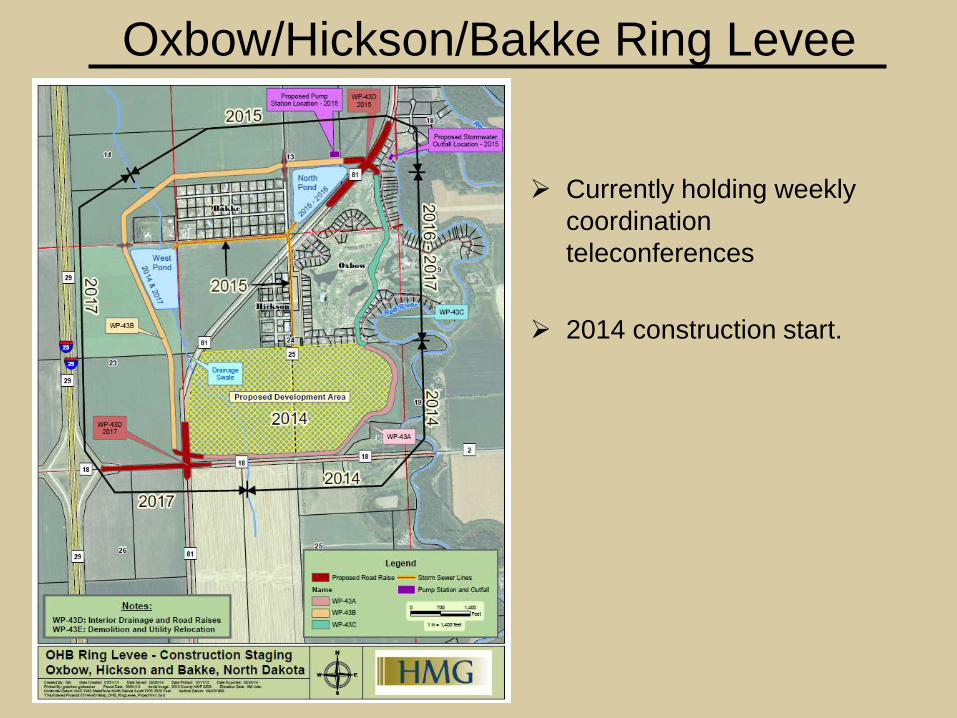
Oxbow/Hickson/Bakke Ring Levee
Currently holding weekly
coordination
teleconferences
2014 construction start.

BUILDING STRONG®42
20,000 cfs ND diversion channel
34,000 acre staging area
30-mile diversion
12 miles of tie-back embankments
Control structures on the Red & Wild
Rice rivers
Aqueduct & spillway structures on the
Sheyenne & Maple rivers
Rock ramp drop structure on the Lower
Rush & Rush rivers
Meandering low-flow channel
Non-structural mitigation for impacts in
the storage & staging areas
Negligible downstream impacts
Federally Recommended Plan
BUILDING STRONG®43
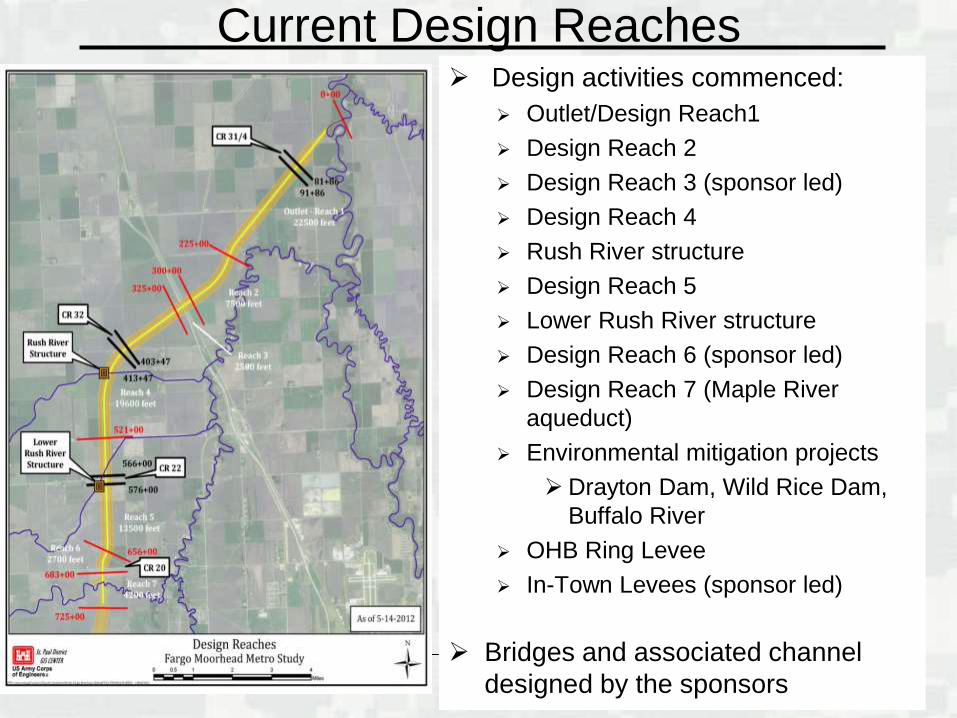
Design activities commenced:
Outlet/Design Reach1
Design Reach 2
Design Reach 3 (sponsor led)
Design Reach 4
Rush River structure
Design Reach 5
Lower Rush River structure
Design Reach 6 (sponsor led)
Design Reach 7 (Maple River
aqueduct)
Environmental mitigation projects
Drayton Dam, Wild Rice Dam,
Buffalo River
OHB Ring Levee
In-Town Levees (sponsor led)
Bridges and associated channel
designed by the sponsors
Current Design Reaches
BUILDING STRONG®44
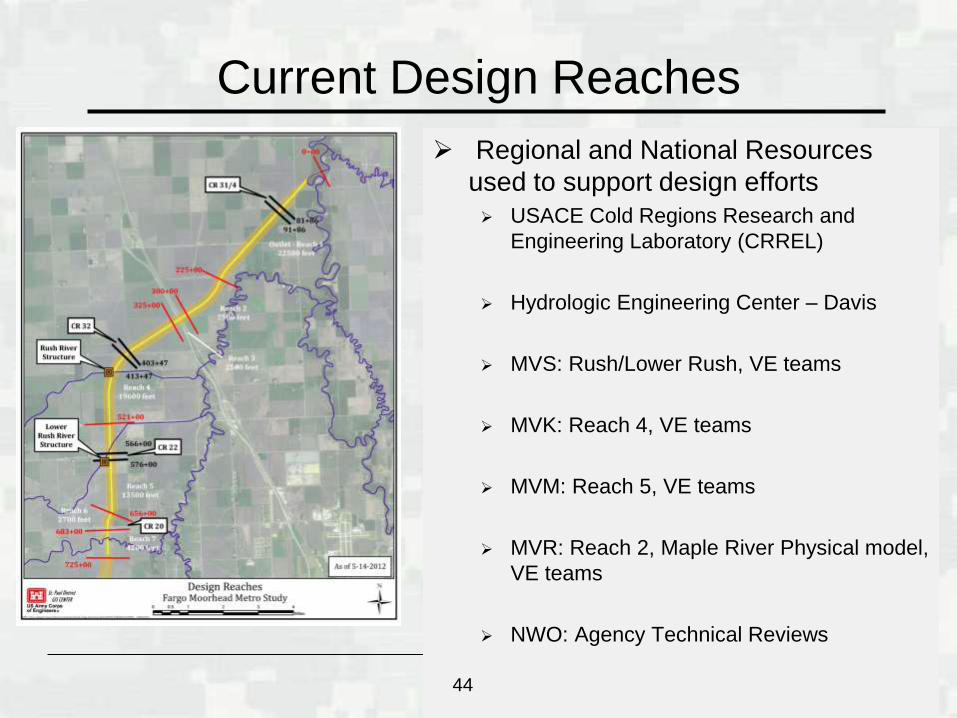
Regional and National Resources
used to support design efforts
USACE Cold Regions Research and
Engineering Laboratory (CRREL)
Hydrologic Engineering Center – Davis
MVS: Rush/Lower Rush, VE teams
MVK: Reach 4, VE teams
MVM: Reach 5, VE teams
MVR: Reach 2, Maple River Physical model,
VE teams
NWO: Agency Technical Reviews
Current Design Reaches
44
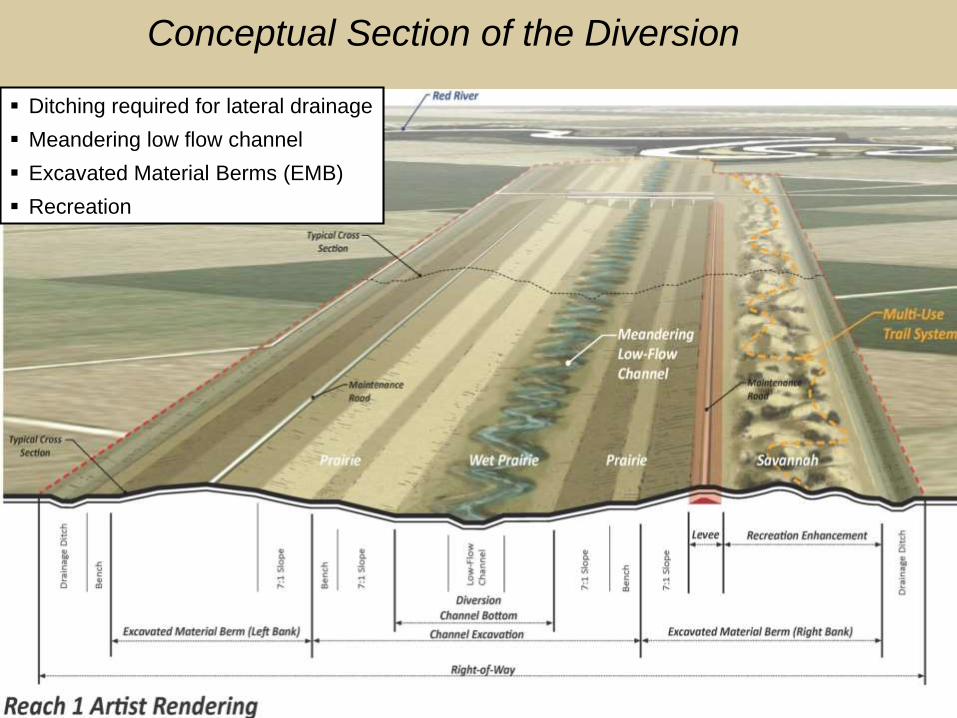
Conceptual Section of the Diversion
Ditching required for lateral drainage
Meandering low flow channel
Excavated Material Berms (EMB)
Recreation
BUILDING STRONG®
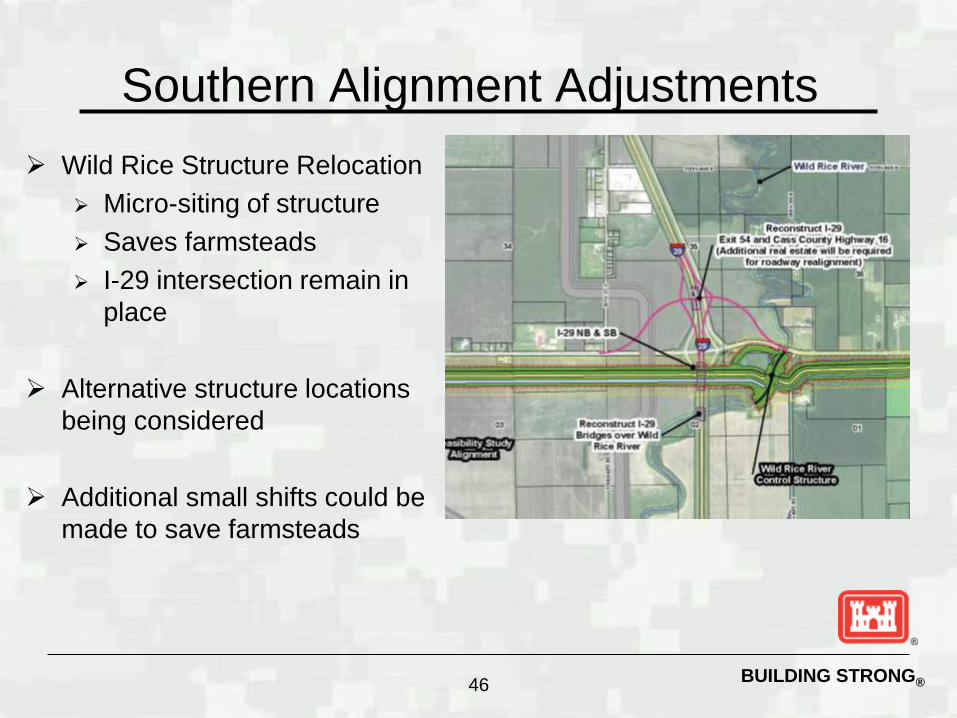
Wild Rice Structure Relocation
Micro-siting of structure
Saves farmsteads
I-29 intersection remain in
place
Alternative structure locations
being considered
Additional small shifts could be
made to save farmsteads
46
Southern Alignment Adjustments
BUILDING STRONG®47
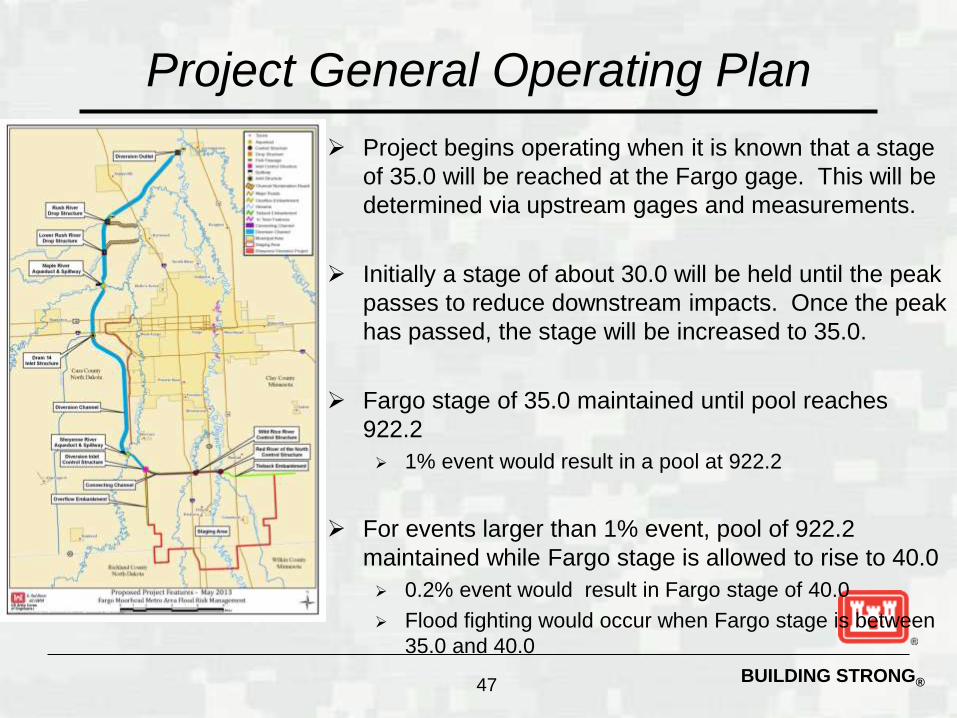
Project begins operating when it is known that a stage
of 35.0 will be reached at the Fargo gage. This will be
determined via upstream gages and measurements.
Initially a stage of about 30.0 will be held until the peak
passes to reduce downstream impacts. Once the peak
has passed, the stage will be increased to 35.0.
Fargo stage of 35.0 maintained until pool reaches
922.2
1% event would result in a pool at 922.2
For events larger than 1% event, pool of 922.2
maintained while Fargo stage is allowed to rise to 40.0
0.2% event would result in Fargo stage of 40.0
Flood fighting would occur when Fargo stage is between
35.0 and 40.0
Project General Operating Plan
BUILDING STRONG®48
Project General Operating Plan (continued)
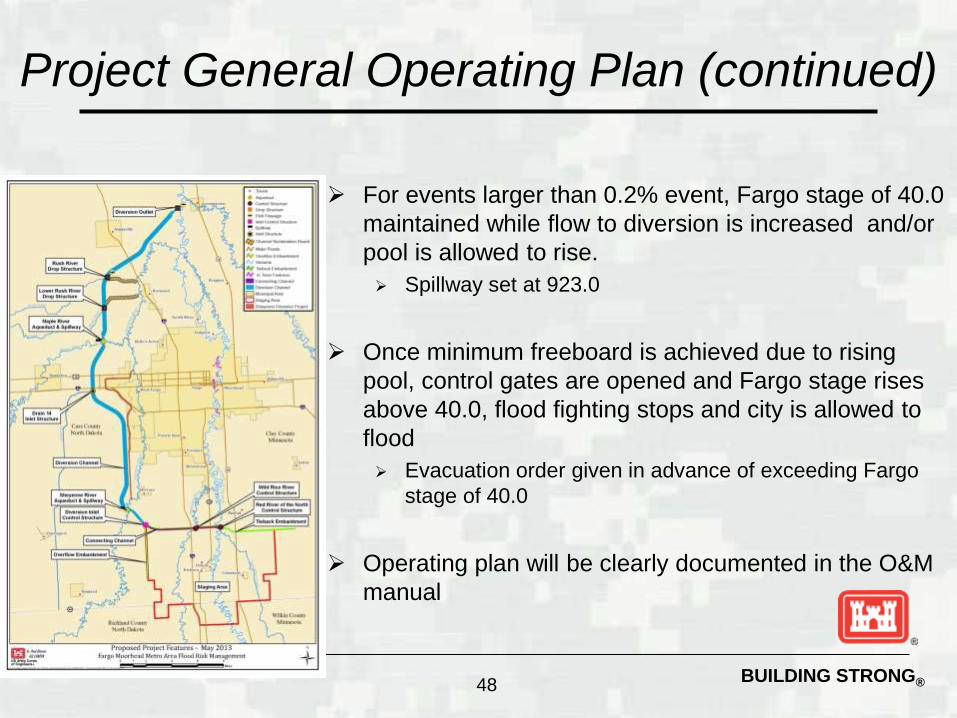
For events larger than 0.2% event, Fargo stage of 40.0
maintained while flow to diversion is increased and/or
pool is allowed to rise.
Spillway set at 923.0
Once minimum freeboard is achieved due to rising
pool, control gates are opened and Fargo stage rises
above 40.0, flood fighting stops and city is allowed to
flood
Evacuation order given in advance of exceeding Fargo
stage of 40.0
Operating plan will be clearly documented in the O&M
manual
BUILDING STRONG®
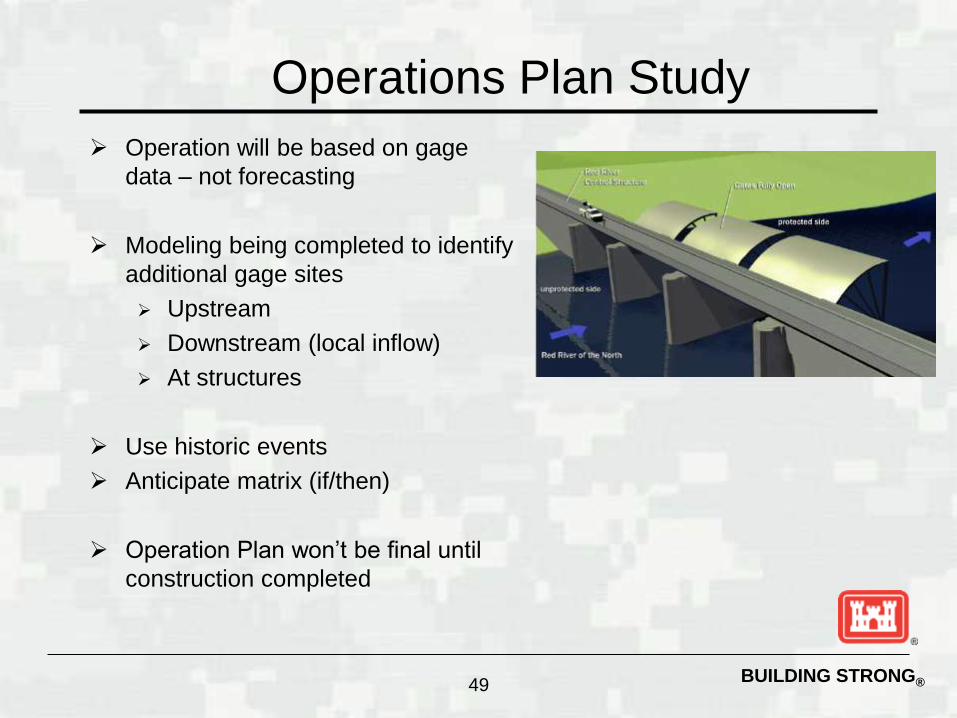
Operation will be based on gage
data – not forecasting
Modeling being completed to identify
additional gage sites
Upstream
Downstream (local inflow)
At structures
Use historic events
Anticipate matrix (if/then)
Operation Plan won’t be final until
construction completed
49
Operations Plan Study
BUILDING STRONG®
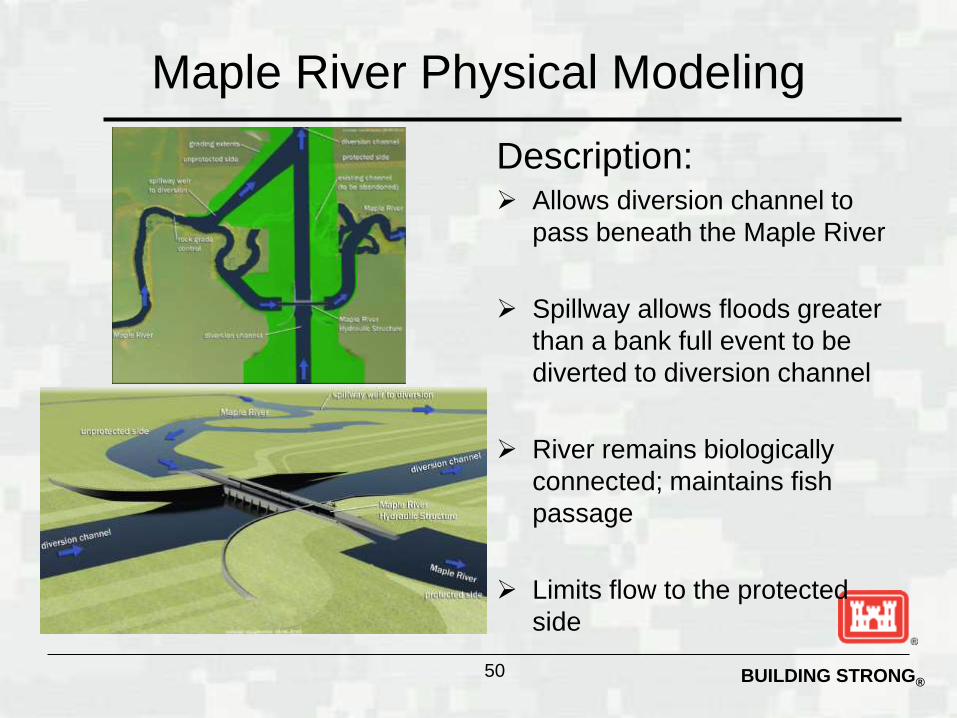
Maple River Physical Modeling
Description: Allows diversion channel to
pass beneath the Maple River
Spillway allows floods greater
than a bank full event to be
diverted to diversion channel
River remains biologically
connected; maintains fish
passage
Limits flow to the protected
side
50
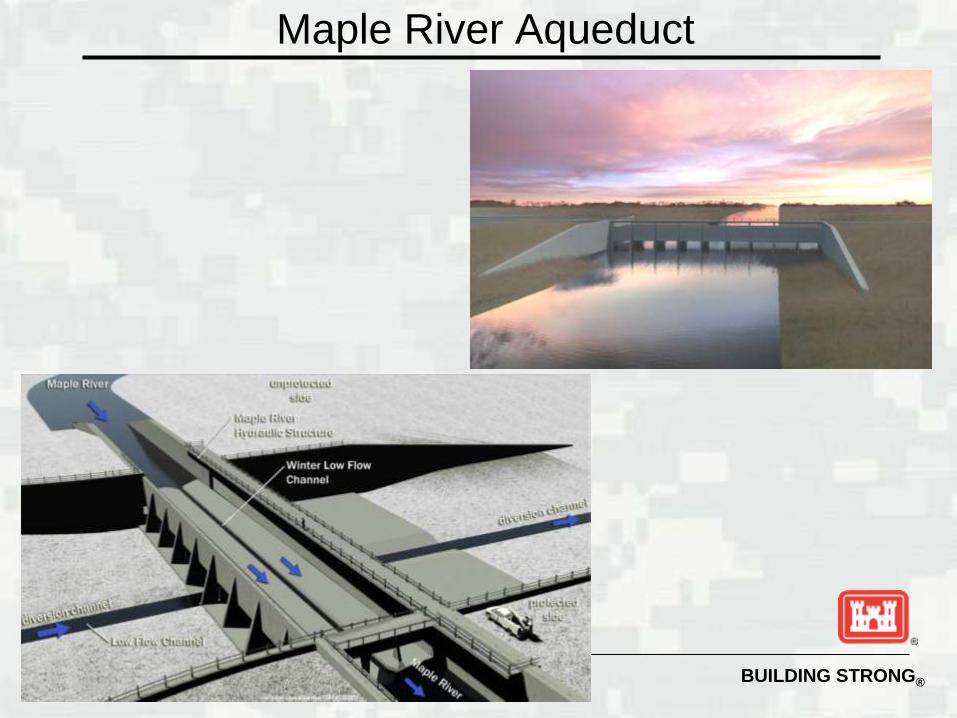
BUILDING STRONG®
Maple River Aqueduct
BUILDING STRONG®
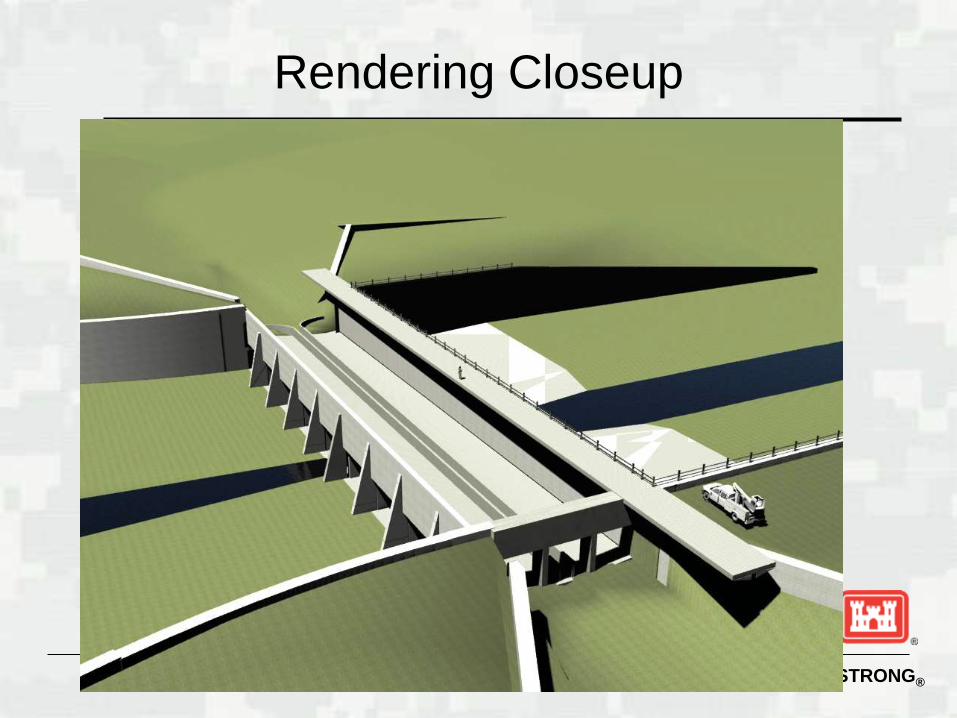
Rendering Closeup
52
BUILDING STRONG®
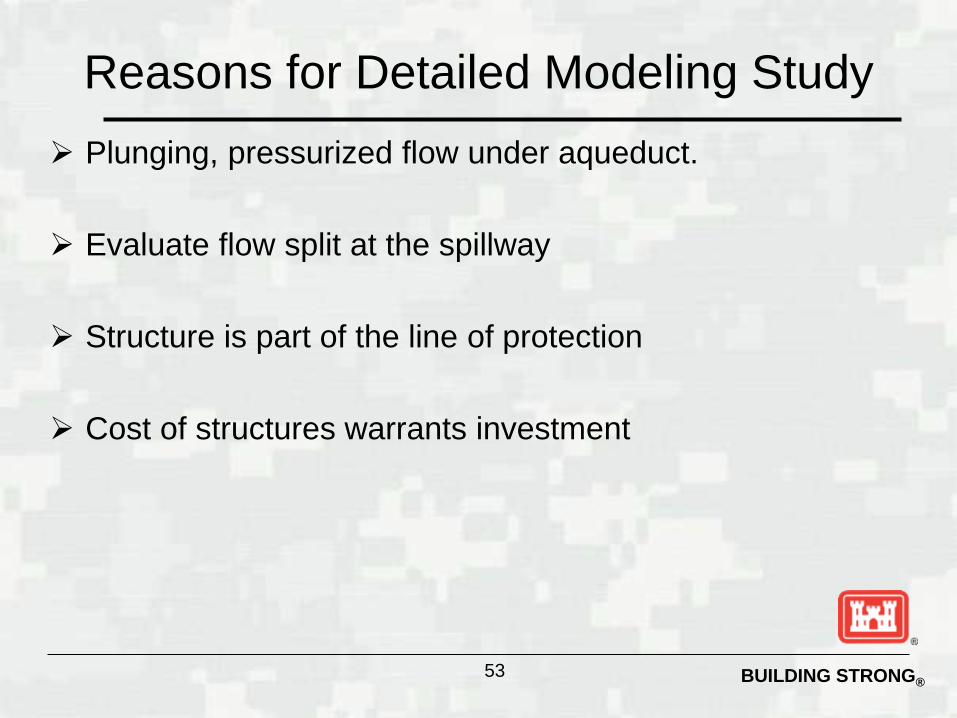
Reasons for Detailed Modeling Study
Plunging, pressurized flow under aqueduct.
Evaluate flow split at the spillway
Structure is part of the line of protection
Cost of structures warrants investment
53
BUILDING STRONG®
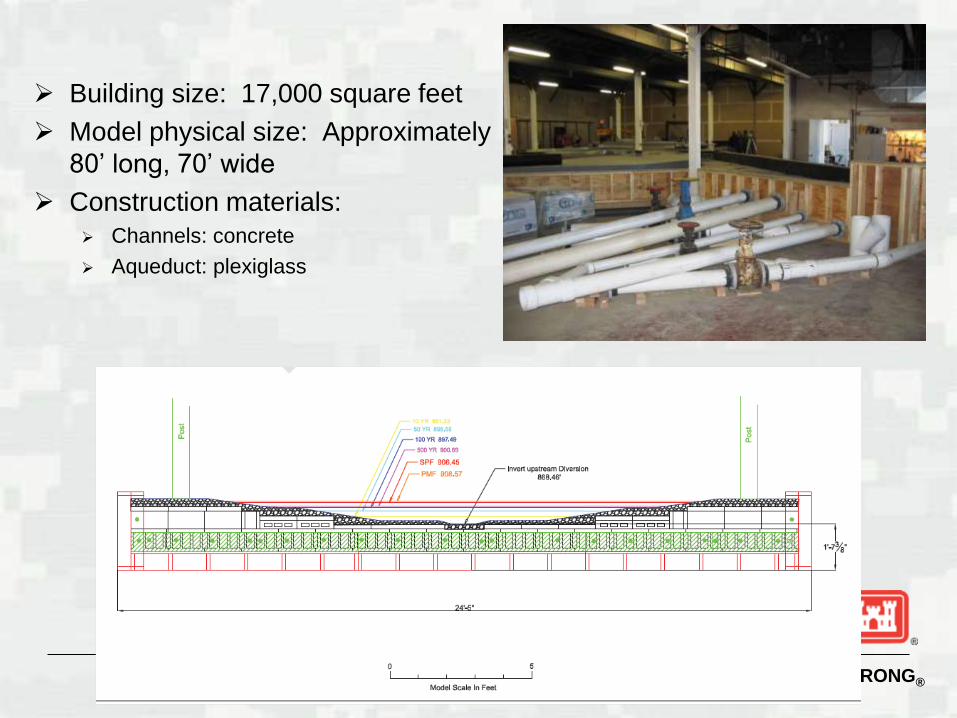
Building size: 17,000 square feet
Model physical size: Approximately
80’ long, 70’ wide
Construction materials:
Channels: concrete
Aqueduct: plexiglass
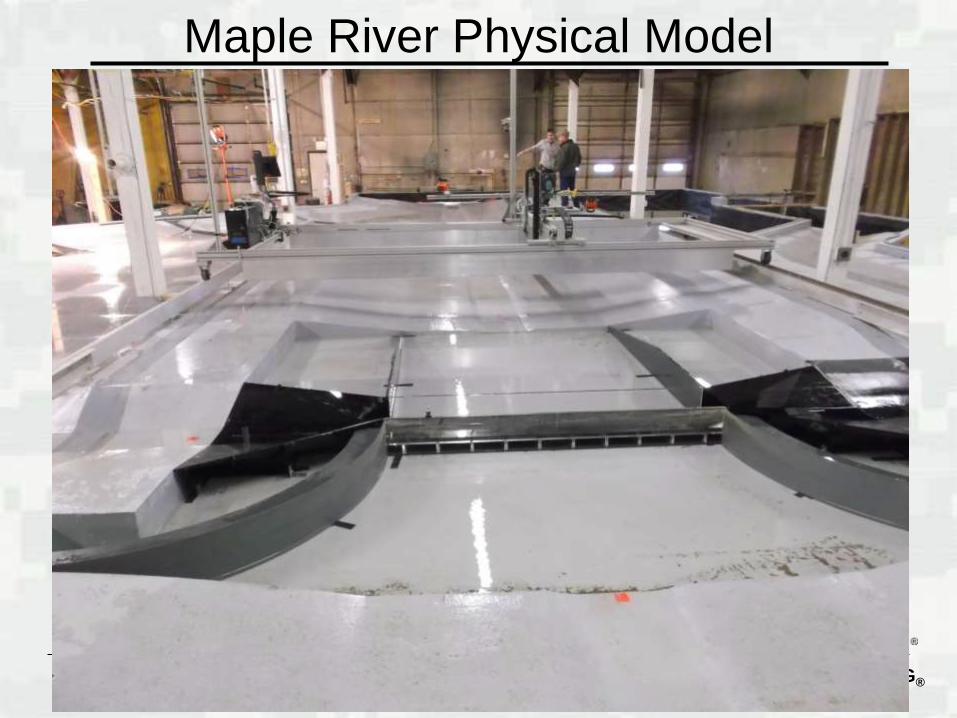
BUILDING STRONG®
Maple River Physical Model
BUILDING STRONG®
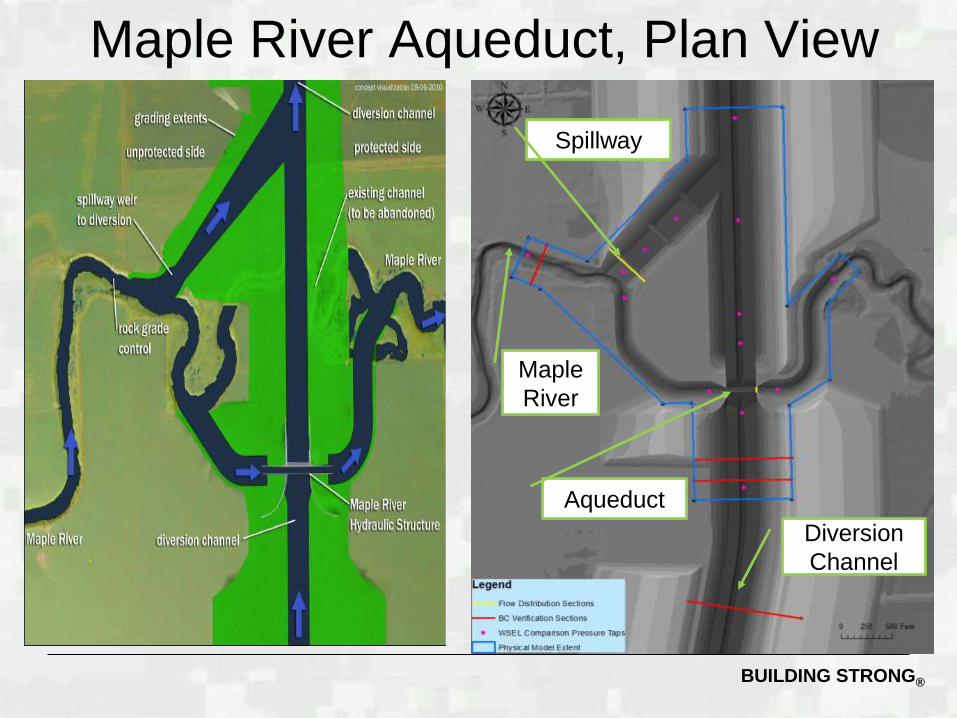
Maple River Aqueduct, Plan View
Aqueduct
Spillway
Maple
River
Diversion
Channel
BUILDING STRONG®57
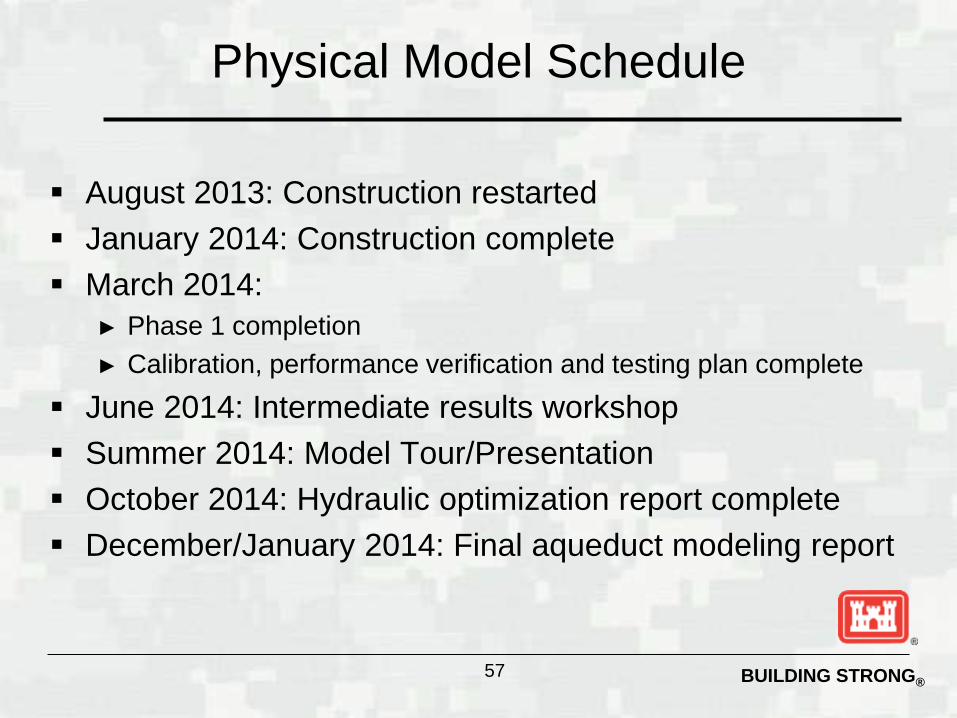
Physical Model Schedule
August 2013: Construction restarted
January 2014: Construction complete
March 2014:
► Phase 1 completion
► Calibration, performance verification and testing plan complete
June 2014: Intermediate results workshop
Summer 2014: Model Tour/Presentation
October 2014: Hydraulic optimization report complete
December/January 2014: Final aqueduct modeling report
BUILDING STRONG®58
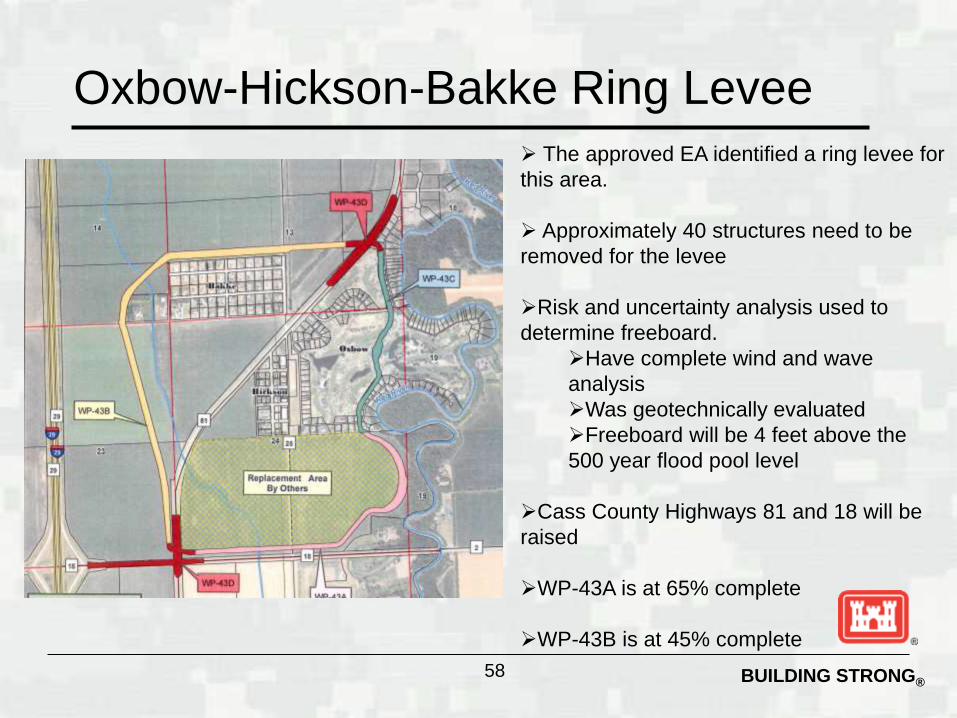
The approved EA identified a ring levee for
this area.
Approximately 40 structures need to be
removed for the levee
Risk and uncertainty analysis used to
determine freeboard.
Have complete wind and wave
analysis
Was geotechnically evaluated
Freeboard will be 4 feet above the
500 year flood pool level
Cass County Highways 81 and 18 will be
raised
WP-43A is at 65% complete
WP-43B is at 45% complete
Oxbow-Hickson-Bakke Ring Levee
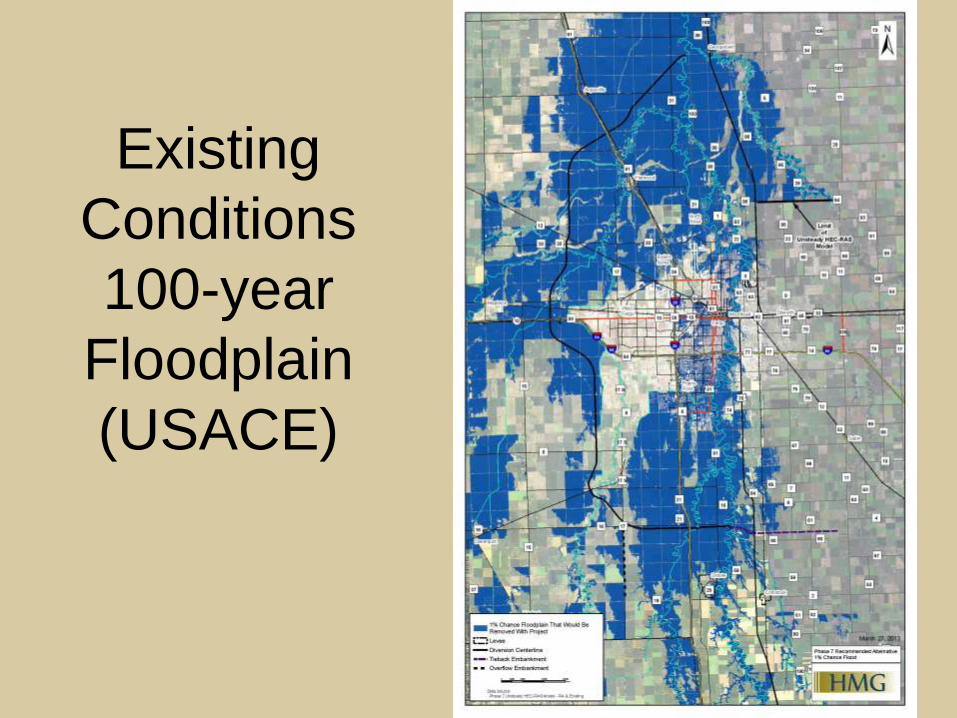
Existing
Conditions
100-year
Floodplain
(USACE)
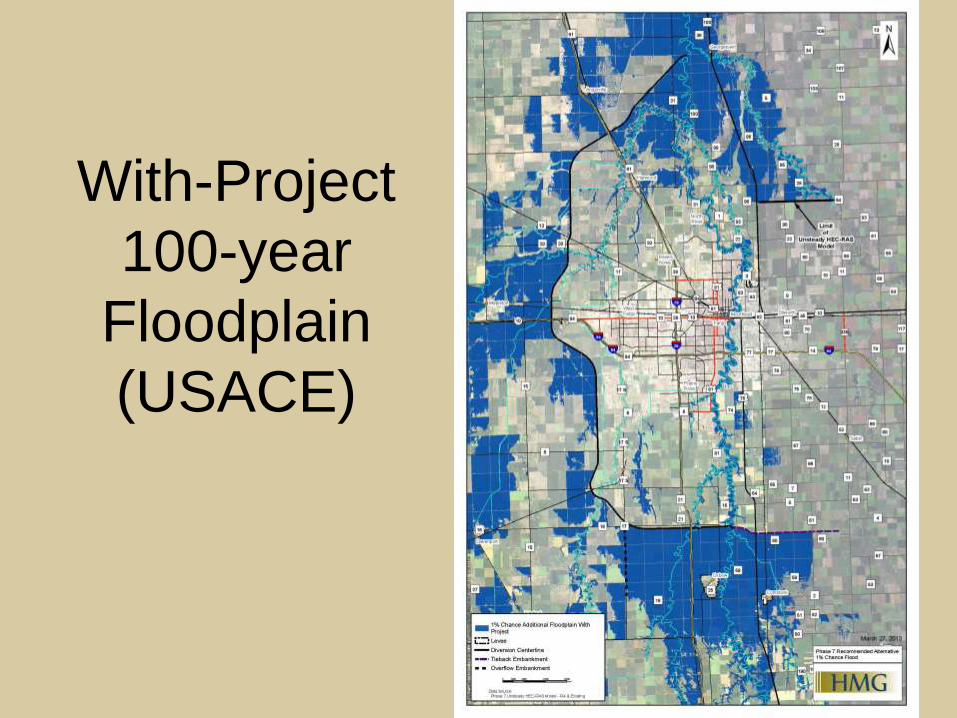
With-Project
100-year
Floodplain
(USACE)
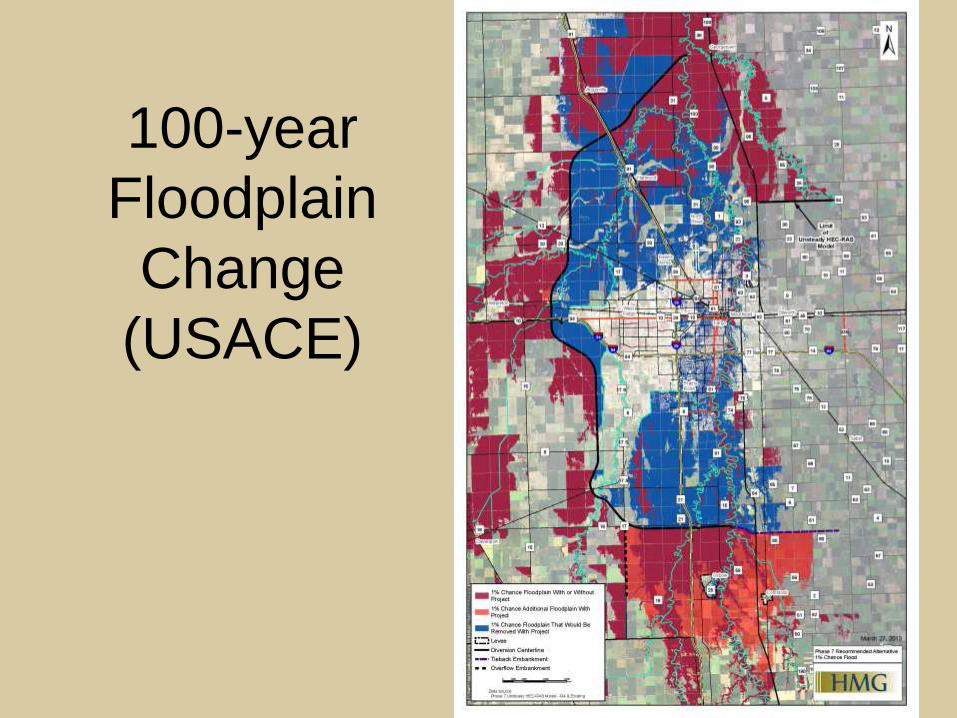
100-year
Floodplain
Change
(USACE)
BUILDING STRONG®62
Congress advancing Water Resources Development Act
(WRDA) that would authorize the Project
The Corps and Local Sponsors are moving forward with
the design phase
Once authorized and funded by Congress
+3 months - Sign Project Partnership Agreement (PPA)
+ 8.5 years - Project Operable *
Executing a Construction Memo of Understanding with the
Sponsors that would allow them to begin construction
prior to authorization and funding at its own risk
* 8.5 year construction period based on $240 Million/year funding stream
Overall Project Construction Schedule
BUILDING STRONG®
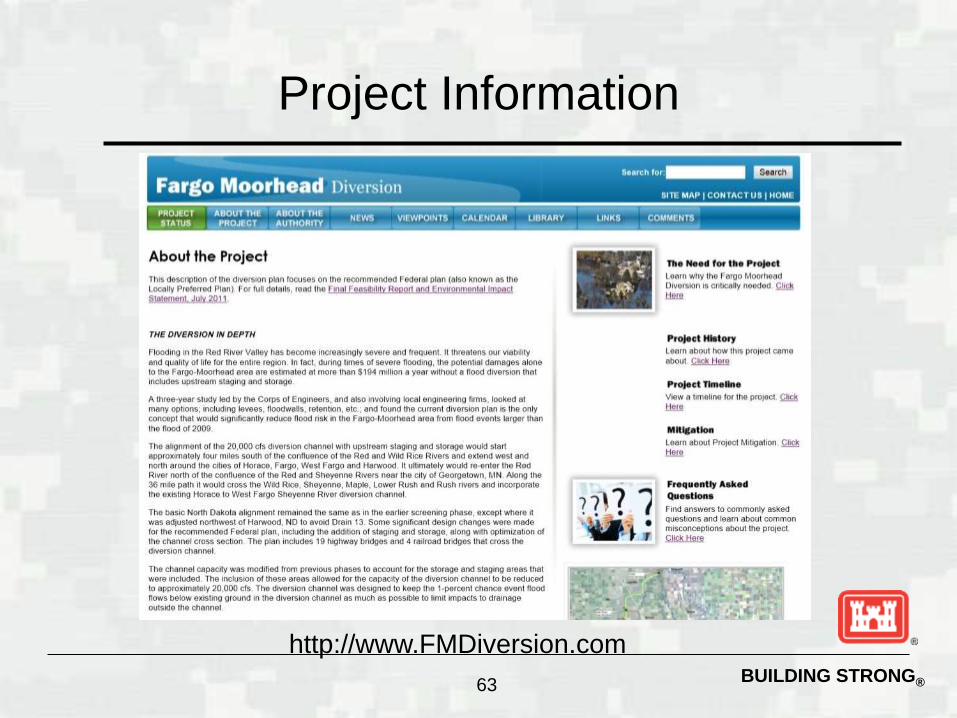
http://www.FMDiversion.com
63
Project Information