federico castellucci il mercato mondiale del vino: sfide … · o.i.v.2014 executive master in wine...
TRANSCRIPT
O.I.V.2014
Executive Master in Wine Export
IL MERCATO MONDIALE DEL VINO: SFIDE E OPPORTUNITA’
Federico Castellucci
Executive Master in Wine Export
Federico Castellucci
IL MERCATO MONDIALE DEL VINO:SFIDE E OPPORTUNITA’
Fondazione Mach
San Michele all’Adige
29 gennaio 2015
Executive Master in Wine Export
Federico Castellucci
IL MERCATO MONDIALE DEL VINO:SFIDE E OPPORTUNITA’
Fondazione Mach
San Michele all’Adige
29 gennaio 2015
O.I.V.2014
Executive Master in Wine Export
IL MERCATO MONDIALE DEL VINO: SFIDE E OPPORTUNITA’
Federico Castellucci
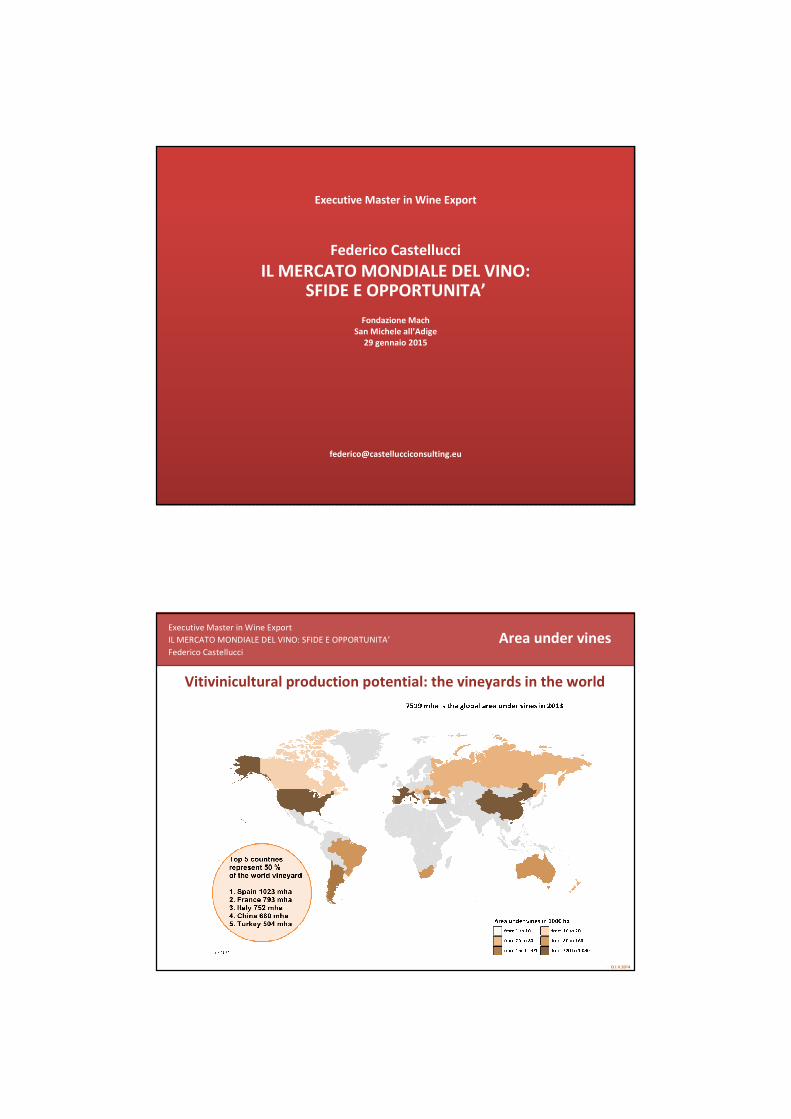
Vitivinicultural production potential: the vineyards in the world
Area under vines
O.I.V.2014
Executive Master in Wine Export
IL MERCATO MONDIALE DEL VINO: SFIDE E OPPORTUNITA’
Federico Castellucci
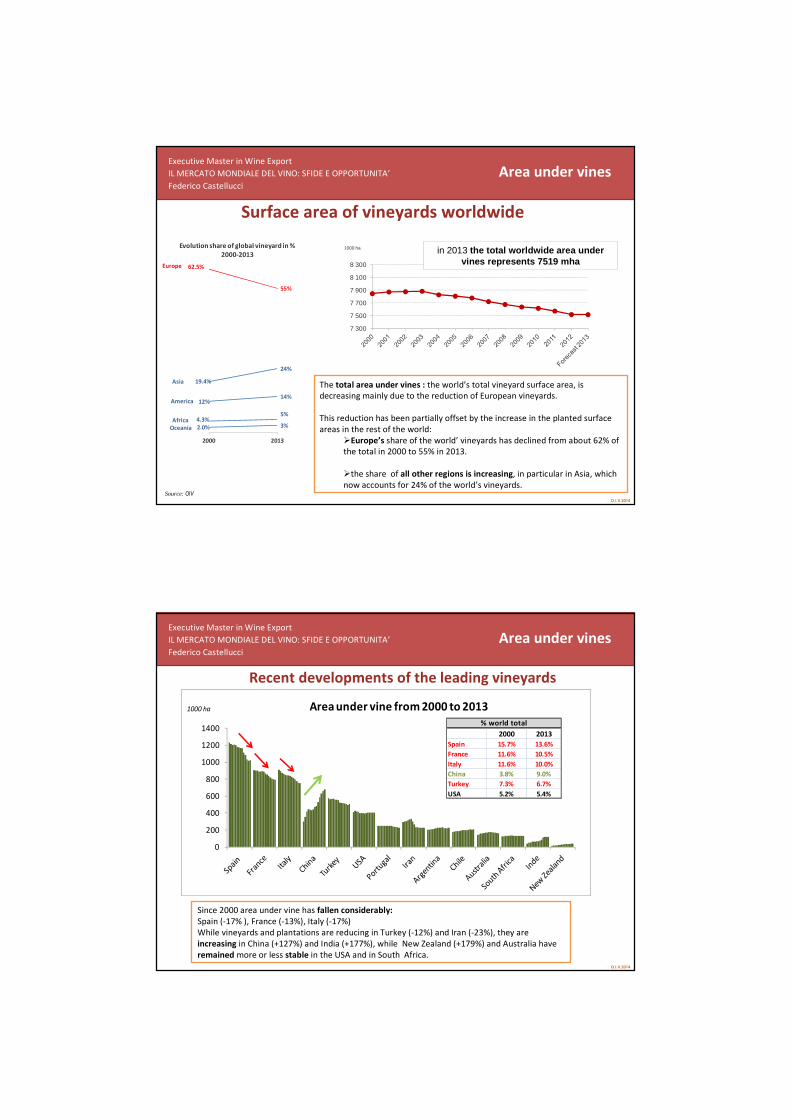
Surface area of vineyards worldwide
Source: OIV
7 300
7 500
7 700
7 900
8 100
8 300
1000 ha in 2013 the total worldwide area under vines represents 7519 mha
Area under vines
The total area under vines : the world’s total vineyard surface area, is
decreasing mainly due to the reduction of European vineyards.
This reduction has been partially offset by the increase in the planted surface
areas in the rest of the world:
�Europe’s share of the world’ vineyards has declined from about 62% of
the total in 2000 to 55% in 2013.
�the share of all other regions is increasing, in particular in Asia, which
now accounts for 24% of the world’s vineyards.
62.5%
55%
19.4%
24%
12%14%
4.3%5%
2.0% 3%
2000 2013
Evolution share of global vineyard in %
2000-2013
Europe
Oceania
Africa
America
Asia
O.I.V.2014
Executive Master in Wine Export
IL MERCATO MONDIALE DEL VINO: SFIDE E OPPORTUNITA’
Federico Castellucci
Recent developments of the leading vineyards
0
200
400
600
800
1000
1200
1400
1000 ha Area under vine from 2000 to 2013
2000 2013
Spain 15.7% 13.6%
France 11.6% 10.5%
Italy 11.6% 10.0%
China 3.8% 9.0%
Turkey 7.3% 6.7%
USA 5.2% 5.4%
% world total
Since 2000 area under vine has fallen considerably:
Spain (-17% ), France (-13%), Italy (-17%)
While vineyards and plantations are reducing in Turkey (-12%) and Iran (-23%), they are
increasing in China (+127%) and India (+177%), while New Zealand (+179%) and Australia have
remained more or less stable in the USA and in South Africa.
Area under vines
O.I.V.2014
Executive Master in Wine Export
IL MERCATO MONDIALE DEL VINO: SFIDE E OPPORTUNITA’
Federico Castellucci
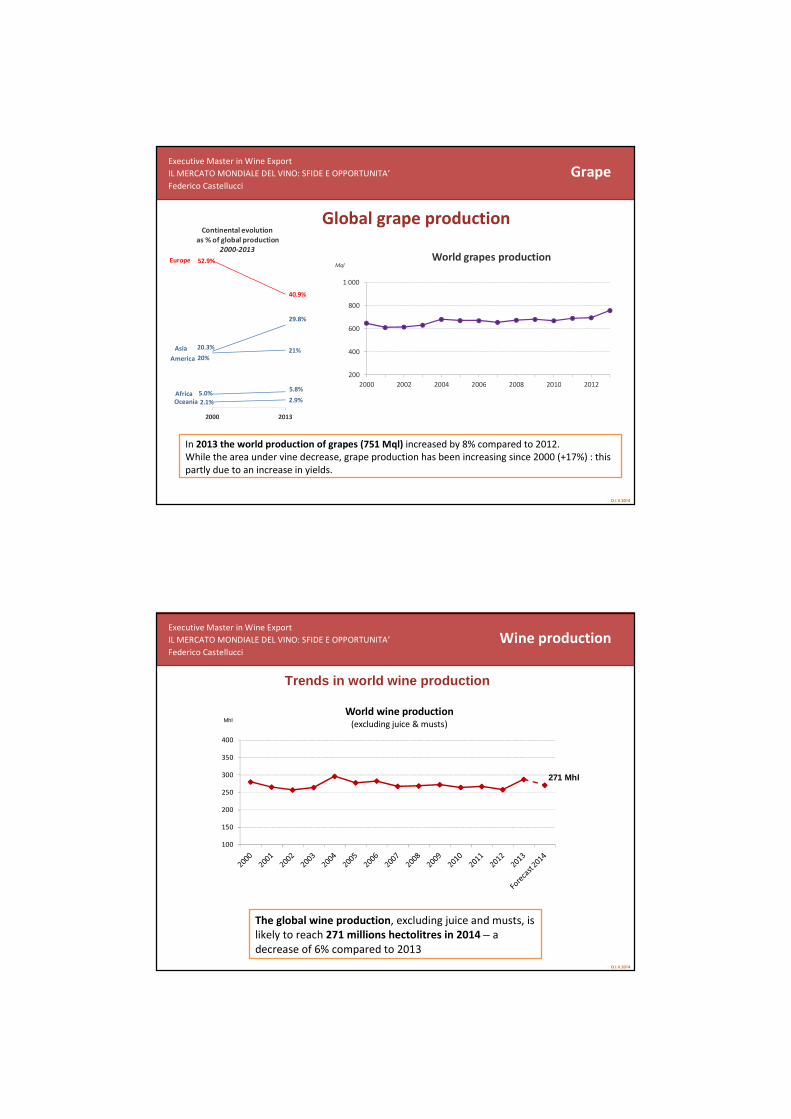
Global grape production
In 2013 the world production of grapes (751 Mql) increased by 8% compared to 2012.
While the area under vine decrease, grape production has been increasing since 2000 (+17%) : this
partly due to an increase in yields.
Grape
200
400
600
800
1 000
2000 2002 2004 2006 2008 2010 2012
Mql
World grapes production52.9%
40.9%
20.3%
29.8%
20%21%
5.0%5.8%
2.1% 2.9%
2000 2013
Continental evolution
as % of global production
2000-2013
Europe
Oceania
Africa
America
Asia
O.I.V.2014
Executive Master in Wine Export
IL MERCATO MONDIALE DEL VINO: SFIDE E OPPORTUNITA’
Federico Castellucci
Trends in world wine production
The global wine production, excluding juice and musts, is
likely to reach 271 millions hectolitres in 2014 – a
decrease of 6% compared to 2013
271 Mhl
100
150
200
250
300
350
400
Mhl World wine production
(excluding juice & musts)
Wine production

O.I.V.2014
Executive Master in Wine Export
IL MERCATO MONDIALE DEL VINO: SFIDE E OPPORTUNITA’
Federico Castellucci
2014 wine production in the 10 main producing countries
Wine production
O.I.V.2014
Executive Master in Wine Export
IL MERCATO MONDIALE DEL VINO: SFIDE E OPPORTUNITA’
Federico Castellucci
Table 1: Wine production (excluding juice and musts) (1)
1000 hl 2010 2011 2012
2013
Provisional
2014
Forecast
2014/2013
Variation in
volume
2014/2013
Variation
in %
Ranking
France 44 381 50 757 41 548 42 004 46 151 4147 10% 1Italy 48 525 42 772 45 616 52 429 44 424 -8005 -15% 2Spain 35 353 33 397 31 123 45 650 37 000 -8650 -19% 3United States (2) 20 890 19 140 21 740 23 500 22 500 -1000 -4% 4Argentina 16 250 15 473 11 780 14 984 15 200 216 1% 5Australia 11 420 11 180 12 260 12 310 12 560 250 2% 6China (3) 13000 13200 13810 11780 11780 0 0% 7South Africa 9 327 9 725 10 568 10 980 11 420 440 4% 8Chile 8844 10464 12554 12 846 10 029 -2817 -22% 9Germany 6 906 9 132 9 012 8 409 9 725 1316 16% 10Portugal 7 148 5 622 6 327 6 238 5886 -352 -6% 11Romania 3 287 4 058 3 311 5 113 4 093 -1020 -20% 12New Zealand 1 900 2 350 1 940 2 480 3 200 720 29% 13Greece 2 950 2 750 3 115 3 343 2 900 -443 -13% 14Brazil 2 459 3 460 2 967 2 710 2810 100 4% 15Hungary 1 762 2 750 1 776 2 666 2 734 68 3% 16Austria 1 737 2 814 2 125 2 392 2 250 -142 -6% 17Bulgaria 1 224 1 237 1 442 1 755 1 229 -526 -30% 18Switzerland 1 030 1 120 1 000 840 900 60 7% 19Croatia 1 433 1 409 1 293 1 249 874 -375 -30% 20
OIV World Total(4) 264 372 267 243 256 222 287 600 270 864 -16736 -6%
(1): Countries for which information has been provided with a wine production of more than 1 mhl
(3): Report for the year 2013, 2014 figures not yet available (2): OIV estimate (USDA basis)
(4) Range used for 2014 world production: 266.2 mhl to 275.5 mhl
Wine production

O.I.V.2014
Executive Master in Wine Export
IL MERCATO MONDIALE DEL VINO: SFIDE E OPPORTUNITA’
Federico Castellucci
0
5
10
15
20
25
USA Argentina Australia China South
Africa
Chile New
Zealand
Brazil
Mhl2014 & trends in production
00-04
05-09
10-14
Forecast 2014
Countries with an increasing trend
*Report for the year 2013, 2014 figures not yet available
*
In 2014, compared to the last 15 years’ trend:
� almost all countries confirm their increase in vine production
Trends in wine production
O.I.V.2014
Executive Master in Wine Export
IL MERCATO MONDIALE DEL VINO: SFIDE E OPPORTUNITA’
Federico Castellucci
200
210
220
230
240
250
260
270
280
Mhl
World wine consumption
Wine consumption forecast
At this time of the
year, no reliable
information is
available on the level
of consumption in
the different markets
for 2014.
The data available
show a consolidation
of the global
consumption, at
around 243 Mhl.
Moving towards consolidation of
consumption
10
O.I.V.2014
Executive Master in Wine Export
IL MERCATO MONDIALE DEL VINO: SFIDE E OPPORTUNITA’
Federico Castellucci
0
5 000
10 000
15 000
20 000
25 000
30 000
35 000
40 000
USA France Italy Germany China United
Kingdom
Russian
Federation
Argentina Spain Australia
1000 hl
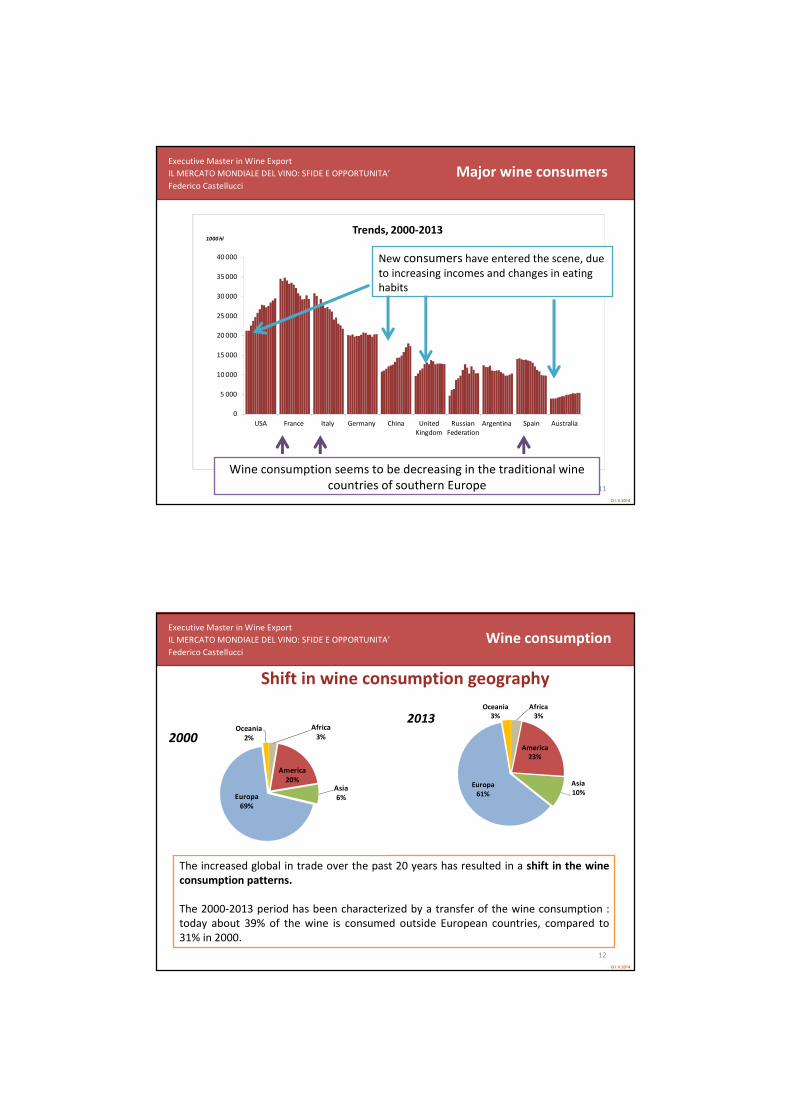
Trends, 2000-2013
Major wine consumers
Wine consumption seems to be decreasing in the traditional wine
countries of southern Europe
New consumers have entered the scene, due
to increasing incomes and changes in eating
habits
11
O.I.V.2014
Executive Master in Wine Export
IL MERCATO MONDIALE DEL VINO: SFIDE E OPPORTUNITA’
Federico Castellucci
The increased global in trade over the past 20 years has resulted in a shift in the wine
consumption patterns.
The 2000-2013 period has been characterized by a transfer of the wine consumption :
today about 39% of the wine is consumed outside European countries, compared to
31% in 2000.
Shift in wine consumption geography
Wine consumption
12
Africa
3%
America
20%Asia
6%Europa
69%
Oceania
2%2000
Africa
3%
America
23%
Asia
10%Europa
61%
Oceania
3%2013

O.I.V.2014
Executive Master in Wine Export
IL MERCATO MONDIALE DEL VINO: SFIDE E OPPORTUNITA’
Federico Castellucci
2.28 2.31 2.14 2.22 2.15 2.16 2.17 2.22 2.31 2.09 2.25 2.34 2.532.62
60 6170 69
73 7681
90 87 8593
100 100 9814 14
15 15 1616
18
20 20
18
21
23
25 26
2000 2001 2002 2003 2004 2005 2006 2007 2008 2009 2010 2011 2012 2013
Bill €
Mhl
World wine exports in Euros and Litres€/l
Mhl.
Bill €
In 2013 the trade in wine decreased by 2.2% in volume, representing
98 million of hl, even though the growing prices allowed an increase in
total revenues of 1.5% up to 25.7 billion Euros.
World wine Export
O.I.V.2014
Executive Master in Wine Export
IL MERCATO MONDIALE DEL VINO: SFIDE E OPPORTUNITA’
Federico Castellucci
In the 2000-2013 period, the composition of exports
significantly changed : the share of bottled wines
reduced by 2.5 points in value and 6 points in volume,
while bulk wines increased.
By type of product
32% 28% 30% 34% 35% 32% 35% 36% 36% 36% 37% 38% 37% 38%
5%5% 5%
6% 5% 5%5% 6% 6% 6% 6% 6% 6% 7%
63% 67% 65% 61% 60% 62% 60% 58% 58% 58% 57% 55% 56% 55%
0
10
20
30
40
50
60
0%
10%
20%
30%
40%
50%
60%
70%
80%
90%
100%
2000 2001 2002 2003 2004 2005 2006 2007 2008 2009 2010 2011 2012 2013
Mhl
By type of wine in volume terms Bulk &> 2l Sparkling Bottled Bulk &> 2l Sparkling Bottled
14

O.I.V.2014
Executive Master in Wine Export
IL MERCATO MONDIALE DEL VINO: SFIDE E OPPORTUNITA’
Federico Castellucci
Since the beginning of the Century, all the top 10 exporters increased their value.
France remains clearly the leader. After the 2009 world crisis in wine consumption, Italy
and to a lesser extent Spain, performed particularly well in the last 4 years ; Chile also
increased its value.
Top 10 world exporters of wine
15
6.9
3.7
2.0
1.4
0.9 0.8 0.70.4 0.6 0.4 0.5
7.8
5.0
2.5
1.3 1.41.0 1.2
0.8 0.7 0.7 0.6
0
1
2
3
4
5
6
7
8
9
France Italy Spain Australia Chile Germany United
States
New
Zealand
Portugal Argentina South
Africa
Billion of Euro Trends exports in value : 2008 to 2013
O.I.V.2014
Executive Master in Wine Export
IL MERCATO MONDIALE DEL VINO: SFIDE E OPPORTUNITA’
Federico Castellucci
In volume, Italy and Spain are the leaders, although suffering from a low crop in 2012 in the
Northern Hemisphere. In 2013, Chile overpassed Australia, and South Africa took advantage
of lower inventories in the North.
Top 10 world exporters of wine
16
13.8
18.1
16.9
7.0
5.9
3.74.6
1.0
3.0
4.3 4.4
14.6
20.3
17.7
7.1
8.8
4.0 4.1
1.83.1 3.2
5.6
0
5
10
15
20
25
France Italy Spain Australia Chile Germany United
States
New
Zealand
Portugal Argentina South
Africa
Mhl
Trends exports in volume: 2008 to 2013

O.I.V.2014
Executive Master in Wine Export
IL MERCATO MONDIALE DEL VINO: SFIDE E OPPORTUNITA’
Federico Castellucci
Top world Exporters
Among the top wine
exporters, the first 5 account
for more than 70% of total
exports in value and volume0
5000
10000
15000
20000
25000
1000 hl 2013
0
1000
2000
3000
4000
5000
6000
7000
8000
9000Million of Euros 2013
O.I.V.2014
Executive Master in Wine Export
IL MERCATO MONDIALE DEL VINO: SFIDE E OPPORTUNITA’
Federico Castellucci
6 countries import for more than 1 billion euros of wine each : USA overpassed UK as top world
importer, Germany and Canada grows slowly, and China reached Japan’s level although declining in
2013.
Top 6 world Importers of wine
3.2
3.6
2.2
1.10.9
0.3
3.93.7
2.6
1.5
1.2 1.2
0
1
1
2
2
3
3
4
4
5
USA UK Germany Canada Japan China
Billion Euro Trends imports in value: 2008 to 2013
O.I.V.2014
Executive Master in Wine Export
IL MERCATO MONDIALE DEL VINO: SFIDE E OPPORTUNITA’
Federico Castellucci
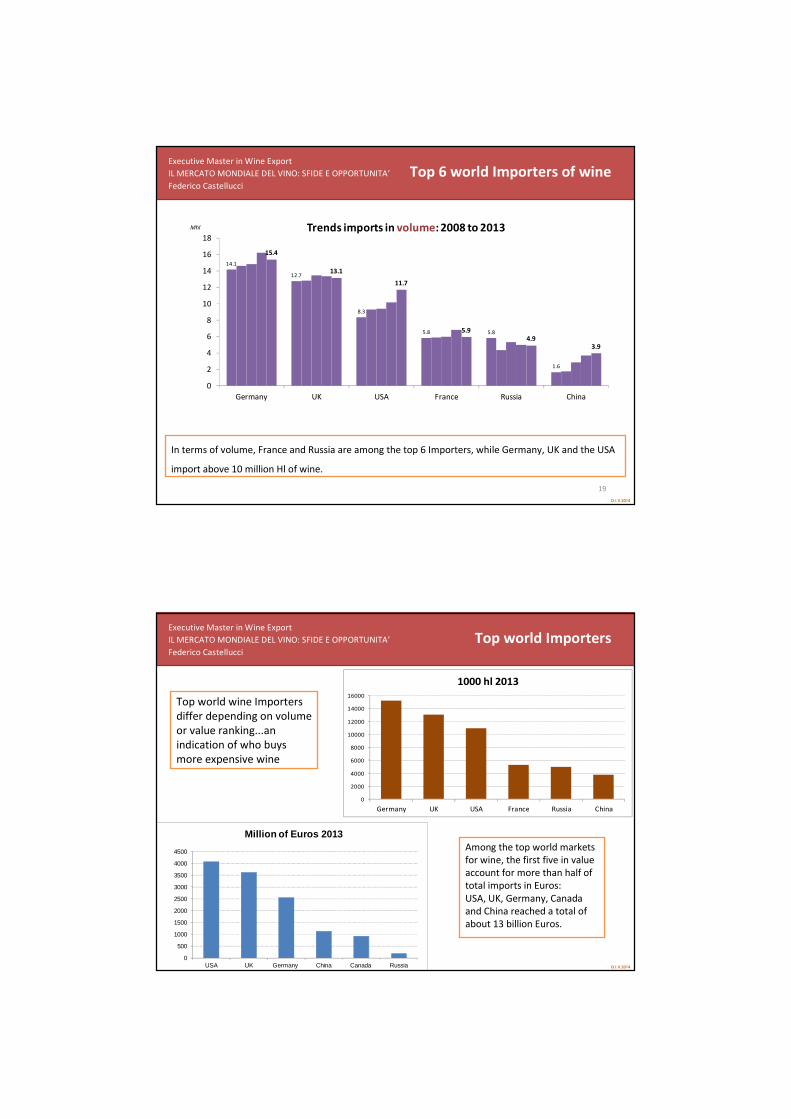
In terms of volume, France and Russia are among the top 6 Importers, while Germany, UK and the USA
import above 10 million Hl of wine.
19
14.1
12.7
8.3
5.8 5.8
1.6
15.4
13.1
11.7
5.9
4.93.9
0
2
4
6
8
10
12
14
16
18
Germany UK USA France Russia China
Mhl Trends imports in volume: 2008 to 2013
Top 6 world Importers of wine
O.I.V.2014
Executive Master in Wine Export
IL MERCATO MONDIALE DEL VINO: SFIDE E OPPORTUNITA’
Federico Castellucci
Top world Importers
Among the top world markets
for wine, the first five in value
account for more than half of
total imports in Euros:
USA, UK, Germany, Canada
and China reached a total of
about 13 billion Euros.
Top world wine Importers
differ depending on volume
or value ranking...an
indication of who buys
more expensive wine
0
500
1000
1500
2000
2500
3000
3500
4000
4500
USA UK Germany China Canada Russia
Million of Euros 2013
0
2000
4000
6000
8000
10000
12000
14000
16000
Germany UK USA France Russia China
1000 hl 2013

O.I.V.2014
Executive Master in Wine Export
IL MERCATO MONDIALE DEL VINO: SFIDE E OPPORTUNITA’
Federico Castellucci
21
Production
has
increased
significantly:
+ 40% in 10
years
About 18 Mhl of sparkling wine was
produced in 2013- accounting for 7% of
the world wine production
12,7 Mhl17,6 Mhl
Sparkling
O.I.V.2014
Executive Master in Wine Export
IL MERCATO MONDIALE DEL VINO: SFIDE E OPPORTUNITA’
Federico Castellucci
22
The German and French markets remain the largest, with about 3 and
2 Mhl consumed in 2013
A growing interest in these wines outside the EU, particularly in the
United States, Australia, Russia and Eastern European countries,
whose consumption has significantly increased over the past 10 years.
Sparkling wine consumption by country
0
1
2
3
4
5
Germany France Russia United States Italy United
Kingdom
Other
countries
Mhl
11,8 Mhl
15,4 Mhl
Sparkling

O.I.V.2014
Executive Master in Wine Export
IL MERCATO MONDIALE DEL VINO: SFIDE E OPPORTUNITA’
Federico Castellucci
23
The sparkling wine trade has increased steadily over the past 10 years
Since 2000, world exports of sparkling wines have more than doubled, with
an average growth of 9% per year, from 3.11 Mhl to 8.7 Mhl in 2013 and
reaching the 4.3 billion euros in 2013
0
1
2
3
4
5
6
0
2
4
6
8
10
2000 2001 2002 2003 2004 2005 2006 2007 2008 2009 2010 2011 2012 2013
Billions of euros Mhl
Millions of hectolitres Billions of euros
Sparkling