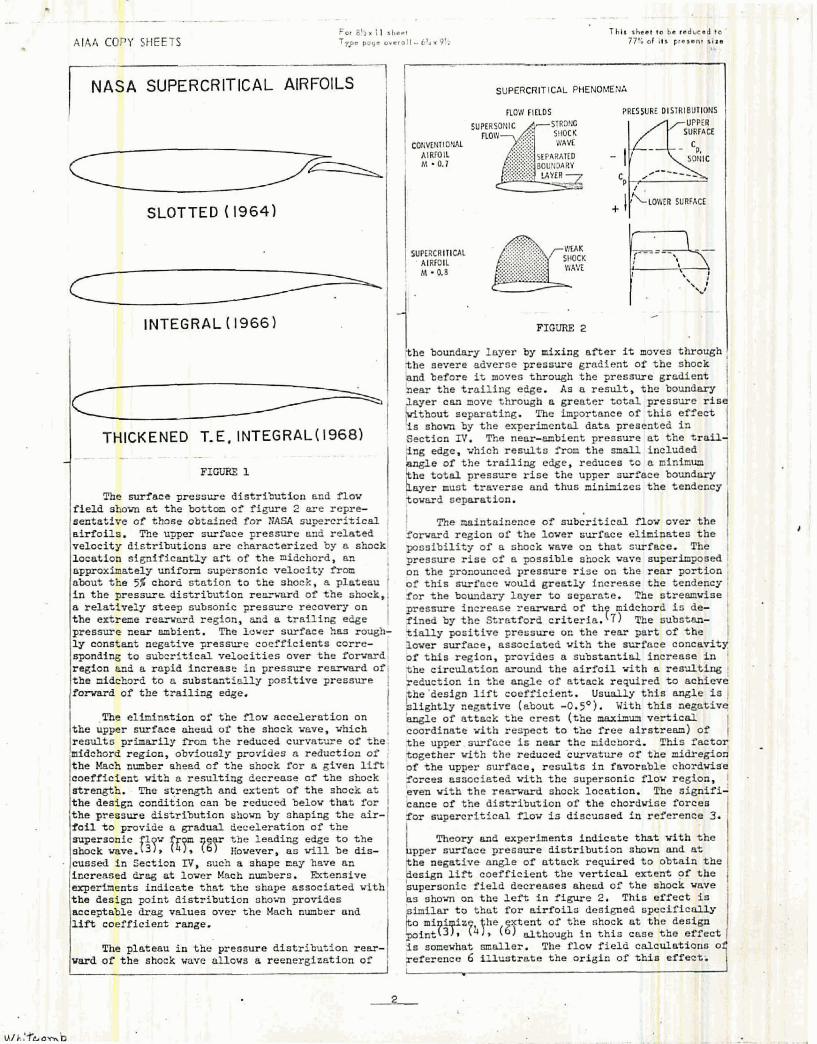
for - nasa langley gis team home page nasa integral supercritical airfoil t/c = 0.110 - --2 z - - --...
TRANSCRIPT

For 8'2 1 1 rltoc~ This sl~cot to be redutod t o
A lAA COPY SHEETS Type poqe owrto I t - 6 '4 . 9'1 77% of 11s ppsont smxo
--- -- - ---- The relatively large leading edge rad i i of
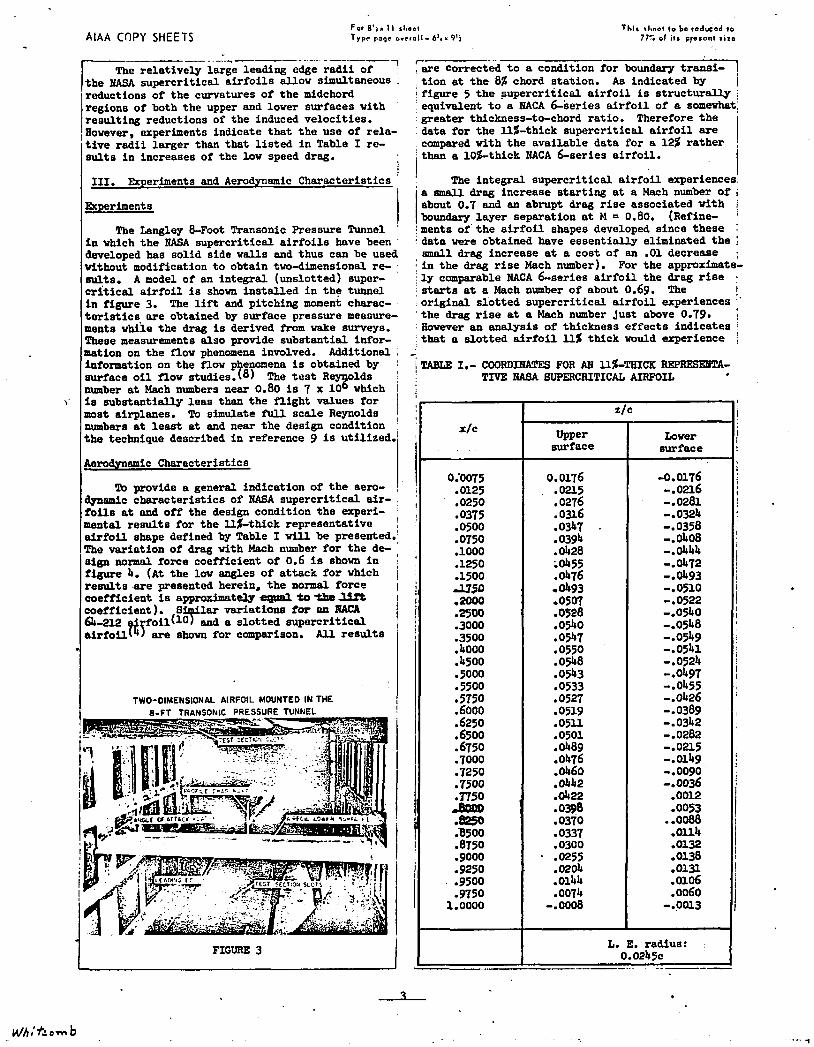
-I :are corrected t o a condition for boundary transi- 1 the HMA supercritical a i r fo i l s allow SirPultaneous . t ion a t the 88 chord staaion. A s indicated by 1 r reductions of the curvatures of the midchord I figure 5 the supercritical a i r fo i l is structural ly 1 regions of both the upper and lower surfaces with equivalent t o a NACA 6-series a i r fo i l of a samewhat, resulting reductions of the induced velocities. greater thickness-to-chord ratio. Therefore the Bowever, experiments indicate that the use of rela- data for the u$-thick supercritic* a i r f o i l are i t ive radi i larger than that l i s ted i n Table I re- compared with the available data for a 12% rather su l t s in increases of the low speed drag. I than a l o s t h i c k NACA 6-series airfoi l .
I I i I 111. Experiments and Aerodynamic Characterif~tics ' I
The Langley &Foot Transonic Pressure Tunnel '
i n which the NASA supercritical a i r fo i l s have been developed has solid side walls and thus can be used without modification t o obtain two-dimensional re- eults. A model of an integral (unslotted) super- c r i t i c a l a i r fo i l is shown installed i n the tunnel In figure 3. The l i f t and pitching moment charac- t e r i e t i c s a r e obtained by surface pressure measure- ments while the drag i s derived from wake surveys. These measurements also provide substantial infor- mation on the flow phenomena involved. Additional information on the flow phenomena is obtained by W a c e o i l flow studies.(8) The t e s t R @yifoldS number a t Mach numbers near 0.80 i s 7 x 10 which I is substantially leas than the f l igh t values for
numbers a t least a t and near the design condition I most airplanes. To simulate full scale Reynolds ,
the technique described i n reference 9 is utilized. i I ~erodynmic Characteristics I
To provide a general indication of t he aero- I dynamic characteristics of NASA supercritical air- 1 fo i l s a t and off the design condition the experi- i mental results for the ll&thick representative a i r fo i l shape defined by Table I will be presented.' The variation of drag with Mach number for the de- sign normal force coefficient of 0.6 is shown i n figure 4. ( ~ t the lov angles of attack for which 1 result8 a r e presented herein, the normal force 1 coefficient is appr0ximatd.y b ftta lift I coefficient ) . Sirflar variations for an l?ACA 64-212 t t j fo i l ( lo and a slotted supercritical 1 a i r fo i l are s h a n for comparison. AJ.l resul ts /
I TWO-DIMENSIONAL AIRFOIL MOUNTED IN THE I I
I FIGURE 3 1
1 The integral supercritical a i r fo i l experiences'
i a s m a l l drag increase s tar t ing a t a Mach number of j about 0.7 and an abrupt drag r i s e associated with ! boundary layer separation a t M = 0.80. ( ~ e f i n e - I
!merits of the a i r f o i l shapes developed since these 1 ldata weze obtained have essentially eliminated the \
s m a l l drag increase a t a cost of an .01 decrease 1 : i n the drag r i s e Mach number). For the approximate- l y comparable NACA 6-series a i r fo i l the drag r i s e s
starts a t a Mach number of about 0.69. The ! original s lot ted supercritical a i r fo i l experiences :' the drag r i s e a t a Mach number Just above 0.79. ; Hawever an analysis of thickness effects ind ica tesv that a slotted a i r f o i l 11% thick would experience !
1 TABLE 1.- COORDIHATES FOR AN U%-THICK REP-- TIVE EiASA BUPERCRITICAL AIRFOIL j
x/c I i
Upper Lower surface surface
I !
I L. E. radius: 0.0245~
---.-- -----

AlAA COPY SHEETS For B'," 1 l shes, Tfp* pogo ovoroll- 6'4 x 9'2
This sheot to be roduesd to 775 o l i ts prorent sire
- I
1 COMPARISON OF SEPARATION ONSET I I
I
. COMPARISON OF I
DRAG- RISE CHARACTERISTICS
. 0 2 0 - ~ ~ ~ 0 . 6 0 1
0 1 6 - SLOTTED S.C.
, 0 1 2 - I
Cd
NASA INTEGRAL SUPERCRITICAL AIRFOIL
t '6 NACA 6 4 ' - 2 1 2 ' . AIRFOIL \ . \
m 4
lmannnerability o f , ff ghters a t high subsonic speed.! The phenomena associated with t h i s effect w i l l be ;discussed later. I I
r/c - 0.110
-
960 .:4 d,a 2 -7: .A i ' 4 a
- - M
FIGURE 4
a drag r i s e a t about 0.81 or 0.82. !Phu the elimi- nation of the slot had a small adverse effect on 1 the drag r i s e Mach nmber. The higher drag level '
for the slotted a i r fo i l of course resu l t s from the added skin fr ict ion associated v i th the slot. The dip i n the variation of drag with Mach number a t a I Mach number of 0.79 is due t o an essential elimina- tion of the shock wave for this condition. I
The variation of the normal force coefficient I for separation onset with Mach number is shoun in '
figure 6. It will be noted that the supercritical a i r fo i l provides a greater delay i n separation on- set compared with the HACA a i r f o i l a t the higher normal forces than a t the design condition. It , also provides a substantial increase in the maxi- I m m normal force a t these higher Mach numbers. These characteristics of supercritical a i r fo i l s '
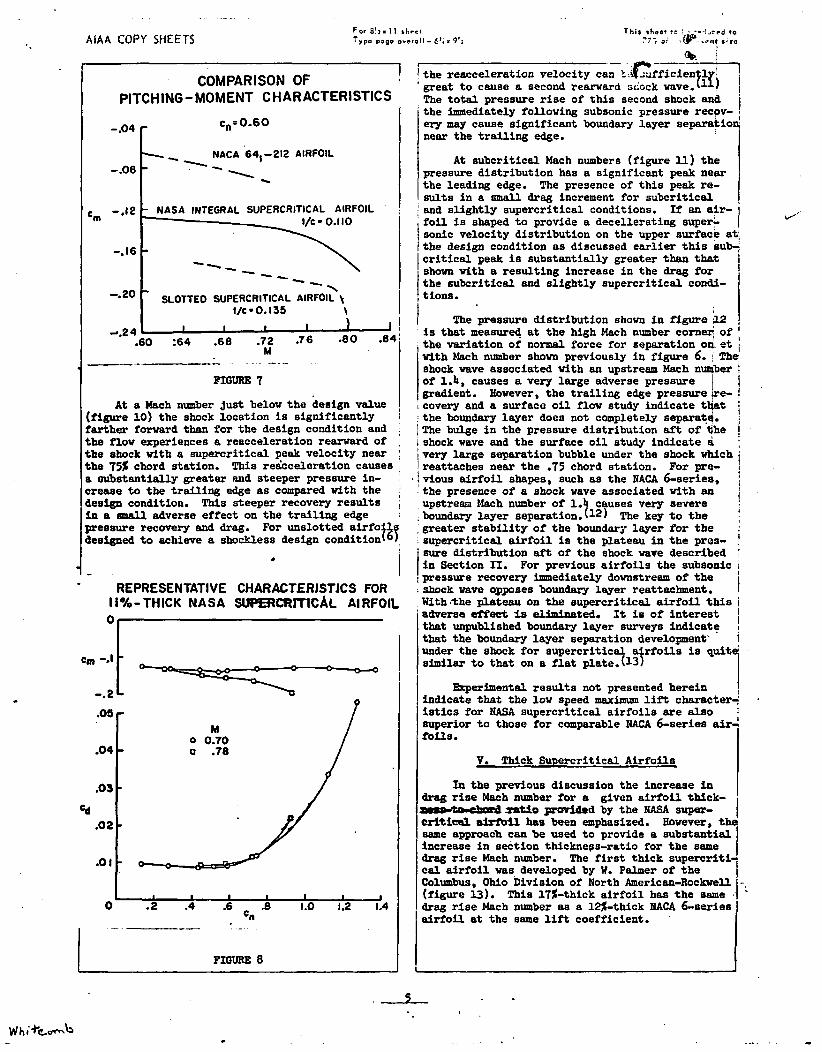
/ Because of the increased aft loading on the f IHAsA integral supercritical a irfoi l . the pitchirrg- i imments for a given n o d force coefficient are lsubstantially more negative than for the WCA 6- I
series a i r fo i l s (figure 7 ) . Hovever, they are Islgnificantly less negative than for the original ' lslotted supercritical a irfoi l . Wind tunnel results. obtained for a swept supercritical wing, developed A
for the f l ight demonstration program t o be diSCUfis-~ 'ed l a te r , indicate that the t v i s t required t o I
l o b t a b the proper span load distribution result8 i f i n a positive pitching moment which approximate I
1 offsets the negative pitching moment associated I 1 wlth the section. A s a result l i t t l e or no trim 1 1 penalty i s incurred, a t l eas t with such a swept 1 ! wing. I would result i n a substantial improvement of the
COMPARISON OF CHORDWISE THICKNESS DISTRIBUTIONS
-12 - 0
. \
0 .2 .4 .6 .8 a/c
1 .o
7 - - ---- -- A- -
FIGURE 5
-
The variations of drag and pitching moment' I
vlth normal force coefficients a t representative ; Mach numbers for the U s t h i c k representative i n t e i gral supercritical a i r fo i l are presented i n figure ' 8 for reference. i
1
I N. now Phenomena a t Off-Design, Subcritical. and High Lif t Conditions I
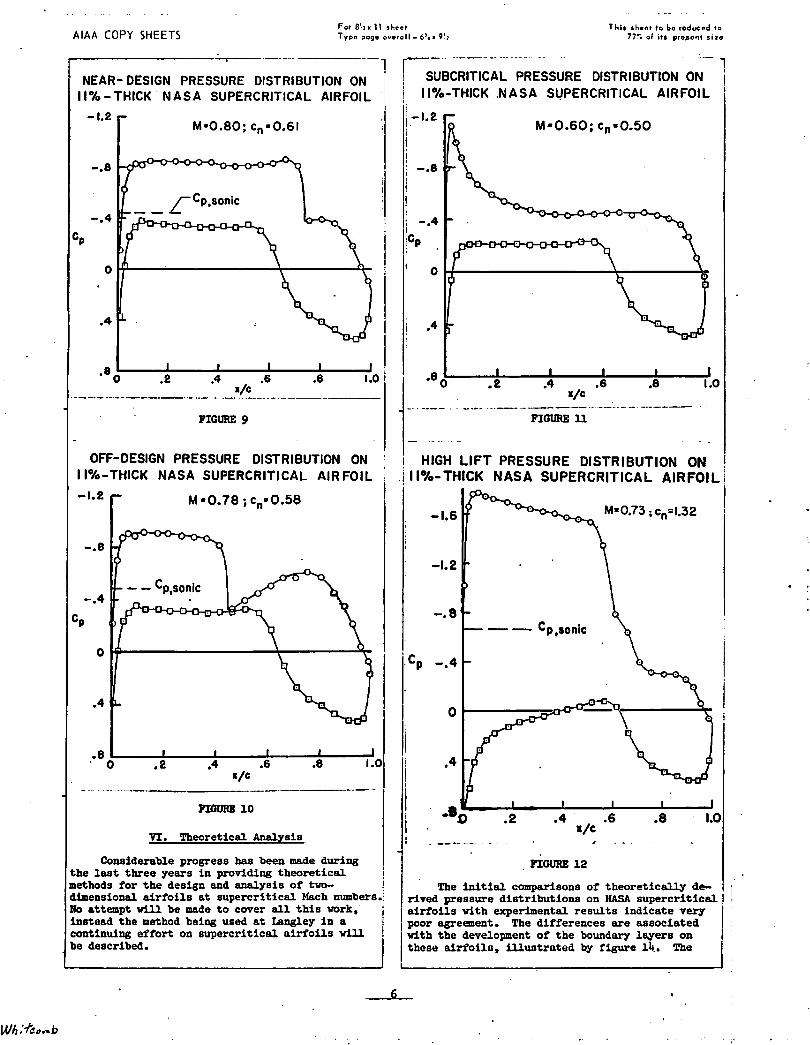
I The distributions measured on the ll%-thick representative M A supercritical m o i l ! defined by Table I provide a general indication of I the flow phenomena associated with NASA supercriti-! cal a i r fo i l s a t off-design, subcritical, and high I lift conditions (figures 9 - 12). In these figraesf the circle symbols are upper surface measurements, the squares are lower surface values.
A t a h c h number s l ight ly above the design I value (figure 9 ) the shock wave location is 'rear- ward of that for the design condition with a small acceleration ahead of the wave. This change causes a alight increase i n the shock losees (figure 4 )
I but does not resul t i n boundary layer separation. Beparation occurs when the shock wave moves fa r th rearward and the preseure plateau described in . . Section I1 is eliminated.
- . - -
A l A A COPY SHEETS
COMPARISON OF 1 PITCHING -MOMENT CHARACTERISTICS
For 8 ' y x 1 1 .h.e? This sheet t c u r r d t o rypo pago ers rc l l - 6'. z 9 ' i
. I - ! the reacceleration velocity e a - k , c i f i c i e w great t o cause a second rearward stlock wave. The t o t a l pressure r i s e of t h i s second shock and i the immediately following subsonic pressure recov- ery may cause significant boundary layer separation, near the t ra i l ing edge. 1 -.04 -
1 The i e s s u r e distribution shown i n figure b is that measur4 a t the high Mach number corn* of 1 the variation of normal force for separation on. e t / with Mach number shown previously i n figure 6. : The shock vave associated with an upstream Mach number 1 of 1.4, causes a very large adverse pressure
(gradient. However, the t ra i l ing edge i covery and a M ~ I C O o i l flow study ! t he boundary layer does not completely separate. I The bulge i n the pressure distribution aft of fhe I 1 shock wave and the surface o i l study indicate 8 : ,very large separation bubble under the shock which i 'reattaches near the .75 chord station. For pre- ! I vious a i r fo i l shapes, such as the NACA &series, i the presence of a shock vave associated with an upstream Mach number of 1. causes very severe i , boundary layer separation.tl2) The key t o t he
, greater s tab i l i ty of the boundary layer f o r the ! supercritical a i r f o i l i s the plateau i n the pres- !
i sure distribution aft of the shock m e described ' i n Section 11. For previous a i r fo i l s the subsonic ,
A t subcritical Mach numbers (figure 11) the pressure distribution has a significant peak near the leading edge. The presence of t h i s peak re- su l t s i n a small drag increment for subcritical
land s l ight ly supercritical conditions. I f an air- f o i l is shaped t o provide a decellerating super-
I pressure recovery immediately downstream of the ' REPRESENTATIVE CHARACTERJSTJCS FOR 2 shock w e opposes boundary l w e r reattachment. f
c,=0.60
J
I 1%- THICK NASA smmrncA~ AIRFOIL 0 1
-.of3
-.I2
-.I6
-.20
4.24
sonic velocity distribution on the upper surface a t the design condition as discussed ear l ier t h i s sub- c r i t i c a l peak is substantially greater than that shown with a resulting increase i n the drag for the subcritical and s l ight ly supercritical condi-
, t ions.
Withathe pht-eau on the super&itical a i r f o i l t h i s j adverse effect i s elhbmted. It is of interest 1 that unpublished boundary layer surveys indicate that the boundary layer separation development' 1 under the shock for supercritical a i r fo i l s is quit similar t o t h a t on a f l a t plate.(13) 1
\ - NACA 641-212 AIRFOIL - I-. Z
- NASA INTEGRAL SUPERCRITICAL AIRFOIL t/c = 0.110
- --2 Z - - -- - 1
SLOTTED SUPERCRITICAL AIRFOIL t/c=0.135 \
- I I I I 1 I
m e r h e n t a l resul ts not presented herein 1 indicate that the low speed maximum lift character- . i s t i c s for HhSA supercritical a i r fo i l s are also superior t o those for comparable NACA &series air4 foi ls . I
.60 :64 -68 .72 3 6 -80 084' M
-- -- - --- FIGURE 7
A t a Mach number just below the design value , (flgure 10) the shock location i s significantly 1
farther forvard than for the design condition and , the flow experiences a reacceleration rearward of . the shock with a ~upercr i t i ca l peak velocity near the 75% chord station. This re&celeration causes a eubstantially greater and steeper pressure in- crease t o the t ra i l ing edge as campared with the ; design condition. This steeper recovery resul ts , in a small adverse effect on the t ra i l ing edge : pressure recovery and drag. For malot ted a i r fo s designed t o achieve a shockless design condition 8) -
V. Thick Supercritical Airfoils
In the p r d o u s discussion the increase in 1 drag r i s e Mach number for a given a i r f o i l thick- -- x t i o prmided by the I?ASA super- I critlcd siribil has been emphasized. Hwever, t he same approach can be used t o provide a substantial increase i n section thicknegs-ratio for the same drag r i s e Mach number. The f i r s t thick supercr i t i c a l a i r f o i l was developed by W. Palmer of the
I Columbus, Ohio Division of North American-Rockwell -. (figure u). This 17%-thick a i r fo i l has t he same . ' drag r i s e Mach number aa a 12%-thick HACA 6-series a i r fo i l at the same l i f t coefficient.
1
A l A A COPY SHEETS For 8 ' 1 x 1 1 rheat Type pogo overa l l - 6'4 x 9 '1
This sheel t o bo roduccd t o 775 of i t8 proscnl a i r 0
- - - - - -- A- - -- - -- 1 1 suBcRlTlcAL PRESSURE DlsTRlBuTloN ON j ' NEAR- DESIGN PRESSURE DISTRIBUTION ON , ,
I 1% -THICK N A S A SUPERCR~T~CAL AIRFOIL i I I%-THICK .NASA SUPERCRlTlCAL AIRFOIL
-1.2 r , I -1.2 M * 0 . 8 0 ; c,-0.61 * I M m O . 6 0 ; cn=0.50
i
I t i
1 !
CP i 1 ' 0 1 G i * 4
1
I 04 1 I
_ _--- -.-_ * ---- - -- -- -- FIGURE 9 FIGURE 11
M 80.78 ; cn-0.58
. I
FrmJRE 10
YI. Theoretical Analysis . -
Considerable progress has been made during FIGURE 12 the last three years in providing theoretical 1 methods for the design and analysis of two- ! dimensional a i r fo i l s a t supercritical Mach numbers-' Bo attempt wil l be made t o cover all t h i s work, i instead the method being used a t langley i n a I continuing effort on supercritical a i r fo i l s wil l be described.
The i n i t i a l contparisons of theoretically de- 1 1
rived pressure distributions on NASA supercritical I a i r fo i l s with experimental resul ts indicate very I poor agreement. The differences are associated with the development of the boundary layers on these airfoi le , i l lustrated by figure 14. The

AlAA COPY SHEETS For 8'; r 1 1 s h e e t Type pogo orerol l - 6'4 r 9 ' :
T h i s shoot t o bo raducod t o 77'; of ~ 1 % proaont s i l o
THlCK SUPERCRITICAL AIRFOIL I PALMER OF NORTH AMERICAN ROCKWELL, COLUMBUS 1
-- - --.--- -.-- FIGURE 1 3
INFLUENCE OF BOUNDARY - LAYER DISPLACEMENT ON EFFECTIVE CAMBER
OF SUPERCRITICAL AIRFOIL
I BOUNDARY LAYER (SCHEMATIC) 7 1
1 CONFORMAL COORDINATE SYSTEM FOR - I
1 VISCOUS EFFECTS ON PRESSURE DISTRIBUTIONS; I
FOR A SUPERCRITICAL AIRFOIL I
FIGURE 16
I steep pressure r i s e near the t ra i l ing edge of the upper surface causes the boundary layer t o thicken I significantly. On the lower surface the pressure / r i s e from about the .5 t o the .9 chords resul ts ' in a substantial thickening of the boundary layer i i n the cusp while the rapid pressure decrease near I the t ra i l ing edge causes a pronounced thinning of 1 the boundary layer. Each of these effects con- tributes t o a substantial reduction of the effec- t ive aft camber of the airfoi l . It was concluded 1 that for HASA supercritical a i r fo i l s any analytic I
jmethod must include the effect of the boundary I layer.
Recently an analytic method vhich includes the effect of the bo layer has been developed~
This i terat ive pro ed ei fl5Y , is based on the method of Korn and Garabedian for analyzing the external supercritical field, vhich implements a transo i f in i ted i f fe rence scheme defined by Murmaa. ?lg) A imilar method ru also developed by Jameson. (17f l l lo coordinate
hovn in figure 15, was suggested by and consists of mapping the inter ior of ,
the unit c i rc le conformally onto the exterior of ! t h q a i r f o i l with the point a t inf ini ty correspond- , h g t o the origin. These flow f i e ld computations I
are made for a i r fo i l shapes modified by the cal- 1 culated displacement thicknesses of the upper and , 1 lower surface boundary layera. The displacement I thickness s are determined by the method of Br&hav.?l9). Since the boundary layer calc-
empirical correction i s applied for t h i s region. tions are not applicable near the t ra i l ing edge a n 4
A similar method has also been developed by h u e r at the Courant Institute.
I The effect of including the boundary layer on analytical predicted pressure distributions for an I BABA- superc;itical a i r fo i l is i l lustrated i n figure 16. These comparisons are for lift coeffi- i cients substantially greater than the design value.;, A t a subcritical Mach number, including the effect j , of the boundary layer causes a moderate change in the predicted l i f t . However, a t a supercritical Mach number including the effect of the boundary 1 layer resul ts in substantial changes of the poei- t ion of the shock wave and the l i f t . Comparisons I

A l A A COPY SHEETS For e l l l I I shoot Type pogo o r e t o l l - 6'61 9':
This sheet t o bo reduced to 77'; o l i l r present nixe
L & P A R I s o N OF EXPERIMENTAL 8 THEORETICAL ! U.S.NAVY F-8 WITH TRANSPORT TYPE I
I / noted tha t the a i r f o i l shapes shown a t the bottam of these figures include the displacement thick- , nesses of the upper and lower surface boundam
PRESSURE DISTRIBUTIONS 1 I 9
1 1 7 - - - .. SUPERCRITICAL WlNG
NASA SUPERCRITICAL AIRFOIL M = 0.50
1 - THEORY I
EXPERIMENT I
i I I I I FIGW 19
I - - /
! F-8 FLIGHT DEMONSTRATION PROGRAM .
- - j /layers. I
.--. .. VII. Flight Demonstration Program
1
-- - - - FIGURE 17
- - COMPARISON OF EXPERIMENTAL 8 THEORETICAL
PRESSURE DISTRIBUTIONS
I NASA SUPER CRITICAL AIRFOIL
M = 0.76
-
FIGURE 18
of theoretical pressure b i s t r l h t l ana -.bp t h i s method with experimental distributions for a BA8A supercritical a i r fo i l a t a subcritical and a aupercritical condition are presented in figures 17 and 18 respectively. Again these comparisons are for lift coefficients substantially greater ! than the design value. In both cases the agree- 1 ment i s quite good. The difference i n pressures j just rearward of the shock wave for the super- 1 c r i t i c a l condition (figure 18) is due t o the fact tbt the f i e ld ca l cmt ion under predicts the i preseure jump through the shock. Recently Jameeon 1
THEORY / 1 CHRONOLOGY
EXPERIMENT APPROVAL - 1968
1 I ~l t - is~ FLffinT - 1971 COMPLETION - 1973
- CQHCLUSION - WINO-TU&EL RESULTS VERIFIE D - - - - - - . - -
PUBJgE 20
,has solved this problem and the method is now being' 1 modified t o incorporate his solution. It should be
,
Because of the drastically different nature o f ' e flow over the NASA supercritical a i r fo i l , there '
considerable concern as t o how the new shape d operate i n actual fl ight. Therefore, the ral U. S. government agencies responsible for 1
that 3s HBSB, the Air Force, and the &my4 a -, three part f l ight demon- !
The program was t o evaluate t he I application of the new a i r fo i l t o a swept, long- 1 kange transport wing configuration, n thick wing, and a variable s e e p fighter wing. In each c u e 1 existing military a i rc ra f t were used as t e a t beds. Boyever, i n none of the cases was it intended t he ; tes t wing muld be applied t o production versions
i !of these aircraf t .
WING APRICATION - LONG RANGE TRANSPORT
W E C T I V E - INCREASE0 CRUISE SPEED TO NEAR-SONIC VALUE W ~ ~ O U T DEGRADATION OF OFF-OESION CHARACTERISTICS
SPONSOR - NASA
F-8 TEST BED - PROVIDEO BY U.S. NAVY
CONFIGURATION DESIGN 8 OEVELOPMENT -NASA LANGLEY
WING STRUCTURAL DESIGN a FABRICATION - NORTH AMERICAN- ROWWELL .LO9 ANGELES
FLIGHT PROGRnL( - NASA FLIGHT RESEARCH CENTER
AlAA COPY SHEETS For 8 ' ~ x 11 st, Trpe paqe o r e
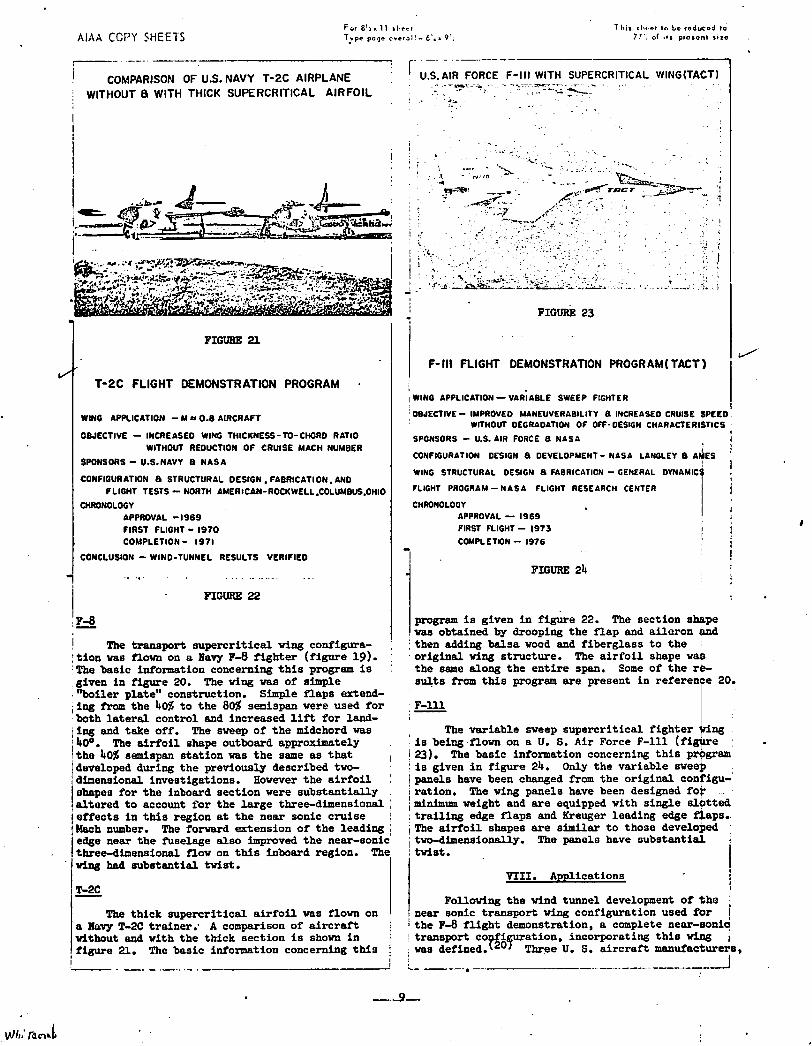
! COMPARISON OF U.S. NAVY T-2C AIRPLANE
j WITHOUT 8 WITH THICK SUPERCRITICAL AIRFOIL I
1 1-2C FLIGHT DEMONSTRATION PROGRAM -
WING APF'LICATION - M rr 0.8 AIRCRAFT
OWECTIVE - INCREASE0 WING THICKNESS-TO-CHORD RATIO WITHOUT REDUCTION OF CRUISE MACH NUMBER
SPONSORS - U.S.NAVY 8 NASA
CONFIGURATION 8 STRUCTURAL OESIGN . FABRICATION, AN0 PLIGHT TESTS - NORTH AMERICAN-ROCKWELL.COLUMBUS.OHI0
Q(RONOL0GY APPROVAL - 1969 FIRST FLIGHT - 1 9 7 0 COMPLETION - 1971
CONCLUStON - WINO-TUNNEL RESULTS VERIFIED
1 The transport supercr i t ical wing configura- ] ! t ion was flown on a Havy F-8 fighter (figure 19). ,
The basic information concerning this pmgram is given i n figure 20. The wing was of simple "boiler plate" construction. Simple f laps extend- , ing from the 4053 t o the 8015 senispan were used fo r both l a t e r a l control and increased lift f o r land- ing and take off. The sweep of t h e midchord was
1 hOO. The a i r f o i l shape outbo-d approximately I
1 the 40$ semispan s ta t ion was t h e same as t h a t developed during t h e previously described two- i I dimensional investigations. Bowever the a i r f o i l I shapes for t h e inboard section were substantially altered t o account for the l a rge three-dimensional ,
[e f fec t s i n this region a t the near sonic cruise I !Mach number. The forward &ension of the leading I I a e near the fuselage also improved the near-sonic thtee4imenaional flow on t h i s inboard region.
( w i n g 2raa substantial twist.
The thick supercrit ical a i r f o i l was flown on 1 a Havy T-2C trainer: A comparison of a i r c r a f t 1 without and with the tMck section i s shown i n 4
figure 21. The basic information concerning t h i s i
' U.S.AIR FORCE F-Ill WlTH SUPERCRITICAL WING(TACT1 1
F-Ill FLIGHT DEMONSTRATION PROGRAM( TACT) I d 1 WING APPLICAllON - VARIABLE SWEEP FIGHTER I
I OBJECTIVE - IMPROVED MANEUVERABILITY 8 INCREASED CRUISE SPEED.
WITHOUT DEGRAOATION OF OFF- OESIGN CHARACTERISTICS
SPONSORS - US. AIR FORCE a NASA i I
CONFIGURATION DESIGN 8 DEVELOPMENT- NASA LAMLEY 8 A ~ E S
WlNG STRUCTURAL DESIGN 8 FABRICATION - GENERAL DYNAMICS I
i FLIGHT PROGRAM - NASA FLIGHT RESEARCH CENTER
CHRONOLOGY APPROVAL - 1969
I I FIRST FLIGHT - I 9 7 3 ! COUPLETON - 1976
i FIGURE 24
program is given i n figure 22. The section shape vas obtained by drooping the f l ap and aileron &d
ithen adding balsa mod and fiberglass t o the orlginal wing structure. The a i r f o i l shape was the same along t h e en t i re span. Some of t h e r b salts -this program are present i n reference 20.
The variable sweep supercr i t ical f ighter iring ' i s being flown on a U. S. A i r Force F-111 ( f l y @ 1 23). The basic information concerning t h i s pr gram ' i s given i n figure 24. Only the variable awe% I panels have been changed from the or iginal configu- 1 ration. The wing panels have been designed fo? . , minimum weight and a r e equipped with single s lo t t ed , t r a i l i n g edge f laps and Kreryer leading edge flaps. I The a i r f o i l shapes a r e similar t o those developed ;two-dimensioaslly. The panels have substantial , twist. i
VIII. Applications ! f I Following t h e wind tunnel development of t h e j near sonic transport wing configuration used f o r I
i the F-8 f l i g h t demonstration, a complete near-aoniq ! transport co ation, incorporating t h i s wipg i
A d y m e e ". ,. drcra , m n ~ a c t u r q a , i was defined.
AIAA COPY St1EETS For 8 ' 2 1 1 1 r h a r ~ Typo page orerol l - 6'4 x 9'1
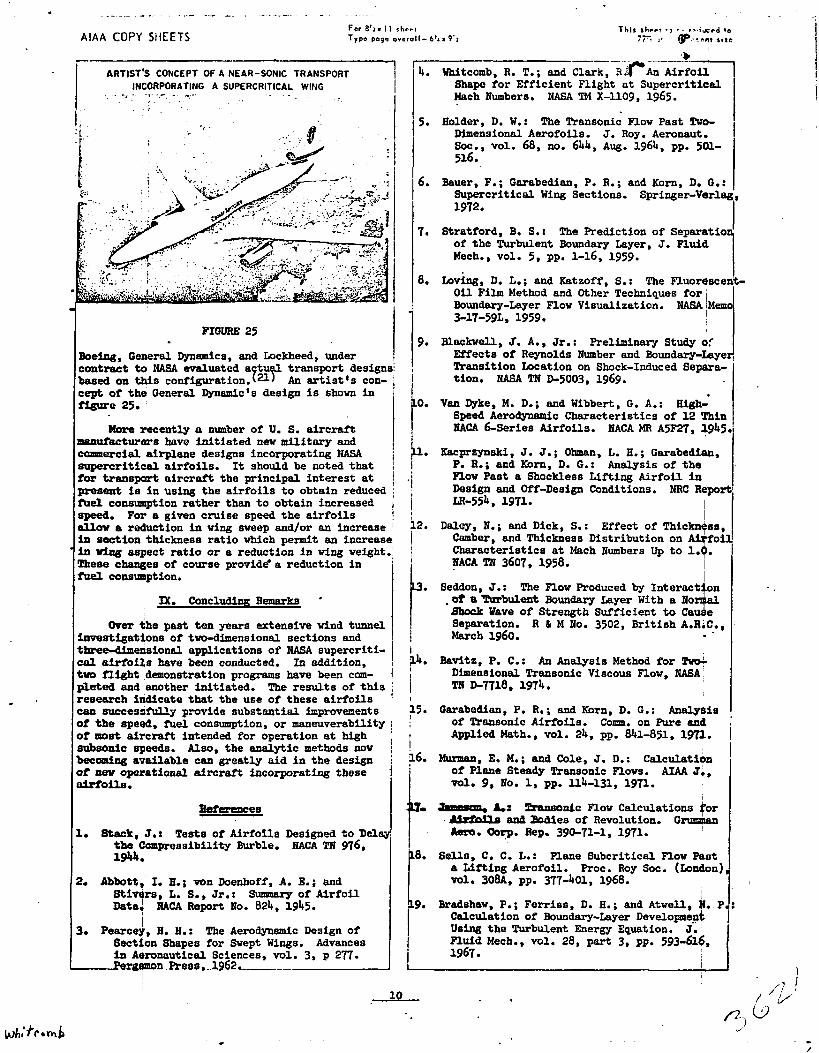
ARTIST'S CONCEPT OF A NEAR-SONIC TRANSPORT INCORPORATING A SUPERCRITICAL WING . -= - , - - *.
FIGURE 25
b e i n g , General Dynmics, and Lockheed, under contract to NASA evaluated a t transport designsi
on tbls coni igurat ion.f2y An artistts con- 1 cept of the General Dynamic's design is shown i n figure 25.
More recently a number of U. S. a i rc ra f t mamfkctmers have in i t i a ted nev mil i tary and ! -cia1 airplane designs incorporating NASA i supescritical air foi ls . It should be noted tha t j for transpart a i r c r a f t the principal in te res t a t 1 present is i n using the a i r f o i l s t o obtain reduced j fUel conslmrption ra ther than t o obtain increased 1 speed. For a given cruise speed t h e a i r f o i l s i allow a reduction i n wing sweep and/or an increase ;
ia section thickness r a t i o which permit an increase; ' i n wing aspect r a t i o o r a reduction i n wing weight.,
These changes of course provide' a reduction i n iuel consumption. I I Me Conclu- Remarks ' I
Over the past ten years extensive wind tunuel investigations of two-dimensional sections and ttree4hensiona.l applications of BASA supercriti- cal a i r f o i l s have been conducted. In addition, tuo flight demonstration programs have been con- w e d and another init iated. The resu l t s of this research indicate t h a t the use of these a i r f o i l s can guccesoiully provide substantial hprovenents of t h e speed, fuel consumption, o r maneuverability of most a i rc ra f t intended fo r operation a t high subsopic speeds. Also, the analytic methods now becamin8 available can greatly a i d i n the design of new operational d r c r s f t incorporating these air iof i .
1. Stack, J.: Tests of Airfoils Designed t o Deld the ccquess ib i l i ty Burble. HACA TN 976,
2. Abbott, I. 8. ; .van Doeahoff, A. B.; and Stivere, L. S., Jr.: Summy of Airfoi l Data! HACA Report. No. 824, 1945.
I 3. ~ e a r c e y , H. H.: The Aerodynamic Design of
., -- - - ---- Whitcomb, R. T. ; aud Clark, SPA~ Air fo i l Shape f o r Efficient Flight a t Supercrit ical Mech Numbers. NASA TM X-1109, 1965.
Holder, D. W.: The Transonic Flow Past !hm- Dimensional Aerofoils. J. Roy. Aeronaut. Soc., vol. 68, no. 644, Aug. 1964, pp. 501- 516.
Bauer, F.; Garabedian, P. R.; and b r n , D. 0. : I Supercrit ical Wing Sections. Springer-Verlag, 1972. I
Stratford, B. 5.: The Prediction of Separatio of the Turbulent Boundary Layer, J. Fluid Mech., vol. 5, pp. 1-16, 1959.
1 Loving, D. L.; and Kstzoff, S. : The Fluorescent-
O i l Film Method and Other Techniques f o r I 1 Boundary-Layer Flow Visualization. 3-17-59Lv 1959. -'"-I
Blackwell, J. A., Jr.: Preliminary Study o i Effects of Reynolds Number and Boundary-Laye Transition Location on Shock-Induced Separa- tion. NASA TN D-5003, 1969. . I
Van Dyke, M. D.; and Wibbert, G I A,: High- Speed Aerodynaraic Characteristics of 12 Thin . I EACA &series Airfoils. HACA MR A5F27, 1945. i
Kacprzynski, J. J.; Obmsa, L. H.; Garabedian, P. R.; and Korn, D. G.: Analysis of t h e Flow Past a Shockless Lifting Airfoi l i n Design and Off-Design Conditions. W-554 , 1971. I
Daley, FI.; and Dick, S.: Effect of Thickness,
Characteristics a t Mach Numbers Up t o 1.9. I Camber, and Thickness Distribution on &oil
FIACA !t!N 3607, 1958. I
I Seddon, J.: The Flow Produced by Interact on , of a Turbulent Boundaqy Layer With a No 8hock Wave of Strength Sufficient to Cau e e Separation. R & M No. 3502, Bri t ish A.R!c,, w c h 1960.
I Bavitz, P. C.: An Analysis Method f o r &
Dimensional Transonic Viscous Flow, M A : TN D-7718, 1974.
Oarabedian, P. R.; and Korn, D. G.: AnalyBis I of Transonic Airfoils. Comm. on Pure and ' A W ~ h t h . , V O ~ . 24, pp. 841-851, 197L. i
Muman, E. M.; and Cole, J. D.: ~ a l c u l a t i k of Plane Steady Transonic now. A I A A J., vdle 9, Ho. 1, pp. lib-131, 1971. 1
A.: ~ n i c now calculations ?or . ASrZbib an8 Bodles of Revolution. G- a. -9. Rep- 390-71-1, 1971.
Sells, C. C. L.: Plane Subcrit ical Flow Past a Lifting Aerofoil. Proc. Roy Soc. (London) vol. 308A, pp. 3't't-b01, 1968.
I
Bradshaw, P.; Ferries, D. H.; and Atwell, k. PA: Calculation of Boundary-Layer evel lop me-nt I U s h t h e Turbulent Energy Equation. J. I F h f d Mech., vol. 28, 3; pp. 593-616, 1967. I

For 8 ' j x 11 shest Type page ouornll - 6!r s 9!1
I .----.--- - 20. Ayers, T. G. : ~ u p k ~ c r i t i c a l Aerodynamics,
Astronautics and Aeronautics, pp. 32-36, A u ~ St. 1972. r -7
21. baslow, A. L. ; and Alyord, W. J. : Advancea [ Subsonic Transport Technology. Astronautics and :Aeronautics, pp. 26-31, August 1972. 1
I . j Symbols I
chord of a i r fo i l section drag coefficient section moment coefficient section normal force coefficient pressure coefficient Cp = ~(1ocal)- ambient
9 Mach ;number pressure. dyn&c pressure d r f d i l thickness d i s thce from leading edge of a i r f o h ve*ical dimension &om horizontal reference angle of attack
This shoat to be rodueed l o 77% of i t s prorent size
f .