fy5/2015 1st quarter performance - ir pocketpdf.irpocket.com/c2678/xn1v/qlno/sto9.pdf · because...
TRANSCRIPT
Disclaimer This is an English translation of the captioned release. This translation is prepared and provided for the purpose of the reader’s convenience. All readers are recommended to refer to the original version in Japanese of the release for complete information
News Release dated: September 12, 2014
To whom it may concern:
Company Name: ASKUL Corporation (Code No.: 2678, Tokyo Stock Exchange First Section)
Representative: Shoichiro Iwata President and Chief Executive Officer
Contact Person: Tsuguhiro Tamai Executive Officer, Finance & Corporate Communication Unit Phone: (03) 4330-5130
FY5/2015 1st Quarter Performance (Consolidated financial summary for first quarter of fiscal year ending May 2015)
ASKUL Corporation (hereinafter referred to as the “Company”) herewith attach the “FY5/2015 1st
Quarter Performance” (Consolidated financial summary for first quarter of fiscal year ending May
2015 ) to provide supplementary information with respect to the “Summary of Consolidated Financial
Results for First Quarter of Fiscal Year Ending May 2015.”
These supplementary materials include forward-looking statements concerning current plans and the
outlook for operating results. These statements are based on plans and forecasts that use currently
available information. Forward-looking statements are not promises or guarantees about the future
because actual operating results may differ from the Company’s outlook for a variety of reasons.
These supplementary materials are unaudited and have not been reviewed by certified public
accountants or auditors.

September 12, 2014
First Quarter Sales and Profit Growth in Line with Forecast
B-to-B Business to Work on Further Enhancing Earning Power
LOHACO to Pursue Further Growth by Introducing New Products
FY5/2015 1st Quarter Performance
DisclaimerThis is an English translation of the captioned presentation material. This translation is prepared and provided for the purpose of the convenience of non-Japanese-speaking people. All readers are recommended to refer to the original version in Japanese of the presentation material for complete information.

1
Notes:
This material contains ASKUL Group’s current plans and performance outlook. These plans, forecasts, and other forward-looking statements
represent ASKUL’s plans and forecasts based on information currently available. Actual performance may differ from these plans and
forecasts due to a variety of conditions and factors that could occur in the future. This material does not represent promises or guarantees
regarding the achievement of these plans.
This material has not been audited by certified public accountants or auditing firms.
For the purposes of this material, LOHACO refers to the online mail-order business for general consumers, launched in October 2012 in
alliance with Yahoo Japan Corporation.
B-to-B refers to business-to-business transactions.
Reproduction or reprint in any form of all or part of this material (including trademarks and images) without the permission of ASKUL is
prohibited.

2
I. First Quarter Results and FY5/2015 Outlook (Reminder)
II. Strengthening of Logistics Capability– Pursuit of Efficiency and Expansion of Production Capacity –
III. Status of B-to-B Business– B-to-B Business to Work on Further Enhancing Earning Power –
IV. Status of LOHACO Business– LOHACO to Pursue Further Growth by Introducing New Products –

FY5/2015 1Q Consolidated Performance
Amount AmountYoY
c hange
(\million) (\million) (%)
Ne t S a l e s 57,560 100.0 63,037 100.0 +9.5
Gross Profi t 12,785 22.2 13,576 21.5 +6.2
S e l l i ng, Ge ne ra l a nd
Admi ni stra t i ve
E xpe nse s12,420 21.6 13,194 20.9 +6.2
Ope ra t i ng Income 364 0.6 381 0.6 +4.6
Ordi na ry Income 396 0.7 404 0.6 +2.1
Ne t Income 133 0.2 182 0.3 +37.3
FY5/2014
% of net
sales
% of net
sales
FY5/2015 Net sales increased 9.5% YoY by
overcoming the impact of the
consumption tax increase
Gross profit margin declined 0.7
p.p. reflecting the weaker yen and
rising cost of raw materials
Ratio of SG&A expenses to net
sales improved by 0.7 p.p. due to
improvement in logistics
productivity
Operating income increased 4.6%
and net income rose 37.3%
3
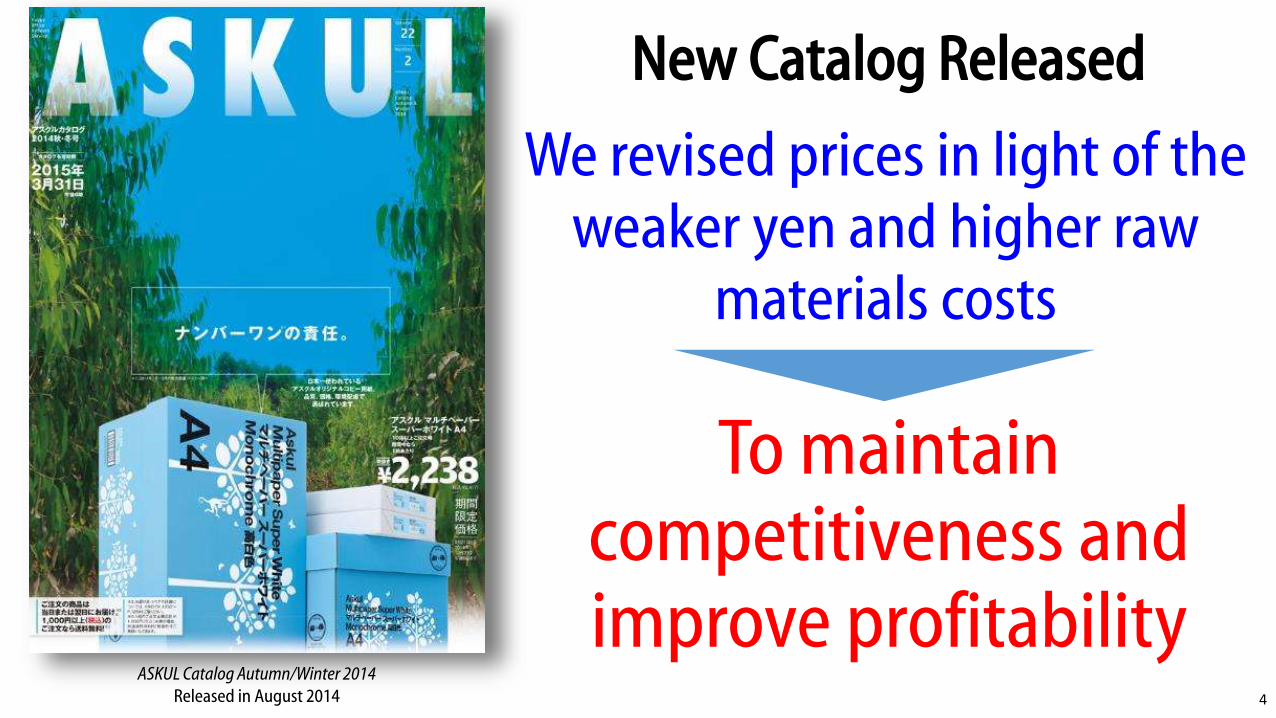
ASKUL Catalog Autumn/Winter 2014
Released in August 2014
We revised prices in light of the weaker yen and higher raw
materials costs
New Catalog Released
To maintain competitiveness and improve profitability
4

Copier paperASKUL Multi Paper Super White
Size A4 1 box (5,000 sheets) Comparison with
similar products
L-shaped transparent foldersASKUL Standard Clear Folder A4
1 packet (100 sheets) Comparison with similar products
Per pocket
Flat filesASKUL Flat File (Economy Type) A4
1 packet (10 files) Comparison with similar products
Per file
Mineral waterKirin Alkali Ion Water 2.0 L
1 set (12 bottles)
Per bottle
TissueASKUL Original Tissue 200 pulls per box
1 pack (5 boxes) Comparison with similar products
Comparison of Prices in New Catalog against Competing Products
¥2,678 ¥2,798 ¥6.98 ¥7.59< ¥22.7 ¥24.8<
¥83.0 ¥118.2< ¥298 ¥366<
*Prices of ASKUL products are
those listed in the catalog after a
limited sale period.
*The prices of products by other
companies are based on a survey
by ASKUL as of September 2014.
*The prices do not include
consumption tax.
<
5
ASKUL Other company ASKUL Other company ASKUL Other company
ASKUL Other company ASKUL Other company

Introduce More Value Added Products to Improve Gross Profit
6

Net Sales 1.8 55.7 57.5 4.0 59.0 63.0Operating
Income -0.6 0.9 0.3 -0.9 1.2 0.3
FY5/2014 1Q Actual
B-to-B
Business, etc.LOHACO Total
FY5/2015 1Q Actual
LOHACOB-to-B
Business, etc.Total
FY5/2015 1Q Consolidated Performance (By Business)
B-to-B Business, etc.: Both net sales and operating income rose YoY
LOHACO: Top line was 224% of the same period a year earlierActively implementing measures to increase customers
7
(¥billion)

Consolidated Net Sales and Operating Income Progressing in Line with Forecasts
0
20
40
60
80
100
1Q 2Q 3Q 4Q
FY5/2015 Plan
FY5/2015 Actual
Note: Quarterly trend when full-year plan is set as 100%
(Quarter)
Plan
Actual
(%)
Progress of Net Sales
0
20
40
60
80
100
1Q 2Q 3Q 4Q
FY5/2015 Plan
FY5/2015 Actual
Note: Quarterly trend when full-year plan is set as 100%
(Quarter)
Plan
Actual
(%)
Progress of Operating Income
Price revision,
etc.
8

Amount YoY change Amount YoY change
(\billion) (%) (\billion) (%)
Net Sales 132.5 100.0 +11.1 144.5 100.0 +7.7
Gross Profit 29.1 22.0 +9.1 32.4 22.4 +11.6
Selling, General and
Administrative Expenses 27.1 20.5 +7.5 27.9 19.3 +6.4
Operating Inc ome 2.0 1.5 +36.3 4.5 3.1 +60.2
Ordinary Inc ome 1.9 1.5 +30.0 4.4 3.1 +53.1
Net Inc ome 1.0 0.8 +79.2 2.4 1.7 +49.4
2H FY5/2015
% of net
sales
1H FY5/2015
% of net
sales
Consolidated Performance Outlook for 1H and 2H FY5/2015
9
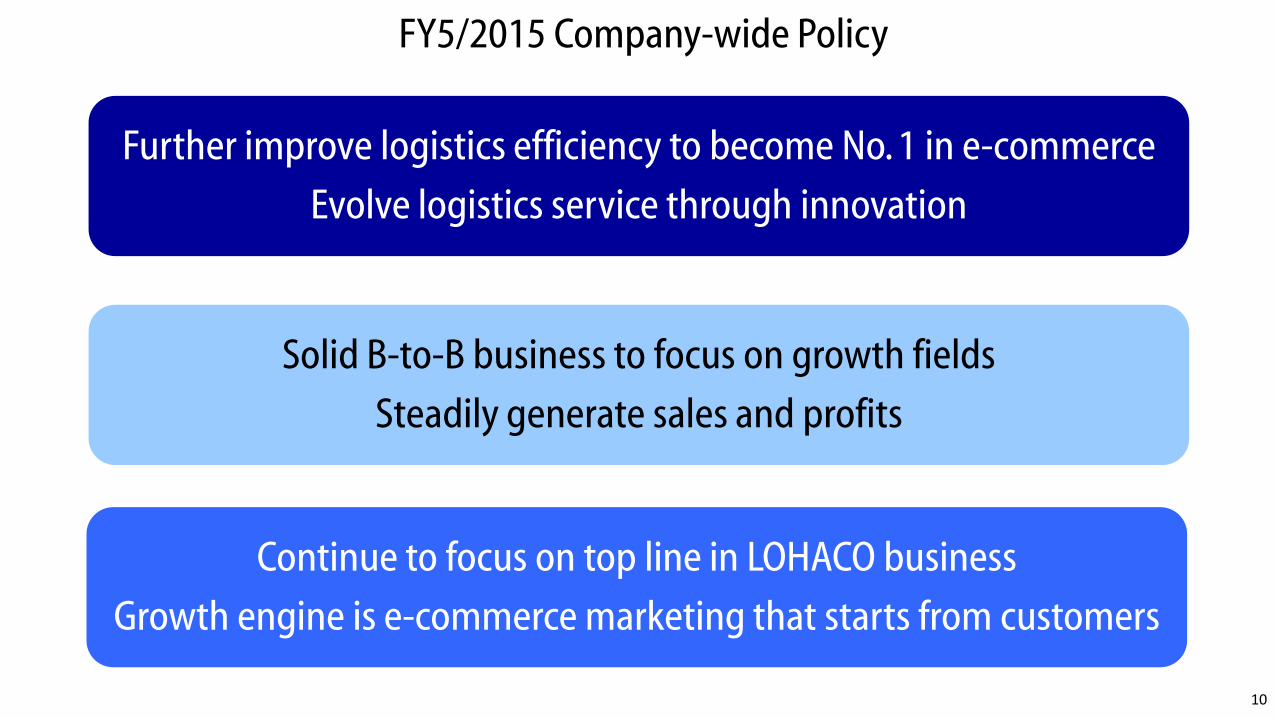
Further improve logistics efficiency to become No. 1 in e-commerce
Evolve logistics service through innovation
Continue to focus on top line in LOHACO business
Growth engine is e-commerce marketing that starts from customers
Solid B-to-B business to focus on growth fields
Steadily generate sales and profits
FY5/2015 Company-wide Policy
10

11
I. First Quarter Results and FY5/2015 Outlook (Reminder)
II. Strengthening of Logistics Capability– Pursuit of Efficiency and Expansion of Production Capacity –
III. Status of B-to-B Business– B-to-B Business to Work on Further Enhancing Earning Power –
IV. Status of LOHACO Business– LOHACO to Pursue Further Growth by Introducing New Products –
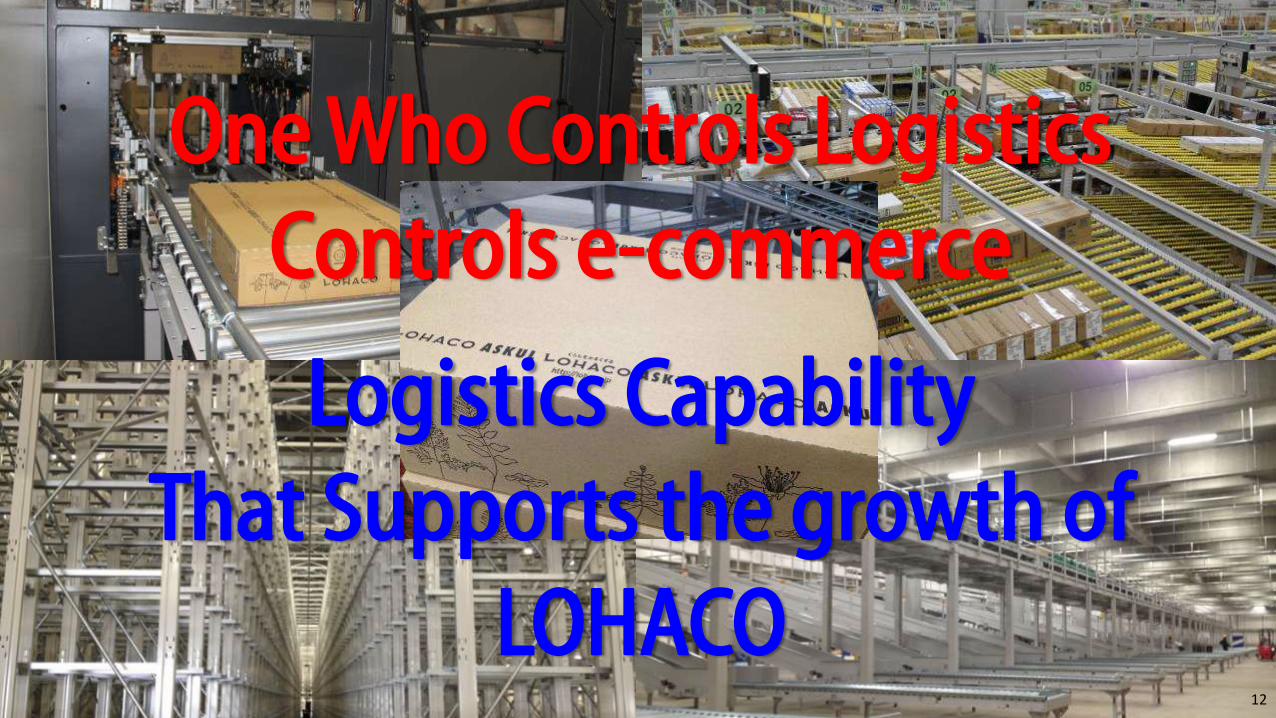
One Who Controls Logistics
Controls e-commerce
Logistics Capability
That Supports the growth of
LOHACO12

Initiatives for Improving Logistics Efficiency in FY5/2015
(1) Center operation (local operation perspective): 1Q• Improve location, picking, packing, and replenishment
• Review inefficient operations and efficiently utilize human resources
(2) Material handling equipment and system (engineer’s perspective): 2Q• Enhance capacity of existing facilities
• Further improve productivity by introducing new equipment
(3) Business process, model (business perspective): 2Q, 3Q• Reform of inventory arrangement, inter-warehouse transfer, arrival system, etc.
13
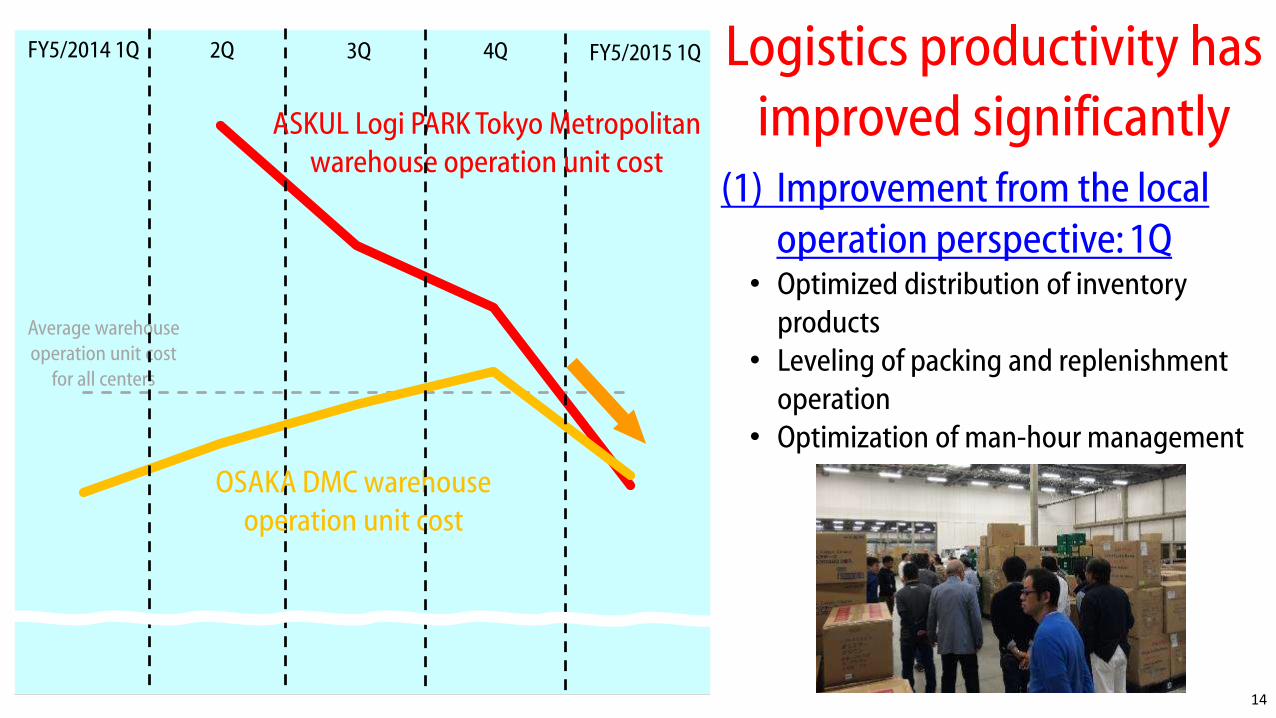
13/5期 1Q 13/5期 2Q 13/5期 3Q 13/5期 4Q 14/5期 1Q
Average warehouse
operation unit cost
for all centers
ASKUL Logi PARK Tokyo Metropolitan
warehouse operation unit cost
4Q3Q2QFY5/2014 1Q FY5/2015 1Q
OSAKA DMC warehouse
operation unit cost
Logistics productivity has
improved significantly(1) Improvement from the local
operation perspective: 1Q• Optimized distribution of inventory
products
• Leveling of packing and replenishment
operation
• Optimization of man-hour management
14

(2) Improvement from the
engineer’s perspective: 2Q• Expansion and review of conveyer
lines (for all centers)
• Introduction of picking and
sorting/packing facility
(for B-to-B Business centers)
Total investment about ¥500 million
B-to-B Business
B-to-B Business + LOHACO
Fukuoka Center
(September 2000)
Yokohama Center
(April 2001)
★
★
★
Osaka DMC
(renewal in May 2013)
Nagoya Center
(September 2004)
ASKUL Logi PARK Tokyo Metropolitan
(operation started in July 2013)
Sendai DMC
(August 2007)
DCM Center
(April 2002)
Further improvement of
logistics productivity
through further capital
investment
15
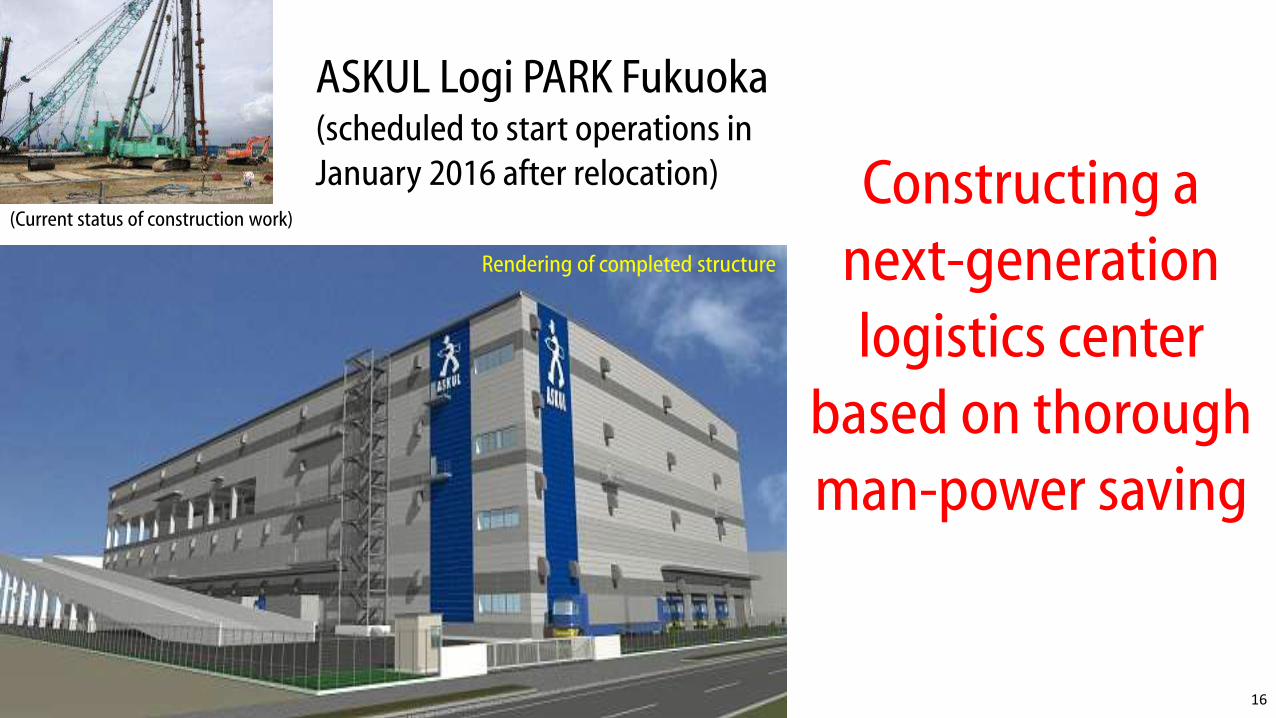
ASKUL Logi PARK Fukuoka(scheduled to start operations in
January 2016 after relocation)
Rendering of completed structure
Constructing a
next-generation
logistics center
based on thorough
man-power saving
(Current status of construction work)
16
17
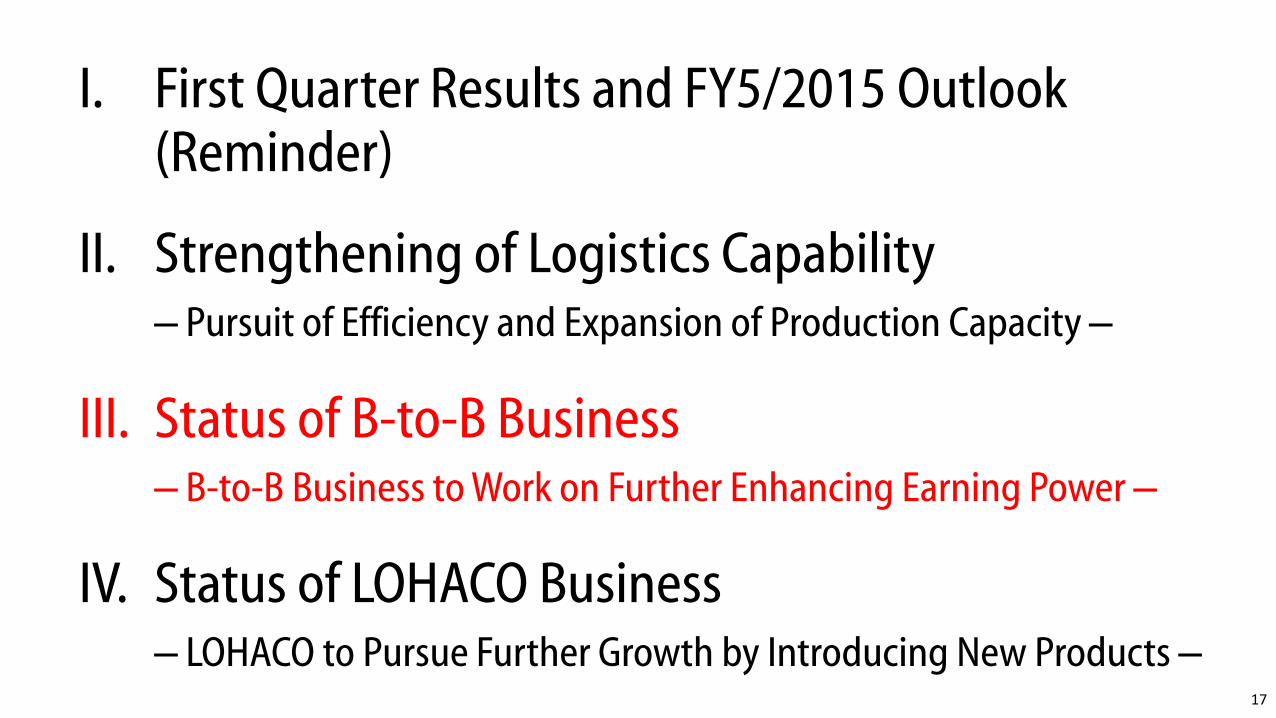
I. First Quarter Results and FY5/2015 Outlook (Reminder)
II. Strengthening of Logistics Capability– Pursuit of Efficiency and Expansion of Production Capacity –
III. Status of B-to-B Business– B-to-B Business to Work on Further Enhancing Earning Power –
IV. Status of LOHACO Business– LOHACO to Pursue Further Growth by Introducing New Products –

18
Targeting
B-to-B Business
100
105
110
115
120
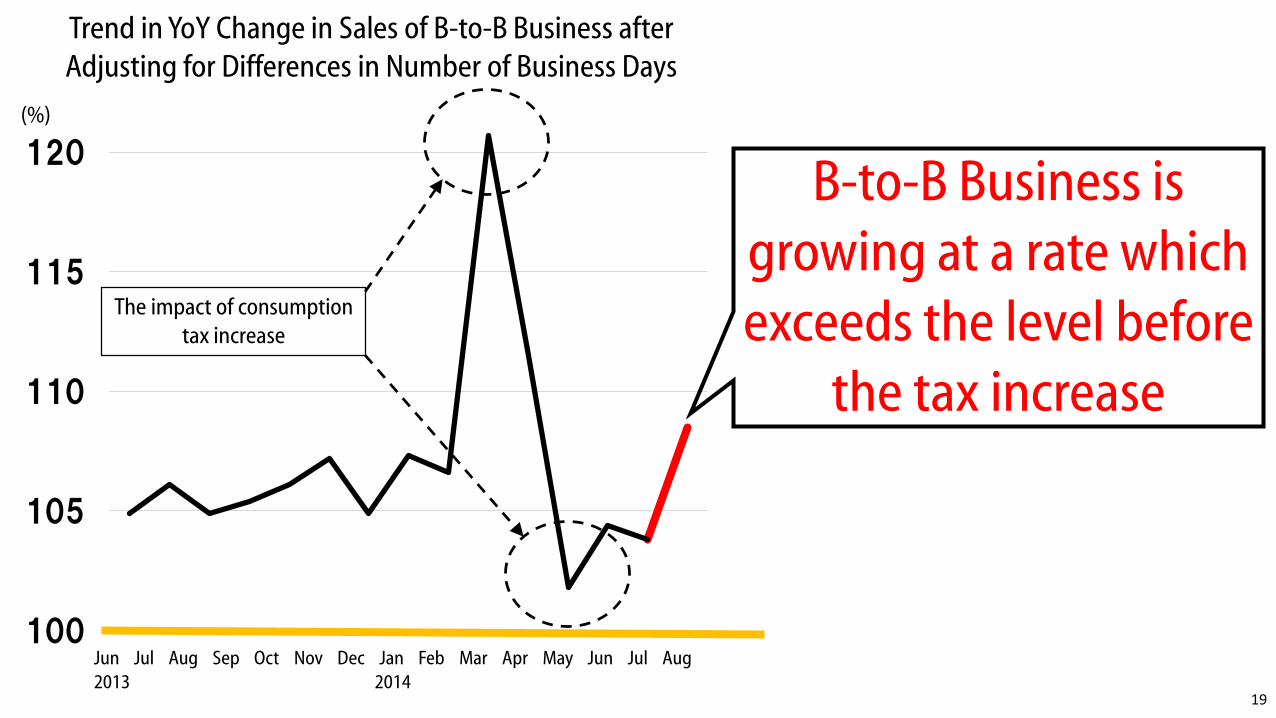
(%)
Trend in YoY Change in Sales of B-to-B Business after
Adjusting for Differences in Number of Business Days
The impact of consumption
tax increase
B-to-B Business is
growing at a rate which
exceeds the level before
the tax increase
19
Jun Jul Aug Sep Oct Nov Dec Jan Feb Mar Apr May Jun Jul Aug
2013 2014

20
(%)
The increase in spending
per customer drove the
growth
Resulting expansion in net
sales per box improved
delivery efficiency100
101
102
103
104
105
6月 7月 8月
Annual growth rate of spending per
customer for full-year FY5/2014
2.8%
Trend in YoY Change in Monthly Spending per
Customer of B-to-B Business
20
Jun Jul Aug
2014
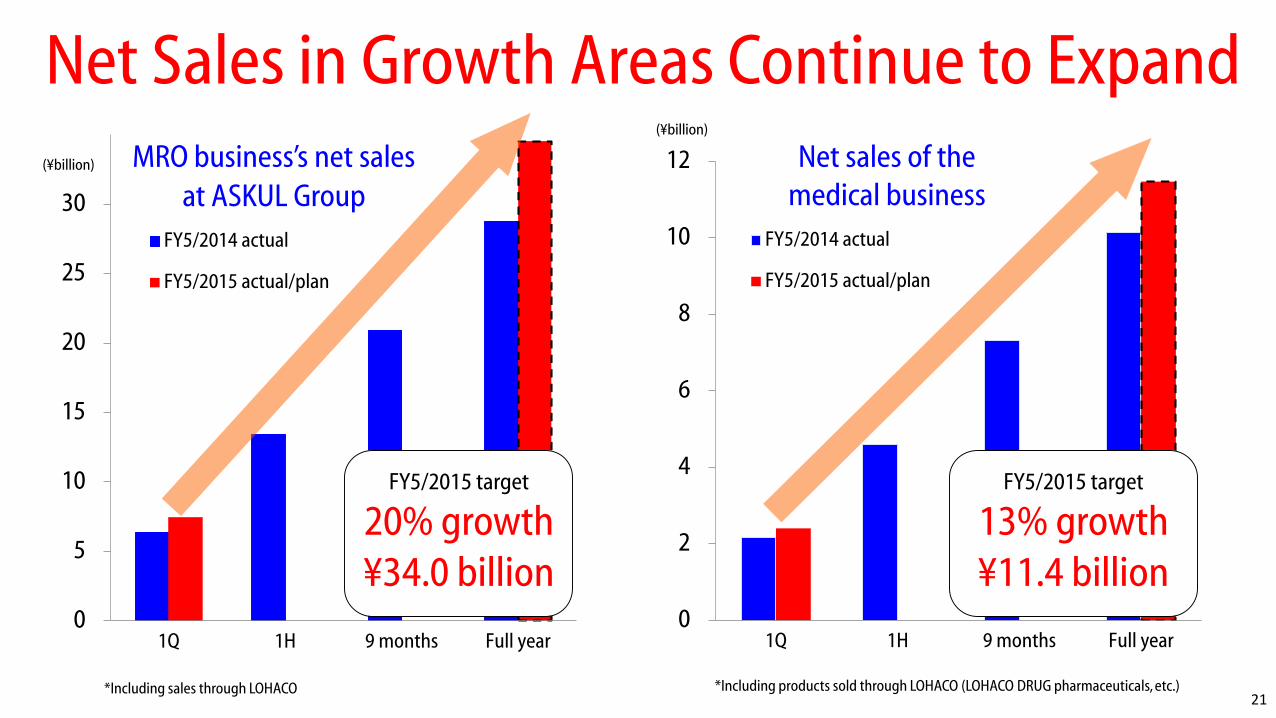
0
2
4
6
8
10
12
1Q 1H 9 months Full year
FY5/2014 actual
FY5/2015 actual/plan
0
5
10
15
20
25
30
1Q 1H 9 months Full year
FY5/2014 actual
FY5/2015 actual/plan
MRO business’s net sales
at ASKUL Group
FY5/2015 target
20% growth
¥34.0 billion
Net Sales in Growth Areas Continue to Expand
*Including sales through LOHACO
Net sales of the
medical business
FY5/2015 target
13% growth
¥11.4 billion
*Including products sold through LOHACO (LOHACO DRUG pharmaceuticals, etc.)21
(¥billion)
(¥billion)

Increase the number of customers
(primarily in manufacturing and medical/nursing care)
Evolve e-commerce purchasing website to boost
active customer rate
3 Measures That Support Growth of B-to-B Business
Introduce new high-demand products (MRO, medical)
22

Ultra general-purpose products for
any industry categories
Listed on catalogs
High-demand products
Expand lineup of
industry-category-specific
specialty goods
Industry-category-specific
general-purpose products
New high-demand product
Introduce New High-demand Products (MRO)
23
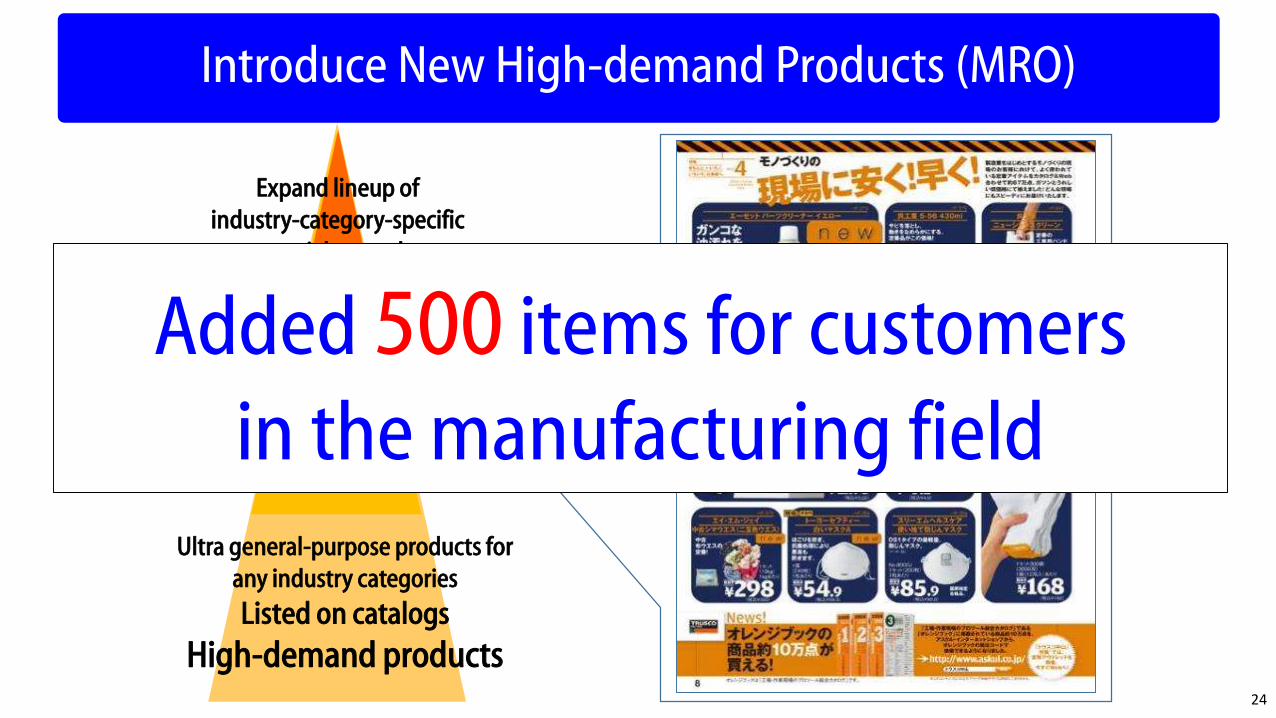
24
Ultra general-purpose products for
any industry categories
Listed on catalogs
High-demand products
Expand lineup of
industry-category-specific
specialty goods
Industry-category-specific
general-purpose products
New high-demand product
Introduce New High-demand Products (MRO)
Added 500 items for customers
in the manufacturing field
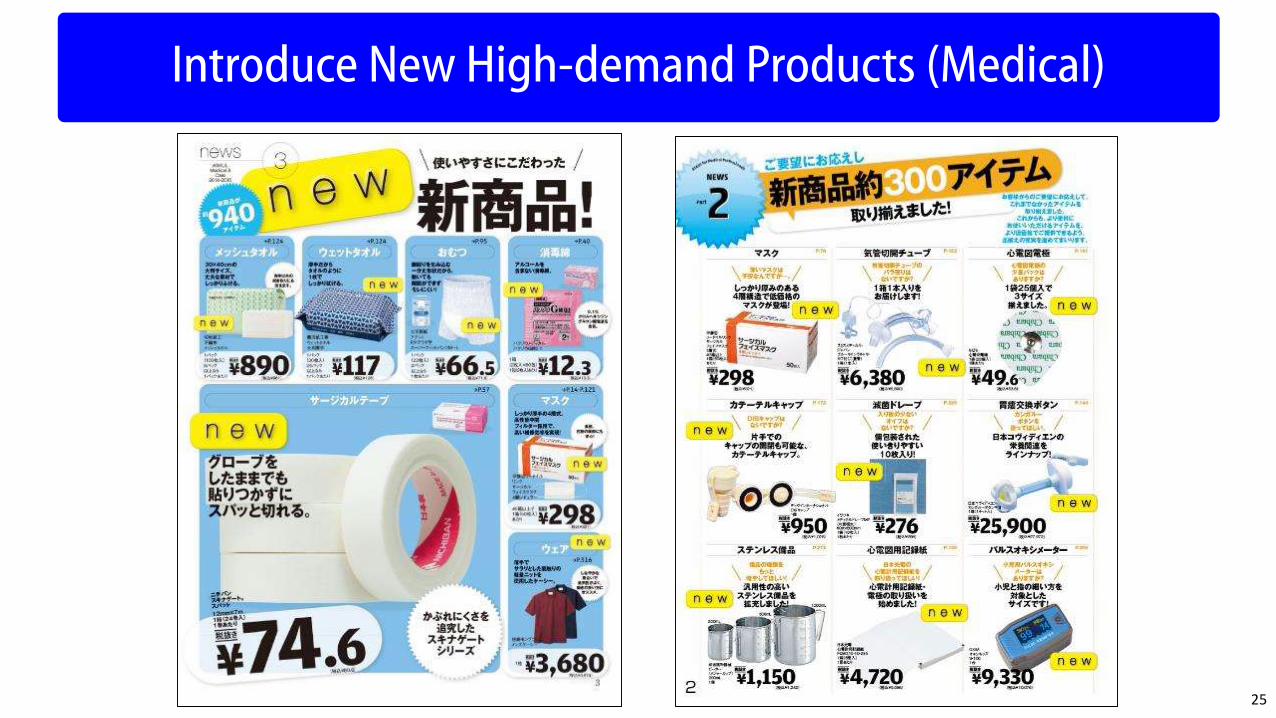
Introduce New High-demand Products (Medical)
25

Added 1,240 items for customers
in medical and nursing care facilities
26
Introduce New High-demand Products (Medical)

Strengthen new customer development with new high-demand products and 1,400 agents
New customer
developmentInitial operation
1 2
Operation promotion
3
Flyers for developing
new customers in
strategic industries
Pamphlets sent along
with catalogs
Operation promotion
tools, samples
Increase the Number of Customers(Primarily in Manufacturing and Medical/Nursing Care)
27

FY5/2014 actual
Manufacturing/
construction
Medical/nursing care
Other
Manufacturing/
construction
Medical/nursing care
FY5/2015 target
Other
Develop
approx. 170,000companies
in manufacturing/construction
and medical/nursing care fields
28
Increase the Number of Customers(Primarily in Manufacturing and Medical/Nursing Care)
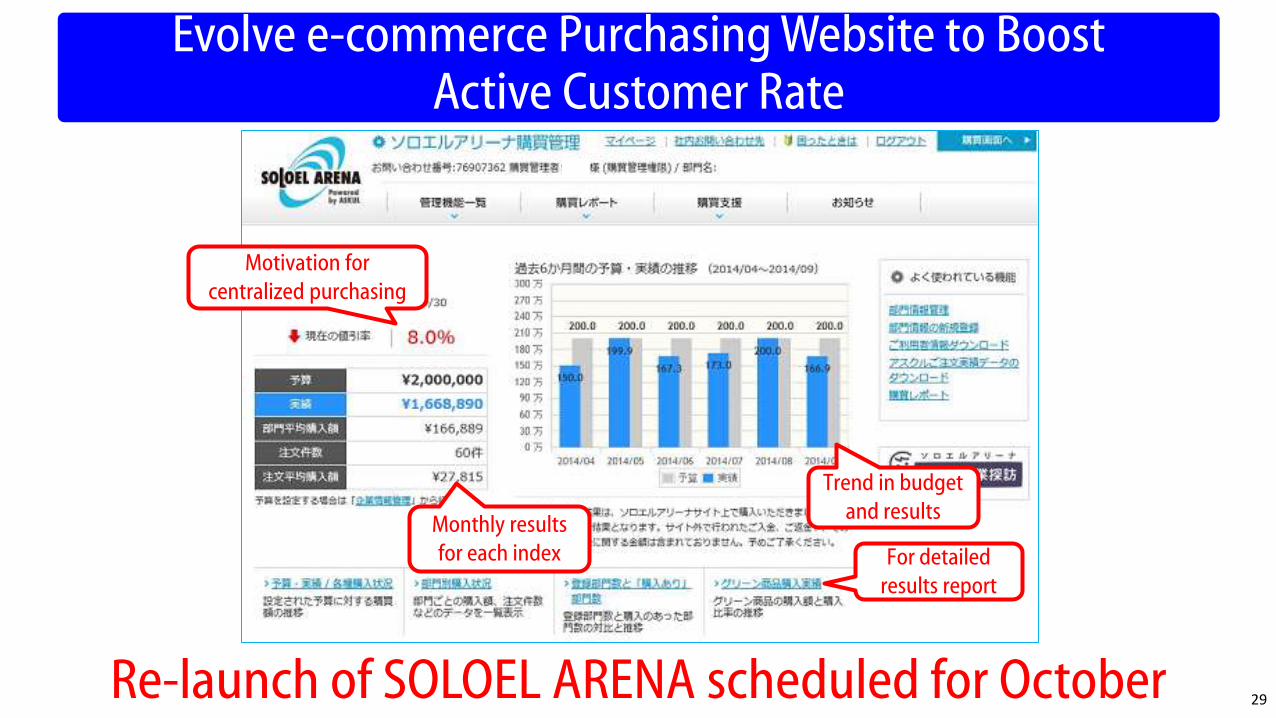
Motivation for
centralized purchasing
Trend in budget
and resultsMonthly results
for each index For detailed
results report
Re-launch of SOLOEL ARENA scheduled for October
Evolve e-commerce Purchasing Website to BoostActive Customer Rate
29

B-to-B business advancing towards
development of new markets and
further bolstering of profits30

31
I. First Quarter Results and FY5/2015 Outlook (Reminder)
II. Strengthening of Logistics Capability– Pursuit of Efficiency and Expansion of Production Capacity –
III. Status of B-to-B Business– B-to-B Business to Work on Further Enhancing Earning Power –
IV. Status of LOHACO Business– LOHACO to Pursue Further Growth by Introducing New Products –

×
32

LOHACO net sales
grew, overcoming the
impact of the rise in
consumption tax
0
200
400
600
800
1,000
1,200
1,400
1,600
Jun Jul Aug Sep Oct Nov Dec Jan Feb Mar Apr May Jun Jul Aug
224%of the same period a
year earlier
2013 2014
33
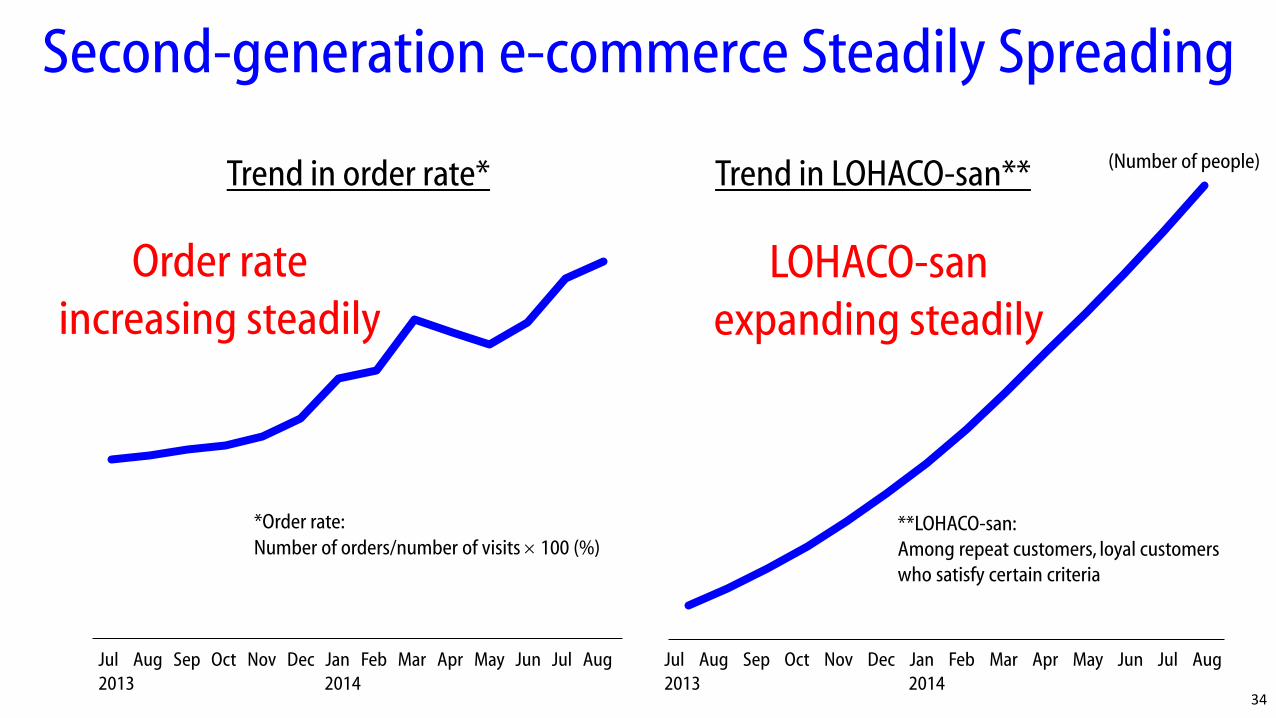
0
20,000
40,000
60,000
80,000
100,000
120,000
140,000
7月 8月 9月 10月 11月 12月 1月 2月 3月 4月 5月 6月 7月 8月
(Number of people)Trend in LOHACO-san**
**LOHACO-san:
Among repeat customers, loyal customers
who satisfy certain criteria
0.0%
1.0%
2.0%
3.0%
4.0%
5.0%
6.0%
7月 8月 9月 10月 11月 12月 1月 2月 3月 4月 5月 6月 7月 8月
Trend in order rate*
*Order rate:
Number of orders/number of visits 100 (%)
Order rate
increasing steadilyLOHACO-san
expanding steadily
Second-generation e-commerce Steadily Spreading
34
Jul Aug Sep Oct Nov Dec Jan Feb Mar Apr May Jun Jul Aug
2013 2014
Jul Aug Sep Oct Nov Dec Jan Feb Mar Apr May Jun Jul Aug
2013 2014

1-day Sample Programto support manufacturers to nurture products
Program effective for expanding customer base and nurturing products at manufacturers
Confident of effectiveness based on demonstration test in 1Q (temporary impact on unit cost and gross profit)
Program to be operated jointly with manufacturers in the future
Inflow from Yahoo! JAPAN site’s main banner
1-day Sample Program is a program that enables the high-speed implementation of
Experience Evaluation Establishment
Expansion
of
population
Product nurturing on a small start with low cost in a short period of time
35

Enhance product
lineup to meet the
customer needs
Aim for increase in
sales per order
Started offering from August 20
Scheduled to start offering from
November
Existing products
Type 1 OTC drugs
Beer, chuhai from 4 major
manufacturers
Cosmetics,
Health products
Started offering from June 12
New productsMore new products from November onwards,
one after another
In addition to the existing
attractive products
+
+
+
+
Produ
ct coun
t
36

Opening of popular
new stores
one after another
Pursue profitability
through added
value
Newly
opened!
8 stores at the time of opening
(August 2013)
27 stores
(As of September 12, 2014)
37

LOHACO Mall Joint Meeting on September 2, 2014
Participants: 62 officials from 32 companies
Further
revitalization also
of existing stores
38

BEER SHOP Launched
in AugustCurrently operated as a separate site
due to licensing issues
Plan to open a large-scale
liquor web shop in
October after integrating
into LOHACO39

0
200,000
400,000
600,000
800,000
1,000,000
1,200,000
1,400,000
1,600,000
1,800,000
Average for 20 days before opening Average for 20 days after opening
Comparison of Average Daily Sales of Alcoholic Beverages
(LOHACO Liquor + BEER SHOP)
for 20-day Period before and after the Opening of BEER SHOP
Alcoholic beverages net
sales expanded
significantly following the
opening of BEER SHOP
168%of the level prior to
the opening
40

Advance sales through LOHACO ofKirin Off White
Brand nurturing using big data
and web marketing expertise
Translation by ASKUL of extract from press release by Kirin Brewery
Company, Limited on August 21, 2014
New Marketing Route from Manufacturers
Promising as a Marketing Method
41
Advertisement
and contents
<Communication>
Sales
<Channel>Sampling
<Promotion>
High-speed PDCA platform
A one-stop e-commerce site for
communication, test marketing and sales
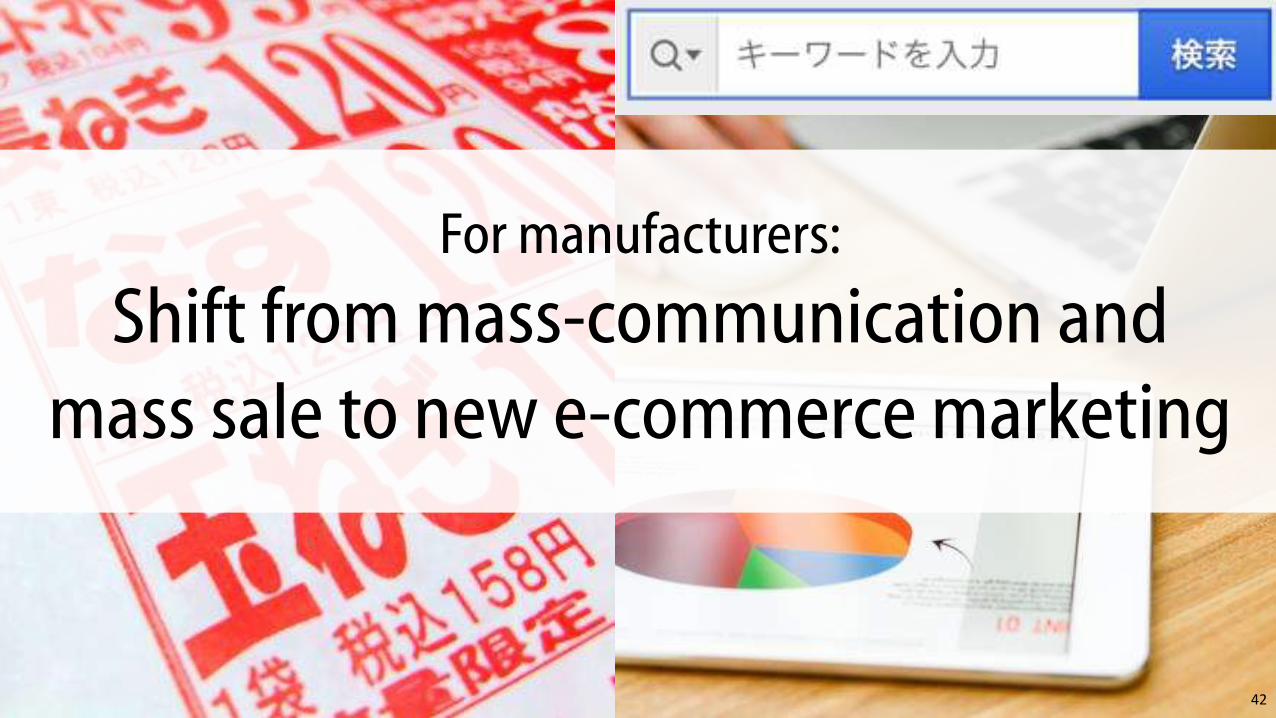
For manufacturers:
Shift from mass-communication and
mass sale to new e-commerce marketing
42

Mass
production
Mass
advertising
Mass
distribution
Securing
regular
item status
(1) Immediate startup
(2) Upfront investment
(3) Negotiation for regular item
status
(4) Reduction of regular items,
inventory disposal, own-brand
products
Issues facing manufacturers
Advantages for manufacturers
Conventional process
LOHACO’s process
(1) Small start
(2) High-speed implementation of
PDCA
(3) Visualization of evaluation
(4) Expansion at low cost
Small
start CommunicationProduct
evaluation
Improve SpreadNurture,
establish
43

Expand customer support
by creating a new distribution process
that is integrated with manufacturers
44

Appendix
45

500
550
600
650
FY5/2013 FY5/2014 FY5/2015
Trend in 1Q Consolidated Net Sales
Marked a record high
Achieved net sales
exceeding
¥60.0 billion
46
65
60
55
50
(¥billion)

1Q Net Sales by Product Category
Non-consolidated
net sales were also
a record
Positive growth
in all categories
1Q FY5/2014 1Q FY5/2015
Amount YoY change Amount YoY change
(¥billion) (%) (¥billion) (%)
OA&PC 19.9 +3.6 20.6 +3.5
Stationery 12.0 +7.1 12.9 +7.6
Living Supplies 13.4 +20.0 16.1 +19.7
Furniture 4.2 +3.4 4.6 +9.0
Others 3.7 +14.3 4.2 +12.1
Total 53.4 +8.9 58.5 +9.547
Non-consolidated

3231
26
16
12
5810
12
1922
0
5
10
15
20
25
30
04/5月 05/5月 06/5月 07/5月 08/5月 09/5月 10/5月 11/5月 12/5月 13/5月 14/5月 14/8月
0
100
200
300
400
500
600
700
800
04/5期 05/5期 06/5期 07/5期 08/5期 09/5期 10/5期 11/5期 12/5期 13/5期 14/5期 15/5期
SOLOEL ARENA Expanding Steadily
4.28.5
14.9
22.4
29.734.5
38.745.1
53.4
61.6
71.0
Quarterly sales increased 14.8%, exceeding full-year plan of 12.7%48
80
70
60
50
40
30
20
10
0
(¥billion)
SOLOEL
ARENA
SOLOELEnterprise
ASKUL
Internet
Shop
LOHACO
Medium-sized companies
Large-sized companies
Small- to medium-sized
offices
Individuals
1Q FY5/2014 sales ¥16.2 billion
Cumulative Total of Registered
Companies at SOLOEL ARENA, etc.
(thousand
companies)
SOLOEL ARENA , etc. Sales Trend
1Q FY5/2015 sales ¥18.6 billion;
YoY change +14.8%
FY5/2015
plan
¥80.0
billion
FY5/04 FY5/05 FY5/06 FY5/07 FY5/08 FY5/09 FY5/10 FY5/11 FY5/12 FY5/13 FY5/14 FY5/15
5/2004 5/2005 5/2006 5/2007 5/2008 5/2009 5/2010 5/2011 5/2012 5/2013 5/2014 8/2014
110
120
130
140
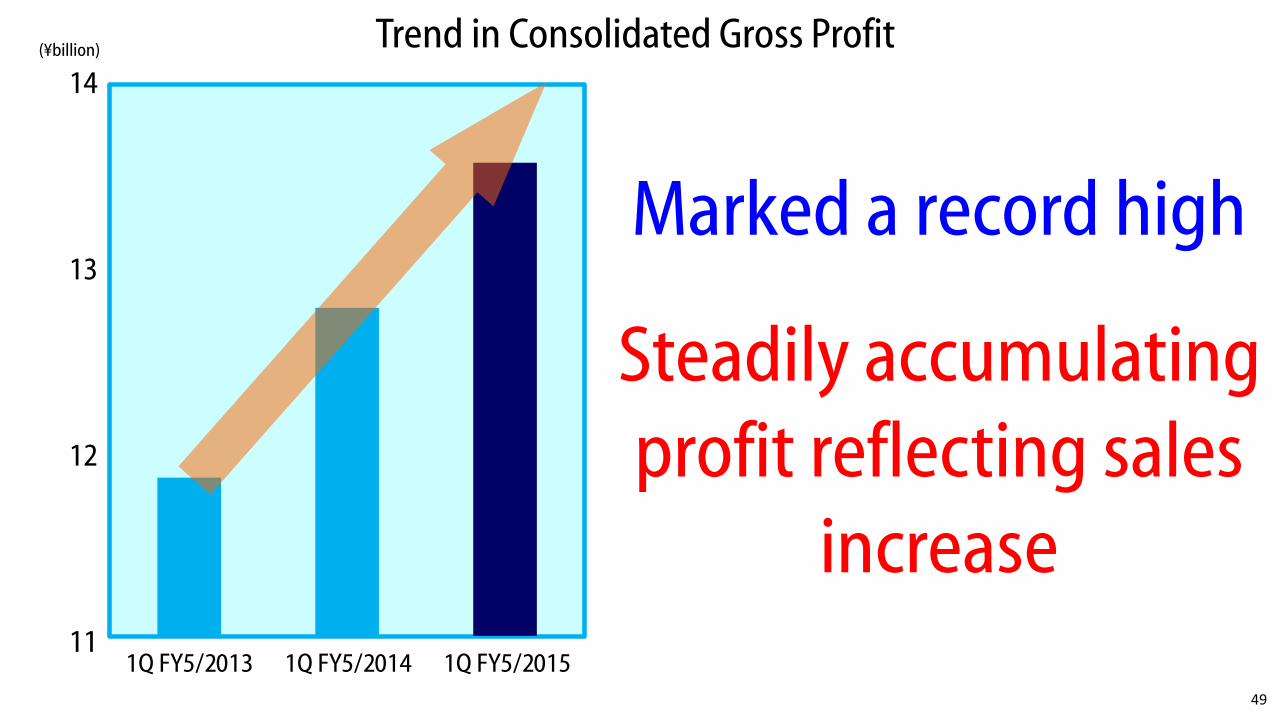
1Q FY5/2013 1Q FY5/2014 1Q FY5/2015
Trend in Consolidated Gross Profit
49
14
13
12
11
(¥billion)
Marked a record high
Steadily accumulating
profit reflecting sales
increase
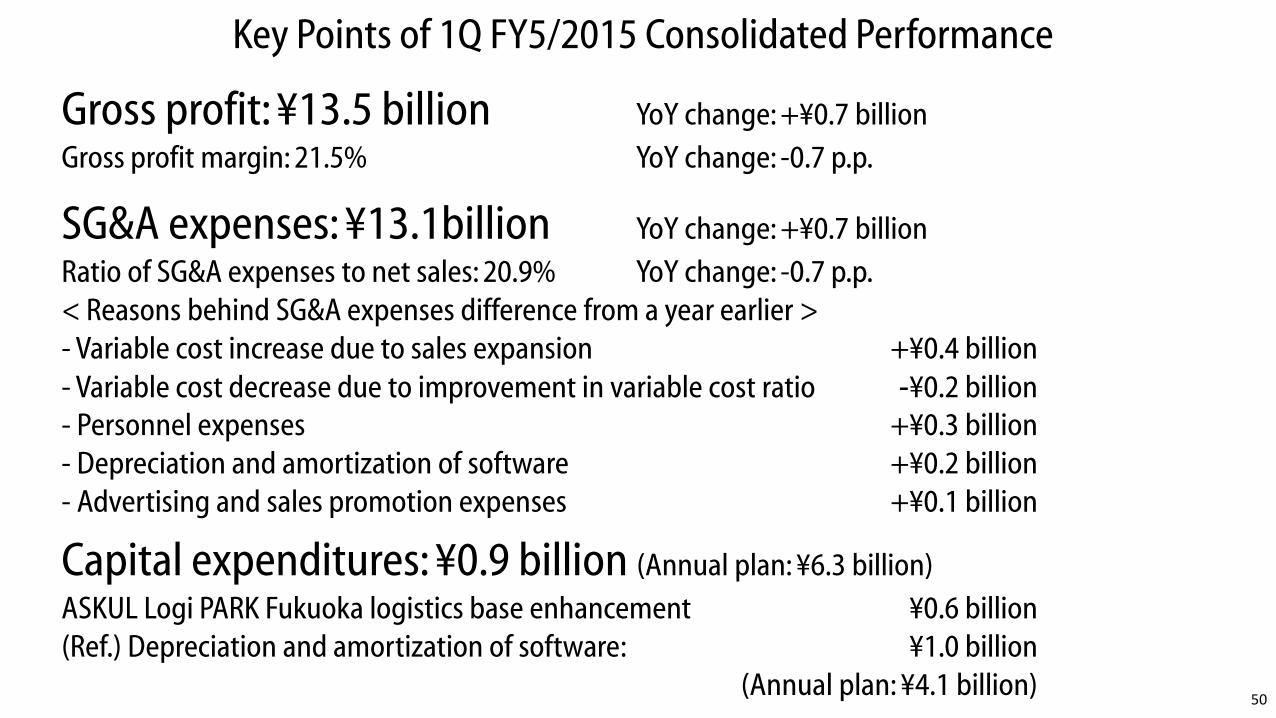
Gross profit: ¥13.5 billion YoY change: +¥0.7 billion
Gross profit margin: 21.5% YoY change: -0.7 p.p.
Key Points of 1Q FY5/2015 Consolidated Performance
SG&A expenses: ¥13.1billion YoY change: +¥0.7 billion
Ratio of SG&A expenses to net sales: 20.9% YoY change: -0.7 p.p.
< Reasons behind SG&A expenses difference from a year earlier >
- Variable cost increase due to sales expansion +¥0.4 billion
- Variable cost decrease due to improvement in variable cost ratio -¥0.2 billion- Personnel expenses +¥0.3 billion
- Depreciation and amortization of software +¥0.2 billion
- Advertising and sales promotion expenses +¥0.1 billion
Capital expenditures: ¥0.9 billion (Annual plan: ¥6.3 billion)
ASKUL Logi PARK Fukuoka logistics base enhancement ¥0.6 billion
(Ref.) Depreciation and amortization of software: ¥1.0 billion
(Annual plan: ¥4.1 billion)50

Share of orders placed on the Internet in net sales and ASKUL original products
Key Points of 1Q FY5/2015 Consolidated Performance
51
ASKUL original products
August 2014
(single month)YoY change
August 2013
(single month)
Number of original products 5,774 +1,394 4,380
Share in net sales 17.0% +1.1 p.p. 15.9%
Share of orders placed on the Internet in net sales
1Q FY5/2015 YoY change 1Q FY5/2014
Orders via the Internet 76.0% +3.1 p.p. 72.9%
Other 24.0% -3.1 p.p. 27.1%
Note 1: The percentages above are based on orders placed.
Notes:
1. The figures above are the results for the month of August each year.
2. Net sales of original products used as the numerators in calculating the shares in net sales do not include net sales of original copier paper.
3. Each figure includes the products listed in Medical & Care Catalogs and Medical Pro Catalogs.
(items)

52
Key Points of 1Q FY5/2015 Consolidated Performance
Capital Expenditures (Details)
Construction in progress Note 3 696 +12,953.7% 5
Software in progress 257 +157.5% 99
(¥million)
Item1Q FY5/2015 1Q FY5/2014
Amount YoY change Amount
[Capital expenditures] Note 2 964 -95.2% 20,036
Property, plant and equipment Note 2 707 -96.3% 19,231
Intangible assets 257 -68.0% 805
Notes:
1. Capital expenditures are stated on an accrual basis and do not reflect reductions.
2. Expenditures for FY5/2014 are high due to recording of expenses of ASKUL Logi PARK Tokyo Metropolitan.
3. Expenditures for FY5/2015 are high due to recording of expenses of ASKUL Logi PARK Fukuoka.
Construction in progress and software in progress partially include consumption and other taxes.