g o access - walt crawford · 2 gold open access 2013-2018: articles in journals (goa4) key...
TRANSCRIPT
GOLD OPEN ACCESS
2013-2018ARTICLES IN JOURNALS
(GOA4)
Walt Crawford
Cites & Insights BooksLivermore, California, 2019
Gold Open Access 2013-2018:Articles in Journals (GOA4)
Copyright © 2019 by Walt CrawfordORCID 0000-0002-4815-1997
Some Rights Reserved:Creative Commons Attribution License (CC BY)
You are free to make any use of this text, so long as you provide appro-priate attribution: Crawford, Walt (ORCID 0000-0002-4815-1997),Gold Open Access 2013-2018: Articles in Journals (GOA4), Livermore, CA:2019.
While you’re legally free to redistribute this PDF to others, it’s a kind-ness to the author to distribute links instead, so that it’s possible tocount the number of downloads.
This book was prepared entirely in Word 2013, using the licensedtypefaces Berkeley Book and Berkeley (bold) for text and Calibri forheadings and subheadings. Excel 2013 was used for data gathering andto prepare tables and graphs. The template is a customized version ofbk6pv.dotx (modified for different typefaces and slightly different head-ing practices), a template developed by the author, modified and im-proved with the cooperation Information Today, Inc. and freelyavailable at waltcrawford.name/bk6pv.dotx. (The template named usesPalatino Linotype for body text and Verdana for headings.) For moreabout the template and using no-cost methods to produce professional-quality books, read The Librarian’s Guide to Micropublishing.
iii
Contents
Preface ......................................................................................... iv
1. The Big Picture ..........................................................................1
2. Exclusions and Special Cases ...................................................11
3. Looking Back: Continuing, New and Dropped Journals ...........14
4. Four-year Comparisons ...........................................................29
5. Journals by Article Volume ......................................................37
6. Fees and Maximum Revenue ...................................................44
7. Publisher Category ..................................................................51
8. Country of Publication ............................................................74
9. Biology and Medicine ..............................................................87
10. Science, Technology, Engineering and Math ...........................95
11. Humanities & Social Sciences..............................................113
12. Africa ..................................................................................135
13. Asia .....................................................................................142
14. Eastern Europe ....................................................................149
15. Latin America ......................................................................156
16. Middle East .........................................................................162
17. Pacific/English .....................................................................168
18. Western Europe...................................................................174
Appendix A. Methods, Changes and Caveats .............................181
Index.........................................................................................184
iv
Preface
This book is the fourth full study of serious gold open access—openaccess articles in open access journals listed in the Directory of OpenAccess Journals. This and previous editions are available as free PDFebooks or paperbacks priced to cover production costs.
Thanks to SPARC’s continued support, I was able to update the da-tabase to include all journals in the Directory of Open Access Journals asof very early January 1, 2019 and to add 2018 counts and earlier countsas needed (and sometimes refine subject assignments).
This book follows the pattern of the previous versions but includessome notable changes for clarity and meaningfulness. These changes arediscussed in Chapter 1; the most obvious ones are an increased empha-sis on articles, decreased emphasis on percentages of no-fee journals,and the change from “APC” to “fee” and “free” to “no-fee.” Additionally,the OAWorld/APCLand split has been abandoned since it never caughton—and “visibility” was abandoned as a not-very-useful measure. Anew Key Facts table replaces the old Journals and Articles table, provid-ing a more useful quick look at any subset of journals.
Gold Open Access by Country 2013-2018 will appear a few weeks afterthis book appears. tShird book, Gold Open Access 2013-2018: Subjectand Publisher Profiles, will appear a few weeks after that. Part or all ofsome books will appear as issues of what’s left of Cites & Insights.
Acknowledgments
Thanks first and foremost to SPARC. Without SPARC’s sponsorship, thisproject would not have happened—and good advice and feedback fromRaym Crow and Shawn Daugherty improved the project.
Preface v
Thanks to the staff at DOAJ—Tom, Clara, managing editors—andjournal publishers they contacted, a significant problem with malware-infected journals has been almost entirely eliminated.
Special thanks to Subramaniam Janakiraman, another WednesdayAmbler, who tackled the one “untranslatable” journal from the first twoeditions, recognized the script as Hindi, and passed it on to his friendYogesh Nivas. Yogesh Nivas (a native Hindi speaker) provided me withthe required information on the journal.
Thanks also to Patrick Hogan for publishing Open-Access Journals:Idealism and Opportunism, the August/September 2015 Library Technol-ogy Reports covering some two-thirds of DOAJ journals from 2011through June 2014, which served as a precursor to this project.
Thanks to the good people at DOAJ for answering questions and im-proving the directory—and to Heather Morrison for pointing me to away to get DOAJ metadata into Excel in full Unicode form.
Thanks to Linda Driver for tolerating and encouraging my ongoingobsession with getting the facts right about real-world open access.
Thanks to loads of LSW folks—John Dupuis, Dorothea Salo, BarbaraFister and many others—for encouraging this work, and to a fair numberof people involved with OA who have helped along the way.
The work is my responsibility, as are errors that may have crept in.
Links
The data used for this report is freely available, with a Creative Com-mons BY (attribution) license: you can do what you want with it as longas you properly credit the source. So, too, the PDF version of this bookand of supplemental books are issued with CC BY licenses.
Links are at http://waltcrawford.name/goaj.html.

1
1. The Big Picture
This study attempts to answer questions about the state of serious goldOA publishing—its extent, the extent of fee-based and no-fee publish-ing, and the complexities of the picture. I define serious gold OA basedon journals in Directory of Open Access Journals (DOAJ).
The overall picture of serious gold OA in 2018:
711,670 articles in 2018, up from 651,384 in 2017; 595,707 in2016; 541,700 in 2015; 490,277 in 2014; and 416,251 in 2013.Direct comparisons with previous editions are difficult because ofchanges in DOAJ: in this case, 2,305 journals added and 616 re-moved during the year. See also Chapters 3 and 4.
12,180 fully-analyzed journals, of which 11,465 published articlesin 2018 for an average of 62 articles per journal.
Although most gold OA journals (70% of those active in 2018) donot charge fees, most articles (58% in 2018) do involve fees.
The average cost per article was no more than $913 in 2018 andprobably less, but that’s up from 2017.
Gold OA isn’t one homogeneous field. The rest of this book providesmore detail and ways of looking at gold OA and how it’s done. The bookis generally patterned after previous editions for comparability, withchanges to improve usefulness and clarity.
While some discussions and tables involve the full 12,180, others—where 2018 article counts are fundamental—address only 11,465, ig-noring 715 journals with no 2018 articles when checked.
2 Gold Open Access 2013-2018: articles in journals (GOA4)
Key Defini�ons
Gold Open Access
Gold OA articles are open access articles appearing in open access jour-nals. This study is limited to those journals serious enough to be inDOAJ. “Hybrid” journals and “delayed access” journals are excluded.This definition includes so called “diamond” and “platinum” journals.
Other Terms and Data Sources
Journal names, publisher names, starting year and country of publica-tion all come directly from the Directory of Open Access Journals as of12:30 a.m. (UMT) January 1, 2019.
Subjects were assigned based on DOAJ subject and keyword fields, andin some cases refined based on scanning article titles. Subject segmentswere assigned based on subjects.
Regions were assigned based on country of publication.Publisher categories were assigned based on publisher names and
available online information.Fees include normally-mandatory submission, processing and pub-
lishing fees (including required society membership), as they would beapplied for a U.S. author in the most expensive author category, for a10-page article in the most expensive article category, in U.S. dollars inearly 2019 (exchange rates checked March 27-April 2, 2019). For jour-nals that only charge fees for in-country authors, that fee is used: mostsuch journals appear to be predominantly local.
Articles per year were determined by direct observation, usingshortcuts where available and Find counts when feasible (e.g., when eacharticle has “PDF” as a text tag or “doi.” in a DOI).
Revenue is simply the current fee times the 2018 article count and isalways the maximum potential revenue, ignoring waivers, discountsand lower charges for some article or review types. Actual revenue maywell be at least 15% lower.
1. The Big Picture 3
The Big Numbers
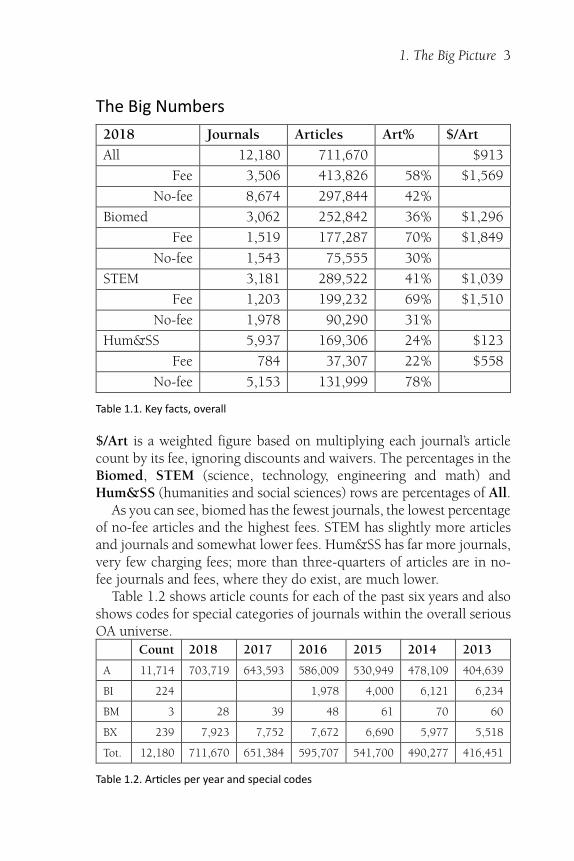
2018 Journals Articles Art% $/Art
All 12,180 711,670 $913
Fee 3,506 413,826 58% $1,569
No-fee 8,674 297,844 42%
Biomed 3,062 252,842 36% $1,296
Fee 1,519 177,287 70% $1,849
No-fee 1,543 75,555 30%
STEM 3,181 289,522 41% $1,039
Fee 1,203 199,232 69% $1,510
No-fee 1,978 90,290 31%
Hum&SS 5,937 169,306 24% $123
Fee 784 37,307 22% $558
No-fee 5,153 131,999 78%
Table 1.1. Key facts, overall
$/Art is a weighted figure based on multiplying each journal’s articlecount by its fee, ignoring discounts and waivers. The percentages in theBiomed, STEM (science, technology, engineering and math) andHum&SS (humanities and social sciences) rows are percentages of All.
As you can see, biomed has the fewest journals, the lowest percentageof no-fee articles and the highest fees. STEM has slightly more articlesand journals and somewhat lower fees. Hum&SS has far more journals,very few charging fees; more than three-quarters of articles are in no-fee journals and fees, where they do exist, are much lower.
Table 1.2 shows article counts for each of the past six years and alsoshows codes for special categories of journals within the overall seriousOA universe.
Count 2018 2017 2016 2015 2014 2013
A 11,714 703,719 643,593 586,009 530,949 478,109 404,639
BI 224 1,978 4,000 6,121 6,234
BM 3 28 39 48 61 70 60
BX 239 7,923 7,752 7,672 6,690 5,977 5,518
Tot. 12,180 711,670 651,384 595,707 541,700 490,277 416,451
Table 1.2. Ar�cles per year and special codes
4 Gold Open Access 2013-2018: articles in journals (GOA4)
“A” is for journals active in 2017 or 2018 with no special codes.“B” codes are as follows:
BI (inactive) journals have articles after 2012 but none since 2016.
BM (malware) journals have outbound calls trapped by Malware-bytes Pro as malware, but could be analyzed while preventing thosecalls from executing. Don’t visit these journals without active strongsecurity software.
BX journals could not be reached using the URL downloaded fromDOAJ but could be reached using a title search; the dataset includesthe new URLs.
These codes are not used in the remainder of this book since—otherthan BM—they do not imply anything negative about the journals.
Overall Growth
Serious gold OA is growing at roughly 10% per year since 2014, but—thanks to more journals being in DOAJ—listed journals include 26%more 2018 articles than the 2017 articles in last year’s analysis.
Revenue and Costs
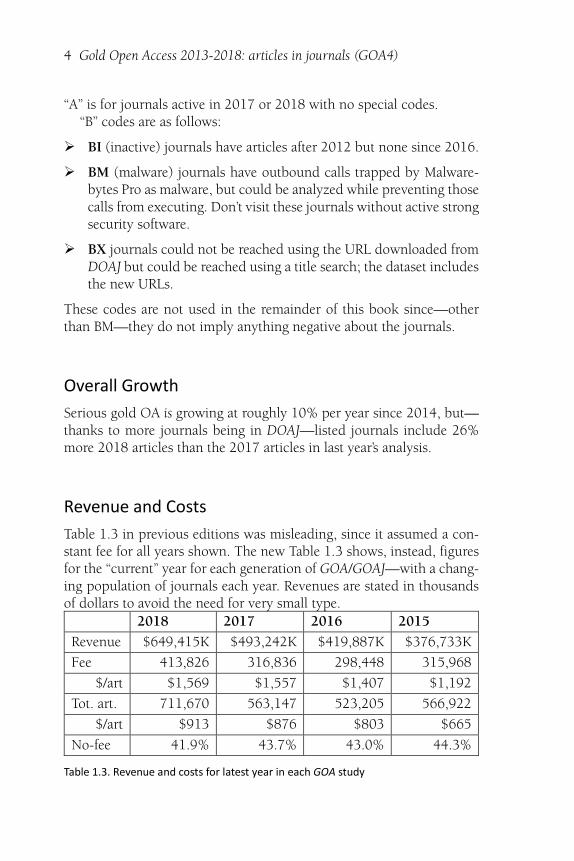
Table 1.3 in previous editions was misleading, since it assumed a con-stant fee for all years shown. The new Table 1.3 shows, instead, figuresfor the “current” year for each generation of GOA/GOAJ—with a chang-ing population of journals each year. Revenues are stated in thousandsof dollars to avoid the need for very small type.
2018 2017 2016 2015
Revenue $649,415K $493,242K $419,887K $376,733K
Fee 413,826 316,836 298,448 315,968
$/art $1,569 $1,557 $1,407 $1,192
Tot. art. 711,670 563,147 523,205 566,922
$/art $913 $876 $803 $665
No-fee 41.9% 43.7% 43.0% 44.3%
Table 1.3. Revenue and costs for latest year in each GOA study
1. The Big Picture 5
Star�ng Date
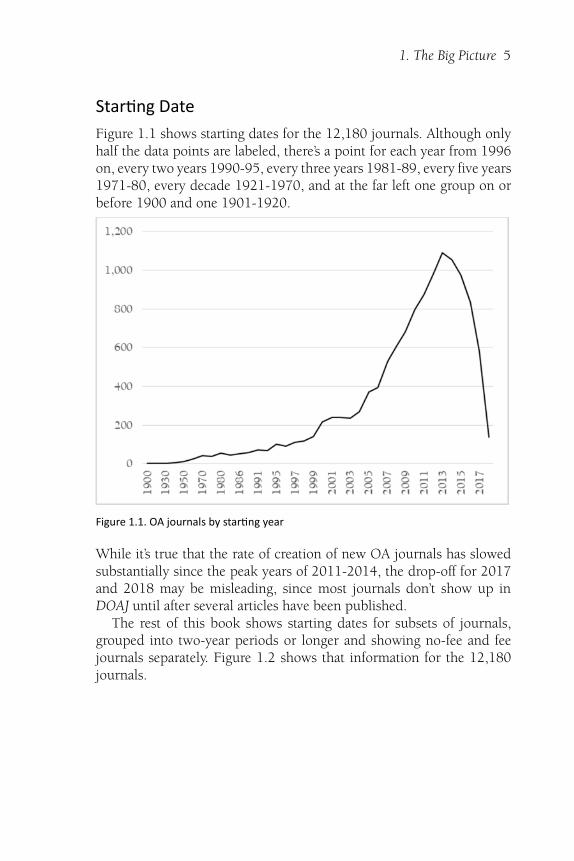
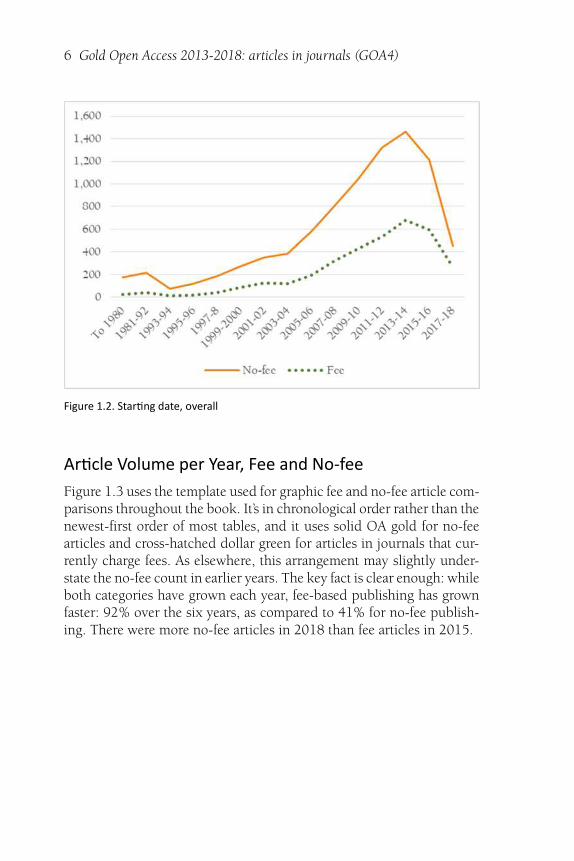
Figure 1.1 shows starting dates for the 12,180 journals. Although onlyhalf the data points are labeled, there’s a point for each year from 1996on, every two years 1990-95, every three years 1981-89, every five years1971-80, every decade 1921-1970, and at the far left one group on orbefore 1900 and one 1901-1920.
Figure 1.1. OA journals by star�ng year
While it’s true that the rate of creation of new OA journals has slowedsubstantially since the peak years of 2011-2014, the drop-off for 2017and 2018 may be misleading, since most journals don’t show up inDOAJ until after several articles have been published.
The rest of this book shows starting dates for subsets of journals,grouped into two-year periods or longer and showing no-fee and feejournals separately. Figure 1.2 shows that information for the 12,180journals.
6 Gold Open Access 2013-2018: articles in journals (GOA4)
Figure 1.2. Star�ng date, overall
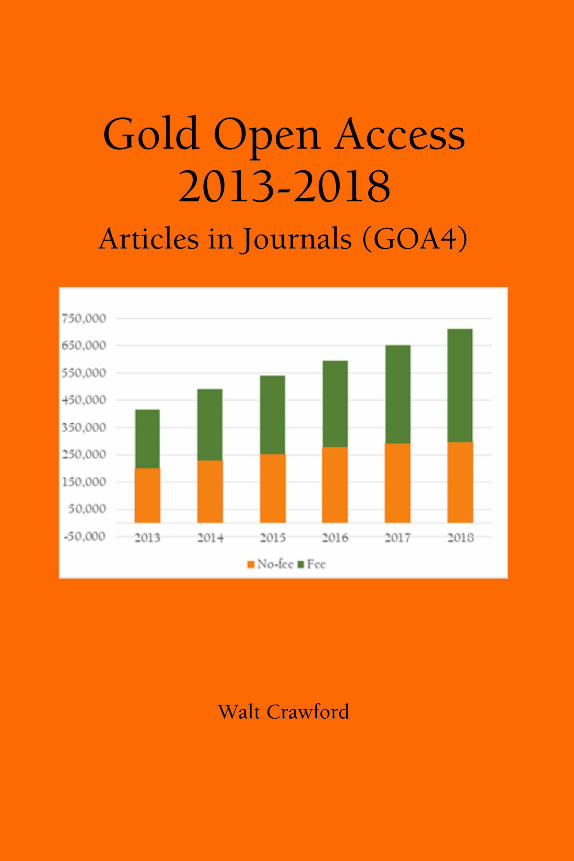
Ar�cle Volume per Year, Fee and No-fee
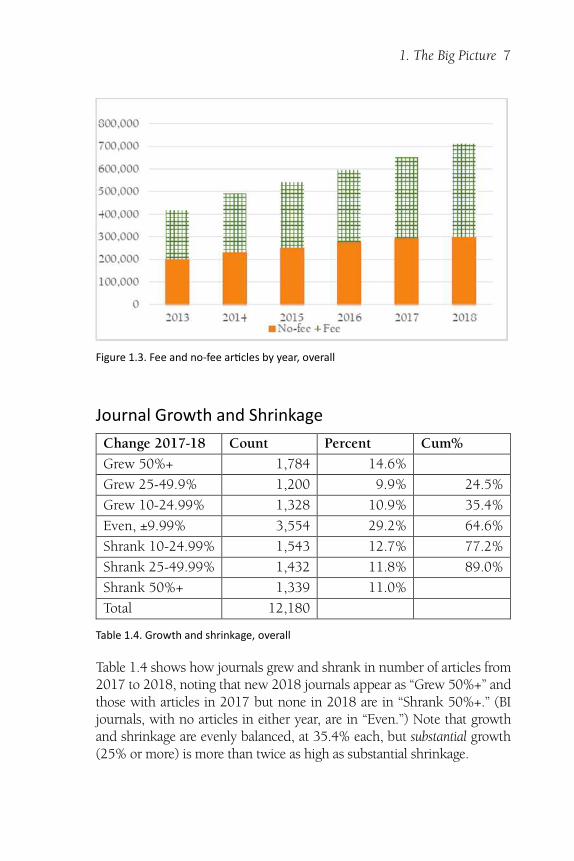
Figure 1.3 uses the template used for graphic fee and no-fee article com-parisons throughout the book. It’s in chronological order rather than thenewest-first order of most tables, and it uses solid OA gold for no-feearticles and cross-hatched dollar green for articles in journals that cur-rently charge fees. As elsewhere, this arrangement may slightly under-state the no-fee count in earlier years. The key fact is clear enough: whileboth categories have grown each year, fee-based publishing has grownfaster: 92% over the six years, as compared to 41% for no-fee publish-ing. There were more no-fee articles in 2018 than fee articles in 2015.
1. The Big Picture 7
Figure 1.3. Fee and no-fee ar�cles by year, overall
Journal Growth and Shrinkage
Change 2017-18 Count Percent Cum%
Grew 50%+ 1,784 14.6%
Grew 25-49.9% 1,200 9.9% 24.5%
Grew 10-24.99% 1,328 10.9% 35.4%
Even, ±9.99% 3,554 29.2% 64.6%
Shrank 10-24.99% 1,543 12.7% 77.2%
Shrank 25-49.99% 1,432 11.8% 89.0%
Shrank 50%+ 1,339 11.0%
Total 12,180
Table 1.4. Growth and shrinkage, overall
Table 1.4 shows how journals grew and shrank in number of articles from2017 to 2018, noting that new 2018 journals appear as “Grew 50%+” andthose with articles in 2017 but none in 2018 are in “Shrank 50%+.” (BIjournals, with no articles in either year, are in “Even.”) Note that growthand shrinkage are evenly balanced, at 35.4% each, but substantial growth(25% or more) is more than twice as high as substantial shrinkage.
8 Gold Open Access 2013-2018: articles in journals (GOA4)
Subject
Subject Jour. Art. %No-fee $/article
Medicine 2,665 209,877 34% $1,183
Other Sciences 216 62,268 12% $1,801
Biology 397 42,965 12% $1,851
Engineering 432 32,225 30% $889
Ecology 314 29,745 31% $937
Physics 157 28,972 33% $1,182
Chemistry 156 27,484 16% $1,101
Education 843 26,140 81% $62
Agriculture 469 26,046 35% $767
Technology 231 25,609 63% $534
Earth Sciences 409 20,519 50% $611
Economics 791 20,288 66% $100
Language & Literature 763 20,205 81% $32
Sociology 529 17,437 71% $148
Anthropology 489 13,835 78% $81
Computer Science 296 13,555 39% $510
Zoology 260 12,485 34% $521
Mathematics 241 10,614 46% $757
Law 364 8,930 92% $19
Miscellany 211 8,875 73% $95
Arts & Architecture 315 8,682 73% $147
History 324 8,592 95% $8
Political Science 318 8,334 89% $23
Psychology 209 8,244 50% $1,095
Media & Communications 221 6,092 89% $53
Philosophy 207 5,161 94% $50
Religion 208 5,128 69% $127
Library Science 145 3,363 98% $8
Table 1.5. Subject, overall
1. The Big Picture 9
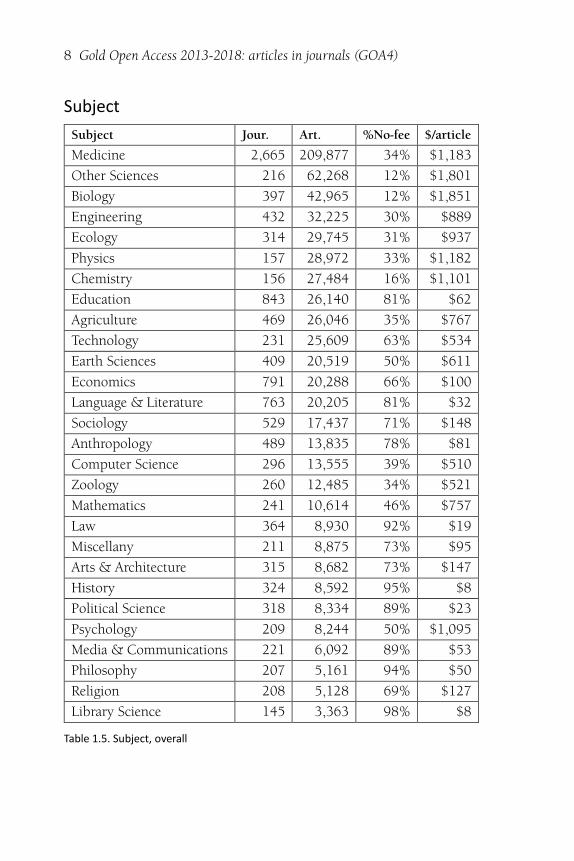
Subjects are sorted by number of 2018 articles. Note that “Other Sci-ences” includes megajournals that cover many disciplines. Note alsothat $/article (average cost per article) includes no-fee articles, whichhelps explain the extremely low figures for History, Library Science andLaw (among others): more than 90% of the articles are no-fee.
The Rest of the Book
The rest of this book offers a variety of ways to look at the current state ofserious gold OA. My purpose here is to describe, not prescribe.
Chapter 2 discusses exclusions and special cases.Chapter 3 looks at changes in DOAJ from the end of 2017 to the end of
2018, while Chapter 4 compares the four iterations of Gold Open Access.Chapter 5 looks at journals by article volume.Chapter 6 looks at articles by fee and journal revenue.Chapter 7 looks at articles by type of publisher.Chapter 8 looks at articles by country of publication.Chapters 9-11 look at articles within each subject segment.Chapters 12-18 look at articles within each geographic region.Appendix A discusses the methodologyKey points and highlights appear at the end of some chapters.
Changes from Previous Edi�ons
Some of these were noted in the preface, but are expanded here (withthe suspicion that few people read prefaces).
Terminology: “APC”—which was never the right term, since I in-clude submission fees and required memberships—is now “fee.”“Free”—which seems to mislead people because, of course, all OA arti-cles are free—is now “no-fee.” In ten cases, country names used in DOAJ(and the dataset) have been replaced with shorter common forms.
Dropped: The “Visibility” measure didn’t work very well and hasbeen dropped. (For the record, I found fee-visibility problems with 903no-fee journals, probably because university and society publishersdon’t always feel the need to be explicit about having no fees—and 188fee journals, which is more of an issue.) The OAWorld/APCLand splitnever seemed to catch on, and has been abandoned. The brief SubjectSegments and Regions/APCLand chapters have been removed.
10 Gold Open Access 2013-2018: articles in journals (GOA4)
Modified: The “Journals and articles” table that appears so often inprevious editions, and seemed to emphasize percentages of fee and no-fee journals, has been replaced by the “Key facts” table, which dropsjournal-level percentages and adds segment-level information and cost-per-article information.
Data
The master spreadsheet for this project, including publishers and jour-nal titles but omitting some calculated figures (e.g., revenue) to savespace, is freely available with a CC BY license. For links to the data (andlinks to the supplements), go to waltcrawford.name/goaj.html.
Highlights and Key Points
Nearly 300,000 articles appeared in 2018 in 8,674 journals fundedthrough means other than author-side fees.
More than 410,000 articles appeared in 3,506 journals charging au-thor-side fees (including memberships), for a total of more than710,000 serious gold OA articles.
While more than 70% of OA journals are no-fee, most articles(58%) are in fee-charging journals.
Serious gold OA is growing: for journals currently in DOAJ, roughly10% more articles for each of the past four years. That’s for journalsin DOAJ as of January 1, 2019; compared to January 1, 2018, theyear-to-year increase is 26%.
Some 997 journals show higher fees in this report than in last year’s,and 886 show lower fees. Many of those, especially the reductions,are currency exchange fluctuations. Whether because of better in-formation or actual changes, 372 journals appear to have switchedfrom no-fee to fee, while 144 appear to have switched from fee tono-fee.
New journal creation peaked in 2013-2014, the only years withmore than 1,000 new journals per year), but new journals continueto emerge, including 581 in 2017 and 140 (so far) in 2018.
11
2. Exclusions and Special Cases
This chapter is, in essence, one long footnote, and you can skip it if youlike. Along with Appendix A, it provides transparency on methodologyand tells why some journals in DOAJ are excluded from this report.
The Basics
I visited each journal’s website at least once and sometimes up to threetimes. The first set of visits took place between January 2, 2019 andMarch 22, 2019. I marked some 1,800 journals—those flagged as exclu-sions and journals that might not yet have final 2018 issues posted—forrevisits. I revisited those journals April 2-12, 2019. Journals flagged as Xcodes were visited a third time, April 15-17, 2019.
Some notes on what visits did and did not entail:
All work was done using Chrome, copying-and-pasting URLs intoChrome and using the embedded Google language tools.
At all times, I ran Malwarebytes Pro and Windows Defender. Duringan earlier investigation, at least one “journal” managed to hit mewith a difficult-to-fix piece of malware and at least four others at-tempted to do so; this time, I wasn’t taking any chances. Nor shouldreaders or authors. There were literally hundreds of malwarecases—but, with DOAJ’s help, nearly all of them were corrected.
Both the percentage and number of excluded journals havedropped substantially since last year: number down from 413 to235, percentage down from 4.0% to 1.9%.
12 Gold Open Access 2013-2018: articles in journals (GOA4)
Codes XD through XX
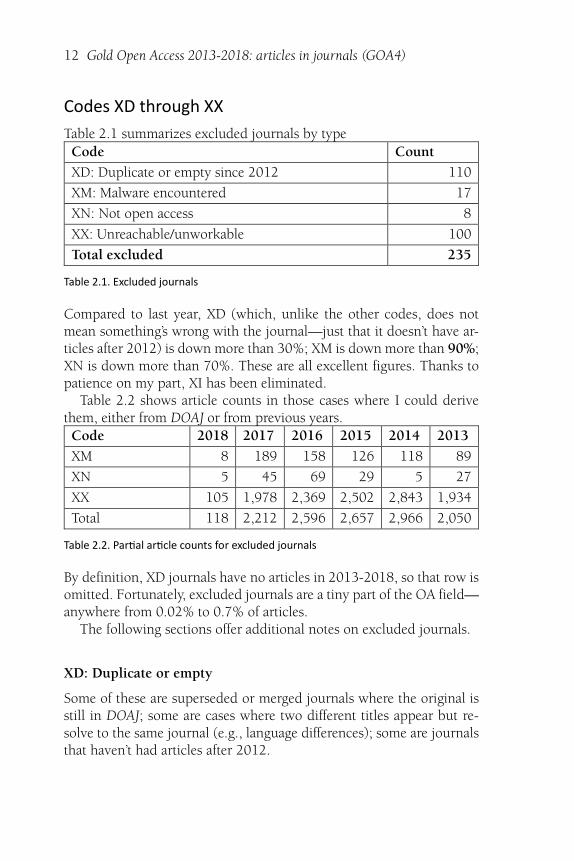
Table 2.1 summarizes excluded journals by typeCode Count
XD: Duplicate or empty since 2012 110
XM: Malware encountered 17
XN: Not open access 8
XX: Unreachable/unworkable 100
Total excluded 235
Table 2.1. Excluded journals
Compared to last year, XD (which, unlike the other codes, does notmean something’s wrong with the journal—just that it doesn’t have ar-ticles after 2012) is down more than 30%; XM is down more than 90%;XN is down more than 70%. These are all excellent figures. Thanks topatience on my part, XI has been eliminated.
Table 2.2 shows article counts in those cases where I could derivethem, either from DOAJ or from previous years.Code 2018 2017 2016 2015 2014 2013
XM 8 189 158 126 118 89
XN 5 45 69 29 5 27
XX 105 1,978 2,369 2,502 2,843 1,934
Total 118 2,212 2,596 2,657 2,966 2,050
Table 2.2. Par�al ar�cle counts for excluded journals
By definition, XD journals have no articles in 2013-2018, so that row isomitted. Fortunately, excluded journals are a tiny part of the OA field—anywhere from 0.02% to 0.7% of articles.
The following sections offer additional notes on excluded journals.
XD: Duplicate or empty
Some of these are superseded or merged journals where the original isstill in DOAJ; some are cases where two different titles appear but re-solve to the same journal (e.g., language differences); some are journalsthat haven’t had articles after 2012.
2. Exclusions and Special Cases 13
XM: Malware encountered
The efforts of DOAJ editors and other staff, and of contacted universitypublishers, were overwhelmingly successful, changing a large issue intoan almost-trivial one. Characteristics of the remaining 17:
Country: All of last year’s Indonesia, Malaysia and Romania journalshave been cleaned. Almost all current cases are in Latin America: foureach in Argentina and Brazil, three in Ecuador, two in Mexico and oneeach in Colombia. Peru, Spain and Venezuela.
Publisher category: All from universities.Nature of problem: Malwarebytes Pro says that five are phishing,
four have Trojan attacks; one is spyware, and four have other forms ofmalware. Two have defective SSL certificates.
XN: Not open access
What few of these are left have an assortment of flaws. One is admirablebut not a journal at all; four require registration/login; and three have feesfor some articles or lack peer review.
XX: Unreachable/unworkable
This motley crew includes a mix of issues—404 and 403 errors, data-base failures, dsn lookup failures and others.
Highlights and Key Points
In most areas, problems have been reduced from 2017.
Malware has gone from a serious problem to a trivial one.
14
3. Looking Back: Con�nuing, New and Dropped Journals
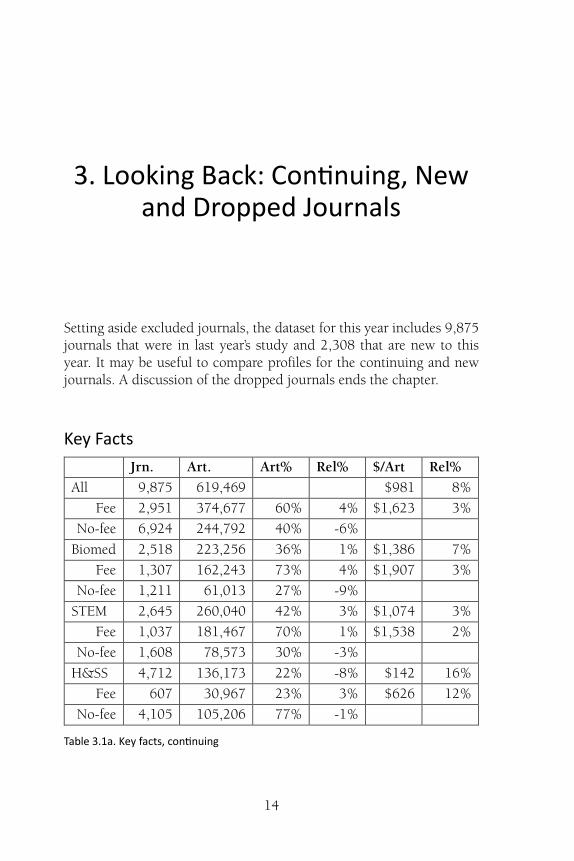
Setting aside excluded journals, the dataset for this year includes 9,875journals that were in last year’s study and 2,308 that are new to thisyear. It may be useful to compare profiles for the continuing and newjournals. A discussion of the dropped journals ends the chapter.
Key Facts
Jrn. Art. Art% Rel% $/Art Rel%
All 9,875 619,469 $981 8%
Fee 2,951 374,677 60% 4% $1,623 3%
No-fee 6,924 244,792 40% -6%
Biomed 2,518 223,256 36% 1% $1,386 7%
Fee 1,307 162,243 73% 4% $1,907 3%
No-fee 1,211 61,013 27% -9%
STEM 2,645 260,040 42% 3% $1,074 3%
Fee 1,037 181,467 70% 1% $1,538 2%
No-fee 1,608 78,573 30% -3%
H&SS 4,712 136,173 22% -8% $142 16%
Fee 607 30,967 23% 3% $626 12%
No-fee 4,105 105,206 77% -1%
Table 3.1a. Key facts, con�nuing
3. Looking Back: Continuing, New and Dropped Journals 15
Jrn. Art. Art% Rel% $/Art Rel%
All 2,305 92,201 $450 -51%
Fee 555 39,149 42% -27% $1,059 -32%
No-fee 1,750 53,052 58% 37%
Biomed 544 29,586 32% -10% $620 -52%
Fee 212 15,044 51% -27% $1,220 -34%
No-fee 332 14,542 49% 64%
STEM 536 29,482 32% -21% $735 -29%
Fee 166 17,765 60% -12% $1,220 -19%
No-fee 370 11,717 40% 27%
H&SS 1,225 33,133 36% 51% $44 -65%
Fee 177 6,340 19% -13% $228 -59%
No-fee 1,048 26,793 81% 4%
Table 3.1b. Key facts, new
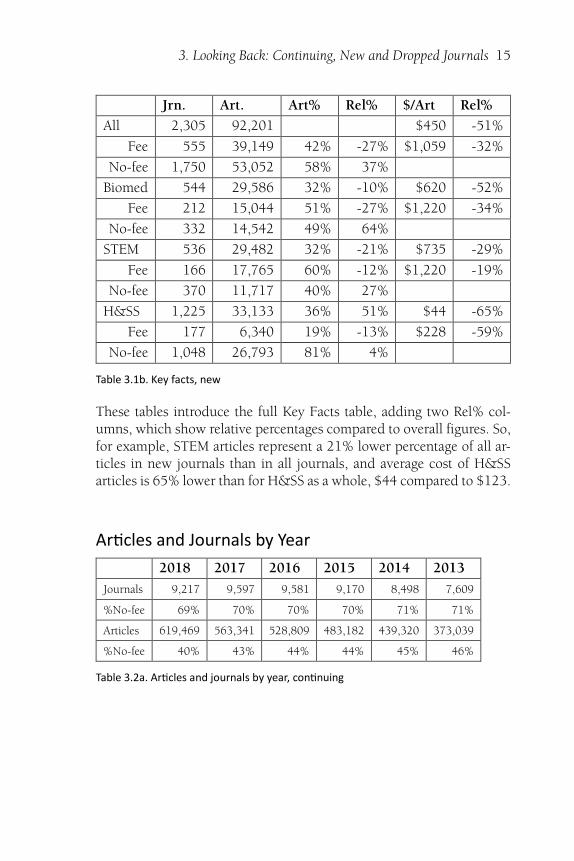
These tables introduce the full Key Facts table, adding two Rel% col-umns, which show relative percentages compared to overall figures. So,for example, STEM articles represent a 21% lower percentage of all ar-ticles in new journals than in all journals, and average cost of H&SSarticles is 65% lower than for H&SS as a whole, $44 compared to $123.
Ar�cles and Journals by Year
2018 2017 2016 2015 2014 2013
Journals 9,217 9,597 9,581 9,170 8,498 7,609
%No-fee 69% 70% 70% 70% 71% 71%
Articles 619,469 563,341 528,809 483,182 439,320 373,039
%No-fee 40% 43% 44% 44% 45% 46%
Table 3.2a. Ar�cles and journals by year, con�nuing
16 Gold Open Access 2013-2018: articles in journals (GOA4)
2018 2017 2016 2015 2014 2013
Journals 2,248 2,172 1,802 1,526 1,273 1,094
%No-fee 76% 77% 80% 81% 81% 81%
Articles 92,201 88,043 66,898 58,518 50,957 43,412
%No-fee 58% 58% 67% 66% 67% 65%
Table 3.2b. Ar�cles and journals by year, new
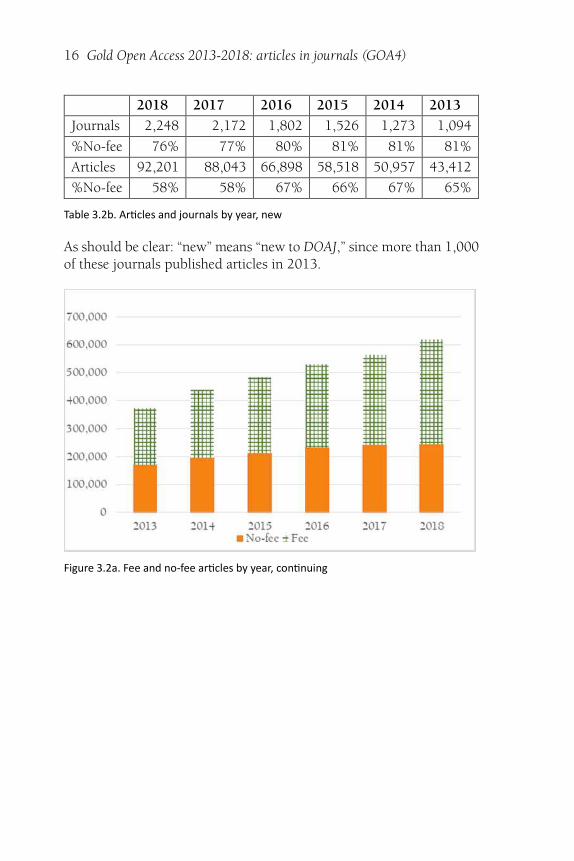
As should be clear: “new” means “new to DOAJ,” since more than 1,000of these journals published articles in 2013.
Figure 3.2a. Fee and no-fee ar�cles by year, con�nuing
3. Looking Back: Continuing, New and Dropped Journals 17
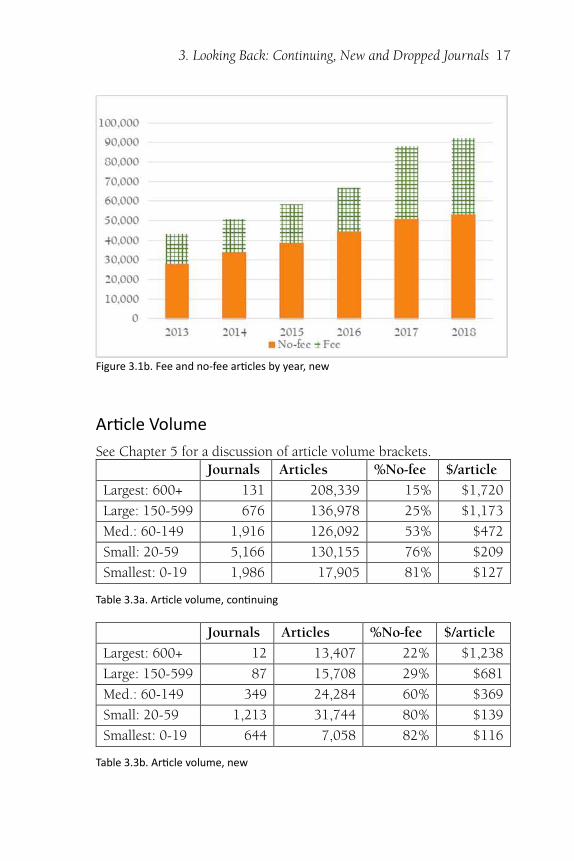
Figure 3.1b. Fee and no-fee ar�cles by year, new
Ar�cle Volume
See Chapter 5 for a discussion of article volume brackets.Journals Articles %No-fee $/article
Largest: 600+ 131 208,339 15% $1,720
Large: 150-599 676 136,978 25% $1,173
Med.: 60-149 1,916 126,092 53% $472
Small: 20-59 5,166 130,155 76% $209
Smallest: 0-19 1,986 17,905 81% $127
Table 3.3a. Ar�cle volume, con�nuing
Journals Articles %No-fee $/article
Largest: 600+ 12 13,407 22% $1,238
Large: 150-599 87 15,708 29% $681
Med.: 60-149 349 24,284 60% $369
Small: 20-59 1,213 31,744 80% $139
Smallest: 0-19 644 7,058 82% $116
Table 3.3b. Ar�cle volume, new
18 Gold Open Access 2013-2018: articles in journals (GOA4)
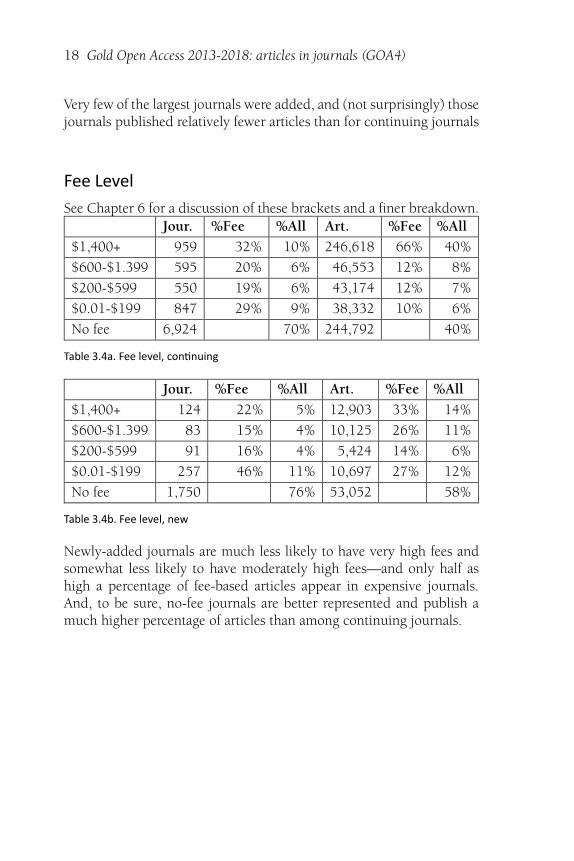
Very few of the largest journals were added, and (not surprisingly) thosejournals published relatively fewer articles than for continuing journals
Fee Level
See Chapter 6 for a discussion of these brackets and a finer breakdown.Jour. %Fee %All Art. %Fee %All
$1,400+ 959 32% 10% 246,618 66% 40%
$600-$1.399 595 20% 6% 46,553 12% 8%
$200-$599 550 19% 6% 43,174 12% 7%
$0.01-$199 847 29% 9% 38,332 10% 6%
No fee 6,924 70% 244,792 40%
Table 3.4a. Fee level, con�nuing
Jour. %Fee %All Art. %Fee %All
$1,400+ 124 22% 5% 12,903 33% 14%
$600-$1.399 83 15% 4% 10,125 26% 11%
$200-$599 91 16% 4% 5,424 14% 6%
$0.01-$199 257 46% 11% 10,697 27% 12%
No fee 1,750 76% 53,052 58%
Table 3.4b. Fee level, new
Newly-added journals are much less likely to have very high fees andsomewhat less likely to have moderately high fees—and only half ashigh a percentage of fee-based articles appear in expensive journals.And, to be sure, no-fee journals are better represented and publish amuch higher percentage of articles than among continuing journals.
3. Looking Back: Continuing, New and Dropped Journals 19
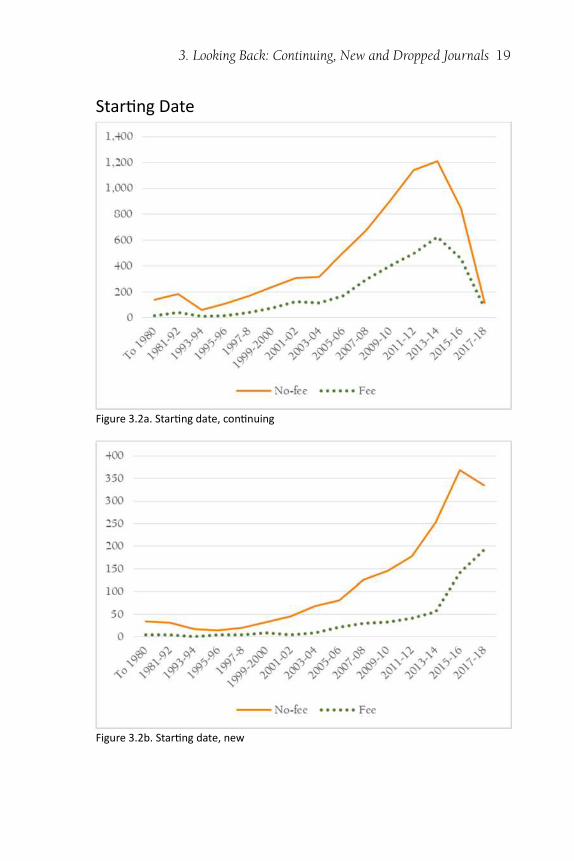
Star�ng Date
Figure 3.2a. Star�ng date, con�nuing
Figure 3.2b. Star�ng date, new
20 Gold Open Access 2013-2018: articles in journals (GOA4)
It would seem obvious that newly-added journals are much more likelyto be newish journals—but starting dates still go back quite a long time.Note the dominance of no-fee journals.
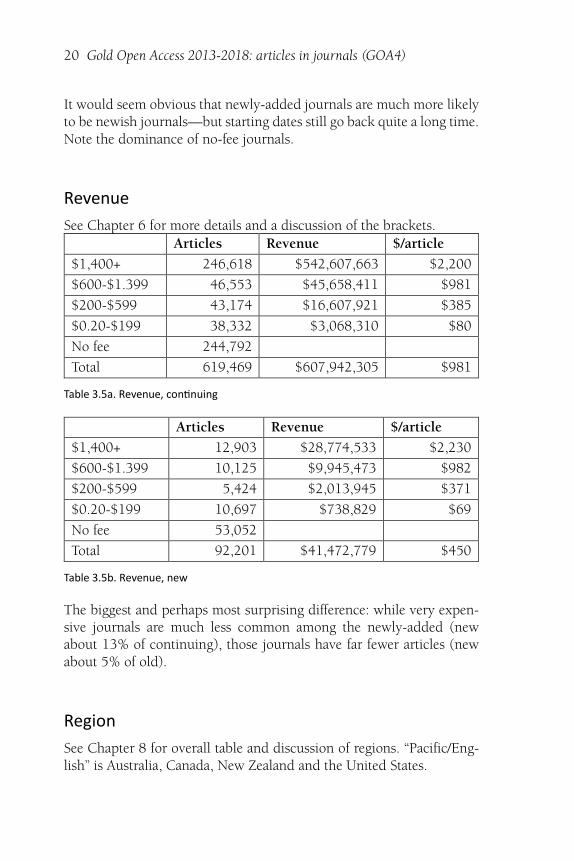
Revenue
See Chapter 6 for more details and a discussion of the brackets.Articles Revenue $/article
$1,400+ 246,618 $542,607,663 $2,200
$600-$1.399 46,553 $45,658,411 $981
$200-$599 43,174 $16,607,921 $385
$0.20-$199 38,332 $3,068,310 $80
No fee 244,792
Total 619,469 $607,942,305 $981
Table 3.5a. Revenue, con�nuing
Articles Revenue $/article
$1,400+ 12,903 $28,774,533 $2,230
$600-$1.399 10,125 $9,945,473 $982
$200-$599 5,424 $2,013,945 $371
$0.20-$199 10,697 $738,829 $69
No fee 53,052
Total 92,201 $41,472,779 $450
Table 3.5b. Revenue, new
The biggest and perhaps most surprising difference: while very expen-sive journals are much less common among the newly-added (newabout 13% of continuing), those journals have far fewer articles (newabout 5% of old).
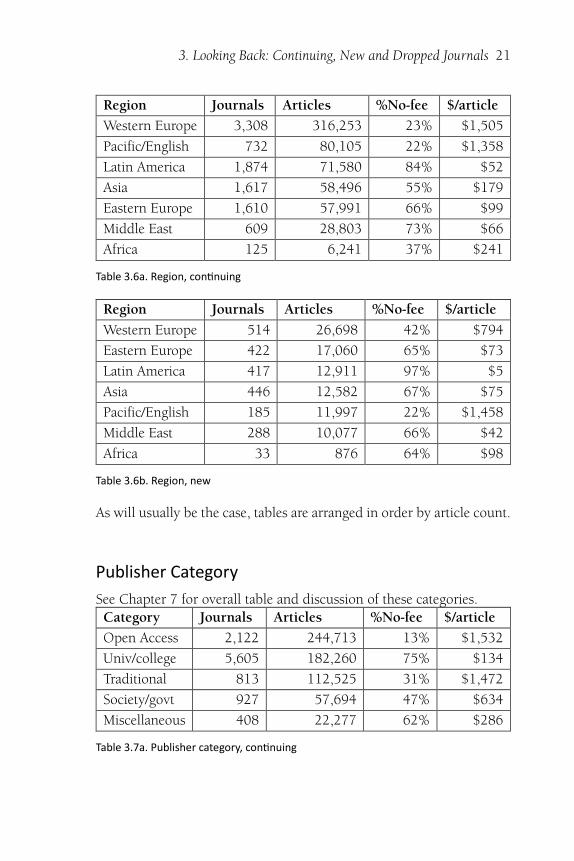
Region
See Chapter 8 for overall table and discussion of regions. “Pacific/Eng-lish” is Australia, Canada, New Zealand and the United States.
3. Looking Back: Continuing, New and Dropped Journals 21
Region Journals Articles %No-fee $/article
Western Europe 3,308 316,253 23% $1,505
Pacific/English 732 80,105 22% $1,358
Latin America 1,874 71,580 84% $52
Asia 1,617 58,496 55% $179
Eastern Europe 1,610 57,991 66% $99
Middle East 609 28,803 73% $66
Africa 125 6,241 37% $241
Table 3.6a. Region, con�nuing
Region Journals Articles %No-fee $/article
Western Europe 514 26,698 42% $794
Eastern Europe 422 17,060 65% $73
Latin America 417 12,911 97% $5
Asia 446 12,582 67% $75
Pacific/English 185 11,997 22% $1,458
Middle East 288 10,077 66% $42
Africa 33 876 64% $98
Table 3.6b. Region, new
As will usually be the case, tables are arranged in order by article count.
Publisher Category
See Chapter 7 for overall table and discussion of these categories.Category Journals Articles %No-fee $/article
Open Access 2,122 244,713 13% $1,532
Univ/college 5,605 182,260 75% $134
Traditional 813 112,525 31% $1,472
Society/govt 927 57,694 47% $634
Miscellaneous 408 22,277 62% $286
Table 3.7a. Publisher category, con�nuing
22 Gold Open Access 2013-2018: articles in journals (GOA4)
Category Journals Articles %No-fee $/article
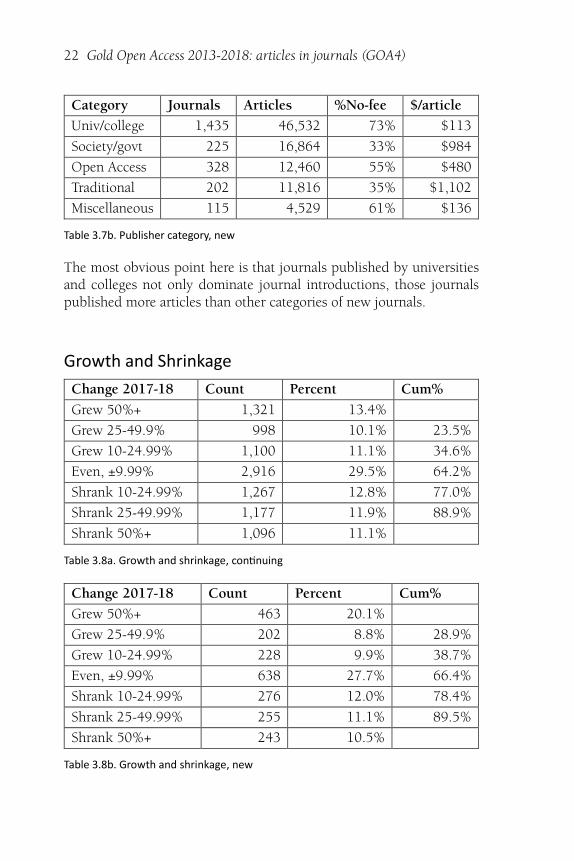
Univ/college 1,435 46,532 73% $113
Society/govt 225 16,864 33% $984
Open Access 328 12,460 55% $480
Traditional 202 11,816 35% $1,102
Miscellaneous 115 4,529 61% $136
Table 3.7b. Publisher category, new
The most obvious point here is that journals published by universitiesand colleges not only dominate journal introductions, those journalspublished more articles than other categories of new journals.
Growth and Shrinkage
Change 2017-18 Count Percent Cum%
Grew 50%+ 1,321 13.4%
Grew 25-49.9% 998 10.1% 23.5%
Grew 10-24.99% 1,100 11.1% 34.6%
Even, ±9.99% 2,916 29.5% 64.2%
Shrank 10-24.99% 1,267 12.8% 77.0%
Shrank 25-49.99% 1,177 11.9% 88.9%
Shrank 50%+ 1,096 11.1%
Table 3.8a. Growth and shrinkage, con�nuing
Change 2017-18 Count Percent Cum%
Grew 50%+ 463 20.1%
Grew 25-49.9% 202 8.8% 28.9%
Grew 10-24.99% 228 9.9% 38.7%
Even, ±9.99% 638 27.7% 66.4%
Shrank 10-24.99% 276 12.0% 78.4%
Shrank 25-49.99% 255 11.1% 89.5%
Shrank 50%+ 243 10.5%
Table 3.8b. Growth and shrinkage, new
3. Looking Back: Continuing, New and Dropped Journals 23
Subject
Subject Jour. Art. %No-fee $/article
Medicine 2,185 184,279 31% $1,266
Other Sciences 191 61,005 11% $1,835
Biology 333 38,977 11% $1,952
Engineering 344 28,533 27% $976
Ecology 263 27,762 30% $954
Technology 184 24,128 63% $562
Physics 134 23,789 37% $986
Agriculture 384 22,434 32% $832
Chemistry 138 21,594 19% $1,148
Education 648 20,560 80% $71
Earth Sciences 337 18,288 46% $646
Economics 629 16,643 66% $101
Language & Literature 602 16,347 80% $35
Sociology 407 13,317 74% $171
Anthropology 422 12,182 78% $79
Computer Science 250 11,960 36% $560
Zoology 221 11,012 32% $544
Mathematics 199 9,535 42% $831
Psychology 171 7,231 50% $1,223
Miscellany 194 7,162 69% $111
Law 278 6,774 91% $23
History 254 6,756 95% $9
Arts & Architecture 244 6,650 73% $173
Political Science 228 5,880 90% $27
Media & Communications 185 5,294 88% $60
Religion 166 4,417 67% $146
Philosophy 158 3,944 93% $64
Library Science 126 3,016 97% $9
Table 3.9a. Subject, con�nuing
24 Gold Open Access 2013-2018: articles in journals (GOA4)
Subject Jour. Art. %No-fee $/article
Medicine 480 25,598 53% $583
Chemistry 18 5,890 6% $931
Education 195 5,580 85% $27
Physics 23 5,183 10% $2,082
Sociology 122 4,120 64% $71
Biology 64 3,988 22% $860
Language & Literature 161 3,858 84% $20
Engineering 88 3,692 56% $215
Economics 162 3,645 66% $97
Agriculture 85 3,612 52% $368
Political Science 90 2,454 85% $12
Earth Sciences 72 2,231 77% $329
Law 86 2,156 94% $6
Arts & Architecture 71 2,032 75% $62
Ecology 51 1,983 39% $695
History 70 1,836 96% $3
Miscellany 17 1,713 93% $26
Anthropology 67 1,653 80% $96
Computer Science 46 1,595 62% $135
Technology 47 1,481 73% $84
Zoology 39 1,473 49% $350
Other Sciences 25 1,263 54% $166
Philosophy 49 1,217 96% $3
Mathematics 42 1,079 84% $97
Psychology 38 1,013 56% $177
Media & Communications 36 798 97% $2
Religion 42 711 85% $11
Library Science 19 347 100% $0
Table 3.9b. Subject, new
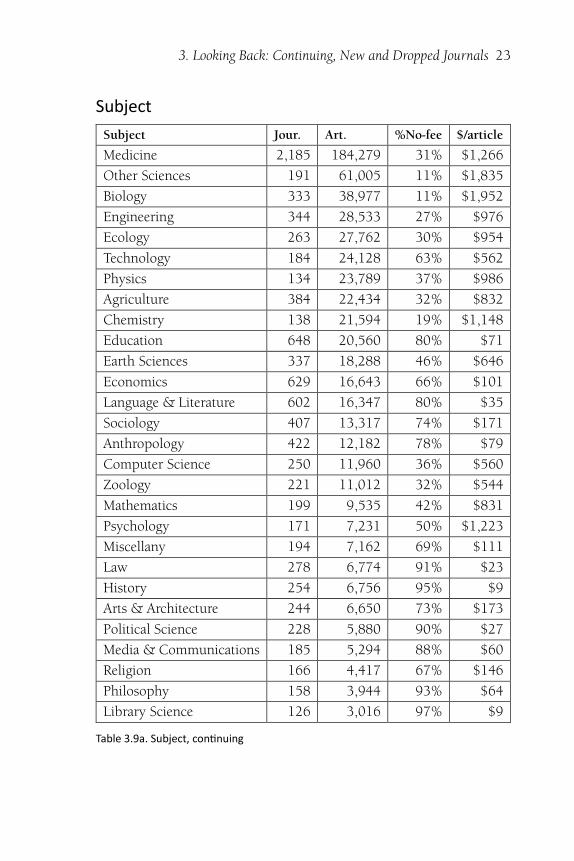
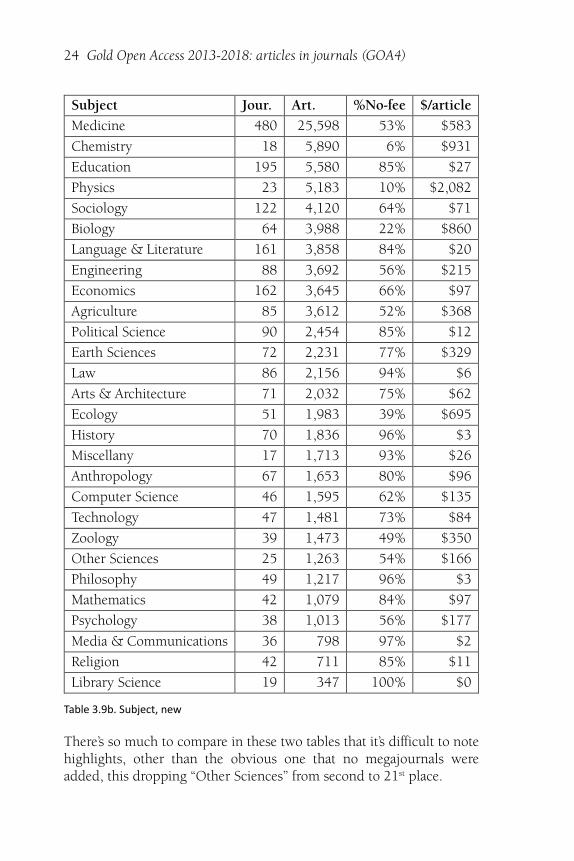
There’s so much to compare in these two tables that it’s difficult to notehighlights, other than the obvious one that no megajournals wereadded, this dropping “Other Sciences” from second to 21st place.
3. Looking Back: Continuing, New and Dropped Journals 25
There are many other striking differences, to be sure: newly-addedmedical journals and biology journals averaged less than half the costper article of continuing ones; newly-added physics journals—presum-ably not part of SCOAP—averaged more than twice the cost per articleof continuing ones; newly-added philosophy journals averaged a trivial$3 per article, a big drop from the already modest $64 for ongoing jour-nals—and so on.
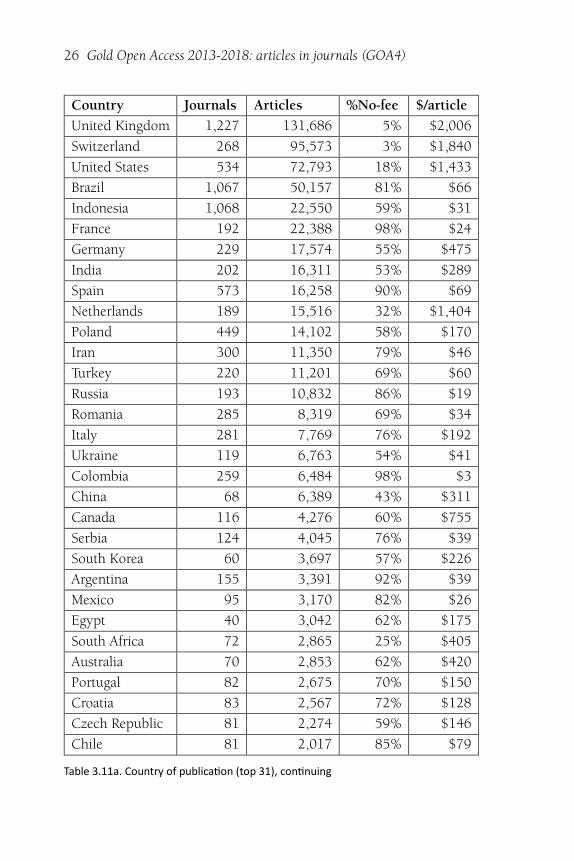
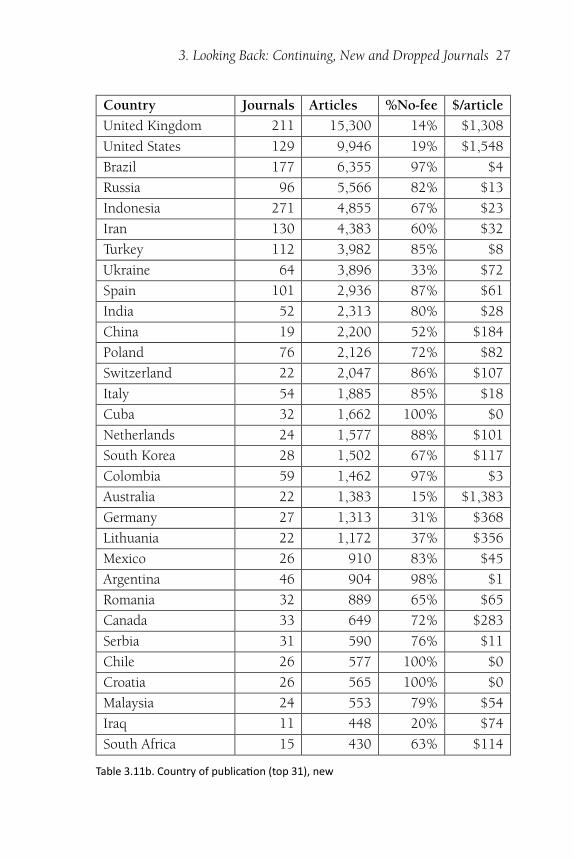
Country of Publica�on
The last two tables in this chapter are partial ones, showing the coun-tries with the most articles for continuing and new journals respectively.Complete tables would require up to four pages each, since 119 coun-tries are represented. (See Chapter 8 for a complete list.)
I won’t add comments on these tables. It should be clear that Swit-zerland’s and the United Kingdom’s positons in the continuing table arelargely due to very large publishers headquartered there.
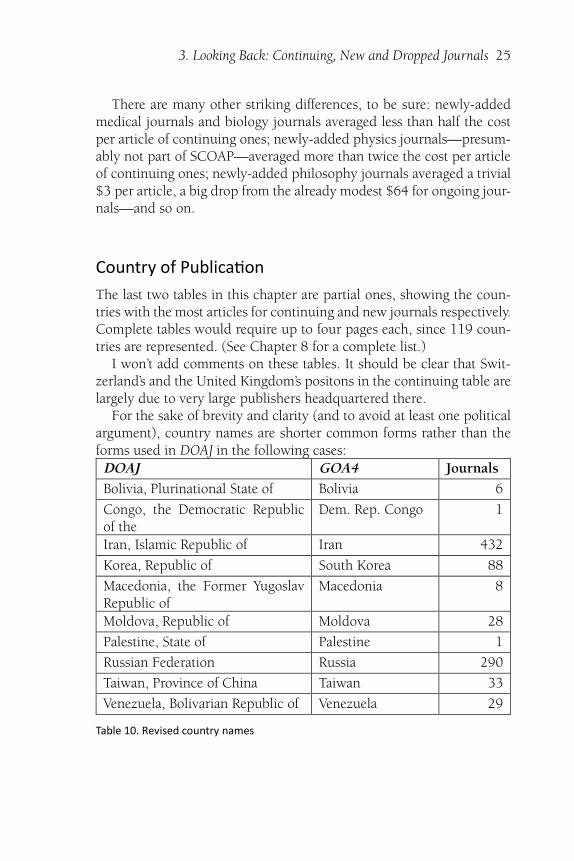
For the sake of brevity and clarity (and to avoid at least one politicalargument), country names are shorter common forms rather than theforms used in DOAJ in the following cases:DOAJ GOA4 Journals
Bolivia, Plurinational State of Bolivia 6
Congo, the Democratic Republicof the
Dem. Rep. Congo 1
Iran, Islamic Republic of Iran 432
Korea, Republic of South Korea 88
Macedonia, the Former YugoslavRepublic of
Macedonia 8
Moldova, Republic of Moldova 28
Palestine, State of Palestine 1
Russian Federation Russia 290
Taiwan, Province of China Taiwan 33
Venezuela, Bolivarian Republic of Venezuela 29
Table 10. Revised country names
26 Gold Open Access 2013-2018: articles in journals (GOA4)
Country Journals Articles %No-fee $/article
United Kingdom 1,227 131,686 5% $2,006
Switzerland 268 95,573 3% $1,840
United States 534 72,793 18% $1,433
Brazil 1,067 50,157 81% $66
Indonesia 1,068 22,550 59% $31
France 192 22,388 98% $24
Germany 229 17,574 55% $475
India 202 16,311 53% $289
Spain 573 16,258 90% $69
Netherlands 189 15,516 32% $1,404
Poland 449 14,102 58% $170
Iran 300 11,350 79% $46
Turkey 220 11,201 69% $60
Russia 193 10,832 86% $19
Romania 285 8,319 69% $34
Italy 281 7,769 76% $192
Ukraine 119 6,763 54% $41
Colombia 259 6,484 98% $3
China 68 6,389 43% $311
Canada 116 4,276 60% $755
Serbia 124 4,045 76% $39
South Korea 60 3,697 57% $226
Argentina 155 3,391 92% $39
Mexico 95 3,170 82% $26
Egypt 40 3,042 62% $175
South Africa 72 2,865 25% $405
Australia 70 2,853 62% $420
Portugal 82 2,675 70% $150
Croatia 83 2,567 72% $128
Czech Republic 81 2,274 59% $146
Chile 81 2,017 85% $79
Table 3.11a. Country of publica�on (top 31), con�nuing
3. Looking Back: Continuing, New and Dropped Journals 27
Country Journals Articles %No-fee $/article
United Kingdom 211 15,300 14% $1,308
United States 129 9,946 19% $1,548
Brazil 177 6,355 97% $4
Russia 96 5,566 82% $13
Indonesia 271 4,855 67% $23
Iran 130 4,383 60% $32
Turkey 112 3,982 85% $8
Ukraine 64 3,896 33% $72
Spain 101 2,936 87% $61
India 52 2,313 80% $28
China 19 2,200 52% $184
Poland 76 2,126 72% $82
Switzerland 22 2,047 86% $107
Italy 54 1,885 85% $18
Cuba 32 1,662 100% $0
Netherlands 24 1,577 88% $101
South Korea 28 1,502 67% $117
Colombia 59 1,462 97% $3
Australia 22 1,383 15% $1,383
Germany 27 1,313 31% $368
Lithuania 22 1,172 37% $356
Mexico 26 910 83% $45
Argentina 46 904 98% $1
Romania 32 889 65% $65
Canada 33 649 72% $283
Serbia 31 590 76% $11
Chile 26 577 100% $0
Croatia 26 565 100% $0
Malaysia 24 553 79% $54
Iraq 11 448 20% $74
South Africa 15 430 63% $114
Table 3.11b. Country of publica�on (top 31), new
28 Gold Open Access 2013-2018: articles in journals (GOA4)
Dropped Journals
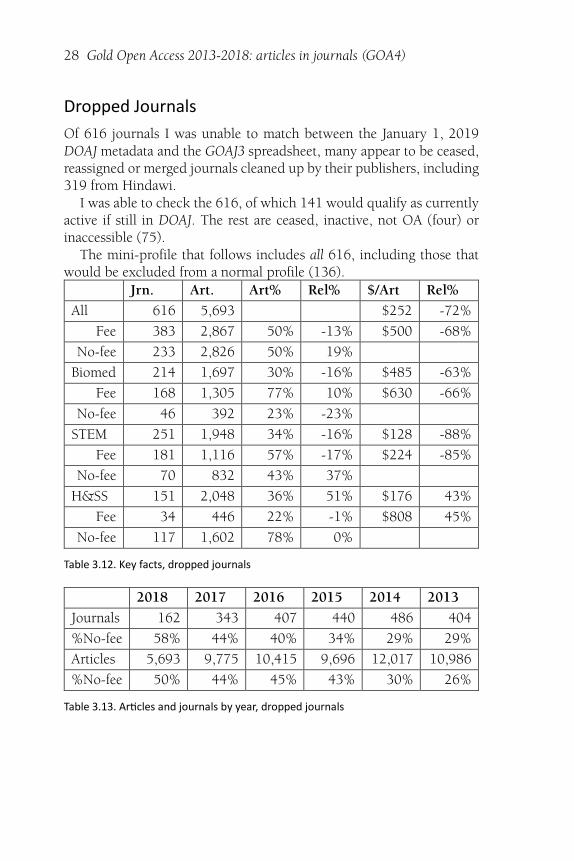
Of 616 journals I was unable to match between the January 1, 2019DOAJ metadata and the GOAJ3 spreadsheet, many appear to be ceased,reassigned or merged journals cleaned up by their publishers, including319 from Hindawi.
I was able to check the 616, of which 141 would qualify as currentlyactive if still in DOAJ. The rest are ceased, inactive, not OA (four) orinaccessible (75).
The mini-profile that follows includes all 616, including those thatwould be excluded from a normal profile (136).
Jrn. Art. Art% Rel% $/Art Rel%
All 616 5,693 $252 -72%
Fee 383 2,867 50% -13% $500 -68%
No-fee 233 2,826 50% 19%
Biomed 214 1,697 30% -16% $485 -63%
Fee 168 1,305 77% 10% $630 -66%
No-fee 46 392 23% -23%
STEM 251 1,948 34% -16% $128 -88%
Fee 181 1,116 57% -17% $224 -85%
No-fee 70 832 43% 37%
H&SS 151 2,048 36% 51% $176 43%
Fee 34 446 22% -1% $808 45%
No-fee 117 1,602 78% 0%
Table 3.12. Key facts, dropped journals
2018 2017 2016 2015 2014 2013
Journals 162 343 407 440 486 404
%No-fee 58% 44% 40% 34% 29% 29%
Articles 5,693 9,775 10,415 9,696 12,017 10,986
%No-fee 50% 44% 45% 43% 30% 26%
Table 3.13. Ar�cles and journals by year, dropped journals
29
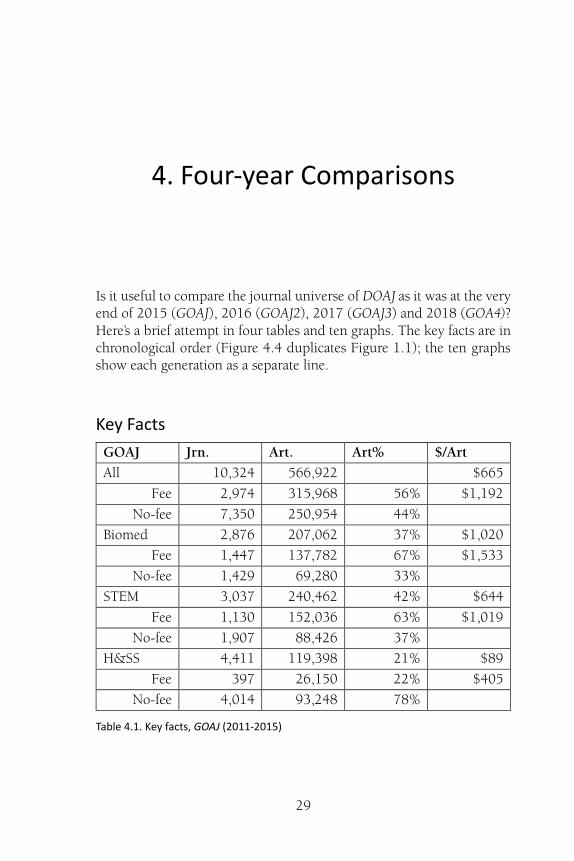
4. Four-year Comparisons
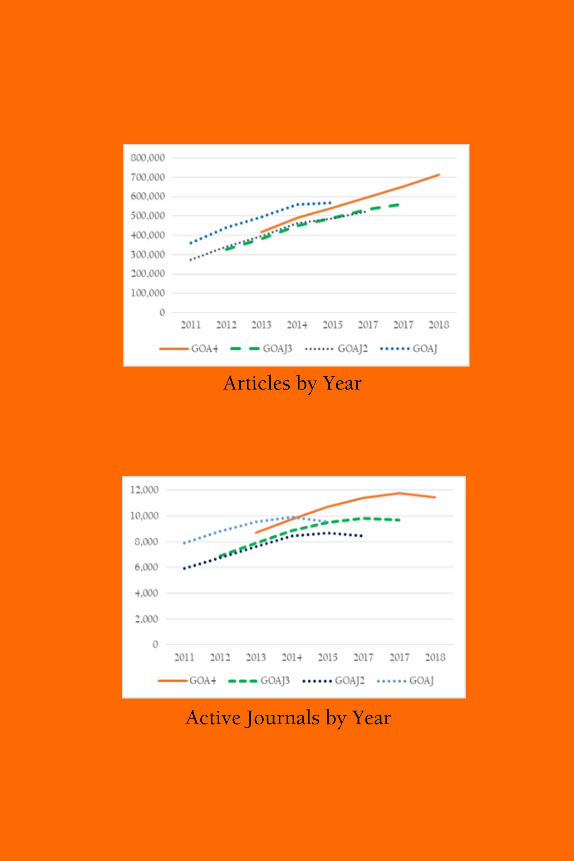
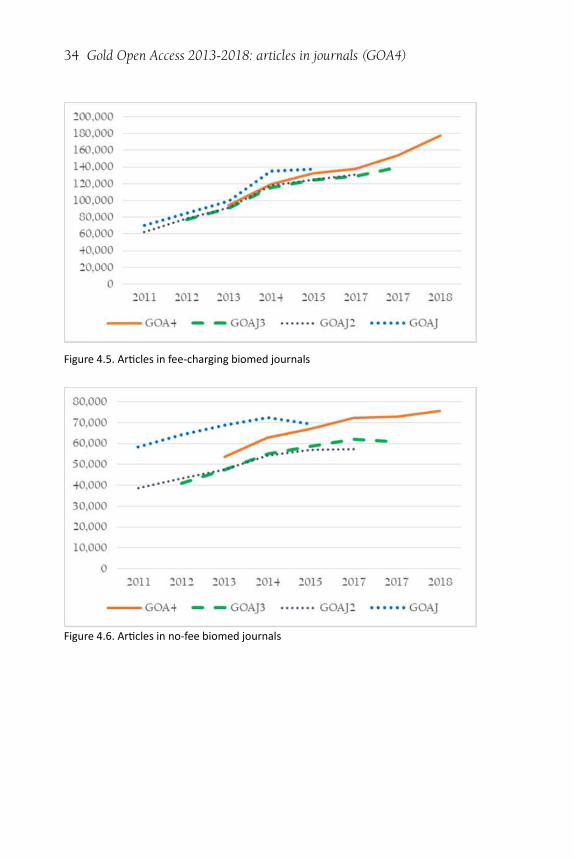
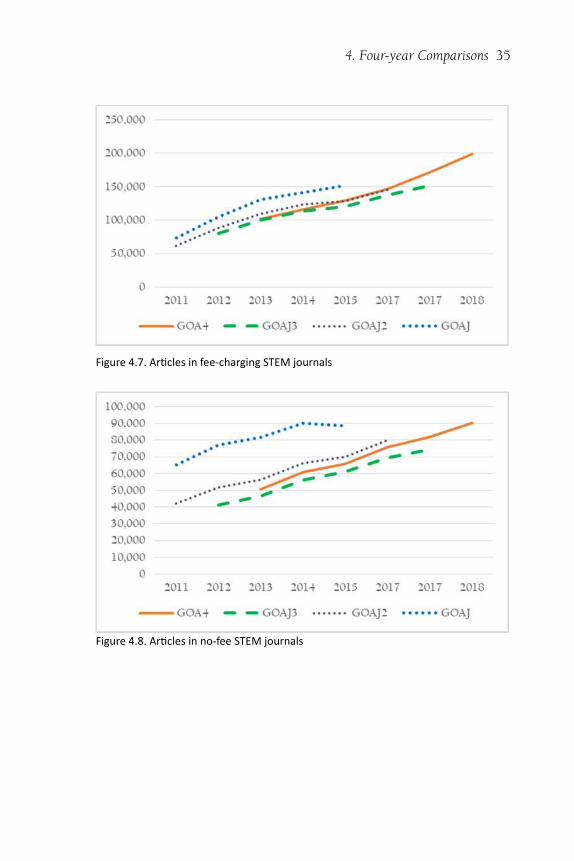
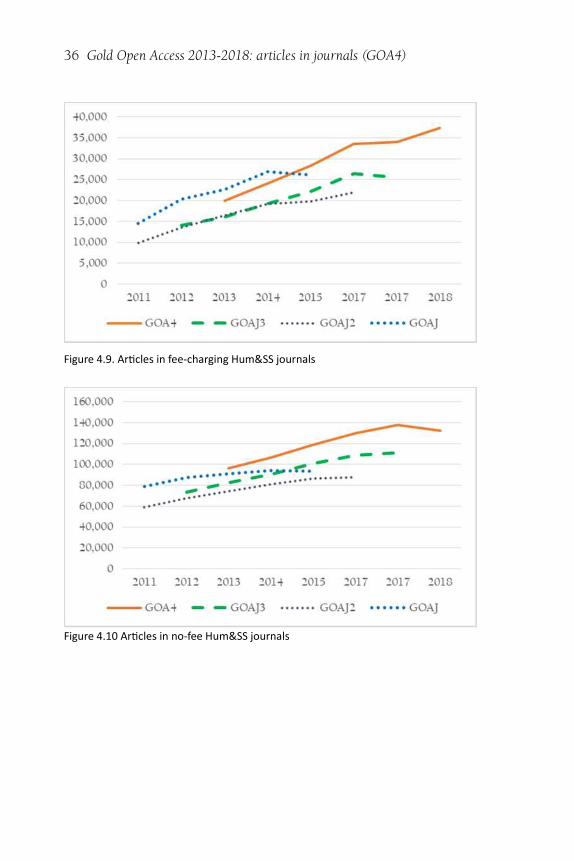
Is it useful to compare the journal universe of DOAJ as it was at the veryend of 2015 (GOAJ), 2016 (GOAJ2), 2017 (GOAJ3) and 2018 (GOA4)?Here’s a brief attempt in four tables and ten graphs. The key facts are inchronological order (Figure 4.4 duplicates Figure 1.1); the ten graphsshow each generation as a separate line.
Key Facts
GOAJ Jrn. Art. Art% $/Art
All 10,324 566,922 $665
Fee 2,974 315,968 56% $1,192
No-fee 7,350 250,954 44%
Biomed 2,876 207,062 37% $1,020
Fee 1,447 137,782 67% $1,533
No-fee 1,429 69,280 33%
STEM 3,037 240,462 42% $644
Fee 1,130 152,036 63% $1,019
No-fee 1,907 88,426 37%
H&SS 4,411 119,398 21% $89
Fee 397 26,150 22% $405
No-fee 4,014 93,248 78%
Table 4.1. Key facts, GOAJ (2011-2015)
30 Gold Open Access 2013-2018: articles in journals (GOA4)
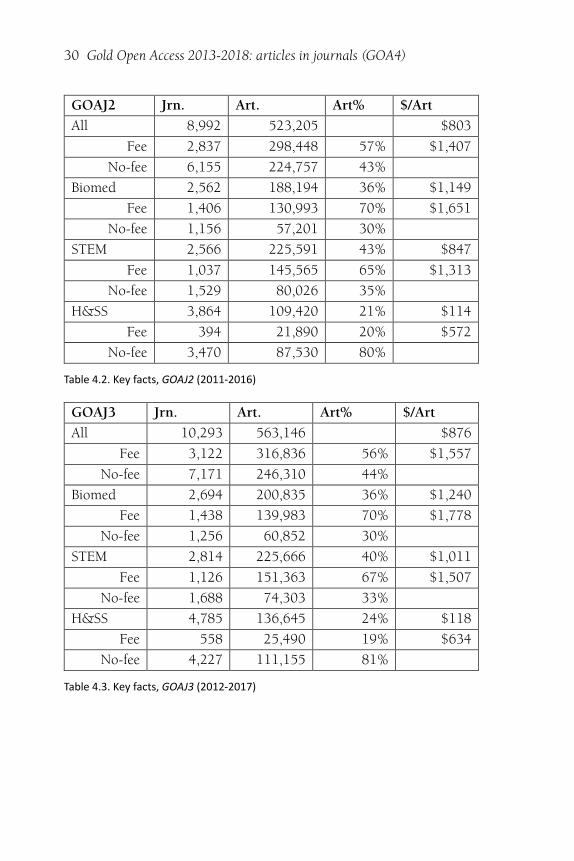
GOAJ2 Jrn. Art. Art% $/Art
All 8,992 523,205 $803
Fee 2,837 298,448 57% $1,407
No-fee 6,155 224,757 43%
Biomed 2,562 188,194 36% $1,149
Fee 1,406 130,993 70% $1,651
No-fee 1,156 57,201 30%
STEM 2,566 225,591 43% $847
Fee 1,037 145,565 65% $1,313
No-fee 1,529 80,026 35%
H&SS 3,864 109,420 21% $114
Fee 394 21,890 20% $572
No-fee 3,470 87,530 80%
Table 4.2. Key facts, GOAJ2 (2011-2016)
GOAJ3 Jrn. Art. Art% $/Art
All 10,293 563,146 $876
Fee 3,122 316,836 56% $1,557
No-fee 7,171 246,310 44%
Biomed 2,694 200,835 36% $1,240
Fee 1,438 139,983 70% $1,778
No-fee 1,256 60,852 30%
STEM 2,814 225,666 40% $1,011
Fee 1,126 151,363 67% $1,507
No-fee 1,688 74,303 33%
H&SS 4,785 136,645 24% $118
Fee 558 25,490 19% $634
No-fee 4,227 111,155 81%
Table 4.3. Key facts, GOAJ3 (2012-2017)
4. Four-year Comparisons 31
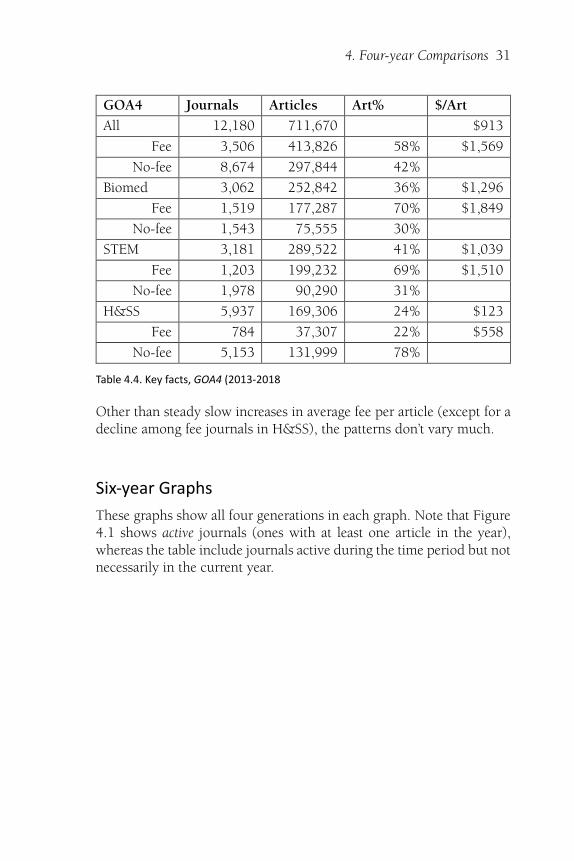
GOA4 Journals Articles Art% $/Art
All 12,180 711,670 $913
Fee 3,506 413,826 58% $1,569
No-fee 8,674 297,844 42%
Biomed 3,062 252,842 36% $1,296
Fee 1,519 177,287 70% $1,849
No-fee 1,543 75,555 30%
STEM 3,181 289,522 41% $1,039
Fee 1,203 199,232 69% $1,510
No-fee 1,978 90,290 31%
H&SS 5,937 169,306 24% $123
Fee 784 37,307 22% $558
No-fee 5,153 131,999 78%
Table 4.4. Key facts, GOA4 (2013-2018
Other than steady slow increases in average fee per article (except for adecline among fee journals in H&SS), the patterns don’t vary much.
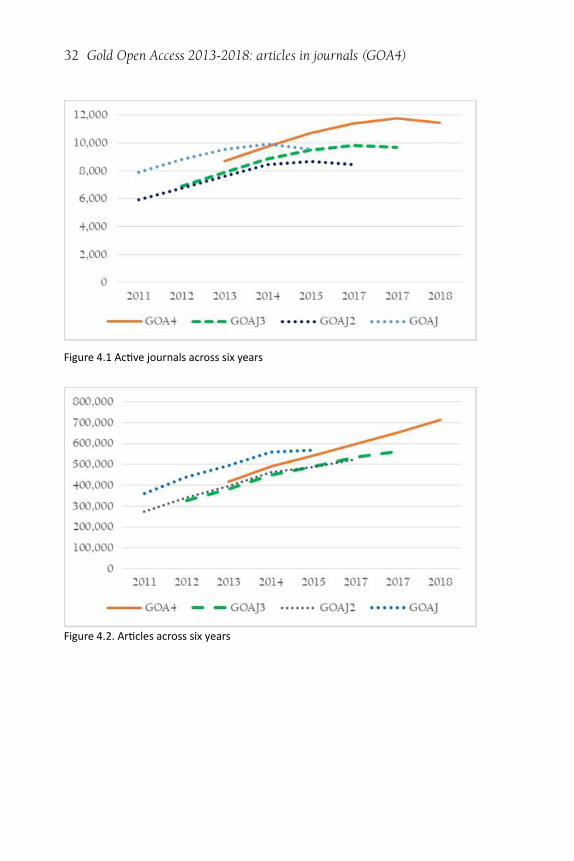
Six-year Graphs
These graphs show all four generations in each graph. Note that Figure4.1 shows active journals (ones with at least one article in the year),whereas the table include journals active during the time period but notnecessarily in the current year.
32 Gold Open Access 2013-2018: articles in journals (GOA4)
Figure 4.1 Ac�ve journals across six years
Figure 4.2. Ar�cles across six years
4. Four-year Comparisons 33
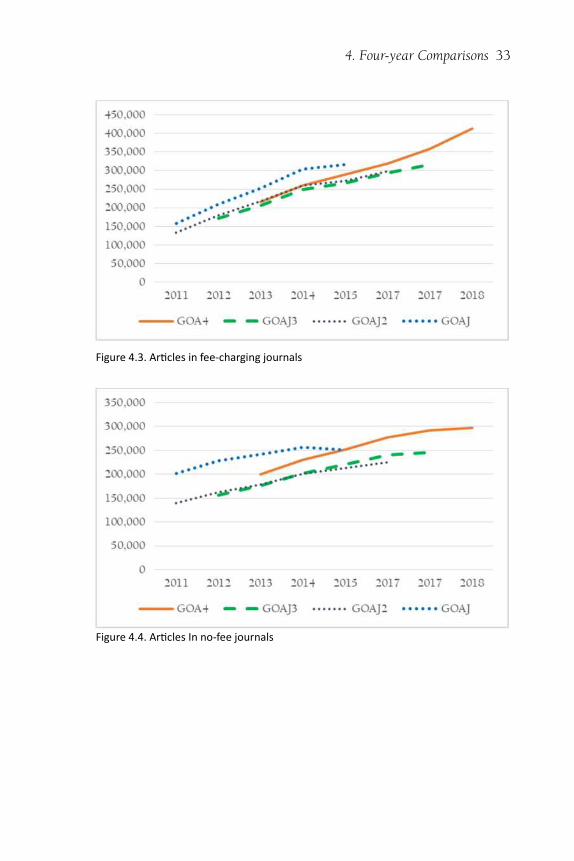
Figure 4.3. Ar�cles in fee-charging journals
Figure 4.4. Ar�cles In no-fee journals
34 Gold Open Access 2013-2018: articles in journals (GOA4)
Figure 4.5. Ar�cles in fee-charging biomed journals
Figure 4.6. Ar�cles in no-fee biomed journals
4. Four-year Comparisons 35
Figure 4.7. Ar�cles in fee-charging STEM journals
Figure 4.8. Ar�cles in no-fee STEM journals
36 Gold Open Access 2013-2018: articles in journals (GOA4)
Figure 4.9. Ar�cles in fee-charging Hum&SS journals
Figure 4.10 Ar�cles in no-fee Hum&SS journals
37
5. Journals by Ar�cle Volume
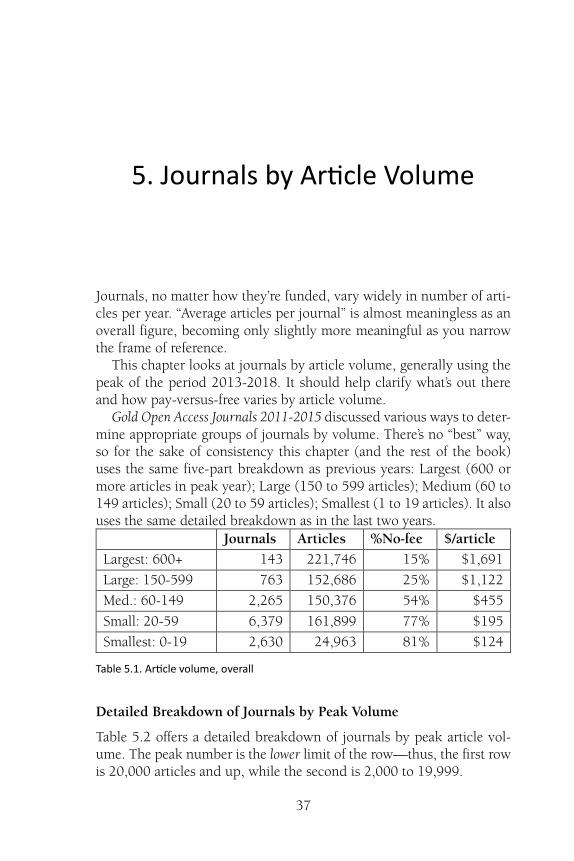
Journals, no matter how they’re funded, vary widely in number of arti-cles per year. “Average articles per journal” is almost meaningless as anoverall figure, becoming only slightly more meaningful as you narrowthe frame of reference.
This chapter looks at journals by article volume, generally using thepeak of the period 2013-2018. It should help clarify what’s out thereand how pay-versus-free varies by article volume.
Gold Open Access Journals 2011-2015 discussed various ways to deter-mine appropriate groups of journals by volume. There’s no “best” way,so for the sake of consistency this chapter (and the rest of the book)uses the same five-part breakdown as previous years: Largest (600 ormore articles in peak year); Large (150 to 599 articles); Medium (60 to149 articles); Small (20 to 59 articles); Smallest (1 to 19 articles). It alsouses the same detailed breakdown as in the last two years.
Journals Articles %No-fee $/article
Largest: 600+ 143 221,746 15% $1,691
Large: 150-599 763 152,686 25% $1,122
Med.: 60-149 2,265 150,376 54% $455
Small: 20-59 6,379 161,899 77% $195
Smallest: 0-19 2,630 24,963 81% $124
Table 5.1. Ar�cle volume, overall
Detailed Breakdown of Journals by Peak Volume
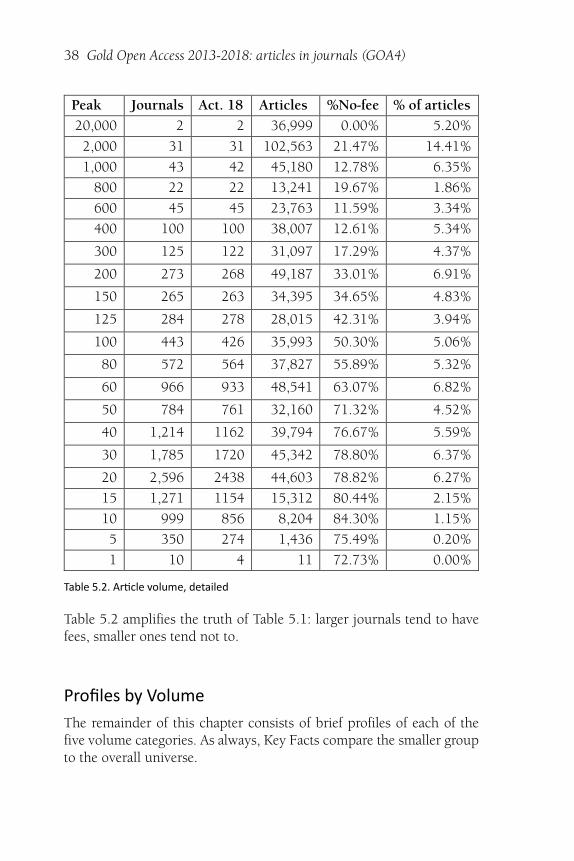
Table 5.2 offers a detailed breakdown of journals by peak article vol-ume. The peak number is the lower limit of the row—thus, the first rowis 20,000 articles and up, while the second is 2,000 to 19,999.
38 Gold Open Access 2013-2018: articles in journals (GOA4)
Peak Journals Act. 18 Articles %No-fee % of articles
20,000 2 2 36,999 0.00% 5.20%
2,000 31 31 102,563 21.47% 14.41%
1,000 43 42 45,180 12.78% 6.35%
800 22 22 13,241 19.67% 1.86%
600 45 45 23,763 11.59% 3.34%
400 100 100 38,007 12.61% 5.34%
300 125 122 31,097 17.29% 4.37%
200 273 268 49,187 33.01% 6.91%
150 265 263 34,395 34.65% 4.83%
125 284 278 28,015 42.31% 3.94%
100 443 426 35,993 50.30% 5.06%
80 572 564 37,827 55.89% 5.32%
60 966 933 48,541 63.07% 6.82%
50 784 761 32,160 71.32% 4.52%
40 1,214 1162 39,794 76.67% 5.59%
30 1,785 1720 45,342 78.80% 6.37%
20 2,596 2438 44,603 78.82% 6.27%
15 1,271 1154 15,312 80.44% 2.15%
10 999 856 8,204 84.30% 1.15%
5 350 274 1,436 75.49% 0.20%
1 10 4 11 72.73% 0.00%
Table 5.2. Ar�cle volume, detailed
Table 5.2 amplifies the truth of Table 5.1: larger journals tend to havefees, smaller ones tend not to.
Profiles by Volume
The remainder of this chapter consists of brief profiles of each of thefive volume categories. As always, Key Facts compare the smaller groupto the overall universe.
5. Journals by Article Volume 39
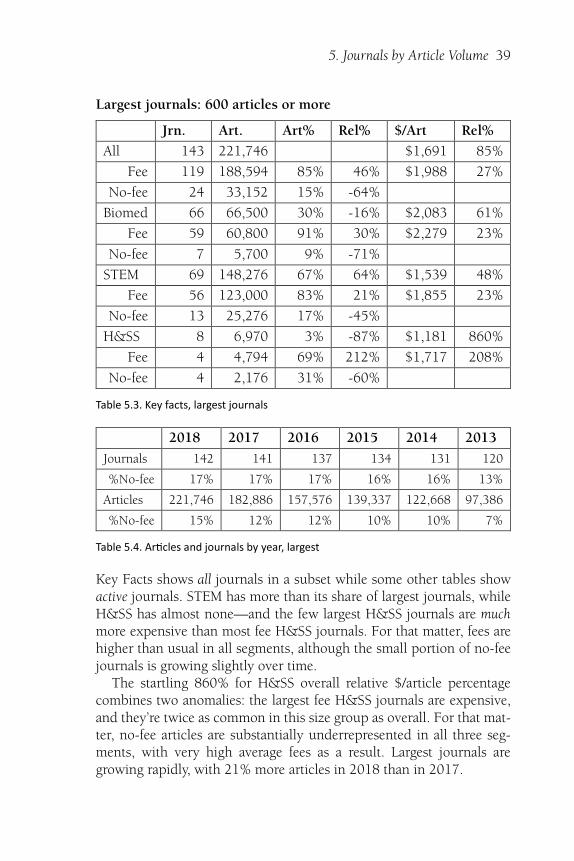
Largest journals: 600 articles or more
Jrn. Art. Art% Rel% $/Art Rel%
All 143 221,746 $1,691 85%
Fee 119 188,594 85% 46% $1,988 27%
No-fee 24 33,152 15% -64%
Biomed 66 66,500 30% -16% $2,083 61%
Fee 59 60,800 91% 30% $2,279 23%
No-fee 7 5,700 9% -71%
STEM 69 148,276 67% 64% $1,539 48%
Fee 56 123,000 83% 21% $1,855 23%
No-fee 13 25,276 17% -45%
H&SS 8 6,970 3% -87% $1,181 860%
Fee 4 4,794 69% 212% $1,717 208%
No-fee 4 2,176 31% -60%
Table 5.3. Key facts, largest journals
2018 2017 2016 2015 2014 2013
Journals 142 141 137 134 131 120
%No-fee 17% 17% 17% 16% 16% 13%
Articles 221,746 182,886 157,576 139,337 122,668 97,386
%No-fee 15% 12% 12% 10% 10% 7%
Table 5.4. Ar�cles and journals by year, largest
Key Facts shows all journals in a subset while some other tables showactive journals. STEM has more than its share of largest journals, whileH&SS has almost none—and the few largest H&SS journals are muchmore expensive than most fee H&SS journals. For that matter, fees arehigher than usual in all segments, although the small portion of no-feejournals is growing slightly over time.
The startling 860% for H&SS overall relative $/article percentagecombines two anomalies: the largest fee H&SS journals are expensive,and they’re twice as common in this size group as overall. For that mat-ter, no-fee articles are substantially underrepresented in all three seg-ments, with very high average fees as a result. Largest journals aregrowing rapidly, with 21% more articles in 2018 than in 2017.
40 Gold Open Access 2013-2018: articles in journals (GOA4)
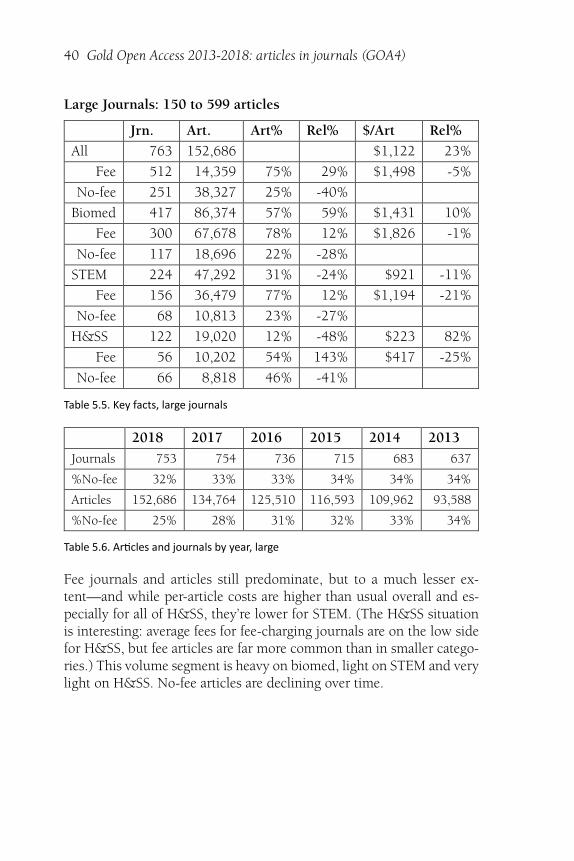
Large Journals: 150 to 599 articles
Jrn. Art. Art% Rel% $/Art Rel%
All 763 152,686 $1,122 23%
Fee 512 14,359 75% 29% $1,498 -5%
No-fee 251 38,327 25% -40%
Biomed 417 86,374 57% 59% $1,431 10%
Fee 300 67,678 78% 12% $1,826 -1%
No-fee 117 18,696 22% -28%
STEM 224 47,292 31% -24% $921 -11%
Fee 156 36,479 77% 12% $1,194 -21%
No-fee 68 10,813 23% -27%
H&SS 122 19,020 12% -48% $223 82%
Fee 56 10,202 54% 143% $417 -25%
No-fee 66 8,818 46% -41%
Table 5.5. Key facts, large journals
2018 2017 2016 2015 2014 2013
Journals 753 754 736 715 683 637
%No-fee 32% 33% 33% 34% 34% 34%
Articles 152,686 134,764 125,510 116,593 109,962 93,588
%No-fee 25% 28% 31% 32% 33% 34%
Table 5.6. Ar�cles and journals by year, large
Fee journals and articles still predominate, but to a much lesser ex-tent—and while per-article costs are higher than usual overall and es-pecially for all of H&SS, they’re lower for STEM. (The H&SS situationis interesting: average fees for fee-charging journals are on the low sidefor H&SS, but fee articles are far more common than in smaller catego-ries.) This volume segment is heavy on biomed, light on STEM and verylight on H&SS. No-fee articles are declining over time.
5. Journals by Article Volume 41
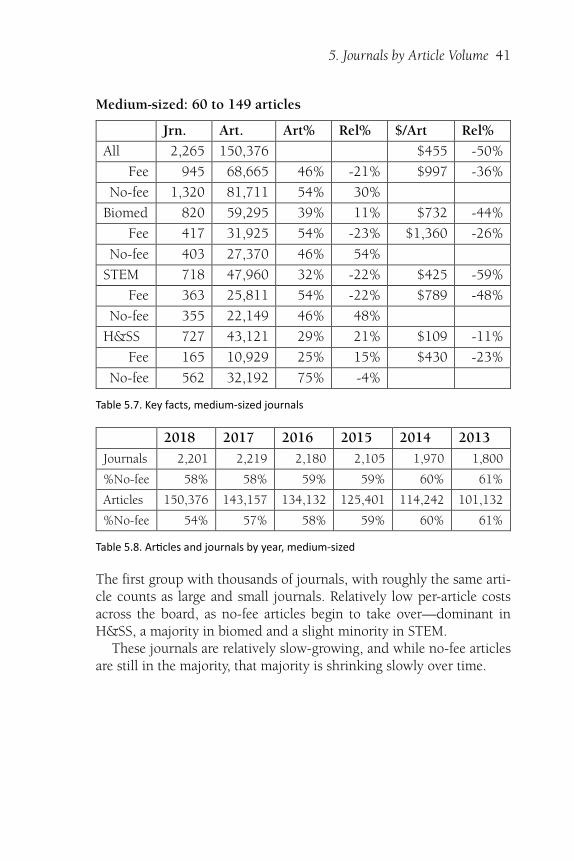
Medium-sized: 60 to 149 articles
Jrn. Art. Art% Rel% $/Art Rel%
All 2,265 150,376 $455 -50%
Fee 945 68,665 46% -21% $997 -36%
No-fee 1,320 81,711 54% 30%
Biomed 820 59,295 39% 11% $732 -44%
Fee 417 31,925 54% -23% $1,360 -26%
No-fee 403 27,370 46% 54%
STEM 718 47,960 32% -22% $425 -59%
Fee 363 25,811 54% -22% $789 -48%
No-fee 355 22,149 46% 48%
H&SS 727 43,121 29% 21% $109 -11%
Fee 165 10,929 25% 15% $430 -23%
No-fee 562 32,192 75% -4%
Table 5.7. Key facts, medium-sized journals
2018 2017 2016 2015 2014 2013
Journals 2,201 2,219 2,180 2,105 1,970 1,800
%No-fee 58% 58% 59% 59% 60% 61%
Articles 150,376 143,157 134,132 125,401 114,242 101,132
%No-fee 54% 57% 58% 59% 60% 61%
Table 5.8. Ar�cles and journals by year, medium-sized
The first group with thousands of journals, with roughly the same arti-cle counts as large and small journals. Relatively low per-article costsacross the board, as no-fee articles begin to take over—dominant inH&SS, a majority in biomed and a slight minority in STEM.
These journals are relatively slow-growing, and while no-fee articlesare still in the majority, that majority is shrinking slowly over time.
42 Gold Open Access 2013-2018: articles in journals (GOA4)
Small Journals: 20 to 59 articles
Jrn. Art. Art% Rel% $/Art Rel%
All 6,379 161,899 $195 -79%
Fee 1,420 37,570 23% -60% $841 -46%
No-fee 4,959 124,329 77% 83%
Biomed 1,347 37,139 23% -35% $546 -58%
Fee 552 15,374 41% -41% $1,319 -29%
No-fee 795 21,765 59% 96%
STEM 1,547 40,031 25% -39% $201 -81%
Fee 473 12,468 31% -55% $646 -57%
No-fee 1,074 27,563 69% 121%
H&SS 3,485 84,729 52% 120% $38 -69%
Fee 395 9,728 11% -48% $335 -40%
No-fee 3,090 75,001 89% 14%
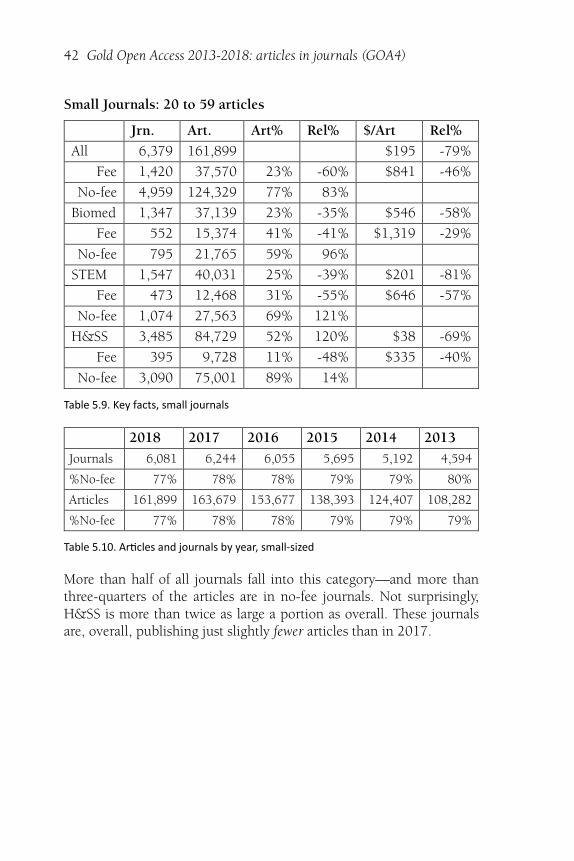
Table 5.9. Key facts, small journals
2018 2017 2016 2015 2014 2013
Journals 6,081 6,244 6,055 5,695 5,192 4,594
%No-fee 77% 78% 78% 79% 79% 80%
Articles 161,899 163,679 153,677 138,393 124,407 108,282
%No-fee 77% 78% 78% 79% 79% 79%
Table 5.10. Ar�cles and journals by year, small-sized
More than half of all journals fall into this category—and more thanthree-quarters of the articles are in no-fee journals. Not surprisingly,H&SS is more than twice as large a portion as overall. These journalsare, overall, publishing just slightly fewer articles than in 2017.

5. Journals by Article Volume 43
Smallest: fewer than 20 articles
Jrn. Art. Art% Rel% $/Art Rel%
All 2,630 24,963 $124 -86%
Fee 510 4,638 19% -68% $665 -58%
No-fee 2,120 20,325 81% 95%
Biomed 412 3,534 14% -60% $556 -57%
Fee 191 1,510 43% -39% $1,300 -30%
No-fee 221 2,024 57% 92%
STEM 623 5,963 24% -41% $124 -88%
Fee 155 1,474 25% -64% $501 -67%
No-fee 468 4,489 75% 141%
H&SS 1,595 15,466 62% 160% $25 -80%
Fee 164 1,654 11% -51% $231 -59%
No-fee 1,431 13,812 89% 15%
Table 5.11. Key facts, smallest journals
2018 2017 2016 2015 2014 2013
Journals 2,288 2,411 2,275 2,047 1,795 1,552
%No-fee 80% 81% 81% 82% 83% 84%
Articles 24,963 26,898 24,812 21,976 18,998 16,063
%No-fee 81% 82% 82% 83% 84% 86%
Table 5.12. Ar�cles and journals by year, smallest-sized
While small journals may be the norm in H&SS—30 to 50 articles ayear for a specialized journal being reasonably typical—these are verysmall journals, almost all no-fee and mostly H&SS. Another case wherearticle counts are down slightly from 2017.
44
6. Fees and Maximum Revenue
It takes money to publish even the smallest journal. For small openaccess journals run out of a university library or department the costsbe may be so small as to be trivial.
You can find long lists of all the things publishers may do and longdiscussions of what constitutes reasonable pricing. This book doesn’tsay “here’s what an article should cost” but does offer some data on themaximum amount that journals are or may be getting from fees.
Fee Level
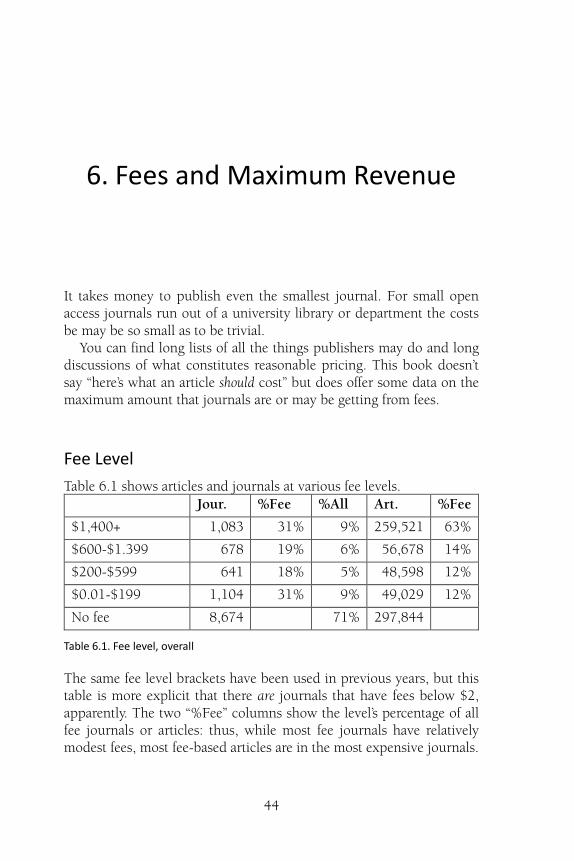
Table 6.1 shows articles and journals at various fee levels.Jour. %Fee %All Art. %Fee
$1,400+ 1,083 31% 9% 259,521 63%
$600-$1.399 678 19% 6% 56,678 14%
$200-$599 641 18% 5% 48,598 12%
$0.01-$199 1,104 31% 9% 49,029 12%
No fee 8,674 71% 297,844
Table 6.1. Fee level, overall
The same fee level brackets have been used in previous years, but thistable is more explicit that there are journals that have fees below $2,apparently. The two “%Fee” columns show the level’s percentage of allfee journals or articles: thus, while most fee journals have relativelymodest fees, most fee-based articles are in the most expensive journals.
6. Fees and Maximum Revenue 45
Revenue Ranges
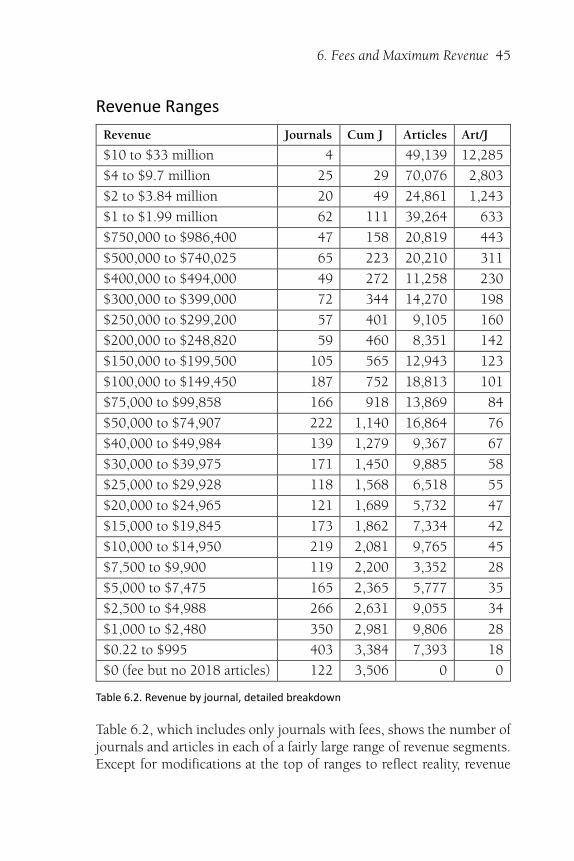
Revenue Journals Cum J Articles Art/J
$10 to $33 million 4 49,139 12,285
$4 to $9.7 million 25 29 70,076 2,803
$2 to $3.84 million 20 49 24,861 1,243
$1 to $1.99 million 62 111 39,264 633
$750,000 to $986,400 47 158 20,819 443
$500,000 to $740,025 65 223 20,210 311
$400,000 to $494,000 49 272 11,258 230
$300,000 to $399,000 72 344 14,270 198
$250,000 to $299,200 57 401 9,105 160
$200,000 to $248,820 59 460 8,351 142
$150,000 to $199,500 105 565 12,943 123
$100,000 to $149,450 187 752 18,813 101
$75,000 to $99,858 166 918 13,869 84
$50,000 to $74,907 222 1,140 16,864 76
$40,000 to $49,984 139 1,279 9,367 67
$30,000 to $39,975 171 1,450 9,885 58
$25,000 to $29,928 118 1,568 6,518 55
$20,000 to $24,965 121 1,689 5,732 47
$15,000 to $19,845 173 1,862 7,334 42
$10,000 to $14,950 219 2,081 9,765 45
$7,500 to $9,900 119 2,200 3,352 28
$5,000 to $7,475 165 2,365 5,777 35
$2,500 to $4,988 266 2,631 9,055 34
$1,000 to $2,480 350 2,981 9,806 28
$0.22 to $995 403 3,384 7,393 18
$0 (fee but no 2018 articles) 122 3,506 0 0
Table 6.2. Revenue by journal, detailed breakdown
Table 6.2, which includes only journals with fees, shows the number ofjournals and articles in each of a fairly large range of revenue segments.Except for modifications at the top of ranges to reflect reality, revenue
46 Gold Open Access 2013-2018: articles in journals (GOA4)
brackets are the same as in GOAJ2: Gold Open Access Journals 2011-2016to provide comparability. (One of those modifications is noteworthy:the top potential revenue for a single journal, $44 million last year, isdown to $33 million for 2018.)
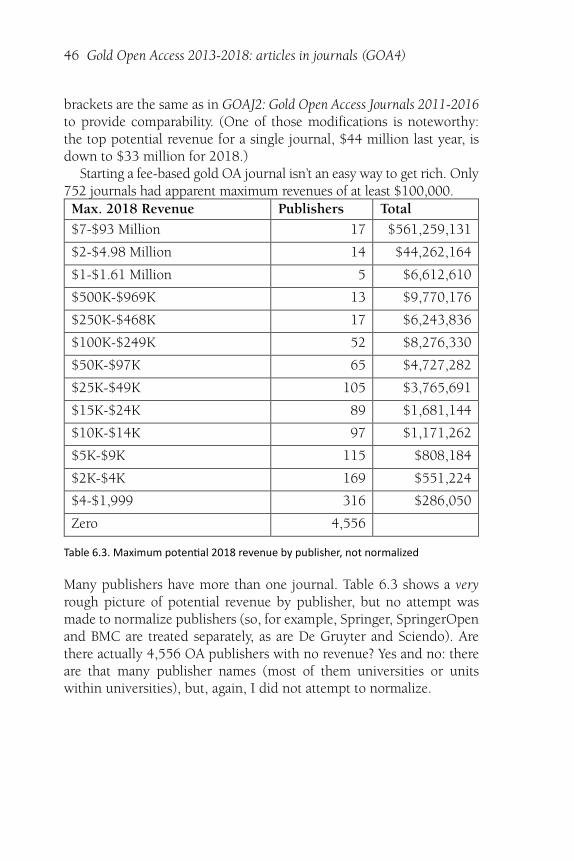
Starting a fee-based gold OA journal isn’t an easy way to get rich. Only752 journals had apparent maximum revenues of at least $100,000.Max. 2018 Revenue Publishers Total
$7-$93 Million 17 $561,259,131
$2-$4.98 Million 14 $44,262,164
$1-$1.61 Million 5 $6,612,610
$500K-$969K 13 $9,770,176
$250K-$468K 17 $6,243,836
$100K-$249K 52 $8,276,330
$50K-$97K 65 $4,727,282
$25K-$49K 105 $3,765,691
$15K-$24K 89 $1,681,144
$10K-$14K 97 $1,171,262
$5K-$9K 115 $808,184
$2K-$4K 169 $551,224
$4-$1,999 316 $286,050
Zero 4,556
Table 6.3. Maximum poten�al 2018 revenue by publisher, not normalized
Many publishers have more than one journal. Table 6.3 shows a veryrough picture of potential revenue by publisher, but no attempt wasmade to normalize publishers (so, for example, Springer, SpringerOpenand BMC are treated separately, as are De Gruyter and Sciendo). Arethere actually 4,556 OA publishers with no revenue? Yes and no: thereare that many publisher names (most of them universities or unitswithin universities), but, again, I did not attempt to normalize.
6. Fees and Maximum Revenue 47
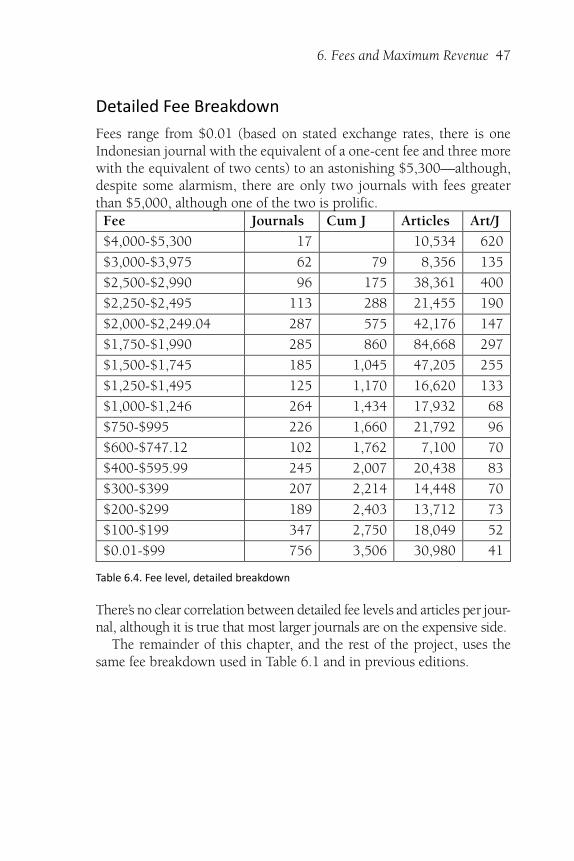
Detailed Fee Breakdown
Fees range from $0.01 (based on stated exchange rates, there is oneIndonesian journal with the equivalent of a one-cent fee and three morewith the equivalent of two cents) to an astonishing $5,300—although,despite some alarmism, there are only two journals with fees greaterthan $5,000, although one of the two is prolific.Fee Journals Cum J Articles Art/J
$4,000-$5,300 17 10,534 620
$3,000-$3,975 62 79 8,356 135
$2,500-$2,990 96 175 38,361 400
$2,250-$2,495 113 288 21,455 190
$2,000-$2,249.04 287 575 42,176 147
$1,750-$1,990 285 860 84,668 297
$1,500-$1,745 185 1,045 47,205 255
$1,250-$1,495 125 1,170 16,620 133
$1,000-$1,246 264 1,434 17,932 68
$750-$995 226 1,660 21,792 96
$600-$747.12 102 1,762 7,100 70
$400-$595.99 245 2,007 20,438 83
$300-$399 207 2,214 14,448 70
$200-$299 189 2,403 13,712 73
$100-$199 347 2,750 18,049 52
$0.01-$99 756 3,506 30,980 41
Table 6.4. Fee level, detailed breakdown
There’s no clear correlation between detailed fee levels and articles per jour-nal, although it is true that most larger journals are on the expensive side.
The remainder of this chapter, and the rest of the project, uses thesame fee breakdown used in Table 6.1 and in previous editions.
48 Gold Open Access 2013-2018: articles in journals (GOA4)
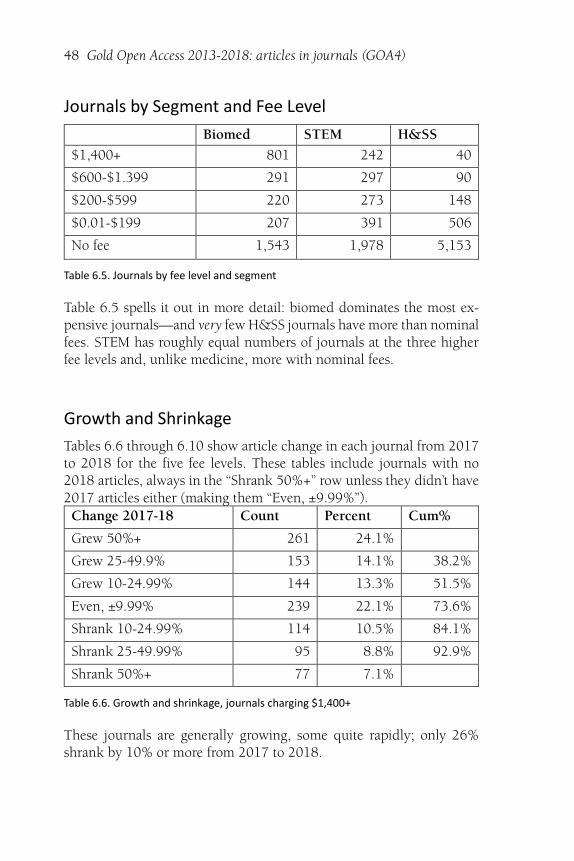
Journals by Segment and Fee Level
Biomed STEM H&SS
$1,400+ 801 242 40
$600-$1.399 291 297 90
$200-$599 220 273 148
$0.01-$199 207 391 506
No fee 1,543 1,978 5,153
Table 6.5. Journals by fee level and segment
Table 6.5 spells it out in more detail: biomed dominates the most ex-pensive journals—and very few H&SS journals have more than nominalfees. STEM has roughly equal numbers of journals at the three higherfee levels and, unlike medicine, more with nominal fees.
Growth and Shrinkage
Tables 6.6 through 6.10 show article change in each journal from 2017to 2018 for the five fee levels. These tables include journals with no2018 articles, always in the “Shrank 50%+” row unless they didn’t have2017 articles either (making them “Even, ±9.99%”).Change 2017-18 Count Percent Cum%
Grew 50%+ 261 24.1%
Grew 25-49.9% 153 14.1% 38.2%
Grew 10-24.99% 144 13.3% 51.5%
Even, ±9.99% 239 22.1% 73.6%
Shrank 10-24.99% 114 10.5% 84.1%
Shrank 25-49.99% 95 8.8% 92.9%
Shrank 50%+ 77 7.1%
Table 6.6. Growth and shrinkage, journals charging $1,400+
These journals are generally growing, some quite rapidly; only 26%shrank by 10% or more from 2017 to 2018.
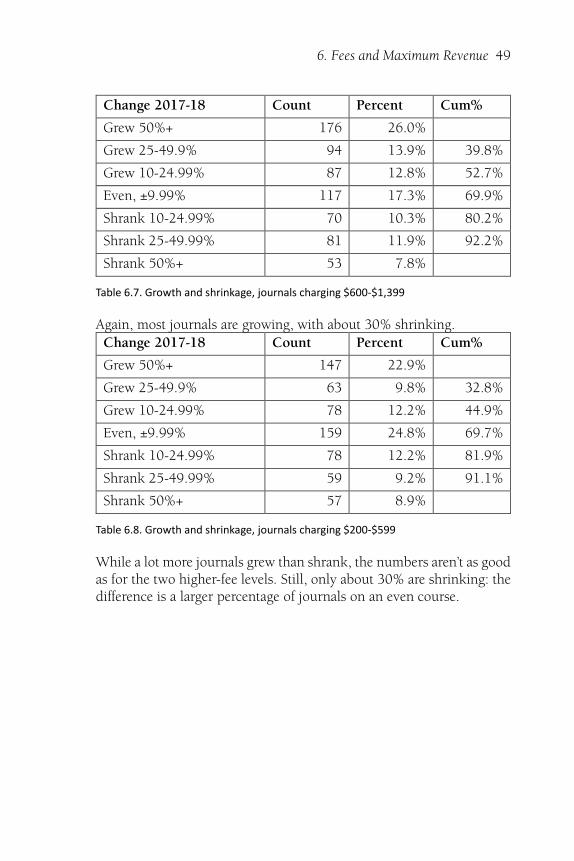
6. Fees and Maximum Revenue 49
Change 2017-18 Count Percent Cum%
Grew 50%+ 176 26.0%
Grew 25-49.9% 94 13.9% 39.8%
Grew 10-24.99% 87 12.8% 52.7%
Even, ±9.99% 117 17.3% 69.9%
Shrank 10-24.99% 70 10.3% 80.2%
Shrank 25-49.99% 81 11.9% 92.2%
Shrank 50%+ 53 7.8%
Table 6.7. Growth and shrinkage, journals charging $600-$1,399
Again, most journals are growing, with about 30% shrinking.Change 2017-18 Count Percent Cum%
Grew 50%+ 147 22.9%
Grew 25-49.9% 63 9.8% 32.8%
Grew 10-24.99% 78 12.2% 44.9%
Even, ±9.99% 159 24.8% 69.7%
Shrank 10-24.99% 78 12.2% 81.9%
Shrank 25-49.99% 59 9.2% 91.1%
Shrank 50%+ 57 8.9%
Table 6.8. Growth and shrinkage, journals charging $200-$599
While a lot more journals grew than shrank, the numbers aren’t as goodas for the two higher-fee levels. Still, only about 30% are shrinking: thedifference is a larger percentage of journals on an even course.
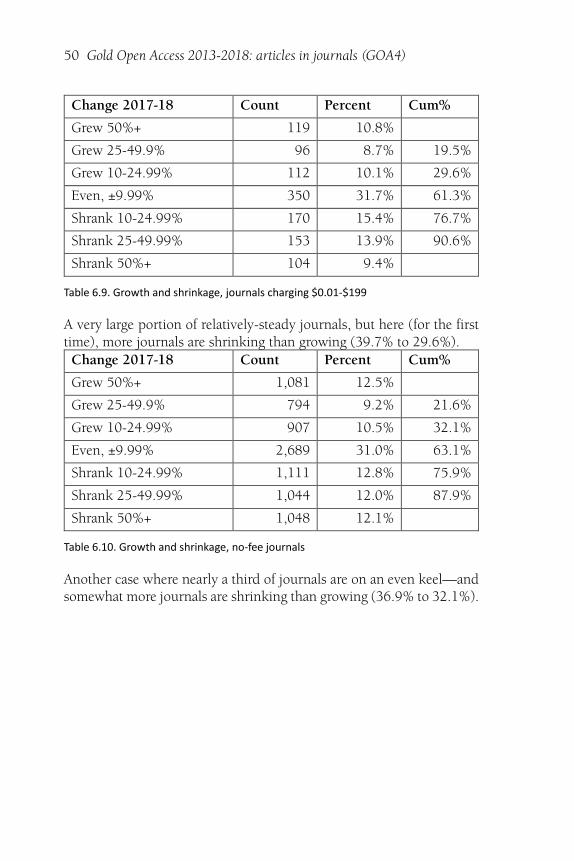
50 Gold Open Access 2013-2018: articles in journals (GOA4)
Change 2017-18 Count Percent Cum%
Grew 50%+ 119 10.8%
Grew 25-49.9% 96 8.7% 19.5%
Grew 10-24.99% 112 10.1% 29.6%
Even, ±9.99% 350 31.7% 61.3%
Shrank 10-24.99% 170 15.4% 76.7%
Shrank 25-49.99% 153 13.9% 90.6%
Shrank 50%+ 104 9.4%
Table 6.9. Growth and shrinkage, journals charging $0.01-$199
A very large portion of relatively-steady journals, but here (for the firsttime), more journals are shrinking than growing (39.7% to 29.6%).Change 2017-18 Count Percent Cum%
Grew 50%+ 1,081 12.5%
Grew 25-49.9% 794 9.2% 21.6%
Grew 10-24.99% 907 10.5% 32.1%
Even, ±9.99% 2,689 31.0% 63.1%
Shrank 10-24.99% 1,111 12.8% 75.9%
Shrank 25-49.99% 1,044 12.0% 87.9%
Shrank 50%+ 1,048 12.1%
Table 6.10. Growth and shrinkage, no-fee journals
Another case where nearly a third of journals are on an even keel—andsomewhat more journals are shrinking than growing (36.9% to 32.1%).
51
7. Publisher Category
Do the characteristics of open access journals vary depending on thetype of publisher? This chapter explores that question, breaking seriousgold OA journals down into five categories, based on the publishername as it appears in DOAJ. The categories are:
University, college or institute: Excluding (as much as possible)“institutes” that don’t have educational or research functions. A uni-versity press falls into this category even if it seems to function as atraditional publisher.
Societies, associations and government agencies: There aren’tmany government-published OA journals, not enough to create aseparate category.
Traditional publishers: Companies (or publisher names) that pub-lish subscription journals as well as multiple OA journals.
Open access publishers: Publishers that don’t appear to publishmany subscription journals but do publish multiple OA journals.
Miscellaneous: Publisher names (frequently journal names) thatdon’t obviously fall into the other types and that only have one ortwo journals.
I searched for information on many non-obvious publisher names andassigned categories appropriately. I’m sure there are quite a few miscel-laneous journals that are from universities, colleges, societies, associa-tions or government agencies but where the non-English publishername didn’t make that obvious—but never more than a couple for eachpublisher name. There are only half as many miscellaneous journals asin GOAJ3 largely because I was able to identify more journals as belong-ing in one of the other categories.
52 Gold Open Access 2013-2018: articles in journals (GOA4)
Category Journals Articles %No-fee $/article
Open Access 2,450 257,173 15% $1,481
Univ/college 7,040 228,792 75% $130
Traditional 1,015 124,341 32% $1,437
Society/govt 1,152 74,558 44% $713
Miscellaneous 522 26,788 62% $261
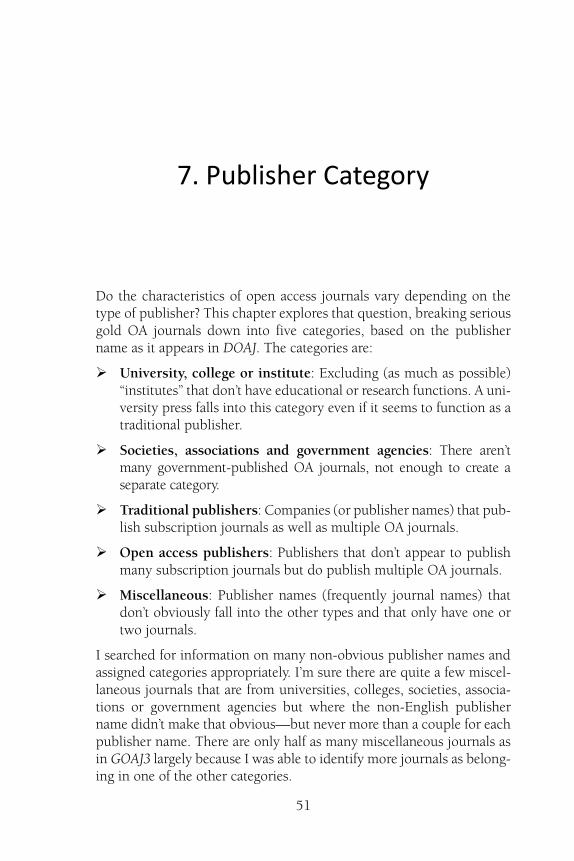
Table 7.1. Publisher category, overall
Table 7.1 shows articles and journals by publisher category, sorted bynumber of articles. The difference between the two largest categories byarticle and journal count could hardly be starker. OA publishers pre-dominantly charge fees, more so than traditional publishers, where onlyone of four university-published articles involves fees. And the averagecost per article for OA publishers is over $1,400, as is true for traditionalpublishers—more than 11 times as much as for university publishers.
The rest of this chapter is a series of profiles for each publisher cate-gory, in the order shown above.
Open Access Publishers
Jrn. Art. Art% Rel% $/Art Rel%
All 2,450 257,173 $1,481 62%
Fee 1,406 219,278 85% 47% $1,737 11%
No-fee 1,044 37,895 15% -65%
Biomed 1,147 121,262 47% 33% $1,717 32%
Fee 790 105,363 87% 24% $1,976 7%
No-fee 357 15,899 13% -56%
STEM 757 116,186 45% 11% $1,366 31%
Fee 437 102,201 88% 28% $1,553 3%
No-fee 320 13,985 12% -61%
H&SS 546 19,725 8% -68% $707 475%
Fee 179 11,714 59% 170% $1,190 113%
No-fee 367 8,011 41% -48%
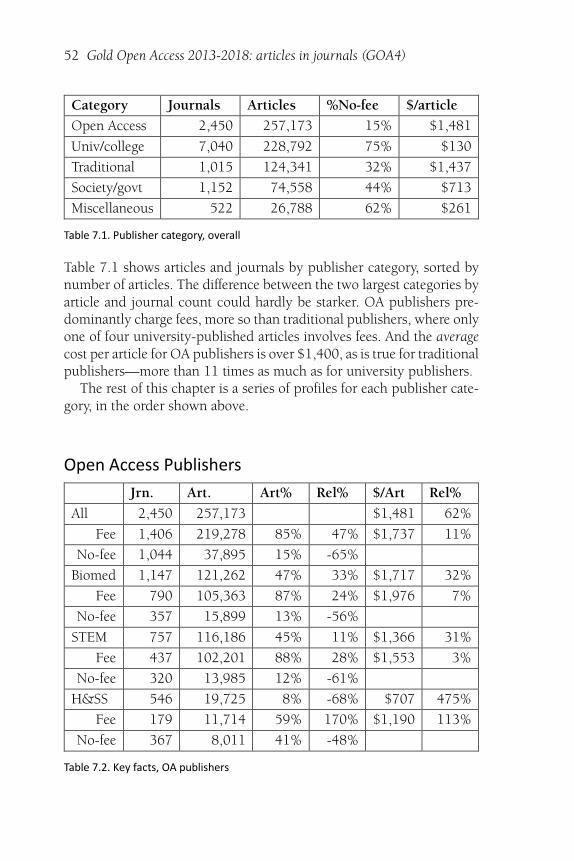
Table 7.2. Key facts, OA publishers
7. Publisher Category 53
Consider the relative percentages: high on fee, negative by more than50% across the board for no-fee article percentages, nearly five times theoverall average for H&SS article costs.
2018 2017 2016 2015 2014 2013
Journals 2,317 2,359 2,265 2,107 1,918 1,709
%No-fee 41% 42% 41% 39% 38% 37%
Articles 257,173 209,827 199,621 188,076 182,780 155,227
%No-fee 15% 18% 18% 17% 17% 17%
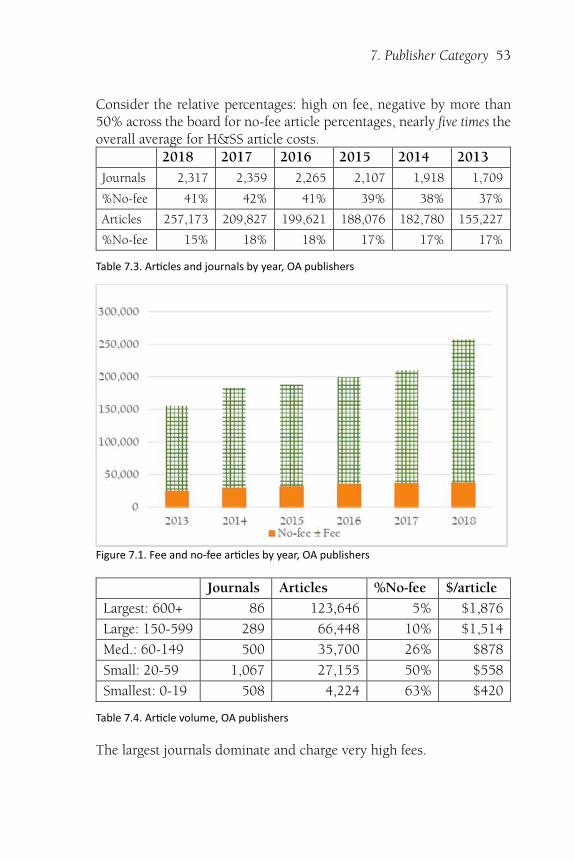
Table 7.3. Ar�cles and journals by year, OA publishers
Figure 7.1. Fee and no-fee ar�cles by year, OA publishers
Journals Articles %No-fee $/article
Largest: 600+ 86 123,646 5% $1,876
Large: 150-599 289 66,448 10% $1,514
Med.: 60-149 500 35,700 26% $878
Small: 20-59 1,067 27,155 50% $558
Smallest: 0-19 508 4,224 63% $420
Table 7.4. Ar�cle volume, OA publishers
The largest journals dominate and charge very high fees.
54 Gold Open Access 2013-2018: articles in journals (GOA4)
Jour. %Fee %All Art. %Fee %All
$1,400+ 610 43% 25% 169,814 77% 66%
$600-$1.399 363 26% 15% 23,709 11% 9%
$200-$599 298 21% 12% 20,190 9% 8%
$0.01-$199 135 10% 6% 5,565 3% 2%
No fee 1,044 43% 37,895 15%
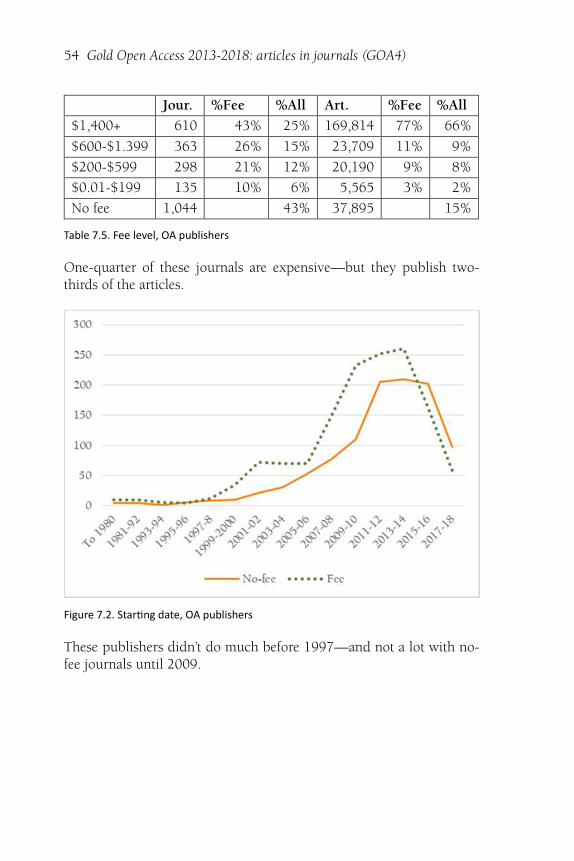
Table 7.5. Fee level, OA publishers
One-quarter of these journals are expensive—but they publish two-thirds of the articles.
Figure 7.2. Star�ng date, OA publishers
These publishers didn’t do much before 1997—and not a lot with no-fee journals until 2009.
7. Publisher Category 55
Articles Revenue $/article
$1,400+ 169,814 $348,909,053 $2,055
$600-$1.399 23,709 $23,285,270 $982
$200-$599 20,190 $8,082,402 $400
$0.20-$199 5,565 $580,974 $104
No fee 37,895
Total 257,173 $380,857,700 $1,481
Table 7.6. Revenue, OA publishers
Region Journals Articles %No-fee $/article
Western Europe 1,397 183,410 9% $1,704
Pacific/English 159 36,771 7% $1,603
Asia 256 18,078 54% $276
Eastern Europe 480 12,671 51% $242
Middle East 96 3,935 71% $110
Africa 48 1,823 21% $507
Latin America 14 485 42% $84
Table 7.7. Region, OA publishers
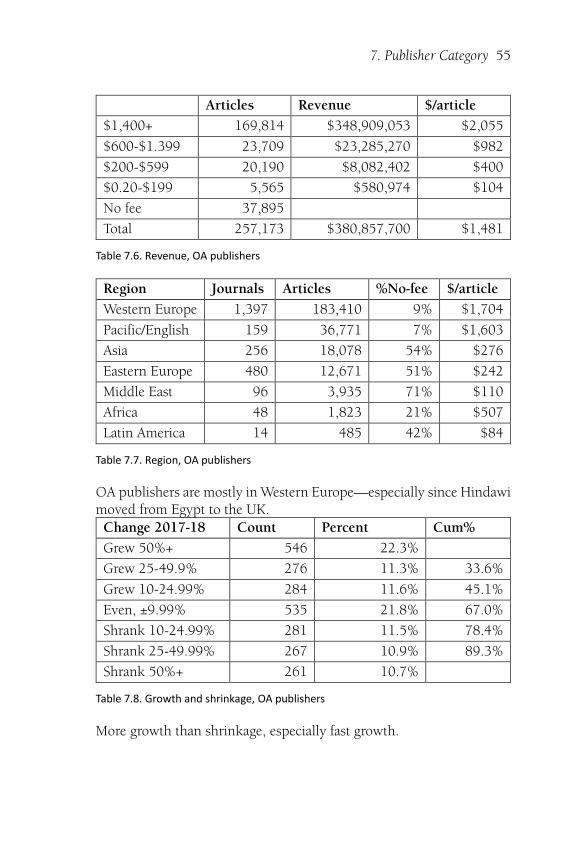
OA publishers are mostly in Western Europe—especially since Hindawimoved from Egypt to the UK.Change 2017-18 Count Percent Cum%
Grew 50%+ 546 22.3%
Grew 25-49.9% 276 11.3% 33.6%
Grew 10-24.99% 284 11.6% 45.1%
Even, ±9.99% 535 21.8% 67.0%
Shrank 10-24.99% 281 11.5% 78.4%
Shrank 25-49.99% 267 10.9% 89.3%
Shrank 50%+ 261 10.7%
Table 7.8. Growth and shrinkage, OA publishers
More growth than shrinkage, especially fast growth.
56 Gold Open Access 2013-2018: articles in journals (GOA4)
Subject Articles $/article Weight
Mathematics 6,063 $1,271 58.07%
Biology 23,881 $1,978 53.81%
Chemistry 14,397 $1,567 44.96%
Physics 15,100 $1,154 44.23%
Ecology 14,592 $1,401 35.75%
Earth Sciences 10,012 $1,012 35.03%
Medicine 97,381 $1,653 28.40%
Psychology 3,331 $2,584 11.81%
Other Sciences 23,376 $1,520 3.89%
Table 7.9. Overweighted subjects, OA publishers
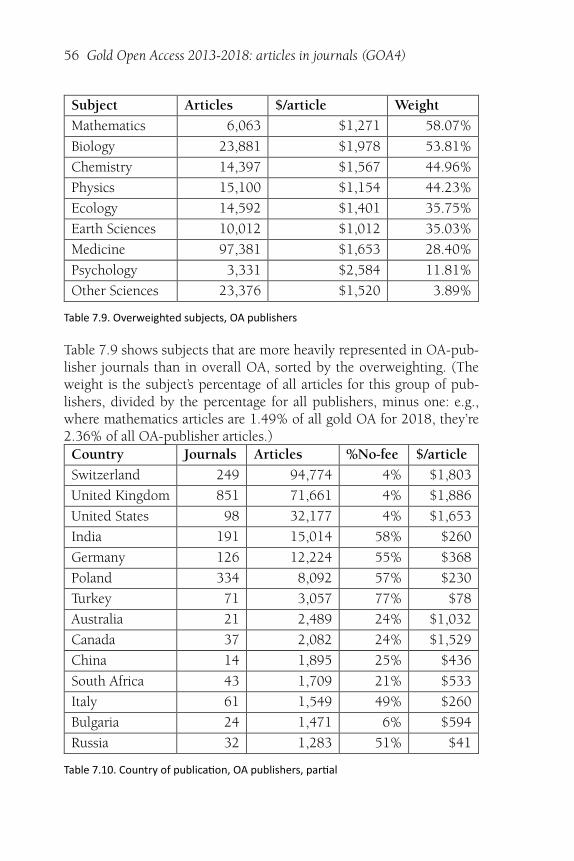
Table 7.9 shows subjects that are more heavily represented in OA-pub-lisher journals than in overall OA, sorted by the overweighting. (Theweight is the subject’s percentage of all articles for this group of pub-lishers, divided by the percentage for all publishers, minus one: e.g.,where mathematics articles are 1.49% of all gold OA for 2018, they’re2.36% of all OA-publisher articles.)Country Journals Articles %No-fee $/article
Switzerland 249 94,774 4% $1,803
United Kingdom 851 71,661 4% $1,886
United States 98 32,177 4% $1,653
India 191 15,014 58% $260
Germany 126 12,224 55% $368
Poland 334 8,092 57% $230
Turkey 71 3,057 77% $78
Australia 21 2,489 24% $1,032
Canada 37 2,082 24% $1,529
China 14 1,895 25% $436
South Africa 43 1,709 21% $533
Italy 61 1,549 49% $260
Bulgaria 24 1,471 6% $594
Russia 32 1,283 51% $41
Table 7.10. Country of publica�on, OA publishers, par�al
7. Publisher Category 57
Finally, Table 7.10 shows the countries with more than 1,200 articles in2018 (out of 58 countries represented in OA-publisher journals).
Universi�es, Colleges and Ins�tutes
Note that this category does not include university-sponsored journalsfrom OA and traditional publishers.
Jrn. Art. Art% Rel% $/Art Rel%
All 7,040 228,792 $130 -86%
Fee 1,056 57,725 25% -57% $515 -67%
No-fee 5,984 171,067 75% 79%
Biomed 887 45,946 20% -43% $385 -70%
Fee 199 18,659 41% -42% $947 -49%
No-fee 688 27,287 59% 99%
STEM 1,646 61,432 27% -34% $154 -85%
Fee 385 20,896 34% -51% $454 -70%
No-fee 1,261 40,536 66% 112%
H&SS 4,507 121,414 53% 123% $21 -83%
Fee 472 18,170 15% -32% $141 -75%
No-fee 4,035 103,244 85% 9%
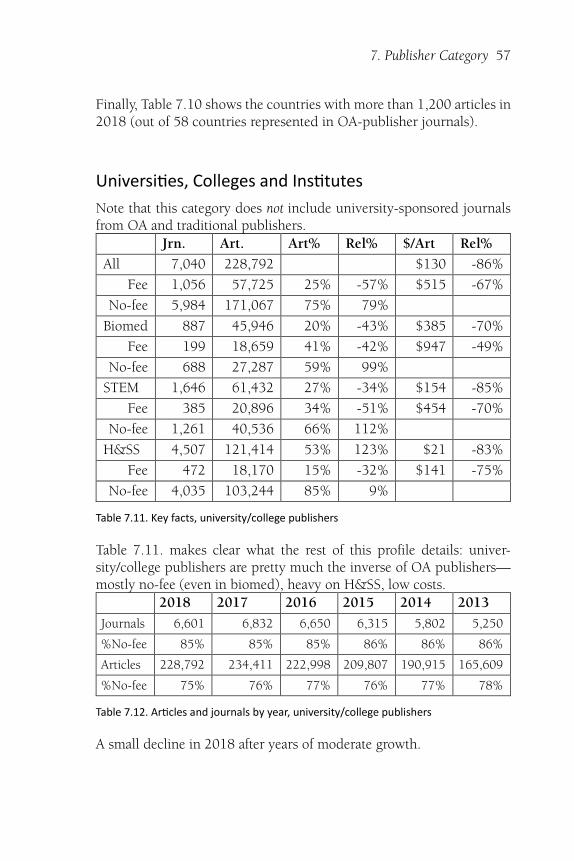
Table 7.11. Key facts, university/college publishers
Table 7.11. makes clear what the rest of this profile details: univer-sity/college publishers are pretty much the inverse of OA publishers—mostly no-fee (even in biomed), heavy on H&SS, low costs.
2018 2017 2016 2015 2014 2013
Journals 6,601 6,832 6,650 6,315 5,802 5,250
%No-fee 85% 85% 85% 86% 86% 86%
Articles 228,792 234,411 222,998 209,807 190,915 165,609
%No-fee 75% 76% 77% 76% 77% 78%
Table 7.12. Ar�cles and journals by year, university/college publishers
A small decline in 2018 after years of moderate growth.
58 Gold Open Access 2013-2018: articles in journals (GOA4)
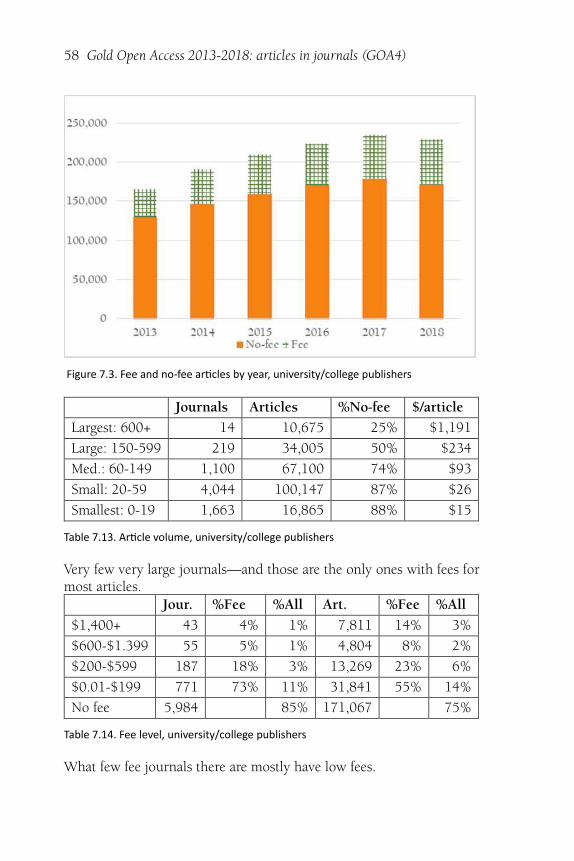
Figure 7.3. Fee and no-fee ar�cles by year, university/college publishers
Journals Articles %No-fee $/article
Largest: 600+ 14 10,675 25% $1,191
Large: 150-599 219 34,005 50% $234
Med.: 60-149 1,100 67,100 74% $93
Small: 20-59 4,044 100,147 87% $26
Smallest: 0-19 1,663 16,865 88% $15
Table 7.13. Ar�cle volume, university/college publishers
Very few very large journals—and those are the only ones with fees formost articles.
Jour. %Fee %All Art. %Fee %All
$1,400+ 43 4% 1% 7,811 14% 3%
$600-$1.399 55 5% 1% 4,804 8% 2%
$200-$599 187 18% 3% 13,269 23% 6%
$0.01-$199 771 73% 11% 31,841 55% 14%
No fee 5,984 85% 171,067 75%
Table 7.14. Fee level, university/college publishers
What few fee journals there are mostly have low fees.
7. Publisher Category 59
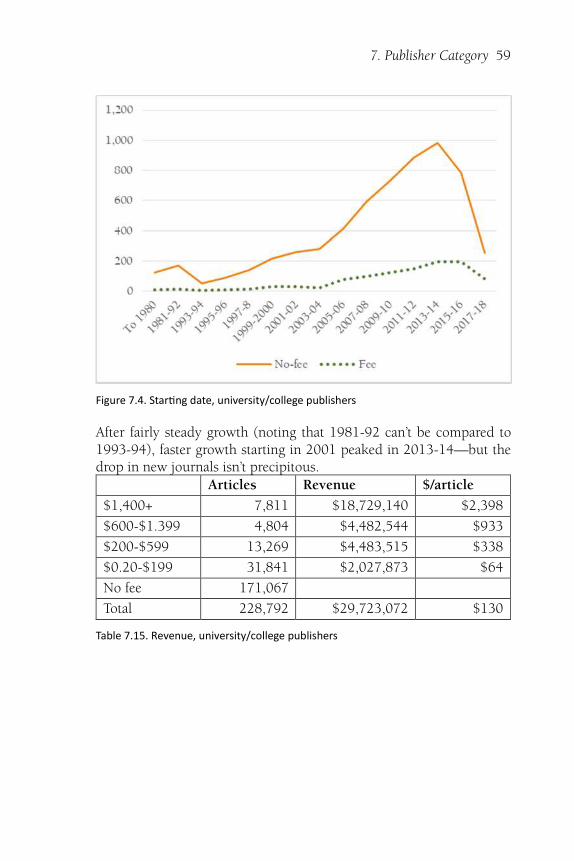
Figure 7.4. Star�ng date, university/college publishers
After fairly steady growth (noting that 1981-92 can’t be compared to1993-94), faster growth starting in 2001 peaked in 2013-14—but thedrop in new journals isn’t precipitous.
Articles Revenue $/article
$1,400+ 7,811 $18,729,140 $2,398
$600-$1.399 4,804 $4,482,544 $933
$200-$599 13,269 $4,483,515 $338
$0.20-$199 31,841 $2,027,873 $64
No fee 171,067
Total 228,792 $29,723,072 $130
Table 7.15. Revenue, university/college publishers
60 Gold Open Access 2013-2018: articles in journals (GOA4)
Region Journals Articles %No-fee $/article
Latin America 1,956 67,061 90% $31
Eastern Europe 1,225 47,660 71% $44
Western Europe 1,299 41,883 68% $453
Asia 1,488 34,974 59% $58
Middle East 616 23,409 76% $34
Pacific/English 387 10,860 75% $322
Africa 69 2,945 66% $82
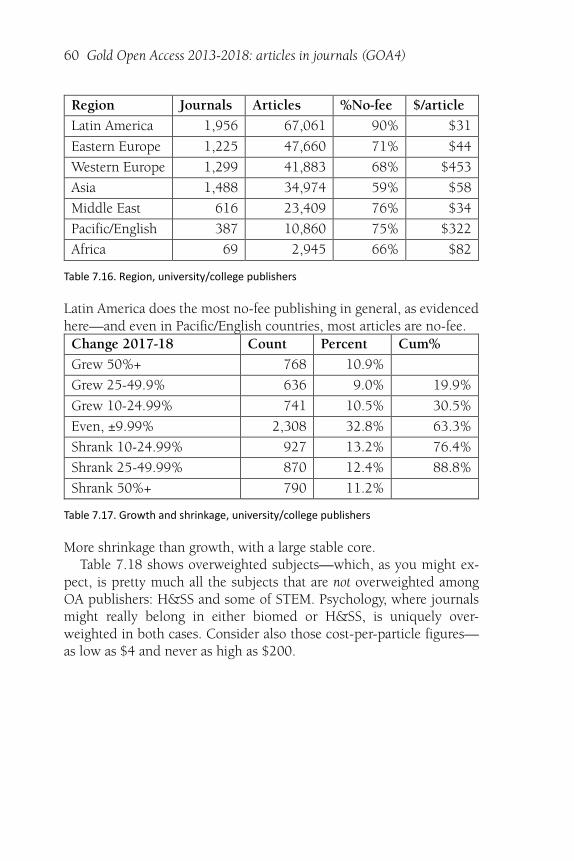
Table 7.16. Region, university/college publishers
Latin America does the most no-fee publishing in general, as evidencedhere—and even in Pacific/English countries, most articles are no-fee.Change 2017-18 Count Percent Cum%
Grew 50%+ 768 10.9%
Grew 25-49.9% 636 9.0% 19.9%
Grew 10-24.99% 741 10.5% 30.5%
Even, ±9.99% 2,308 32.8% 63.3%
Shrank 10-24.99% 927 13.2% 76.4%
Shrank 25-49.99% 870 12.4% 88.8%
Shrank 50%+ 790 11.2%
Table 7.17. Growth and shrinkage, university/college publishers
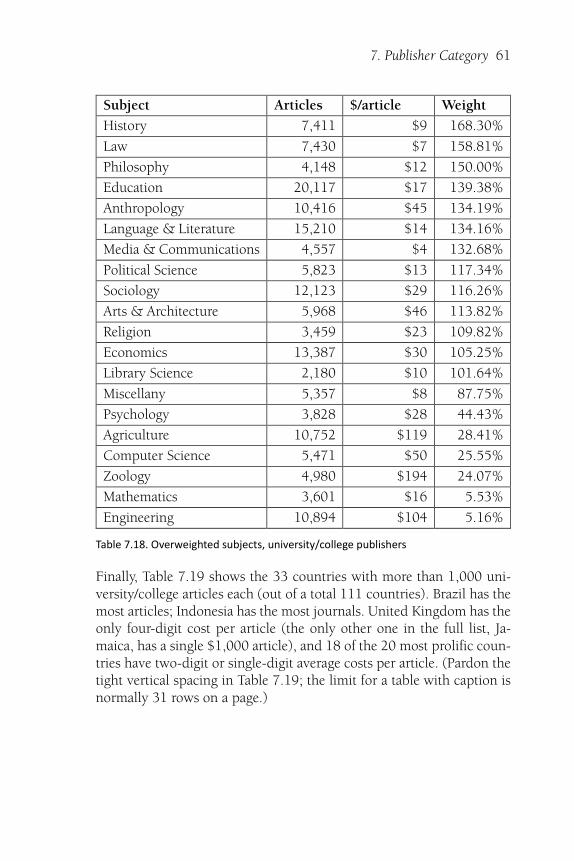
More shrinkage than growth, with a large stable core.Table 7.18 shows overweighted subjects—which, as you might ex-
pect, is pretty much all the subjects that are not overweighted amongOA publishers: H&SS and some of STEM. Psychology, where journalsmight really belong in either biomed or H&SS, is uniquely over-weighted in both cases. Consider also those cost-per-particle figures—as low as $4 and never as high as $200.
7. Publisher Category 61
Subject Articles $/article Weight
History 7,411 $9 168.30%
Law 7,430 $7 158.81%
Philosophy 4,148 $12 150.00%
Education 20,117 $17 139.38%
Anthropology 10,416 $45 134.19%
Language & Literature 15,210 $14 134.16%
Media & Communications 4,557 $4 132.68%
Political Science 5,823 $13 117.34%
Sociology 12,123 $29 116.26%
Arts & Architecture 5,968 $46 113.82%
Religion 3,459 $23 109.82%
Economics 13,387 $30 105.25%
Library Science 2,180 $10 101.64%
Miscellany 5,357 $8 87.75%
Psychology 3,828 $28 44.43%
Agriculture 10,752 $119 28.41%
Computer Science 5,471 $50 25.55%
Zoology 4,980 $194 24.07%
Mathematics 3,601 $16 5.53%
Engineering 10,894 $104 5.16%
Table 7.18. Overweighted subjects, university/college publishers
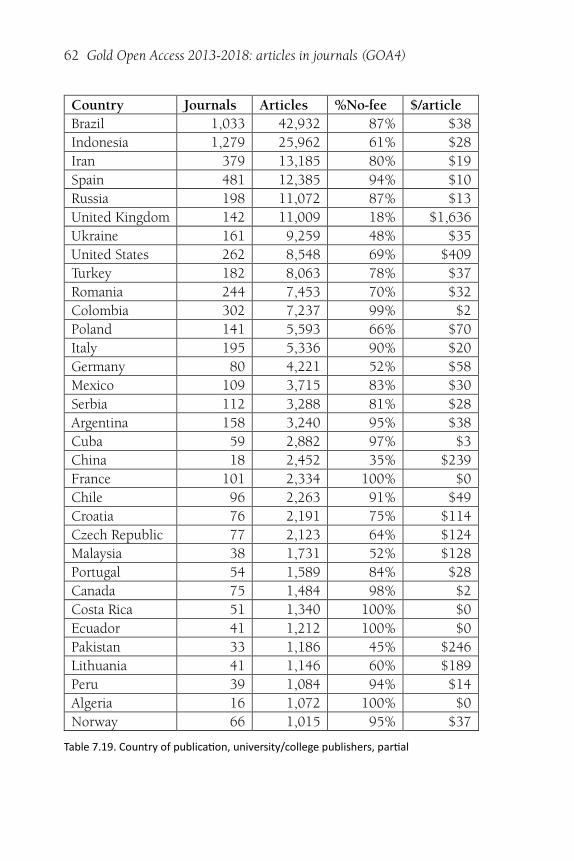
Finally, Table 7.19 shows the 33 countries with more than 1,000 uni-versity/college articles each (out of a total 111 countries). Brazil has themost articles; Indonesia has the most journals. United Kingdom has theonly four-digit cost per article (the only other one in the full list, Ja-maica, has a single $1,000 article), and 18 of the 20 most prolific coun-tries have two-digit or single-digit average costs per article. (Pardon thetight vertical spacing in Table 7.19; the limit for a table with caption isnormally 31 rows on a page.)
62 Gold Open Access 2013-2018: articles in journals (GOA4)
Country Journals Articles %No-fee $/article
Brazil 1,033 42,932 87% $38
Indonesia 1,279 25,962 61% $28
Iran 379 13,185 80% $19
Spain 481 12,385 94% $10
Russia 198 11,072 87% $13
United Kingdom 142 11,009 18% $1,636
Ukraine 161 9,259 48% $35
United States 262 8,548 69% $409
Turkey 182 8,063 78% $37
Romania 244 7,453 70% $32
Colombia 302 7,237 99% $2
Poland 141 5,593 66% $70
Italy 195 5,336 90% $20
Germany 80 4,221 52% $58
Mexico 109 3,715 83% $30
Serbia 112 3,288 81% $28
Argentina 158 3,240 95% $38
Cuba 59 2,882 97% $3
China 18 2,452 35% $239
France 101 2,334 100% $0
Chile 96 2,263 91% $49
Croatia 76 2,191 75% $114
Czech Republic 77 2,123 64% $124
Malaysia 38 1,731 52% $128
Portugal 54 1,589 84% $28
Canada 75 1,484 98% $2
Costa Rica 51 1,340 100% $0
Ecuador 41 1,212 100% $0
Pakistan 33 1,186 45% $246
Lithuania 41 1,146 60% $189
Peru 39 1,084 94% $14
Algeria 16 1,072 100% $0
Norway 66 1,015 95% $37
Table 7.19. Country of publica�on, university/college publishers, par�al
7. Publisher Category 63
Tradi�onal Publishers
Jrn. Art. Art% Rel% $/Art Rel%
All 1,015 124,341 $1,437 58%
Fee 672 84,913 68% 17% $2,105 34%
No-fee 343 39,428 32% -24%
Biomed 586 51,873 42% 17% $1,668 29%
Fee 423 39,603 76% 9% $2,185 18%
No-fee 163 12,270 24% -21%
STEM 286 66,794 54% 32% $1,330 28%
Fee 193 42,147 63% -8% $2,108 40%
No-fee 93 24,647 37% 18%
H&SS 143 5,674 5% -81% $583 374%
Fee 56 3,163 56% 153% $1,045 87%
No-fee 87 2,511 44% -43%
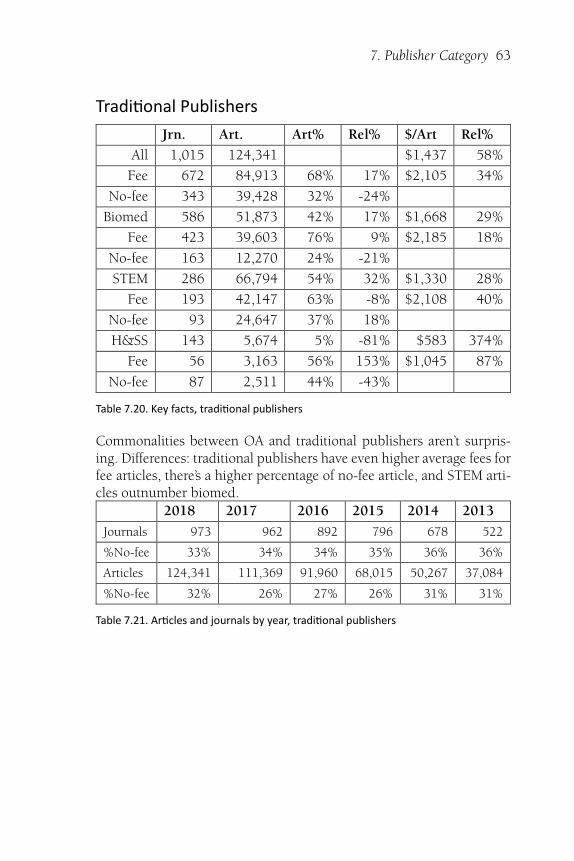
Table 7.20. Key facts, tradi�onal publishers
Commonalities between OA and traditional publishers aren’t surpris-ing. Differences: traditional publishers have even higher average fees forfee articles, there’s a higher percentage of no-fee article, and STEM arti-cles outnumber biomed.
2018 2017 2016 2015 2014 2013
Journals 973 962 892 796 678 522
%No-fee 33% 34% 34% 35% 36% 36%
Articles 124,341 111,369 91,960 68,015 50,267 37,084
%No-fee 32% 26% 27% 26% 31% 31%
Table 7.21. Ar�cles and journals by year, tradi�onal publishers
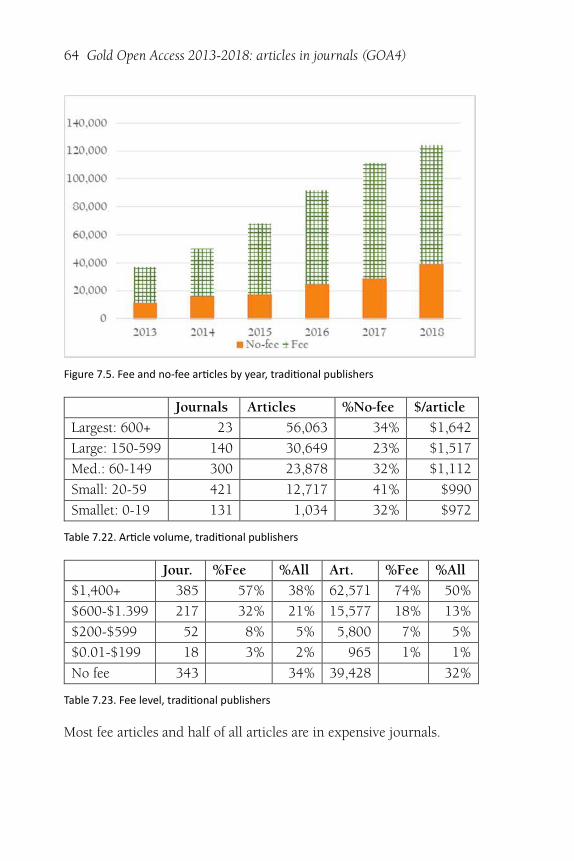
64 Gold Open Access 2013-2018: articles in journals (GOA4)
Figure 7.5. Fee and no-fee ar�cles by year, tradi�onal publishers
Journals Articles %No-fee $/article
Largest: 600+ 23 56,063 34% $1,642
Large: 150-599 140 30,649 23% $1,517
Med.: 60-149 300 23,878 32% $1,112
Small: 20-59 421 12,717 41% $990
Smallet: 0-19 131 1,034 32% $972
Table 7.22. Ar�cle volume, tradi�onal publishers
Jour. %Fee %All Art. %Fee %All
$1,400+ 385 57% 38% 62,571 74% 50%
$600-$1.399 217 32% 21% 15,577 18% 13%
$200-$599 52 8% 5% 5,800 7% 5%
$0.01-$199 18 3% 2% 965 1% 1%
No fee 343 34% 39,428 32%
Table 7.23. Fee level, tradi�onal publishers
Most fee articles and half of all articles are in expensive journals.
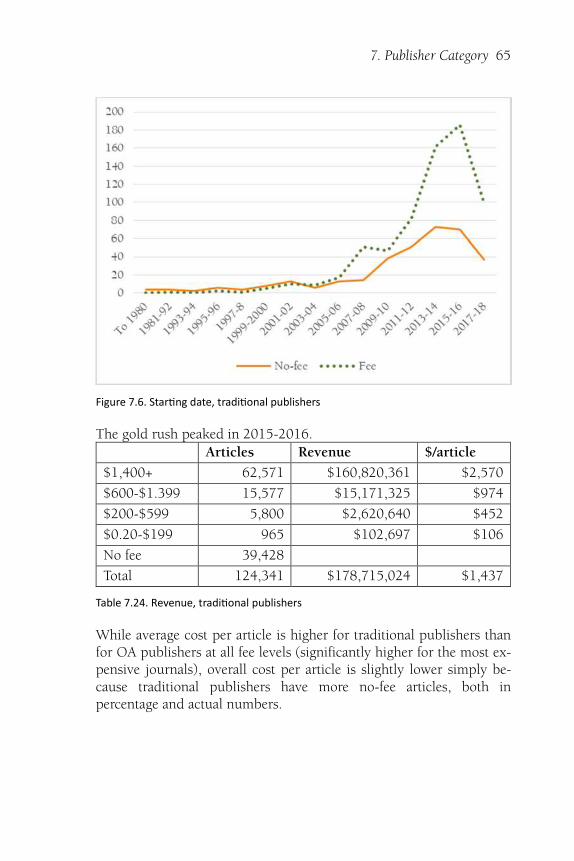
7. Publisher Category 65
Figure 7.6. Star�ng date, tradi�onal publishers
The gold rush peaked in 2015-2016.Articles Revenue $/article
$1,400+ 62,571 $160,820,361 $2,570
$600-$1.399 15,577 $15,171,325 $974
$200-$599 5,800 $2,620,640 $452
$0.20-$199 965 $102,697 $106
No fee 39,428
Total 124,341 $178,715,024 $1,437
Table 7.24. Revenue, tradi�onal publishers
While average cost per article is higher for traditional publishers thanfor OA publishers at all fee levels (significantly higher for the most ex-pensive journals), overall cost per article is slightly lower simply be-cause traditional publishers have more no-fee articles, both inpercentage and actual numbers.
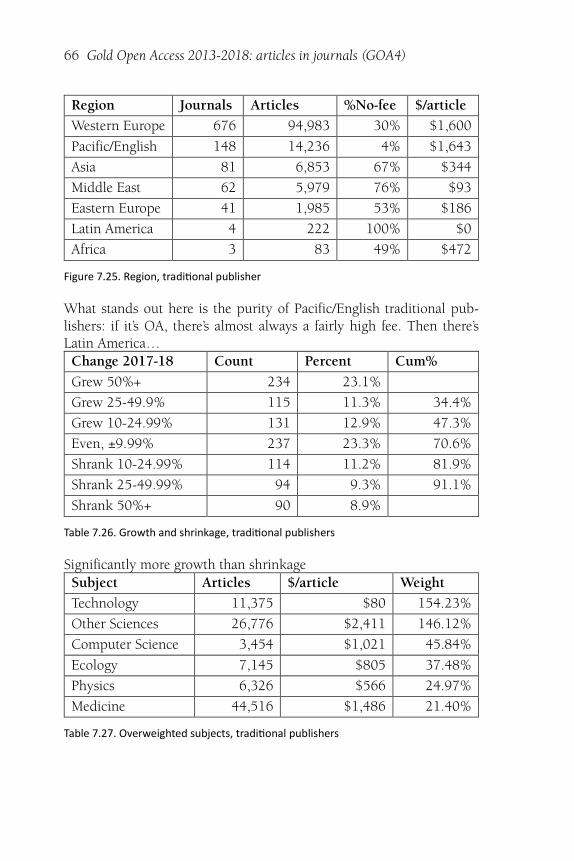
66 Gold Open Access 2013-2018: articles in journals (GOA4)
Region Journals Articles %No-fee $/article
Western Europe 676 94,983 30% $1,600
Pacific/English 148 14,236 4% $1,643
Asia 81 6,853 67% $344
Middle East 62 5,979 76% $93
Eastern Europe 41 1,985 53% $186
Latin America 4 222 100% $0
Africa 3 83 49% $472
Figure 7.25. Region, tradi�onal publisher
What stands out here is the purity of Pacific/English traditional pub-lishers: if it’s OA, there’s almost always a fairly high fee. Then there’sLatin America…Change 2017-18 Count Percent Cum%
Grew 50%+ 234 23.1%
Grew 25-49.9% 115 11.3% 34.4%
Grew 10-24.99% 131 12.9% 47.3%
Even, ±9.99% 237 23.3% 70.6%
Shrank 10-24.99% 114 11.2% 81.9%
Shrank 25-49.99% 94 9.3% 91.1%
Shrank 50%+ 90 8.9%
Table 7.26. Growth and shrinkage, tradi�onal publishers
Significantly more growth than shrinkageSubject Articles $/article Weight
Technology 11,375 $80 154.23%
Other Sciences 26,776 $2,411 146.12%
Computer Science 3,454 $1,021 45.84%
Ecology 7,145 $805 37.48%
Physics 6,326 $566 24.97%
Medicine 44,516 $1,486 21.40%
Table 7.27. Overweighted subjects, tradi�onal publishers
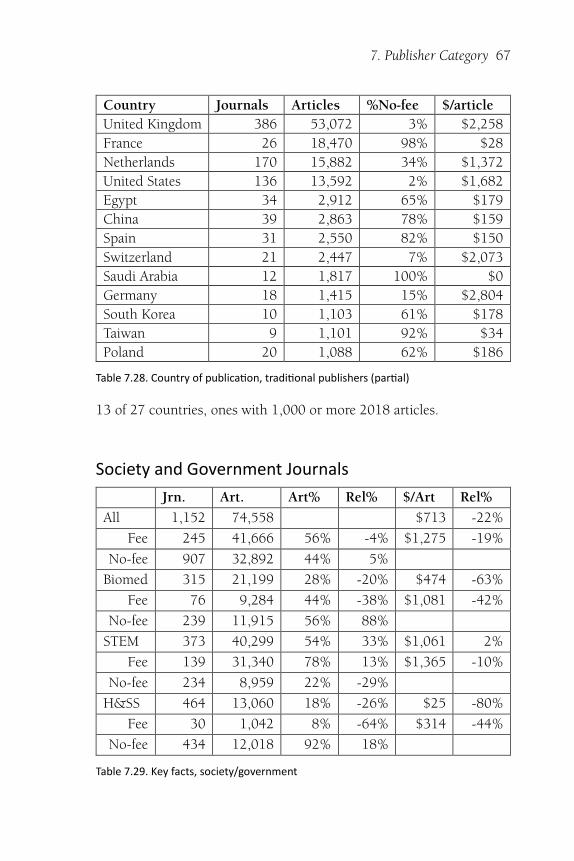
7. Publisher Category 67
Country Journals Articles %No-fee $/article
United Kingdom 386 53,072 3% $2,258
France 26 18,470 98% $28
Netherlands 170 15,882 34% $1,372
United States 136 13,592 2% $1,682
Egypt 34 2,912 65% $179
China 39 2,863 78% $159
Spain 31 2,550 82% $150
Switzerland 21 2,447 7% $2,073
Saudi Arabia 12 1,817 100% $0
Germany 18 1,415 15% $2,804
South Korea 10 1,103 61% $178
Taiwan 9 1,101 92% $34
Poland 20 1,088 62% $186
Table 7.28. Country of publica�on, tradi�onal publishers (par�al)
13 of 27 countries, ones with 1,000 or more 2018 articles.
Society and Government Journals
Jrn. Art. Art% Rel% $/Art Rel%
All 1,152 74,558 $713 -22%
Fee 245 41,666 56% -4% $1,275 -19%
No-fee 907 32,892 44% 5%
Biomed 315 21,199 28% -20% $474 -63%
Fee 76 9,284 44% -38% $1,081 -42%
No-fee 239 11,915 56% 88%
STEM 373 40,299 54% 33% $1,061 2%
Fee 139 31,340 78% 13% $1,365 -10%
No-fee 234 8,959 22% -29%
H&SS 464 13,060 18% -26% $25 -80%
Fee 30 1,042 8% -64% $314 -44%
No-fee 434 12,018 92% 18%
Table 7.29. Key facts, society/government
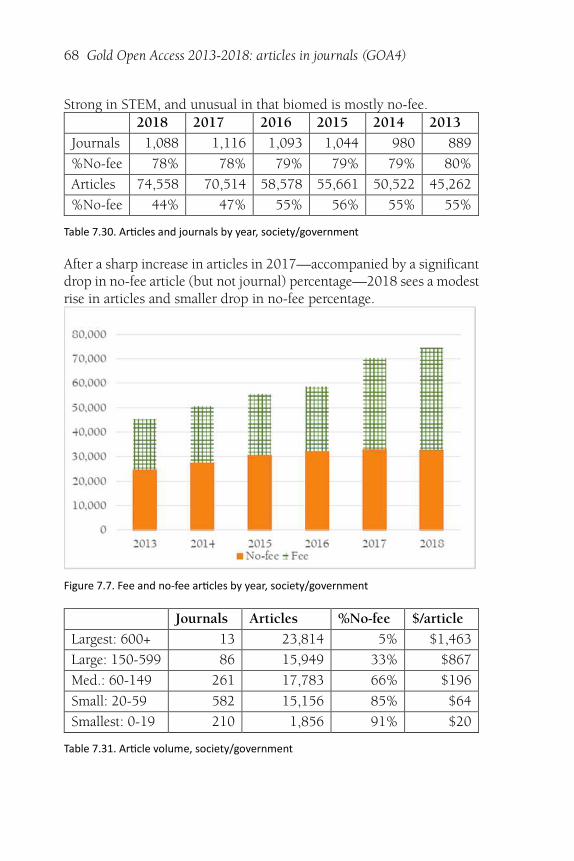
68 Gold Open Access 2013-2018: articles in journals (GOA4)
Strong in STEM, and unusual in that biomed is mostly no-fee.2018 2017 2016 2015 2014 2013
Journals 1,088 1,116 1,093 1,044 980 889
%No-fee 78% 78% 79% 79% 79% 80%
Articles 74,558 70,514 58,578 55,661 50,522 45,262
%No-fee 44% 47% 55% 56% 55% 55%
Table 7.30. Ar�cles and journals by year, society/government
After a sharp increase in articles in 2017—accompanied by a significantdrop in no-fee article (but not journal) percentage—2018 sees a modestrise in articles and smaller drop in no-fee percentage.
Figure 7.7. Fee and no-fee ar�cles by year, society/government
Journals Articles %No-fee $/article
Largest: 600+ 13 23,814 5% $1,463
Large: 150-599 86 15,949 33% $867
Med.: 60-149 261 17,783 66% $196
Small: 20-59 582 15,156 85% $64
Smallest: 0-19 210 1,856 91% $20
Table 7.31. Ar�cle volume, society/government
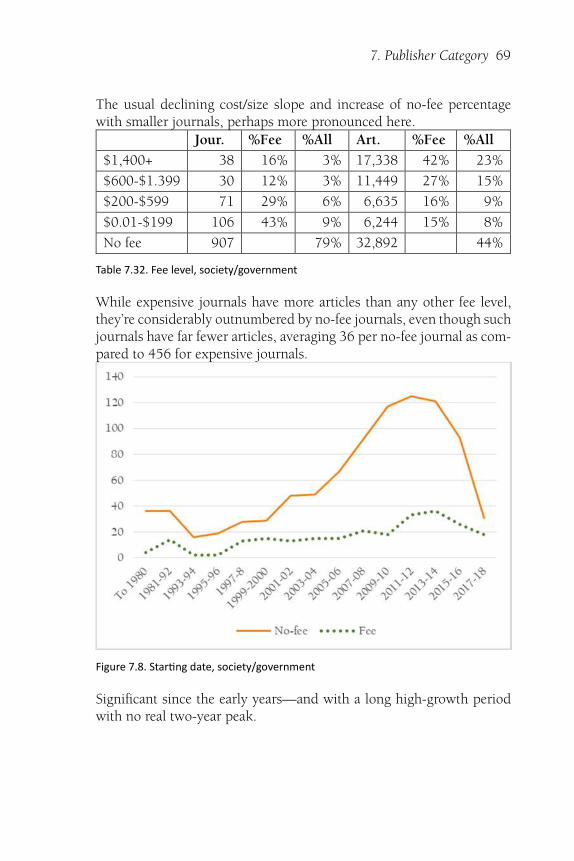
7. Publisher Category 69
The usual declining cost/size slope and increase of no-fee percentagewith smaller journals, perhaps more pronounced here.
Jour. %Fee %All Art. %Fee %All
$1,400+ 38 16% 3% 17,338 42% 23%
$600-$1.399 30 12% 3% 11,449 27% 15%
$200-$599 71 29% 6% 6,635 16% 9%
$0.01-$199 106 43% 9% 6,244 15% 8%
No fee 907 79% 32,892 44%
Table 7.32. Fee level, society/government
While expensive journals have more articles than any other fee level,they’re considerably outnumbered by no-fee journals, even though suchjournals have far fewer articles, averaging 36 per no-fee journal as com-pared to 456 for expensive journals.
Figure 7.8. Star�ng date, society/government
Significant since the early years—and with a long high-growth periodwith no real two-year peak.
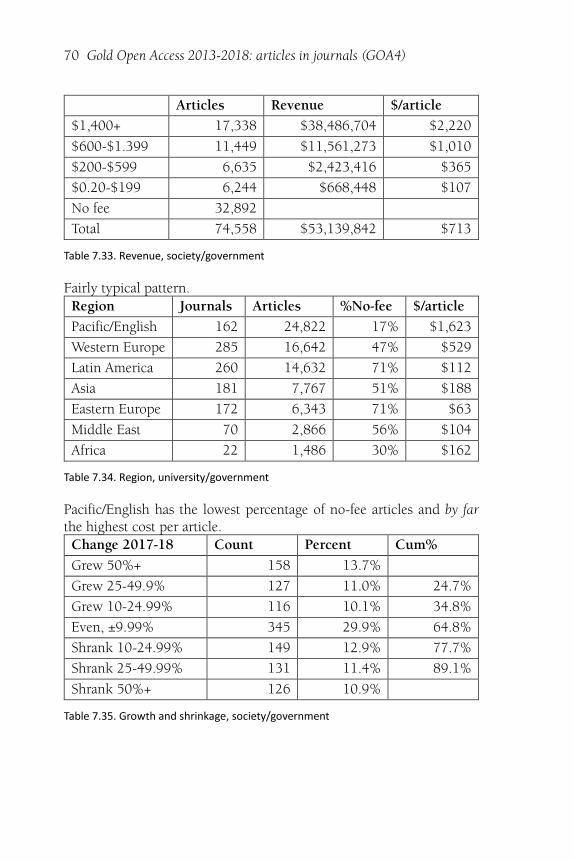
70 Gold Open Access 2013-2018: articles in journals (GOA4)
Articles Revenue $/article
$1,400+ 17,338 $38,486,704 $2,220
$600-$1.399 11,449 $11,561,273 $1,010
$200-$599 6,635 $2,423,416 $365
$0.20-$199 6,244 $668,448 $107
No fee 32,892
Total 74,558 $53,139,842 $713
Table 7.33. Revenue, society/government
Fairly typical pattern.Region Journals Articles %No-fee $/article
Pacific/English 162 24,822 17% $1,623
Western Europe 285 16,642 47% $529
Latin America 260 14,632 71% $112
Asia 181 7,767 51% $188
Eastern Europe 172 6,343 71% $63
Middle East 70 2,866 56% $104
Africa 22 1,486 30% $162
Table 7.34. Region, university/government
Pacific/English has the lowest percentage of no-fee articles and by farthe highest cost per article.Change 2017-18 Count Percent Cum%
Grew 50%+ 158 13.7%
Grew 25-49.9% 127 11.0% 24.7%
Grew 10-24.99% 116 10.1% 34.8%
Even, ±9.99% 345 29.9% 64.8%
Shrank 10-24.99% 149 12.9% 77.7%
Shrank 25-49.99% 131 11.4% 89.1%
Shrank 50%+ 126 10.9%
Table 7.35. Growth and shrinkage, society/government
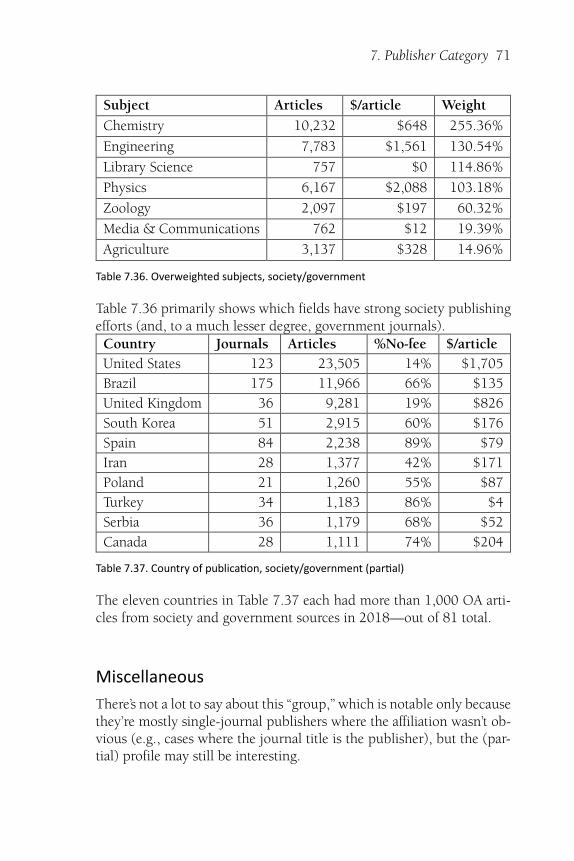
7. Publisher Category 71
Subject Articles $/article Weight
Chemistry 10,232 $648 255.36%
Engineering 7,783 $1,561 130.54%
Library Science 757 $0 114.86%
Physics 6,167 $2,088 103.18%
Zoology 2,097 $197 60.32%
Media & Communications 762 $12 19.39%
Agriculture 3,137 $328 14.96%
Table 7.36. Overweighted subjects, society/government
Table 7.36 primarily shows which fields have strong society publishingefforts (and, to a much lesser degree, government journals).Country Journals Articles %No-fee $/article
United States 123 23,505 14% $1,705
Brazil 175 11,966 66% $135
United Kingdom 36 9,281 19% $826
South Korea 51 2,915 60% $176
Spain 84 2,238 89% $79
Iran 28 1,377 42% $171
Poland 21 1,260 55% $87
Turkey 34 1,183 86% $4
Serbia 36 1,179 68% $52
Canada 28 1,111 74% $204
Table 7.37. Country of publica�on, society/government (par�al)
The eleven countries in Table 7.37 each had more than 1,000 OA arti-cles from society and government sources in 2018—out of 81 total.
Miscellaneous
There’s not a lot to say about this “group,” which is notable only becausethey’re mostly single-journal publishers where the affiliation wasn’t ob-vious (e.g., cases where the journal title is the publisher), but the (par-tial) profile may still be interesting.
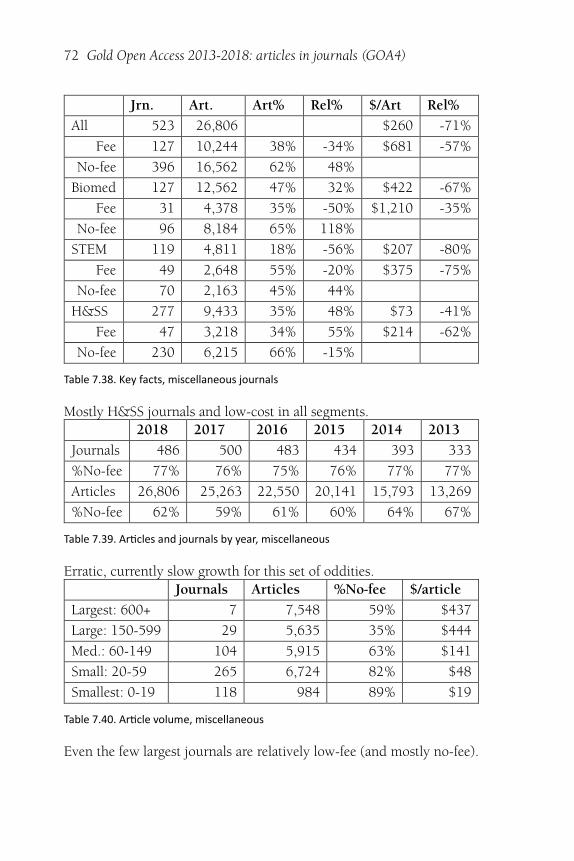
72 Gold Open Access 2013-2018: articles in journals (GOA4)
Jrn. Art. Art% Rel% $/Art Rel%
All 523 26,806 $260 -71%
Fee 127 10,244 38% -34% $681 -57%
No-fee 396 16,562 62% 48%
Biomed 127 12,562 47% 32% $422 -67%
Fee 31 4,378 35% -50% $1,210 -35%
No-fee 96 8,184 65% 118%
STEM 119 4,811 18% -56% $207 -80%
Fee 49 2,648 55% -20% $375 -75%
No-fee 70 2,163 45% 44%
H&SS 277 9,433 35% 48% $73 -41%
Fee 47 3,218 34% 55% $214 -62%
No-fee 230 6,215 66% -15%
Table 7.38. Key facts, miscellaneous journals
Mostly H&SS journals and low-cost in all segments.2018 2017 2016 2015 2014 2013
Journals 486 500 483 434 393 333
%No-fee 77% 76% 75% 76% 77% 77%
Articles 26,806 25,263 22,550 20,141 15,793 13,269
%No-fee 62% 59% 61% 60% 64% 67%
Table 7.39. Ar�cles and journals by year, miscellaneous
Erratic, currently slow growth for this set of oddities.Journals Articles %No-fee $/article
Largest: 600+ 7 7,548 59% $437
Large: 150-599 29 5,635 35% $444
Med.: 60-149 104 5,915 63% $141
Small: 20-59 265 6,724 82% $48
Smallest: 0-19 118 984 89% $19
Table 7.40. Ar�cle volume, miscellaneous
Even the few largest journals are relatively low-fee (and mostly no-fee).
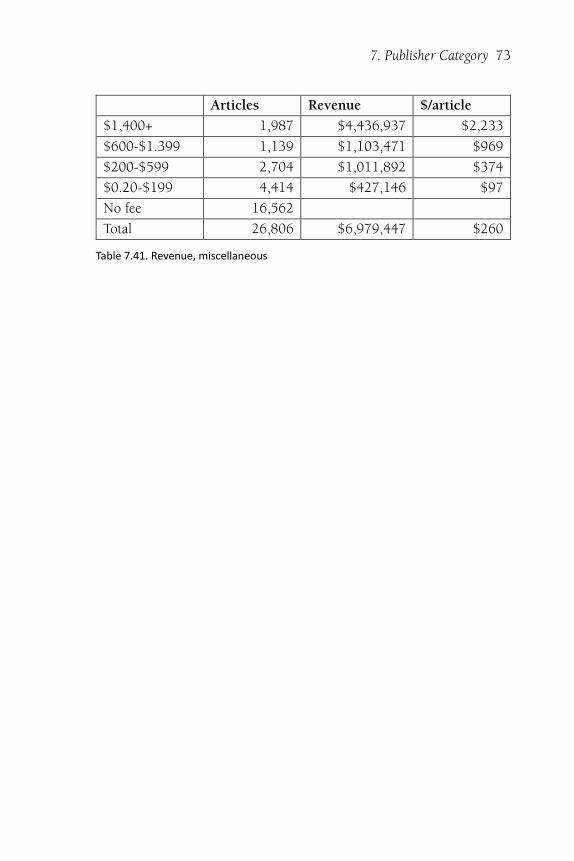
7. Publisher Category 73
Articles Revenue $/article
$1,400+ 1,987 $4,436,937 $2,233
$600-$1.399 1,139 $1,103,471 $969
$200-$599 2,704 $1,011,892 $374
$0.20-$199 4,414 $427,146 $97
No fee 16,562
Total 26,806 $6,979,447 $260
Table 7.41. Revenue, miscellaneous
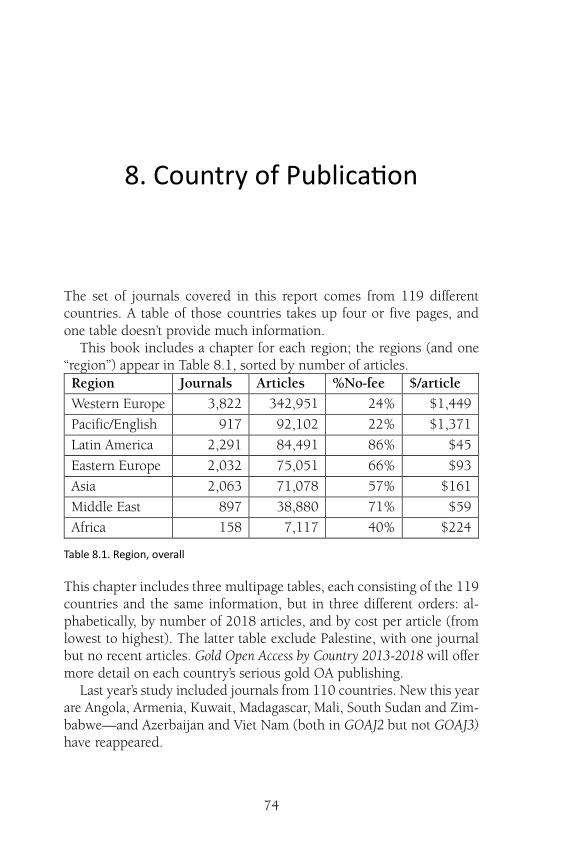
74
8. Country of Publica�on
The set of journals covered in this report comes from 119 differentcountries. A table of those countries takes up four or five pages, andone table doesn’t provide much information.
This book includes a chapter for each region; the regions (and one“region”) appear in Table 8.1, sorted by number of articles.Region Journals Articles %No-fee $/article
Western Europe 3,822 342,951 24% $1,449
Pacific/English 917 92,102 22% $1,371
Latin America 2,291 84,491 86% $45
Eastern Europe 2,032 75,051 66% $93
Asia 2,063 71,078 57% $161
Middle East 897 38,880 71% $59
Africa 158 7,117 40% $224
Table 8.1. Region, overall
This chapter includes three multipage tables, each consisting of the 119countries and the same information, but in three different orders: al-phabetically, by number of 2018 articles, and by cost per article (fromlowest to highest). The latter table exclude Palestine, with one journalbut no recent articles. Gold Open Access by Country 2013-2018 will offermore detail on each country’s serious gold OA publishing.
Last year’s study included journals from 110 countries. New this yearare Angola, Armenia, Kuwait, Madagascar, Mali, South Sudan and Zim-babwe—and Azerbaijan and Viet Nam (both in GOAJ2 but not GOAJ3)have reappeared.
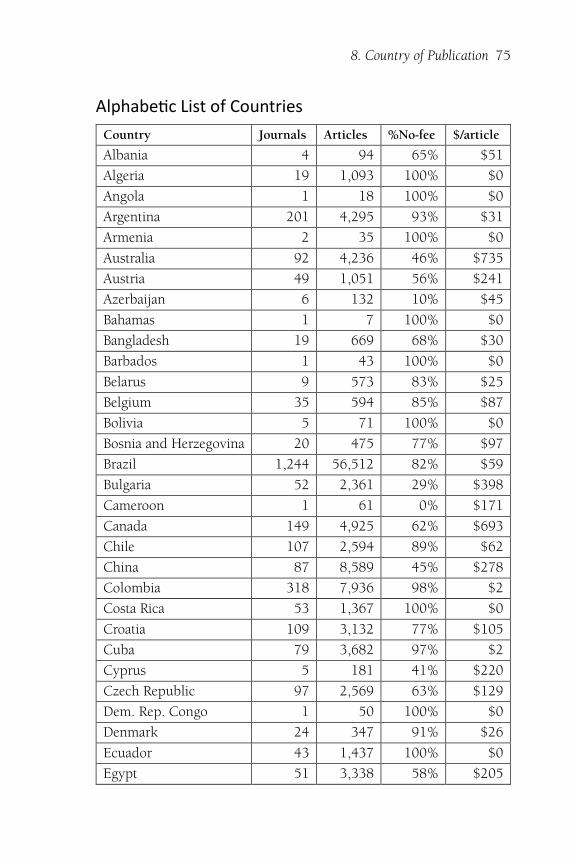
8. Country of Publication 75
Alphabe�c List of Countries
Country Journals Articles %No-fee $/article
Albania 4 94 65% $51
Algeria 19 1,093 100% $0
Angola 1 18 100% $0
Argentina 201 4,295 93% $31
Armenia 2 35 100% $0
Australia 92 4,236 46% $735
Austria 49 1,051 56% $241
Azerbaijan 6 132 10% $45
Bahamas 1 7 100% $0
Bangladesh 19 669 68% $30
Barbados 1 43 100% $0
Belarus 9 573 83% $25
Belgium 35 594 85% $87
Bolivia 5 71 100% $0
Bosnia and Herzegovina 20 475 77% $97
Brazil 1,244 56,512 82% $59
Bulgaria 52 2,361 29% $398
Cameroon 1 61 0% $171
Canada 149 4,925 62% $693
Chile 107 2,594 89% $62
China 87 8,589 45% $278
Colombia 318 7,936 98% $2
Costa Rica 53 1,367 100% $0
Croatia 109 3,132 77% $105
Cuba 79 3,682 97% $2
Cyprus 5 181 41% $220
Czech Republic 97 2,569 63% $129
Dem. Rep. Congo 1 50 100% $0
Denmark 24 347 91% $26
Ecuador 43 1,437 100% $0
Egypt 51 3,338 58% $205
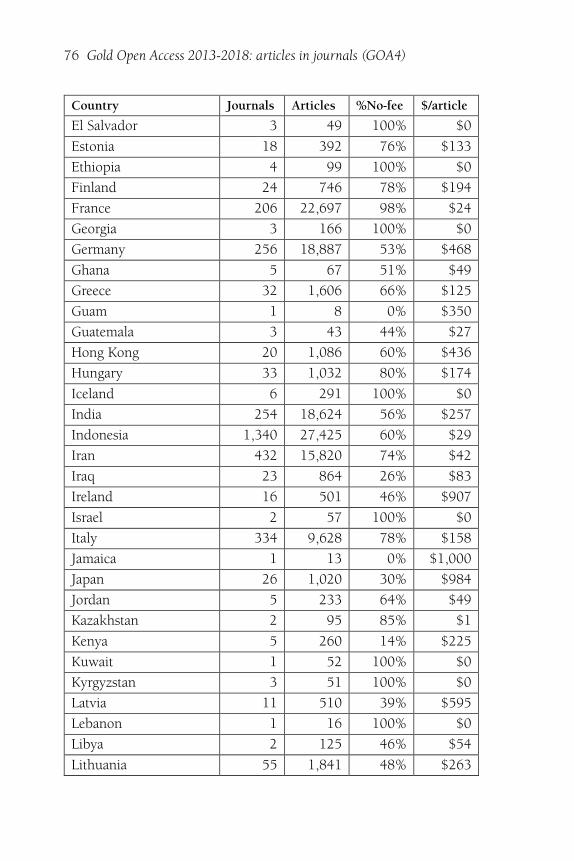
76 Gold Open Access 2013-2018: articles in journals (GOA4)
Country Journals Articles %No-fee $/article
El Salvador 3 49 100% $0
Estonia 18 392 76% $133
Ethiopia 4 99 100% $0
Finland 24 746 78% $194
France 206 22,697 98% $24
Georgia 3 166 100% $0
Germany 256 18,887 53% $468
Ghana 5 67 51% $49
Greece 32 1,606 66% $125
Guam 1 8 0% $350
Guatemala 3 43 44% $27
Hong Kong 20 1,086 60% $436
Hungary 33 1,032 80% $174
Iceland 6 291 100% $0
India 254 18,624 56% $257
Indonesia 1,340 27,425 60% $29
Iran 432 15,820 74% $42
Iraq 23 864 26% $83
Ireland 16 501 46% $907
Israel 2 57 100% $0
Italy 334 9,628 78% $158
Jamaica 1 13 0% $1,000
Japan 26 1,020 30% $984
Jordan 5 233 64% $49
Kazakhstan 2 95 85% $1
Kenya 5 260 14% $225
Kuwait 1 52 100% $0
Kyrgyzstan 3 51 100% $0
Latvia 11 510 39% $595
Lebanon 1 16 100% $0
Libya 2 125 46% $54
Lithuania 55 1,841 48% $263
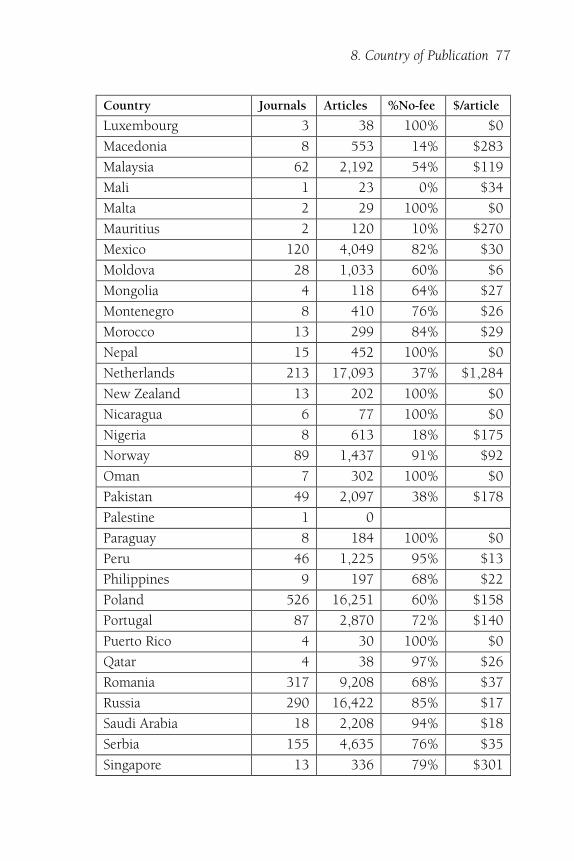
8. Country of Publication 77
Country Journals Articles %No-fee $/article
Luxembourg 3 38 100% $0
Macedonia 8 553 14% $283
Malaysia 62 2,192 54% $119
Mali 1 23 0% $34
Malta 2 29 100% $0
Mauritius 2 120 10% $270
Mexico 120 4,049 82% $30
Moldova 28 1,033 60% $6
Mongolia 4 118 64% $27
Montenegro 8 410 76% $26
Morocco 13 299 84% $29
Nepal 15 452 100% $0
Netherlands 213 17,093 37% $1,284
New Zealand 13 202 100% $0
Nicaragua 6 77 100% $0
Nigeria 8 613 18% $175
Norway 89 1,437 91% $92
Oman 7 302 100% $0
Pakistan 49 2,097 38% $178
Palestine 1 0
Paraguay 8 184 100% $0
Peru 46 1,225 95% $13
Philippines 9 197 68% $22
Poland 526 16,251 60% $158
Portugal 87 2,870 72% $140
Puerto Rico 4 30 100% $0
Qatar 4 38 97% $26
Romania 317 9,208 68% $37
Russia 290 16,422 85% $17
Saudi Arabia 18 2,208 94% $18
Serbia 155 4,635 76% $35
Singapore 13 336 79% $301
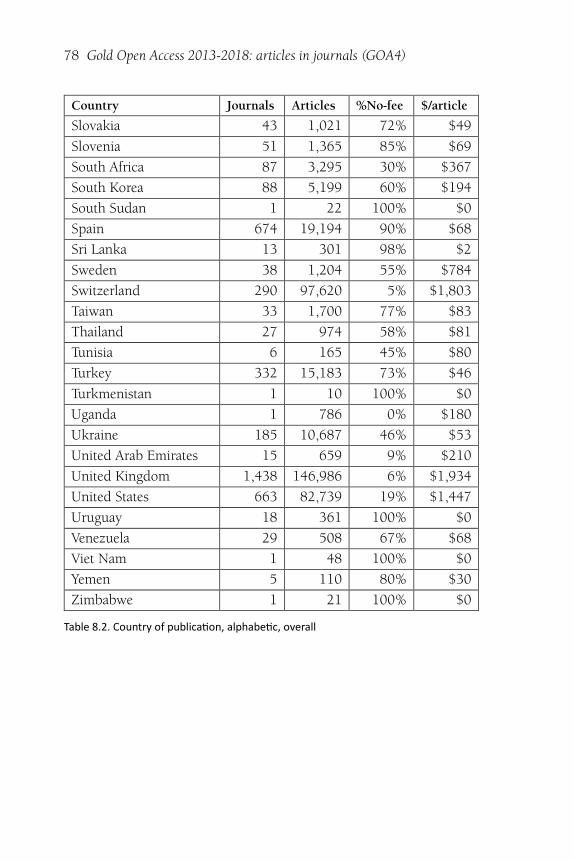
78 Gold Open Access 2013-2018: articles in journals (GOA4)
Country Journals Articles %No-fee $/article
Slovakia 43 1,021 72% $49
Slovenia 51 1,365 85% $69
South Africa 87 3,295 30% $367
South Korea 88 5,199 60% $194
South Sudan 1 22 100% $0
Spain 674 19,194 90% $68
Sri Lanka 13 301 98% $2
Sweden 38 1,204 55% $784
Switzerland 290 97,620 5% $1,803
Taiwan 33 1,700 77% $83
Thailand 27 974 58% $81
Tunisia 6 165 45% $80
Turkey 332 15,183 73% $46
Turkmenistan 1 10 100% $0
Uganda 1 786 0% $180
Ukraine 185 10,687 46% $53
United Arab Emirates 15 659 9% $210
United Kingdom 1,438 146,986 6% $1,934
United States 663 82,739 19% $1,447
Uruguay 18 361 100% $0
Venezuela 29 508 67% $68
Viet Nam 1 48 100% $0
Yemen 5 110 80% $30
Zimbabwe 1 21 100% $0
Table 8.2. Country of publica�on, alphabe�c, overall
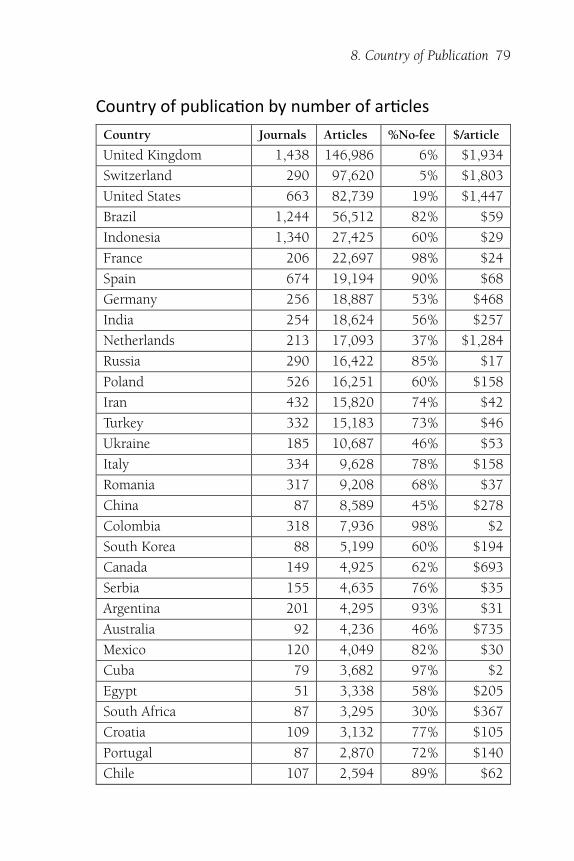
8. Country of Publication 79
Country of publica�on by number of ar�cles
Country Journals Articles %No-fee $/article
United Kingdom 1,438 146,986 6% $1,934
Switzerland 290 97,620 5% $1,803
United States 663 82,739 19% $1,447
Brazil 1,244 56,512 82% $59
Indonesia 1,340 27,425 60% $29
France 206 22,697 98% $24
Spain 674 19,194 90% $68
Germany 256 18,887 53% $468
India 254 18,624 56% $257
Netherlands 213 17,093 37% $1,284
Russia 290 16,422 85% $17
Poland 526 16,251 60% $158
Iran 432 15,820 74% $42
Turkey 332 15,183 73% $46
Ukraine 185 10,687 46% $53
Italy 334 9,628 78% $158
Romania 317 9,208 68% $37
China 87 8,589 45% $278
Colombia 318 7,936 98% $2
South Korea 88 5,199 60% $194
Canada 149 4,925 62% $693
Serbia 155 4,635 76% $35
Argentina 201 4,295 93% $31
Australia 92 4,236 46% $735
Mexico 120 4,049 82% $30
Cuba 79 3,682 97% $2
Egypt 51 3,338 58% $205
South Africa 87 3,295 30% $367
Croatia 109 3,132 77% $105
Portugal 87 2,870 72% $140
Chile 107 2,594 89% $62
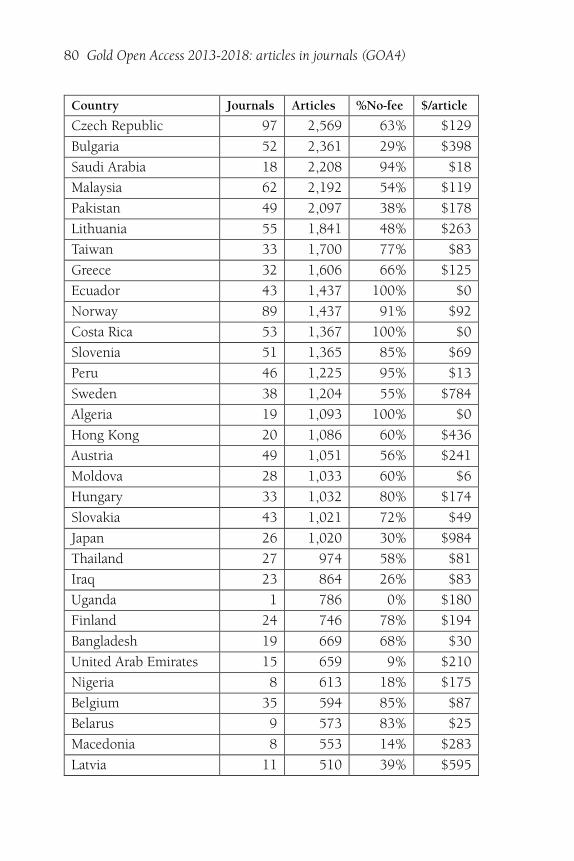
80 Gold Open Access 2013-2018: articles in journals (GOA4)
Country Journals Articles %No-fee $/article
Czech Republic 97 2,569 63% $129
Bulgaria 52 2,361 29% $398
Saudi Arabia 18 2,208 94% $18
Malaysia 62 2,192 54% $119
Pakistan 49 2,097 38% $178
Lithuania 55 1,841 48% $263
Taiwan 33 1,700 77% $83
Greece 32 1,606 66% $125
Ecuador 43 1,437 100% $0
Norway 89 1,437 91% $92
Costa Rica 53 1,367 100% $0
Slovenia 51 1,365 85% $69
Peru 46 1,225 95% $13
Sweden 38 1,204 55% $784
Algeria 19 1,093 100% $0
Hong Kong 20 1,086 60% $436
Austria 49 1,051 56% $241
Moldova 28 1,033 60% $6
Hungary 33 1,032 80% $174
Slovakia 43 1,021 72% $49
Japan 26 1,020 30% $984
Thailand 27 974 58% $81
Iraq 23 864 26% $83
Uganda 1 786 0% $180
Finland 24 746 78% $194
Bangladesh 19 669 68% $30
United Arab Emirates 15 659 9% $210
Nigeria 8 613 18% $175
Belgium 35 594 85% $87
Belarus 9 573 83% $25
Macedonia 8 553 14% $283
Latvia 11 510 39% $595
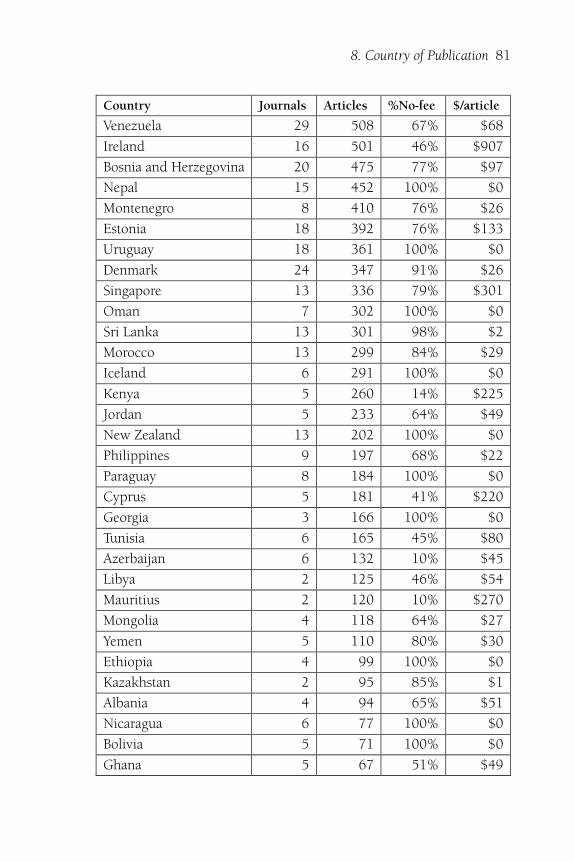
8. Country of Publication 81
Country Journals Articles %No-fee $/article
Venezuela 29 508 67% $68
Ireland 16 501 46% $907
Bosnia and Herzegovina 20 475 77% $97
Nepal 15 452 100% $0
Montenegro 8 410 76% $26
Estonia 18 392 76% $133
Uruguay 18 361 100% $0
Denmark 24 347 91% $26
Singapore 13 336 79% $301
Oman 7 302 100% $0
Sri Lanka 13 301 98% $2
Morocco 13 299 84% $29
Iceland 6 291 100% $0
Kenya 5 260 14% $225
Jordan 5 233 64% $49
New Zealand 13 202 100% $0
Philippines 9 197 68% $22
Paraguay 8 184 100% $0
Cyprus 5 181 41% $220
Georgia 3 166 100% $0
Tunisia 6 165 45% $80
Azerbaijan 6 132 10% $45
Libya 2 125 46% $54
Mauritius 2 120 10% $270
Mongolia 4 118 64% $27
Yemen 5 110 80% $30
Ethiopia 4 99 100% $0
Kazakhstan 2 95 85% $1
Albania 4 94 65% $51
Nicaragua 6 77 100% $0
Bolivia 5 71 100% $0
Ghana 5 67 51% $49
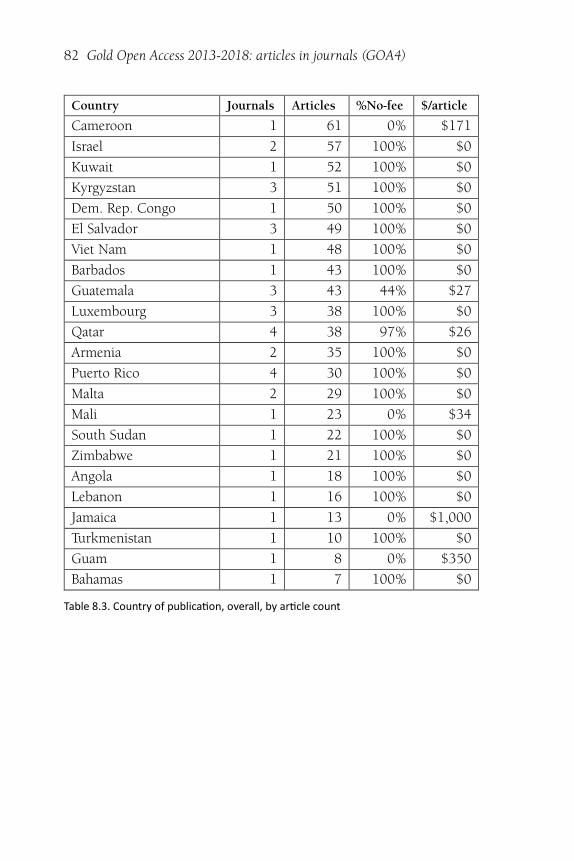
82 Gold Open Access 2013-2018: articles in journals (GOA4)
Country Journals Articles %No-fee $/article
Cameroon 1 61 0% $171
Israel 2 57 100% $0
Kuwait 1 52 100% $0
Kyrgyzstan 3 51 100% $0
Dem. Rep. Congo 1 50 100% $0
El Salvador 3 49 100% $0
Viet Nam 1 48 100% $0
Barbados 1 43 100% $0
Guatemala 3 43 44% $27
Luxembourg 3 38 100% $0
Qatar 4 38 97% $26
Armenia 2 35 100% $0
Puerto Rico 4 30 100% $0
Malta 2 29 100% $0
Mali 1 23 0% $34
South Sudan 1 22 100% $0
Zimbabwe 1 21 100% $0
Angola 1 18 100% $0
Lebanon 1 16 100% $0
Jamaica 1 13 0% $1,000
Turkmenistan 1 10 100% $0
Guam 1 8 0% $350
Bahamas 1 7 100% $0
Table 8.3. Country of publica�on, overall, by ar�cle count
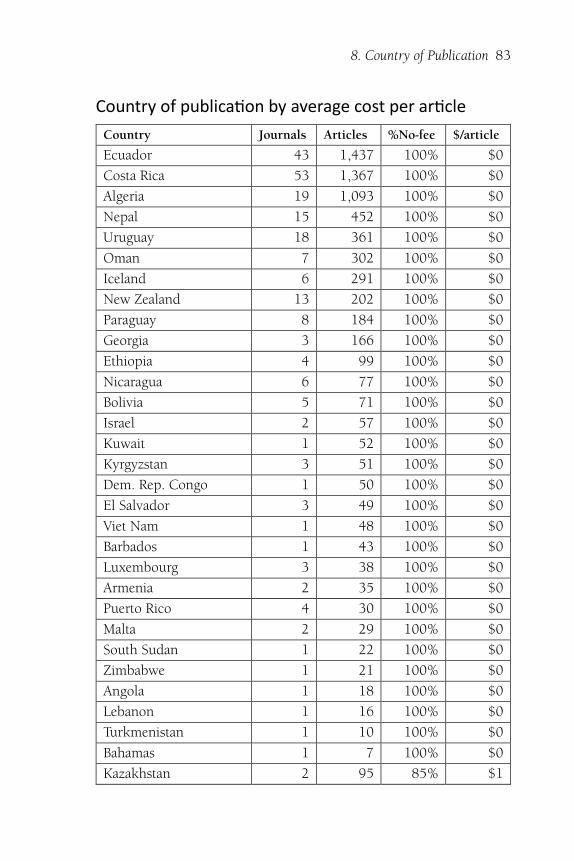
8. Country of Publication 83
Country of publica�on by average cost per ar�cle
Country Journals Articles %No-fee $/article
Ecuador 43 1,437 100% $0
Costa Rica 53 1,367 100% $0
Algeria 19 1,093 100% $0
Nepal 15 452 100% $0
Uruguay 18 361 100% $0
Oman 7 302 100% $0
Iceland 6 291 100% $0
New Zealand 13 202 100% $0
Paraguay 8 184 100% $0
Georgia 3 166 100% $0
Ethiopia 4 99 100% $0
Nicaragua 6 77 100% $0
Bolivia 5 71 100% $0
Israel 2 57 100% $0
Kuwait 1 52 100% $0
Kyrgyzstan 3 51 100% $0
Dem. Rep. Congo 1 50 100% $0
El Salvador 3 49 100% $0
Viet Nam 1 48 100% $0
Barbados 1 43 100% $0
Luxembourg 3 38 100% $0
Armenia 2 35 100% $0
Puerto Rico 4 30 100% $0
Malta 2 29 100% $0
South Sudan 1 22 100% $0
Zimbabwe 1 21 100% $0
Angola 1 18 100% $0
Lebanon 1 16 100% $0
Turkmenistan 1 10 100% $0
Bahamas 1 7 100% $0
Kazakhstan 2 95 85% $1
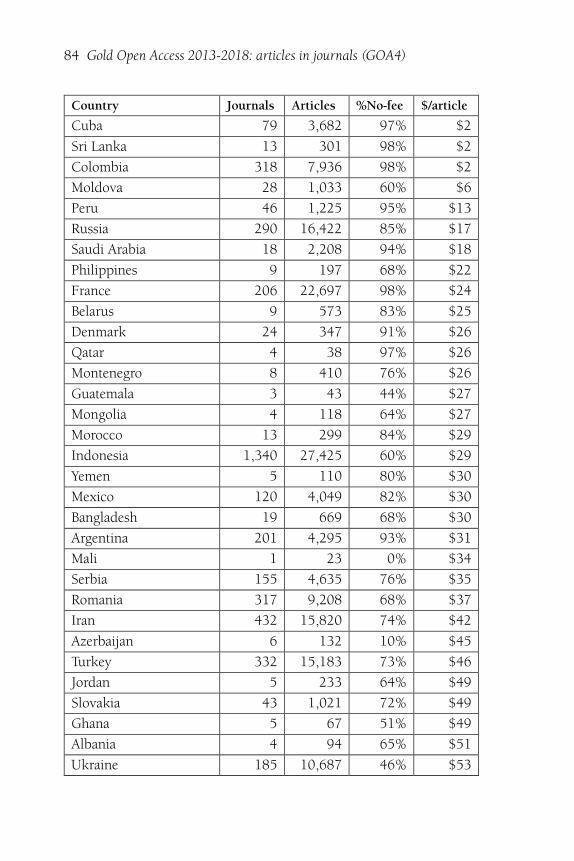
84 Gold Open Access 2013-2018: articles in journals (GOA4)
Country Journals Articles %No-fee $/article
Cuba 79 3,682 97% $2
Sri Lanka 13 301 98% $2
Colombia 318 7,936 98% $2
Moldova 28 1,033 60% $6
Peru 46 1,225 95% $13
Russia 290 16,422 85% $17
Saudi Arabia 18 2,208 94% $18
Philippines 9 197 68% $22
France 206 22,697 98% $24
Belarus 9 573 83% $25
Denmark 24 347 91% $26
Qatar 4 38 97% $26
Montenegro 8 410 76% $26
Guatemala 3 43 44% $27
Mongolia 4 118 64% $27
Morocco 13 299 84% $29
Indonesia 1,340 27,425 60% $29
Yemen 5 110 80% $30
Mexico 120 4,049 82% $30
Bangladesh 19 669 68% $30
Argentina 201 4,295 93% $31
Mali 1 23 0% $34
Serbia 155 4,635 76% $35
Romania 317 9,208 68% $37
Iran 432 15,820 74% $42
Azerbaijan 6 132 10% $45
Turkey 332 15,183 73% $46
Jordan 5 233 64% $49
Slovakia 43 1,021 72% $49
Ghana 5 67 51% $49
Albania 4 94 65% $51
Ukraine 185 10,687 46% $53
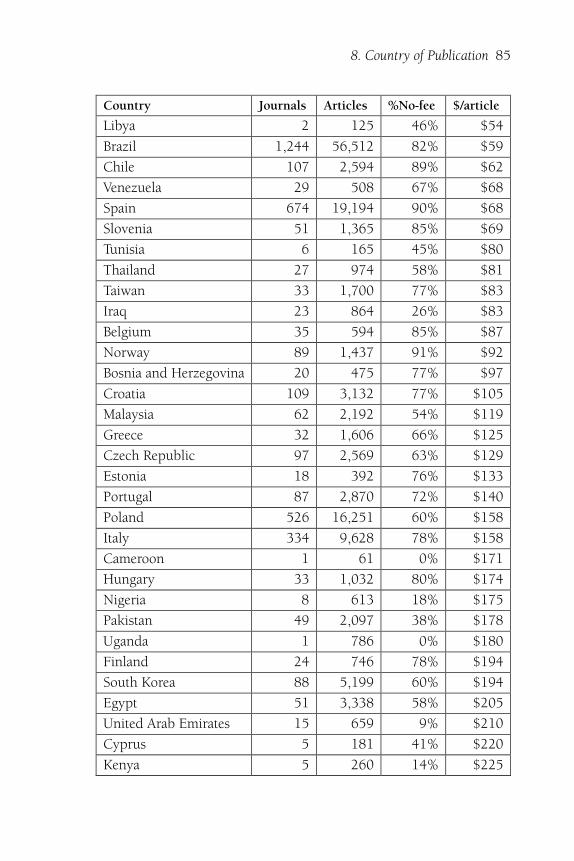
8. Country of Publication 85
Country Journals Articles %No-fee $/article
Libya 2 125 46% $54
Brazil 1,244 56,512 82% $59
Chile 107 2,594 89% $62
Venezuela 29 508 67% $68
Spain 674 19,194 90% $68
Slovenia 51 1,365 85% $69
Tunisia 6 165 45% $80
Thailand 27 974 58% $81
Taiwan 33 1,700 77% $83
Iraq 23 864 26% $83
Belgium 35 594 85% $87
Norway 89 1,437 91% $92
Bosnia and Herzegovina 20 475 77% $97
Croatia 109 3,132 77% $105
Malaysia 62 2,192 54% $119
Greece 32 1,606 66% $125
Czech Republic 97 2,569 63% $129
Estonia 18 392 76% $133
Portugal 87 2,870 72% $140
Poland 526 16,251 60% $158
Italy 334 9,628 78% $158
Cameroon 1 61 0% $171
Hungary 33 1,032 80% $174
Nigeria 8 613 18% $175
Pakistan 49 2,097 38% $178
Uganda 1 786 0% $180
Finland 24 746 78% $194
South Korea 88 5,199 60% $194
Egypt 51 3,338 58% $205
United Arab Emirates 15 659 9% $210
Cyprus 5 181 41% $220
Kenya 5 260 14% $225
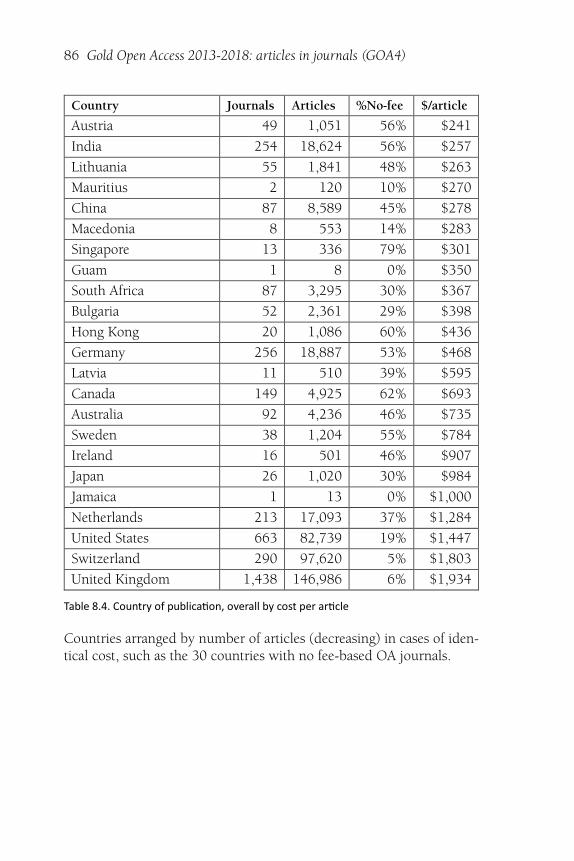
86 Gold Open Access 2013-2018: articles in journals (GOA4)
Country Journals Articles %No-fee $/article
Austria 49 1,051 56% $241
India 254 18,624 56% $257
Lithuania 55 1,841 48% $263
Mauritius 2 120 10% $270
China 87 8,589 45% $278
Macedonia 8 553 14% $283
Singapore 13 336 79% $301
Guam 1 8 0% $350
South Africa 87 3,295 30% $367
Bulgaria 52 2,361 29% $398
Hong Kong 20 1,086 60% $436
Germany 256 18,887 53% $468
Latvia 11 510 39% $595
Canada 149 4,925 62% $693
Australia 92 4,236 46% $735
Sweden 38 1,204 55% $784
Ireland 16 501 46% $907
Japan 26 1,020 30% $984
Jamaica 1 13 0% $1,000
Netherlands 213 17,093 37% $1,284
United States 663 82,739 19% $1,447
Switzerland 290 97,620 5% $1,803
United Kingdom 1,438 146,986 6% $1,934
Table 8.4. Country of publica�on, overall by cost per ar�cle
Countries arranged by number of articles (decreasing) in cases of iden-tical cost, such as the 30 countries with no fee-based OA journals.
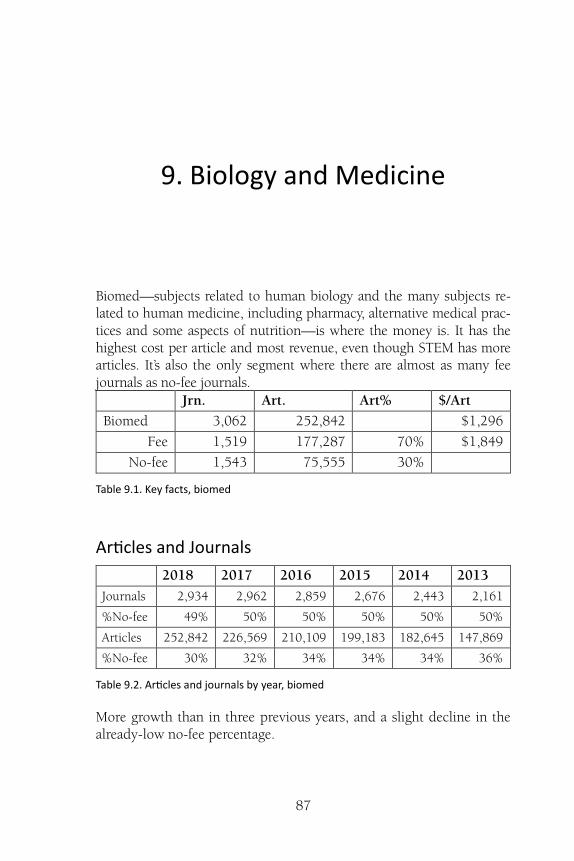
87
9. Biology and Medicine
Biomed—subjects related to human biology and the many subjects re-lated to human medicine, including pharmacy, alternative medical prac-tices and some aspects of nutrition—is where the money is. It has thehighest cost per article and most revenue, even though STEM has morearticles. It’s also the only segment where there are almost as many feejournals as no-fee journals.
Jrn. Art. Art% $/Art
Biomed 3,062 252,842 $1,296
Fee 1,519 177,287 70% $1,849
No-fee 1,543 75,555 30%
Table 9.1. Key facts, biomed
Ar�cles and Journals
2018 2017 2016 2015 2014 2013
Journals 2,934 2,962 2,859 2,676 2,443 2,161
%No-fee 49% 50% 50% 50% 50% 50%
Articles 252,842 226,569 210,109 199,183 182,645 147,869
%No-fee 30% 32% 34% 34% 34% 36%
Table 9.2. Ar�cles and journals by year, biomed
More growth than in three previous years, and a slight decline in thealready-low no-fee percentage.
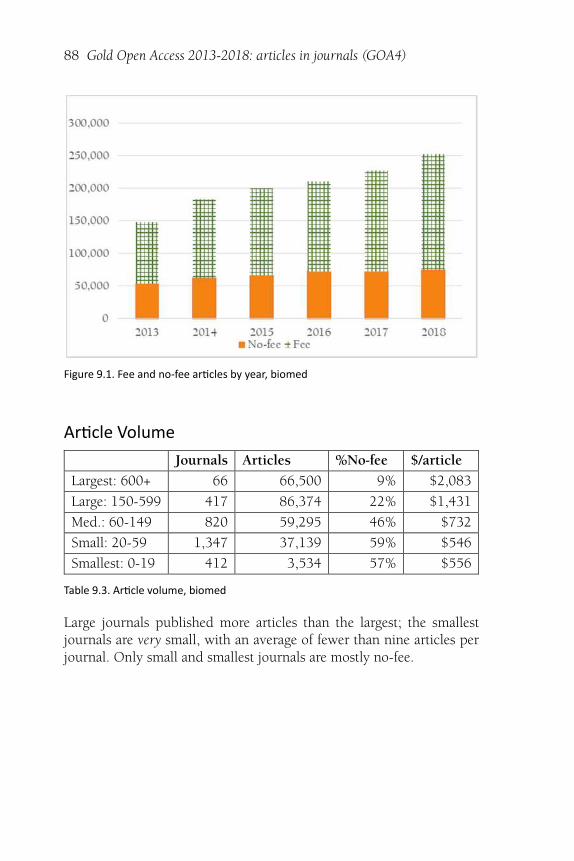
88 Gold Open Access 2013-2018: articles in journals (GOA4)
Figure 9.1. Fee and no-fee ar�cles by year, biomed
Ar�cle Volume
Journals Articles %No-fee $/article
Largest: 600+ 66 66,500 9% $2,083
Large: 150-599 417 86,374 22% $1,431
Med.: 60-149 820 59,295 46% $732
Small: 20-59 1,347 37,139 59% $546
Smallest: 0-19 412 3,534 57% $556
Table 9.3. Ar�cle volume, biomed
Large journals published more articles than the largest; the smallestjournals are very small, with an average of fewer than nine articles perjournal. Only small and smallest journals are mostly no-fee.
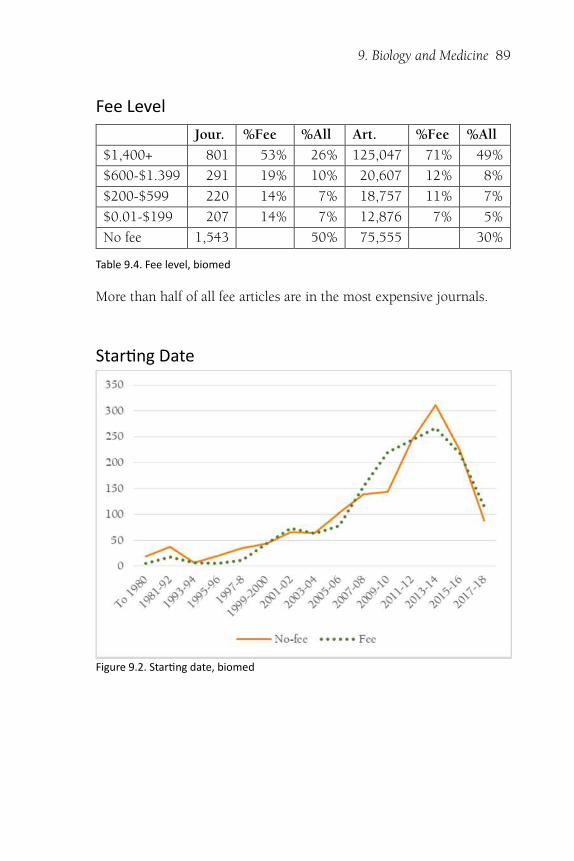
9. Biology and Medicine 89
Fee Level
Jour. %Fee %All Art. %Fee %All
$1,400+ 801 53% 26% 125,047 71% 49%
$600-$1.399 291 19% 10% 20,607 12% 8%
$200-$599 220 14% 7% 18,757 11% 7%
$0.01-$199 207 14% 7% 12,876 7% 5%
No fee 1,543 50% 75,555 30%
Table 9.4. Fee level, biomed
More than half of all fee articles are in the most expensive journals.
Star�ng Date
Figure 9.2. Star�ng date, biomed
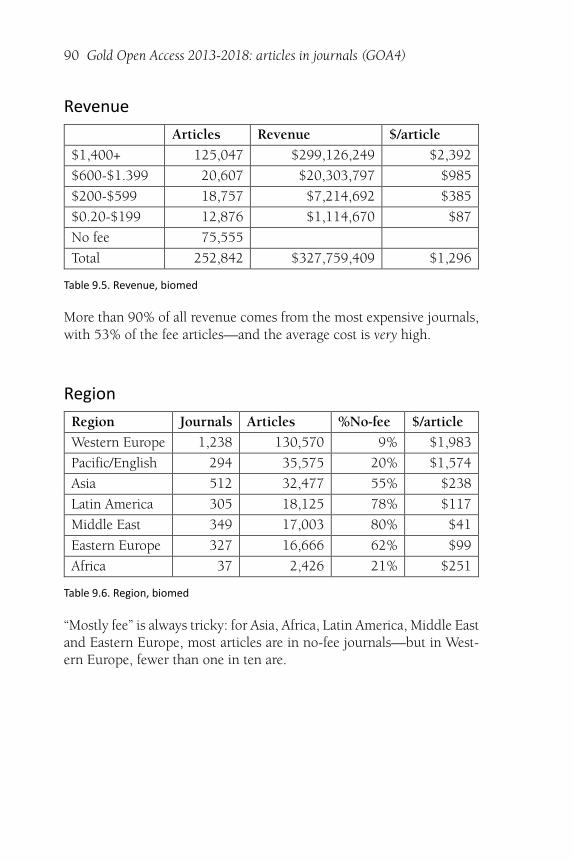
90 Gold Open Access 2013-2018: articles in journals (GOA4)
Revenue
Articles Revenue $/article
$1,400+ 125,047 $299,126,249 $2,392
$600-$1.399 20,607 $20,303,797 $985
$200-$599 18,757 $7,214,692 $385
$0.20-$199 12,876 $1,114,670 $87
No fee 75,555
Total 252,842 $327,759,409 $1,296
Table 9.5. Revenue, biomed
More than 90% of all revenue comes from the most expensive journals,with 53% of the fee articles—and the average cost is very high.
Region
Region Journals Articles %No-fee $/article
Western Europe 1,238 130,570 9% $1,983
Pacific/English 294 35,575 20% $1,574
Asia 512 32,477 55% $238
Latin America 305 18,125 78% $117
Middle East 349 17,003 80% $41
Eastern Europe 327 16,666 62% $99
Africa 37 2,426 21% $251
Table 9.6. Region, biomed
“Mostly fee” is always tricky: for Asia, Africa, Latin America, Middle Eastand Eastern Europe, most articles are in no-fee journals—but in West-ern Europe, fewer than one in ten are.
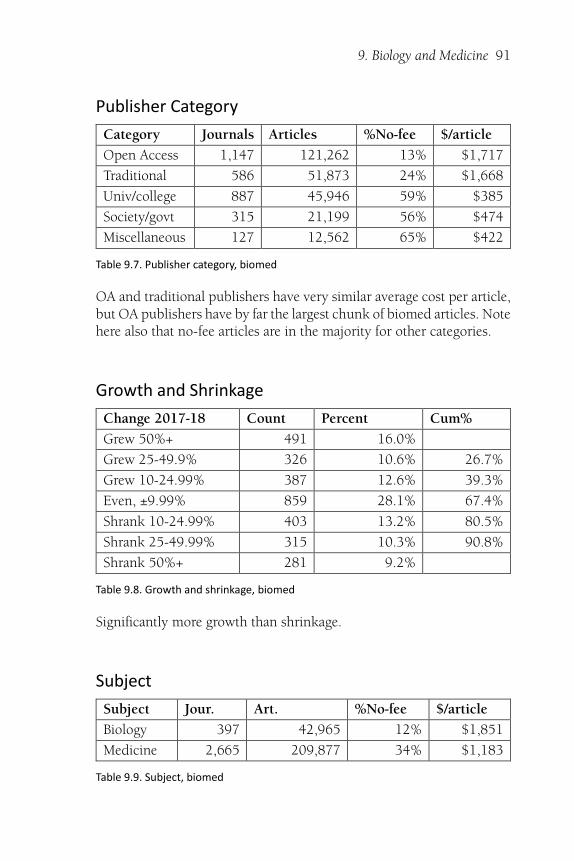
9. Biology and Medicine 91
Publisher Category
Category Journals Articles %No-fee $/article
Open Access 1,147 121,262 13% $1,717
Traditional 586 51,873 24% $1,668
Univ/college 887 45,946 59% $385
Society/govt 315 21,199 56% $474
Miscellaneous 127 12,562 65% $422
Table 9.7. Publisher category, biomed
OA and traditional publishers have very similar average cost per article,but OA publishers have by far the largest chunk of biomed articles. Notehere also that no-fee articles are in the majority for other categories.
Growth and Shrinkage
Change 2017-18 Count Percent Cum%
Grew 50%+ 491 16.0%
Grew 25-49.9% 326 10.6% 26.7%
Grew 10-24.99% 387 12.6% 39.3%
Even, ±9.99% 859 28.1% 67.4%
Shrank 10-24.99% 403 13.2% 80.5%
Shrank 25-49.99% 315 10.3% 90.8%
Shrank 50%+ 281 9.2%
Table 9.8. Growth and shrinkage, biomed
Significantly more growth than shrinkage.
Subject
Subject Jour. Art. %No-fee $/article
Biology 397 42,965 12% $1,851
Medicine 2,665 209,877 34% $1,183
Table 9.9. Subject, biomed
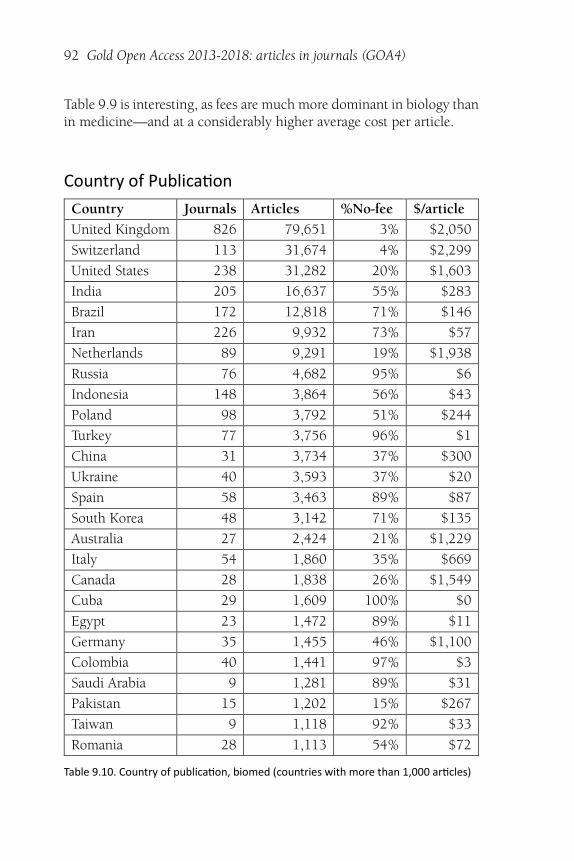
92 Gold Open Access 2013-2018: articles in journals (GOA4)
Table 9.9 is interesting, as fees are much more dominant in biology thanin medicine—and at a considerably higher average cost per article.
Country of Publica�on
Country Journals Articles %No-fee $/article
United Kingdom 826 79,651 3% $2,050
Switzerland 113 31,674 4% $2,299
United States 238 31,282 20% $1,603
India 205 16,637 55% $283
Brazil 172 12,818 71% $146
Iran 226 9,932 73% $57
Netherlands 89 9,291 19% $1,938
Russia 76 4,682 95% $6
Indonesia 148 3,864 56% $43
Poland 98 3,792 51% $244
Turkey 77 3,756 96% $1
China 31 3,734 37% $300
Ukraine 40 3,593 37% $20
Spain 58 3,463 89% $87
South Korea 48 3,142 71% $135
Australia 27 2,424 21% $1,229
Italy 54 1,860 35% $669
Canada 28 1,838 26% $1,549
Cuba 29 1,609 100% $0
Egypt 23 1,472 89% $11
Germany 35 1,455 46% $1,100
Colombia 40 1,441 97% $3
Saudi Arabia 9 1,281 89% $31
Pakistan 15 1,202 15% $267
Taiwan 9 1,118 92% $33
Romania 28 1,113 54% $72
Table 9.10. Country of publica�on, biomed (countries with more than 1,000 ar�cles)
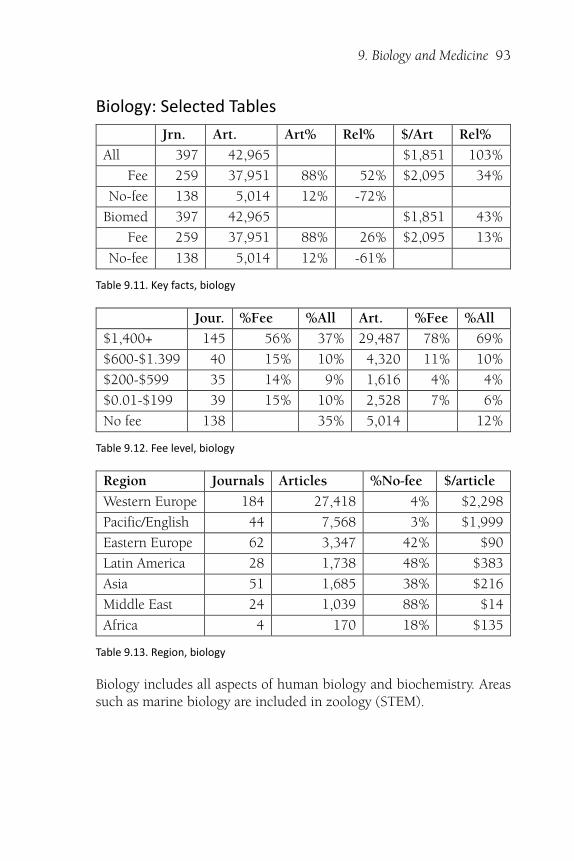
9. Biology and Medicine 93
Biology: Selected Tables
Jrn. Art. Art% Rel% $/Art Rel%
All 397 42,965 $1,851 103%
Fee 259 37,951 88% 52% $2,095 34%
No-fee 138 5,014 12% -72%
Biomed 397 42,965 $1,851 43%
Fee 259 37,951 88% 26% $2,095 13%
No-fee 138 5,014 12% -61%
Table 9.11. Key facts, biology
Jour. %Fee %All Art. %Fee %All
$1,400+ 145 56% 37% 29,487 78% 69%
$600-$1.399 40 15% 10% 4,320 11% 10%
$200-$599 35 14% 9% 1,616 4% 4%
$0.01-$199 39 15% 10% 2,528 7% 6%
No fee 138 35% 5,014 12%
Table 9.12. Fee level, biology
Region Journals Articles %No-fee $/article
Western Europe 184 27,418 4% $2,298
Pacific/English 44 7,568 3% $1,999
Eastern Europe 62 3,347 42% $90
Latin America 28 1,738 48% $383
Asia 51 1,685 38% $216
Middle East 24 1,039 88% $14
Africa 4 170 18% $135
Table 9.13. Region, biology
Biology includes all aspects of human biology and biochemistry. Areassuch as marine biology are included in zoology (STEM).
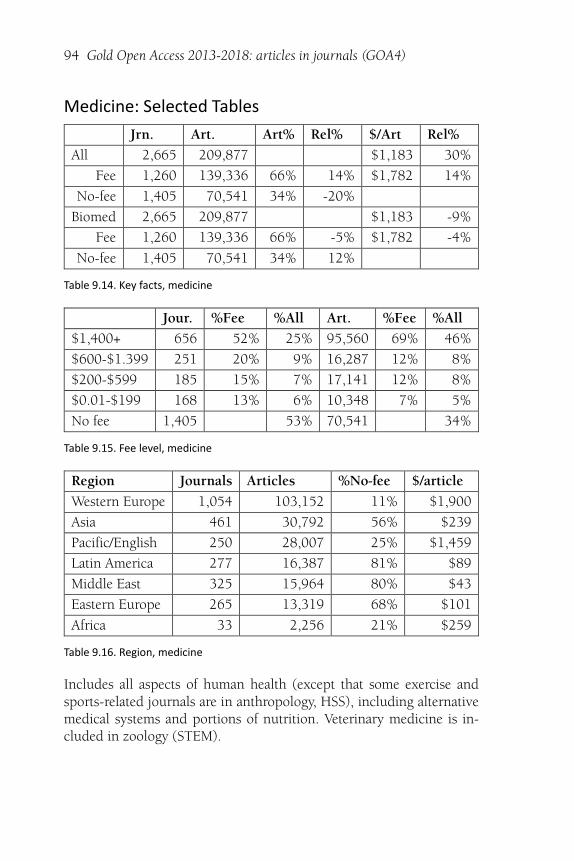
94 Gold Open Access 2013-2018: articles in journals (GOA4)
Medicine: Selected Tables
Jrn. Art. Art% Rel% $/Art Rel%
All 2,665 209,877 $1,183 30%
Fee 1,260 139,336 66% 14% $1,782 14%
No-fee 1,405 70,541 34% -20%
Biomed 2,665 209,877 $1,183 -9%
Fee 1,260 139,336 66% -5% $1,782 -4%
No-fee 1,405 70,541 34% 12%
Table 9.14. Key facts, medicine
Jour. %Fee %All Art. %Fee %All
$1,400+ 656 52% 25% 95,560 69% 46%
$600-$1.399 251 20% 9% 16,287 12% 8%
$200-$599 185 15% 7% 17,141 12% 8%
$0.01-$199 168 13% 6% 10,348 7% 5%
No fee 1,405 53% 70,541 34%
Table 9.15. Fee level, medicine
Region Journals Articles %No-fee $/article
Western Europe 1,054 103,152 11% $1,900
Asia 461 30,792 56% $239
Pacific/English 250 28,007 25% $1,459
Latin America 277 16,387 81% $89
Middle East 325 15,964 80% $43
Eastern Europe 265 13,319 68% $101
Africa 33 2,256 21% $259
Table 9.16. Region, medicine
Includes all aspects of human health (except that some exercise andsports-related journals are in anthropology, HSS), including alternativemedical systems and portions of nutrition. Veterinary medicine is in-cluded in zoology (STEM).
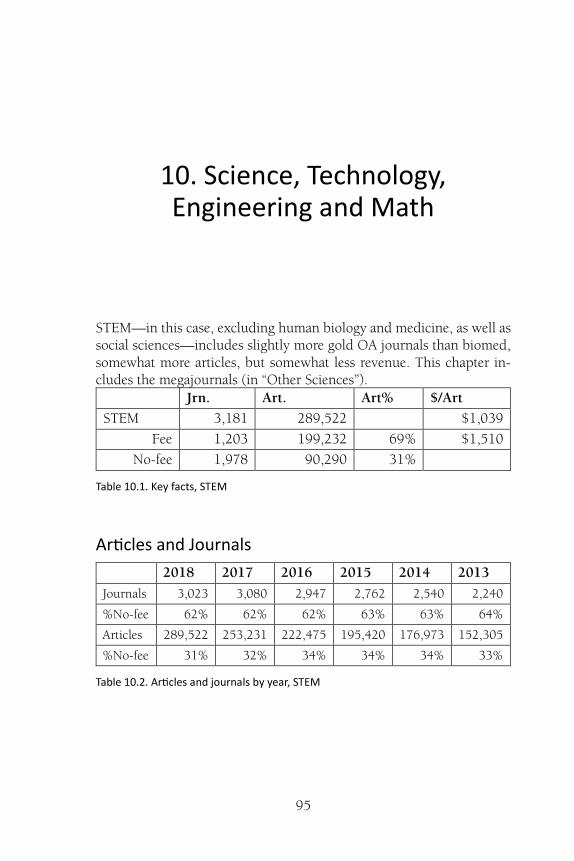
95
10. Science, Technology,Engineering and Math
STEM—in this case, excluding human biology and medicine, as well associal sciences—includes slightly more gold OA journals than biomed,somewhat more articles, but somewhat less revenue. This chapter in-cludes the megajournals (in “Other Sciences”).
Jrn. Art. Art% $/Art
STEM 3,181 289,522 $1,039
Fee 1,203 199,232 69% $1,510
No-fee 1,978 90,290 31%
Table 10.1. Key facts, STEM
Ar�cles and Journals
2018 2017 2016 2015 2014 2013
Journals 3,023 3,080 2,947 2,762 2,540 2,240
%No-fee 62% 62% 62% 63% 63% 64%
Articles 289,522 253,231 222,475 195,420 176,973 152,305
%No-fee 31% 32% 34% 34% 34% 33%
Table 10.2. Ar�cles and journals by year, STEM
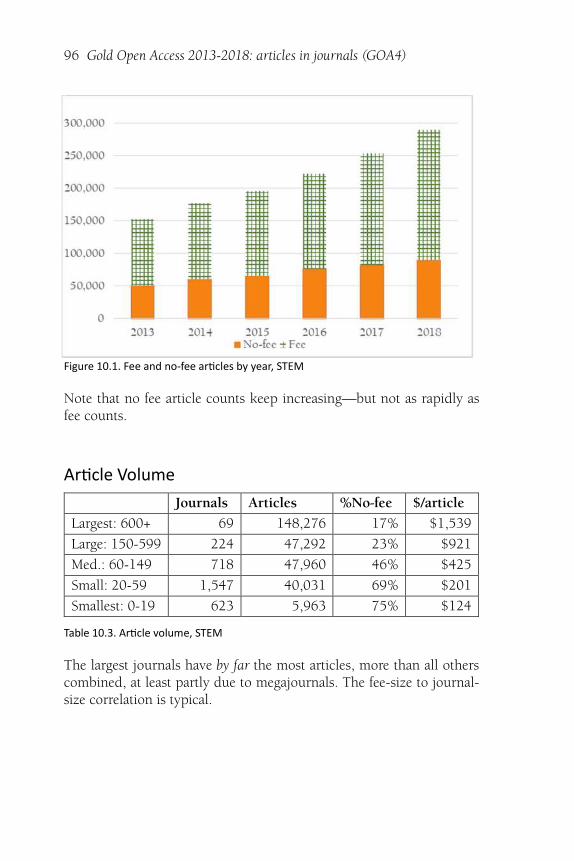
96 Gold Open Access 2013-2018: articles in journals (GOA4)
Figure 10.1. Fee and no-fee ar�cles by year, STEM
Note that no fee article counts keep increasing—but not as rapidly asfee counts.
Ar�cle Volume
Journals Articles %No-fee $/article
Largest: 600+ 69 148,276 17% $1,539
Large: 150-599 224 47,292 23% $921
Med.: 60-149 718 47,960 46% $425
Small: 20-59 1,547 40,031 69% $201
Smallest: 0-19 623 5,963 75% $124
Table 10.3. Ar�cle volume, STEM
The largest journals have by far the most articles, more than all otherscombined, at least partly due to megajournals. The fee-size to journal-size correlation is typical.
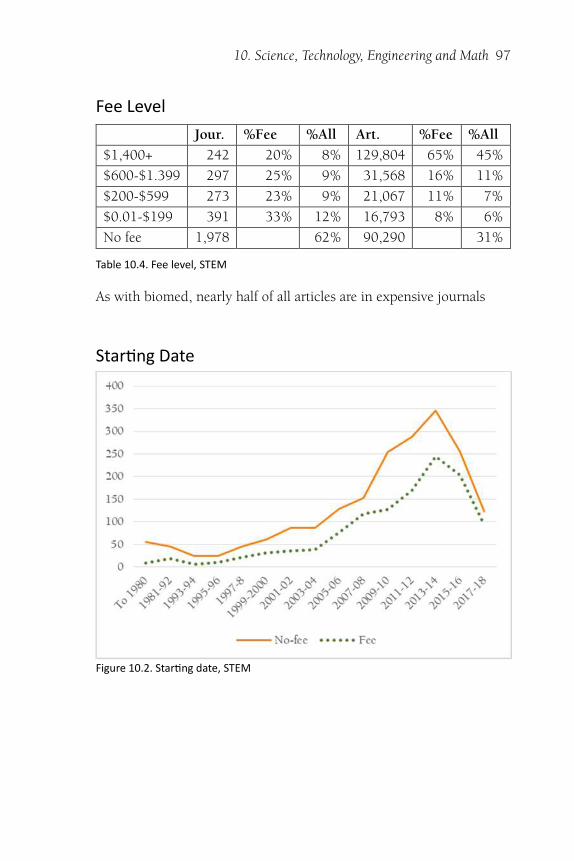
10. Science, Technology, Engineering and Math 97
Fee Level
Jour. %Fee %All Art. %Fee %All
$1,400+ 242 20% 8% 129,804 65% 45%
$600-$1.399 297 25% 9% 31,568 16% 11%
$200-$599 273 23% 9% 21,067 11% 7%
$0.01-$199 391 33% 12% 16,793 8% 6%
No fee 1,978 62% 90,290 31%
Table 10.4. Fee level, STEM
As with biomed, nearly half of all articles are in expensive journals
Star�ng Date
Figure 10.2. Star�ng date, STEM
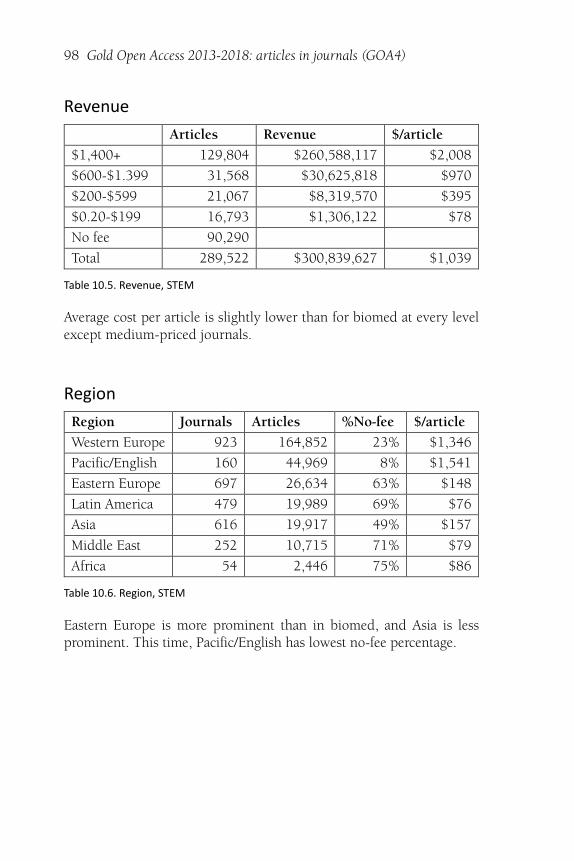
98 Gold Open Access 2013-2018: articles in journals (GOA4)
Revenue
Articles Revenue $/article
$1,400+ 129,804 $260,588,117 $2,008
$600-$1.399 31,568 $30,625,818 $970
$200-$599 21,067 $8,319,570 $395
$0.20-$199 16,793 $1,306,122 $78
No fee 90,290
Total 289,522 $300,839,627 $1,039
Table 10.5. Revenue, STEM
Average cost per article is slightly lower than for biomed at every levelexcept medium-priced journals.
Region
Region Journals Articles %No-fee $/article
Western Europe 923 164,852 23% $1,346
Pacific/English 160 44,969 8% $1,541
Eastern Europe 697 26,634 63% $148
Latin America 479 19,989 69% $76
Asia 616 19,917 49% $157
Middle East 252 10,715 71% $79
Africa 54 2,446 75% $86
Table 10.6. Region, STEM
Eastern Europe is more prominent than in biomed, and Asia is lessprominent. This time, Pacific/English has lowest no-fee percentage.
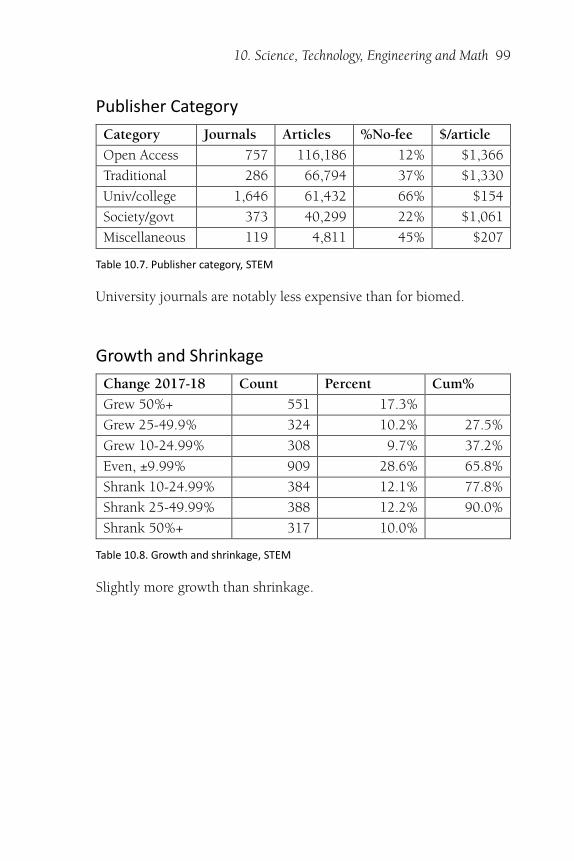
10. Science, Technology, Engineering and Math 99
Publisher Category
Category Journals Articles %No-fee $/article
Open Access 757 116,186 12% $1,366
Traditional 286 66,794 37% $1,330
Univ/college 1,646 61,432 66% $154
Society/govt 373 40,299 22% $1,061
Miscellaneous 119 4,811 45% $207
Table 10.7. Publisher category, STEM
University journals are notably less expensive than for biomed.
Growth and Shrinkage
Change 2017-18 Count Percent Cum%
Grew 50%+ 551 17.3%
Grew 25-49.9% 324 10.2% 27.5%
Grew 10-24.99% 308 9.7% 37.2%
Even, ±9.99% 909 28.6% 65.8%
Shrank 10-24.99% 384 12.1% 77.8%
Shrank 25-49.99% 388 12.2% 90.0%
Shrank 50%+ 317 10.0%
Table 10.8. Growth and shrinkage, STEM
Slightly more growth than shrinkage.
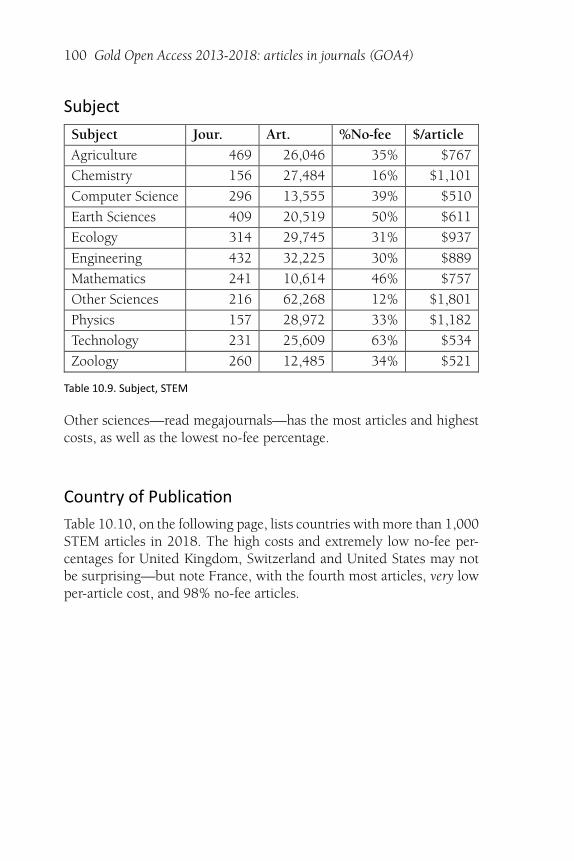
100 Gold Open Access 2013-2018: articles in journals (GOA4)
Subject
Subject Jour. Art. %No-fee $/article
Agriculture 469 26,046 35% $767
Chemistry 156 27,484 16% $1,101
Computer Science 296 13,555 39% $510
Earth Sciences 409 20,519 50% $611
Ecology 314 29,745 31% $937
Engineering 432 32,225 30% $889
Mathematics 241 10,614 46% $757
Other Sciences 216 62,268 12% $1,801
Physics 157 28,972 33% $1,182
Technology 231 25,609 63% $534
Zoology 260 12,485 34% $521
Table 10.9. Subject, STEM
Other sciences—read megajournals—has the most articles and highestcosts, as well as the lowest no-fee percentage.
Country of Publica�on
Table 10.10, on the following page, lists countries with more than 1,000STEM articles in 2018. The high costs and extremely low no-fee per-centages for United Kingdom, Switzerland and United States may notbe surprising—but note France, with the fourth most articles, very lowper-article cost, and 98% no-fee articles.
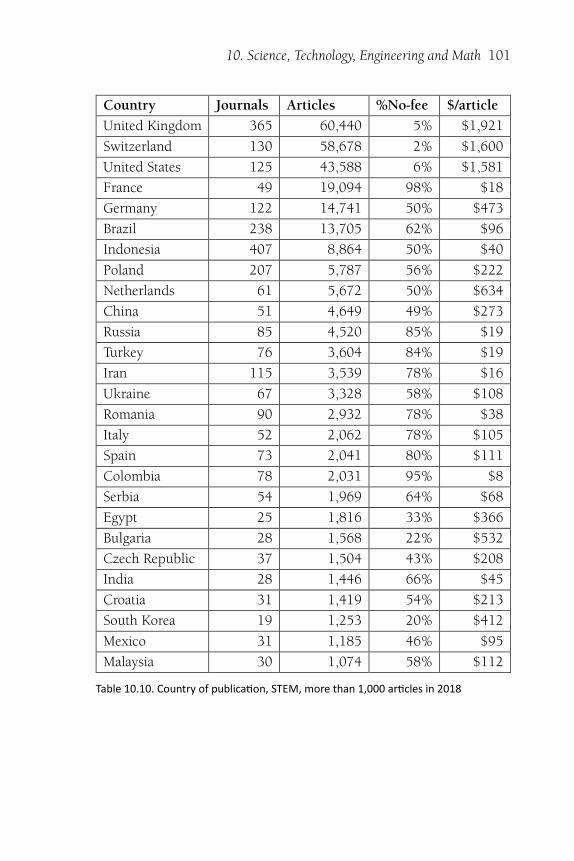
10. Science, Technology, Engineering and Math 101
Country Journals Articles %No-fee $/article
United Kingdom 365 60,440 5% $1,921
Switzerland 130 58,678 2% $1,600
United States 125 43,588 6% $1,581
France 49 19,094 98% $18
Germany 122 14,741 50% $473
Brazil 238 13,705 62% $96
Indonesia 407 8,864 50% $40
Poland 207 5,787 56% $222
Netherlands 61 5,672 50% $634
China 51 4,649 49% $273
Russia 85 4,520 85% $19
Turkey 76 3,604 84% $19
Iran 115 3,539 78% $16
Ukraine 67 3,328 58% $108
Romania 90 2,932 78% $38
Italy 52 2,062 78% $105
Spain 73 2,041 80% $111
Colombia 78 2,031 95% $8
Serbia 54 1,969 64% $68
Egypt 25 1,816 33% $366
Bulgaria 28 1,568 22% $532
Czech Republic 37 1,504 43% $208
India 28 1,446 66% $45
Croatia 31 1,419 54% $213
South Korea 19 1,253 20% $412
Mexico 31 1,185 46% $95
Malaysia 30 1,074 58% $112
Table 10.10. Country of publica�on, STEM, more than 1,000 ar�cles in 2018
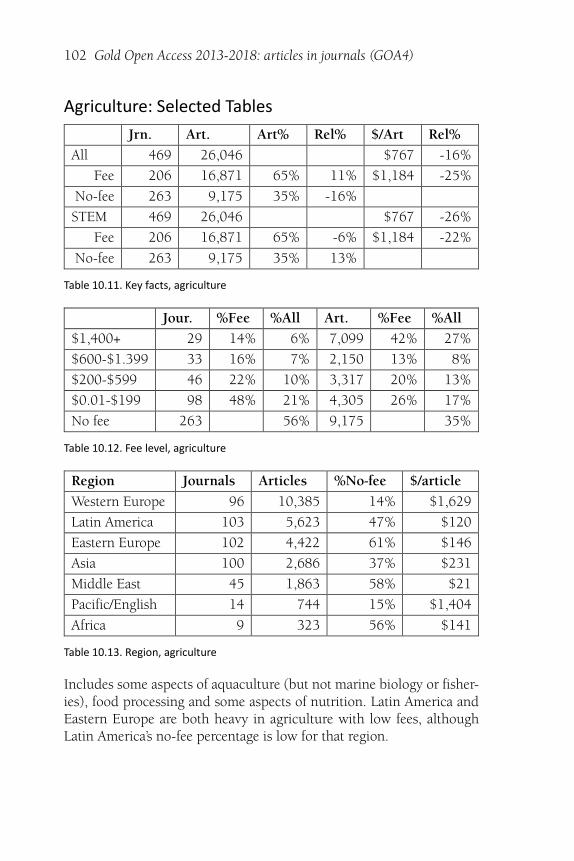
102 Gold Open Access 2013-2018: articles in journals (GOA4)
Agriculture: Selected Tables
Jrn. Art. Art% Rel% $/Art Rel%
All 469 26,046 $767 -16%
Fee 206 16,871 65% 11% $1,184 -25%
No-fee 263 9,175 35% -16%
STEM 469 26,046 $767 -26%
Fee 206 16,871 65% -6% $1,184 -22%
No-fee 263 9,175 35% 13%
Table 10.11. Key facts, agriculture
Jour. %Fee %All Art. %Fee %All
$1,400+ 29 14% 6% 7,099 42% 27%
$600-$1.399 33 16% 7% 2,150 13% 8%
$200-$599 46 22% 10% 3,317 20% 13%
$0.01-$199 98 48% 21% 4,305 26% 17%
No fee 263 56% 9,175 35%
Table 10.12. Fee level, agriculture
Region Journals Articles %No-fee $/article
Western Europe 96 10,385 14% $1,629
Latin America 103 5,623 47% $120
Eastern Europe 102 4,422 61% $146
Asia 100 2,686 37% $231
Middle East 45 1,863 58% $21
Pacific/English 14 744 15% $1,404
Africa 9 323 56% $141
Table 10.13. Region, agriculture
Includes some aspects of aquaculture (but not marine biology or fisher-ies), food processing and some aspects of nutrition. Latin America andEastern Europe are both heavy in agriculture with low fees, althoughLatin America’s no-fee percentage is low for that region.
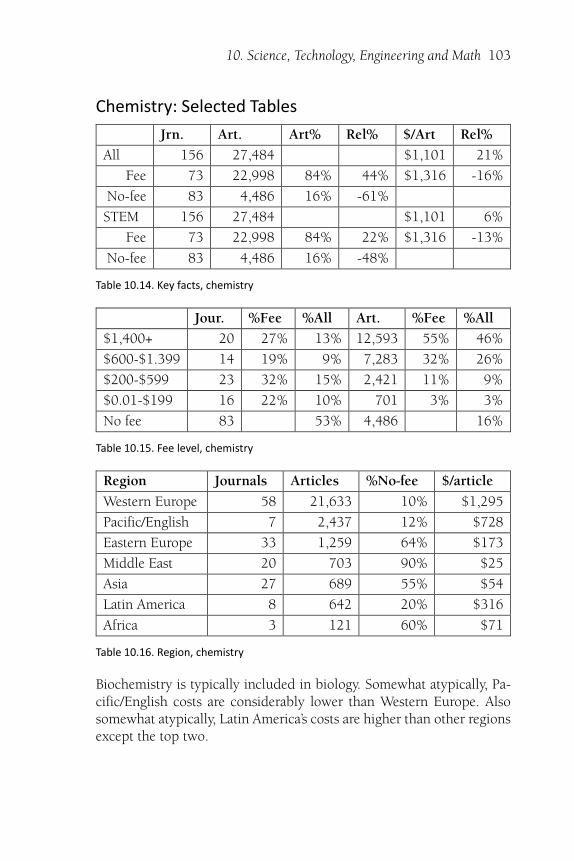
10. Science, Technology, Engineering and Math 103
Chemistry: Selected Tables
Jrn. Art. Art% Rel% $/Art Rel%
All 156 27,484 $1,101 21%
Fee 73 22,998 84% 44% $1,316 -16%
No-fee 83 4,486 16% -61%
STEM 156 27,484 $1,101 6%
Fee 73 22,998 84% 22% $1,316 -13%
No-fee 83 4,486 16% -48%
Table 10.14. Key facts, chemistry
Jour. %Fee %All Art. %Fee %All
$1,400+ 20 27% 13% 12,593 55% 46%
$600-$1.399 14 19% 9% 7,283 32% 26%
$200-$599 23 32% 15% 2,421 11% 9%
$0.01-$199 16 22% 10% 701 3% 3%
No fee 83 53% 4,486 16%
Table 10.15. Fee level, chemistry
Region Journals Articles %No-fee $/article
Western Europe 58 21,633 10% $1,295
Pacific/English 7 2,437 12% $728
Eastern Europe 33 1,259 64% $173
Middle East 20 703 90% $25
Asia 27 689 55% $54
Latin America 8 642 20% $316
Africa 3 121 60% $71
Table 10.16. Region, chemistry
Biochemistry is typically included in biology. Somewhat atypically, Pa-cific/English costs are considerably lower than Western Europe. Alsosomewhat atypically, Latin America’s costs are higher than other regionsexcept the top two.
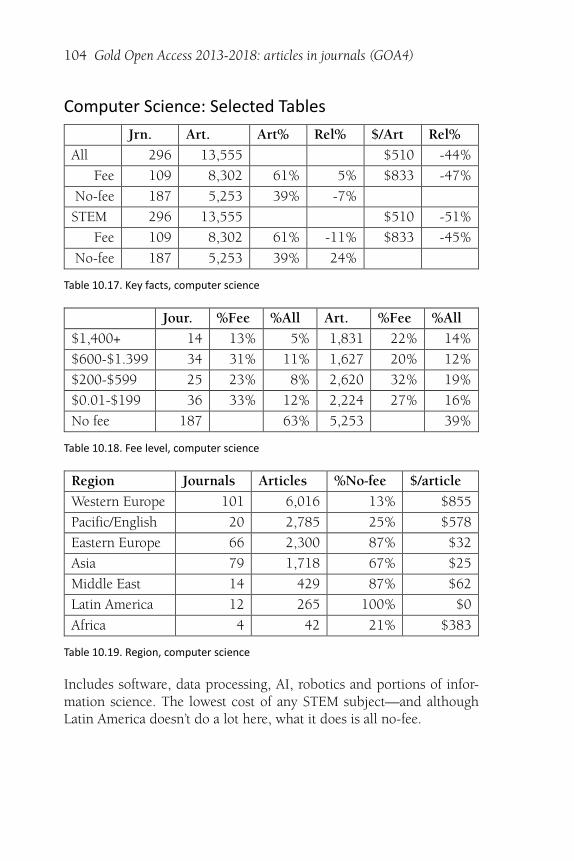
104 Gold Open Access 2013-2018: articles in journals (GOA4)
Computer Science: Selected Tables
Jrn. Art. Art% Rel% $/Art Rel%
All 296 13,555 $510 -44%
Fee 109 8,302 61% 5% $833 -47%
No-fee 187 5,253 39% -7%
STEM 296 13,555 $510 -51%
Fee 109 8,302 61% -11% $833 -45%
No-fee 187 5,253 39% 24%
Table 10.17. Key facts, computer science
Jour. %Fee %All Art. %Fee %All
$1,400+ 14 13% 5% 1,831 22% 14%
$600-$1.399 34 31% 11% 1,627 20% 12%
$200-$599 25 23% 8% 2,620 32% 19%
$0.01-$199 36 33% 12% 2,224 27% 16%
No fee 187 63% 5,253 39%
Table 10.18. Fee level, computer science
Region Journals Articles %No-fee $/article
Western Europe 101 6,016 13% $855
Pacific/English 20 2,785 25% $578
Eastern Europe 66 2,300 87% $32
Asia 79 1,718 67% $25
Middle East 14 429 87% $62
Latin America 12 265 100% $0
Africa 4 42 21% $383
Table 10.19. Region, computer science
Includes software, data processing, AI, robotics and portions of infor-mation science. The lowest cost of any STEM subject—and althoughLatin America doesn’t do a lot here, what it does is all no-fee.
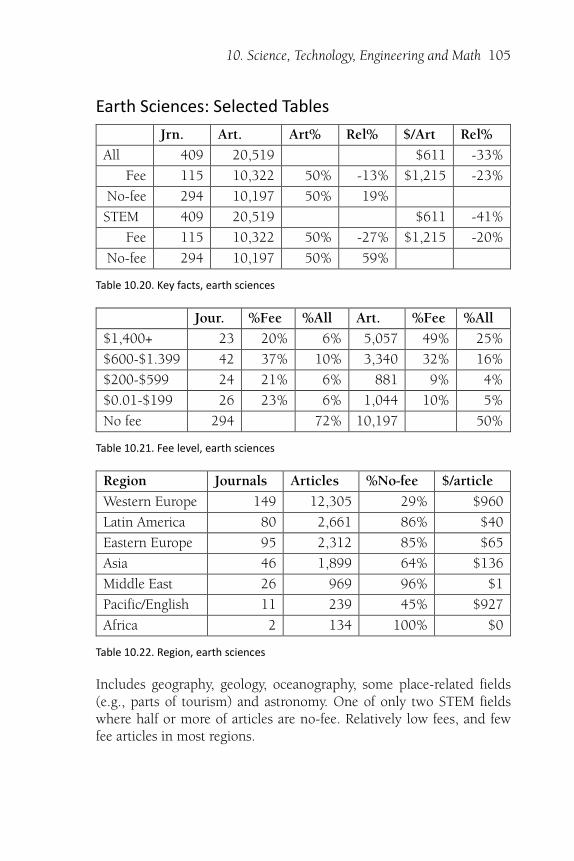
10. Science, Technology, Engineering and Math 105
Earth Sciences: Selected Tables
Jrn. Art. Art% Rel% $/Art Rel%
All 409 20,519 $611 -33%
Fee 115 10,322 50% -13% $1,215 -23%
No-fee 294 10,197 50% 19%
STEM 409 20,519 $611 -41%
Fee 115 10,322 50% -27% $1,215 -20%
No-fee 294 10,197 50% 59%
Table 10.20. Key facts, earth sciences
Jour. %Fee %All Art. %Fee %All
$1,400+ 23 20% 6% 5,057 49% 25%
$600-$1.399 42 37% 10% 3,340 32% 16%
$200-$599 24 21% 6% 881 9% 4%
$0.01-$199 26 23% 6% 1,044 10% 5%
No fee 294 72% 10,197 50%
Table 10.21. Fee level, earth sciences
Region Journals Articles %No-fee $/article
Western Europe 149 12,305 29% $960
Latin America 80 2,661 86% $40
Eastern Europe 95 2,312 85% $65
Asia 46 1,899 64% $136
Middle East 26 969 96% $1
Pacific/English 11 239 45% $927
Africa 2 134 100% $0
Table 10.22. Region, earth sciences
Includes geography, geology, oceanography, some place-related fields(e.g., parts of tourism) and astronomy. One of only two STEM fieldswhere half or more of articles are no-fee. Relatively low fees, and fewfee articles in most regions.
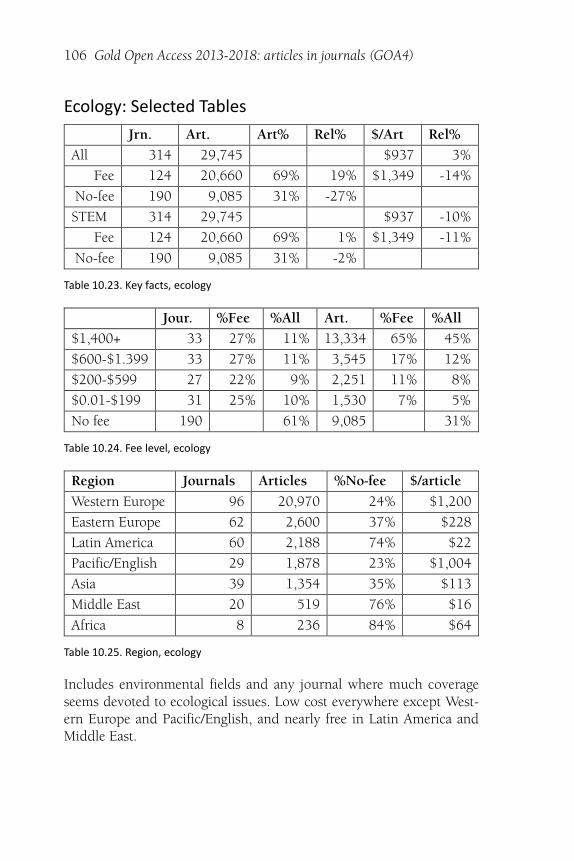
106 Gold Open Access 2013-2018: articles in journals (GOA4)
Ecology: Selected Tables
Jrn. Art. Art% Rel% $/Art Rel%
All 314 29,745 $937 3%
Fee 124 20,660 69% 19% $1,349 -14%
No-fee 190 9,085 31% -27%
STEM 314 29,745 $937 -10%
Fee 124 20,660 69% 1% $1,349 -11%
No-fee 190 9,085 31% -2%
Table 10.23. Key facts, ecology
Jour. %Fee %All Art. %Fee %All
$1,400+ 33 27% 11% 13,334 65% 45%
$600-$1.399 33 27% 11% 3,545 17% 12%
$200-$599 27 22% 9% 2,251 11% 8%
$0.01-$199 31 25% 10% 1,530 7% 5%
No fee 190 61% 9,085 31%
Table 10.24. Fee level, ecology
Region Journals Articles %No-fee $/article
Western Europe 96 20,970 24% $1,200
Eastern Europe 62 2,600 37% $228
Latin America 60 2,188 74% $22
Pacific/English 29 1,878 23% $1,004
Asia 39 1,354 35% $113
Middle East 20 519 76% $16
Africa 8 236 84% $64
Table 10.25. Region, ecology
Includes environmental fields and any journal where much coverageseems devoted to ecological issues. Low cost everywhere except West-ern Europe and Pacific/English, and nearly free in Latin America andMiddle East.
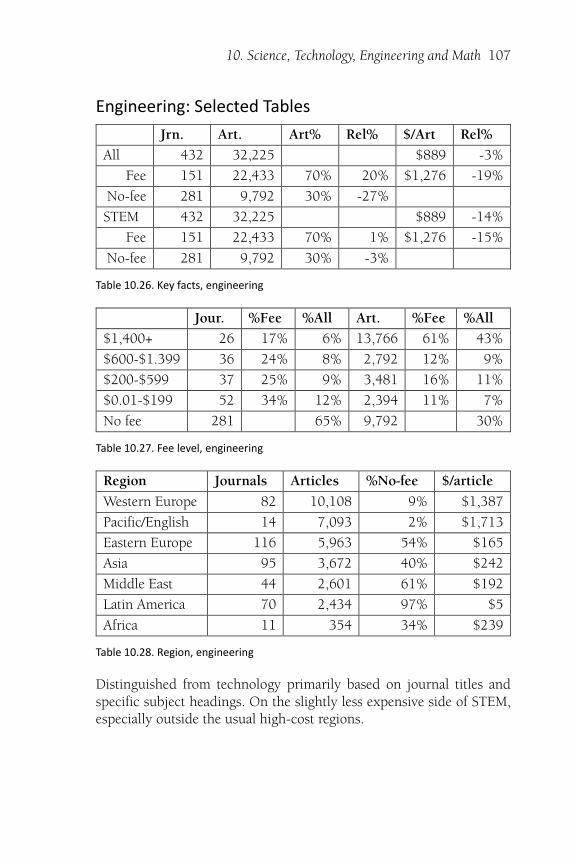
10. Science, Technology, Engineering and Math 107
Engineering: Selected Tables
Jrn. Art. Art% Rel% $/Art Rel%
All 432 32,225 $889 -3%
Fee 151 22,433 70% 20% $1,276 -19%
No-fee 281 9,792 30% -27%
STEM 432 32,225 $889 -14%
Fee 151 22,433 70% 1% $1,276 -15%
No-fee 281 9,792 30% -3%
Table 10.26. Key facts, engineering
Jour. %Fee %All Art. %Fee %All
$1,400+ 26 17% 6% 13,766 61% 43%
$600-$1.399 36 24% 8% 2,792 12% 9%
$200-$599 37 25% 9% 3,481 16% 11%
$0.01-$199 52 34% 12% 2,394 11% 7%
No fee 281 65% 9,792 30%
Table 10.27. Fee level, engineering
Region Journals Articles %No-fee $/article
Western Europe 82 10,108 9% $1,387
Pacific/English 14 7,093 2% $1,713
Eastern Europe 116 5,963 54% $165
Asia 95 3,672 40% $242
Middle East 44 2,601 61% $192
Latin America 70 2,434 97% $5
Africa 11 354 34% $239
Table 10.28. Region, engineering
Distinguished from technology primarily based on journal titles andspecific subject headings. On the slightly less expensive side of STEM,especially outside the usual high-cost regions.
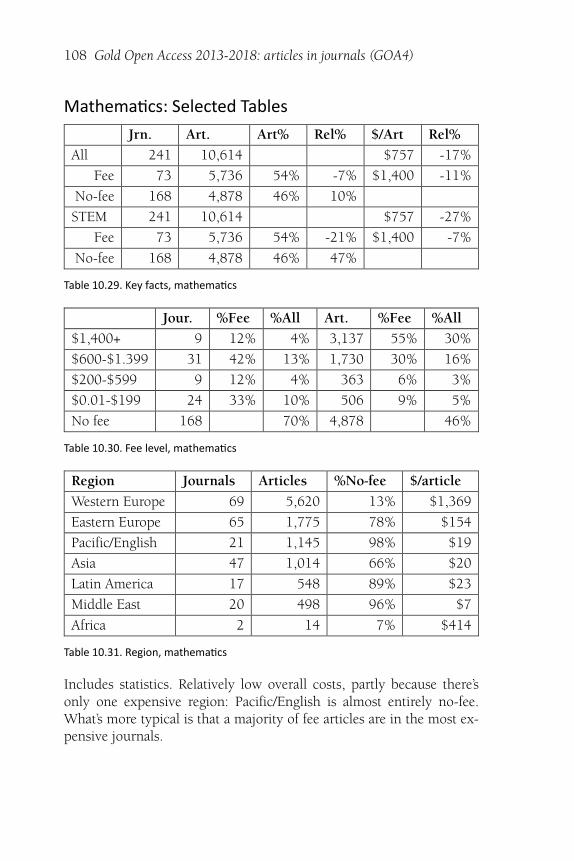
108 Gold Open Access 2013-2018: articles in journals (GOA4)
Mathema�cs: Selected Tables
Jrn. Art. Art% Rel% $/Art Rel%
All 241 10,614 $757 -17%
Fee 73 5,736 54% -7% $1,400 -11%
No-fee 168 4,878 46% 10%
STEM 241 10,614 $757 -27%
Fee 73 5,736 54% -21% $1,400 -7%
No-fee 168 4,878 46% 47%
Table 10.29. Key facts, mathema�cs
Jour. %Fee %All Art. %Fee %All
$1,400+ 9 12% 4% 3,137 55% 30%
$600-$1.399 31 42% 13% 1,730 30% 16%
$200-$599 9 12% 4% 363 6% 3%
$0.01-$199 24 33% 10% 506 9% 5%
No fee 168 70% 4,878 46%
Table 10.30. Fee level, mathema�cs
Region Journals Articles %No-fee $/article
Western Europe 69 5,620 13% $1,369
Eastern Europe 65 1,775 78% $154
Pacific/English 21 1,145 98% $19
Asia 47 1,014 66% $20
Latin America 17 548 89% $23
Middle East 20 498 96% $7
Africa 2 14 7% $414
Table 10.31. Region, mathema�cs
Includes statistics. Relatively low overall costs, partly because there’sonly one expensive region: Pacific/English is almost entirely no-fee.What’s more typical is that a majority of fee articles are in the most ex-pensive journals.
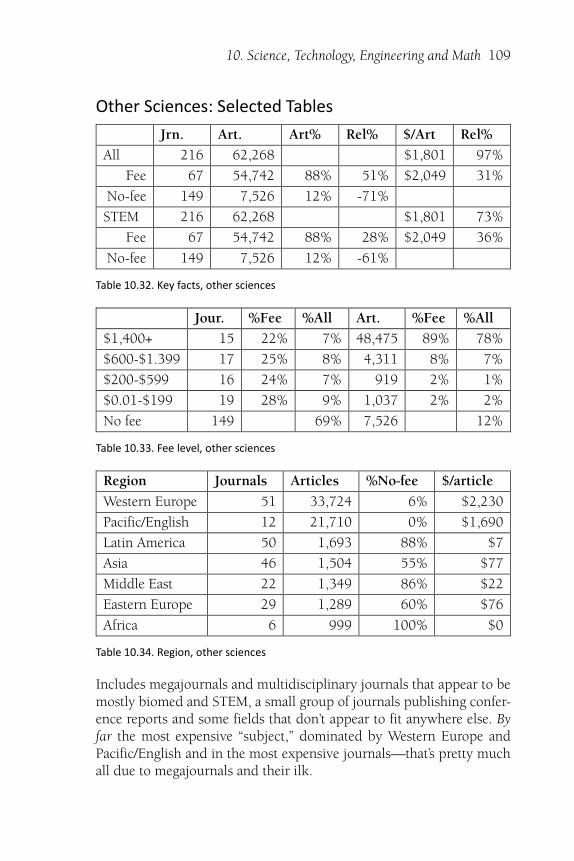
10. Science, Technology, Engineering and Math 109
Other Sciences: Selected Tables
Jrn. Art. Art% Rel% $/Art Rel%
All 216 62,268 $1,801 97%
Fee 67 54,742 88% 51% $2,049 31%
No-fee 149 7,526 12% -71%
STEM 216 62,268 $1,801 73%
Fee 67 54,742 88% 28% $2,049 36%
No-fee 149 7,526 12% -61%
Table 10.32. Key facts, other sciences
Jour. %Fee %All Art. %Fee %All
$1,400+ 15 22% 7% 48,475 89% 78%
$600-$1.399 17 25% 8% 4,311 8% 7%
$200-$599 16 24% 7% 919 2% 1%
$0.01-$199 19 28% 9% 1,037 2% 2%
No fee 149 69% 7,526 12%
Table 10.33. Fee level, other sciences
Region Journals Articles %No-fee $/article
Western Europe 51 33,724 6% $2,230
Pacific/English 12 21,710 0% $1,690
Latin America 50 1,693 88% $7
Asia 46 1,504 55% $77
Middle East 22 1,349 86% $22
Eastern Europe 29 1,289 60% $76
Africa 6 999 100% $0
Table 10.34. Region, other sciences
Includes megajournals and multidisciplinary journals that appear to bemostly biomed and STEM, a small group of journals publishing confer-ence reports and some fields that don’t appear to fit anywhere else. Byfar the most expensive “subject,” dominated by Western Europe andPacific/English and in the most expensive journals—that’s pretty muchall due to megajournals and their ilk.
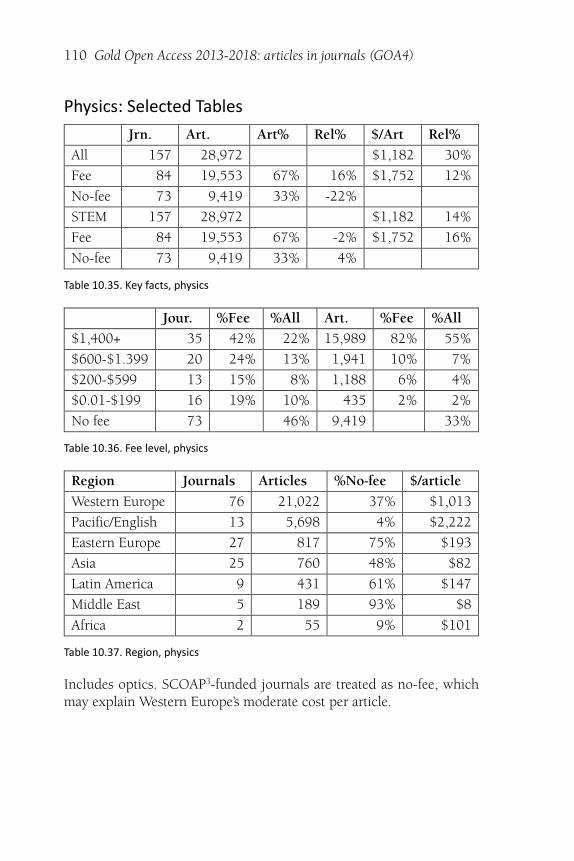
110 Gold Open Access 2013-2018: articles in journals (GOA4)
Physics: Selected Tables
Jrn. Art. Art% Rel% $/Art Rel%
All 157 28,972 $1,182 30%
Fee 84 19,553 67% 16% $1,752 12%
No-fee 73 9,419 33% -22%
STEM 157 28,972 $1,182 14%
Fee 84 19,553 67% -2% $1,752 16%
No-fee 73 9,419 33% 4%
Table 10.35. Key facts, physics
Jour. %Fee %All Art. %Fee %All
$1,400+ 35 42% 22% 15,989 82% 55%
$600-$1.399 20 24% 13% 1,941 10% 7%
$200-$599 13 15% 8% 1,188 6% 4%
$0.01-$199 16 19% 10% 435 2% 2%
No fee 73 46% 9,419 33%
Table 10.36. Fee level, physics
Region Journals Articles %No-fee $/article
Western Europe 76 21,022 37% $1,013
Pacific/English 13 5,698 4% $2,222
Eastern Europe 27 817 75% $193
Asia 25 760 48% $82
Latin America 9 431 61% $147
Middle East 5 189 93% $8
Africa 2 55 9% $101
Table 10.37. Region, physics
Includes optics. SCOAP3-funded journals are treated as no-fee, whichmay explain Western Europe’s moderate cost per article.
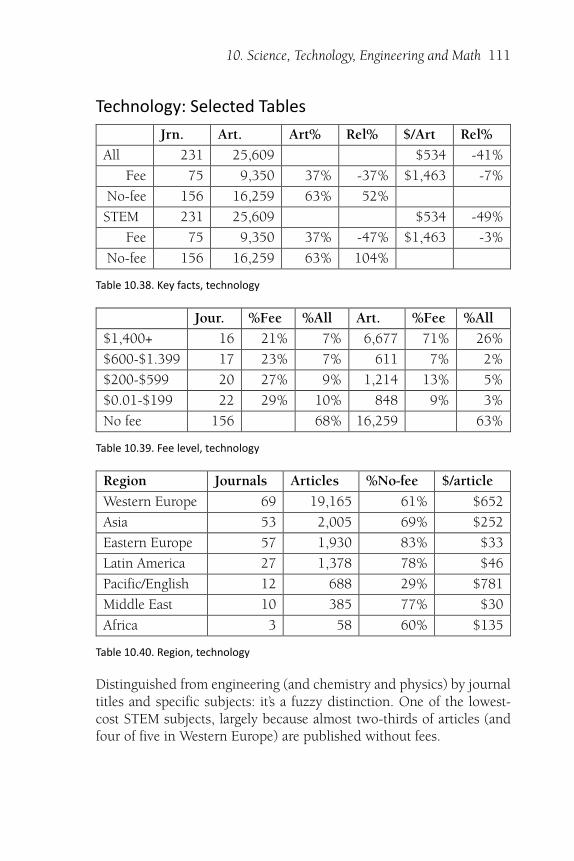
10. Science, Technology, Engineering and Math 111
Technology: Selected Tables
Jrn. Art. Art% Rel% $/Art Rel%
All 231 25,609 $534 -41%
Fee 75 9,350 37% -37% $1,463 -7%
No-fee 156 16,259 63% 52%
STEM 231 25,609 $534 -49%
Fee 75 9,350 37% -47% $1,463 -3%
No-fee 156 16,259 63% 104%
Table 10.38. Key facts, technology
Jour. %Fee %All Art. %Fee %All
$1,400+ 16 21% 7% 6,677 71% 26%
$600-$1.399 17 23% 7% 611 7% 2%
$200-$599 20 27% 9% 1,214 13% 5%
$0.01-$199 22 29% 10% 848 9% 3%
No fee 156 68% 16,259 63%
Table 10.39. Fee level, technology
Region Journals Articles %No-fee $/article
Western Europe 69 19,165 61% $652
Asia 53 2,005 69% $252
Eastern Europe 57 1,930 83% $33
Latin America 27 1,378 78% $46
Pacific/English 12 688 29% $781
Middle East 10 385 77% $30
Africa 3 58 60% $135
Table 10.40. Region, technology
Distinguished from engineering (and chemistry and physics) by journaltitles and specific subjects: it’s a fuzzy distinction. One of the lowest-cost STEM subjects, largely because almost two-thirds of articles (andfour of five in Western Europe) are published without fees.
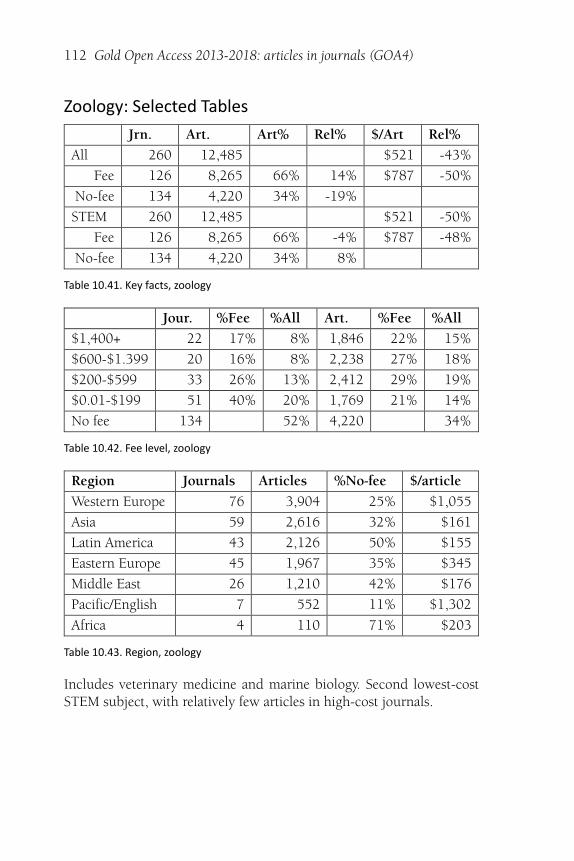
112 Gold Open Access 2013-2018: articles in journals (GOA4)
Zoology: Selected Tables
Jrn. Art. Art% Rel% $/Art Rel%
All 260 12,485 $521 -43%
Fee 126 8,265 66% 14% $787 -50%
No-fee 134 4,220 34% -19%
STEM 260 12,485 $521 -50%
Fee 126 8,265 66% -4% $787 -48%
No-fee 134 4,220 34% 8%
Table 10.41. Key facts, zoology
Jour. %Fee %All Art. %Fee %All
$1,400+ 22 17% 8% 1,846 22% 15%
$600-$1.399 20 16% 8% 2,238 27% 18%
$200-$599 33 26% 13% 2,412 29% 19%
$0.01-$199 51 40% 20% 1,769 21% 14%
No fee 134 52% 4,220 34%
Table 10.42. Fee level, zoology
Region Journals Articles %No-fee $/article
Western Europe 76 3,904 25% $1,055
Asia 59 2,616 32% $161
Latin America 43 2,126 50% $155
Eastern Europe 45 1,967 35% $345
Middle East 26 1,210 42% $176
Pacific/English 7 552 11% $1,302
Africa 4 110 71% $203
Table 10.43. Region, zoology
Includes veterinary medicine and marine biology. Second lowest-costSTEM subject, with relatively few articles in high-cost journals.

113
11. Humani�es & Social Sciences
The humanities and social sciences (H&SS) have many more gold OA jour-nals than other segments (more than 5,900 in all), but they’re mostlysmaller journals from universities and colleges, and very few charge fees.Total potential revenue is a tiny fraction of the other segments, less thanone-fifteenth that of biomed.
Jrn. Art. Art% $/Art
H&SS 5,937 169,306 $123
Fee 784 37,307 22% $558
No-fee 5,153 131,999 78%
Table 11.1. Key facts, H&SS
Ar�cles and Journals
2018 2017 2016 2015 2014 2013
Journals 5,508 5,727 5,577 5,258 4,788 4,302
%No-fee 87% 87% 87% 88% 88% 89%
Articles 169,306 171,584 163,123 147,097 130,659 116,277
%No-fee 78% 80% 79% 81% 82% 83%
Table 11.2. Ar�cles and journals by year, H&SS
A small drop in articles in 2018, but reasonable growth over the years.No-fee percentages are declining, but very slowly.
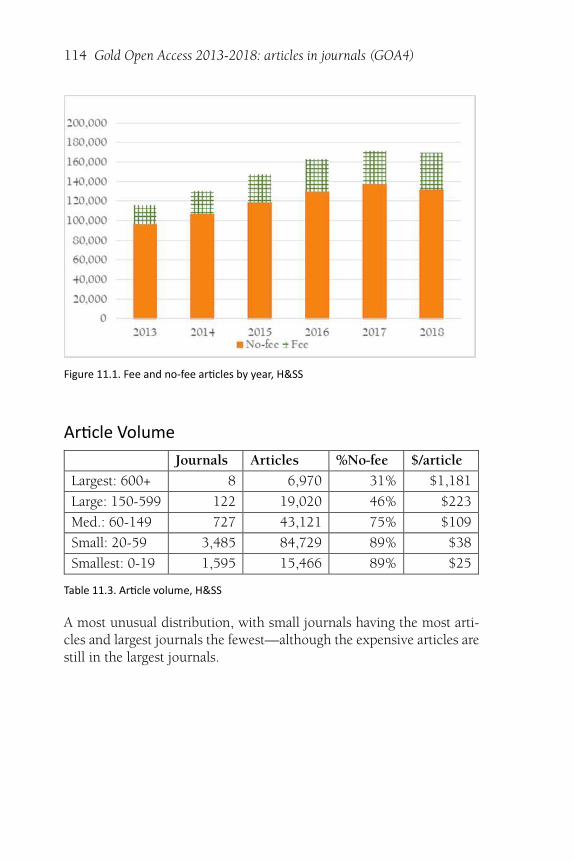
114 Gold Open Access 2013-2018: articles in journals (GOA4)
Figure 11.1. Fee and no-fee ar�cles by year, H&SS
Ar�cle Volume
Journals Articles %No-fee $/article
Largest: 600+ 8 6,970 31% $1,181
Large: 150-599 122 19,020 46% $223
Med.: 60-149 727 43,121 75% $109
Small: 20-59 3,485 84,729 89% $38
Smallest: 0-19 1,595 15,466 89% $25
Table 11.3. Ar�cle volume, H&SS
A most unusual distribution, with small journals having the most arti-cles and largest journals the fewest—although the expensive articles arestill in the largest journals.
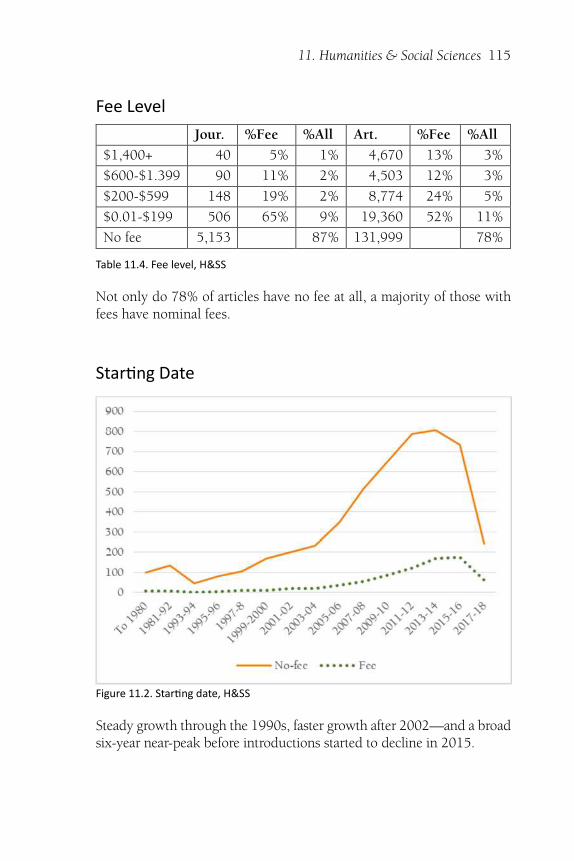
11. Humanities & Social Sciences 115
Fee Level
Jour. %Fee %All Art. %Fee %All
$1,400+ 40 5% 1% 4,670 13% 3%
$600-$1.399 90 11% 2% 4,503 12% 3%
$200-$599 148 19% 2% 8,774 24% 5%
$0.01-$199 506 65% 9% 19,360 52% 11%
No fee 5,153 87% 131,999 78%
Table 11.4. Fee level, H&SS
Not only do 78% of articles have no fee at all, a majority of those withfees have nominal fees.
Star�ng Date
Figure 11.2. Star�ng date, H&SS
Steady growth through the 1990s, faster growth after 2002—and a broadsix-year near-peak before introductions started to decline in 2015.
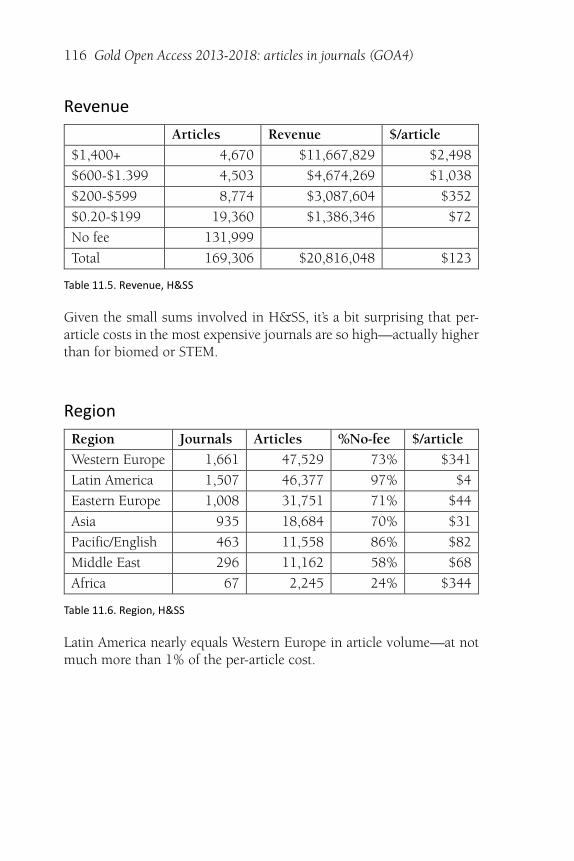
116 Gold Open Access 2013-2018: articles in journals (GOA4)
Revenue
Articles Revenue $/article
$1,400+ 4,670 $11,667,829 $2,498
$600-$1.399 4,503 $4,674,269 $1,038
$200-$599 8,774 $3,087,604 $352
$0.20-$199 19,360 $1,386,346 $72
No fee 131,999
Total 169,306 $20,816,048 $123
Table 11.5. Revenue, H&SS
Given the small sums involved in H&SS, it’s a bit surprising that per-article costs in the most expensive journals are so high—actually higherthan for biomed or STEM.
Region
Region Journals Articles %No-fee $/article
Western Europe 1,661 47,529 73% $341
Latin America 1,507 46,377 97% $4
Eastern Europe 1,008 31,751 71% $44
Asia 935 18,684 70% $31
Pacific/English 463 11,558 86% $82
Middle East 296 11,162 58% $68
Africa 67 2,245 24% $344
Table 11.6. Region, H&SS
Latin America nearly equals Western Europe in article volume—at notmuch more than 1% of the per-article cost.
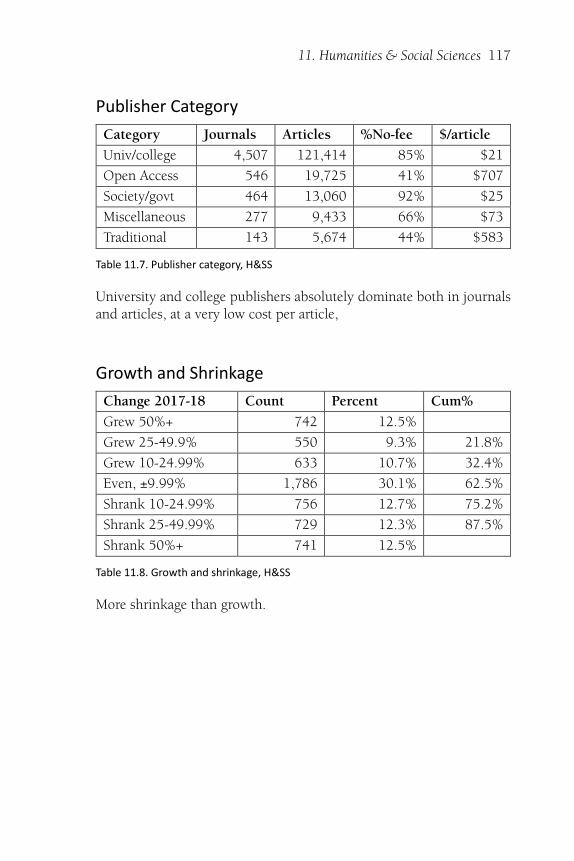
11. Humanities & Social Sciences 117
Publisher Category
Category Journals Articles %No-fee $/article
Univ/college 4,507 121,414 85% $21
Open Access 546 19,725 41% $707
Society/govt 464 13,060 92% $25
Miscellaneous 277 9,433 66% $73
Traditional 143 5,674 44% $583
Table 11.7. Publisher category, H&SS
University and college publishers absolutely dominate both in journalsand articles, at a very low cost per article,
Growth and Shrinkage
Change 2017-18 Count Percent Cum%
Grew 50%+ 742 12.5%
Grew 25-49.9% 550 9.3% 21.8%
Grew 10-24.99% 633 10.7% 32.4%
Even, ±9.99% 1,786 30.1% 62.5%
Shrank 10-24.99% 756 12.7% 75.2%
Shrank 25-49.99% 729 12.3% 87.5%
Shrank 50%+ 741 12.5%
Table 11.8. Growth and shrinkage, H&SS
More shrinkage than growth.
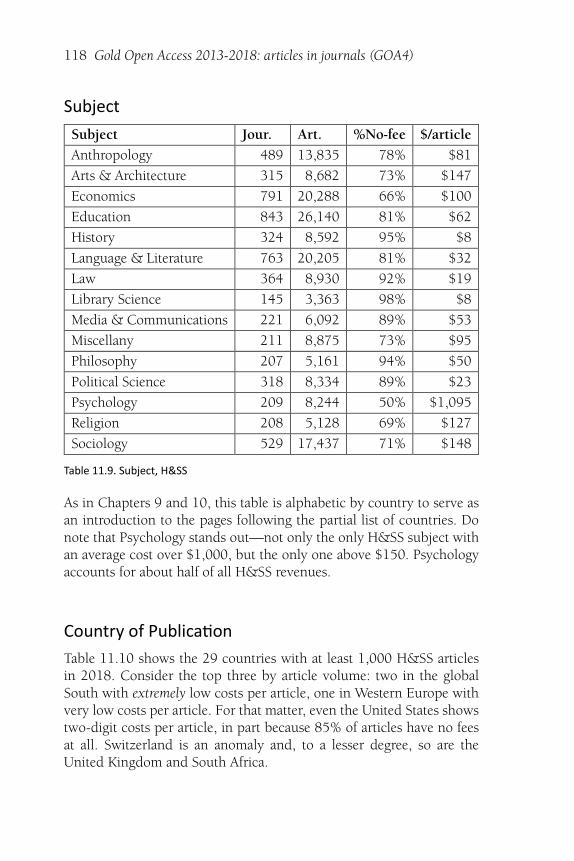
118 Gold Open Access 2013-2018: articles in journals (GOA4)
Subject
Subject Jour. Art. %No-fee $/article
Anthropology 489 13,835 78% $81
Arts & Architecture 315 8,682 73% $147
Economics 791 20,288 66% $100
Education 843 26,140 81% $62
History 324 8,592 95% $8
Language & Literature 763 20,205 81% $32
Law 364 8,930 92% $19
Library Science 145 3,363 98% $8
Media & Communications 221 6,092 89% $53
Miscellany 211 8,875 73% $95
Philosophy 207 5,161 94% $50
Political Science 318 8,334 89% $23
Psychology 209 8,244 50% $1,095
Religion 208 5,128 69% $127
Sociology 529 17,437 71% $148
Table 11.9. Subject, H&SS
As in Chapters 9 and 10, this table is alphabetic by country to serve asan introduction to the pages following the partial list of countries. Donote that Psychology stands out—not only the only H&SS subject withan average cost over $1,000, but the only one above $150. Psychologyaccounts for about half of all H&SS revenues.
Country of Publica�on
Table 11.10 shows the 29 countries with at least 1,000 H&SS articlesin 2018. Consider the top three by article volume: two in the globalSouth with extremely low costs per article, one in Western Europe withvery low costs per article. For that matter, even the United States showstwo-digit costs per article, in part because 85% of articles have no feesat all. Switzerland is an anomaly and, to a lesser degree, so are theUnited Kingdom and South Africa.
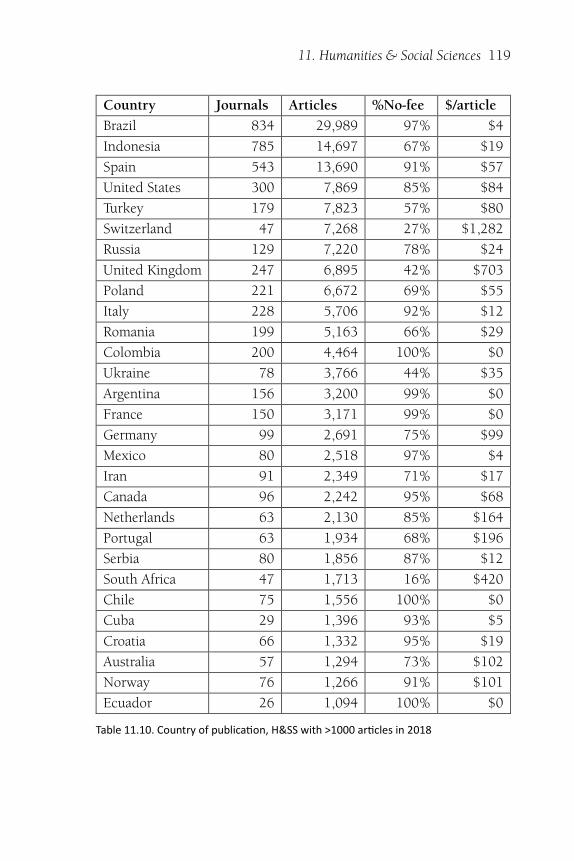
11. Humanities & Social Sciences 119
Country Journals Articles %No-fee $/article
Brazil 834 29,989 97% $4
Indonesia 785 14,697 67% $19
Spain 543 13,690 91% $57
United States 300 7,869 85% $84
Turkey 179 7,823 57% $80
Switzerland 47 7,268 27% $1,282
Russia 129 7,220 78% $24
United Kingdom 247 6,895 42% $703
Poland 221 6,672 69% $55
Italy 228 5,706 92% $12
Romania 199 5,163 66% $29
Colombia 200 4,464 100% $0
Ukraine 78 3,766 44% $35
Argentina 156 3,200 99% $0
France 150 3,171 99% $0
Germany 99 2,691 75% $99
Mexico 80 2,518 97% $4
Iran 91 2,349 71% $17
Canada 96 2,242 95% $68
Netherlands 63 2,130 85% $164
Portugal 63 1,934 68% $196
Serbia 80 1,856 87% $12
South Africa 47 1,713 16% $420
Chile 75 1,556 100% $0
Cuba 29 1,396 93% $5
Croatia 66 1,332 95% $19
Australia 57 1,294 73% $102
Norway 76 1,266 91% $101
Ecuador 26 1,094 100% $0
Table 11.10. Country of publica�on, H&SS with >1000 ar�cles in 2018
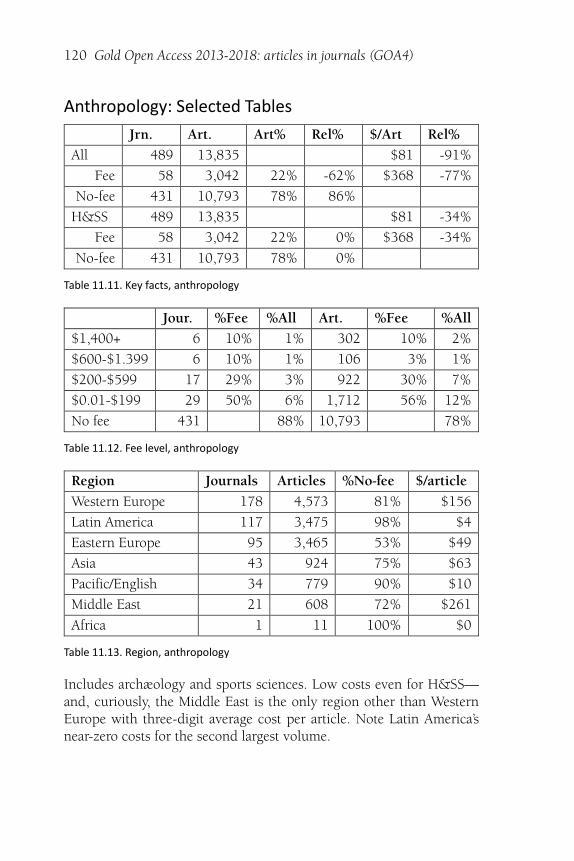
120 Gold Open Access 2013-2018: articles in journals (GOA4)
Anthropology: Selected Tables
Jrn. Art. Art% Rel% $/Art Rel%
All 489 13,835 $81 -91%
Fee 58 3,042 22% -62% $368 -77%
No-fee 431 10,793 78% 86%
H&SS 489 13,835 $81 -34%
Fee 58 3,042 22% 0% $368 -34%
No-fee 431 10,793 78% 0%
Table 11.11. Key facts, anthropology
Jour. %Fee %All Art. %Fee %All
$1,400+ 6 10% 1% 302 10% 2%
$600-$1.399 6 10% 1% 106 3% 1%
$200-$599 17 29% 3% 922 30% 7%
$0.01-$199 29 50% 6% 1,712 56% 12%
No fee 431 88% 10,793 78%
Table 11.12. Fee level, anthropology
Region Journals Articles %No-fee $/article
Western Europe 178 4,573 81% $156
Latin America 117 3,475 98% $4
Eastern Europe 95 3,465 53% $49
Asia 43 924 75% $63
Pacific/English 34 779 90% $10
Middle East 21 608 72% $261
Africa 1 11 100% $0
Table 11.13. Region, anthropology
Includes archæology and sports sciences. Low costs even for H&SS—and, curiously, the Middle East is the only region other than WesternEurope with three-digit average cost per article. Note Latin America’snear-zero costs for the second largest volume.
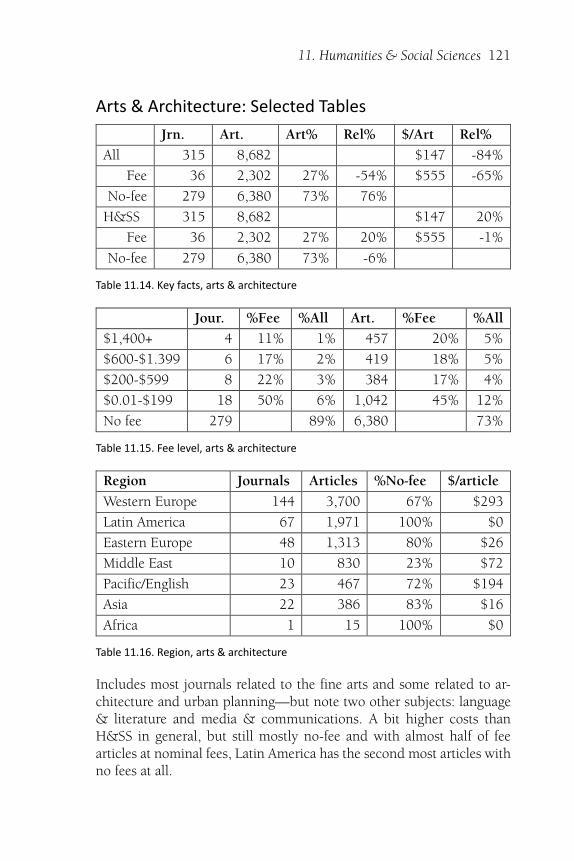
11. Humanities & Social Sciences 121
Arts & Architecture: Selected Tables
Jrn. Art. Art% Rel% $/Art Rel%
All 315 8,682 $147 -84%
Fee 36 2,302 27% -54% $555 -65%
No-fee 279 6,380 73% 76%
H&SS 315 8,682 $147 20%
Fee 36 2,302 27% 20% $555 -1%
No-fee 279 6,380 73% -6%
Table 11.14. Key facts, arts & architecture
Jour. %Fee %All Art. %Fee %All
$1,400+ 4 11% 1% 457 20% 5%
$600-$1.399 6 17% 2% 419 18% 5%
$200-$599 8 22% 3% 384 17% 4%
$0.01-$199 18 50% 6% 1,042 45% 12%
No fee 279 89% 6,380 73%
Table 11.15. Fee level, arts & architecture
Region Journals Articles %No-fee $/article
Western Europe 144 3,700 67% $293
Latin America 67 1,971 100% $0
Eastern Europe 48 1,313 80% $26
Middle East 10 830 23% $72
Pacific/English 23 467 72% $194
Asia 22 386 83% $16
Africa 1 15 100% $0
Table 11.16. Region, arts & architecture
Includes most journals related to the fine arts and some related to ar-chitecture and urban planning—but note two other subjects: language& literature and media & communications. A bit higher costs thanH&SS in general, but still mostly no-fee and with almost half of feearticles at nominal fees, Latin America has the second most articles withno fees at all.
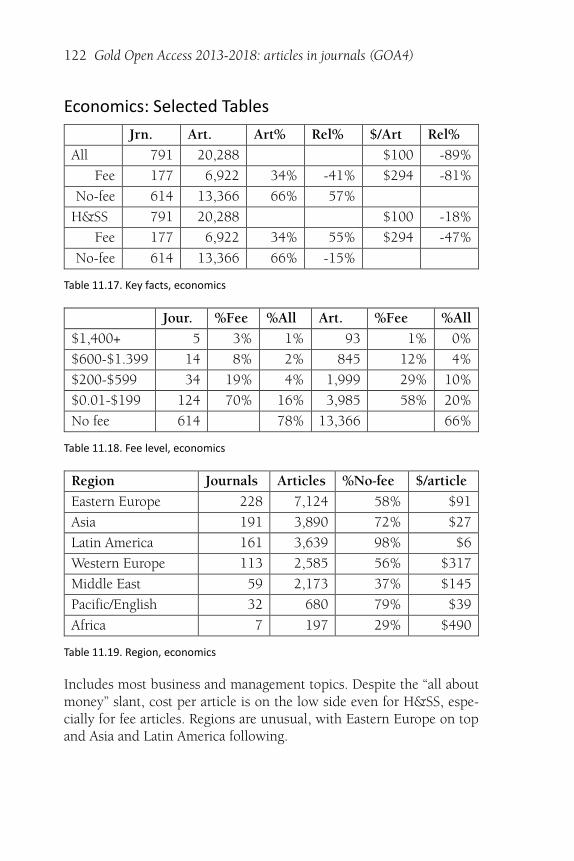
122 Gold Open Access 2013-2018: articles in journals (GOA4)
Economics: Selected Tables
Jrn. Art. Art% Rel% $/Art Rel%
All 791 20,288 $100 -89%
Fee 177 6,922 34% -41% $294 -81%
No-fee 614 13,366 66% 57%
H&SS 791 20,288 $100 -18%
Fee 177 6,922 34% 55% $294 -47%
No-fee 614 13,366 66% -15%
Table 11.17. Key facts, economics
Jour. %Fee %All Art. %Fee %All
$1,400+ 5 3% 1% 93 1% 0%
$600-$1.399 14 8% 2% 845 12% 4%
$200-$599 34 19% 4% 1,999 29% 10%
$0.01-$199 124 70% 16% 3,985 58% 20%
No fee 614 78% 13,366 66%
Table 11.18. Fee level, economics
Region Journals Articles %No-fee $/article
Eastern Europe 228 7,124 58% $91
Asia 191 3,890 72% $27
Latin America 161 3,639 98% $6
Western Europe 113 2,585 56% $317
Middle East 59 2,173 37% $145
Pacific/English 32 680 79% $39
Africa 7 197 29% $490
Table 11.19. Region, economics
Includes most business and management topics. Despite the “all aboutmoney” slant, cost per article is on the low side even for H&SS, espe-cially for fee articles. Regions are unusual, with Eastern Europe on topand Asia and Latin America following.
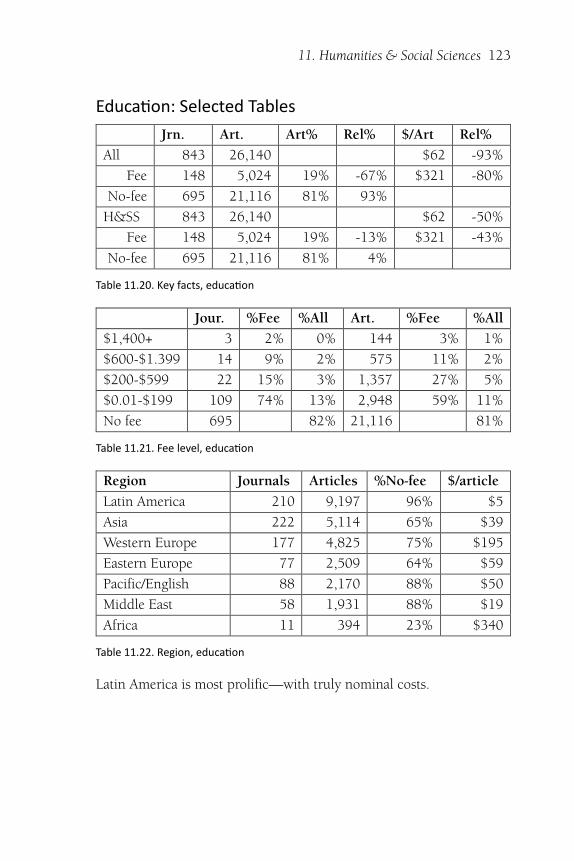
11. Humanities & Social Sciences 123
Educa�on: Selected Tables
Jrn. Art. Art% Rel% $/Art Rel%
All 843 26,140 $62 -93%
Fee 148 5,024 19% -67% $321 -80%
No-fee 695 21,116 81% 93%
H&SS 843 26,140 $62 -50%
Fee 148 5,024 19% -13% $321 -43%
No-fee 695 21,116 81% 4%
Table 11.20. Key facts, educa�on
Jour. %Fee %All Art. %Fee %All
$1,400+ 3 2% 0% 144 3% 1%
$600-$1.399 14 9% 2% 575 11% 2%
$200-$599 22 15% 3% 1,357 27% 5%
$0.01-$199 109 74% 13% 2,948 59% 11%
No fee 695 82% 21,116 81%
Table 11.21. Fee level, educa�on
Region Journals Articles %No-fee $/article
Latin America 210 9,197 96% $5
Asia 222 5,114 65% $39
Western Europe 177 4,825 75% $195
Eastern Europe 77 2,509 64% $59
Pacific/English 88 2,170 88% $50
Middle East 58 1,931 88% $19
Africa 11 394 23% $340
Table 11.22. Region, educa�on
Latin America is most prolific—with truly nominal costs.
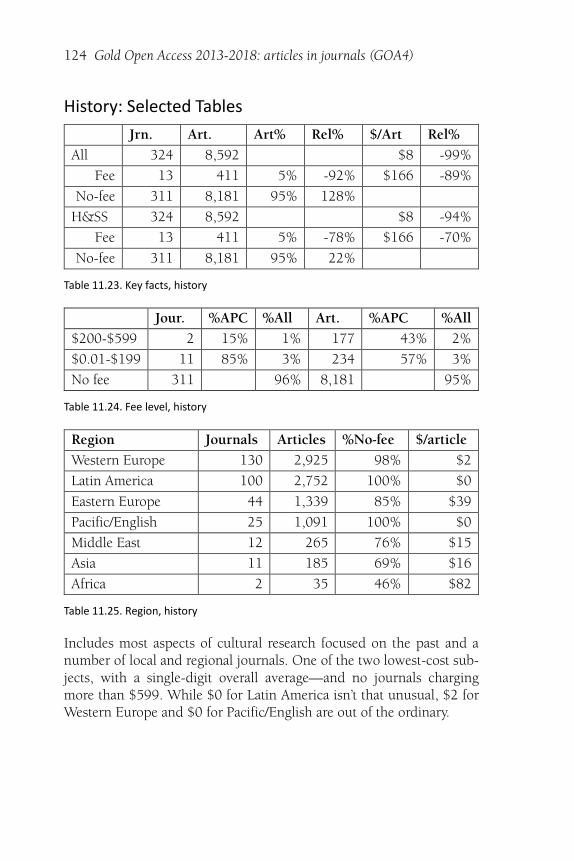
124 Gold Open Access 2013-2018: articles in journals (GOA4)
History: Selected Tables
Jrn. Art. Art% Rel% $/Art Rel%
All 324 8,592 $8 -99%
Fee 13 411 5% -92% $166 -89%
No-fee 311 8,181 95% 128%
H&SS 324 8,592 $8 -94%
Fee 13 411 5% -78% $166 -70%
No-fee 311 8,181 95% 22%
Table 11.23. Key facts, history
Jour. %APC %All Art. %APC %All
$200-$599 2 15% 1% 177 43% 2%
$0.01-$199 11 85% 3% 234 57% 3%
No fee 311 96% 8,181 95%
Table 11.24. Fee level, history
Region Journals Articles %No-fee $/article
Western Europe 130 2,925 98% $2
Latin America 100 2,752 100% $0
Eastern Europe 44 1,339 85% $39
Pacific/English 25 1,091 100% $0
Middle East 12 265 76% $15
Asia 11 185 69% $16
Africa 2 35 46% $82
Table 11.25. Region, history
Includes most aspects of cultural research focused on the past and anumber of local and regional journals. One of the two lowest-cost sub-jects, with a single-digit overall average—and no journals chargingmore than $599. While $0 for Latin America isn’t that unusual, $2 forWestern Europe and $0 for Pacific/English are out of the ordinary.
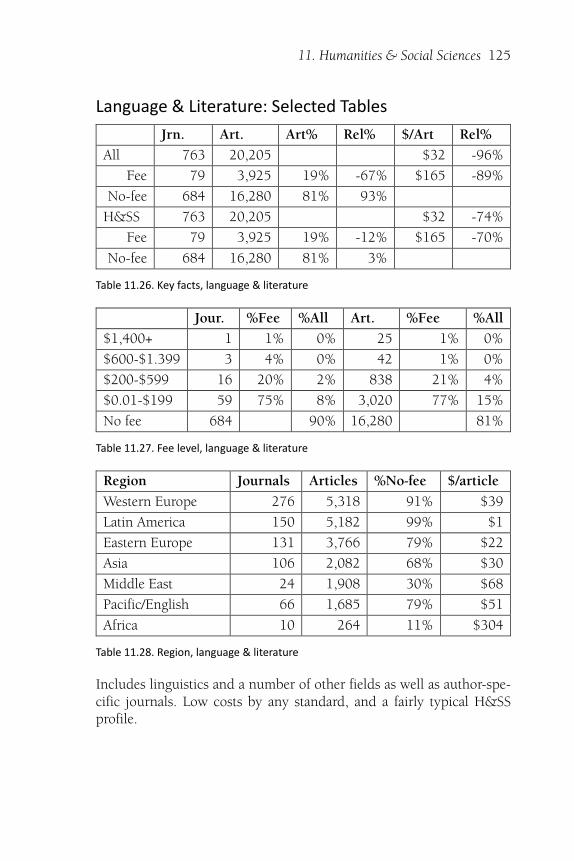
11. Humanities & Social Sciences 125
Language & Literature: Selected Tables
Jrn. Art. Art% Rel% $/Art Rel%
All 763 20,205 $32 -96%
Fee 79 3,925 19% -67% $165 -89%
No-fee 684 16,280 81% 93%
H&SS 763 20,205 $32 -74%
Fee 79 3,925 19% -12% $165 -70%
No-fee 684 16,280 81% 3%
Table 11.26. Key facts, language & literature
Jour. %Fee %All Art. %Fee %All
$1,400+ 1 1% 0% 25 1% 0%
$600-$1.399 3 4% 0% 42 1% 0%
$200-$599 16 20% 2% 838 21% 4%
$0.01-$199 59 75% 8% 3,020 77% 15%
No fee 684 90% 16,280 81%
Table 11.27. Fee level, language & literature
Region Journals Articles %No-fee $/article
Western Europe 276 5,318 91% $39
Latin America 150 5,182 99% $1
Eastern Europe 131 3,766 79% $22
Asia 106 2,082 68% $30
Middle East 24 1,908 30% $68
Pacific/English 66 1,685 79% $51
Africa 10 264 11% $304
Table 11.28. Region, language & literature
Includes linguistics and a number of other fields as well as author-spe-cific journals. Low costs by any standard, and a fairly typical H&SSprofile.
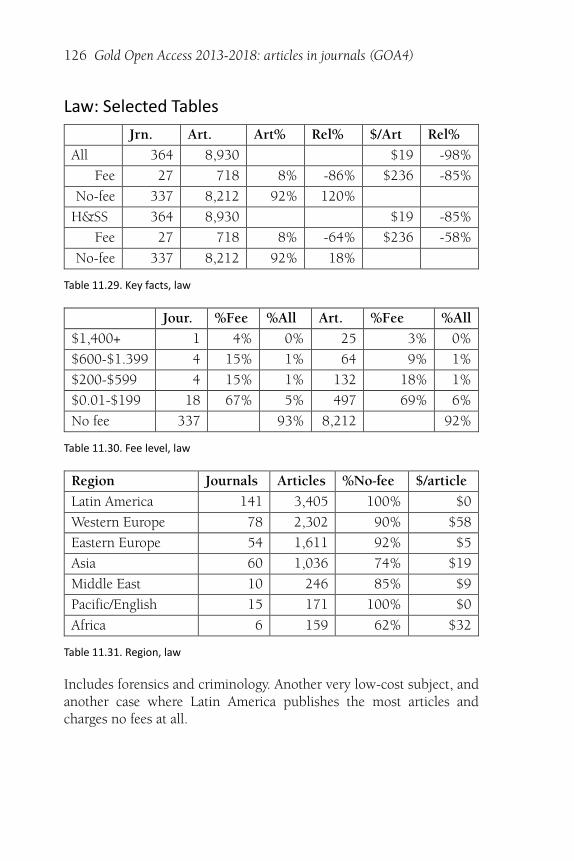
126 Gold Open Access 2013-2018: articles in journals (GOA4)
Law: Selected Tables
Jrn. Art. Art% Rel% $/Art Rel%
All 364 8,930 $19 -98%
Fee 27 718 8% -86% $236 -85%
No-fee 337 8,212 92% 120%
H&SS 364 8,930 $19 -85%
Fee 27 718 8% -64% $236 -58%
No-fee 337 8,212 92% 18%
Table 11.29. Key facts, law
Jour. %Fee %All Art. %Fee %All
$1,400+ 1 4% 0% 25 3% 0%
$600-$1.399 4 15% 1% 64 9% 1%
$200-$599 4 15% 1% 132 18% 1%
$0.01-$199 18 67% 5% 497 69% 6%
No fee 337 93% 8,212 92%
Table 11.30. Fee level, law
Region Journals Articles %No-fee $/article
Latin America 141 3,405 100% $0
Western Europe 78 2,302 90% $58
Eastern Europe 54 1,611 92% $5
Asia 60 1,036 74% $19
Middle East 10 246 85% $9
Pacific/English 15 171 100% $0
Africa 6 159 62% $32
Table 11.31. Region, law
Includes forensics and criminology. Another very low-cost subject, andanother case where Latin America publishes the most articles andcharges no fees at all.
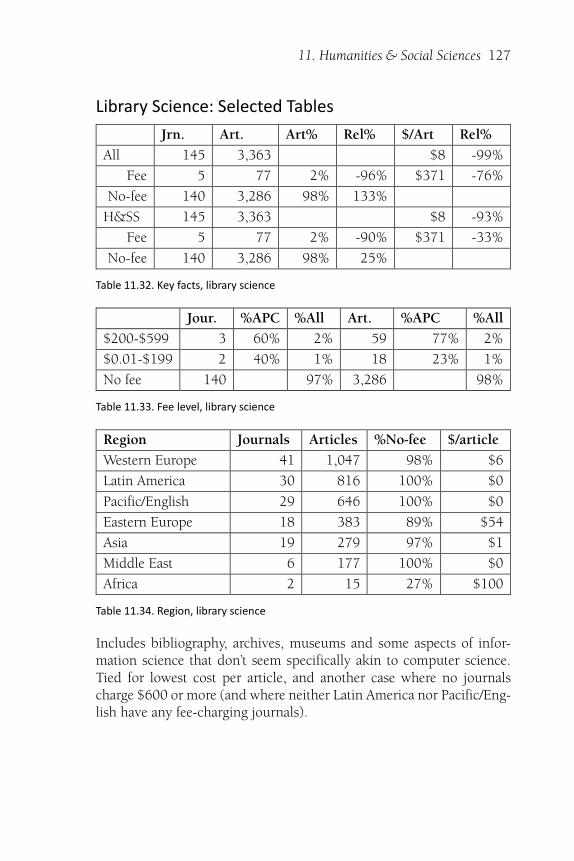
11. Humanities & Social Sciences 127
Library Science: Selected Tables
Jrn. Art. Art% Rel% $/Art Rel%
All 145 3,363 $8 -99%
Fee 5 77 2% -96% $371 -76%
No-fee 140 3,286 98% 133%
H&SS 145 3,363 $8 -93%
Fee 5 77 2% -90% $371 -33%
No-fee 140 3,286 98% 25%
Table 11.32. Key facts, library science
Jour. %APC %All Art. %APC %All
$200-$599 3 60% 2% 59 77% 2%
$0.01-$199 2 40% 1% 18 23% 1%
No fee 140 97% 3,286 98%
Table 11.33. Fee level, library science
Region Journals Articles %No-fee $/article
Western Europe 41 1,047 98% $6
Latin America 30 816 100% $0
Pacific/English 29 646 100% $0
Eastern Europe 18 383 89% $54
Asia 19 279 97% $1
Middle East 6 177 100% $0
Africa 2 15 27% $100
Table 11.34. Region, library science
Includes bibliography, archives, museums and some aspects of infor-mation science that don’t seem specifically akin to computer science.Tied for lowest cost per article, and another case where no journalscharge $600 or more (and where neither Latin America nor Pacific/Eng-lish have any fee-charging journals).
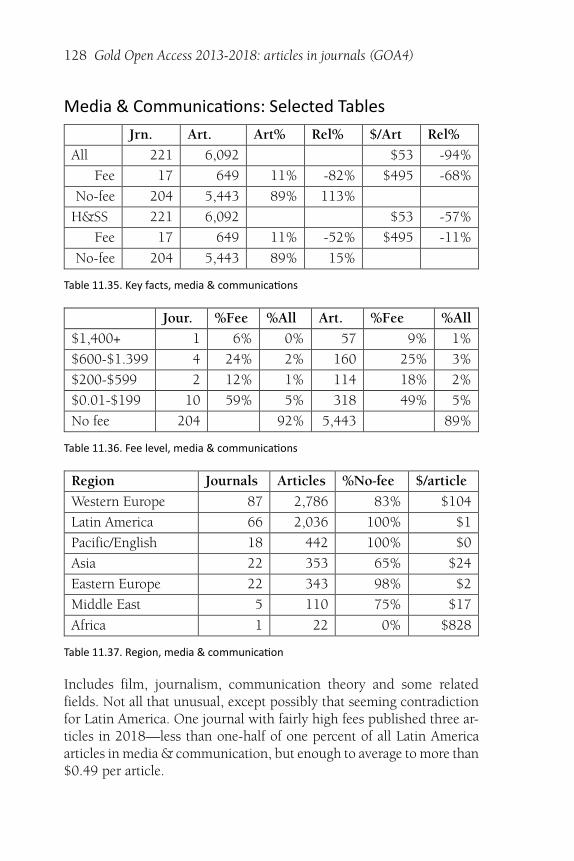
128 Gold Open Access 2013-2018: articles in journals (GOA4)
Media & Communica�ons: Selected Tables
Jrn. Art. Art% Rel% $/Art Rel%
All 221 6,092 $53 -94%
Fee 17 649 11% -82% $495 -68%
No-fee 204 5,443 89% 113%
H&SS 221 6,092 $53 -57%
Fee 17 649 11% -52% $495 -11%
No-fee 204 5,443 89% 15%
Table 11.35. Key facts, media & communica�ons
Jour. %Fee %All Art. %Fee %All
$1,400+ 1 6% 0% 57 9% 1%
$600-$1.399 4 24% 2% 160 25% 3%
$200-$599 2 12% 1% 114 18% 2%
$0.01-$199 10 59% 5% 318 49% 5%
No fee 204 92% 5,443 89%
Table 11.36. Fee level, media & communica�ons
Region Journals Articles %No-fee $/article
Western Europe 87 2,786 83% $104
Latin America 66 2,036 100% $1
Pacific/English 18 442 100% $0
Asia 22 353 65% $24
Eastern Europe 22 343 98% $2
Middle East 5 110 75% $17
Africa 1 22 0% $828
Table 11.37. Region, media & communica�on
Includes film, journalism, communication theory and some relatedfields. Not all that unusual, except possibly that seeming contradictionfor Latin America. One journal with fairly high fees published three ar-ticles in 2018—less than one-half of one percent of all Latin Americaarticles in media & communication, but enough to average to more than$0.49 per article.
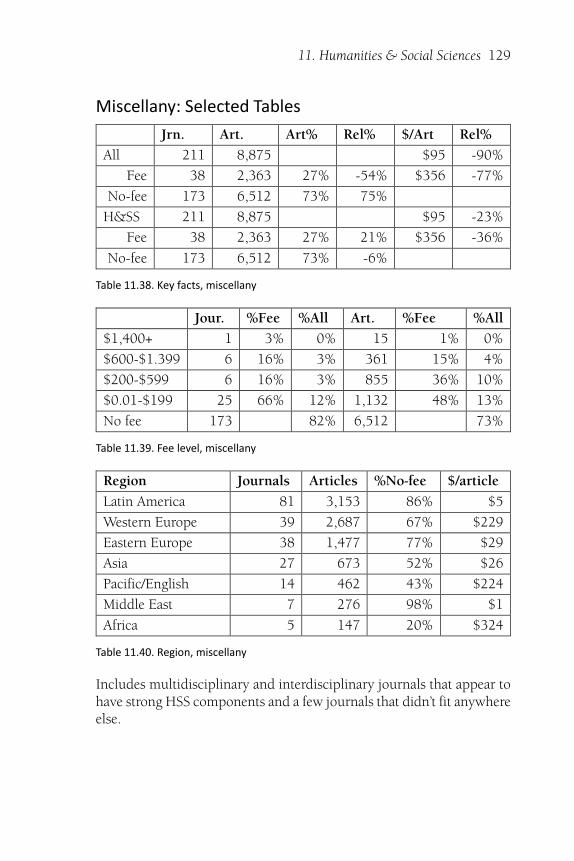
11. Humanities & Social Sciences 129
Miscellany: Selected Tables
Jrn. Art. Art% Rel% $/Art Rel%
All 211 8,875 $95 -90%
Fee 38 2,363 27% -54% $356 -77%
No-fee 173 6,512 73% 75%
H&SS 211 8,875 $95 -23%
Fee 38 2,363 27% 21% $356 -36%
No-fee 173 6,512 73% -6%
Table 11.38. Key facts, miscellany
Jour. %Fee %All Art. %Fee %All
$1,400+ 1 3% 0% 15 1% 0%
$600-$1.399 6 16% 3% 361 15% 4%
$200-$599 6 16% 3% 855 36% 10%
$0.01-$199 25 66% 12% 1,132 48% 13%
No fee 173 82% 6,512 73%
Table 11.39. Fee level, miscellany
Region Journals Articles %No-fee $/article
Latin America 81 3,153 86% $5
Western Europe 39 2,687 67% $229
Eastern Europe 38 1,477 77% $29
Asia 27 673 52% $26
Pacific/English 14 462 43% $224
Middle East 7 276 98% $1
Africa 5 147 20% $324
Table 11.40. Region, miscellany
Includes multidisciplinary and interdisciplinary journals that appear tohave strong HSS components and a few journals that didn’t fit anywhereelse.
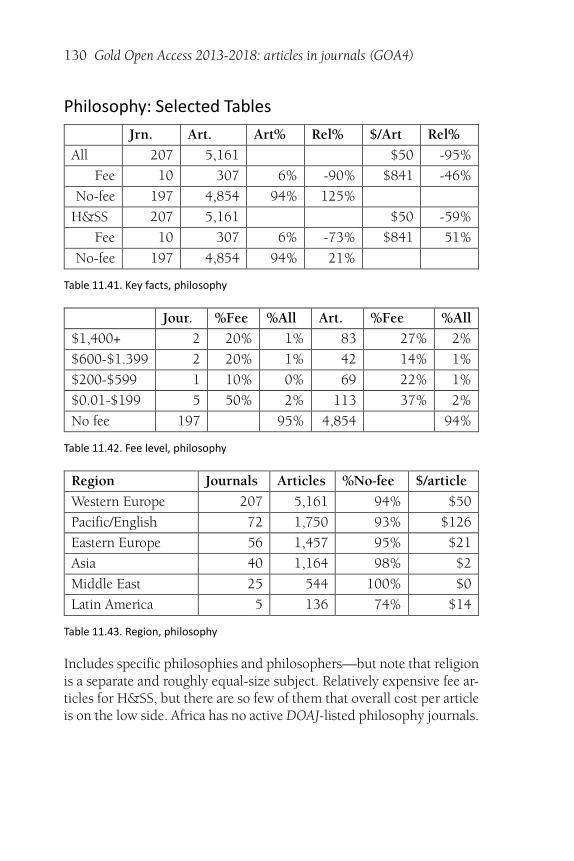
130 Gold Open Access 2013-2018: articles in journals (GOA4)
Philosophy: Selected Tables
Jrn. Art. Art% Rel% $/Art Rel%
All 207 5,161 $50 -95%
Fee 10 307 6% -90% $841 -46%
No-fee 197 4,854 94% 125%
H&SS 207 5,161 $50 -59%
Fee 10 307 6% -73% $841 51%
No-fee 197 4,854 94% 21%
Table 11.41. Key facts, philosophy
Jour. %Fee %All Art. %Fee %All
$1,400+ 2 20% 1% 83 27% 2%
$600-$1.399 2 20% 1% 42 14% 1%
$200-$599 1 10% 0% 69 22% 1%
$0.01-$199 5 50% 2% 113 37% 2%
No fee 197 95% 4,854 94%
Table 11.42. Fee level, philosophy
Region Journals Articles %No-fee $/article
Western Europe 207 5,161 94% $50
Pacific/English 72 1,750 93% $126
Eastern Europe 56 1,457 95% $21
Asia 40 1,164 98% $2
Middle East 25 544 100% $0
Latin America 5 136 74% $14
Table 11.43. Region, philosophy
Includes specific philosophies and philosophers—but note that religionis a separate and roughly equal-size subject. Relatively expensive fee ar-ticles for H&SS, but there are so few of them that overall cost per articleis on the low side. Africa has no active DOAJ-listed philosophy journals.
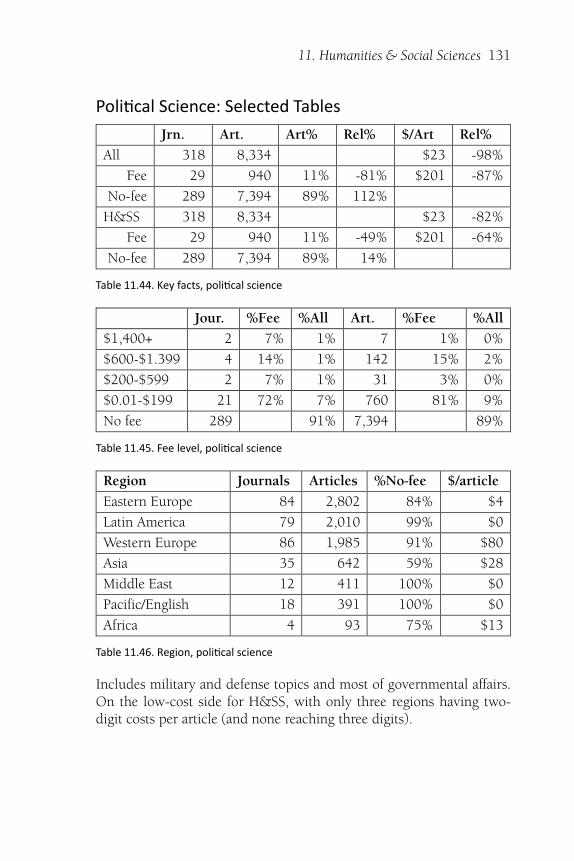
11. Humanities & Social Sciences 131
Poli�cal Science: Selected Tables
Jrn. Art. Art% Rel% $/Art Rel%
All 318 8,334 $23 -98%
Fee 29 940 11% -81% $201 -87%
No-fee 289 7,394 89% 112%
H&SS 318 8,334 $23 -82%
Fee 29 940 11% -49% $201 -64%
No-fee 289 7,394 89% 14%
Table 11.44. Key facts, poli�cal science
Jour. %Fee %All Art. %Fee %All
$1,400+ 2 7% 1% 7 1% 0%
$600-$1.399 4 14% 1% 142 15% 2%
$200-$599 2 7% 1% 31 3% 0%
$0.01-$199 21 72% 7% 760 81% 9%
No fee 289 91% 7,394 89%
Table 11.45. Fee level, poli�cal science
Region Journals Articles %No-fee $/article
Eastern Europe 84 2,802 84% $4
Latin America 79 2,010 99% $0
Western Europe 86 1,985 91% $80
Asia 35 642 59% $28
Middle East 12 411 100% $0
Pacific/English 18 391 100% $0
Africa 4 93 75% $13
Table 11.46. Region, poli�cal science
Includes military and defense topics and most of governmental affairs.On the low-cost side for H&SS, with only three regions having two-digit costs per article (and none reaching three digits).
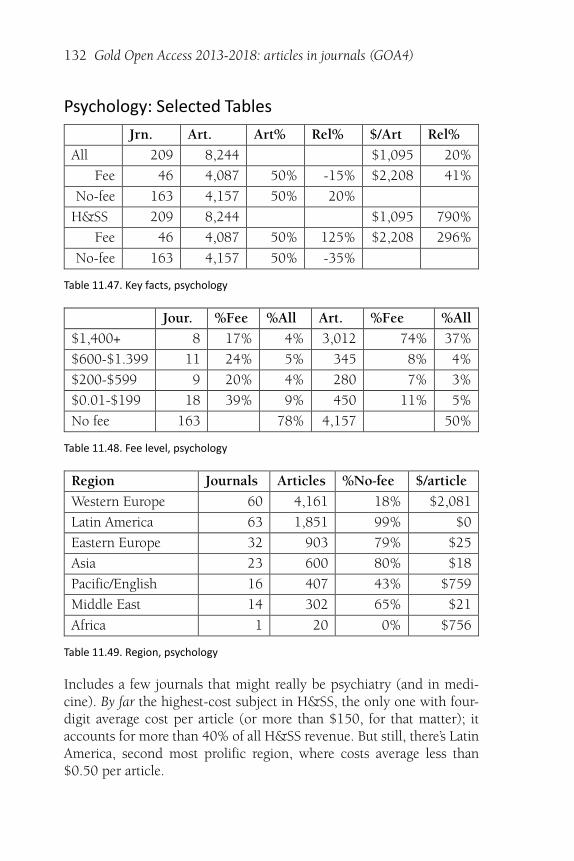
132 Gold Open Access 2013-2018: articles in journals (GOA4)
Psychology: Selected Tables
Jrn. Art. Art% Rel% $/Art Rel%
All 209 8,244 $1,095 20%
Fee 46 4,087 50% -15% $2,208 41%
No-fee 163 4,157 50% 20%
H&SS 209 8,244 $1,095 790%
Fee 46 4,087 50% 125% $2,208 296%
No-fee 163 4,157 50% -35%
Table 11.47. Key facts, psychology
Jour. %Fee %All Art. %Fee %All
$1,400+ 8 17% 4% 3,012 74% 37%
$600-$1.399 11 24% 5% 345 8% 4%
$200-$599 9 20% 4% 280 7% 3%
$0.01-$199 18 39% 9% 450 11% 5%
No fee 163 78% 4,157 50%
Table 11.48. Fee level, psychology
Region Journals Articles %No-fee $/article
Western Europe 60 4,161 18% $2,081
Latin America 63 1,851 99% $0
Eastern Europe 32 903 79% $25
Asia 23 600 80% $18
Pacific/English 16 407 43% $759
Middle East 14 302 65% $21
Africa 1 20 0% $756
Table 11.49. Region, psychology
Includes a few journals that might really be psychiatry (and in medi-cine). By far the highest-cost subject in H&SS, the only one with four-digit average cost per article (or more than $150, for that matter); itaccounts for more than 40% of all H&SS revenue. But still, there’s LatinAmerica, second most prolific region, where costs average less than$0.50 per article.
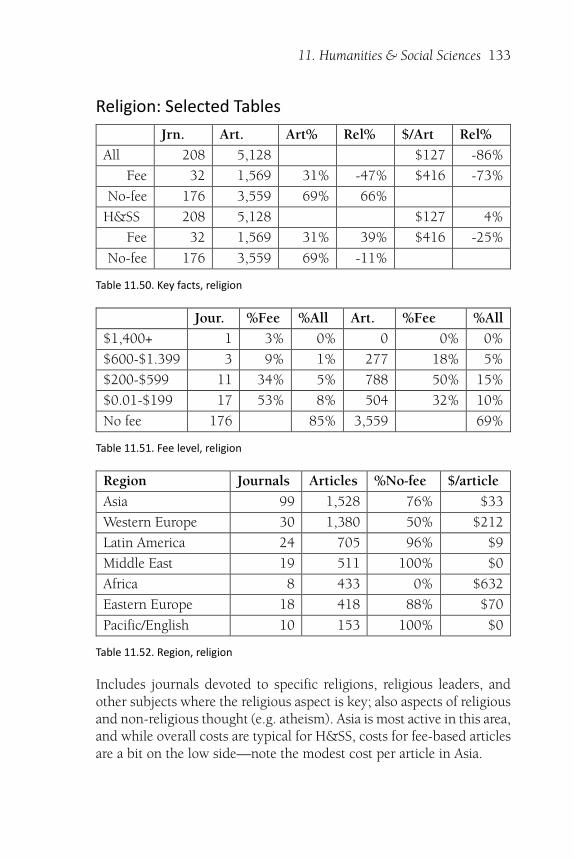
11. Humanities & Social Sciences 133
Religion: Selected Tables
Jrn. Art. Art% Rel% $/Art Rel%
All 208 5,128 $127 -86%
Fee 32 1,569 31% -47% $416 -73%
No-fee 176 3,559 69% 66%
H&SS 208 5,128 $127 4%
Fee 32 1,569 31% 39% $416 -25%
No-fee 176 3,559 69% -11%
Table 11.50. Key facts, religion
Jour. %Fee %All Art. %Fee %All
$1,400+ 1 3% 0% 0 0% 0%
$600-$1.399 3 9% 1% 277 18% 5%
$200-$599 11 34% 5% 788 50% 15%
$0.01-$199 17 53% 8% 504 32% 10%
No fee 176 85% 3,559 69%
Table 11.51. Fee level, religion
Region Journals Articles %No-fee $/article
Asia 99 1,528 76% $33
Western Europe 30 1,380 50% $212
Latin America 24 705 96% $9
Middle East 19 511 100% $0
Africa 8 433 0% $632
Eastern Europe 18 418 88% $70
Pacific/English 10 153 100% $0
Table 11.52. Region, religion
Includes journals devoted to specific religions, religious leaders, andother subjects where the religious aspect is key; also aspects of religiousand non-religious thought (e.g. atheism). Asia is most active in this area,and while overall costs are typical for H&SS, costs for fee-based articlesare a bit on the low side—note the modest cost per article in Asia.
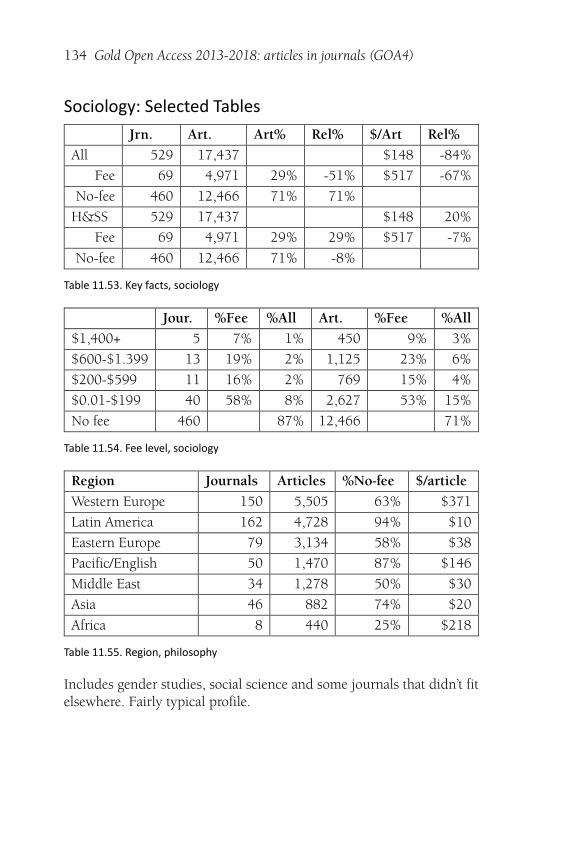
134 Gold Open Access 2013-2018: articles in journals (GOA4)
Sociology: Selected Tables
Jrn. Art. Art% Rel% $/Art Rel%
All 529 17,437 $148 -84%
Fee 69 4,971 29% -51% $517 -67%
No-fee 460 12,466 71% 71%
H&SS 529 17,437 $148 20%
Fee 69 4,971 29% 29% $517 -7%
No-fee 460 12,466 71% -8%
Table 11.53. Key facts, sociology
Jour. %Fee %All Art. %Fee %All
$1,400+ 5 7% 1% 450 9% 3%
$600-$1.399 13 19% 2% 1,125 23% 6%
$200-$599 11 16% 2% 769 15% 4%
$0.01-$199 40 58% 8% 2,627 53% 15%
No fee 460 87% 12,466 71%
Table 11.54. Fee level, sociology
Region Journals Articles %No-fee $/article
Western Europe 150 5,505 63% $371
Latin America 162 4,728 94% $10
Eastern Europe 79 3,134 58% $38
Pacific/English 50 1,470 87% $146
Middle East 34 1,278 50% $30
Asia 46 882 74% $20
Africa 8 440 25% $218
Table 11.55. Region, philosophy
Includes gender studies, social science and some journals that didn’t fitelsewhere. Fairly typical profile.
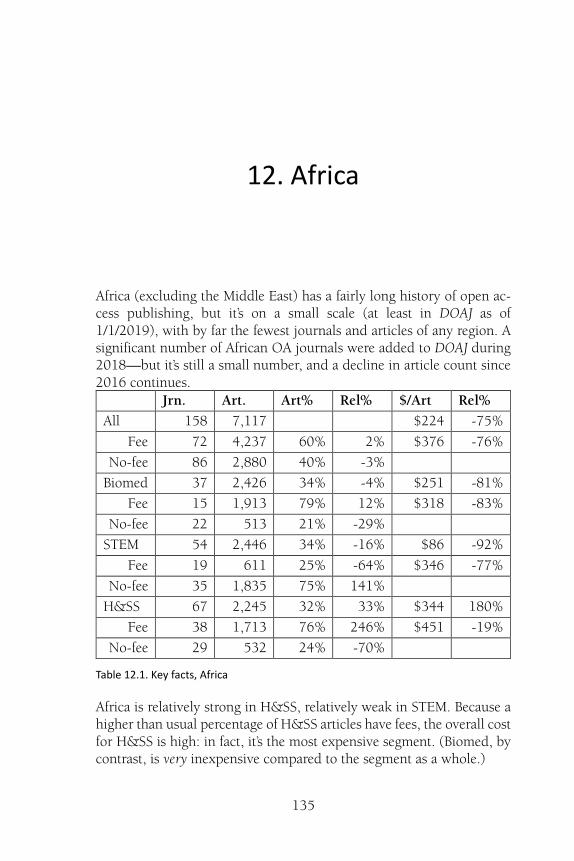
135
12. Africa
Africa (excluding the Middle East) has a fairly long history of open ac-cess publishing, but it’s on a small scale (at least in DOAJ as of1/1/2019), with by far the fewest journals and articles of any region. Asignificant number of African OA journals were added to DOAJ during2018—but it’s still a small number, and a decline in article count since2016 continues.
Jrn. Art. Art% Rel% $/Art Rel%
All 158 7,117 $224 -75%
Fee 72 4,237 60% 2% $376 -76%
No-fee 86 2,880 40% -3%
Biomed 37 2,426 34% -4% $251 -81%
Fee 15 1,913 79% 12% $318 -83%
No-fee 22 513 21% -29%
STEM 54 2,446 34% -16% $86 -92%
Fee 19 611 25% -64% $346 -77%
No-fee 35 1,835 75% 141%
H&SS 67 2,245 32% 33% $344 180%
Fee 38 1,713 76% 246% $451 -19%
No-fee 29 532 24% -70%
Table 12.1. Key facts, Africa
Africa is relatively strong in H&SS, relatively weak in STEM. Because ahigher than usual percentage of H&SS articles have fees, the overall costfor H&SS is high: in fact, it’s the most expensive segment. (Biomed, bycontrast, is very inexpensive compared to the segment as a whole.)
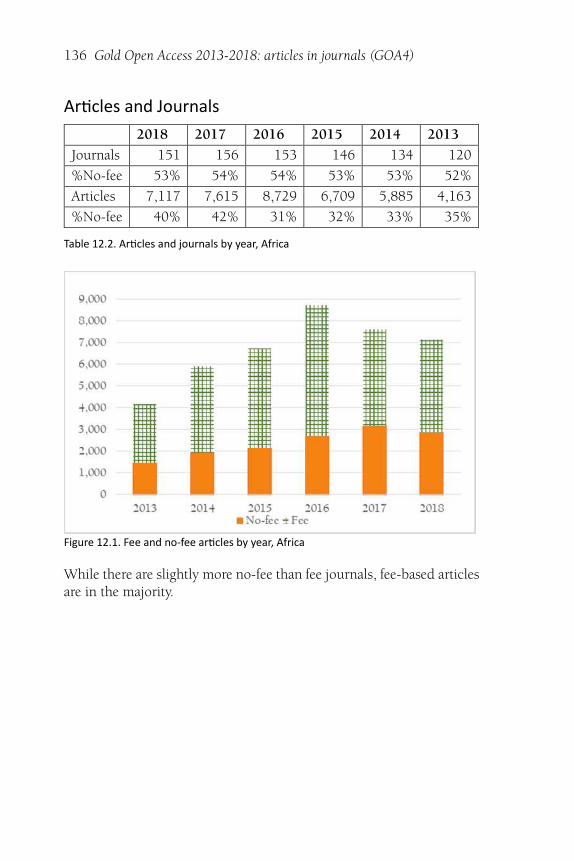
136 Gold Open Access 2013-2018: articles in journals (GOA4)
Ar�cles and Journals
2018 2017 2016 2015 2014 2013
Journals 151 156 153 146 134 120
%No-fee 53% 54% 54% 53% 53% 52%
Articles 7,117 7,615 8,729 6,709 5,885 4,163
%No-fee 40% 42% 31% 32% 33% 35%
Table 12.2. Ar�cles and journals by year, Africa
Figure 12.1. Fee and no-fee ar�cles by year, Africa
While there are slightly more no-fee than fee journals, fee-based articlesare in the majority.
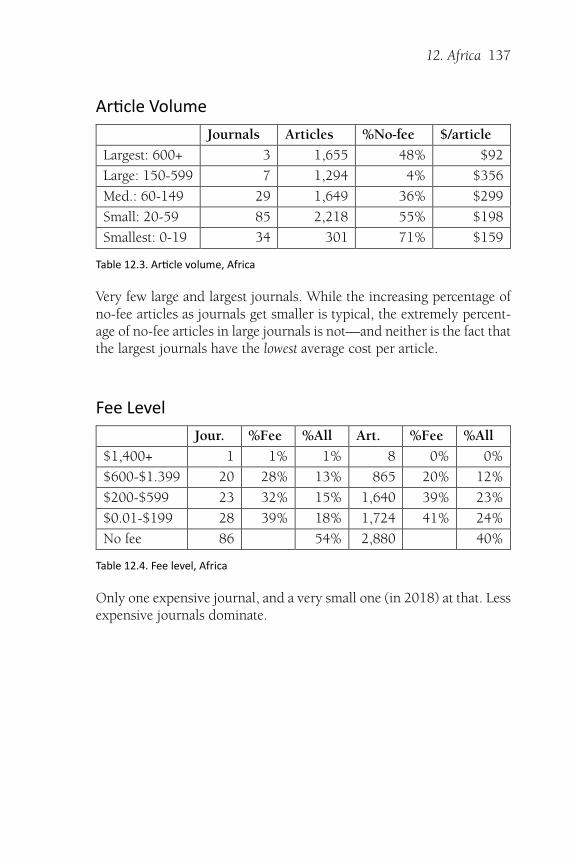
12. Africa 137
Ar�cle Volume
Journals Articles %No-fee $/article
Largest: 600+ 3 1,655 48% $92
Large: 150-599 7 1,294 4% $356
Med.: 60-149 29 1,649 36% $299
Small: 20-59 85 2,218 55% $198
Smallest: 0-19 34 301 71% $159
Table 12.3. Ar�cle volume, Africa
Very few large and largest journals. While the increasing percentage ofno-fee articles as journals get smaller is typical, the extremely percent-age of no-fee articles in large journals is not—and neither is the fact thatthe largest journals have the lowest average cost per article.
Fee Level
Jour. %Fee %All Art. %Fee %All
$1,400+ 1 1% 1% 8 0% 0%
$600-$1.399 20 28% 13% 865 20% 12%
$200-$599 23 32% 15% 1,640 39% 23%
$0.01-$199 28 39% 18% 1,724 41% 24%
No fee 86 54% 2,880 40%
Table 12.4. Fee level, Africa
Only one expensive journal, and a very small one (in 2018) at that. Lessexpensive journals dominate.
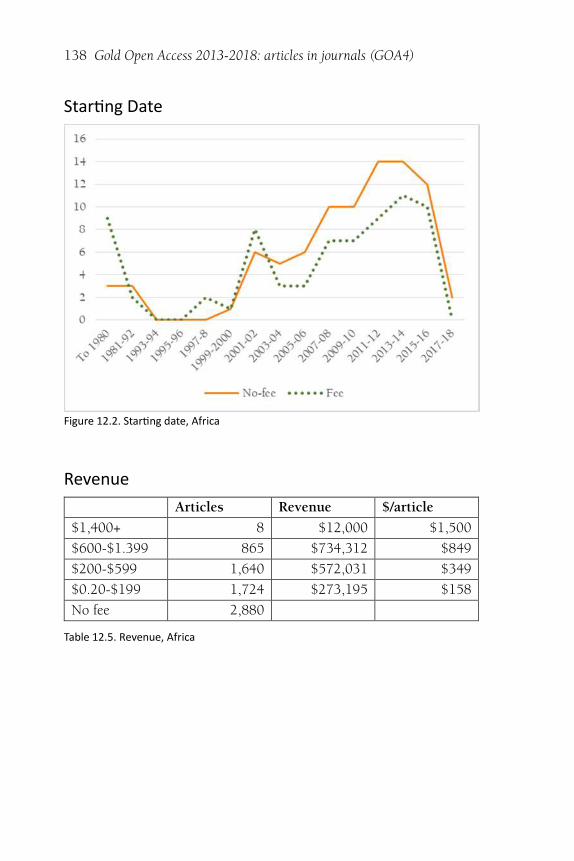
138 Gold Open Access 2013-2018: articles in journals (GOA4)
Star�ng Date
Figure 12.2. Star�ng date, Africa
Revenue
Articles Revenue $/article
$1,400+ 8 $12,000 $1,500
$600-$1.399 865 $734,312 $849
$200-$599 1,640 $572,031 $349
$0.20-$199 1,724 $273,195 $158
No fee 2,880
Table 12.5. Revenue, Africa
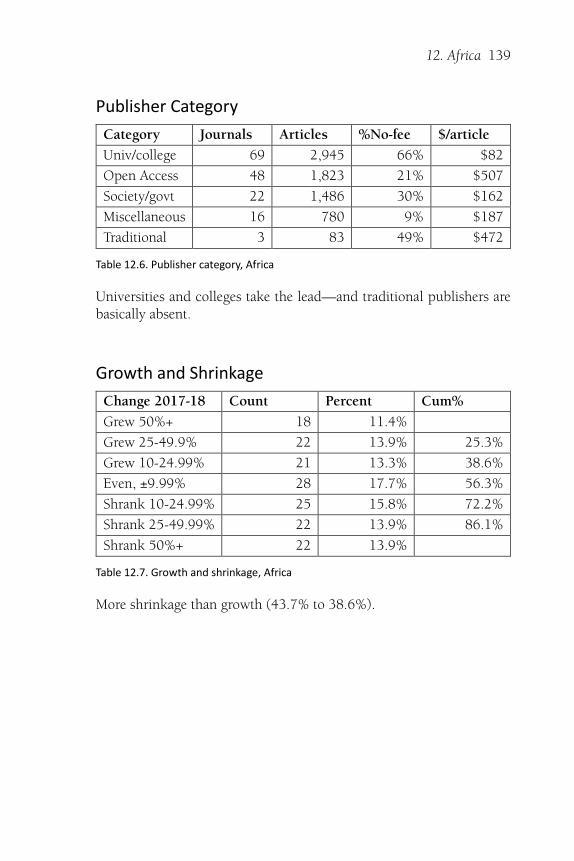
12. Africa 139
Publisher Category
Category Journals Articles %No-fee $/article
Univ/college 69 2,945 66% $82
Open Access 48 1,823 21% $507
Society/govt 22 1,486 30% $162
Miscellaneous 16 780 9% $187
Traditional 3 83 49% $472
Table 12.6. Publisher category, Africa
Universities and colleges take the lead—and traditional publishers arebasically absent.
Growth and Shrinkage
Change 2017-18 Count Percent Cum%
Grew 50%+ 18 11.4%
Grew 25-49.9% 22 13.9% 25.3%
Grew 10-24.99% 21 13.3% 38.6%
Even, ±9.99% 28 17.7% 56.3%
Shrank 10-24.99% 25 15.8% 72.2%
Shrank 25-49.99% 22 13.9% 86.1%
Shrank 50%+ 22 13.9%
Table 12.7. Growth and shrinkage, Africa
More shrinkage than growth (43.7% to 38.6%).
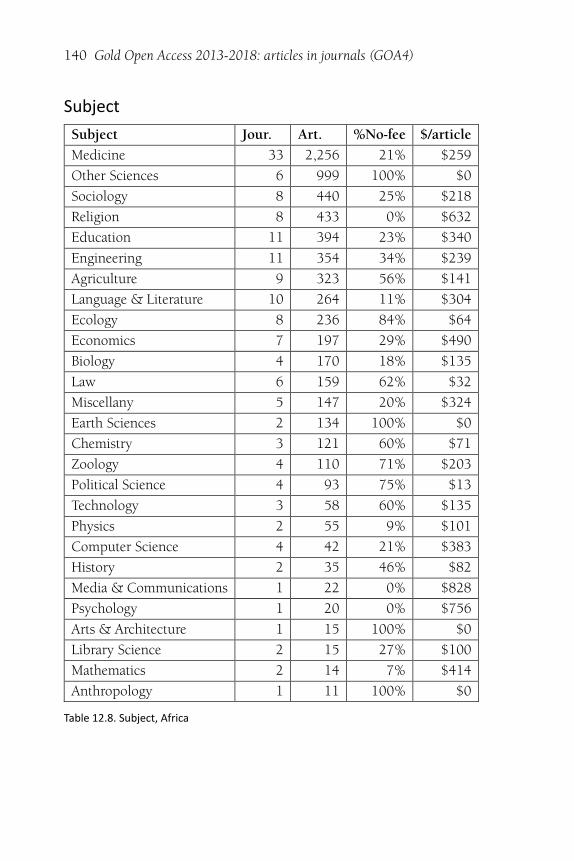
140 Gold Open Access 2013-2018: articles in journals (GOA4)
Subject
Subject Jour. Art. %No-fee $/article
Medicine 33 2,256 21% $259
Other Sciences 6 999 100% $0
Sociology 8 440 25% $218
Religion 8 433 0% $632
Education 11 394 23% $340
Engineering 11 354 34% $239
Agriculture 9 323 56% $141
Language & Literature 10 264 11% $304
Ecology 8 236 84% $64
Economics 7 197 29% $490
Biology 4 170 18% $135
Law 6 159 62% $32
Miscellany 5 147 20% $324
Earth Sciences 2 134 100% $0
Chemistry 3 121 60% $71
Zoology 4 110 71% $203
Political Science 4 93 75% $13
Technology 3 58 60% $135
Physics 2 55 9% $101
Computer Science 4 42 21% $383
History 2 35 46% $82
Media & Communications 1 22 0% $828
Psychology 1 20 0% $756
Arts & Architecture 1 15 100% $0
Library Science 2 15 27% $100
Mathematics 2 14 7% $414
Anthropology 1 11 100% $0
Table 12.8. Subject, Africa
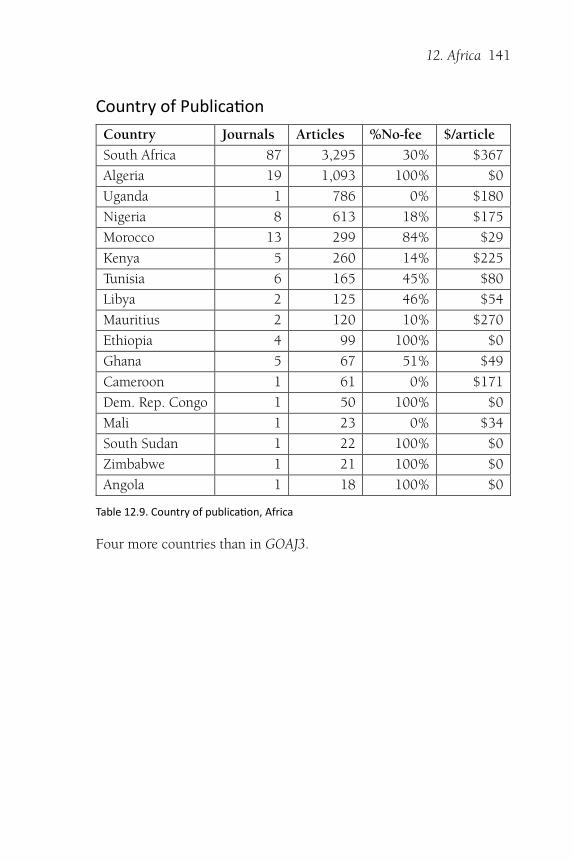
12. Africa 141
Country of Publica�on
Country Journals Articles %No-fee $/article
South Africa 87 3,295 30% $367
Algeria 19 1,093 100% $0
Uganda 1 786 0% $180
Nigeria 8 613 18% $175
Morocco 13 299 84% $29
Kenya 5 260 14% $225
Tunisia 6 165 45% $80
Libya 2 125 46% $54
Mauritius 2 120 10% $270
Ethiopia 4 99 100% $0
Ghana 5 67 51% $49
Cameroon 1 61 0% $171
Dem. Rep. Congo 1 50 100% $0
Mali 1 23 0% $34
South Sudan 1 22 100% $0
Zimbabwe 1 21 100% $0
Angola 1 18 100% $0
Table 12.9. Country of publica�on, Africa
Four more countries than in GOAJ3.
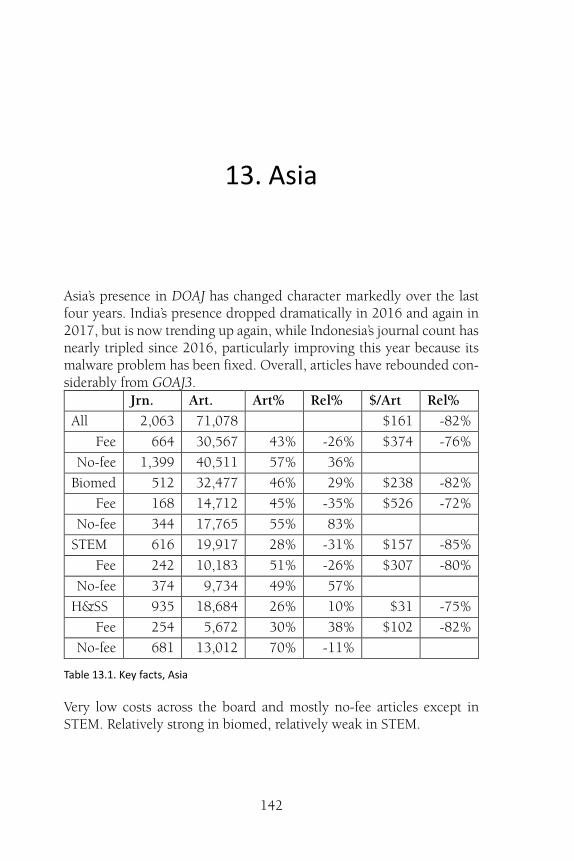
142
13. Asia
Asia’s presence in DOAJ has changed character markedly over the lastfour years. India’s presence dropped dramatically in 2016 and again in2017, but is now trending up again, while Indonesia’s journal count hasnearly tripled since 2016, particularly improving this year because itsmalware problem has been fixed. Overall, articles have rebounded con-siderably from GOAJ3.
Jrn. Art. Art% Rel% $/Art Rel%
All 2,063 71,078 $161 -82%
Fee 664 30,567 43% -26% $374 -76%
No-fee 1,399 40,511 57% 36%
Biomed 512 32,477 46% 29% $238 -82%
Fee 168 14,712 45% -35% $526 -72%
No-fee 344 17,765 55% 83%
STEM 616 19,917 28% -31% $157 -85%
Fee 242 10,183 51% -26% $307 -80%
No-fee 374 9,734 49% 57%
H&SS 935 18,684 26% 10% $31 -75%
Fee 254 5,672 30% 38% $102 -82%
No-fee 681 13,012 70% -11%
Table 13.1. Key facts, Asia
Very low costs across the board and mostly no-fee articles except inSTEM. Relatively strong in biomed, relatively weak in STEM.
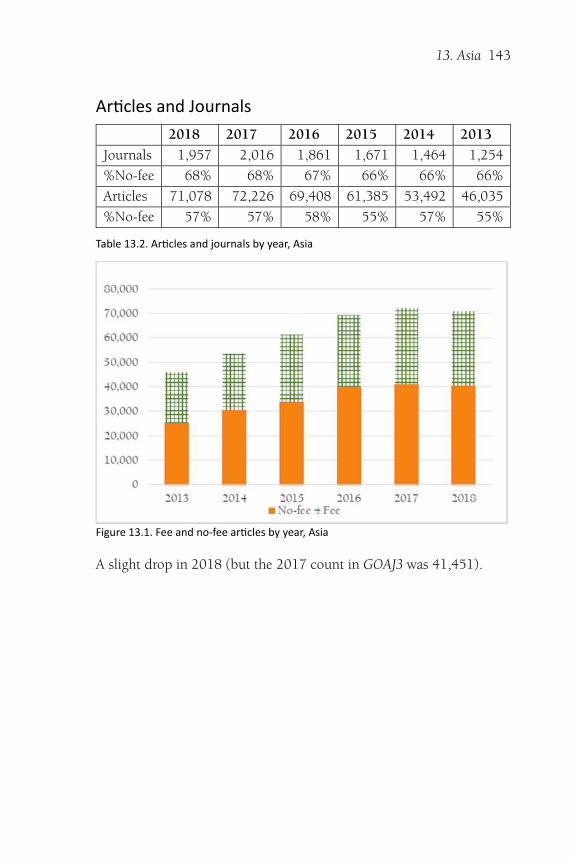
13. Asia 143
Ar�cles and Journals
2018 2017 2016 2015 2014 2013
Journals 1,957 2,016 1,861 1,671 1,464 1,254
%No-fee 68% 68% 67% 66% 66% 66%
Articles 71,078 72,226 69,408 61,385 53,492 46,035
%No-fee 57% 57% 58% 55% 57% 55%
Table 13.2. Ar�cles and journals by year, Asia
Figure 13.1. Fee and no-fee ar�cles by year, Asia
A slight drop in 2018 (but the 2017 count in GOAJ3 was 41,451).
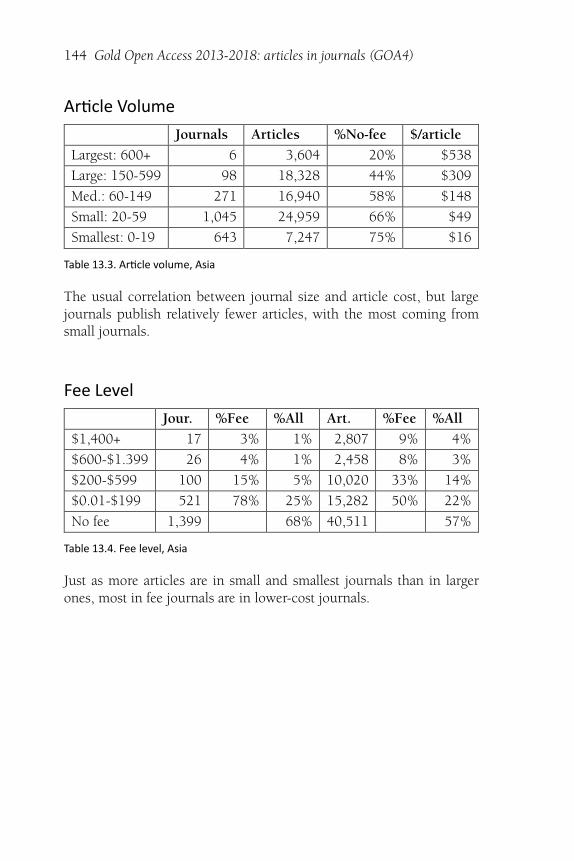
144 Gold Open Access 2013-2018: articles in journals (GOA4)
Ar�cle Volume
Journals Articles %No-fee $/article
Largest: 600+ 6 3,604 20% $538
Large: 150-599 98 18,328 44% $309
Med.: 60-149 271 16,940 58% $148
Small: 20-59 1,045 24,959 66% $49
Smallest: 0-19 643 7,247 75% $16
Table 13.3. Ar�cle volume, Asia
The usual correlation between journal size and article cost, but largejournals publish relatively fewer articles, with the most coming fromsmall journals.
Fee Level
Jour. %Fee %All Art. %Fee %All
$1,400+ 17 3% 1% 2,807 9% 4%
$600-$1.399 26 4% 1% 2,458 8% 3%
$200-$599 100 15% 5% 10,020 33% 14%
$0.01-$199 521 78% 25% 15,282 50% 22%
No fee 1,399 68% 40,511 57%
Table 13.4. Fee level, Asia
Just as more articles are in small and smallest journals than in largerones, most in fee journals are in lower-cost journals.
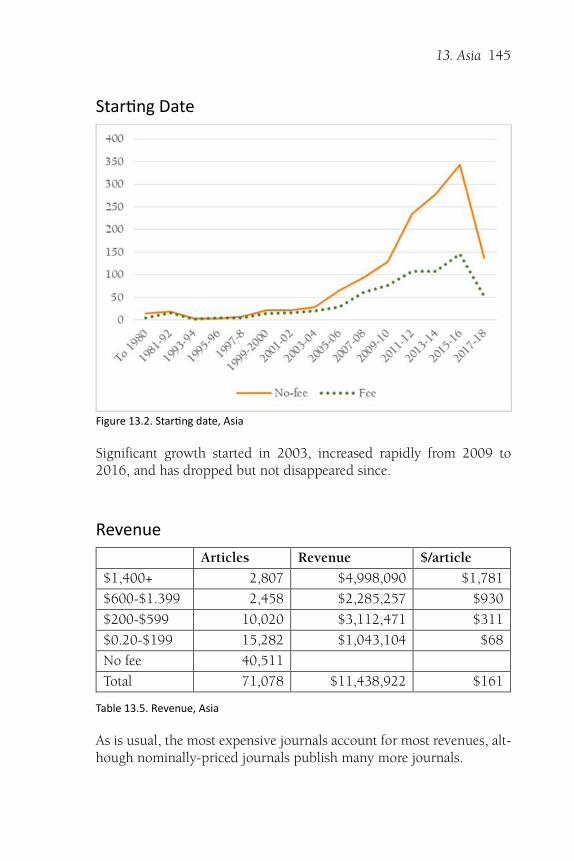
13. Asia 145
Star�ng Date
Figure 13.2. Star�ng date, Asia
Significant growth started in 2003, increased rapidly from 2009 to2016, and has dropped but not disappeared since.
Revenue
Articles Revenue $/article
$1,400+ 2,807 $4,998,090 $1,781
$600-$1.399 2,458 $2,285,257 $930
$200-$599 10,020 $3,112,471 $311
$0.20-$199 15,282 $1,043,104 $68
No fee 40,511
Total 71,078 $11,438,922 $161
Table 13.5. Revenue, Asia
As is usual, the most expensive journals account for most revenues, alt-hough nominally-priced journals publish many more journals.
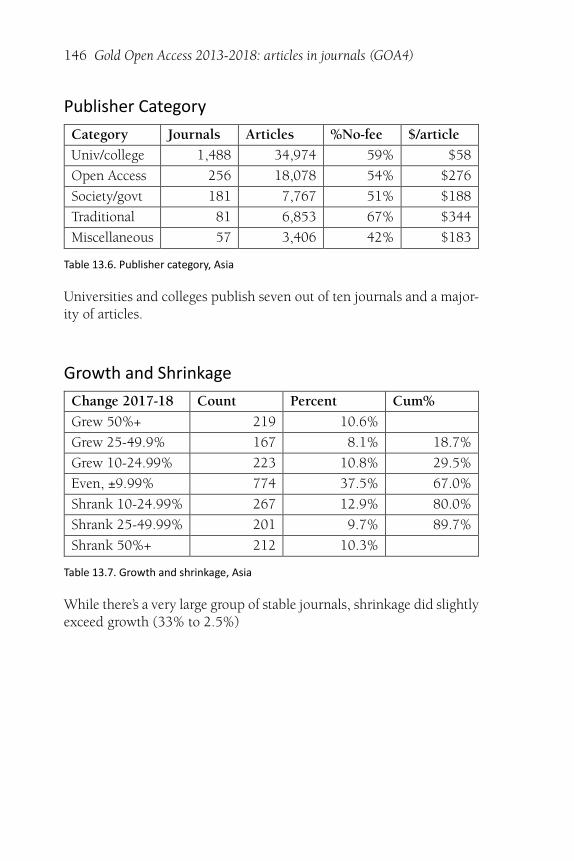
146 Gold Open Access 2013-2018: articles in journals (GOA4)
Publisher Category
Category Journals Articles %No-fee $/article
Univ/college 1,488 34,974 59% $58
Open Access 256 18,078 54% $276
Society/govt 181 7,767 51% $188
Traditional 81 6,853 67% $344
Miscellaneous 57 3,406 42% $183
Table 13.6. Publisher category, Asia
Universities and colleges publish seven out of ten journals and a major-ity of articles.
Growth and Shrinkage
Change 2017-18 Count Percent Cum%
Grew 50%+ 219 10.6%
Grew 25-49.9% 167 8.1% 18.7%
Grew 10-24.99% 223 10.8% 29.5%
Even, ±9.99% 774 37.5% 67.0%
Shrank 10-24.99% 267 12.9% 80.0%
Shrank 25-49.99% 201 9.7% 89.7%
Shrank 50%+ 212 10.3%
Table 13.7. Growth and shrinkage, Asia
While there’s a very large group of stable journals, shrinkage did slightlyexceed growth (33% to 2.5%)
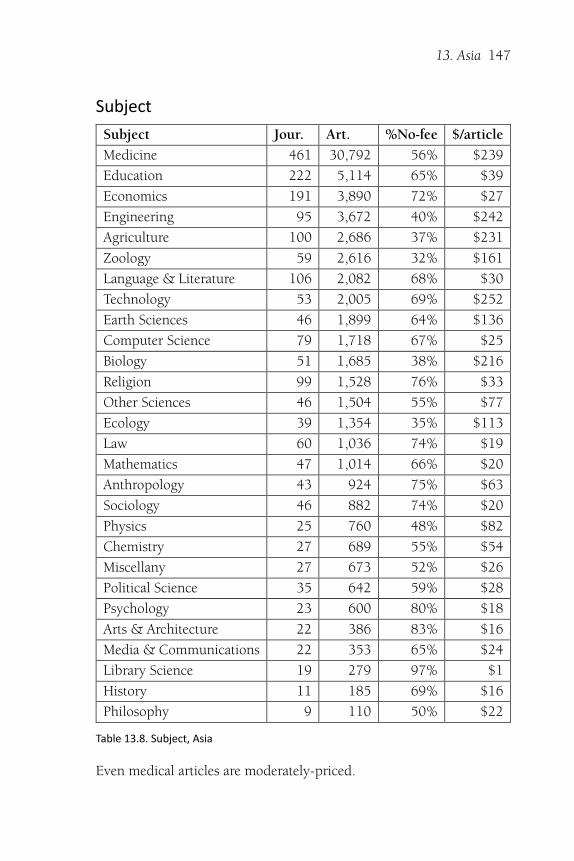
13. Asia 147
Subject
Subject Jour. Art. %No-fee $/article
Medicine 461 30,792 56% $239
Education 222 5,114 65% $39
Economics 191 3,890 72% $27
Engineering 95 3,672 40% $242
Agriculture 100 2,686 37% $231
Zoology 59 2,616 32% $161
Language & Literature 106 2,082 68% $30
Technology 53 2,005 69% $252
Earth Sciences 46 1,899 64% $136
Computer Science 79 1,718 67% $25
Biology 51 1,685 38% $216
Religion 99 1,528 76% $33
Other Sciences 46 1,504 55% $77
Ecology 39 1,354 35% $113
Law 60 1,036 74% $19
Mathematics 47 1,014 66% $20
Anthropology 43 924 75% $63
Sociology 46 882 74% $20
Physics 25 760 48% $82
Chemistry 27 689 55% $54
Miscellany 27 673 52% $26
Political Science 35 642 59% $28
Psychology 23 600 80% $18
Arts & Architecture 22 386 83% $16
Media & Communications 22 353 65% $24
Library Science 19 279 97% $1
History 11 185 69% $16
Philosophy 9 110 50% $22
Table 13.8. Subject, Asia
Even medical articles are moderately-priced.
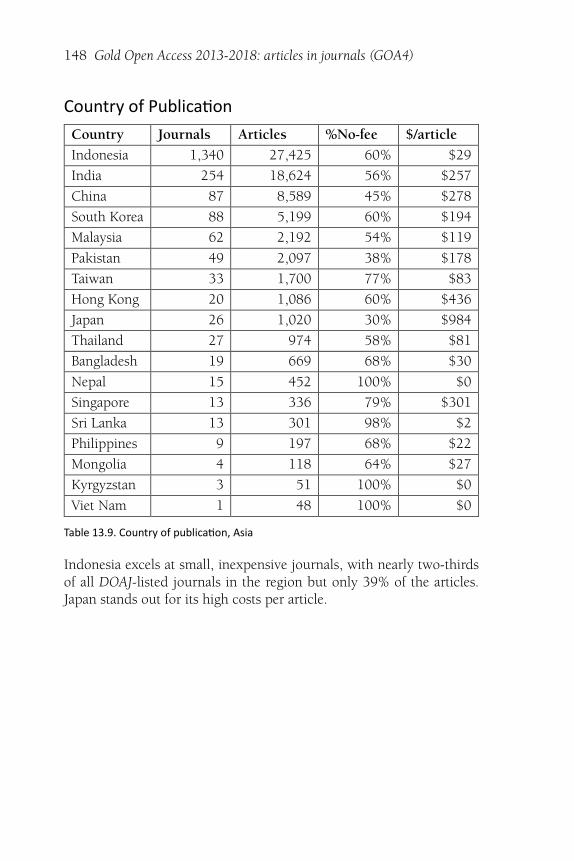
148 Gold Open Access 2013-2018: articles in journals (GOA4)
Country of Publica�on
Country Journals Articles %No-fee $/article
Indonesia 1,340 27,425 60% $29
India 254 18,624 56% $257
China 87 8,589 45% $278
South Korea 88 5,199 60% $194
Malaysia 62 2,192 54% $119
Pakistan 49 2,097 38% $178
Taiwan 33 1,700 77% $83
Hong Kong 20 1,086 60% $436
Japan 26 1,020 30% $984
Thailand 27 974 58% $81
Bangladesh 19 669 68% $30
Nepal 15 452 100% $0
Singapore 13 336 79% $301
Sri Lanka 13 301 98% $2
Philippines 9 197 68% $22
Mongolia 4 118 64% $27
Kyrgyzstan 3 51 100% $0
Viet Nam 1 48 100% $0
Table 13.9. Country of publica�on, Asia
Indonesia excels at small, inexpensive journals, with nearly two-thirdsof all DOAJ-listed journals in the region but only 39% of the articles.Japan stands out for its high costs per article.
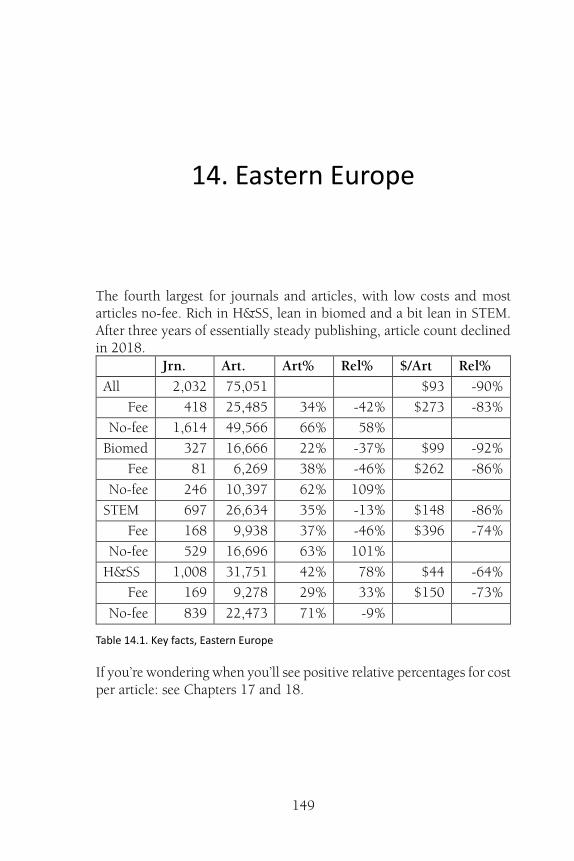
149
14. Eastern Europe
The fourth largest for journals and articles, with low costs and mostarticles no-fee. Rich in H&SS, lean in biomed and a bit lean in STEM.After three years of essentially steady publishing, article count declinedin 2018.
Jrn. Art. Art% Rel% $/Art Rel%
All 2,032 75,051 $93 -90%
Fee 418 25,485 34% -42% $273 -83%
No-fee 1,614 49,566 66% 58%
Biomed 327 16,666 22% -37% $99 -92%
Fee 81 6,269 38% -46% $262 -86%
No-fee 246 10,397 62% 109%
STEM 697 26,634 35% -13% $148 -86%
Fee 168 9,938 37% -46% $396 -74%
No-fee 529 16,696 63% 101%
H&SS 1,008 31,751 42% 78% $44 -64%
Fee 169 9,278 29% 33% $150 -73%
No-fee 839 22,473 71% -9%
Table 14.1. Key facts, Eastern Europe
If you’re wondering when you’ll see positive relative percentages for costper article: see Chapters 17 and 18.
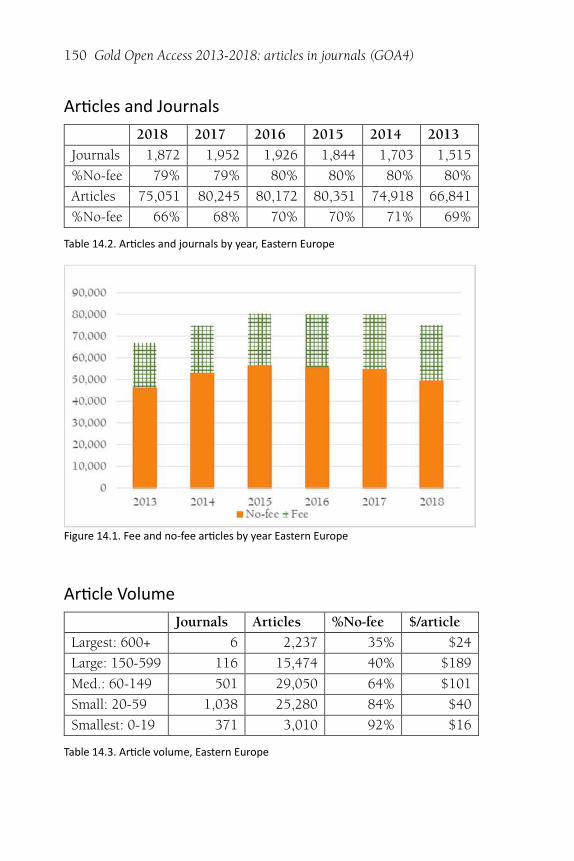
150 Gold Open Access 2013-2018: articles in journals (GOA4)
Ar�cles and Journals
2018 2017 2016 2015 2014 2013
Journals 1,872 1,952 1,926 1,844 1,703 1,515
%No-fee 79% 79% 80% 80% 80% 80%
Articles 75,051 80,245 80,172 80,351 74,918 66,841
%No-fee 66% 68% 70% 70% 71% 69%
Table 14.2. Ar�cles and journals by year, Eastern Europe
Figure 14.1. Fee and no-fee ar�cles by year Eastern Europe
Ar�cle Volume
Journals Articles %No-fee $/article
Largest: 600+ 6 2,237 35% $24
Large: 150-599 116 15,474 40% $189
Med.: 60-149 501 29,050 64% $101
Small: 20-59 1,038 25,280 84% $40
Smallest: 0-19 371 3,010 92% $16
Table 14.3. Ar�cle volume, Eastern Europe
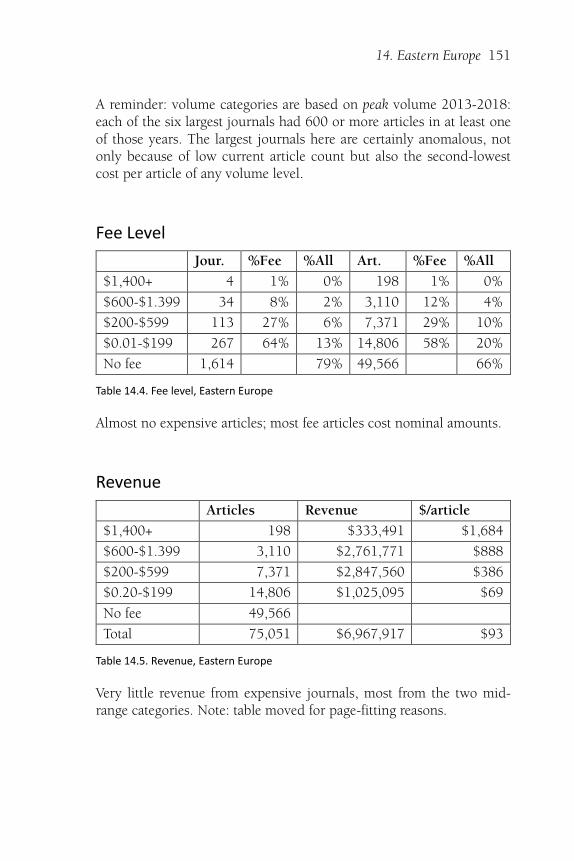
14. Eastern Europe 151
A reminder: volume categories are based on peak volume 2013-2018:each of the six largest journals had 600 or more articles in at least oneof those years. The largest journals here are certainly anomalous, notonly because of low current article count but also the second-lowestcost per article of any volume level.
Fee Level
Jour. %Fee %All Art. %Fee %All
$1,400+ 4 1% 0% 198 1% 0%
$600-$1.399 34 8% 2% 3,110 12% 4%
$200-$599 113 27% 6% 7,371 29% 10%
$0.01-$199 267 64% 13% 14,806 58% 20%
No fee 1,614 79% 49,566 66%
Table 14.4. Fee level, Eastern Europe
Almost no expensive articles; most fee articles cost nominal amounts.
Revenue
Articles Revenue $/article
$1,400+ 198 $333,491 $1,684
$600-$1.399 3,110 $2,761,771 $888
$200-$599 7,371 $2,847,560 $386
$0.20-$199 14,806 $1,025,095 $69
No fee 49,566
Total 75,051 $6,967,917 $93
Table 14.5. Revenue, Eastern Europe
Very little revenue from expensive journals, most from the two mid-range categories. Note: table moved for page-fitting reasons.
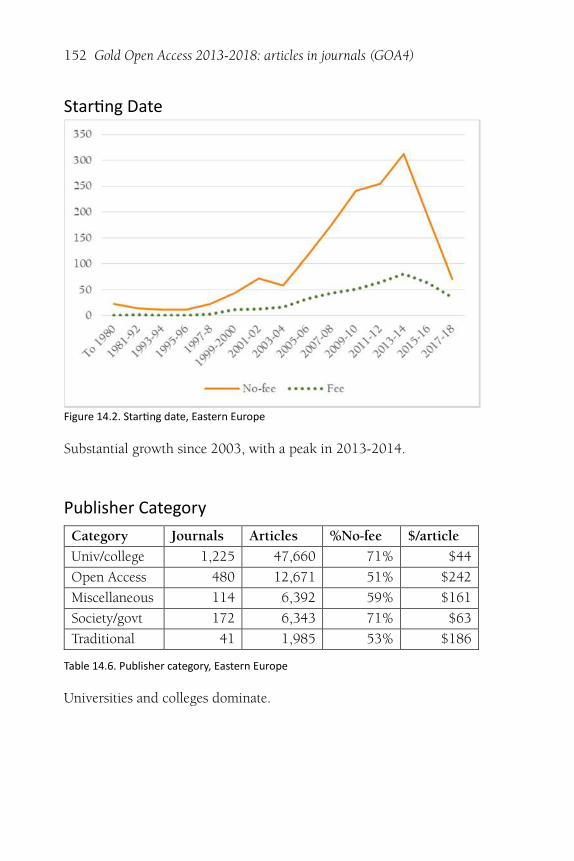
152 Gold Open Access 2013-2018: articles in journals (GOA4)
Star�ng Date
Figure 14.2. Star�ng date, Eastern Europe
Substantial growth since 2003, with a peak in 2013-2014.
Publisher Category
Category Journals Articles %No-fee $/article
Univ/college 1,225 47,660 71% $44
Open Access 480 12,671 51% $242
Miscellaneous 114 6,392 59% $161
Society/govt 172 6,343 71% $63
Traditional 41 1,985 53% $186
Table 14.6. Publisher category, Eastern Europe
Universities and colleges dominate.
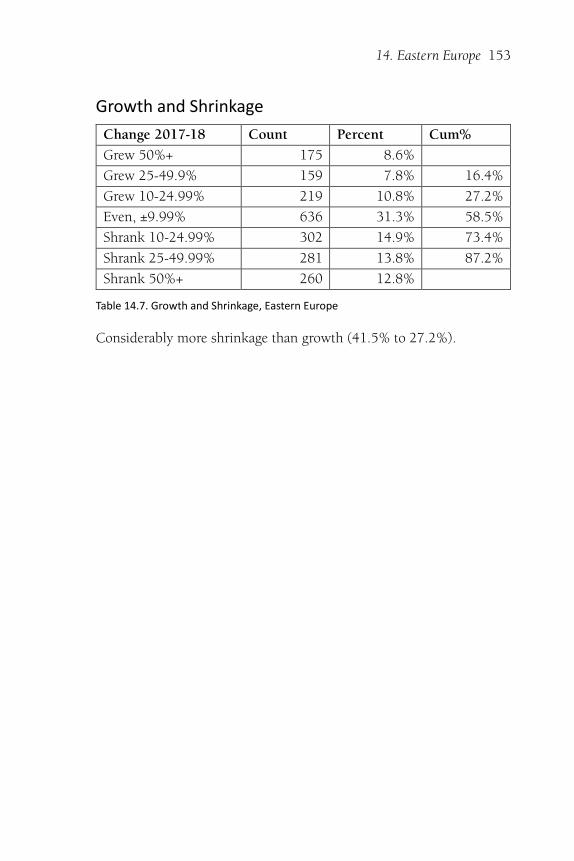
14. Eastern Europe 153
Growth and Shrinkage
Change 2017-18 Count Percent Cum%
Grew 50%+ 175 8.6%
Grew 25-49.9% 159 7.8% 16.4%
Grew 10-24.99% 219 10.8% 27.2%
Even, ±9.99% 636 31.3% 58.5%
Shrank 10-24.99% 302 14.9% 73.4%
Shrank 25-49.99% 281 13.8% 87.2%
Shrank 50%+ 260 12.8%
Table 14.7. Growth and Shrinkage, Eastern Europe
Considerably more shrinkage than growth (41.5% to 27.2%).
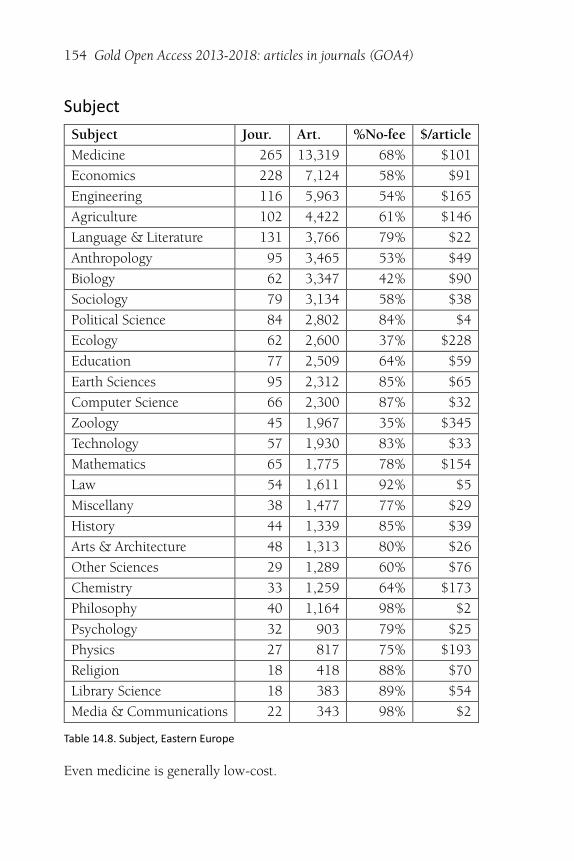
154 Gold Open Access 2013-2018: articles in journals (GOA4)
Subject
Subject Jour. Art. %No-fee $/article
Medicine 265 13,319 68% $101
Economics 228 7,124 58% $91
Engineering 116 5,963 54% $165
Agriculture 102 4,422 61% $146
Language & Literature 131 3,766 79% $22
Anthropology 95 3,465 53% $49
Biology 62 3,347 42% $90
Sociology 79 3,134 58% $38
Political Science 84 2,802 84% $4
Ecology 62 2,600 37% $228
Education 77 2,509 64% $59
Earth Sciences 95 2,312 85% $65
Computer Science 66 2,300 87% $32
Zoology 45 1,967 35% $345
Technology 57 1,930 83% $33
Mathematics 65 1,775 78% $154
Law 54 1,611 92% $5
Miscellany 38 1,477 77% $29
History 44 1,339 85% $39
Arts & Architecture 48 1,313 80% $26
Other Sciences 29 1,289 60% $76
Chemistry 33 1,259 64% $173
Philosophy 40 1,164 98% $2
Psychology 32 903 79% $25
Physics 27 817 75% $193
Religion 18 418 88% $70
Library Science 18 383 89% $54
Media & Communications 22 343 98% $2
Table 14.8. Subject, Eastern Europe
Even medicine is generally low-cost.
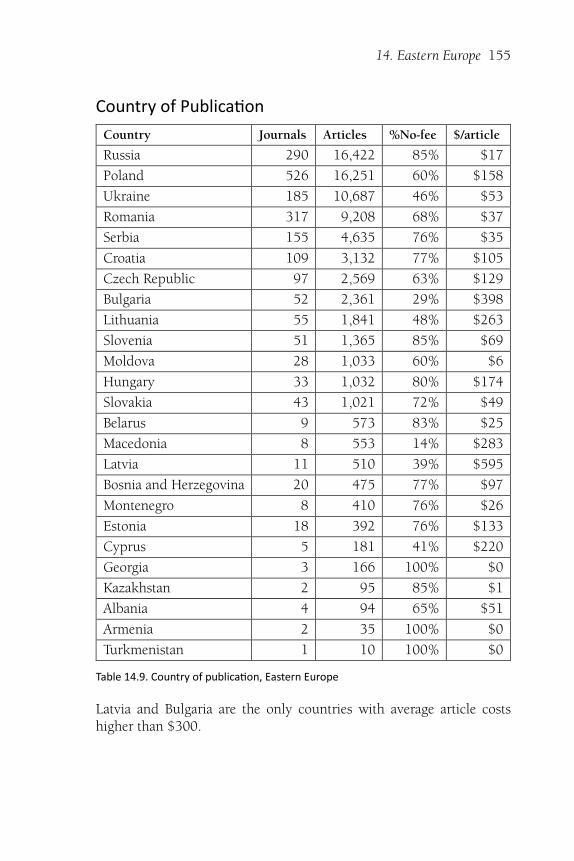
14. Eastern Europe 155
Country of Publica�on
Country Journals Articles %No-fee $/article
Russia 290 16,422 85% $17
Poland 526 16,251 60% $158
Ukraine 185 10,687 46% $53
Romania 317 9,208 68% $37
Serbia 155 4,635 76% $35
Croatia 109 3,132 77% $105
Czech Republic 97 2,569 63% $129
Bulgaria 52 2,361 29% $398
Lithuania 55 1,841 48% $263
Slovenia 51 1,365 85% $69
Moldova 28 1,033 60% $6
Hungary 33 1,032 80% $174
Slovakia 43 1,021 72% $49
Belarus 9 573 83% $25
Macedonia 8 553 14% $283
Latvia 11 510 39% $595
Bosnia and Herzegovina 20 475 77% $97
Montenegro 8 410 76% $26
Estonia 18 392 76% $133
Cyprus 5 181 41% $220
Georgia 3 166 100% $0
Kazakhstan 2 95 85% $1
Albania 4 94 65% $51
Armenia 2 35 100% $0
Turkmenistan 1 10 100% $0
Table 14.9. Country of publica�on, Eastern Europe
Latvia and Bulgaria are the only countries with average article costshigher than $300.
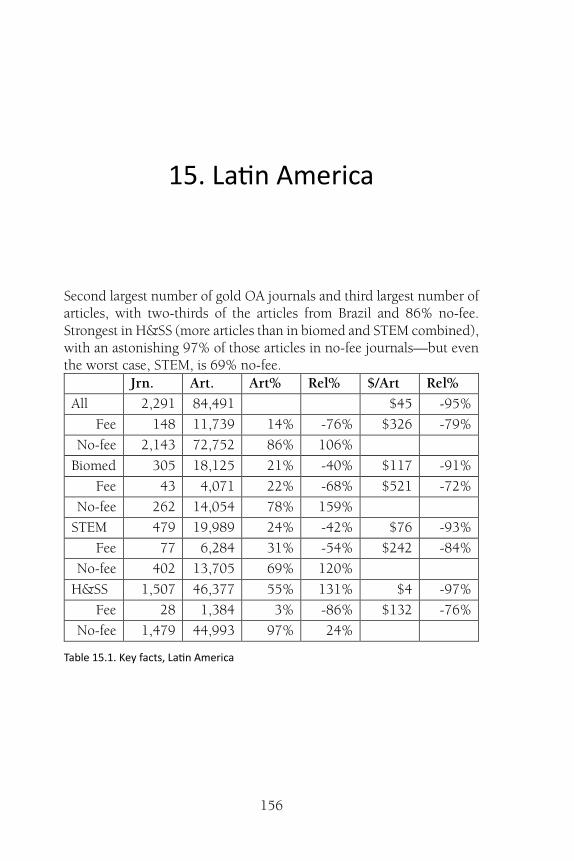
156
15. La�n America
Second largest number of gold OA journals and third largest number ofarticles, with two-thirds of the articles from Brazil and 86% no-fee.Strongest in H&SS (more articles than in biomed and STEM combined),with an astonishing 97% of those articles in no-fee journals—but eventhe worst case, STEM, is 69% no-fee.
Jrn. Art. Art% Rel% $/Art Rel%
All 2,291 84,491 $45 -95%
Fee 148 11,739 14% -76% $326 -79%
No-fee 2,143 72,752 86% 106%
Biomed 305 18,125 21% -40% $117 -91%
Fee 43 4,071 22% -68% $521 -72%
No-fee 262 14,054 78% 159%
STEM 479 19,989 24% -42% $76 -93%
Fee 77 6,284 31% -54% $242 -84%
No-fee 402 13,705 69% 120%
H&SS 1,507 46,377 55% 131% $4 -97%
Fee 28 1,384 3% -86% $132 -76%
No-fee 1,479 44,993 97% 24%
Table 15.1. Key facts, La�n America
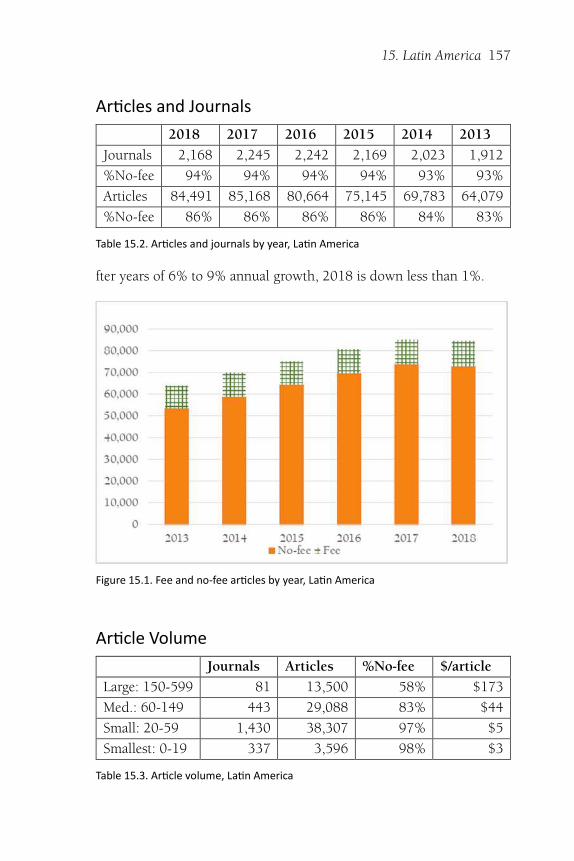
15. Latin America 157
Ar�cles and Journals
2018 2017 2016 2015 2014 2013
Journals 2,168 2,245 2,242 2,169 2,023 1,912
%No-fee 94% 94% 94% 94% 93% 93%
Articles 84,491 85,168 80,664 75,145 69,783 64,079
%No-fee 86% 86% 86% 86% 84% 83%
Table 15.2. Ar�cles and journals by year, La�n America
fter years of 6% to 9% annual growth, 2018 is down less than 1%.
Figure 15.1. Fee and no-fee ar�cles by year, La�n America
Ar�cle Volume
Journals Articles %No-fee $/article
Large: 150-599 81 13,500 58% $173
Med.: 60-149 443 29,088 83% $44
Small: 20-59 1,430 38,307 97% $5
Smallest: 0-19 337 3,596 98% $3
Table 15.3. Ar�cle volume, La�n America
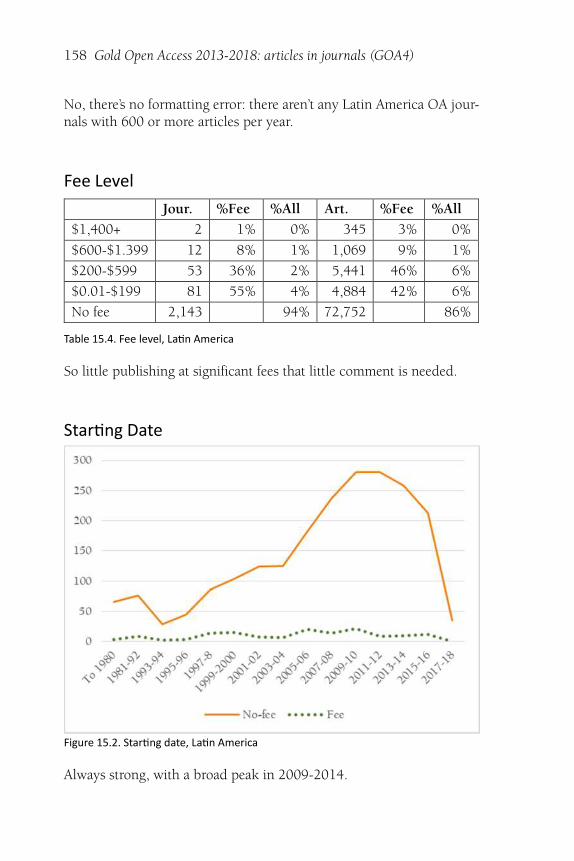
158 Gold Open Access 2013-2018: articles in journals (GOA4)
No, there’s no formatting error: there aren’t any Latin America OA jour-nals with 600 or more articles per year.
Fee Level
Jour. %Fee %All Art. %Fee %All
$1,400+ 2 1% 0% 345 3% 0%
$600-$1.399 12 8% 1% 1,069 9% 1%
$200-$599 53 36% 2% 5,441 46% 6%
$0.01-$199 81 55% 4% 4,884 42% 6%
No fee 2,143 94% 72,752 86%
Table 15.4. Fee level, La�n America
So little publishing at significant fees that little comment is needed.
Star�ng Date
Figure 15.2. Star�ng date, La�n America
Always strong, with a broad peak in 2009-2014.
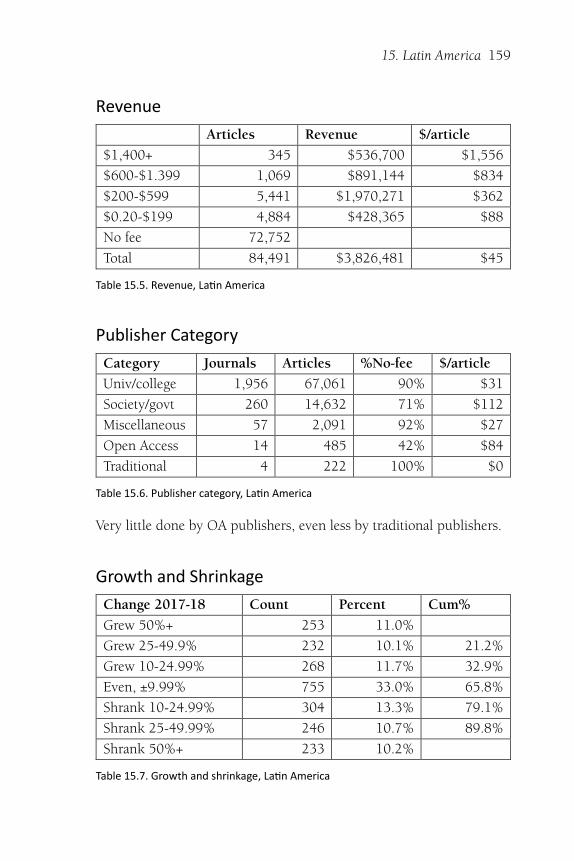
15. Latin America 159
Revenue
Articles Revenue $/article
$1,400+ 345 $536,700 $1,556
$600-$1.399 1,069 $891,144 $834
$200-$599 5,441 $1,970,271 $362
$0.20-$199 4,884 $428,365 $88
No fee 72,752
Total 84,491 $3,826,481 $45
Table 15.5. Revenue, La�n America
Publisher Category
Category Journals Articles %No-fee $/article
Univ/college 1,956 67,061 90% $31
Society/govt 260 14,632 71% $112
Miscellaneous 57 2,091 92% $27
Open Access 14 485 42% $84
Traditional 4 222 100% $0
Table 15.6. Publisher category, La�n America
Very little done by OA publishers, even less by traditional publishers.
Growth and Shrinkage
Change 2017-18 Count Percent Cum%
Grew 50%+ 253 11.0%
Grew 25-49.9% 232 10.1% 21.2%
Grew 10-24.99% 268 11.7% 32.9%
Even, ±9.99% 755 33.0% 65.8%
Shrank 10-24.99% 304 13.3% 79.1%
Shrank 25-49.99% 246 10.7% 89.8%
Shrank 50%+ 233 10.2%
Table 15.7. Growth and shrinkage, La�n America
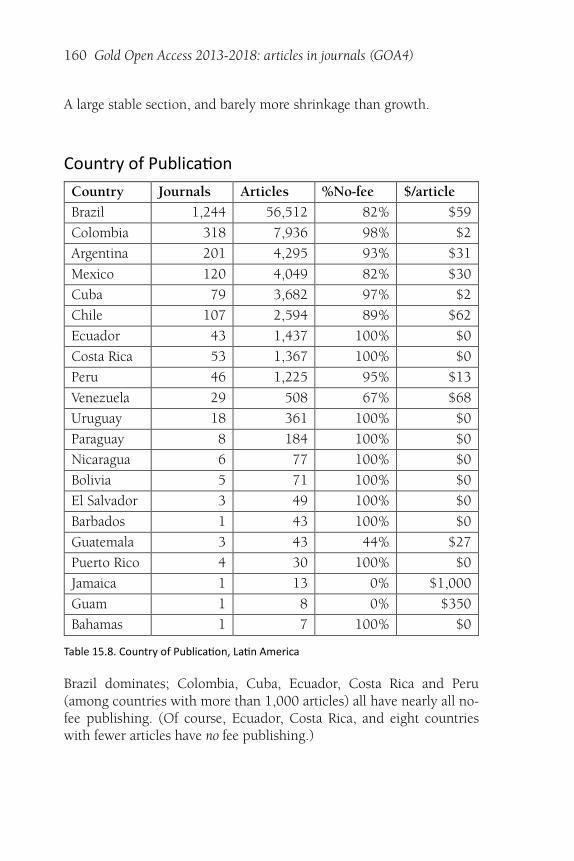
160 Gold Open Access 2013-2018: articles in journals (GOA4)
A large stable section, and barely more shrinkage than growth.
Country of Publica�on
Country Journals Articles %No-fee $/article
Brazil 1,244 56,512 82% $59
Colombia 318 7,936 98% $2
Argentina 201 4,295 93% $31
Mexico 120 4,049 82% $30
Cuba 79 3,682 97% $2
Chile 107 2,594 89% $62
Ecuador 43 1,437 100% $0
Costa Rica 53 1,367 100% $0
Peru 46 1,225 95% $13
Venezuela 29 508 67% $68
Uruguay 18 361 100% $0
Paraguay 8 184 100% $0
Nicaragua 6 77 100% $0
Bolivia 5 71 100% $0
El Salvador 3 49 100% $0
Barbados 1 43 100% $0
Guatemala 3 43 44% $27
Puerto Rico 4 30 100% $0
Jamaica 1 13 0% $1,000
Guam 1 8 0% $350
Bahamas 1 7 100% $0
Table 15.8. Country of Publica�on, La�n America
Brazil dominates; Colombia, Cuba, Ecuador, Costa Rica and Peru(among countries with more than 1,000 articles) all have nearly all no-fee publishing. (Of course, Ecuador, Costa Rica, and eight countrieswith fewer articles have no fee publishing.)
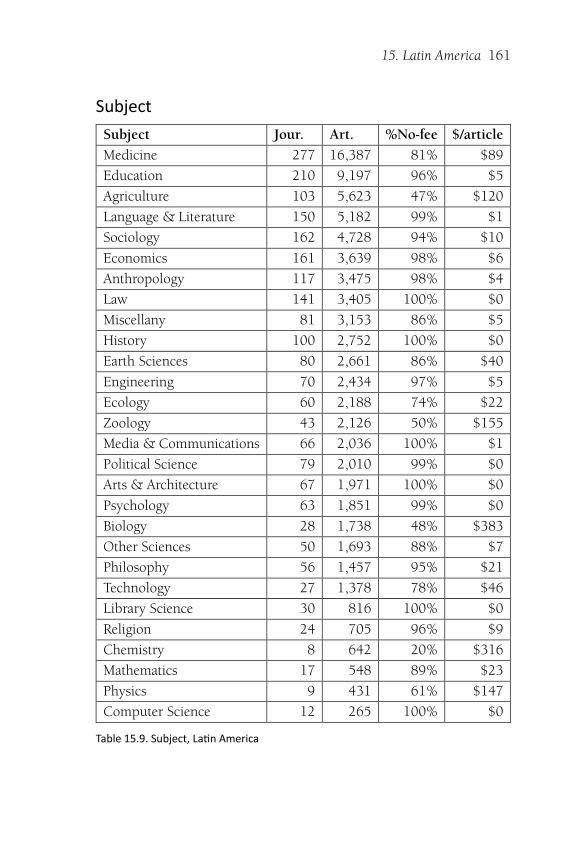
15. Latin America 161
Subject
Subject Jour. Art. %No-fee $/article
Medicine 277 16,387 81% $89
Education 210 9,197 96% $5
Agriculture 103 5,623 47% $120
Language & Literature 150 5,182 99% $1
Sociology 162 4,728 94% $10
Economics 161 3,639 98% $6
Anthropology 117 3,475 98% $4
Law 141 3,405 100% $0
Miscellany 81 3,153 86% $5
History 100 2,752 100% $0
Earth Sciences 80 2,661 86% $40
Engineering 70 2,434 97% $5
Ecology 60 2,188 74% $22
Zoology 43 2,126 50% $155
Media & Communications 66 2,036 100% $1
Political Science 79 2,010 99% $0
Arts & Architecture 67 1,971 100% $0
Psychology 63 1,851 99% $0
Biology 28 1,738 48% $383
Other Sciences 50 1,693 88% $7
Philosophy 56 1,457 95% $21
Technology 27 1,378 78% $46
Library Science 30 816 100% $0
Religion 24 705 96% $9
Chemistry 8 642 20% $316
Mathematics 17 548 89% $23
Physics 9 431 61% $147
Computer Science 12 265 100% $0
Table 15.9. Subject, La�n America
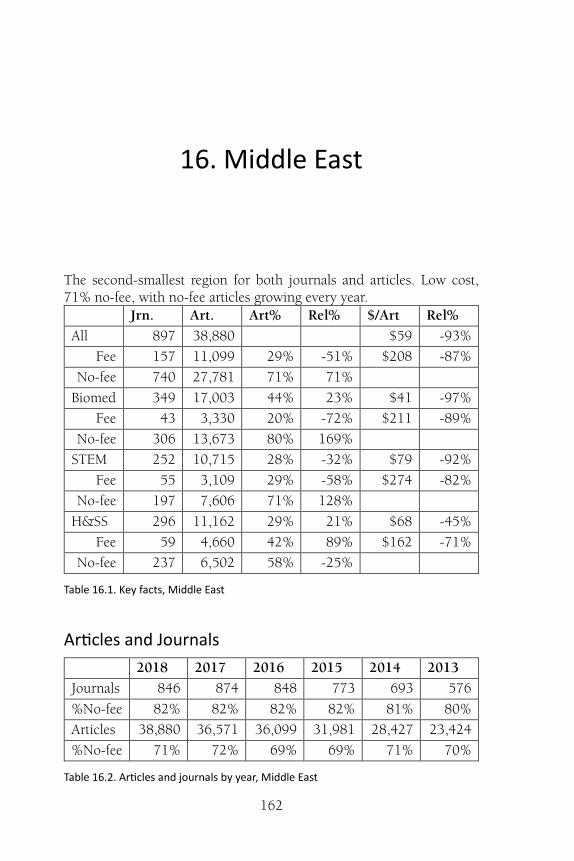
162
16. Middle East
The second-smallest region for both journals and articles. Low cost,71% no-fee, with no-fee articles growing every year.
Jrn. Art. Art% Rel% $/Art Rel%
All 897 38,880 $59 -93%
Fee 157 11,099 29% -51% $208 -87%
No-fee 740 27,781 71% 71%
Biomed 349 17,003 44% 23% $41 -97%
Fee 43 3,330 20% -72% $211 -89%
No-fee 306 13,673 80% 169%
STEM 252 10,715 28% -32% $79 -92%
Fee 55 3,109 29% -58% $274 -82%
No-fee 197 7,606 71% 128%
H&SS 296 11,162 29% 21% $68 -45%
Fee 59 4,660 42% 89% $162 -71%
No-fee 237 6,502 58% -25%
Table 16.1. Key facts, Middle East
Ar�cles and Journals
2018 2017 2016 2015 2014 2013
Journals 846 874 848 773 693 576
%No-fee 82% 82% 82% 82% 81% 80%
Articles 38,880 36,571 36,099 31,981 28,427 23,424
%No-fee 71% 72% 69% 69% 71% 70%
Table 16.2. Ar�cles and journals by year, Middle East
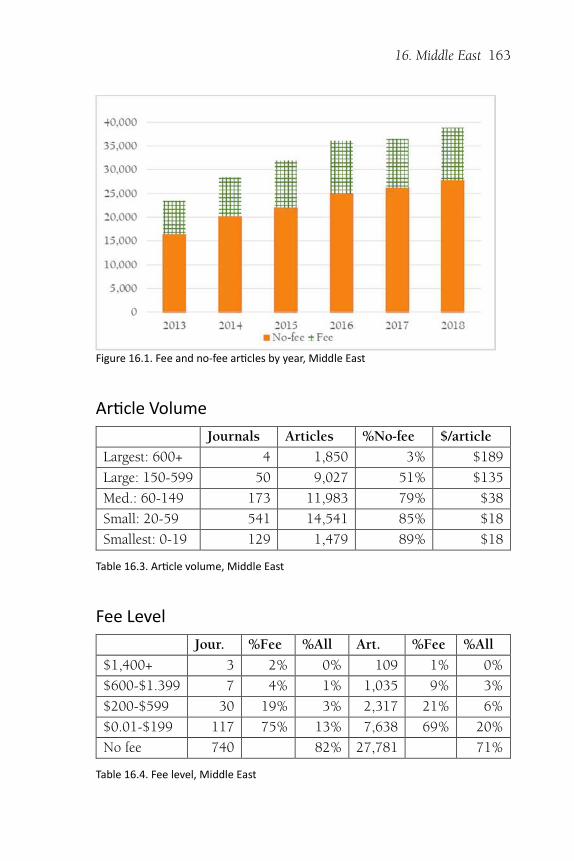
16. Middle East 163
Figure 16.1. Fee and no-fee ar�cles by year, Middle East
Ar�cle Volume
Journals Articles %No-fee $/article
Largest: 600+ 4 1,850 3% $189
Large: 150-599 50 9,027 51% $135
Med.: 60-149 173 11,983 79% $38
Small: 20-59 541 14,541 85% $18
Smallest: 0-19 129 1,479 89% $18
Table 16.3. Ar�cle volume, Middle East
Fee Level
Jour. %Fee %All Art. %Fee %All
$1,400+ 3 2% 0% 109 1% 0%
$600-$1.399 7 4% 1% 1,035 9% 3%
$200-$599 30 19% 3% 2,317 21% 6%
$0.01-$199 117 75% 13% 7,638 69% 20%
No fee 740 82% 27,781 71%
Table 16.4. Fee level, Middle East
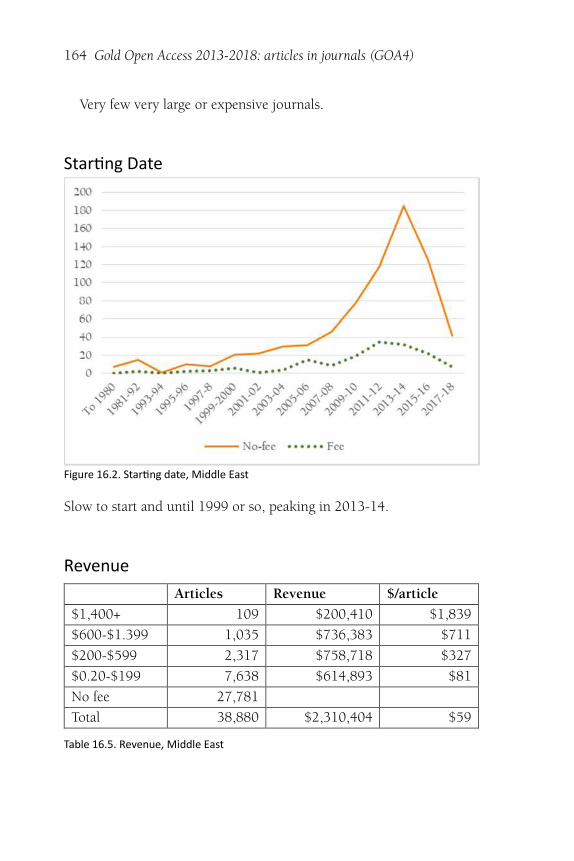
164 Gold Open Access 2013-2018: articles in journals (GOA4)
Very few very large or expensive journals.
Star�ng Date
Figure 16.2. Star�ng date, Middle East
Slow to start and until 1999 or so, peaking in 2013-14.
Revenue
Articles Revenue $/article
$1,400+ 109 $200,410 $1,839
$600-$1.399 1,035 $736,383 $711
$200-$599 2,317 $758,718 $327
$0.20-$199 7,638 $614,893 $81
No fee 27,781
Total 38,880 $2,310,404 $59
Table 16.5. Revenue, Middle East
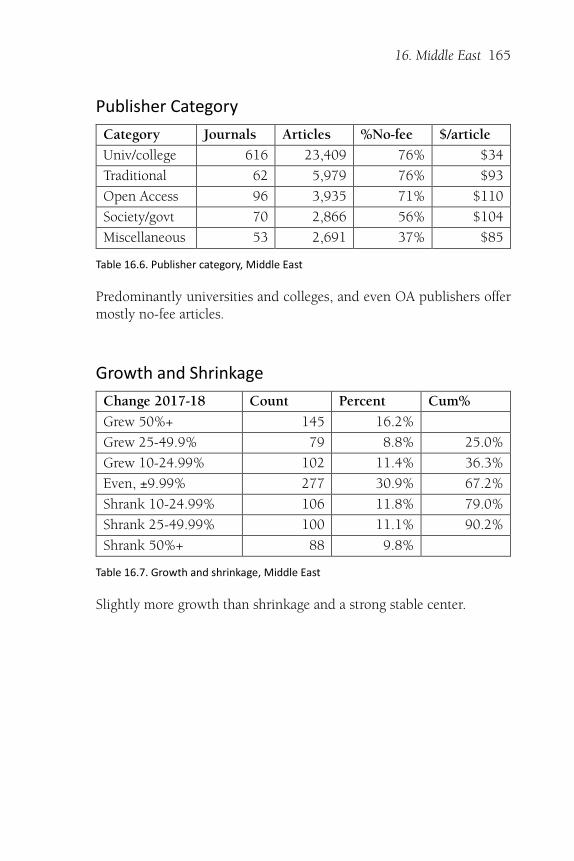
16. Middle East 165
Publisher Category
Category Journals Articles %No-fee $/article
Univ/college 616 23,409 76% $34
Traditional 62 5,979 76% $93
Open Access 96 3,935 71% $110
Society/govt 70 2,866 56% $104
Miscellaneous 53 2,691 37% $85
Table 16.6. Publisher category, Middle East
Predominantly universities and colleges, and even OA publishers offermostly no-fee articles.
Growth and Shrinkage
Change 2017-18 Count Percent Cum%
Grew 50%+ 145 16.2%
Grew 25-49.9% 79 8.8% 25.0%
Grew 10-24.99% 102 11.4% 36.3%
Even, ±9.99% 277 30.9% 67.2%
Shrank 10-24.99% 106 11.8% 79.0%
Shrank 25-49.99% 100 11.1% 90.2%
Shrank 50%+ 88 9.8%
Table 16.7. Growth and shrinkage, Middle East
Slightly more growth than shrinkage and a strong stable center.
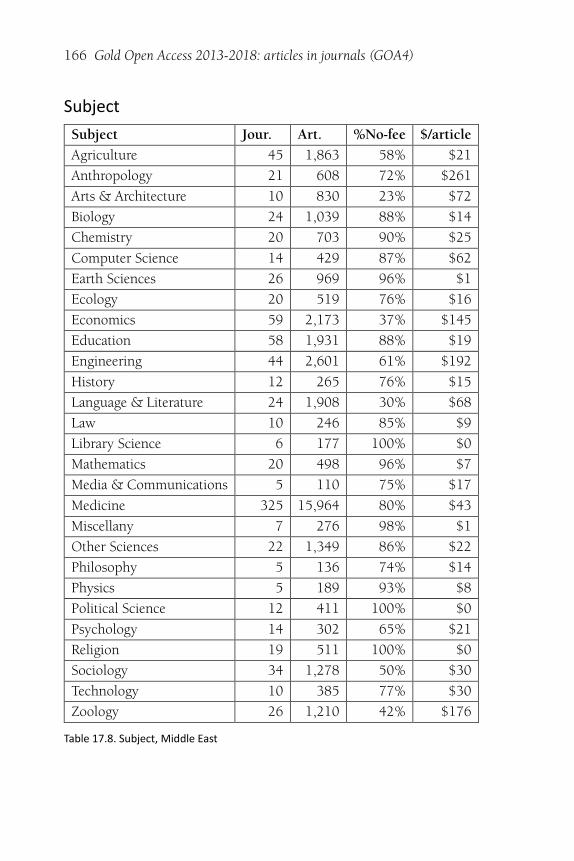
166 Gold Open Access 2013-2018: articles in journals (GOA4)
Subject
Subject Jour. Art. %No-fee $/article
Agriculture 45 1,863 58% $21
Anthropology 21 608 72% $261
Arts & Architecture 10 830 23% $72
Biology 24 1,039 88% $14
Chemistry 20 703 90% $25
Computer Science 14 429 87% $62
Earth Sciences 26 969 96% $1
Ecology 20 519 76% $16
Economics 59 2,173 37% $145
Education 58 1,931 88% $19
Engineering 44 2,601 61% $192
History 12 265 76% $15
Language & Literature 24 1,908 30% $68
Law 10 246 85% $9
Library Science 6 177 100% $0
Mathematics 20 498 96% $7
Media & Communications 5 110 75% $17
Medicine 325 15,964 80% $43
Miscellany 7 276 98% $1
Other Sciences 22 1,349 86% $22
Philosophy 5 136 74% $14
Physics 5 189 93% $8
Political Science 12 411 100% $0
Psychology 14 302 65% $21
Religion 19 511 100% $0
Sociology 34 1,278 50% $30
Technology 10 385 77% $30
Zoology 26 1,210 42% $176
Table 17.8. Subject, Middle East
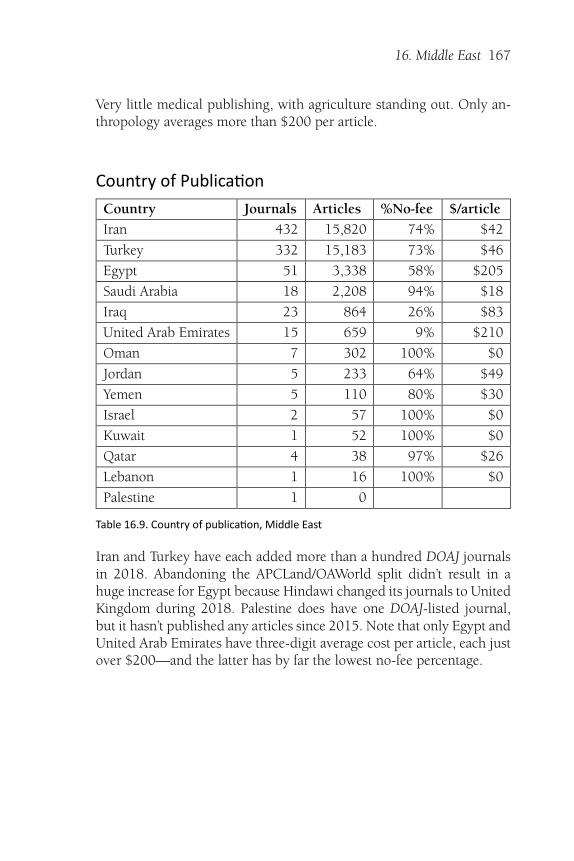
16. Middle East 167
Very little medical publishing, with agriculture standing out. Only an-thropology averages more than $200 per article.
Country of Publica�on
Country Journals Articles %No-fee $/article
Iran 432 15,820 74% $42
Turkey 332 15,183 73% $46
Egypt 51 3,338 58% $205
Saudi Arabia 18 2,208 94% $18
Iraq 23 864 26% $83
United Arab Emirates 15 659 9% $210
Oman 7 302 100% $0
Jordan 5 233 64% $49
Yemen 5 110 80% $30
Israel 2 57 100% $0
Kuwait 1 52 100% $0
Qatar 4 38 97% $26
Lebanon 1 16 100% $0
Palestine 1 0
Table 16.9. Country of publica�on, Middle East
Iran and Turkey have each added more than a hundred DOAJ journalsin 2018. Abandoning the APCLand/OAWorld split didn’t result in ahuge increase for Egypt because Hindawi changed its journals to UnitedKingdom during 2018. Palestine does have one DOAJ-listed journal,but it hasn’t published any articles since 2015. Note that only Egypt andUnited Arab Emirates have three-digit average cost per article, each justover $200—and the latter has by far the lowest no-fee percentage.
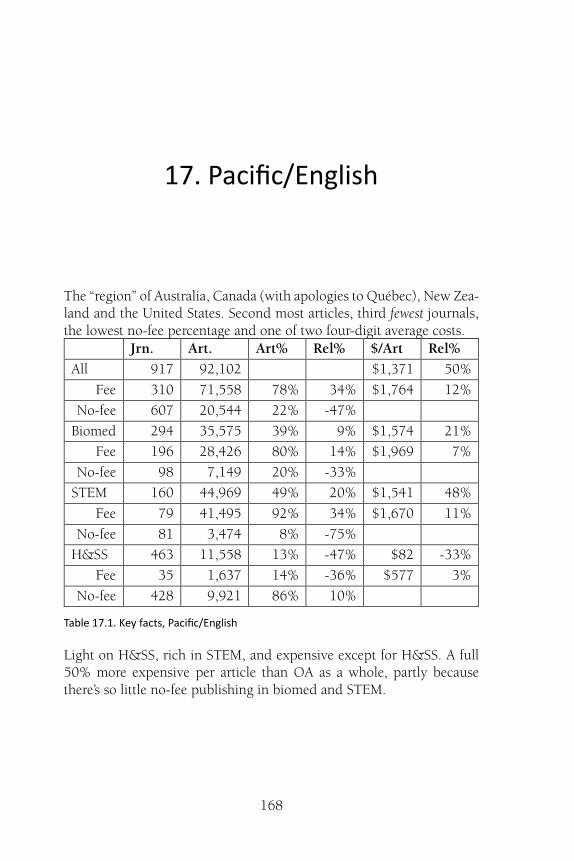
168
17. Pacific/English
The “region” of Australia, Canada (with apologies to Québec), New Zea-land and the United States. Second most articles, third fewest journals,the lowest no-fee percentage and one of two four-digit average costs.
Jrn. Art. Art% Rel% $/Art Rel%
All 917 92,102 $1,371 50%
Fee 310 71,558 78% 34% $1,764 12%
No-fee 607 20,544 22% -47%
Biomed 294 35,575 39% 9% $1,574 21%
Fee 196 28,426 80% 14% $1,969 7%
No-fee 98 7,149 20% -33%
STEM 160 44,969 49% 20% $1,541 48%
Fee 79 41,495 92% 34% $1,670 11%
No-fee 81 3,474 8% -75%
H&SS 463 11,558 13% -47% $82 -33%
Fee 35 1,637 14% -36% $577 3%
No-fee 428 9,921 86% 10%
Table 17.1. Key facts, Pacific/English
Light on H&SS, rich in STEM, and expensive except for H&SS. A full50% more expensive per article than OA as a whole, partly becausethere’s so little no-fee publishing in biomed and STEM.
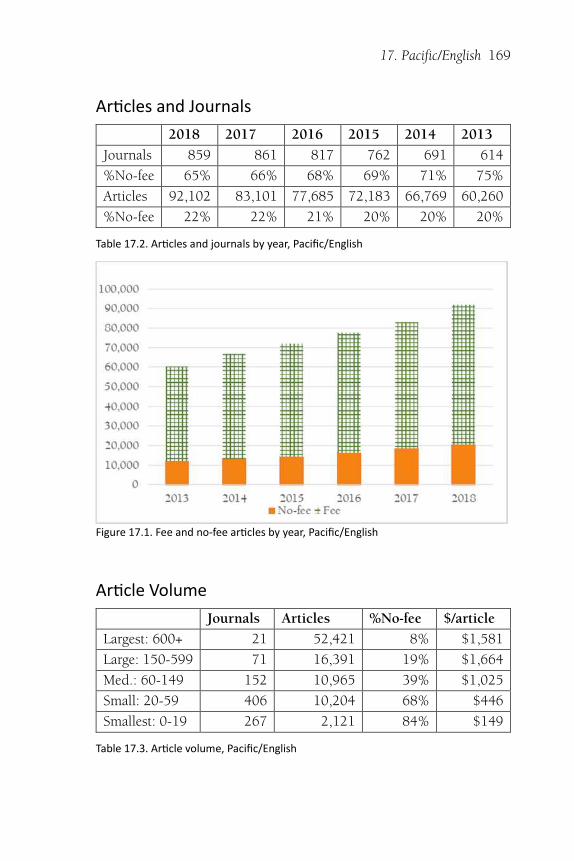
17. Pacific/English 169
Ar�cles and Journals
2018 2017 2016 2015 2014 2013
Journals 859 861 817 762 691 614
%No-fee 65% 66% 68% 69% 71% 75%
Articles 92,102 83,101 77,685 72,183 66,769 60,260
%No-fee 22% 22% 21% 20% 20% 20%
Table 17.2. Ar�cles and journals by year, Pacific/English
Figure 17.1. Fee and no-fee ar�cles by year, Pacific/English
Ar�cle Volume
Journals Articles %No-fee $/article
Largest: 600+ 21 52,421 8% $1,581
Large: 150-599 71 16,391 19% $1,664
Med.: 60-149 152 10,965 39% $1,025
Small: 20-59 406 10,204 68% $446
Smallest: 0-19 267 2,121 84% $149
Table 17.3. Ar�cle volume, Pacific/English
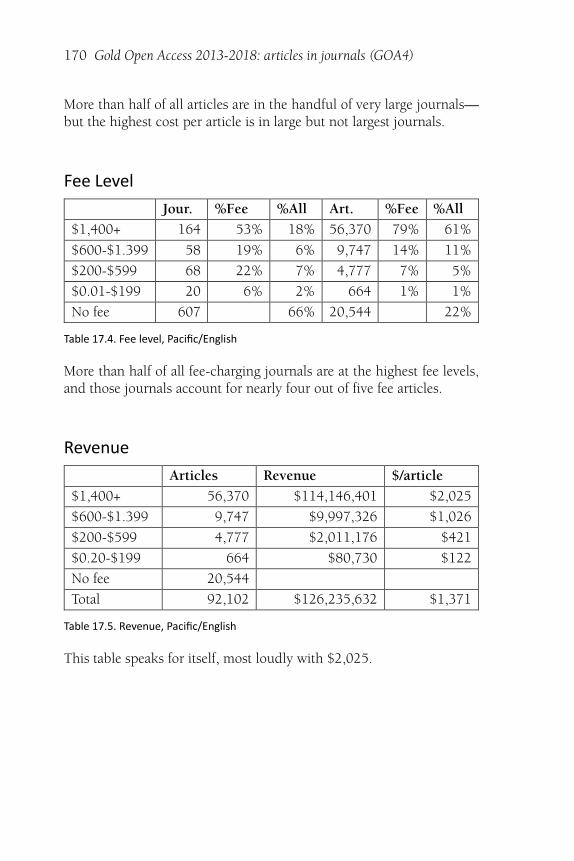
170 Gold Open Access 2013-2018: articles in journals (GOA4)
More than half of all articles are in the handful of very large journals—but the highest cost per article is in large but not largest journals.
Fee Level
Jour. %Fee %All Art. %Fee %All
$1,400+ 164 53% 18% 56,370 79% 61%
$600-$1.399 58 19% 6% 9,747 14% 11%
$200-$599 68 22% 7% 4,777 7% 5%
$0.01-$199 20 6% 2% 664 1% 1%
No fee 607 66% 20,544 22%
Table 17.4. Fee level, Pacific/English
More than half of all fee-charging journals are at the highest fee levels,and those journals account for nearly four out of five fee articles.
Revenue
Articles Revenue $/article
$1,400+ 56,370 $114,146,401 $2,025
$600-$1.399 9,747 $9,997,326 $1,026
$200-$599 4,777 $2,011,176 $421
$0.20-$199 664 $80,730 $122
No fee 20,544
Total 92,102 $126,235,632 $1,371
Table 17.5. Revenue, Pacific/English
This table speaks for itself, most loudly with $2,025.
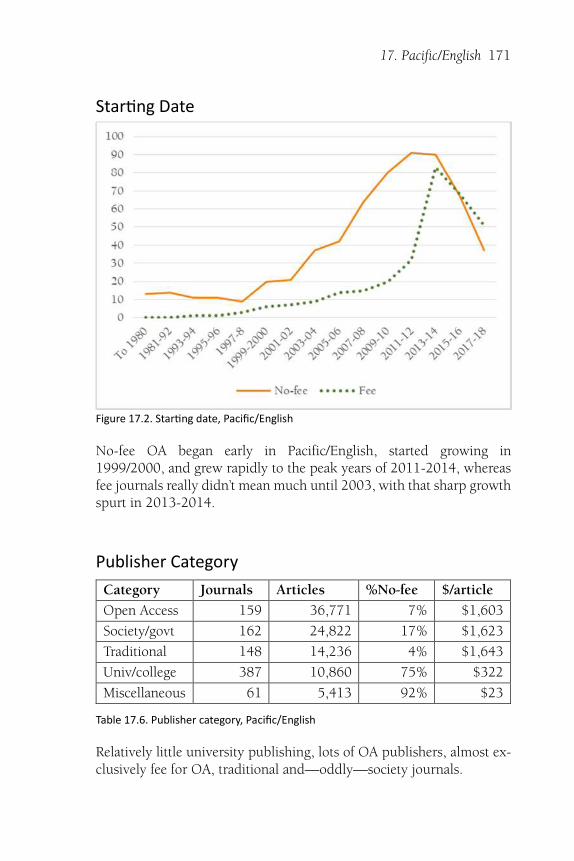
17. Pacific/English 171
Star�ng Date
Figure 17.2. Star�ng date, Pacific/English
No-fee OA began early in Pacific/English, started growing in1999/2000, and grew rapidly to the peak years of 2011-2014, whereasfee journals really didn’t mean much until 2003, with that sharp growthspurt in 2013-2014.
Publisher Category
Category Journals Articles %No-fee $/article
Open Access 159 36,771 7% $1,603
Society/govt 162 24,822 17% $1,623
Traditional 148 14,236 4% $1,643
Univ/college 387 10,860 75% $322
Miscellaneous 61 5,413 92% $23
Table 17.6. Publisher category, Pacific/English
Relatively little university publishing, lots of OA publishers, almost ex-clusively fee for OA, traditional and—oddly—society journals.
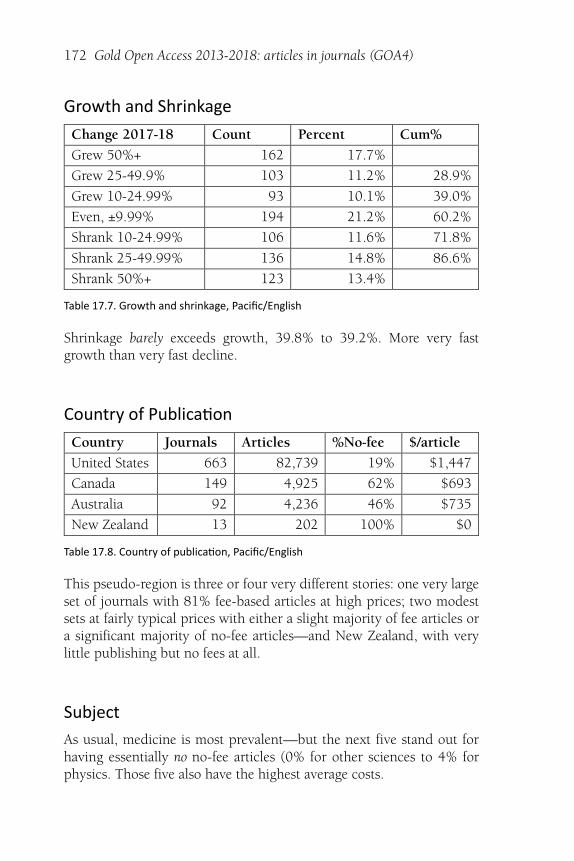
172 Gold Open Access 2013-2018: articles in journals (GOA4)
Growth and Shrinkage
Change 2017-18 Count Percent Cum%
Grew 50%+ 162 17.7%
Grew 25-49.9% 103 11.2% 28.9%
Grew 10-24.99% 93 10.1% 39.0%
Even, ±9.99% 194 21.2% 60.2%
Shrank 10-24.99% 106 11.6% 71.8%
Shrank 25-49.99% 136 14.8% 86.6%
Shrank 50%+ 123 13.4%
Table 17.7. Growth and shrinkage, Pacific/English
Shrinkage barely exceeds growth, 39.8% to 39.2%. More very fastgrowth than very fast decline.
Country of Publica�on
Country Journals Articles %No-fee $/article
United States 663 82,739 19% $1,447
Canada 149 4,925 62% $693
Australia 92 4,236 46% $735
New Zealand 13 202 100% $0
Table 17.8. Country of publica�on, Pacific/English
This pseudo-region is three or four very different stories: one very largeset of journals with 81% fee-based articles at high prices; two modestsets at fairly typical prices with either a slight majority of fee articles ora significant majority of no-fee articles—and New Zealand, with verylittle publishing but no fees at all.
Subject
As usual, medicine is most prevalent—but the next five stand out forhaving essentially no no-fee articles (0% for other sciences to 4% forphysics. Those five also have the highest average costs.
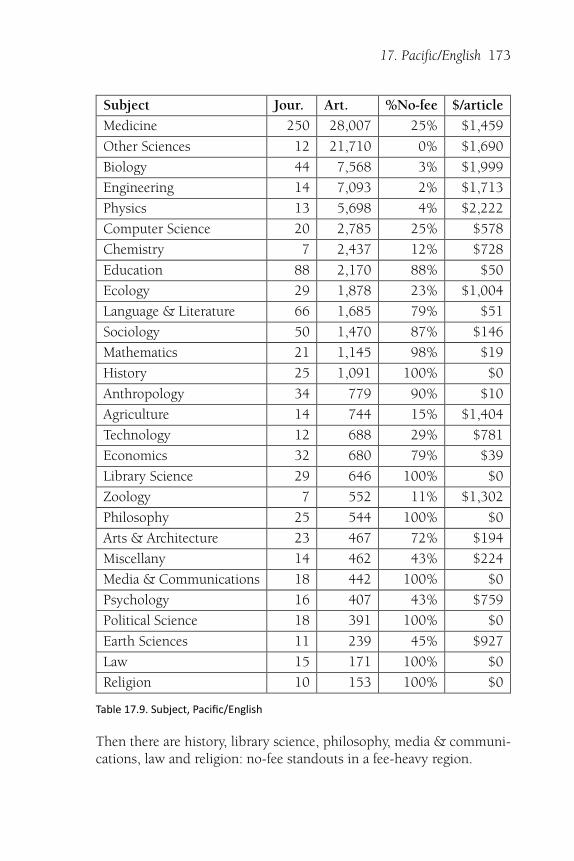
17. Pacific/English 173
Subject Jour. Art. %No-fee $/article
Medicine 250 28,007 25% $1,459
Other Sciences 12 21,710 0% $1,690
Biology 44 7,568 3% $1,999
Engineering 14 7,093 2% $1,713
Physics 13 5,698 4% $2,222
Computer Science 20 2,785 25% $578
Chemistry 7 2,437 12% $728
Education 88 2,170 88% $50
Ecology 29 1,878 23% $1,004
Language & Literature 66 1,685 79% $51
Sociology 50 1,470 87% $146
Mathematics 21 1,145 98% $19
History 25 1,091 100% $0
Anthropology 34 779 90% $10
Agriculture 14 744 15% $1,404
Technology 12 688 29% $781
Economics 32 680 79% $39
Library Science 29 646 100% $0
Zoology 7 552 11% $1,302
Philosophy 25 544 100% $0
Arts & Architecture 23 467 72% $194
Miscellany 14 462 43% $224
Media & Communications 18 442 100% $0
Psychology 16 407 43% $759
Political Science 18 391 100% $0
Earth Sciences 11 239 45% $927
Law 15 171 100% $0
Religion 10 153 100% $0
Table 17.9. Subject, Pacific/English
Then there are history, library science, philosophy, media & communi-cations, law and religion: no-fee standouts in a fee-heavy region.
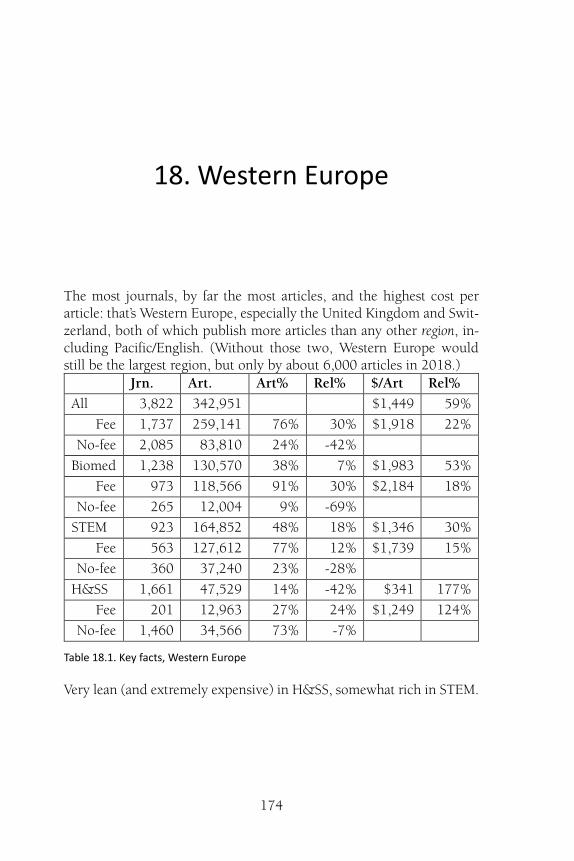
174
18. Western Europe
The most journals, by far the most articles, and the highest cost perarticle: that’s Western Europe, especially the United Kingdom and Swit-zerland, both of which publish more articles than any other region, in-cluding Pacific/English. (Without those two, Western Europe wouldstill be the largest region, but only by about 6,000 articles in 2018.)
Jrn. Art. Art% Rel% $/Art Rel%
All 3,822 342,951 $1,449 59%
Fee 1,737 259,141 76% 30% $1,918 22%
No-fee 2,085 83,810 24% -42%
Biomed 1,238 130,570 38% 7% $1,983 53%
Fee 973 118,566 91% 30% $2,184 18%
No-fee 265 12,004 9% -69%
STEM 923 164,852 48% 18% $1,346 30%
Fee 563 127,612 77% 12% $1,739 15%
No-fee 360 37,240 23% -28%
H&SS 1,661 47,529 14% -42% $341 177%
Fee 201 12,963 27% 24% $1,249 124%
No-fee 1,460 34,566 73% -7%
Table 18.1. Key facts, Western Europe
Very lean (and extremely expensive) in H&SS, somewhat rich in STEM.
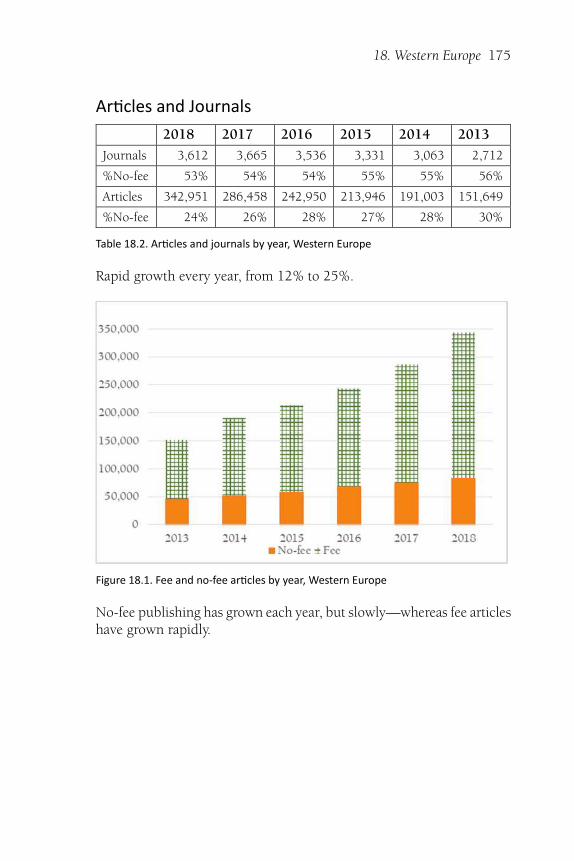
18. Western Europe 175
Ar�cles and Journals
2018 2017 2016 2015 2014 2013
Journals 3,612 3,665 3,536 3,331 3,063 2,712
%No-fee 53% 54% 54% 55% 55% 56%
Articles 342,951 286,458 242,950 213,946 191,003 151,649
%No-fee 24% 26% 28% 27% 28% 30%
Table 18.2. Ar�cles and journals by year, Western Europe
Rapid growth every year, from 12% to 25%.
Figure 18.1. Fee and no-fee ar�cles by year, Western Europe
No-fee publishing has grown each year, but slowly—whereas fee articleshave grown rapidly.
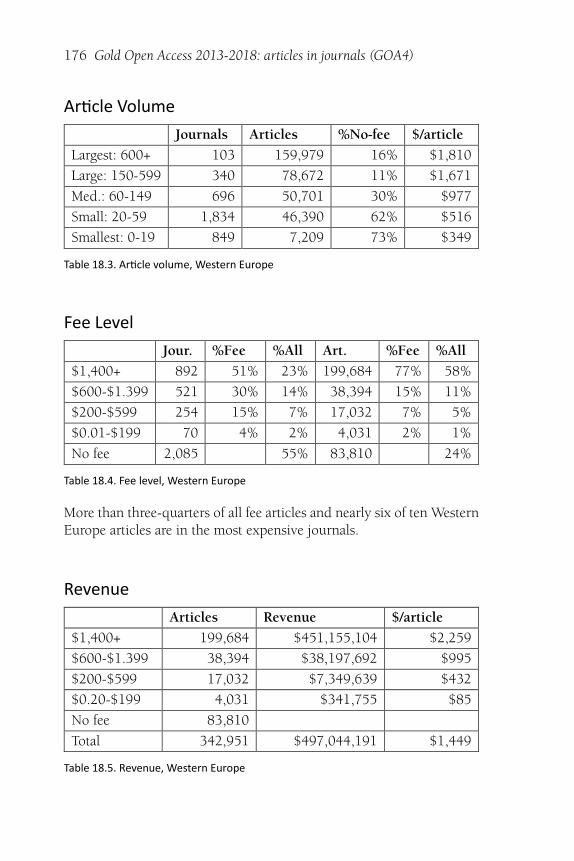
176 Gold Open Access 2013-2018: articles in journals (GOA4)
Ar�cle Volume
Journals Articles %No-fee $/article
Largest: 600+ 103 159,979 16% $1,810
Large: 150-599 340 78,672 11% $1,671
Med.: 60-149 696 50,701 30% $977
Small: 20-59 1,834 46,390 62% $516
Smallest: 0-19 849 7,209 73% $349
Table 18.3. Ar�cle volume, Western Europe
Fee Level
Jour. %Fee %All Art. %Fee %All
$1,400+ 892 51% 23% 199,684 77% 58%
$600-$1.399 521 30% 14% 38,394 15% 11%
$200-$599 254 15% 7% 17,032 7% 5%
$0.01-$199 70 4% 2% 4,031 2% 1%
No fee 2,085 55% 83,810 24%
Table 18.4. Fee level, Western Europe
More than three-quarters of all fee articles and nearly six of ten WesternEurope articles are in the most expensive journals.
Revenue
Articles Revenue $/article
$1,400+ 199,684 $451,155,104 $2,259
$600-$1.399 38,394 $38,197,692 $995
$200-$599 17,032 $7,349,639 $432
$0.20-$199 4,031 $341,755 $85
No fee 83,810
Total 342,951 $497,044,191 $1,449
Table 18.5. Revenue, Western Europe
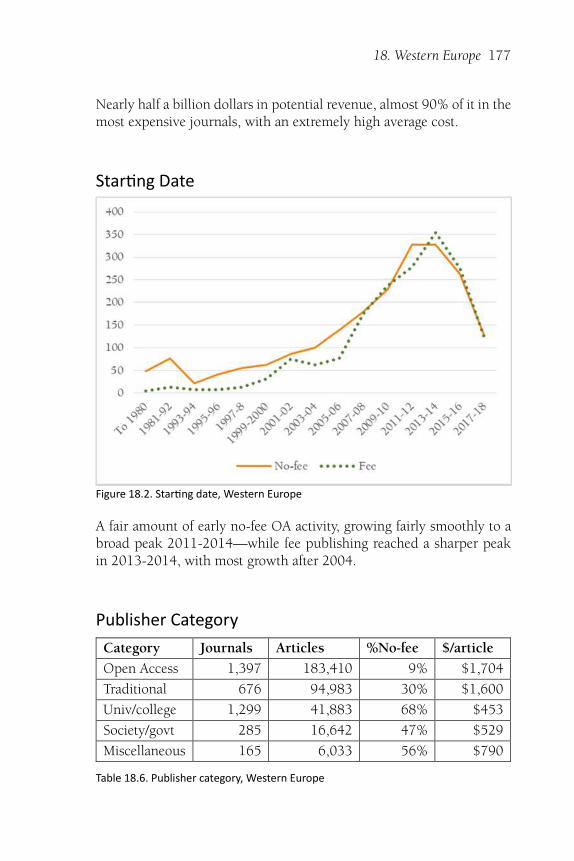
18. Western Europe 177
Nearly half a billion dollars in potential revenue, almost 90% of it in themost expensive journals, with an extremely high average cost.
Star�ng Date
Figure 18.2. Star�ng date, Western Europe
A fair amount of early no-fee OA activity, growing fairly smoothly to abroad peak 2011-2014—while fee publishing reached a sharper peakin 2013-2014, with most growth after 2004.
Publisher Category
Category Journals Articles %No-fee $/article
Open Access 1,397 183,410 9% $1,704
Traditional 676 94,983 30% $1,600
Univ/college 1,299 41,883 68% $453
Society/govt 285 16,642 47% $529
Miscellaneous 165 6,033 56% $790
Table 18.6. Publisher category, Western Europe
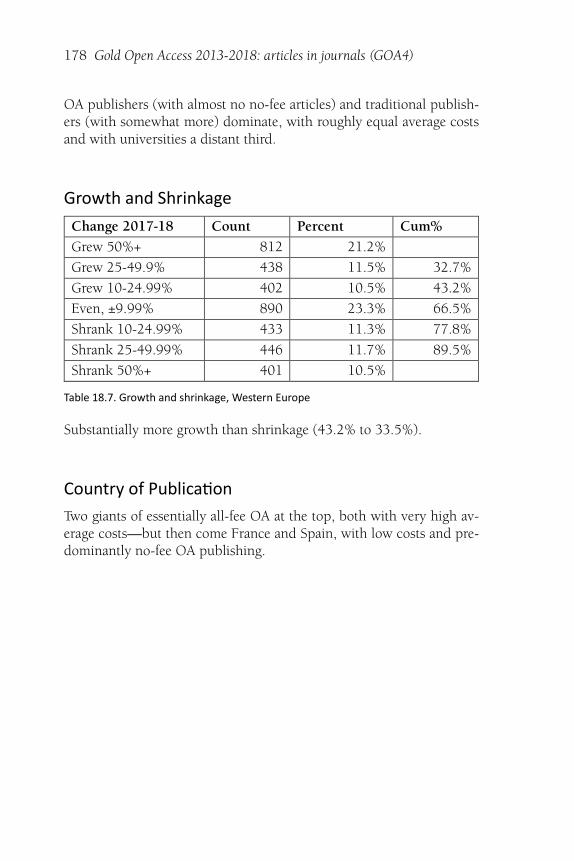
178 Gold Open Access 2013-2018: articles in journals (GOA4)
OA publishers (with almost no no-fee articles) and traditional publish-ers (with somewhat more) dominate, with roughly equal average costsand with universities a distant third.
Growth and Shrinkage
Change 2017-18 Count Percent Cum%
Grew 50%+ 812 21.2%
Grew 25-49.9% 438 11.5% 32.7%
Grew 10-24.99% 402 10.5% 43.2%
Even, ±9.99% 890 23.3% 66.5%
Shrank 10-24.99% 433 11.3% 77.8%
Shrank 25-49.99% 446 11.7% 89.5%
Shrank 50%+ 401 10.5%
Table 18.7. Growth and shrinkage, Western Europe
Substantially more growth than shrinkage (43.2% to 33.5%).
Country of Publica�on
Two giants of essentially all-fee OA at the top, both with very high av-erage costs—but then come France and Spain, with low costs and pre-dominantly no-fee OA publishing.
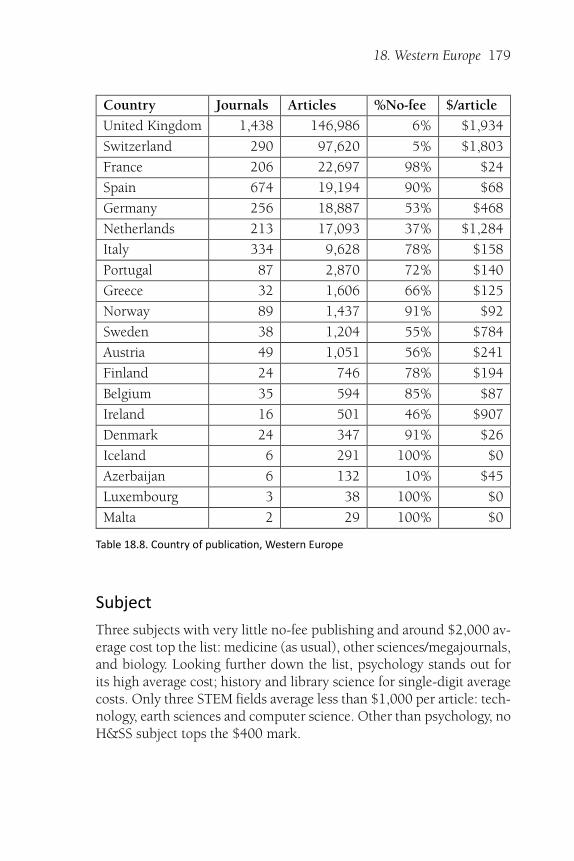
18. Western Europe 179
Country Journals Articles %No-fee $/article
United Kingdom 1,438 146,986 6% $1,934
Switzerland 290 97,620 5% $1,803
France 206 22,697 98% $24
Spain 674 19,194 90% $68
Germany 256 18,887 53% $468
Netherlands 213 17,093 37% $1,284
Italy 334 9,628 78% $158
Portugal 87 2,870 72% $140
Greece 32 1,606 66% $125
Norway 89 1,437 91% $92
Sweden 38 1,204 55% $784
Austria 49 1,051 56% $241
Finland 24 746 78% $194
Belgium 35 594 85% $87
Ireland 16 501 46% $907
Denmark 24 347 91% $26
Iceland 6 291 100% $0
Azerbaijan 6 132 10% $45
Luxembourg 3 38 100% $0
Malta 2 29 100% $0
Table 18.8. Country of publica�on, Western Europe
Subject
Three subjects with very little no-fee publishing and around $2,000 av-erage cost top the list: medicine (as usual), other sciences/megajournals,and biology. Looking further down the list, psychology stands out forits high average cost; history and library science for single-digit averagecosts. Only three STEM fields average less than $1,000 per article: tech-nology, earth sciences and computer science. Other than psychology, noH&SS subject tops the $400 mark.
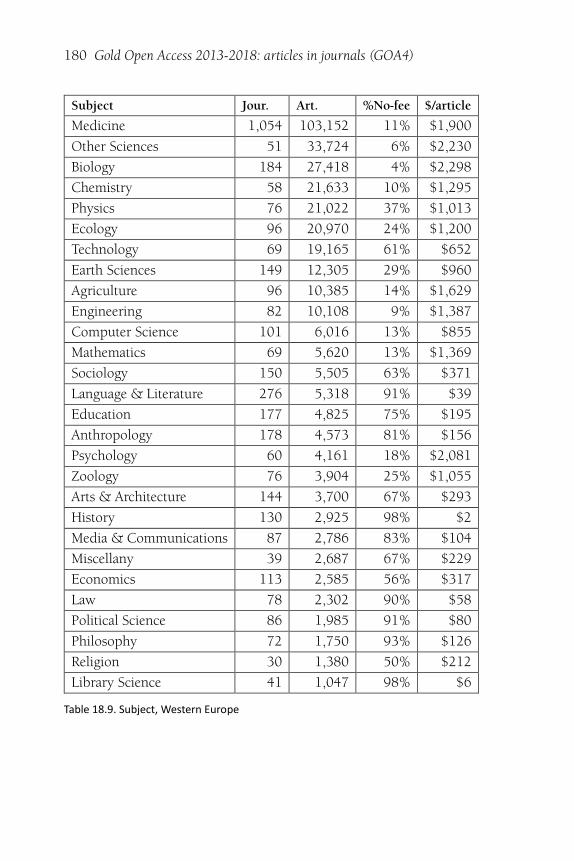
180 Gold Open Access 2013-2018: articles in journals (GOA4)
Subject Jour. Art. %No-fee $/article
Medicine 1,054 103,152 11% $1,900
Other Sciences 51 33,724 6% $2,230
Biology 184 27,418 4% $2,298
Chemistry 58 21,633 10% $1,295
Physics 76 21,022 37% $1,013
Ecology 96 20,970 24% $1,200
Technology 69 19,165 61% $652
Earth Sciences 149 12,305 29% $960
Agriculture 96 10,385 14% $1,629
Engineering 82 10,108 9% $1,387
Computer Science 101 6,016 13% $855
Mathematics 69 5,620 13% $1,369
Sociology 150 5,505 63% $371
Language & Literature 276 5,318 91% $39
Education 177 4,825 75% $195
Anthropology 178 4,573 81% $156
Psychology 60 4,161 18% $2,081
Zoology 76 3,904 25% $1,055
Arts & Architecture 144 3,700 67% $293
History 130 2,925 98% $2
Media & Communications 87 2,786 83% $104
Miscellany 39 2,687 67% $229
Economics 113 2,585 56% $317
Law 78 2,302 90% $58
Political Science 86 1,985 91% $80
Philosophy 72 1,750 93% $126
Religion 30 1,380 50% $212
Library Science 41 1,047 98% $6
Table 18.9. Subject, Western Europe
181
Appendix A. Methods, Changesand Caveats
The Inves�ga�on
This research began with the master dataset prepared for GOAJ3: GoldOpen Access Journals 2012-2017, but proceeded somewhat differentlythan last year. I downloaded DOAJ metadata on December 18, 2018 inorder to allow time to test matching techniques and other issues—and,in the process, determined that it made sense to build the base spread-sheet, then add and delete rows as needed for adds and deletionsthrough midnight, December 31, 2018 or shortly thereafter.
The 2017 dataset included 10,707 journals. The December 18, 2018download consisted of 12,378 records (12,379 including one test rec-ord). After trying a number of matching options, I proceeded as follows:
The best and most unique match appeared to be normalized URL(that is, stripped of http:// or https://) followed by start date—buteven here, it was necessary to disambiguate a few odd cases. Thatdone, 9,450 rows matched in both spreadsheets. Of those, 8,240had the same title, publisher and country; 895 had the same titleand country, but with different publisher names (including all thechanges from BioMed Central to BMC and DeGruyter’s spinoff ofSciendo); 267 had the same title but changed both publisher andcountry; and 48 had different titles and possibly other changes.
Why didn’t I use ISSNs? Other than the fact that I hadn’t storedthem previously, they’re not universal: in the December 18, 2018DOAJ metadata, 7,558 rows included print ISSNs and 10,728 in-cluded e-ISSNs.
182 Gold Open Access 2013-2018: articles in journals (GOA4)
Other matching techniques, including partial-match manual in-spection, yielded another 641 cases where the two spreadsheetsclearly had the same journal—including eight date changes, 141publisher changes, 66 country changes and several hundred URLchanges. The total at this point: 10,091 matches, with 614 remain-ing unmatched 2017 rows and 2,287 unmatched 2018 rows.
Checking DOAJ adds and removes showed 2,272 additional jour-nals for 2018. That suggests a very small number of 2018 changesthat I couldn’t match—around 15. That only meant redoing pre-2018 article counts for those 15 journals.
Of the unmatched 2017 journals, 252 were removed by DOAJ; 128represent ISRN pieces; and 233 are unaccounted for.
The base dataset for 2018 was 12,378 journals as of December 18,2018. I was able to take several days to assign GOAJ subjects andadd regions to countries for added journals and do a number ofconsistency checks. I was also able to refine publisher category as-signments, dealing with changes in publisher and searching formost “miscellaneous” publishers with one or two journals, chang-ing them to one of the four meaningful categories where appropri-ate. (Where the name of the journal and publisher are identical,they were assigned “o”—open—as a publisher category.) Thismoved more than half of the “miscellaneous” journals to somemeaningful category, most commonly “u,”
Shortly after midnight UCT on January 1, 2019 (that is, late in theafternoon on December 31, 2018 in California), I downloaded theDOAJ metadata once more, as well as the deletions-and-additionsdata1. Adding and subtracting as appropriate (nine reported dele-tions, 46 new rows), the final count was 12,415 journals.
The first round of testing, with the spreadsheet arranged by pub-lisher and journal, began January 2, 2019 and was completed onMarch 22, 2019. During the course of testing, a few duplicates
1 Technically, that’s a lie. Observing in downloaded data that no jour-nals have been added between 10 p.m. and midnight on December 31(not unreasonably!), I actually downloaded the metadata at 10:31 pm,December 31, 2018. A recheck shows that no journals were missed asa result.
Appendix A. Methods, Changes and Caveats 183
turned up—perhaps three or four accidental duplications and a fewothers where the same journal appears with titles un two differentlanguages. These are coded “XD,” as are many more journals thateither changed titles before 2013 or ceased publishing before 2013.
Journals with fees were rechecked between March 27 and April 2,2019, to assure more consistent conversion rates for fees not statedin US Dollars. Exceptions are two journals coded XM or XX in thefirst pass, that could be analyzed the second time around, and thathave currencies other than the 22 most commonly used by DOAJjournals; those used rates as of April 15-16, 2019.
The second pass, for 1,143 journals that seemed likely to have ad-ditional articles for 2018, began April 2, 2019 and was completedaround April 12; a “prepass” of XX and XM journals took placeApril 13-14, 2019. I rechecked XX and XM journals a final time onApril 15-17, 2019. Thanks to the good work of DOAJ staff and thejournal publishers they contacted, most of the problematic journalswere now OK, leaving only 17 XM (malware) cases and 100 XX(unreachable/unworkable) cases, in addition to eight XN (not OA)journals and 110 XD (dead or duplicate). These are discussed fur-ther in Chapter 2.
That leaves 12,180 journals that published at least one article be-tween 2013 and 2018 and were accessible during the testing pe-riod, January 2, 2019 to April 17, 2019.
Caveats
The same caveats apply as in GOAJ3: Gold Open Access Journals 2012-2017. Briefly, article counts are (generally) inclusive of reviews, shortreports and (sometimes) editorials, especially when counting shortcutswere available. I used every counting shortcut I could find; and thereare very few estimates (I have 11 journals marked as approximatecounts, but only eight for 2018). I’m certain that some manual countsare off by one or two.
184
Index
Index to tables and figures.Article volume: Africa, 137; Asia, 144; biomed, 88; continuing, 17;
Eastern Europe, 150; H&SS, 114; Latin America, 157; Middle East,163; miscellaneous, 72; new, 17; OA publishers, 53; Pacific/English,169; society/government, 68; STEM, 96; traditional publishers, 64; uni-versity/college publishers, 58; Western Europe, 176
Articles across six years, 32Articles and journals by year: Africa, 136; Asia, 143; biomed, 87;
continuing, 15; dropped journals, 28; Eastern Europe, 150; H&SS,113; Latin America, 157; Middle East, 162; miscellaneous, 72; new, 16;Pacific/English, 169; society/government, 68; STEM, 95; traditionalpublishers, 63; university/college publishers, 57; Western Europe, 175
Articles in fee-charging biomed journals, 34Articles in fee-charging Hum&SS journals, 36Articles in fee-charging journals, 33Articles in fee-charging STEM journals, 35Articles in no-fee biomed journals, 34Articles In no-fee journals, 33Articles in no-fee STEM journals, 35Articles per year and special codes, 3Country of publication (top 31): continuing, 26; new, 27Country of publication: Africa, 141; alphabetic, overall, 78; Asia,
148; biomed (countries with more than 1,000 articles), 92; Eastern Eu-rope, 155; H&SS with >1000 articles in 2018, 119; Latin America, 160;Middle East, 167; OA publishers, partial, 56; overall by cost per article,86; overall, by article count, 82; Pacific/English, 172; society/govern-
Index 185
ment (partial), 71; STEM, more than 1,000 articles in 2018, 101; tradi-tional publishers (partial), 67; university/college publishers, partial, 62;Western Europe, 179
Excluded journals, 12Fee and no-fee articles by year: Asia, 143; Eastern Europe, 150;
Africa, 136; biomed, 88; continuing, 16; H&SS, 114; Latin America,157; Middle East, 163; new, 17; OA publishers, 53; overall, 7; Pa-cific/English, 169; society/government, 68; STEM, 96; traditional pub-lishers, 64; university/college publishers, 58; Western Europe, 175
Fee level: Africa, 137; agriculture, 102; anthropology, 120; arts &architecture, 121; Asia, 144; biology, 93; biomed, 89; chemistry, 103;computer science, 104; continuing, 18; earth sciences, 105; Eastern Eu-rope, 151; ecology, 106; economics, 122; education, 123; engineering,107; H&SS, 115; history, 124; language & literature, 125; Latin Amer-ica, 158; law, 126; library science, 127; mathematics, 108; media &communications, 128; medicine, 94; Middle East, 163; miscellany, 129;new, 18; OA publishers, 54; other sciences, 109; Pacific/English, 170;philosophy, 130; physics, 110; political science, 131; psychology, 132;religion, 133; society/government, 69; sociology, 134; STEM, 97; tech-nology, 111; traditional publishers, 64; university/college publishers,58; Western Europe, 176; zoology, 112
Growth and shrinkage: Africa, 139; Asia, 146; biomed, 91; contin-uing, 22; Eastern Europe, 153; H&SS, 117; Latin America, 159; MiddleEast, 165; new, 22; OA publishers, 55; overall, 7; Pacific/English, 172;society/government, 70; STEM, 99; traditional publishers, 66; univer-sity/college publishers, 60; Western Europe, 178
Key facts: Africa, 135; agriculture, 102; anthropology, 120; arts &architecture, 121; Asia, 142; biology, 93; biomed, 87; chemistry, 103;computer science, 104; continuing, 14; dropped journals, 28; earth sci-ences, 105; Eastern Europe, 149; ecology, 106; economics, 122; educa-tion, 123; engineering, 107; GOA4 (2013-2018, 31; GOAJ (2011-2015), 29; GOAJ2 (2011-2016), 30; GOAJ3 (2012-2017), 30; H&SS,113; history, 124; language & literature, 125; Latin America, 156; law,126; library science, 127; mathematics, 108; media & communications,128; medicine, 94; Middle East, 162; miscellaneous journals, 72; mis-cellany, 129; new, 15; other sciences, 109; overall, 3; Pacific/English,168; philosophy, 130; physics, 110; political science, 131; psychology,132; religion, 133; society/government, 67; sociology, 134; STEM, 95;technology, 111; traditional publishers, 63; university/college publish-ers, 57; Western Europe, 174; zoology, 112
186 Gold Open Access 2013-2018: articles in journals (GOA4)
OA journals by starting year, 5Overweighted subjects: OA publishers, 56; society/government,
71; traditional publishers, 66; university/college publishers, 61Partial article counts for excluded journals, 12Publisher category: Africa, 139; Asia, 146; biomed, 91; continuing,
21; Eastern Europe, 152; H&SS, 117; Latin America, 159; Middle East,165; new, 22; Pacific/English, 171; STEM, 99; Western Europe, 177
Region: agriculture, 102; anthropology, 120; arts & architecture,121; biology, 93; biomed, 90; chemistry, 103; computer science, 104;continuing, 21; earth sciences, 105; ecology, 106; economics, 122; ed-ucation, 123; engineering, 107; H&SS, 116; history, 124; language &literature, 125; law, 126; library science, 127; mathematics, 108; media& communication, 128; medicine, 94; miscellany, 129; new, 21; OApublishers, 55; other sciences, 109; overall, 74; philosophy, 130; phi-losophy, 134; physics, 110; political science, 131; psychology, 132; re-ligion, 133; STEM, 98; technology, 111; traditional publisher, 66;university/college publishers, 60; university/government, 70; zoology,112
Revenue and costs for latest year in each GOA study, 4Revenue: Africa, 138; Asia, 145; biomed, 90; continuing, 20; East-
ern Europe, 151; H&SS, 116; Latin America, 159; Middle East, 164;miscellaneous, 73; new, 20; OA publishers, 55; Pacific/English, 170;society/government, 70; STEM, 98; traditional publishers, 65; univer-sity/college publishers, 59; Western Europe, 176
Revised country names, 25Starting date: Africa, 138; Asia, 145; biomed, 89; continuing, 19;
Eastern Europe, 152; H&SS, 115; Latin America, 158; Middle East,164; new, 19; OA publishers, 54; overall, 6; Pacific/English, 171; soci-ety/government, 69; STEM, 97; traditional publishers, 65; univer-sity/college publishers, 59; Western Europe, 177
Subject: Africa, 140; Asia, 147; biomed, 91; continuing, 23; EasternEurope, 154; H&SS, 118; Latin America, 161; Middle East, 166; new,24; overall, 8; Pacific/English, 173; STEM, 100; Western Europe, 180