gesamtschulkongress, köln, 1. mai 2003 andreas schleicher head, indicators and analysis division
DESCRIPTION
Organisation for Economic Co-Operation and Development Bildung im internationalen Wettbewerb Nach PISA und IGLU. Gesamtschulkongress, Köln, 1. Mai 2003 Andreas Schleicher Head, Indicators and Analysis Division Directorate for Education. - PowerPoint PPT PresentationTRANSCRIPT
11 Organisation for Economic Co-Operation and Development
Bildung im internationalen Wettbewerb
Nach PISA und IGLU
Gesamtschulkongress, Köln, 1. Mai 2003
Andreas SchleicherHead, Indicators and Analysis Division
Directorate for Education
22Analysieren, vergleichen, und
bewertenKreativ mit Information umgehen
Wissen in realitätsnahen Bezügen anwenden
PISA „Literacy“Über die Fähigkeit junger Erwachsener, kreativ
und effizient mit schriftlicher Information umzugehen
Gedankengänge und Ideen wirkungsvoll mitteilen
88
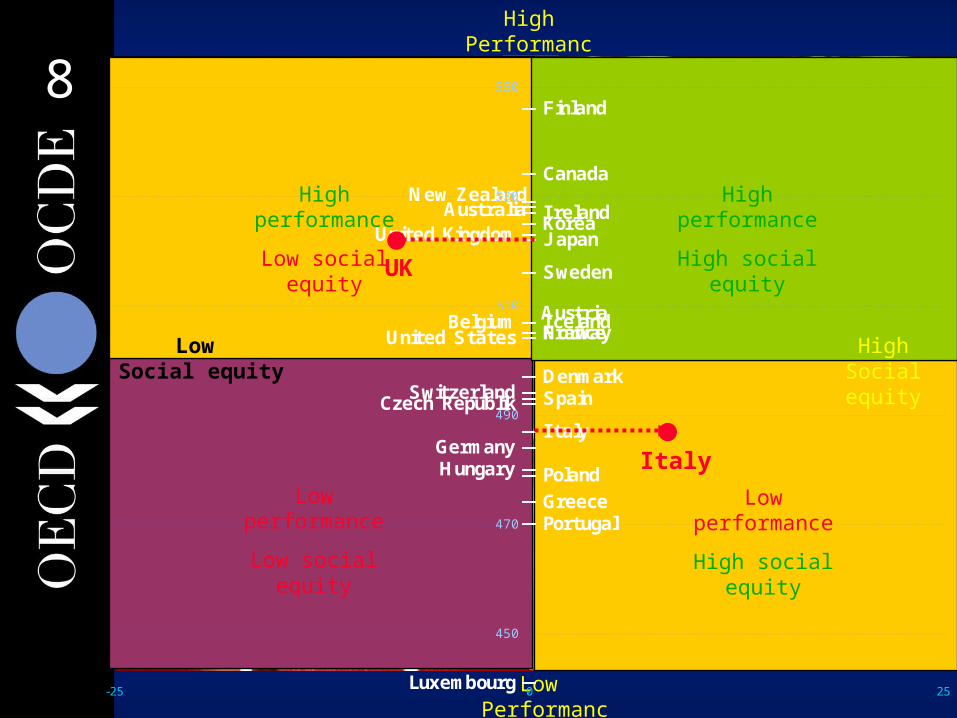
Low Performanc
e
HighPerformanc
e
Low Social equity
Low performance
Low social equity
High performance
Low social equity
Low performance
High social equity
GermanyHungary
Czech RepublikSwitzerland
United States FranceBelgium
United KingdomAustralia
New Zealand
NorwayAustria
Denmark
Luxembourg
PortugalGreecePoland
I taly
Spain
Sweden
Ireland
Canada
Iceland
J apanKorea
Finland
430
450
470
490
510
530
550
-25 0 25
High performance
High social equity
HighSocial equity
Italy
UK
99
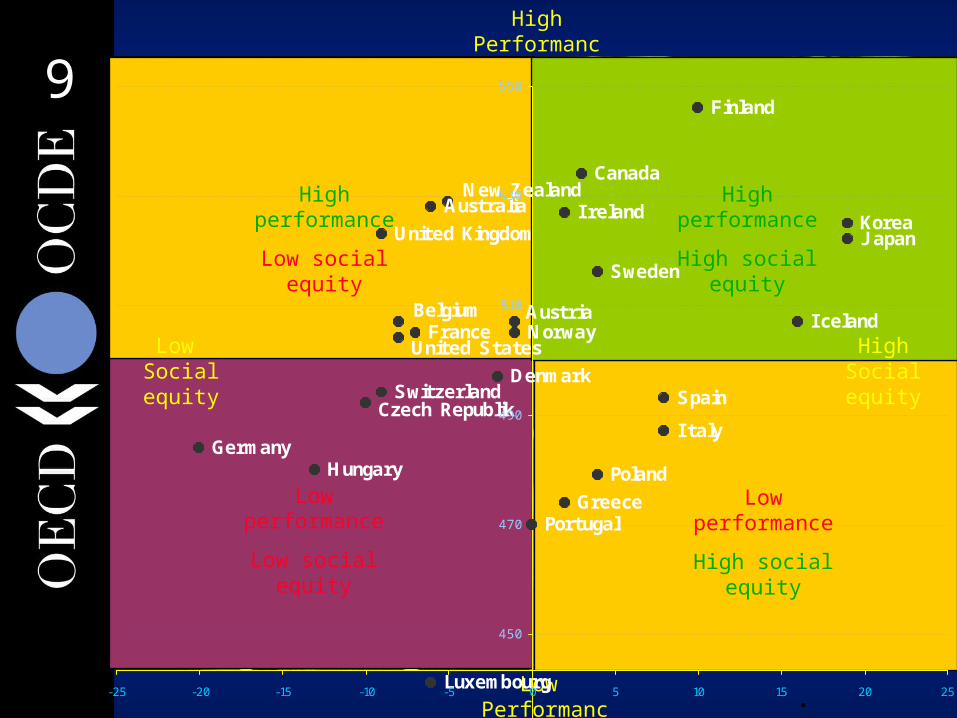
Low Performanc
e
HighPerformanc
e
Low Social equity
Low performance
Low social equity
High performance
Low social equity
Low performance
High social equity
.
High performance
High social equity
HighSocial equity
Finland
KoreaJ apan
Iceland
Canada
I reland
Sweden
Spain
I taly
Poland
GreecePortugal
Luxembourg
Denmark
AustriaNorway
New ZealandAustralia
United Kingdom
BelgiumFrance
United States
SwitzerlandCzech Republik
HungaryGermany
430
450
470
490
510
530
550
-25 -20 -15 -10 -5 0 5 10 15 20 25
1010
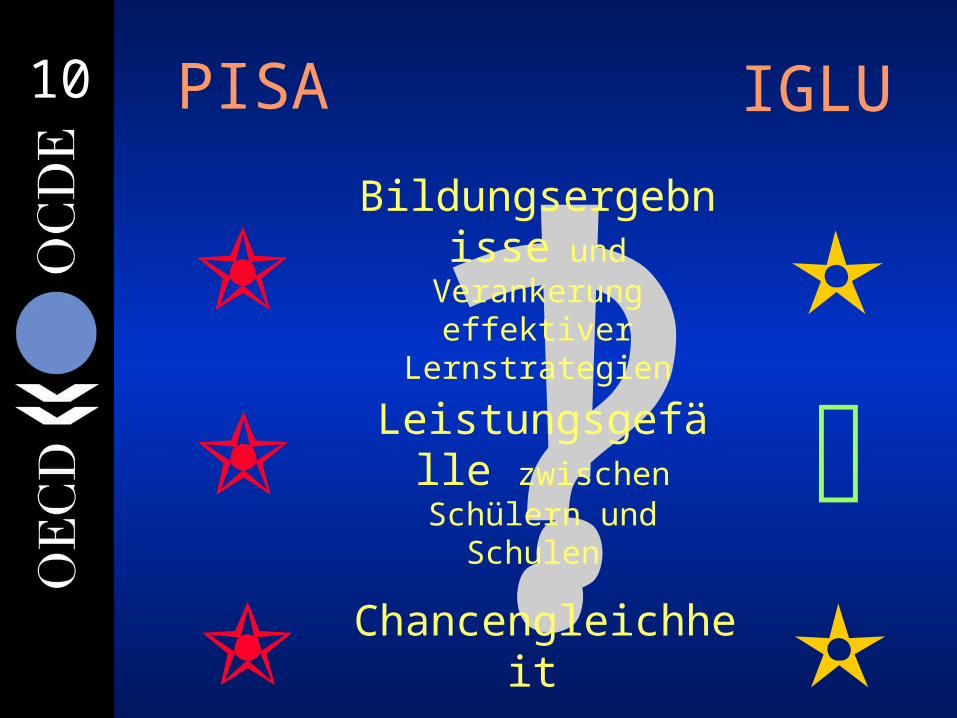
!?PISA
Bildungsergebnisse und Verankerung
effektiver Lernstrategien
Leistungsgefälle zwischen Schülern
und Schulen
Chancengleichheit
IGLU
1111
0
10
20
30
40
50
60
70
80
90
100U
nite
d S
tate
s
Sw
itze
rlan
d
Cze
ch R
epub
lic
Ger
man
y
Den
mar
k
Nor
way
2
Can
ada
Slo
vak
Rep
ublic
Sw
eden
Jap
an
Aus
tria
2
New
Zea
land
Uni
ted
Kin
gdom
3
Net
herl
ands
2, 3
Fin
land
Fra
nce3
Icel
and
Hun
gary
Aus
tral
ia
Luxem
bou
rg
Bel
gium
2
Pola
nd
Irel
and
Kor
ea
Gre
ece
Ital
y
Spa
in
Tur
key
Mex
ico
Port
ugal
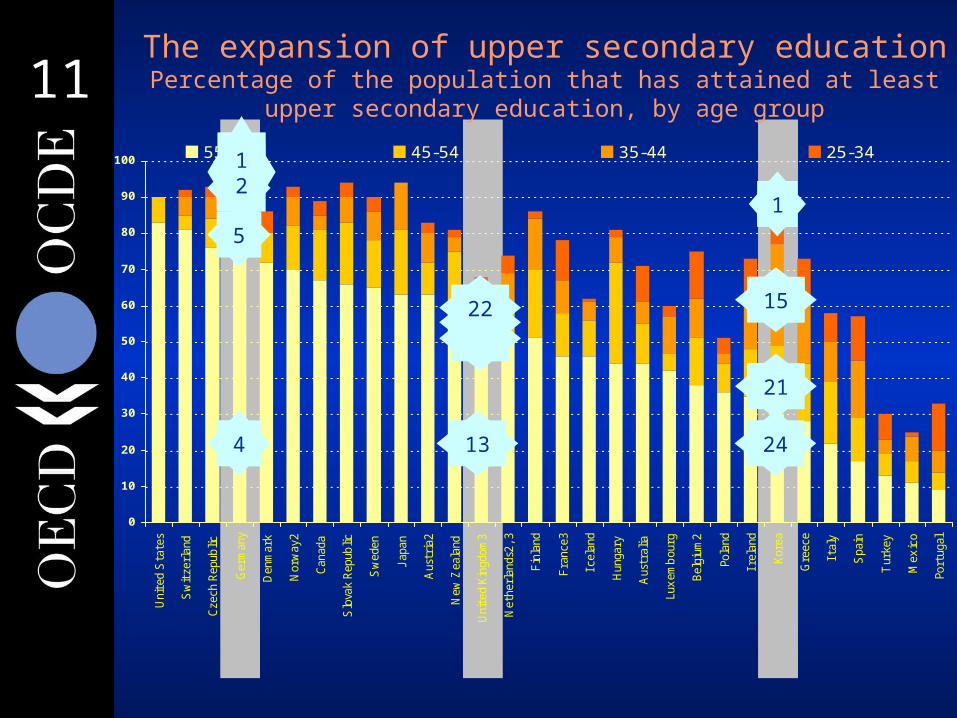
55-64 45-54 35-44 25-34
The expansion of upper secondary educationPercentage of the population that has attained at least upper
secondary education, by age group
13
151822
24
21
15
1
4
5
812
1212
0
10
20
30
40
50Po
rtug
al
Aus
tria
1
Den
mar
k
Gre
ece
Ital
y
Tur
key
Mex
ico
New
Zea
land
Bel
gium
1
Fra
nce
Irel
and
Kor
ea
Luxem
bou
rg
Slo
vak
Rep
ublic
Spa
in
Cze
ch R
epub
lic
Ger
man
y
Jap
an
Pola
nd
Fin
land
Icel
and
Aus
tral
ia
Hun
gary
Uni
ted
Kin
gdom
Sw
itze
rlan
d
Can
ada
Net
herl
ands
1
Sw
eden
Nor
way
1
Uni
ted
Sta
tes
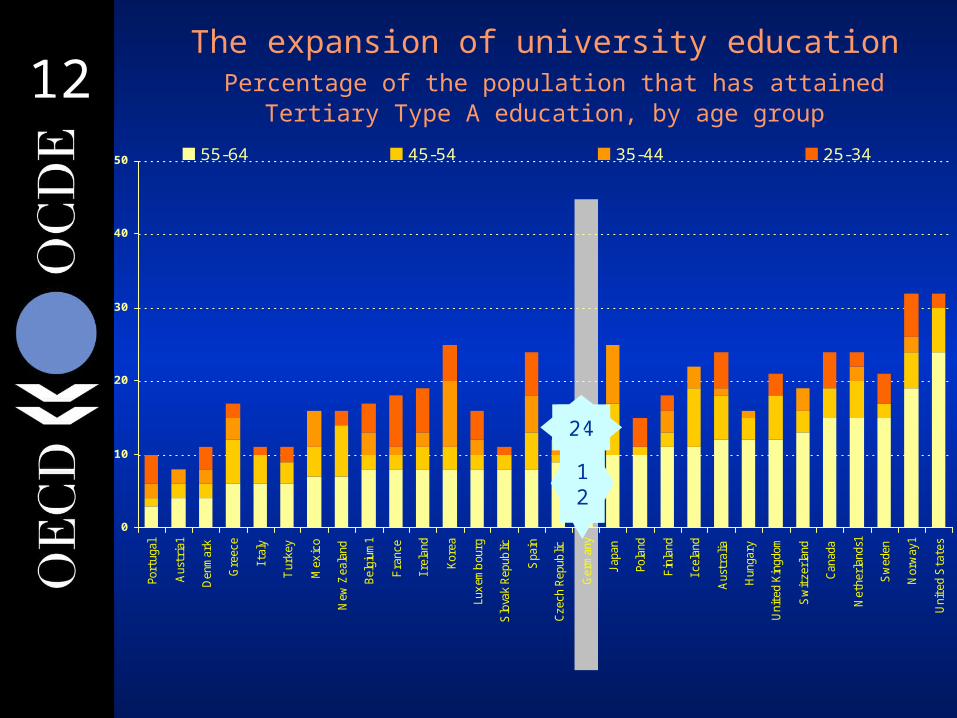
55-64 45-54 35-44 25-34
The expansion of university education Percentage of the population that has attained Tertiary Type A
education, by age group
24
12
1313
0
5
10
15
20
25
30
35
40
45
50
55
60
65
70
75
80
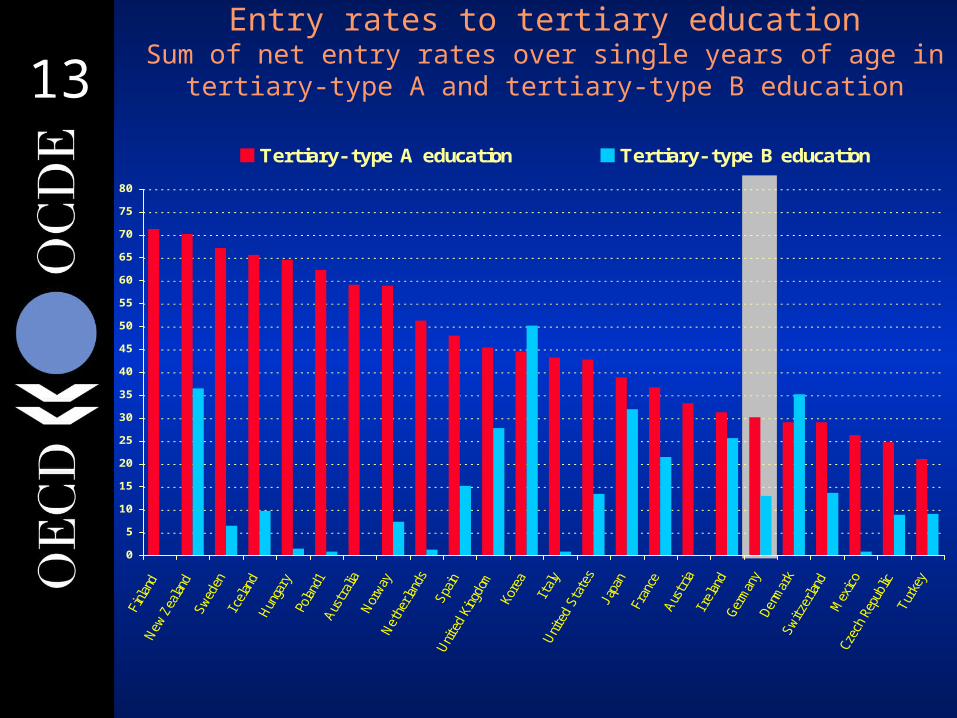
Tertiary- type A education Tertiary- type B education
Entry rates to tertiary educationSum of net entry rates over single years of age in tertiary-
type A and tertiary-type B education
1616
1
2
12
3
4
5
6
7
8
9
10
11
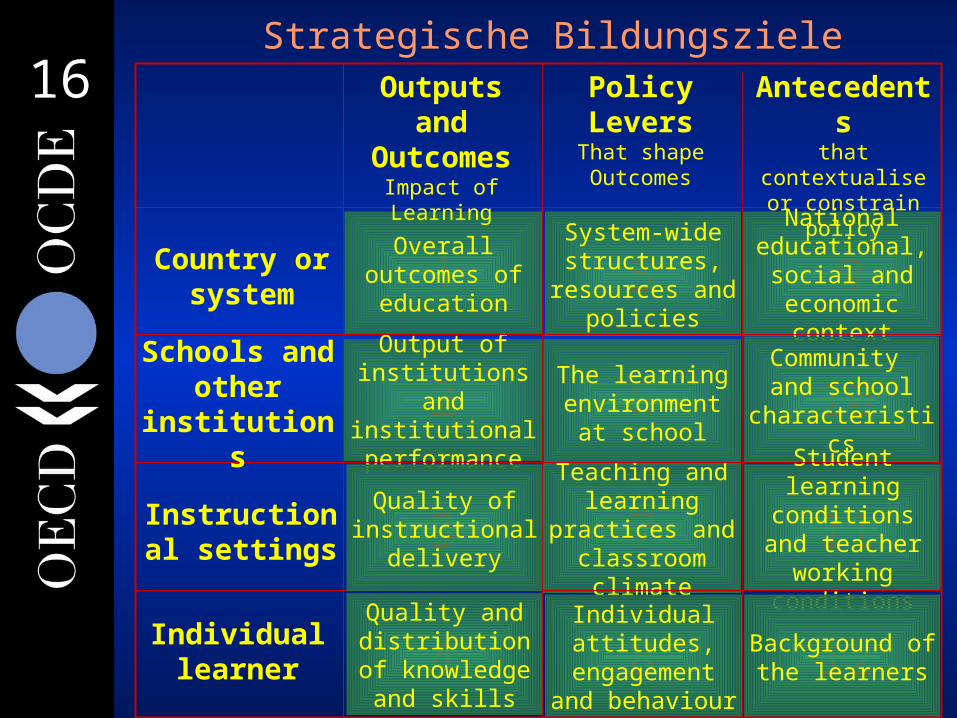
Overall outcomes of education
Output of institutions and
institutional performance
Quality and distribution of knowledge and
skills
System-wide structures,
resources and policies
The learning environment at
school
Teaching and learning
practices and classroom
climateIndividual attitudes,
engagement and behaviour
National educational, social and economic context
Community and school
characteristics
Student learning
conditions and teacher working
conditions
Background of the learners
Strategische BildungszieleOutputs
and Outcomes
Impact of Learning
Policy LeversThat shape Outcomes
Antecedentsthat
contextualise or constrain policy
Country or system
Schools and other
institutions
Instructional settings
Individual learner
Quality of instructional
delivery

1818Finland
KoreaJ apan
Iceland
Canada
I reland
Sweden
Spain
I taly
Poland
GreecePortugal
Luxembourg
Denmark
AustriaNorway
New ZealandAustralia
United Kingdom
BelgiumFrance
United States
SwitzerlandCzech Republik
HungaryGermany
430
450
470
490
510
530
550
-25 -20 -15 -10 -5 0 5 10 15 20 25
E.g. Learning environment and course offering
High degree of autonomy
Low degree of autonomy
% Variance between schools
Low Performanc
e
HighPerformanc
e
Low Social equity
.
HighSocial equity
7%
9%
11%
76%
75% 71
%
20%
r=.51
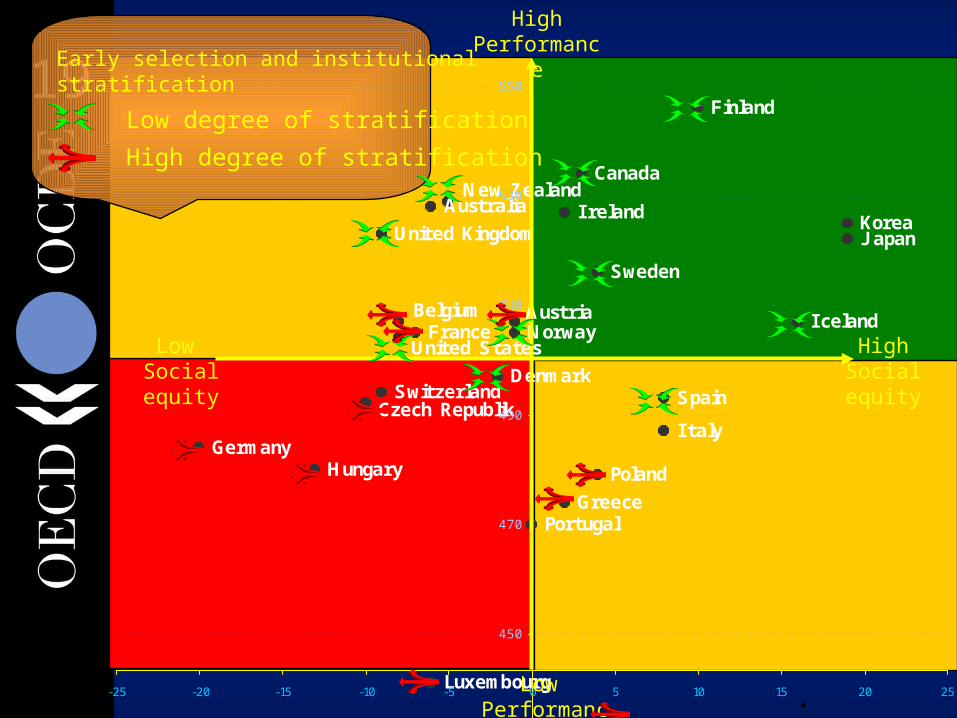
1919Early selection and institutional stratification
Low degree of stratification
High degree of stratification
Finland
KoreaJ apan
Iceland
Canada
I reland
Sweden
Spain
I taly
Poland
GreecePortugal
Luxembourg
Denmark
AustriaNorway
New ZealandAustralia
United Kingdom
BelgiumFrance
United States
SwitzerlandCzech Republik
HungaryGermany
430
450
470
490
510
530
550
-25 -20 -15 -10 -5 0 5 10 15 20 25Low Performanc
e
HighPerformanc
e
Low Social equity
.
HighSocial equity
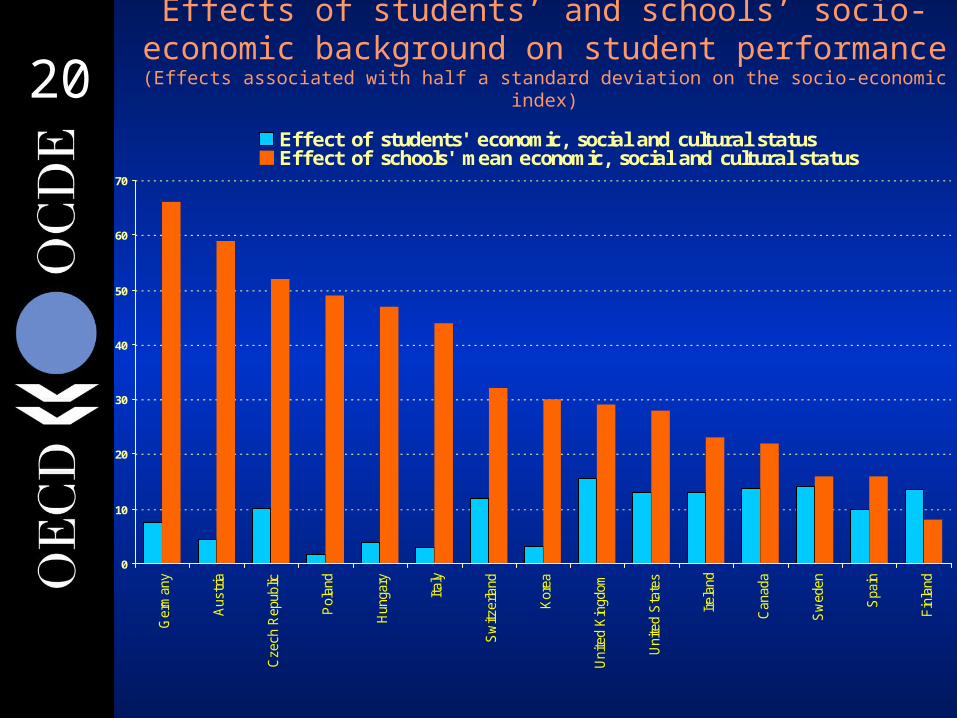
2020
0
10
20
30
40
50
60
70
Ger
man
y
Aus
tria
Cze
ch R
epub
lic
Pol
and
Hun
gary
Ital
y
Sw
itzer
land
Kor
ea
Uni
ted
Kin
gdom
Uni
ted
Sta
tes
Irel
and
Can
ada
Sw
eden
Spa
in
Fin
land
Eff ect of students' economic, social and cultural statusEff ect of schools' mean economic, social and cultural status
Effects of students’ and schools’ socio-economic background on student performance
(Effects associated with half a standard deviation on the socio-economic index)
2121 Weitere Informationen
www.oecd.org www.pisa.oecd.org email: [email protected]
…and remember:
Without data, you are just another person with an opinion