gis -based sensitivity analysis of multicriteria weights ...textroad.com/pdf/jbasr/j. basic. appl....
TRANSCRIPT
J. Basic. Appl. Sci. Res., 1(9)1102-1111, 2011
© 2011, TextRoad Publication
ISSN 2090-424X Journal of Basic and Applied
Scientific Research www.textroad.com
*Corresponding Author: Mohammd Hezam Al-Mashreki, 1School of Environmental and Natural Resource Sciences Faculty of Science and Technology, University of Kebangsaan Malaysia. Email: [email protected]
GIS-Based Sensitivity Analysis of Multi-Criteria Weights for Land Suitability Evaluation of Sorghum Crop in the Ibb Governorate,
Republic of Yemen
Mohammd Hezam Al-Mashreki*1, Juhari Bin Mat Akhir1, Sahibin Abd Rahim,1 Kadderi Md. Desa1 Tukimat Lihan1 and Abdul Rahman Haider2
1School of Environmental and Natural Resource Sciences Faculty of Science and Technology
Universiti Kebangsaan Malaysia 43600 UKM Bangi Selangor, Malaysia 2Agricultural Research and Extension Authority, Republic of Yemen
ABSTRACT
Sensitivity analysis was used to determine how sensitive a model to the changes in the value of the parameter while keeping the other parameters unchanged. It also helps to build confidence in the model by studying the uncertainties that are often associated with parameter in models. Sensitivity analysis allows determining what level of accuracy is necessary for a parameter to make the model sufficiently useful and valid. In this study, as an example, the parameter sensitivity is carried out for path allocation to determine the variation in the output caused by different input weights for four criteria namely climate, soil, slope, and erosion. So that sixteen weighting schemes were constructed, associated with the criterion map layers and run using the model’s implementation in ArcGIS. The weighting schemes were applied for the selected crop (sorghum). The model finds the best path given the weights placed. By varying the weight, several different paths can be found. The results revealed that the slope is a very highly sensitive element in the suitability classification for sorghum crop, whereas the soil is a highly sensitive, the climate and erosion are moderately sensitive. This implies that each factor has to be given suitable weighting reflecting its importance for the suitability of sorghum in the study area. KEY WORDS: ArcGIS, Sensitivity Analysis, suitability criteria, land suitability evaluation,
Sorghum crop
1. INTRODUCTION Sensitivity analysis is defined as the evaluation of the impact or effect of changes in input values on the model
outputs (Frey et al. 2004). A similar definition of the sensitivity analysis offered by Saltelli et al.(2000) states that sensitivity analysis is the study of the ways in which the variation in the output of a model can be apportioned in terms of the quantity and quality among model inputs. It is indicated that it is possible for using sensitivity analysis as an aid in the process of identification of the important uncertainties. This use mainly aims at prioritizing additional data collection or research (Frey et al. 2004). In addition, another important role is played by sensitivity analysis in verifying and validating the model throughout the course of model development and refinement (Fraedrich & Goldberg 2000, Kleijnen & Sargent 2000). It is also stated that another use of sensitivity analysis is to gain further insight into the robustness of model results especially in cases when decisions are made (Saltelli et al. 2000).
For the application of the sensitivity analysis methods, it is proved there have been various methods used in different research fields such as the field of complex engineering systems, economics, physics, social sciences, medical decision making, and others (Helton 1993, Merz et al. 1992). There has been an increasingly growing interest of researhers in integrating GIS capability with multi-criteria decision-making (MCDM) processes. Since integrating GIS-based MCDM as one of the most useful methods for spatial planning and management (Chen et al. 2007, Chen,Khan et al. 2009, Joerin et al. 2001, Karnatak et al. 2007). It is important, there has been a widely increasing request for tools supporting collaborative decisions for the last few decades. In the aerea of land suitability assessments, it has been found that the combination of GIS and MCDM is proved to be a powerful approach in this area. This is because such approach combines a set of geographically defined basic units (e.g. polygons in vectors, or cells in rasters), and a set of evaluation criteria represented as map layers. However, the problem which is possible to be encountered by a researcher in applying this approach is combining the criterion maps based on the attribute values and decision maker’s preferences by using a set of decision rules, or weights for the purpose of classifying each unit into a suitability level (Chen,Yu et al. 2009).
1102
Al-Mashreki et al., 2011
Chen et al. (2010) stressed the importance of recognizing the conditional state of the MCDM-derived rankings (i.e. dependent on the nature of the alternatives under consideration, the criteria used to compare alternatives, and the weights derived for criteria, etc.). Criteria weights are often recognized to represent the major source of controversy and uncertainty. This is partially due to the lack of abslute awareness of the preferences regarding the criteria on the part of decision makers. Another reseaon for this is that it is probable that the nature and scale of the criteria are not well-known. Morover, in cases especially when multiple decision makers are involved, it is often not possible to derive only one set of weights, but ranges of weights, and thus a variety of results. The cruciality of the sensitivity analysis is proved to be evident in the validation and calibration of numerical models. Using it as a tool is useful in checking the robustness of the final outcome against slight changes in the input data (Merritt et al. 2005, Newham et al. 2003, Ticehurst et al. 2003, Zoras et al. 2007).
The usefluness of the sensitivity analysis procedures is that they can help to reduce the uncertainty in the way how a MCDM method operates and the stability of its outputs by illustrating the effect of making slight changes to specific input parameters on evaluation outcomes (Crosetto et al. 2000). Moreover, it is perhaps relatively/more common for checking for changes regarding the criteria values to use sensitivity analysis for the analysis of changes in the weights given to the criteria. In the review of sensitivity analysis by Delgado & Sendra (2004) which focused on the ways how sensitivity analysis has been applied to GIS-based MCDM models, it is pointed that only little attention had been paid to the evaluation of the final results.
It is indicated that the most frequently used sensitivity analysis is based on the variation of the weights of the factors which are implied in the process to test whether it significantly modifies the results obtained. It is propable that the lack of insight provided into the spatial aspects of weight sensitivity is the most critical shortcoming of sensitivity analysis procedures found in limited GIS-Multi-criteria applications. Therfore, it is recommended that sensitivity analysis procedures should allow weight sensitivity to be visualized geographically and to facilitate the spatial analysis of sensitivity where it is appropriate (Feick & Hall 2004).
This paper is mainly concerned with addressing the prevoiusly stated issues by integrating or implimenting a new approach to investigate the spatial dimension of multi-criteria weight sensitivity. This approach makes a use of a generic sensitivity analysis methodology in a GIS-based suitability criteria model. It functions as an Analytical Hierarchy Process-sensitivity analysis tool to be used to examine the assessment of the sensitivity of multi-criteria in criteria weight changes and subsequently visualizing the spatial change dynamics relative to the decision problem. Thus, it is applied by using GIS-based multi-criteria land suitability assessment for potential rainfed agriculture in the Ibb governorate, Republic of Yemen.
2. METHODOLOGY
2.1 The study area
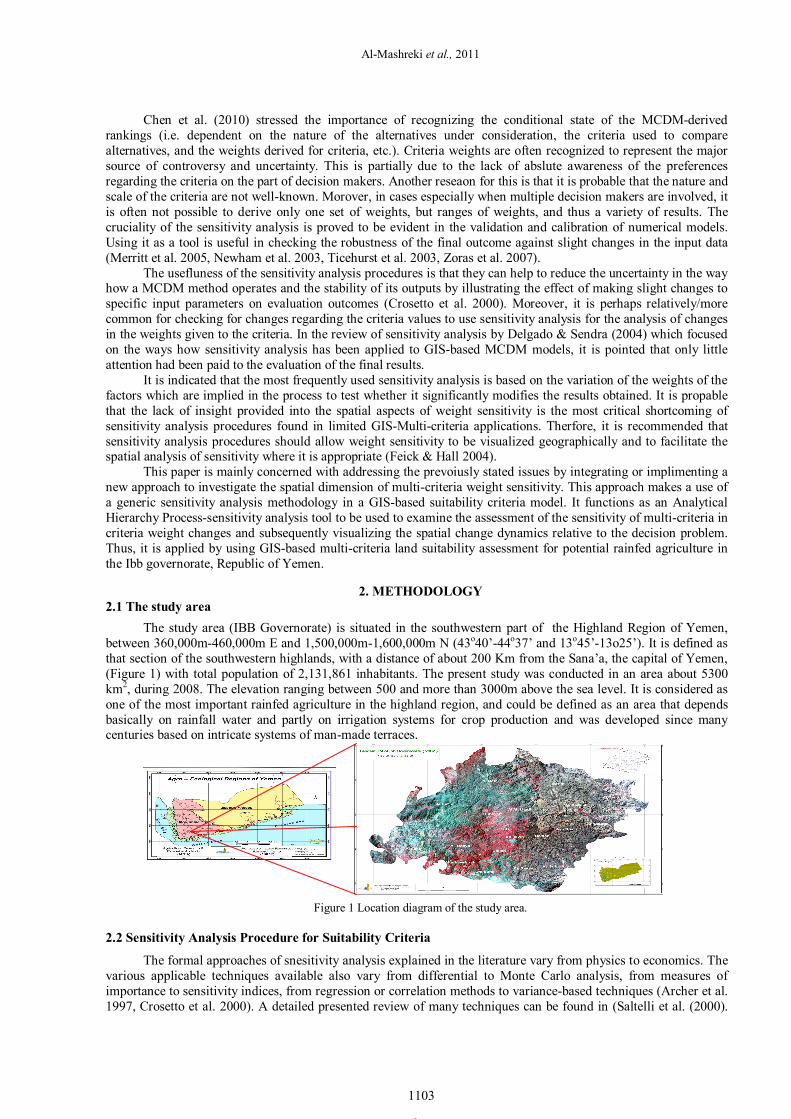
The study area (IBB Governorate) is situated in the southwestern part of the Highland Region of Yemen, between 360,000m-460,000m E and 1,500,000m-1,600,000m N (43o40’-44o37’ and 13o45’-13o25’). It is defined as that section of the southwestern highlands, with a distance of about 200 Km from the Sana’a, the capital of Yemen, (Figure 1) with total population of 2,131,861 inhabitants. The present study was conducted in an area about 5300 km2, during 2008. The elevation ranging between 500 and more than 3000m above the sea level. It is considered as one of the most important rainfed agriculture in the highland region, and could be defined as an area that depends basically on rainfall water and partly on irrigation systems for crop production and was developed since many centuries based on intricate systems of man-made terraces.
Figure 1 Location diagram of the study area. 2.2 Sensitivity Analysis Procedure for Suitability Criteria
The formal approaches of snesitivity analysis explained in the literature vary from physics to economics. The various applicable techniques available also vary from differential to Monte Carlo analysis, from measures of importance to sensitivity indices, from regression or correlation methods to variance-based techniques (Archer et al. 1997, Crosetto et al. 2000). A detailed presented review of many techniques can be found in (Saltelli et al. (2000).
2
1103
J. Basic. Appl. Sci. Res., 1(9)1102-1111, 2011
The simplest approach is recognized in cases when the input factors are varied. It is called ‘‘One At a Time’’ or better known as the OAT method. For its advantages, it is easy to be implemented, computationally cheap, and has been frequently applied in diverse fields where models are employed. This is also identified as the theoretical basis for this methodology. For descrbing the ideal snesitivity analysis tool in supporting an suitability criteria, it is stated that the capability of this snesitivity analysis of taking several levels of uncertainty into account at the global level should be available (i.e. over the entire problem space). However, in the present study, the aspect of criteria weight sensitivity that is of great interest is utilizing the stability of an assessment by making a well-known quantity of change to one weight and observing the expected changes in the rankings of alternatives (e.g. changes taking place in criterion evaluation weights). A series of assessments done are carried out where each criterion weight can be changed in a percent increase over the corresponding feasible range (Chen,Yu et al. 2009). The application of the methodology was demonstrated using GIS-based multi-criteria land suitability evaluation for rainfed cropland in Ibb Governorate, Rebublic of Yemen.
2.3 Spatial modelling with GIS
According to Burrough & McDonnell (1998), value of using GIS is recognized through its providence of a
wide variety of analysis capabilities which enable it to perform its functions on the topology or spatial aspects of geographic data, on the non-spatial attributes of these data, or on both of them as being combined together. These analysis capabilities also enable GIS to be flexible tools,thus, making the use of a GIS for assesing computational models (spatial modelling) as a common practice taken up in diverse types of applications. This is usually based on the spatial data such as natural resource management, hydrology, land planning, etc. The quality of the input and output data of computational models based on a GIS is viewed as a very important aspect to be taken into consideration. It is also possible for the input data to be impacted by uncertainties, which is attributed to various sources namely; measurement errors, uncertainties offfered by inadequate definition, excessively coarse scale, insufficient samples. Burrough & McDonnell (1998) provided a detailed description of sources of possible errors in GIS. it was found that there is a propagation of the errors in the input to the output of the operation in cases when spatial data are used as input to a GIS operation. Therefore, in such a case, it is probable that the reliability of the output will not sufficiently high so that correct conclusions can be drawn from it (Heuvelink 1999). In this research, as to perform simulations where there were various decision weights associated with all criteria used for suitability modelling, the researcher developed a methodology with the aim of investigating their relative impacts on the final results of the evaluation. A tool integrating sensitivity analysis within the ArcGIS environment was also employed. This is because it is expected that a variety of user defined simulations are permitted to be performed for carrying out quantitative evaluation of the model dynamic changes, measuring the stability of results in relation to the various parameter weights, and displaying spatial dynamic changes. It also performs the function of calculating the needed importance of weighting factors which are related to criterion map layers. This is performed with the assistance of a preference matrix where all identified relevant criteria are compared against each other with reproducible preference factors. It is followed by aggregating the weights with the criterion maps in the same way in which the weighted combination methods were conducted.
2.4 Tool Implementation and Base Run
Nwer (2005) indecated that the general purpose of sensitivity analysis for the suitability criteria was to find
out the influence of different criteria weights on the spatial pattern of the suitability classification. This is useful in situations such as where uncertainties exist in the definition of the importance of different suitability criteria. A raster-based tool was developed to implement the sensitivity analysis procedure using Arc GIS (Engine) 9.2 (Rudden & Mackenzie 2008) to visualise the sensitivity analysis. The tool starts with loading all criteria data layers into the map frame, which were processed as ESRI integer grids with the same extent and coordinate system. In practice, sensitivity analysis was accomplished by applying different weighting schemes for the suitability criteria. It is important to observe how the results will change if the weights are changed. In the present study, the suitability classes consisting of five level used were adapted from FAO system (FAO 1976). They are stated as highly suitable (S1), moderately suitable (S2), marginally suitable (S3) currently unsuitable (N1) and permanently unsuitable (N2). In the basic computation, an unequal weights were given to the four criteria (climate, soil, slope, and erosion). This four criteria were chosen based on study objectiv, spatial scale, and in particular, data availability. So that sixteen weighting schemes were constructed and run using the model’s implementation in Arc GIS. The weighting schemes were applied for the selected crop (sorghum). For the purpose of sensitivity analysis, suitability maps for every weighting scheme were created in the GIS. The outputs (suitability maps) were compared to investigate the influence of each criterion on the overall suitability for sorghum crop. Visual assessment of the suitability classes and percentage area calculation of suitability classes were conducted to interpret the output of the sensitivity analysis. By comparing the percentage area of the suitability classes for the different weighting scheme, the sensitivity of the suitability criteria can be assessed. In the following section, the full outputs of sensitivity analysis
1104

Al-Mashreki et al., 2011
for sorghum crop will be presented. Table 1 shows the weighting schemes (models) for the sensitivity analysis. For each criterion, four different weighting schemes were given and all the weightings of the other criteria were given equal weightings.
Table 1 Weighting Schemes for the Suitability Criteria
Model Run Soil % Climate % Slope % Erosion % 1 10 30 30 30 2 30 23 23 23
3 50 17 17 17
4 70 10 10 10 5 30 10 30 30 6 23 30 23 23
7 17 50 17 17
8 10 70 10 10
9 30 30 10 30 10 23 23 30 23
11 17 17 40 17
12 10 10 70 10
13 30 30 30 10 24 23 23 23 30
15 17 17 17 50
16 10 10 10 70
Source: compiled by the author
In the present study, the suitability classes consist of five levels; highly suitable (S1), moderately suitable (S2), marginally suitable (S3), currently unsuitable (N1) and permenantly unsuitable (N2). They were all adapted from the FAO system . Selection of evaluation criteria in this study was based on the research objectives, spatial scale, and in particular, data availability.The identified (threshold) values of evaluation criteria for each of the five suitability classes were identified and measured based on the literature survey and the experts’ opinions about the local context. Spatial data were converted into raster layers and projected to UTM Zone38 in ArcGIS 9.2. Slope was made from a 90m DEM and resampled to 30m resolution. The other three datasets were also resampled to 30m cell size. Then, they were classified into five categories as integer rasters representing different suitability levels based on the assigned identified (threshold) values, and loaded into the map frame of the tool.
3.RESULTS AND DISCUSSIONS
3.1 Sensitivity analysis for sorghum crop
Figure 2 and Figure 3 show the sensitivity analysis of the soil based on the numerous weighting values. It
revealed that the soil is a highly sensitive element in the suitability classification for sorghum crop. Moreover, the more increasing the influence of the soil criteria is, the more the output suitability classes are changeing. As can be noted, when the soil weighting is 10%, insignificant proportion of the study area is classified as not suitable (N2) (2.0%) and the highly suitable class (S1) is 16%. However, in the case when the increase in the weight of the soil reaches a percentage of 70%, it is seen that the significant proportion of N2 class emerges as (33%) and the highly suitable class (S1) is decreased to 2%. The implication of such phenomenon is that the increase in the soil weighting has a dramatic effect on the suitability pattern in the study area. In addition, the moderately suitable class decreases from 32% to 21% when the soil weightings change from 10% to 70%. While, the increase in the marginally suitable class moves from 28% up to 30% when the change in the soil weightings increases from 10% to 50% and it decreases to 25% when the soil weighting increases up to 70%.
1105

J. Basic. Appl. Sci. Res., 1(9)1102-1111, 2011
Figure 2 Sensitivity analysis for soil criteria (model run 1, 2, 3, and 4. Table 1).
As a result, the data shows that the overall suitability classification is changed due to the existence of the variation of soil weightings. This change is expected to take place in the study area. As it is shown in the Figure 3, when there is an increase in the soil weightings, there is a high posibility for the emergence of lower suitability ranks in the parts of the study area where the production of sorghum is limited by factors such as the soil neutrent, the soil depth and the soil drainage. The implication drwan from such significant findings is that soil factors demand suitable weighting which possibly reflects its importance for the suitability of sorghum in the study area.
Figure 3 Sensitivity analysis maps for soil (soil weighting schemes, 1= 10%, 2=30%, 3=50% and 4=70%).
The sensitivity analyses for the climate criteria is conducted in the current study as shown in Figure 4 and Figure 5. The results proved that the climate is moderately sensitive. However, the change is not found to be as dramatic as it is found to be in the soil and slope cases. When the importance of the climate is represented by 10%, the
0
5
10
15
20
25
30
35
40
10% 30% 50% 70%
S1
S2
S3
N1
N2
Soil weightings
Perc
enta
ge %
1106
Al-Mashreki et al., 2011
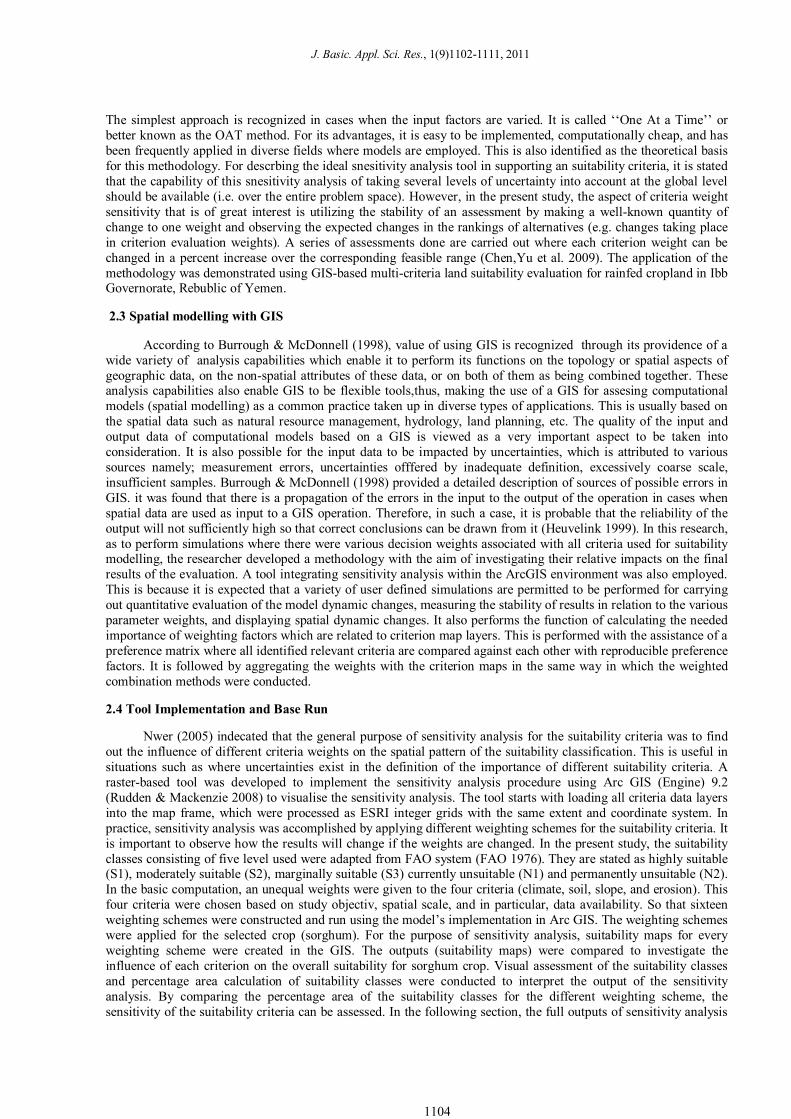
highly suitable class is seen as 8%, whereas as the importance of climate increases up to 70%, the highly suitable class (S1) decreases to 3%. Thus, the percentage 34 % represents the moderately suitable class (S2) and such percentage is possible to exist when the climate weighting is 10%. Whereas it reaches 32%, 28% and 32% when the climate weightings are represented by 30%, 50% and 70% respectivily. The marginally suitable class (S3) is found at 35% when the climate weighting is 10% while it is porn to decrease to 30% when the climate weighting is 30% and it remains decreasingly static when the climate weighting is 50% and 70%. The curently unsuitable class (N1) is 21% when the climate weighting is 10%, whereas it decreases to 2% when the climate weighting 70%. However, the permanently unsuitable class (N2) is 3% when the climate weighting is 10% whereas it is possible to increase upto 29% when the increase in the climate weighting reaches 70%.
Figure 4 Sensitivity analysis for climate criteria (model run 5, 6, 7 and 8. Table 1).
The results presented previously in percentages significantly suggest that climate is a moderately sensitive parameter in the study area and therefore, it is recommended that the weighting for each criterion should be different when the suitability model is used. This implies that climate has to be given a weighting reflecting its importance and effect in the study area.
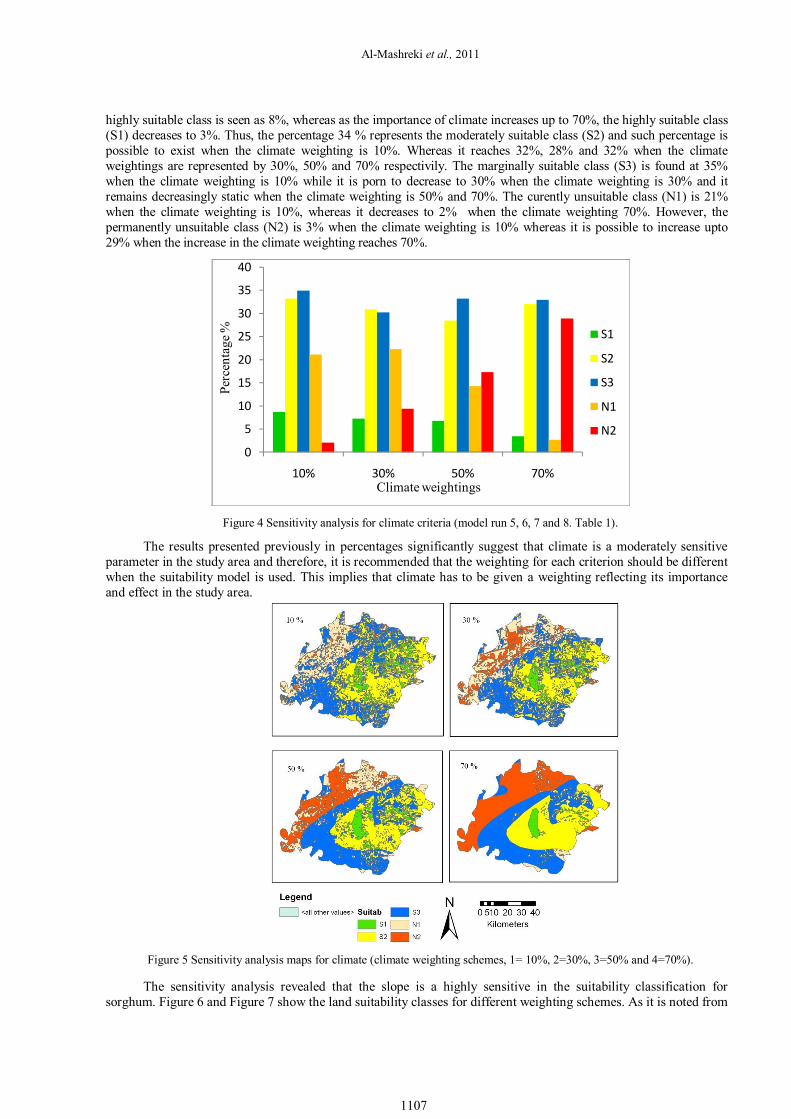
Figure 5 Sensitivity analysis maps for climate (climate weighting schemes, 1= 10%, 2=30%, 3=50% and 4=70%). The sensitivity analysis revealed that the slope is a highly sensitive in the suitability classification for
sorghum. Figure 6 and Figure 7 show the land suitability classes for different weighting schemes. As it is noted from
0
5
10
15
20
25
30
35
40
10% 30% 50% 70%
S1
S2
S3
N1
N2
Climate weightings
Perc
enta
ge %
1107
J. Basic. Appl. Sci. Res., 1(9)1102-1111, 2011
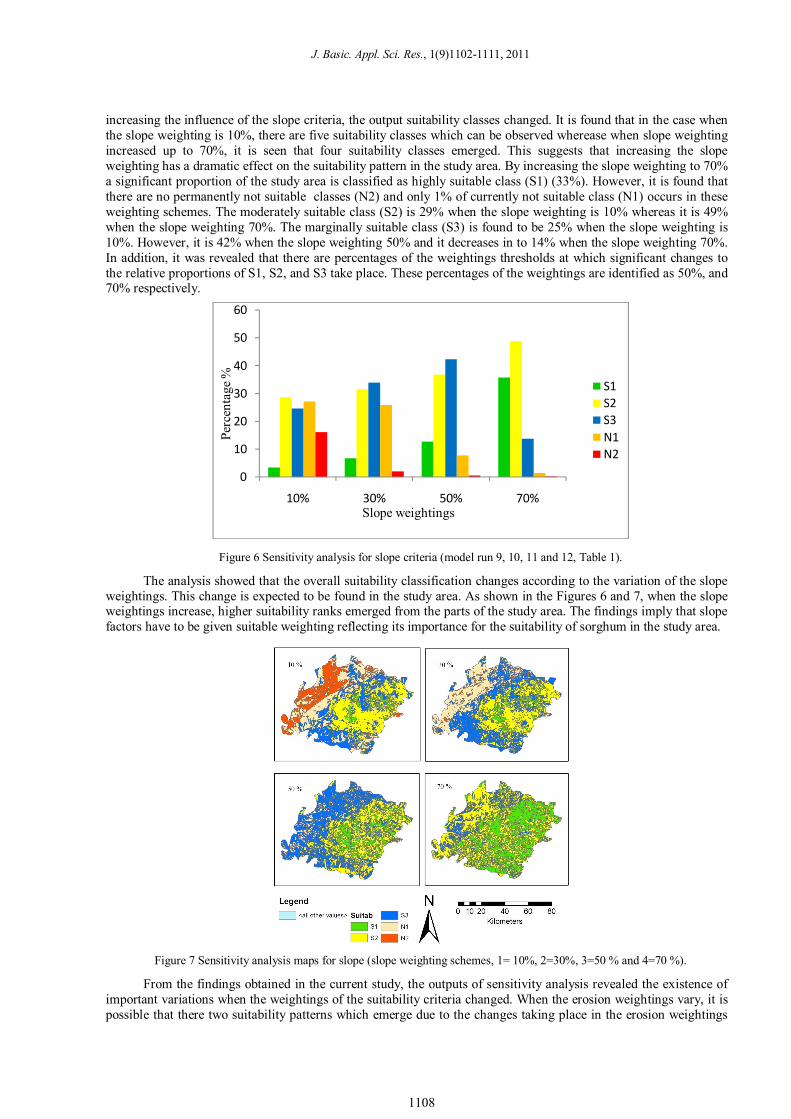
increasing the influence of the slope criteria, the output suitability classes changed. It is found that in the case when the slope weighting is 10%, there are five suitability classes which can be observed wherease when slope weighting increased up to 70%, it is seen that four suitability classes emerged. This suggests that increasing the slope weighting has a dramatic effect on the suitability pattern in the study area. By increasing the slope weighting to 70% a significant proportion of the study area is classified as highly suitable class (S1) (33%). However, it is found that there are no permanently not suitable classes (N2) and only 1% of currently not suitable class (N1) occurs in these weighting schemes. The moderately suitable class (S2) is 29% when the slope weighting is 10% whereas it is 49% when the slope weighting 70%. The marginally suitable class (S3) is found to be 25% when the slope weighting is 10%. However, it is 42% when the slope weighting 50% and it decreases in to 14% when the slope weighting 70%. In addition, it was revealed that there are percentages of the weightings thresholds at which significant changes to the relative proportions of S1, S2, and S3 take place. These percentages of the weightings are identified as 50%, and 70% respectively.
Figure 6 Sensitivity analysis for slope criteria (model run 9, 10, 11 and 12, Table 1).
The analysis showed that the overall suitability classification changes according to the variation of the slope weightings. This change is expected to be found in the study area. As shown in the Figures 6 and 7, when the slope weightings increase, higher suitability ranks emerged from the parts of the study area. The findings imply that slope factors have to be given suitable weighting reflecting its importance for the suitability of sorghum in the study area.
Figure 7 Sensitivity analysis maps for slope (slope weighting schemes, 1= 10%, 2=30%, 3=50 % and 4=70 %).
From the findings obtained in the current study, the outputs of sensitivity analysis revealed the existence of important variations when the weightings of the suitability criteria changed. When the erosion weightings vary, it is possible that there two suitability patterns which emerge due to the changes taking place in the erosion weightings
0
10
20
30
40
50
60
10% 30% 50% 70%
S1S2S3N1N2
Perc
enta
ge %
Slope weightings
1108

Al-Mashreki et al., 2011
(Figures 8 and 9). The first suitability pattern (erosion weighting between 10% and 50%) was dominated by a moderately (S2), marginally suitable (S3) and currently not suitable (N1) classes. The second suitability rank pattern emerged when the erosion weighting increased to 70%. Five dominant suitability classes can be observed in this pattern (S1, S2, S3, N1 and N2). Despite the fact that there is a similarity between these two patterns, the main difference found is the increase of the highly suitable (S1) and permanently not suitable class (N2) in the second pattern. The highly suitable class occured between 6% and 14% in the first pattern, whereas it was found to be 17% in the second suitability pattern. In addition the permanently unsuitable class (N2) was between 4% and 8% in the first pattern, whereas it was 14% in the second suitability pattern weighting scheme. In general, the results provide the evidence that there is significant increase in the proportion of both S1 and N2 classes and a decrease of suitability classes S2 and S3, while N1 remains at the same level when the erosion weighting increases through the different patterns.
Figure 8 Sensitivity analysis for erosion criteria (model run 13, 14, 15 and 16. Table 1).
These results suggest that the erosion is not as sensitive as the soil and slope and therefore, the criterion weighting for each criterion should be different when the suitability model is used.
Figure 9 Sensitivity analysis maps for erosion (erosion weighting schemes, 1= 10%, 2=30%, 3=50% and 4=70%).
0
5
10
15
20
25
30
35
10% 30% 50% 70%
S1S2S3N1N2
Erosion weightings
Perc
enta
ge %
1109

J. Basic. Appl. Sci. Res., 1(9)1102-1111, 2011
CONCLUSIONS
This paper has presented a GIS-based suitability criteria-sensitivity analysis approach for generating and visualizing criteria weight sensitivity. The fusion of sensitivity analysis within ArcGIS environment enhances the conventional module, improves the reliability of suitability criteria output, and extends existing GIS functionalities. The application of the methodology was demonstrated using data from an rainfed cropland suitability evaluation study for sorghum crop in Ibb Governorate, Republic of Yemen. The results showed that sensitivity analysis tool can provide better insights for improving the capabilities of current GIS-based suitability criteria model to create more realistic output scenarios. Continued advances in this research area will permit GIS and suitability criteria-sensitivity analysis to be applied to practical land-management issues with greater success. In conclusion, it is evident that the slope is a highly sensitive in the study area. Therefore, it should be weighted accordingly. This is true for the study where the climate, soil, and erosion all appear to be highly suitable for sorghum. However, if the model is to be used elsewhere in the future, further analyses are needed to investigate the appropriate weighting for the suitability criteria. Replication of the approach outlined in this study should be carried out in other areas of Yemen taking into account more factors and calculating weight of each factor and weight of classes of each factor map to create the potential land and land suitability evaluation maps. The results indicated that the sensitivity analysis tool can provide better insights for improving the capabilities of current GIS-based multi-criteria models to create more realistic output scenarios.
ACKNOWLEDGMENTS
I would like to thank the Government of Yemen for all supports given to me. I would like to express my intense feeling of gratitude and my sincere appreciation to UKM particularly the School of Environmental and Natural Resources Science and Geology Program for supporting this research.
REFERENCES
Archer, G. E. B., Saltelli, A. & Sobol, I. M. 1997. Sensitivity measures, ANOVA-like techniques and the use of bootstrap. Journal of Statistical Computation and Simulation 58 (2): 99-120.
Burrough, P. A. & McDonnell, R. 1998. Principles of GIS: Oxford University Press New York, NY, USA.
Chen, Y., Khan, S. & Paydar, Z. 2007. Irrigation intensification or extensification assessment using spatial modelling in GIS, at Modelling and Simulation Society of Australia and New Zealand. In MODSIM 2007 International Congress on Modelling and Simulation: 1321-1327
Chen, Y., Khan, S. & Paydar, Z. 2009. To retire or expand? A fuzzy GIS-based spatial multi-criteria evaluation framework for irrigated agriculture. Irrigation and Drainage 59 (2): 174-188.
Chen, Y., Yu, J. & Khan, S. 2010. Spatial sensitivity analysis of multi-criteria weights in GIS-based land suitability evaluation. Environmental Modelling & Software 25 (12): 1582-1591.
Chen, Y., Yu, J., Shahbaz, K. & Xevi, E. 2009. A GIS-based sensitivity analysis of multi-criteria weights, at Cairns, Australia 18th World IMACS / MODSIM Congress
Crosetto, M., Tarantola, S. & Saltelli, A. 2000. Sensitivity and uncertainty analysis in spatial modelling based on GIS. Agriculture, Ecosystems & Environment 81 (1): 71-79.
Delgado, M. G. & Sendra, J. B. 2004. Sensitivity analysis in multicriteria spatial decision-making: a review. Human and Ecological Risk Assessment: An International Journal 10 (6): 1173-1187.
FAO. 1976. A framework for land evaluation, FAO Soils bulletin 32. Rome, Italy: Food and Agriculture Organization of the United Nations.
Feick, R. & Hall, B. 2004. A method for examining the spatial dimension of multi-criteria weight sensitivity. International Journal of Geographical Information Science 18 (8): 815-840.
Fraedrich, D. & Goldberg, A. 2000. A methodological framework for the validation of predictive simulations. European Journal of Operational Research 124 (1): 55-62.
Frey, H. C., Mokhtari, A. & Zheng, J. 2004. Recommended practice regarding selection, application, and interpretation of sensitivity analysis methods applied to food safety risk process models. US Department of Agriculture. http://www. ce. ncsu. edu/risk/Phase3Final. pdf.
Helton, J. C. 1993. Uncertainty and sensitivity analysis techniques for use in performance assessment for radioactive waste disposal. Reliability Engineering & System Safety 42 (2-3): 327-367.
1110
Al-Mashreki et al., 2011
Heuvelink, G. 1999. Aggregation and error propagation in GIS. Spatial Accuracy Assessment: Land Information Uncertainty in Natural Resources: 219-225.
Joerin, F., Thériault, M. & Musy, A. 2001. Using GIS and outranking multicriteria analysis for land-use suitability assessment. International Journal of Geographical Information Science 15 (2): 153-174.
Karnatak, H., Saran, S., Bhatia, K. & Roy, P. 2007. Multicriteria Spatial Decision Analysis in Web GIS Environment. GeoInformatica 11 (4): 407-429.
Kleijnen, J. P. C. & Sargent, R. G. 2000. A methodology for fitting and validating metamodels in simulation. European Journal of Operational Research 120 (1): 14-29.
Merritt, W. S., Croke, B. F. W. & Jakeman, A. J. 2005. Sensitivity testing of a model for exploring water resources utilisation and management options. Environmental Modelling & Software 20 (8): 1013-1030.
Merz, J. F., Small, M. J. & Fischbeck, P. S. 1992. Measuring Decision Sensitivity: A combined Monte Carlo-logistic regression approach. Medical Decision Making 12 (3): 189-196.
Newham, L. T. H., Norton, J. P., Prosser, I. P., Croke, B. F. W. & Jakeman, A. J. 2003. Sensitivity analysis for assessing the behaviour of a landscape-based sediment source and transport model. Environmental Modelling & Software 18 (8-9): 741-751.
Nwer, B. A. B. 2005. The application of land evaluation technique in the north-east of Libya, National Soil Resources Institute, Faculty of Environment, Cranfield
Rudden, M. & Mackenzie, I. 2008. Introduction to ArcGIS Desktop and ArcGIS Engine Development, edited by Esri.
Saltelli, A., Chan, K. & Scott, E. M. 2000. Sensitivity Analysis, Wiley Series in Probability and Statistics. Willey, New York.
Ticehurst, J. L., Cresswell, H. P. & Jakeman, A. J. 2003. Using a physically based model to conduct a sensitivity analysis of subsurface lateral flow in south-east Australia. Environmental Modelling & Software 18 (8-9): 729-740.
Zoras, S., Triantafyllou, A. G. & Hurley, P. J. 2007. Grid sensitivity analysis for the calibration of a prognostic meteorological model in complex terrain by a screening experiment. Environmental Modelling & Software 22 (1): 33-39.
1111