global carbon budget 2017 · global carbon budget published on 13 november 2017 2017 powerpoint...
TRANSCRIPT
Global Carbon Budget
Published on 13 November 2017
2017
PowerPoint version 1.1 (released 15 January 2018)
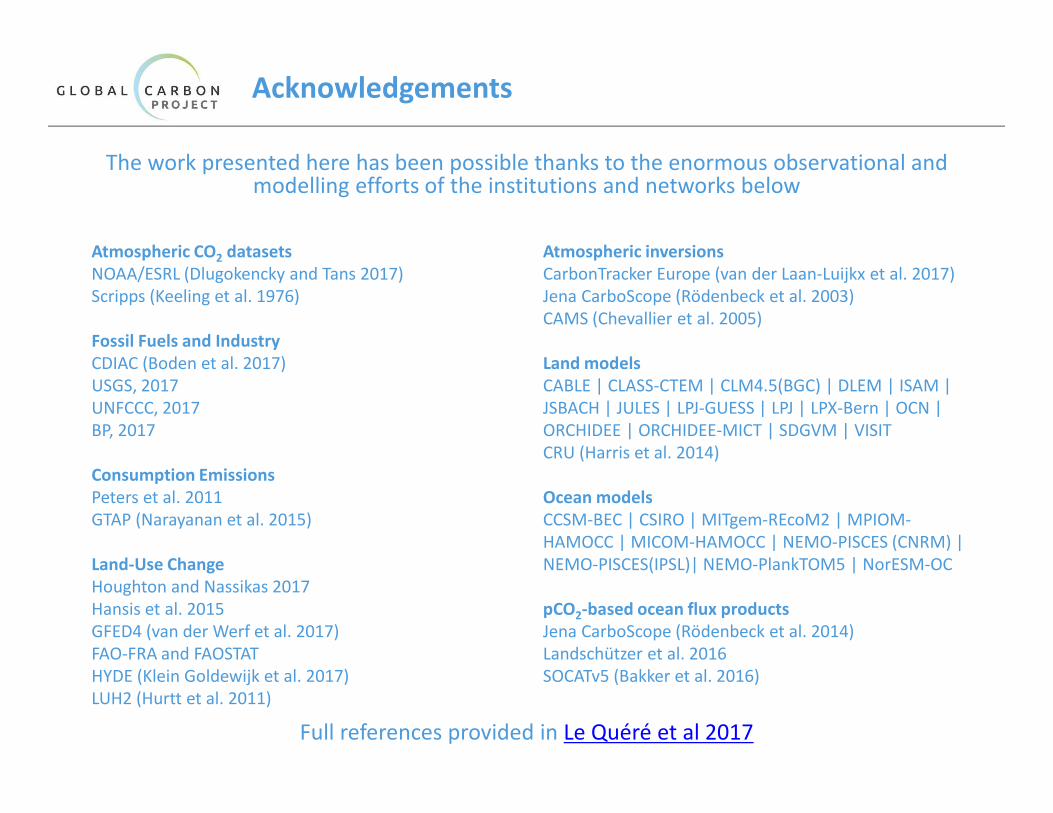
Acknowledgements
The work presented here has been possible thanks to the enormous observational and modelling efforts of the institutions and networks below
Atmospheric CO2 datasets
NOAA/ESRL (Dlugokencky and Tans 2017)
Scripps (Keeling et al. 1976)
Fossil Fuels and Industry
CDIAC (Boden et al. 2017)
USGS, 2017
UNFCCC, 2017
BP, 2017
Consumption Emissions
Peters et al. 2011
GTAP (Narayanan et al. 2015)
Land-Use Change
Houghton and Nassikas 2017
Hansis et al. 2015
GFED4 (van der Werf et al. 2017)
FAO-FRA and FAOSTAT
HYDE (Klein Goldewijk et al. 2017)
LUH2 (Hurtt et al. 2011)
Atmospheric inversions
CarbonTracker Europe (van der Laan-Luijkx et al. 2017)
Jena CarboScope (Rödenbeck et al. 2003)
CAMS (Chevallier et al. 2005)
Land models
CABLE | CLASS-CTEM | CLM4.5(BGC) | DLEM | ISAM |
JSBACH | JULES | LPJ-GUESS | LPJ | LPX-Bern | OCN |
ORCHIDEE | ORCHIDEE-MICT | SDGVM | VISIT
CRU (Harris et al. 2014)
Ocean models
CCSM-BEC | CSIRO | MITgem-REcoM2 | MPIOM-
HAMOCC | MICOM-HAMOCC | NEMO-PISCES (CNRM) |
NEMO-PISCES(IPSL)| NEMO-PlankTOM5 | NorESM-OC
pCO2-based ocean flux products
Jena CarboScope (Rödenbeck et al. 2014)
Landschützer et al. 2016
SOCATv5 (Bakker et al. 2016)
Full references provided in Le Quéré et al 2017
C Le Quéré UK | RM Andrew Norway | GP Peters Norway | JG Canadell Australia | P Friedlingstein UK |
R Jackson USA | S Sitch UK | JI Korsbakken Norway | J Pongratz Germany | AC Manning UK
Thomas A. Boden USA | Pieter P. Tans USA | Oliver D. Andrews UK | Vivek K. Arora Canada | Dorothee C. E. Bakker UK |
Leticia Barbero USA | Meike Becker Norway | Richard A. Betts UK | Laurent Bopp France | Frédéric Chevallier France |
Louise P. Chini USA | Philippe Ciais France | Catherine E. Cosca USA | Jessica Cross USA | Kim Currie New Zealand |
Thomas Gasser Austria | Ian Harris UK | Judith Hauck Germany | Vanessa Haverd Australia | Richard A. Houghton USA |
Christopher W. Hunt USA | George Hurtt USA | Tatiana Ilyina Germany | Atul K. Jain USA | Etsushi Kato Japan | Markus
Kautz Germany | Ralph F. Keeling USA | Kees Klein Goldewijk The Netherlands | Arne Körtzinger Germany | Peter
Landschützer Germany | Nathalie Lefèvre France | Andrew Lenton Australia | Sebastian Lienert Switzerland | Ivan Lima
USA | Danica Lombardozzi USA | Galen McKinley USA | Nicolas Metzl France | Frank Millero USA | Pedro M. S.
Monteiro South Africa | David R. Munro USA | Julia E. M. S. Nabel Germany | Shin-ichiro Nakaoka Japan | Yukihiro
Nojiri Japan | X. Antonio Padín Spain | Anna Peregon France | Benjamin Pfeil Norway | Denis Pierrot USA | Benjamin
Poulter USA | Gregor Rehder Germany | Janet Reimer USA | Christian Rödenbeck Germany | Joyashree Roy India | Jörg
Schwinger Norway | Roland Séférian France | Ingunn Skjelvan Norway | Benjamin D. Stocker Spain | Hanqin Tian USA |
Bronte Tilbrook Australia | Ingrid T. van der Laan-Luijkx The Netherlands | Guido R. van der Werf The Netherlands |
Libo Wu China | Steven van Heuven The Netherlands | Nicolas Viovy France | Nicolas Vuichard France | Anthony P.
Walker USA | Andrew J. Watson UK | Andrew J. Wiltshire UK | Sönke Zaehle Germany | Dan Zhu France
Atlas Team Members at LSCE, France
P Ciais | A Peregon | P Peylin | P Brockmann | V Maigné | P Evano | C Nangini
Communications Team
O Gaffney | A Minns | A Scrutton
Contributors 77 people | 57 organisations | 15 countries
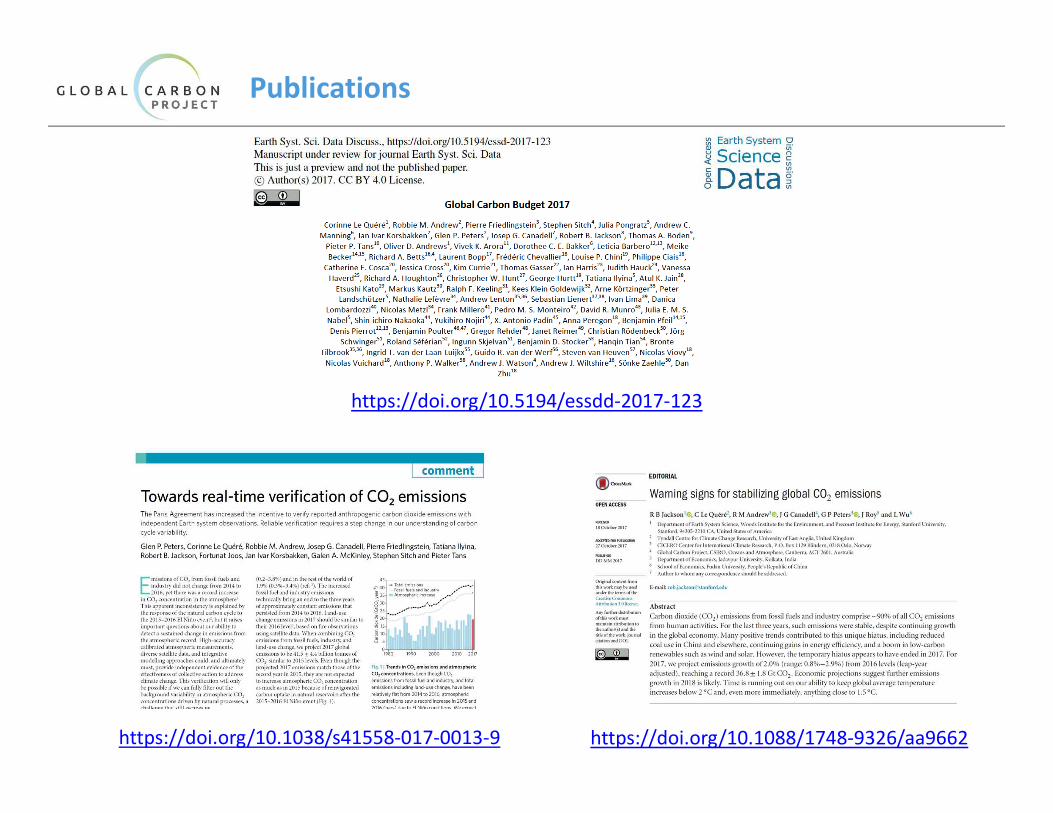
https://doi.org/10.5194/essdd-2017-123
Publications
https://doi.org/10.1088/1748-9326/aa9662https://doi.org/10.1038/s41558-017-0013-9
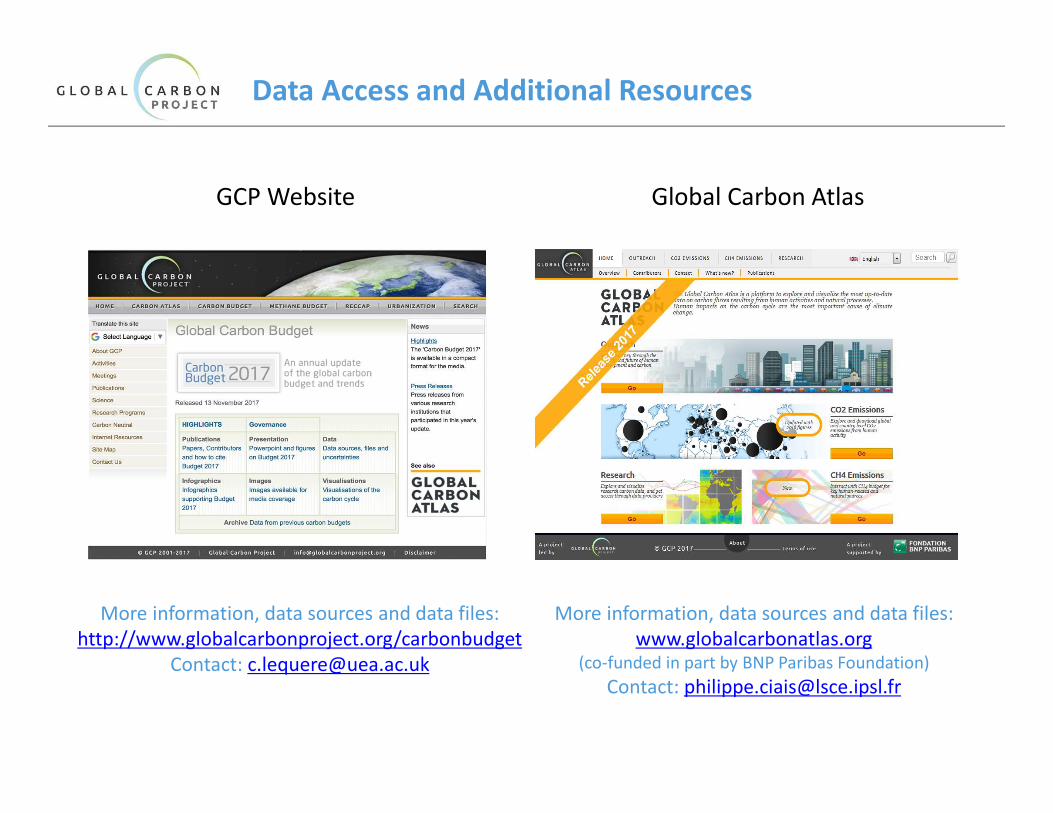
More information, data sources and data files:
http://www.globalcarbonproject.org/carbonbudget
Contact: [email protected]
More information, data sources and data files:
www.globalcarbonatlas.org(co-funded in part by BNP Paribas Foundation)
Contact: [email protected]
Data Access and Additional Resources
GCP Website Global Carbon Atlas
All the data is shown in billion tonnes CO2 (GtCO2)
1 Gigatonne (Gt) = 1 billion tonnes = 1×10¹⁵g = 1 Petagram (Pg)
1 kg carbon (C) = 3.664 kg carbon dioxide (CO2)
1 GtC = 3.664 billion tonnes CO2 = 3.664 GtCO2
(Figures in units of GtC and GtCO2 are available from http://globalcarbonbudget.org/carbonbudget)
Most figures in this presentation are available for download as PDF or PNG
from tinyurl.com/GCB17figs along with the data required to produce them.
DisclaimerThe Global Carbon Budget and the information presented here are intended for those interested in
learning about the carbon cycle, and how human activities are changing it. The information contained
herein is provided as a public service, with the understanding that the Global Carbon Project team make
no warranties, either expressed or implied, concerning the accuracy, completeness, reliability, or suitability
of the information.
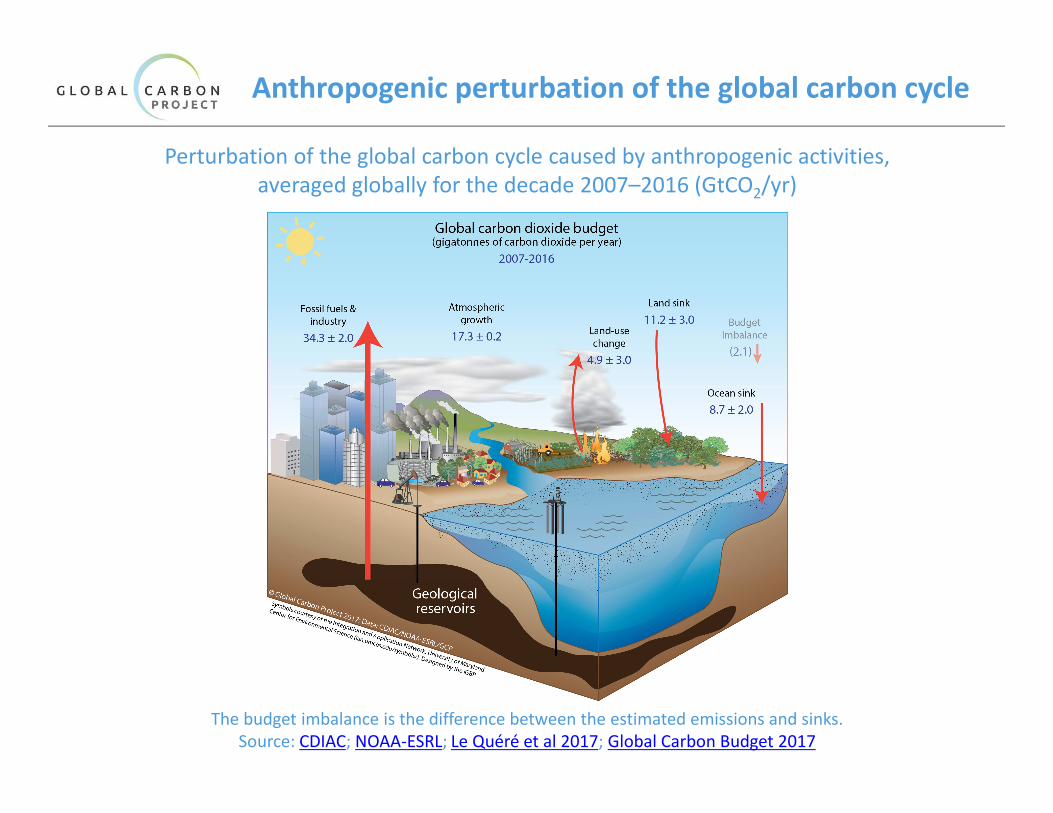
Anthropogenic perturbation of the global carbon cycle
Perturbation of the global carbon cycle caused by anthropogenic activities,
averaged globally for the decade 2007–2016 (GtCO2/yr)
The budget imbalance is the difference between the estimated emissions and sinks.
Source: CDIAC; NOAA-ESRL; Le Quéré et al 2017; Global Carbon Budget 2017
Fossil Fuel and Industry Emissions
1990 1995 2000 2005 2010 2015
22
24
26
28
30
32
34
36
38
40
CO
¿ em
issi
ons
(Gt C
O¿/
yr)
Global Carbon Project
Projection 2017 36.8 Gt CO¿
2.0% (0.8%–3.0%)
2016: 36.2 Gt CO¿
1990–99+1.1%/yr
2000–09+3.3%/yr
Data: CDIAC/GCP/BP/USGS
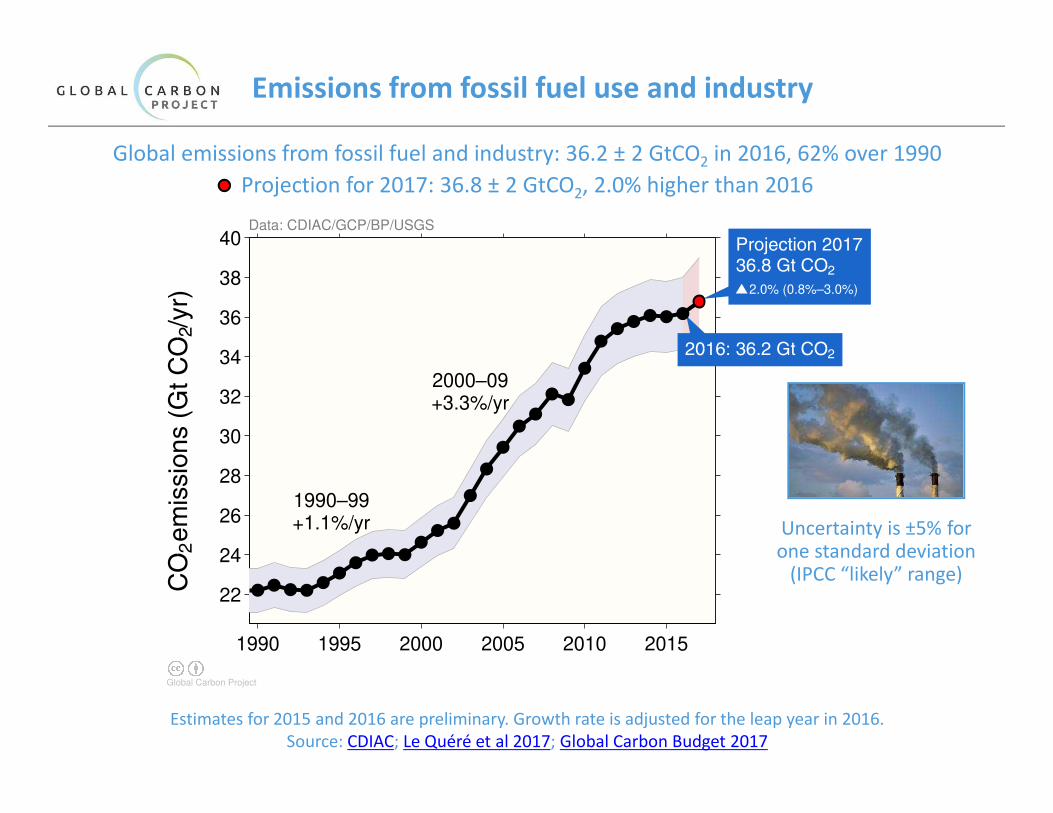
Global emissions from fossil fuel and industry: 36.2 ± 2 GtCO2 in 2016, 62% over 1990
Projection for 2017: 36.8 ± 2 GtCO2, 2.0% higher than 2016
Estimates for 2015 and 2016 are preliminary. Growth rate is adjusted for the leap year in 2016.
Source: CDIAC; Le Quéré et al 2017; Global Carbon Budget 2017
Emissions from fossil fuel use and industry
Uncertainty is ±5% for one standard deviation
(IPCC “likely” range)
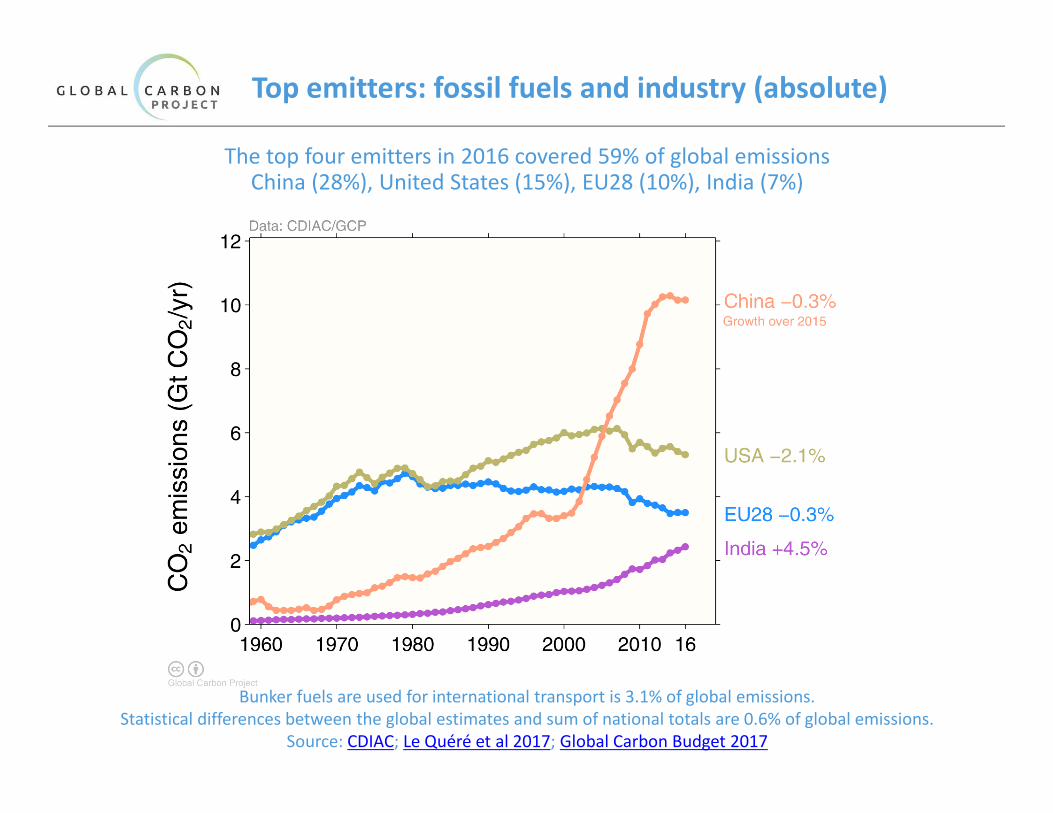
Top emitters: fossil fuels and industry (absolute)
The top four emitters in 2016 covered 59% of global emissionsChina (28%), United States (15%), EU28 (10%), India (7%)
Bunker fuels are used for international transport is 3.1% of global emissions.
Statistical differences between the global estimates and sum of national totals are 0.6% of global emissions.
Source: CDIAC; Le Quéré et al 2017; Global Carbon Budget 2017
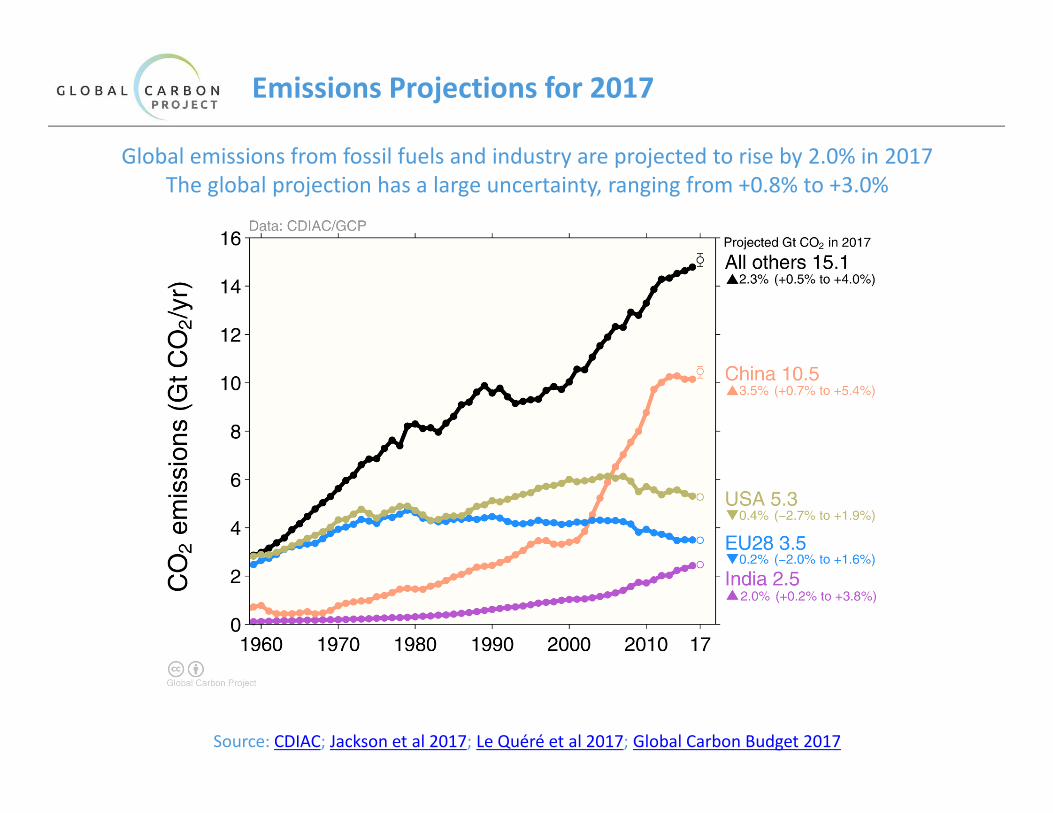
Emissions Projections for 2017
Global emissions from fossil fuels and industry are projected to rise by 2.0% in 2017
The global projection has a large uncertainty, ranging from +0.8% to +3.0%
Source: CDIAC; Jackson et al 2017; Le Quéré et al 2017; Global Carbon Budget 2017

Top emitters: fossil fuels and industry (per capita)
Countries have a broad range of per capita emissions reflecting their national circumstances
Source: CDIAC; Le Quéré et al 2017; Global Carbon Budget 2017
CO
¿ em
issi
ons
(tC
O¿/
pers
on/y
r)
Global Carbon Project
World 4.2
China 7.2
USA 16.5
EU28 6.9
India 1.8
t/p in 2016
Data: CDIAC/GCP
1960 1970 1980 1990 2000 2010 160
5
10
15
20
25
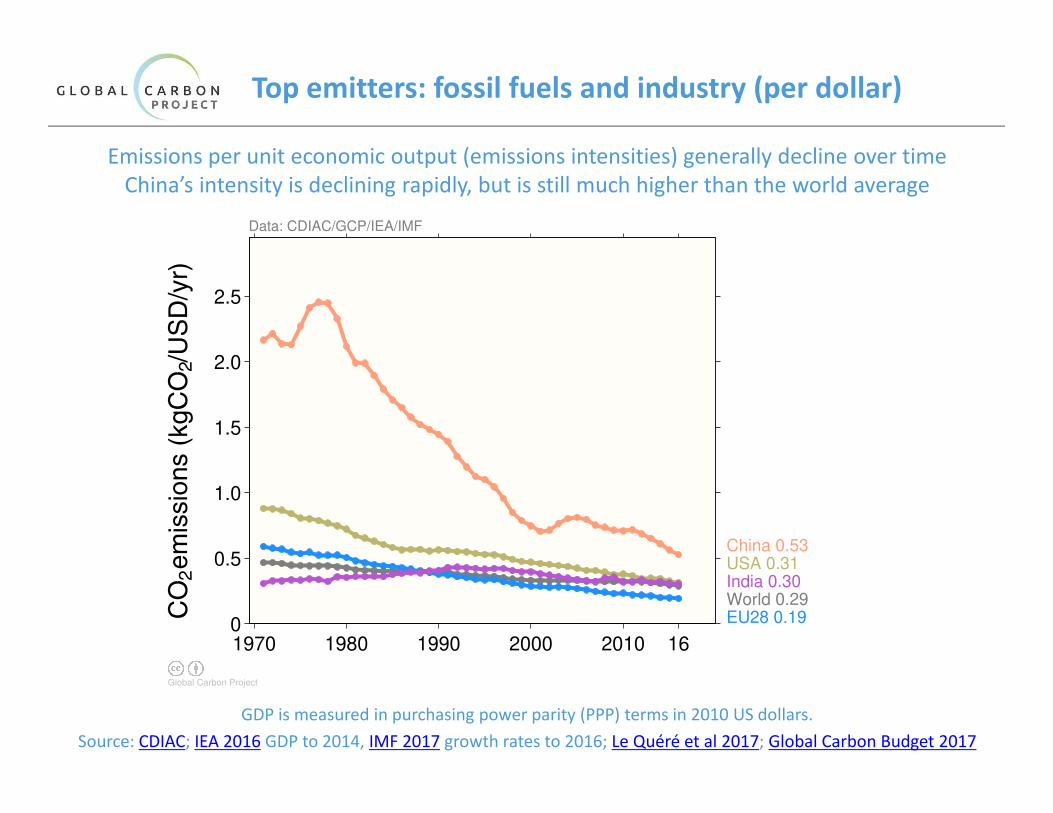
Top emitters: fossil fuels and industry (per dollar)
Emissions per unit economic output (emissions intensities) generally decline over time
China’s intensity is declining rapidly, but is still much higher than the world average
GDP is measured in purchasing power parity (PPP) terms in 2010 US dollars.
Source: CDIAC; IEA 2016 GDP to 2014, IMF 2017 growth rates to 2016; Le Quéré et al 2017; Global Carbon Budget 2017
1970 1980 1990 2000 2010 160
0.5
1.0
1.5
2.0
2.5
CO
¿ em
issi
ons
(kgC
O¿/
US
D/y
r)
Global Carbon Project
World 0.29
China 0.53USA 0.31
EU28 0.19
India 0.30
Data: CDIAC/GCP/IEA/IMF
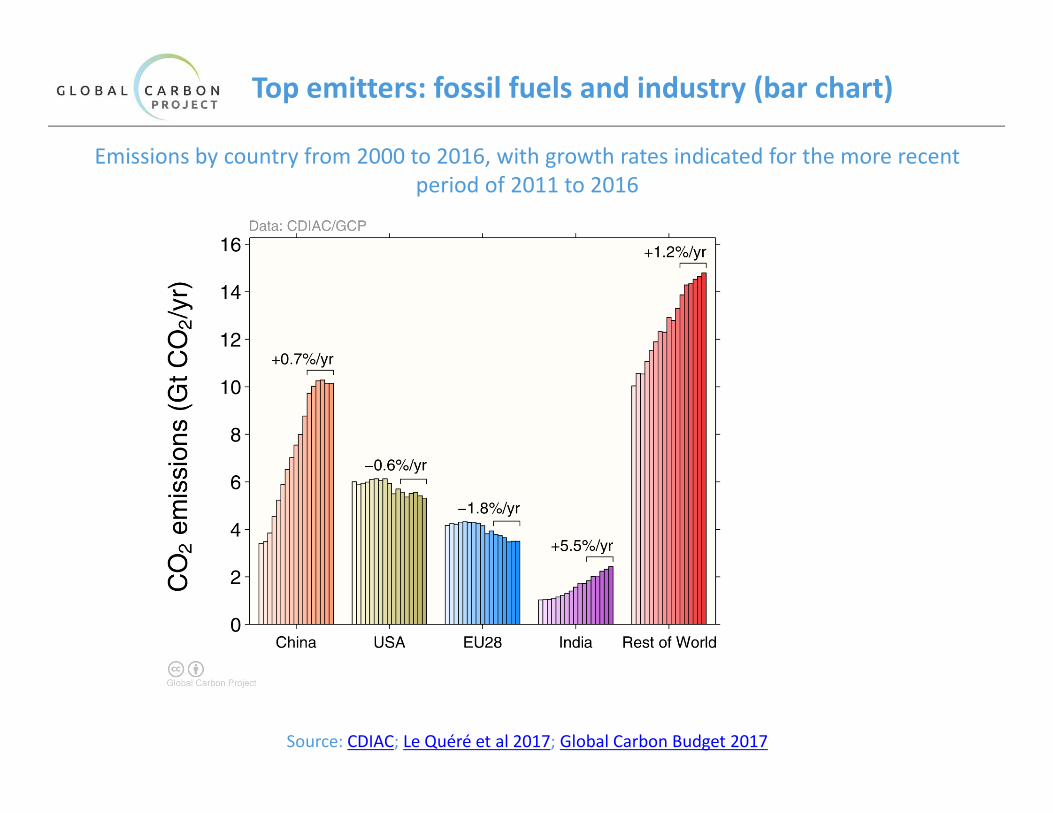
Top emitters: fossil fuels and industry (bar chart)
Emissions by country from 2000 to 2016, with growth rates indicated for the more recent
period of 2011 to 2016
Source: CDIAC; Le Quéré et al 2017; Global Carbon Budget 2017
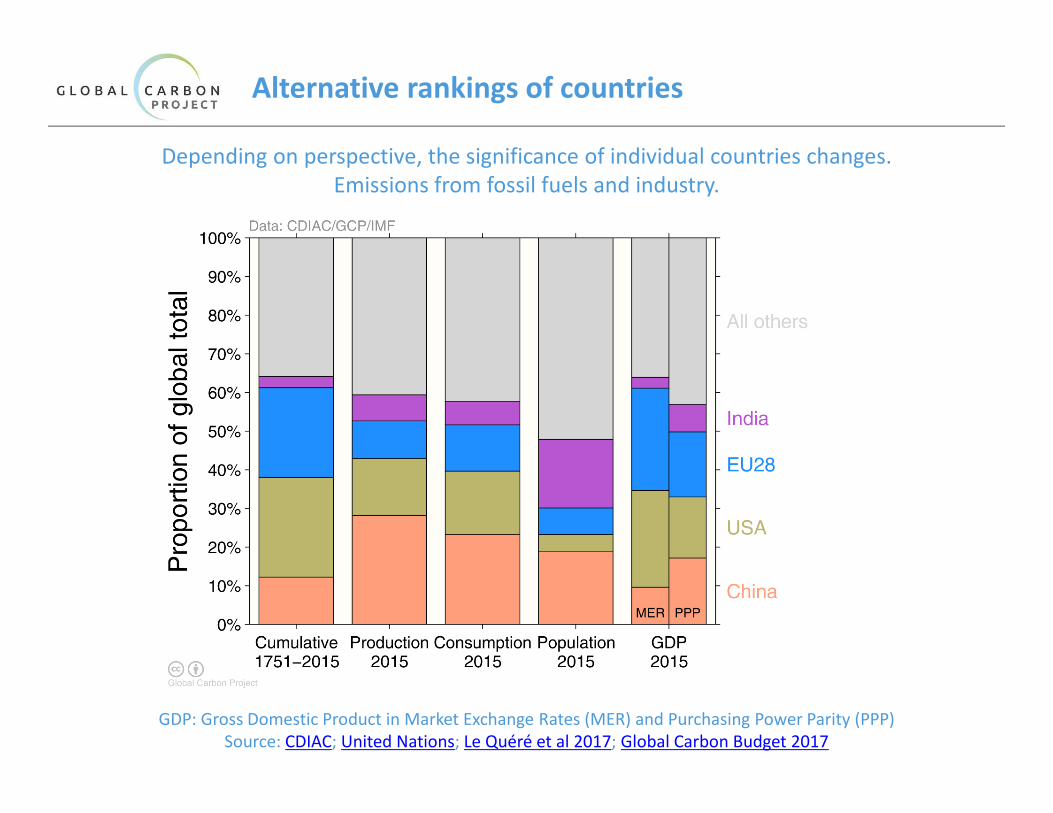
Alternative rankings of countries
Depending on perspective, the significance of individual countries changes.
Emissions from fossil fuels and industry.
GDP: Gross Domestic Product in Market Exchange Rates (MER) and Purchasing Power Parity (PPP)
Source: CDIAC; United Nations; Le Quéré et al 2017; Global Carbon Budget 2017
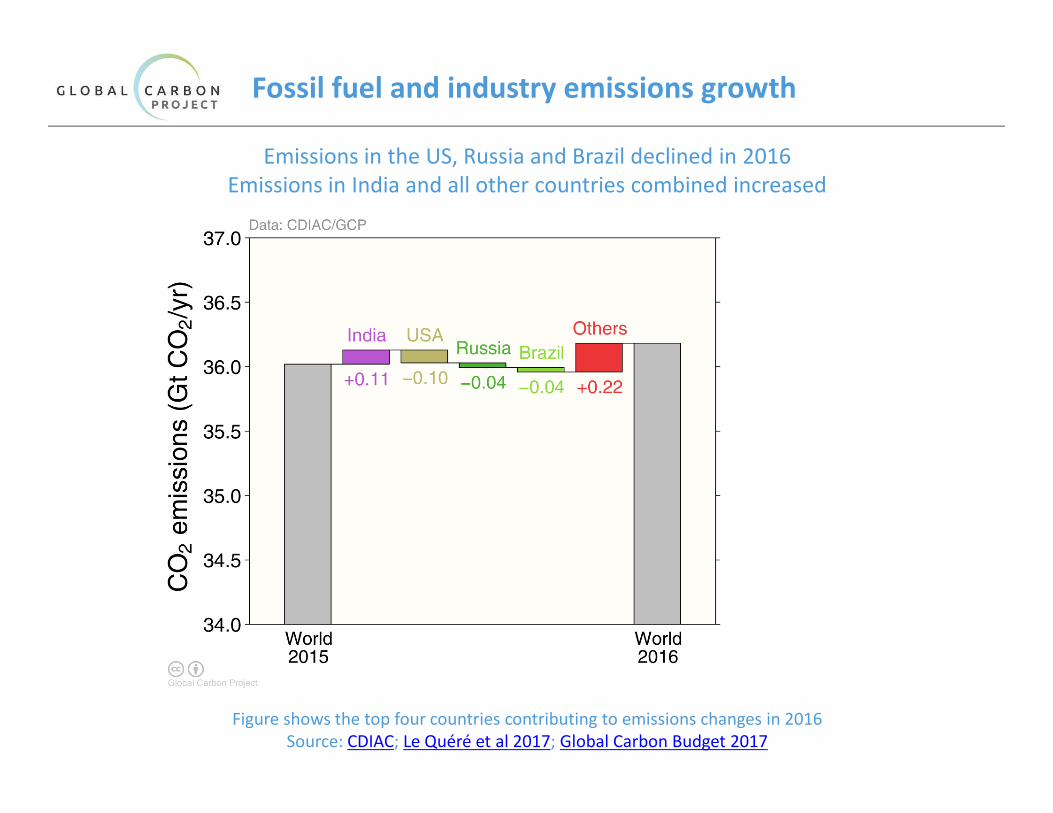
Fossil fuel and industry emissions growth
Emissions in the US, Russia and Brazil declined in 2016
Emissions in India and all other countries combined increased
Figure shows the top four countries contributing to emissions changes in 2016
Source: CDIAC; Le Quéré et al 2017; Global Carbon Budget 2017
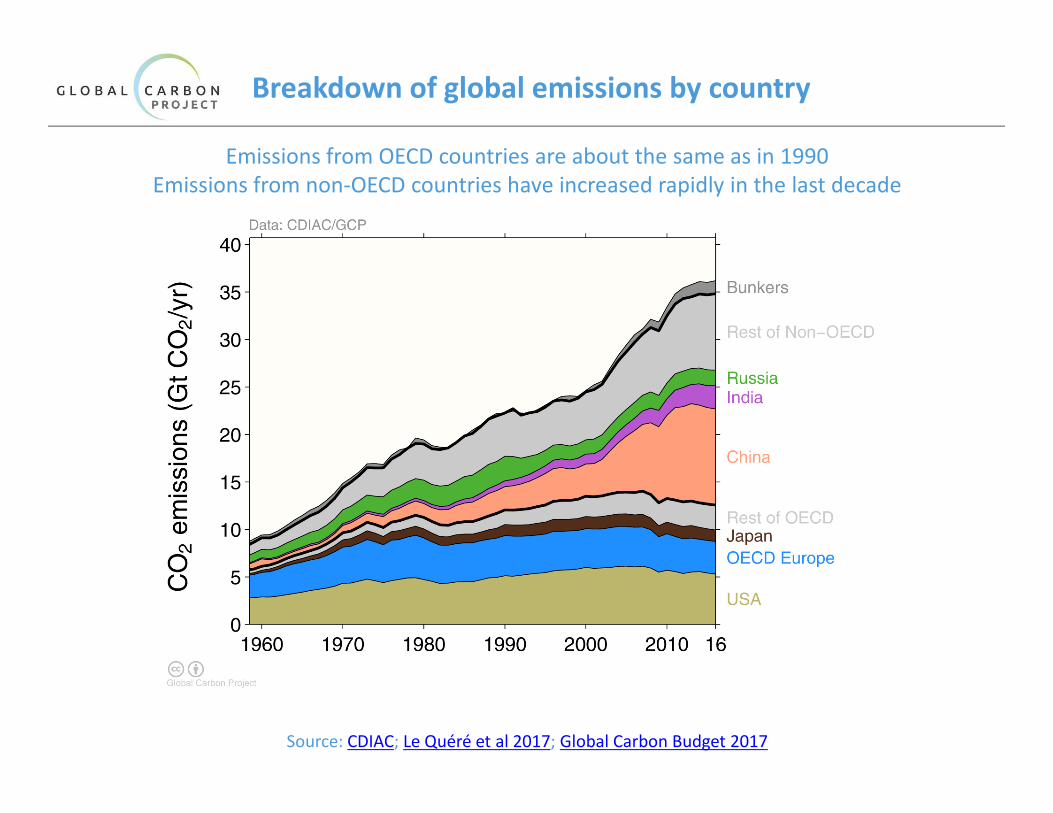
Breakdown of global emissions by country
Emissions from OECD countries are about the same as in 1990
Emissions from non-OECD countries have increased rapidly in the last decade
Source: CDIAC; Le Quéré et al 2017; Global Carbon Budget 2017
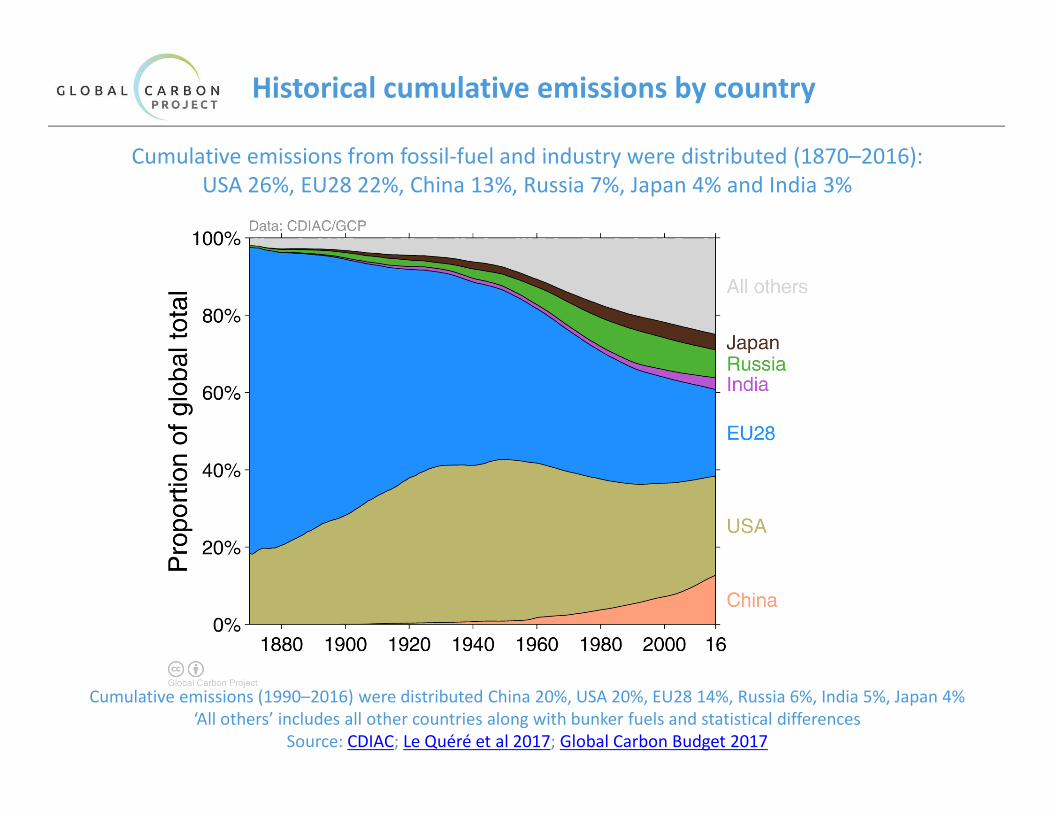
Historical cumulative emissions by country
Cumulative emissions from fossil-fuel and industry were distributed (1870–2016):
USA 26%, EU28 22%, China 13%, Russia 7%, Japan 4% and India 3%
Cumulative emissions (1990–2016) were distributed China 20%, USA 20%, EU28 14%, Russia 6%, India 5%, Japan 4%
‘All others’ includes all other countries along with bunker fuels and statistical differences
Source: CDIAC; Le Quéré et al 2017; Global Carbon Budget 2017
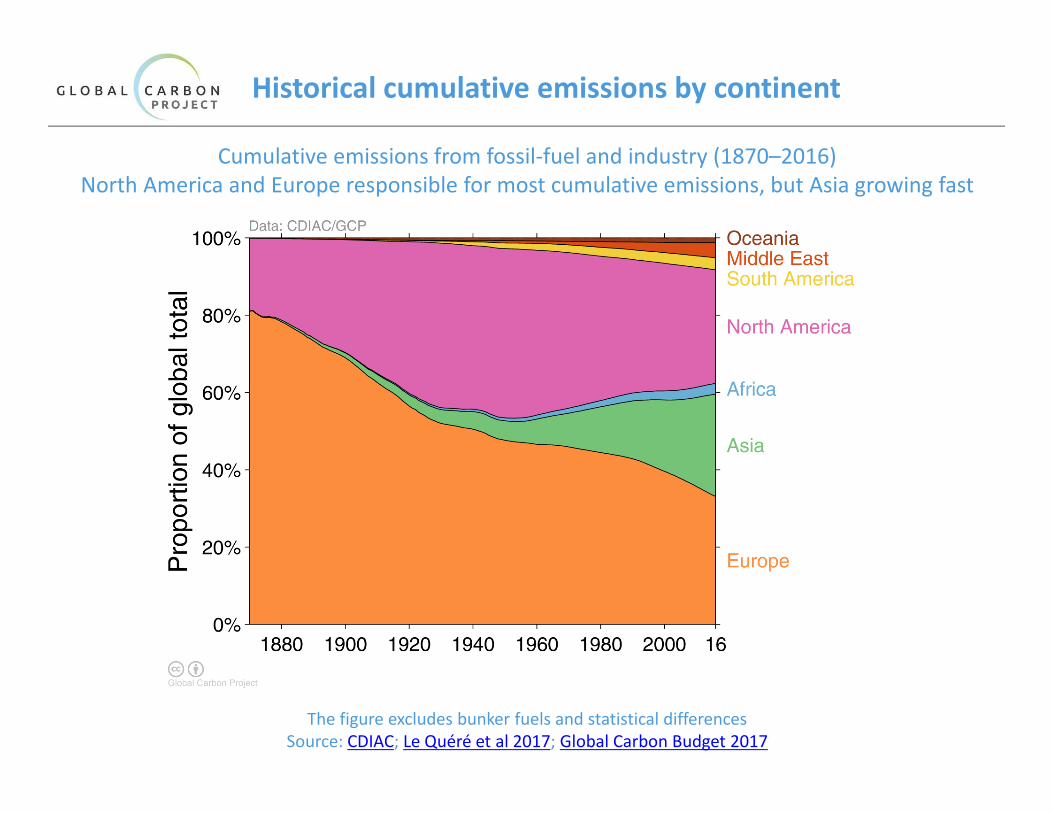
Historical cumulative emissions by continent
Cumulative emissions from fossil-fuel and industry (1870–2016)
North America and Europe responsible for most cumulative emissions, but Asia growing fast
The figure excludes bunker fuels and statistical differences
Source: CDIAC; Le Quéré et al 2017; Global Carbon Budget 2017
1960 1970 1980 1990 2000 2010 160
2
4
6
8
10
12
14
16
CO
¿ em
issi
ons
(Gt C
O¿/
yr)
Global Carbon Project
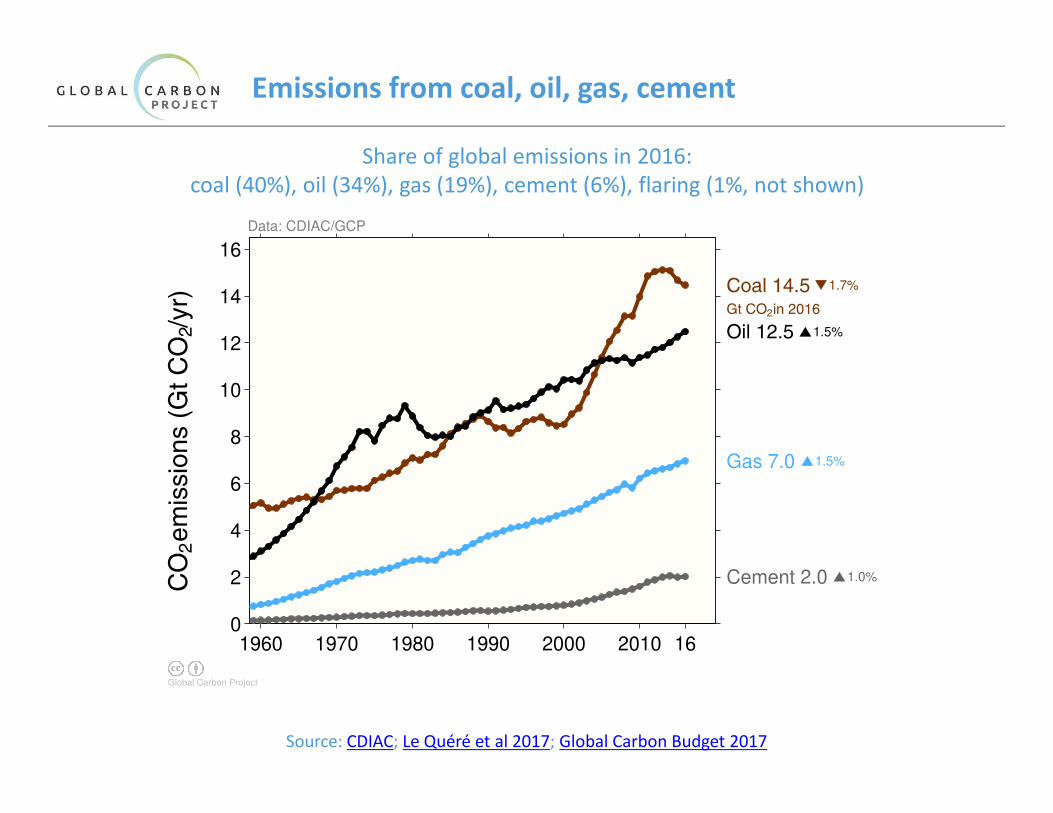
Coal 14.5 Gt CO¿ in 2016
Oil 12.5
Gas 7.0
Cement 2.0
1.7%
1.5%
1.5%
1.0%
Data: CDIAC/GCP
Emissions from coal, oil, gas, cement
Share of global emissions in 2016:
coal (40%), oil (34%), gas (19%), cement (6%), flaring (1%, not shown)
Source: CDIAC; Le Quéré et al 2017; Global Carbon Budget 2017

Emissions by category
Emissions by category from 2000 to 2016, with growth rates indicated for the more recent
period of 2011 to 2016
Source: CDIAC; Jackson et al 2017; Global Carbon Budget 2017
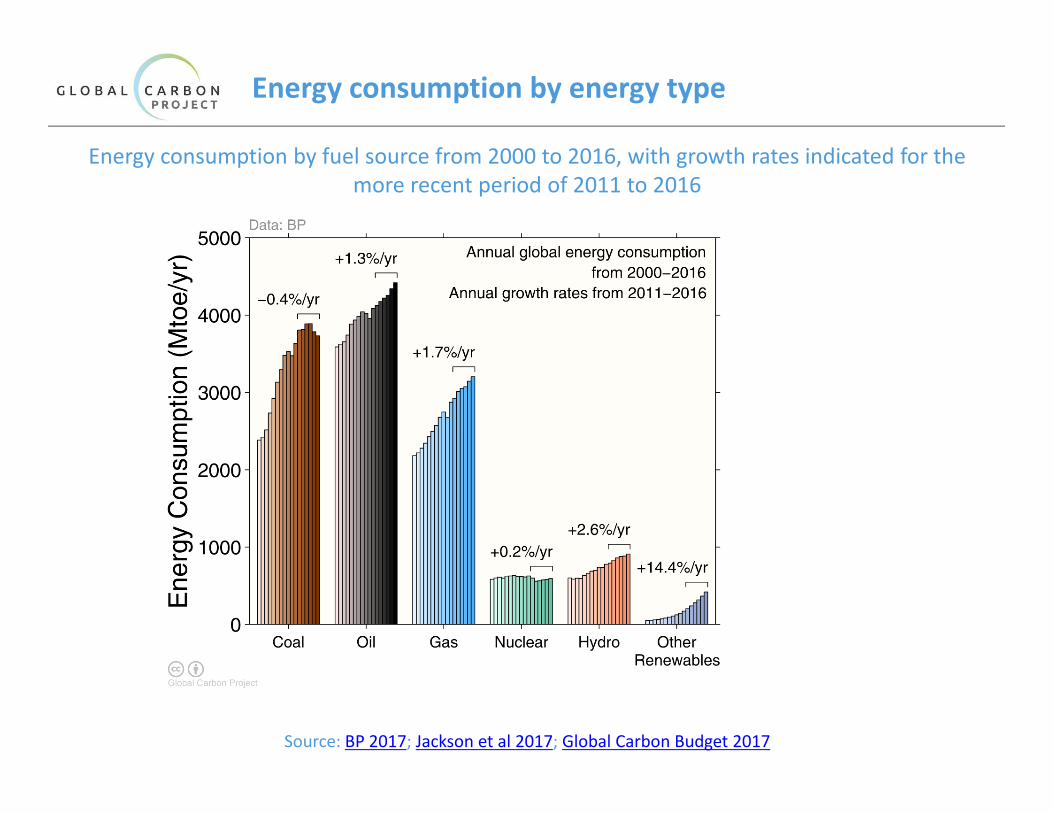
Energy consumption by energy type
Energy consumption by fuel source from 2000 to 2016, with growth rates indicated for the
more recent period of 2011 to 2016
Source: BP 2017; Jackson et al 2017; Global Carbon Budget 2017
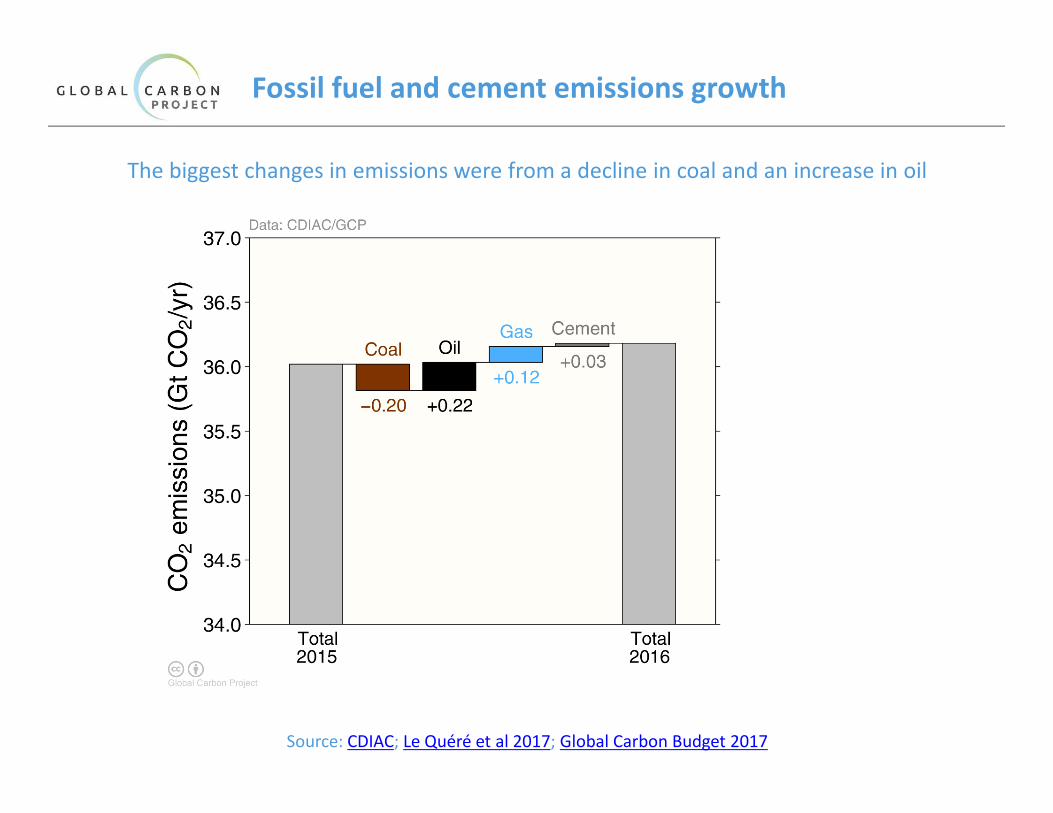
Fossil fuel and cement emissions growth
The biggest changes in emissions were from a decline in coal and an increase in oil
Source: CDIAC; Le Quéré et al 2017; Global Carbon Budget 2017

CO
¿ em
issi
ons
(Gt C
O¿/
yr)
Global Carbon Project
Oil crisis
US savings andloan crisis
Dissolution ofSoviet Union
Asianfinancial
crisis
Globalfinancial
crisis
2017 is projected
Data: CDIAC/GCP/IEA/IMF/Peters et al. 2012
1960 1970 1980 1990 2000 2010 170
5
10
15
20
25
30
35
40 0
100
200
300
400
500
600
700
800
Carbon intensity (gC
O¿/$U
S)
Carbon intensity of economic activity
Global emissions growth has generally recovered quickly from previous financial crises
It is unclear if the recent slowdown in global emissions is related to the Global Financial Crisis
Economic activity is measured in purchasing power parity (PPP) terms in 2010 US dollars.
Source: CDIAC; Peters et al 2012; Le Quéré et al 2017; Global Carbon Budget 2017

Emissions intensity per unit economic activity
The 10 largest economies have a wide range of emissions intensity of economic production
Emission intensity: CO2 emissions from fossil fuel and industry divided by Gross Domestic Product
Source: Global Carbon Budget 2017
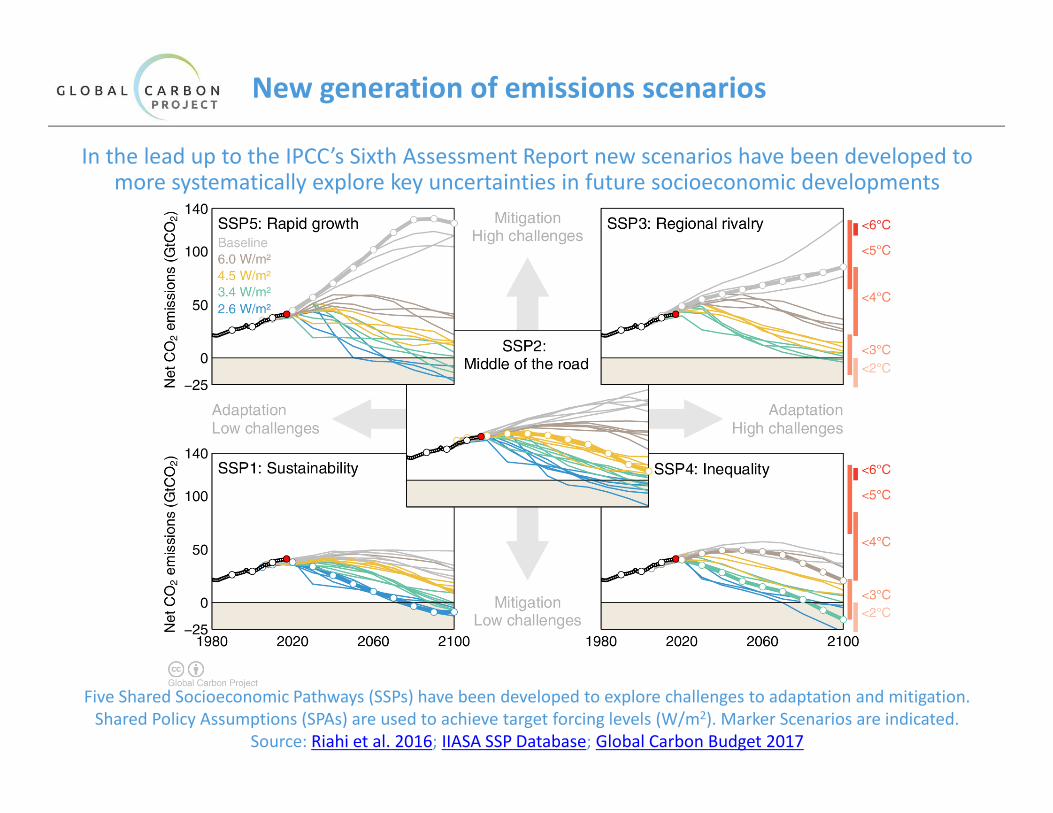
New generation of emissions scenarios
In the lead up to the IPCC’s Sixth Assessment Report new scenarios have been developed to more systematically explore key uncertainties in future socioeconomic developments
Five Shared Socioeconomic Pathways (SSPs) have been developed to explore challenges to adaptation and mitigation.
Shared Policy Assumptions (SPAs) are used to achieve target forcing levels (W/m2). Marker Scenarios are indicated.
Source: Riahi et al. 2016; IIASA SSP Database; Global Carbon Budget 2017
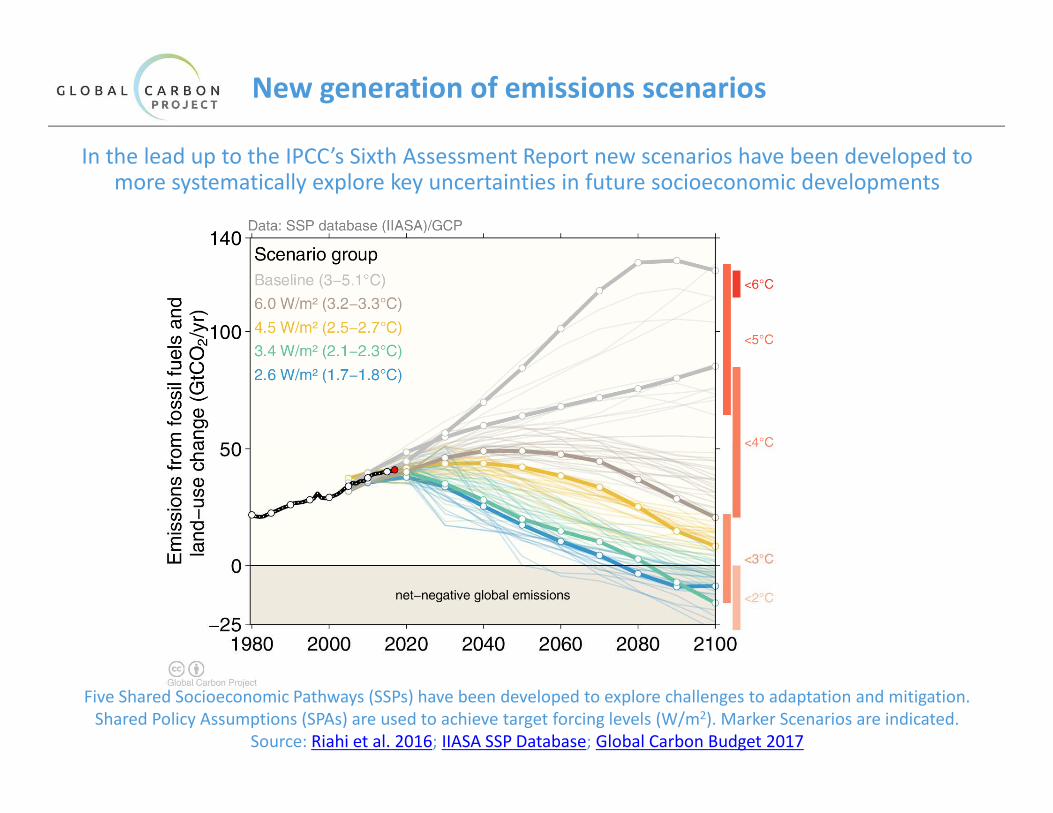
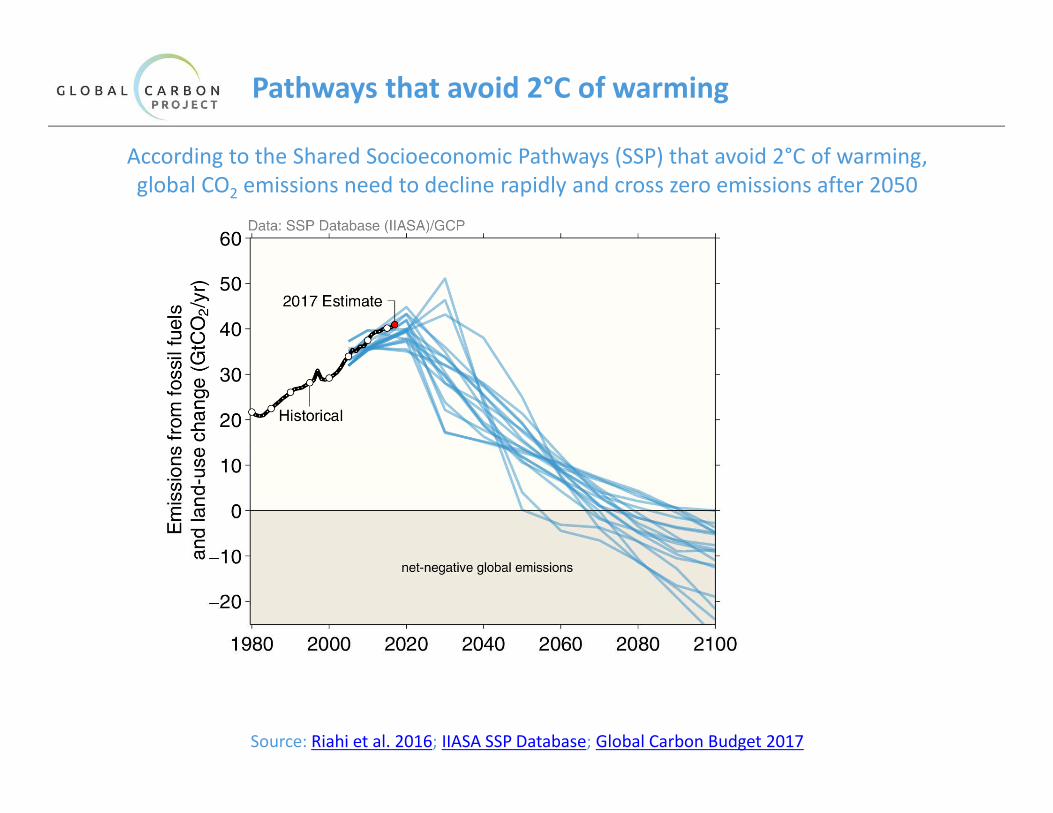
Pathways that avoid 2°C of warming
Source: Riahi et al. 2016; IIASA SSP Database; Global Carbon Budget 2017
According to the Shared Socioeconomic Pathways (SSP) that avoid 2°C of warming,
global CO2 emissions need to decline rapidly and cross zero emissions after 2050
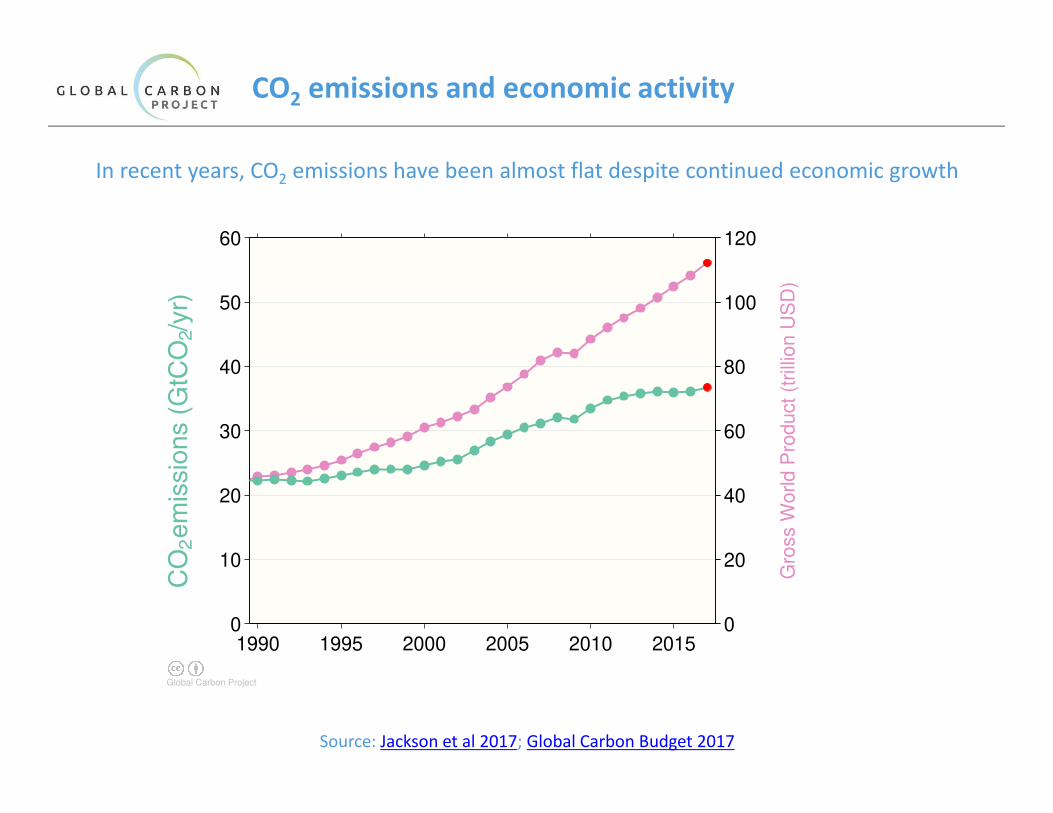
CO2 emissions and economic activity
In recent years, CO2 emissions have been almost flat despite continued economic growth
0
20
40
60
80
100
120
Gro
ss W
orld
Pro
du
ct
(trilli
on
US
D)
1990 1995 2000 2005 2010 20150
10
20
30
40
50
60
CO
¿ em
issi
ons
(GtC
O¿/
yr)
Global Carbon Project
Source: Jackson et al 2017; Global Carbon Budget 2017
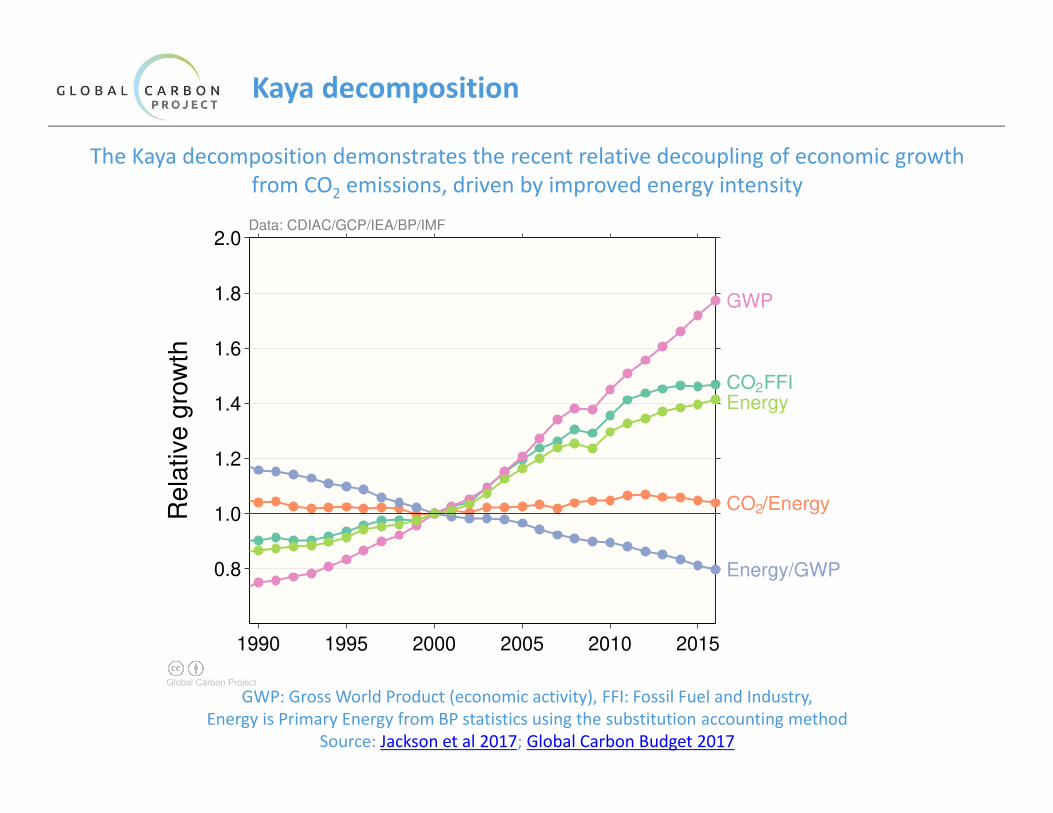
Kaya decomposition
The Kaya decomposition demonstrates the recent relative decoupling of economic growth
from CO2 emissions, driven by improved energy intensity
1990 1995 2000 2005 2010 2015
0.8
1.0
1.2
1.4
1.6
1.8
2.0
Re
lative
gro
wth
Global Carbon Project
CO¿ FFI
CO¿/Energy
Energy/GWP
GWP
Energy
Data: CDIAC/GCP/IEA/BP/IMF
GWP: Gross World Product (economic activity), FFI: Fossil Fuel and Industry,
Energy is Primary Energy from BP statistics using the substitution accounting method
Source: Jackson et al 2017; Global Carbon Budget 2017
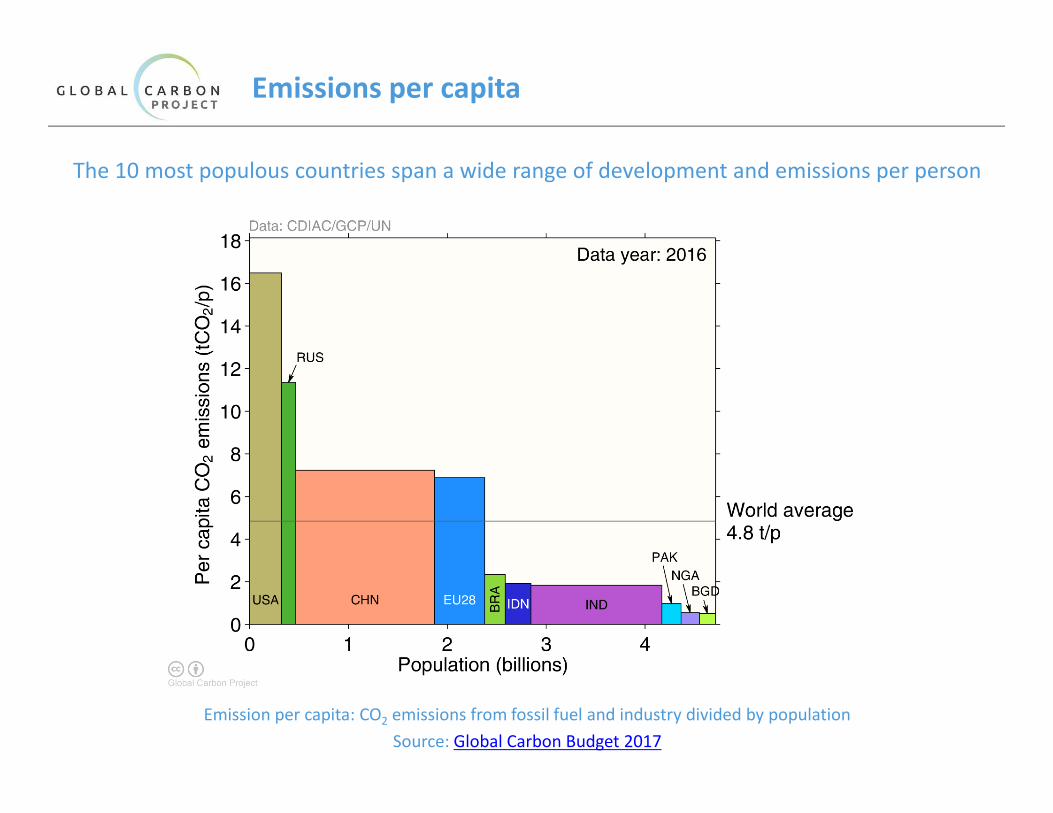
Emissions per capita
The 10 most populous countries span a wide range of development and emissions per person
Emission per capita: CO2 emissions from fossil fuel and industry divided by population
Source: Global Carbon Budget 2017
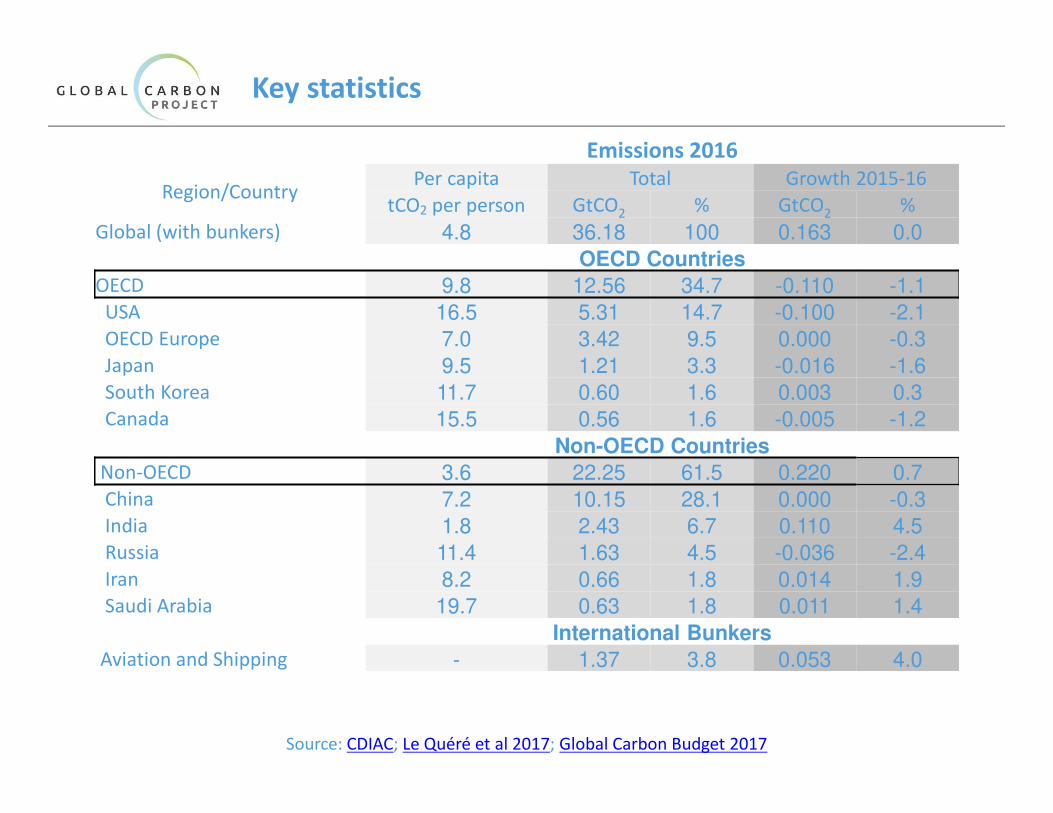
Emissions 2016
Region/CountryPer capita Total Growth 2015-16
tCO2 per person GtCO2 % GtCO2 %
Global (with bunkers) 4.8 36.18 100 0.163 0.0
OECD Countries
OECD 9.8 12.56 34.7 -0.110 -1.1USA 16.5 5.31 14.7 -0.100 -2.1OECD Europe 7.0 3.42 9.5 0.000 -0.3Japan 9.5 1.21 3.3 -0.016 -1.6South Korea 11.7 0.60 1.6 0.003 0.3Canada 15.5 0.56 1.6 -0.005 -1.2
Non-OECD Countries
Non-OECD 3.6 22.25 61.5 0.220 0.7China 7.2 10.15 28.1 0.000 -0.3India 1.8 2.43 6.7 0.110 4.5Russia 11.4 1.63 4.5 -0.036 -2.4Iran 8.2 0.66 1.8 0.014 1.9Saudi Arabia 19.7 0.63 1.8 0.011 1.4
International Bunkers
Aviation and Shipping - 1.37 3.8 0.053 4.0
Key statistics
Source: CDIAC; Le Quéré et al 2017; Global Carbon Budget 2017
Consumption-based Emissions
Consumption–based emissions allocate emissions to the location that goods and services are consumed
Consumption-based emissions = Production/Territorial-based emissions minus emissions embodied in exports plus the emissions embodied in imports
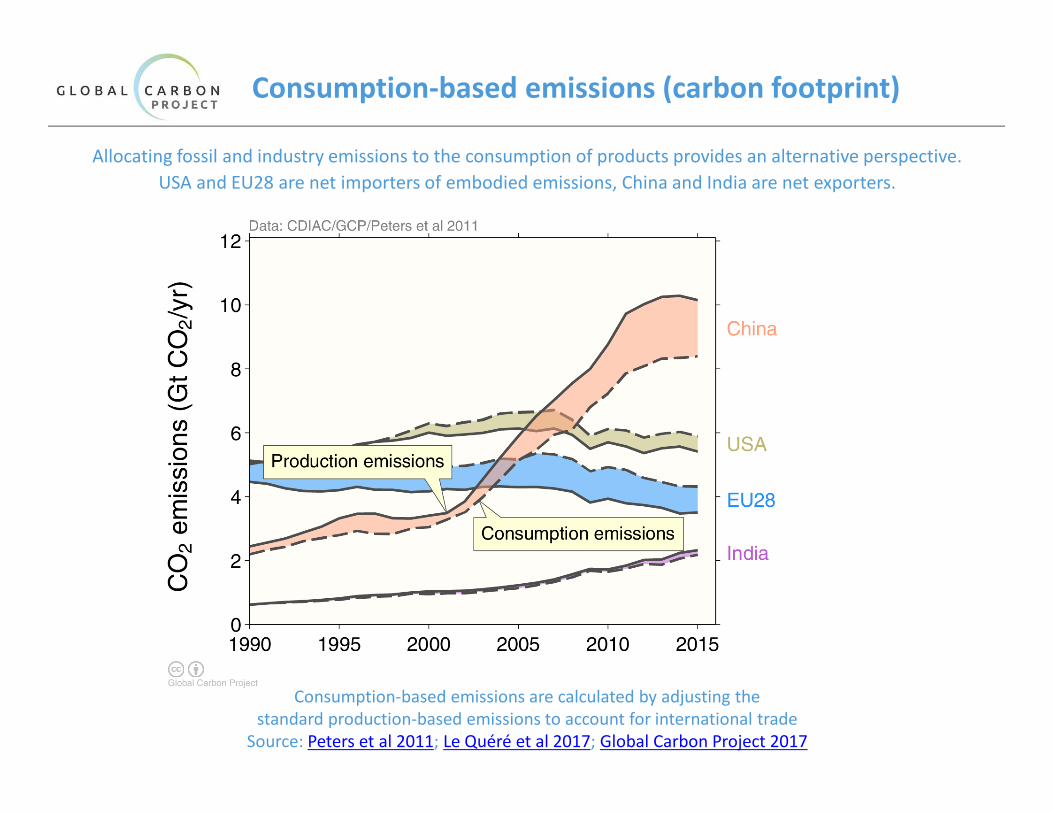
Consumption-based emissions (carbon footprint)
Allocating fossil and industry emissions to the consumption of products provides an alternative perspective.
USA and EU28 are net importers of embodied emissions, China and India are net exporters.
Consumption-based emissions are calculated by adjusting the
standard production-based emissions to account for international trade
Source: Peters et al 2011; Le Quéré et al 2017; Global Carbon Project 2017
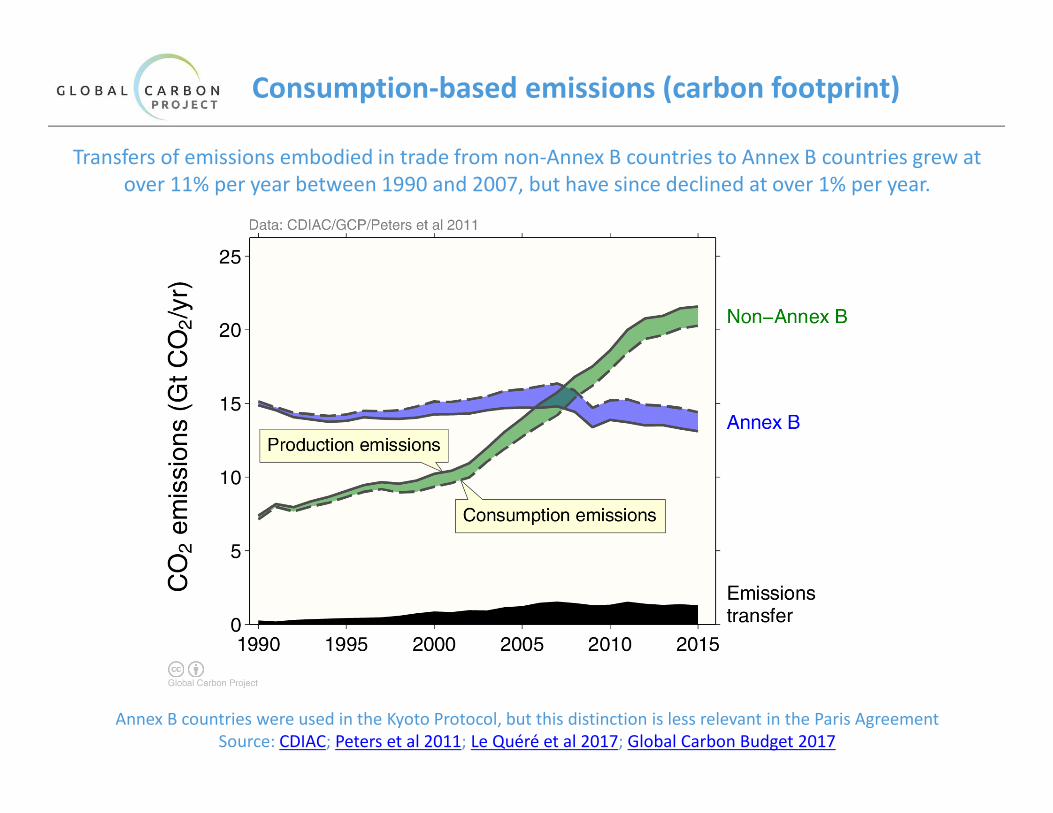
Consumption-based emissions (carbon footprint)
Transfers of emissions embodied in trade from non-Annex B countries to Annex B countries grew at
over 11% per year between 1990 and 2007, but have since declined at over 1% per year.
Annex B countries were used in the Kyoto Protocol, but this distinction is less relevant in the Paris Agreement
Source: CDIAC; Peters et al 2011; Le Quéré et al 2017; Global Carbon Budget 2017
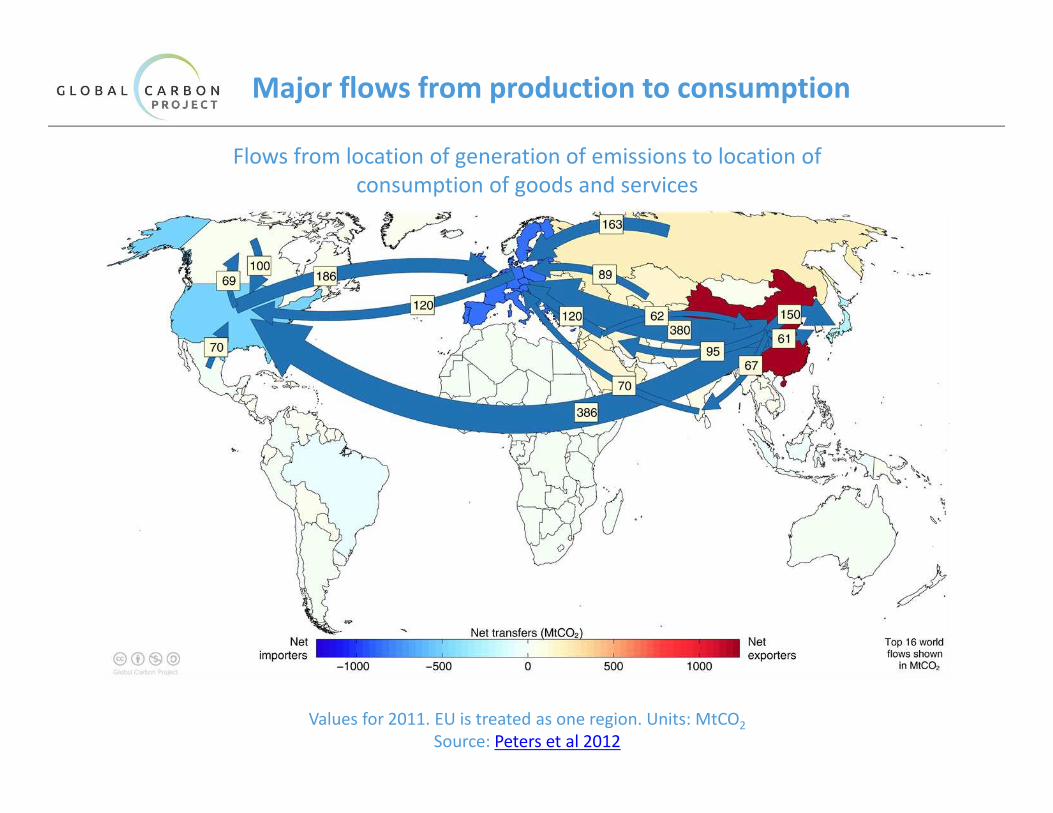
Major flows from production to consumption
Flows from location of generation of emissions to location of
consumption of goods and services
Values for 2011. EU is treated as one region. Units: MtCO2
Source: Peters et al 2012
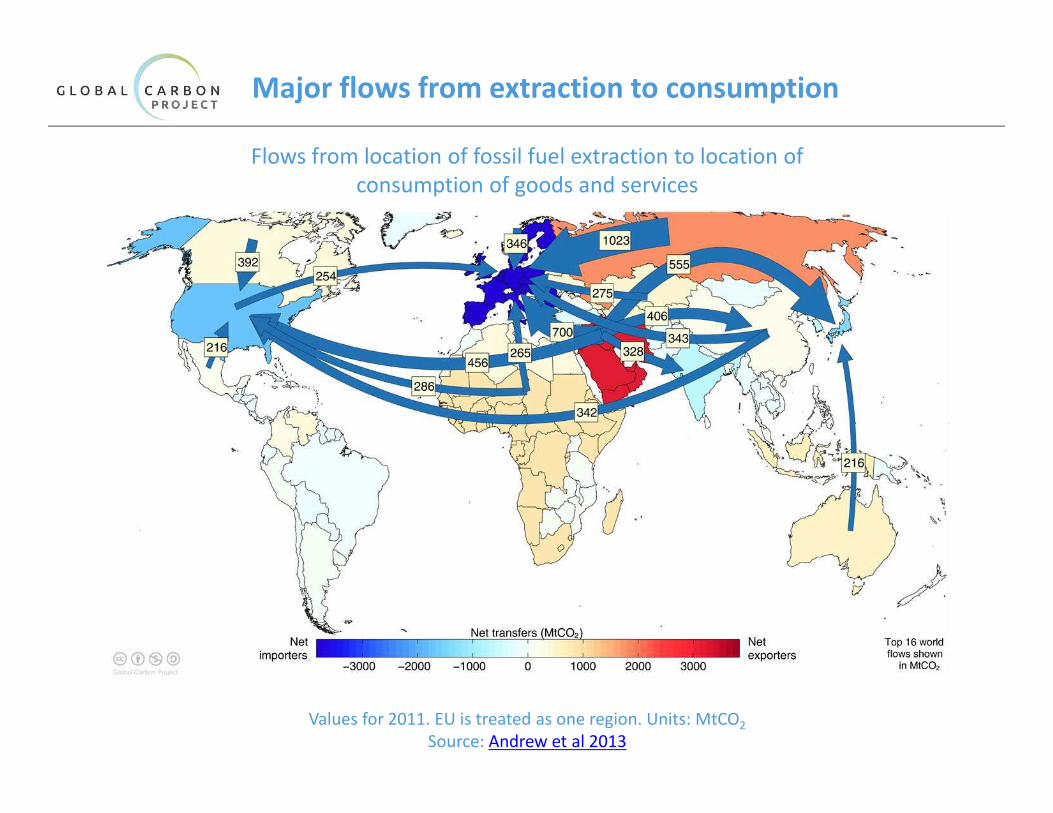
Major flows from extraction to consumption
Flows from location of fossil fuel extraction to location of
consumption of goods and services
Values for 2011. EU is treated as one region. Units: MtCO2
Source: Andrew et al 2013
Land-use Change Emissions
1960 1970 1980 1990 2000 2010 160
1
2
3
4
5
6
7
8
9
CO
¿ em
issi
ons
(Gt C
O¿/
yr)
Global Carbon Project
Data: GCP
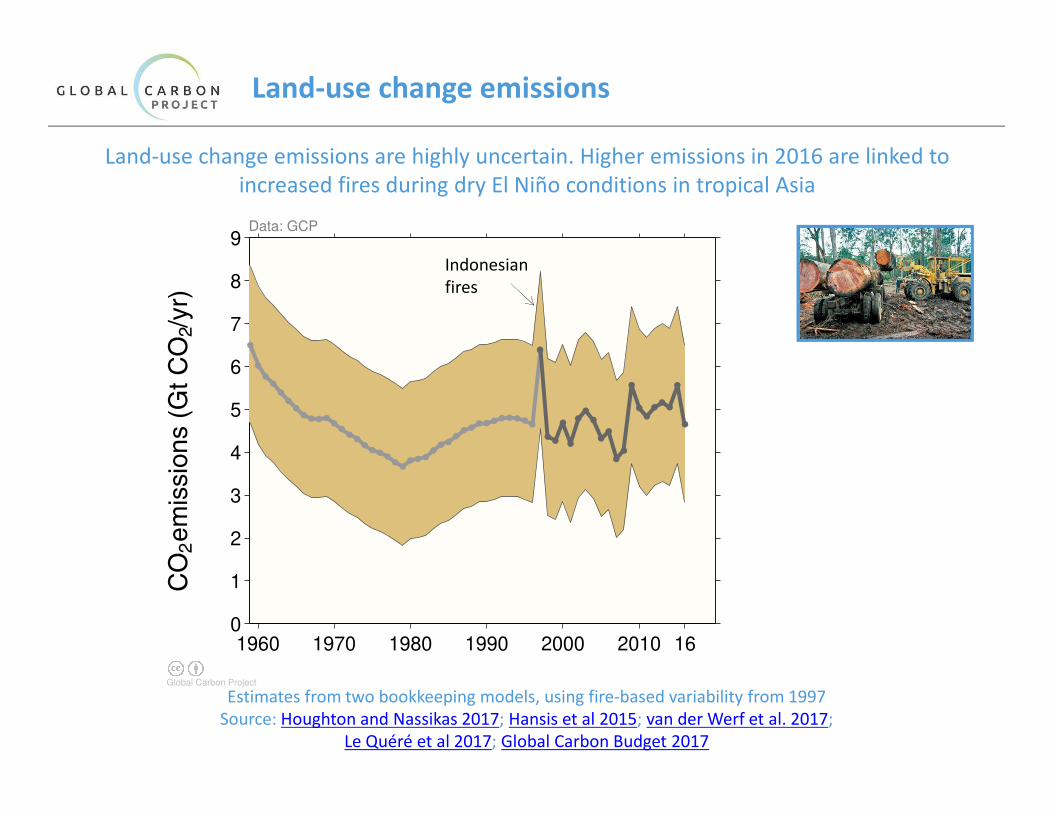
Land-use change emissions
Land-use change emissions are highly uncertain. Higher emissions in 2016 are linked to
increased fires during dry El Niño conditions in tropical Asia
Estimates from two bookkeeping models, using fire-based variability from 1997
Source: Houghton and Nassikas 2017; Hansis et al 2015; van der Werf et al. 2017;
Le Quéré et al 2017; Global Carbon Budget 2017
Indonesian
fires
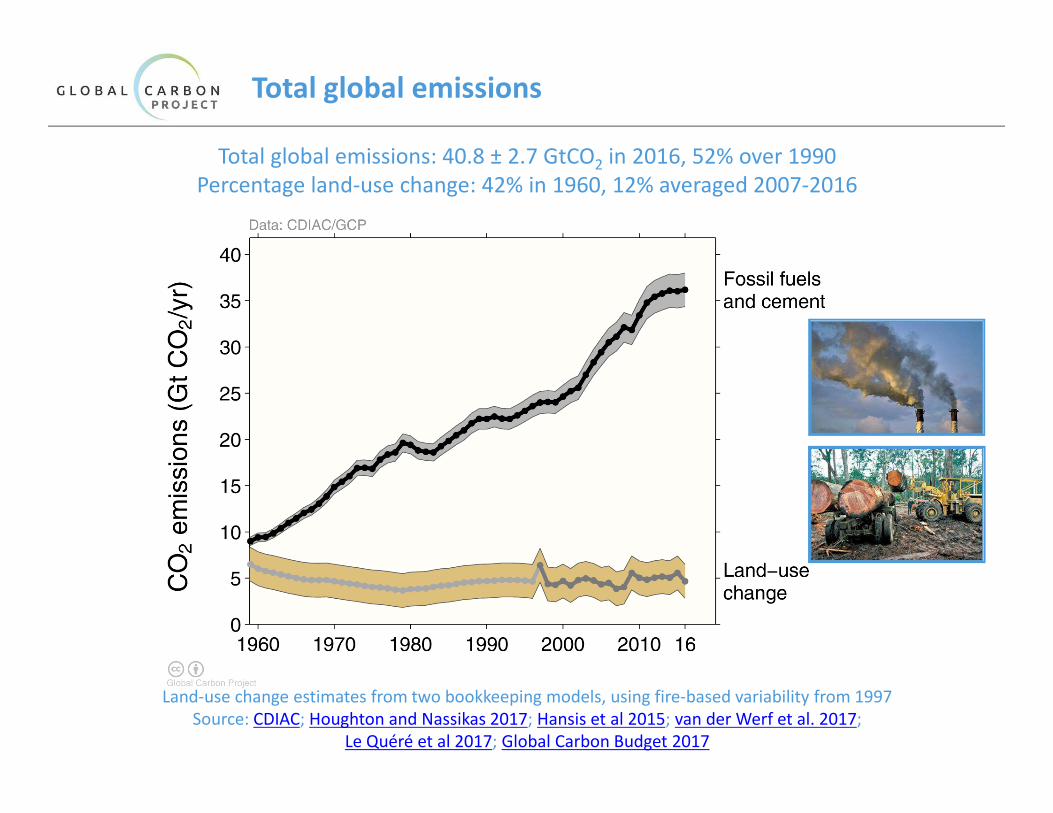
Total global emissions
Total global emissions: 40.8 ± 2.7 GtCO2 in 2016, 52% over 1990
Percentage land-use change: 42% in 1960, 12% averaged 2007-2016
Land-use change estimates from two bookkeeping models, using fire-based variability from 1997
Source: CDIAC; Houghton and Nassikas 2017; Hansis et al 2015; van der Werf et al. 2017;
Le Quéré et al 2017; Global Carbon Budget 2017
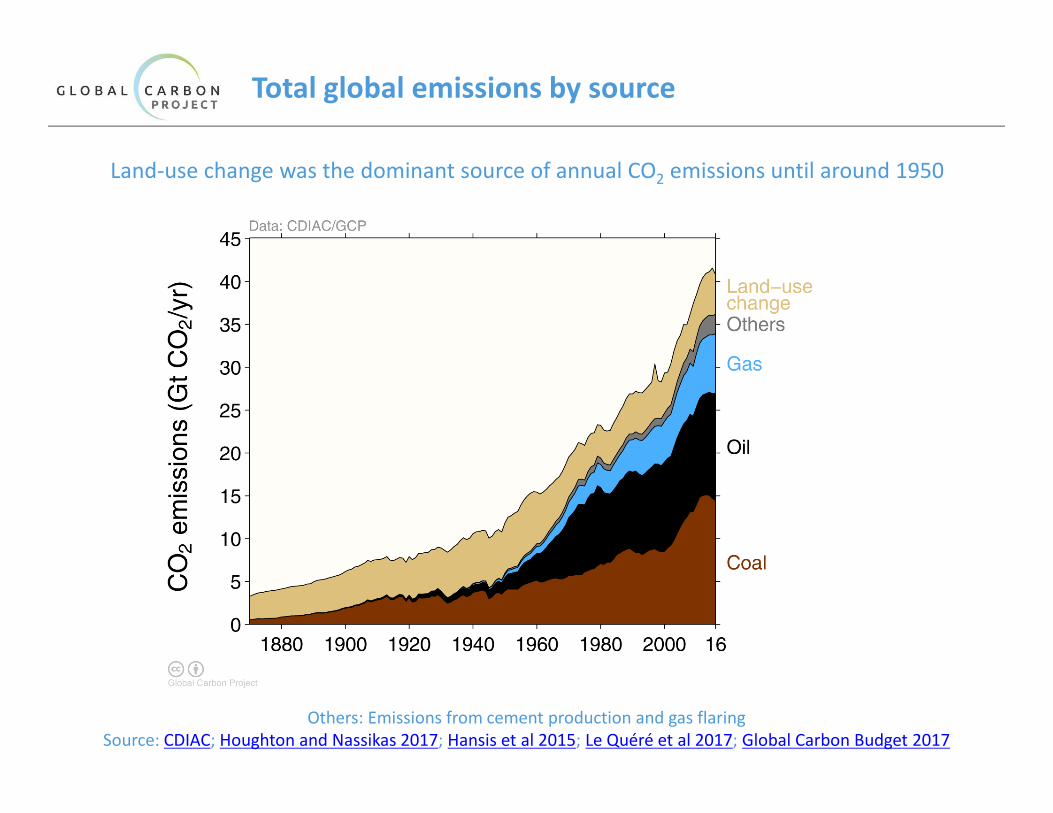
Total global emissions by source
Land-use change was the dominant source of annual CO2 emissions until around 1950
Others: Emissions from cement production and gas flaring
Source: CDIAC; Houghton and Nassikas 2017; Hansis et al 2015; Le Quéré et al 2017; Global Carbon Budget 2017
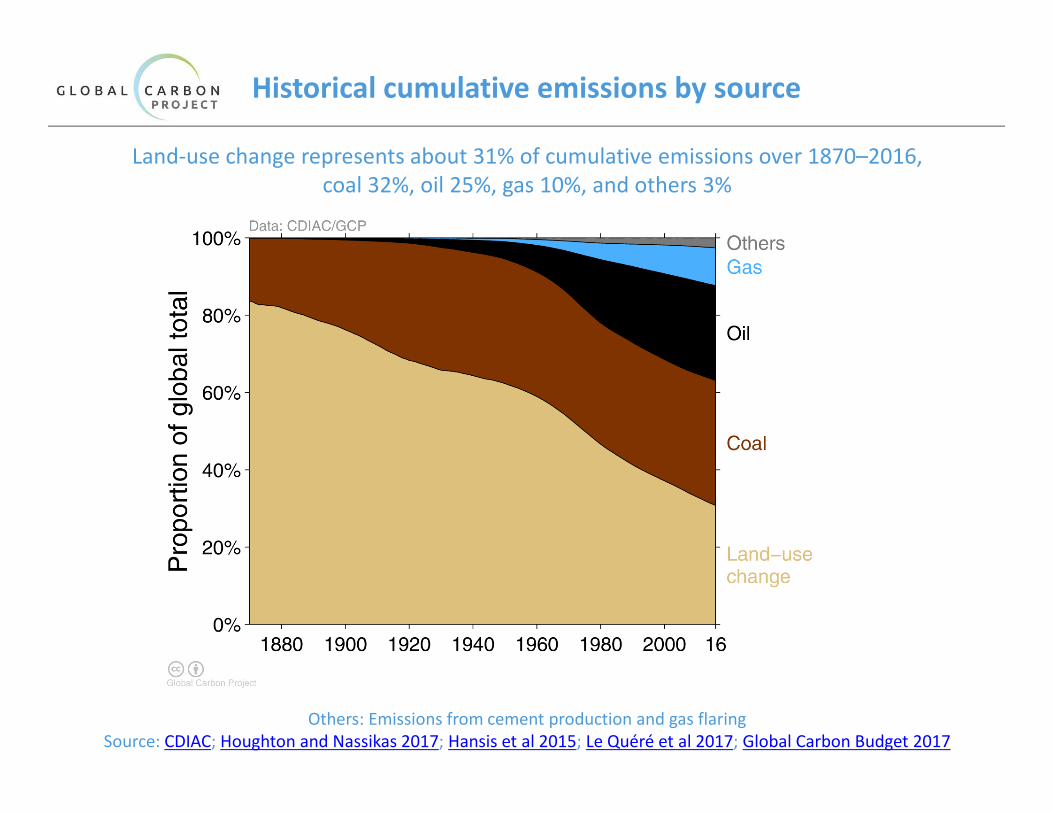
Historical cumulative emissions by source
Land-use change represents about 31% of cumulative emissions over 1870–2016,
coal 32%, oil 25%, gas 10%, and others 3%
Others: Emissions from cement production and gas flaring
Source: CDIAC; Houghton and Nassikas 2017; Hansis et al 2015; Le Quéré et al 2017; Global Carbon Budget 2017

Closing the Global Carbon Budget
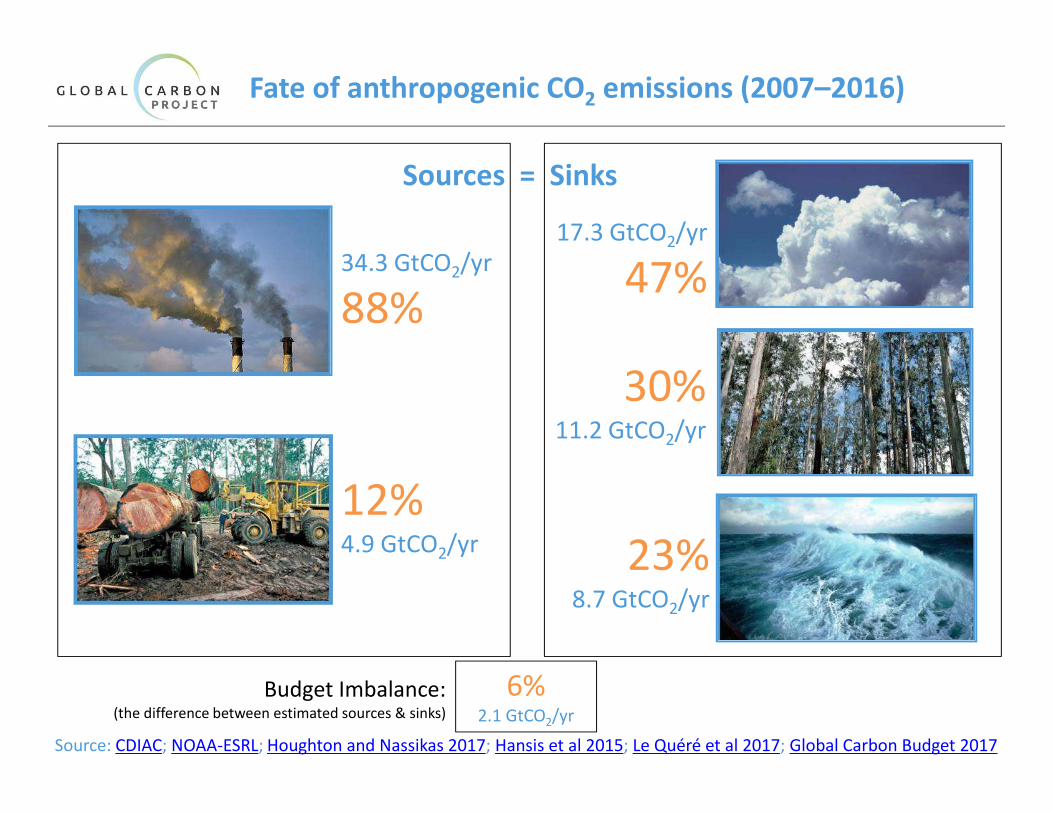
30%11.2 GtCO2/yr
Fate of anthropogenic CO2 emissions (2007–2016)
Source: CDIAC; NOAA-ESRL; Houghton and Nassikas 2017; Hansis et al 2015; Le Quéré et al 2017; Global Carbon Budget 2017
23%8.7 GtCO2/yr
34.3 GtCO2/yr
88%
12%4.9 GtCO2/yr
17.3 GtCO2/yr
47%
Sources = Sinks
6%2.1 GtCO2/yr
Budget Imbalance: (the difference between estimated sources & sinks)
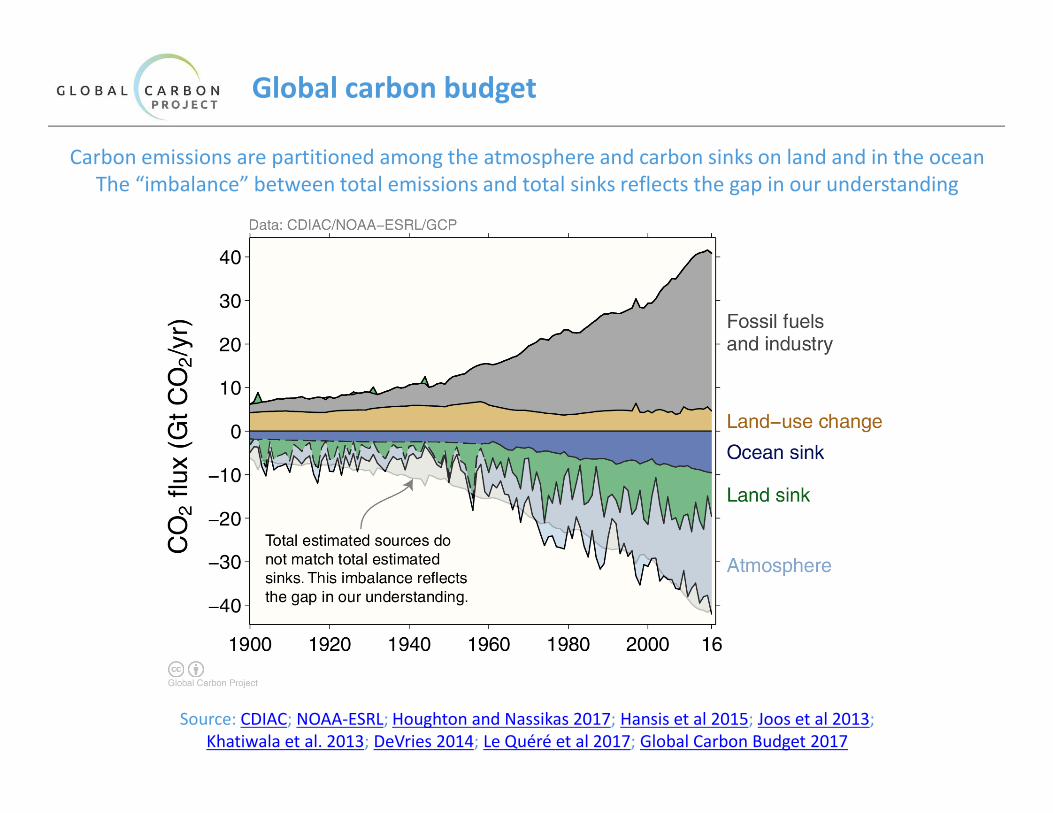
Global carbon budget
Carbon emissions are partitioned among the atmosphere and carbon sinks on land and in the ocean
The “imbalance” between total emissions and total sinks reflects the gap in our understanding
Source: CDIAC; NOAA-ESRL; Houghton and Nassikas 2017; Hansis et al 2015; Joos et al 2013;
Khatiwala et al. 2013; DeVries 2014; Le Quéré et al 2017; Global Carbon Budget 2017
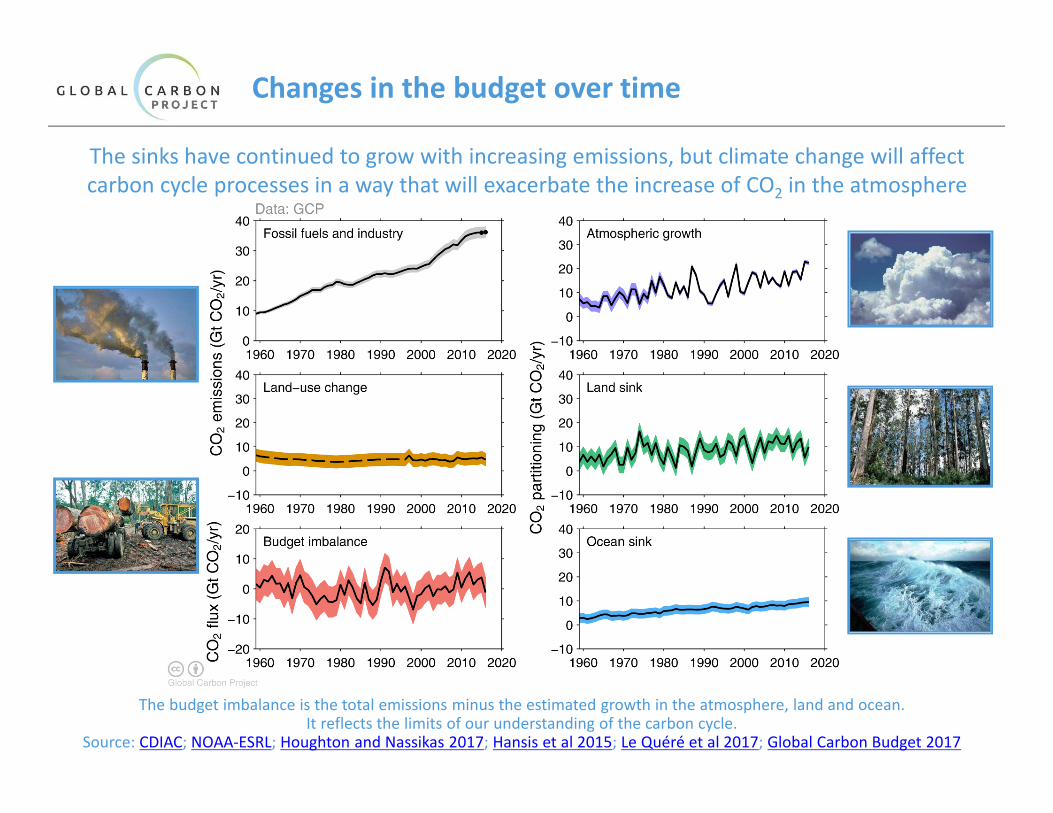
Changes in the budget over time
The sinks have continued to grow with increasing emissions, but climate change will affect
carbon cycle processes in a way that will exacerbate the increase of CO2 in the atmosphere
The budget imbalance is the total emissions minus the estimated growth in the atmosphere, land and ocean. It reflects the limits of our understanding of the carbon cycle.
Source: CDIAC; NOAA-ESRL; Houghton and Nassikas 2017; Hansis et al 2015; Le Quéré et al 2017; Global Carbon Budget 2017
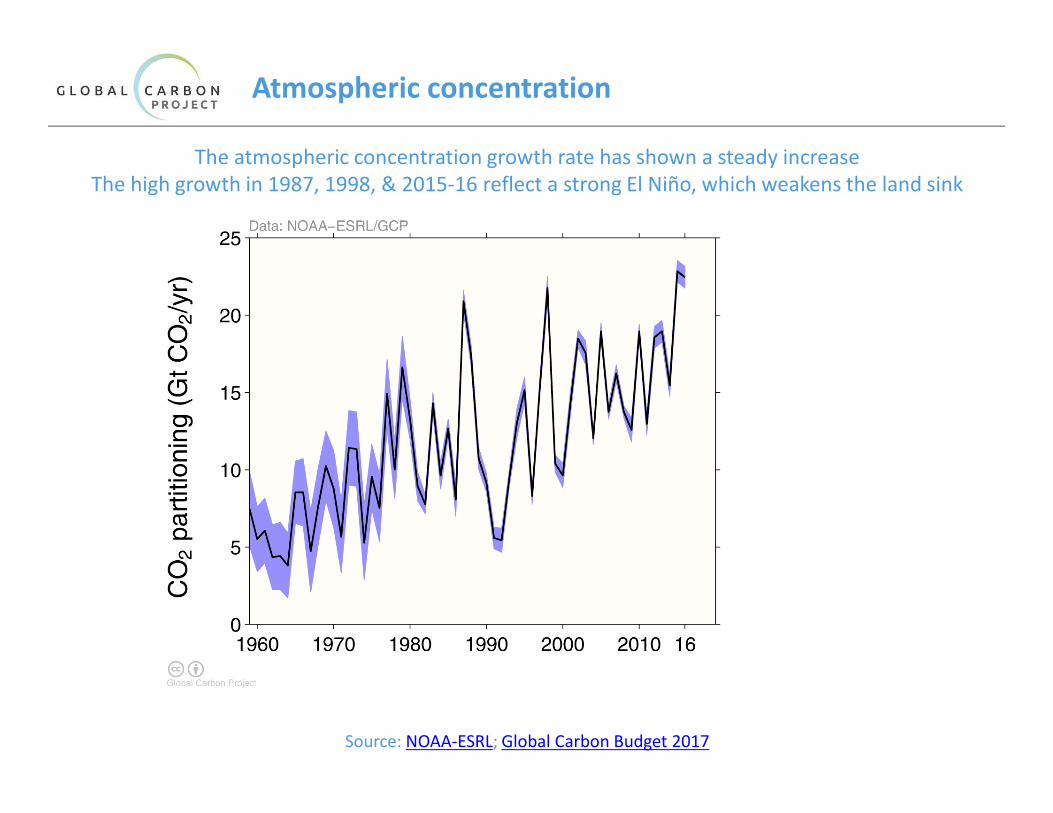
Atmospheric concentration
The atmospheric concentration growth rate has shown a steady increase
The high growth in 1987, 1998, & 2015-16 reflect a strong El Niño, which weakens the land sink
Source: NOAA-ESRL; Global Carbon Budget 2017
CO
¿ (G
t CO
¿/yr
)
Data: GCP
Global Carbon Project
1960 1970 1980 1990 2000 2010 160
5
10
15
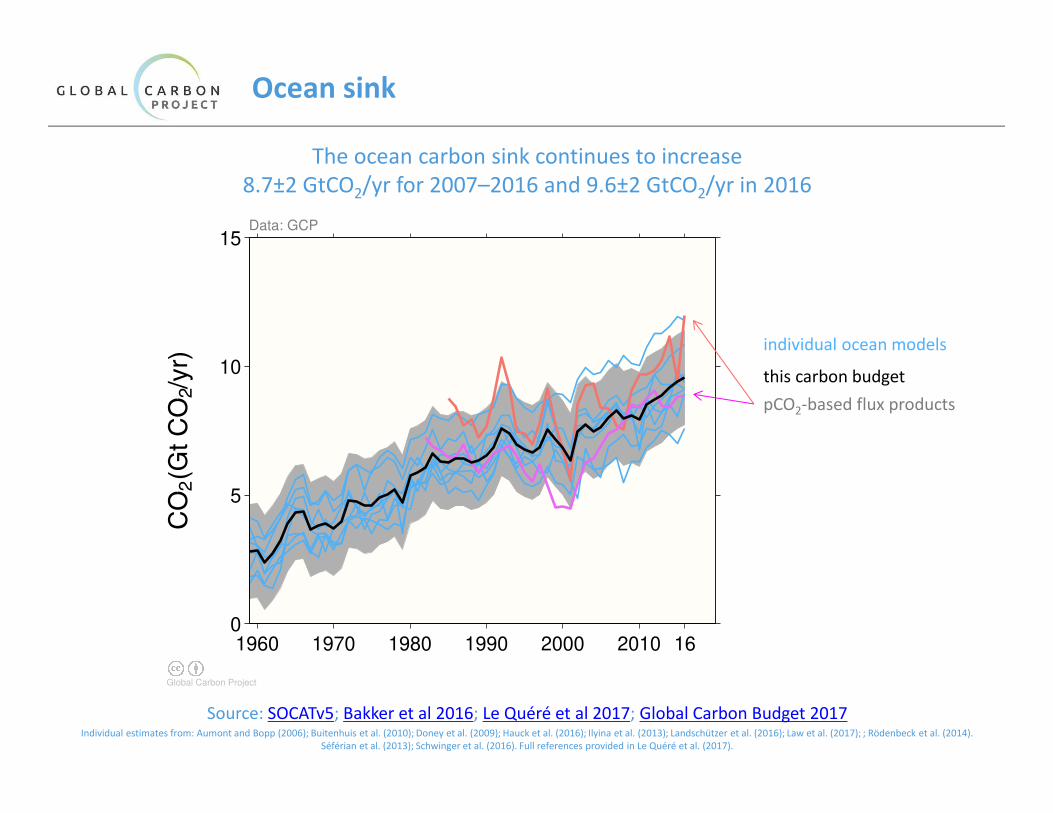
Ocean sink
The ocean carbon sink continues to increase
8.7±2 GtCO2/yr for 2007–2016 and 9.6±2 GtCO2/yr in 2016
Source: SOCATv5; Bakker et al 2016; Le Quéré et al 2017; Global Carbon Budget 2017Individual estimates from: Aumont and Bopp (2006); Buitenhuis et al. (2010); Doney et al. (2009); Hauck et al. (2016); Ilyina et al. (2013); Landschützer et al. (2016); Law et al. (2017); ; Rödenbeck et al. (2014).
Séférian et al. (2013); Schwinger et al. (2016). Full references provided in Le Quéré et al. (2017).
this carbon budget
individual ocean models
pCO2-based flux products
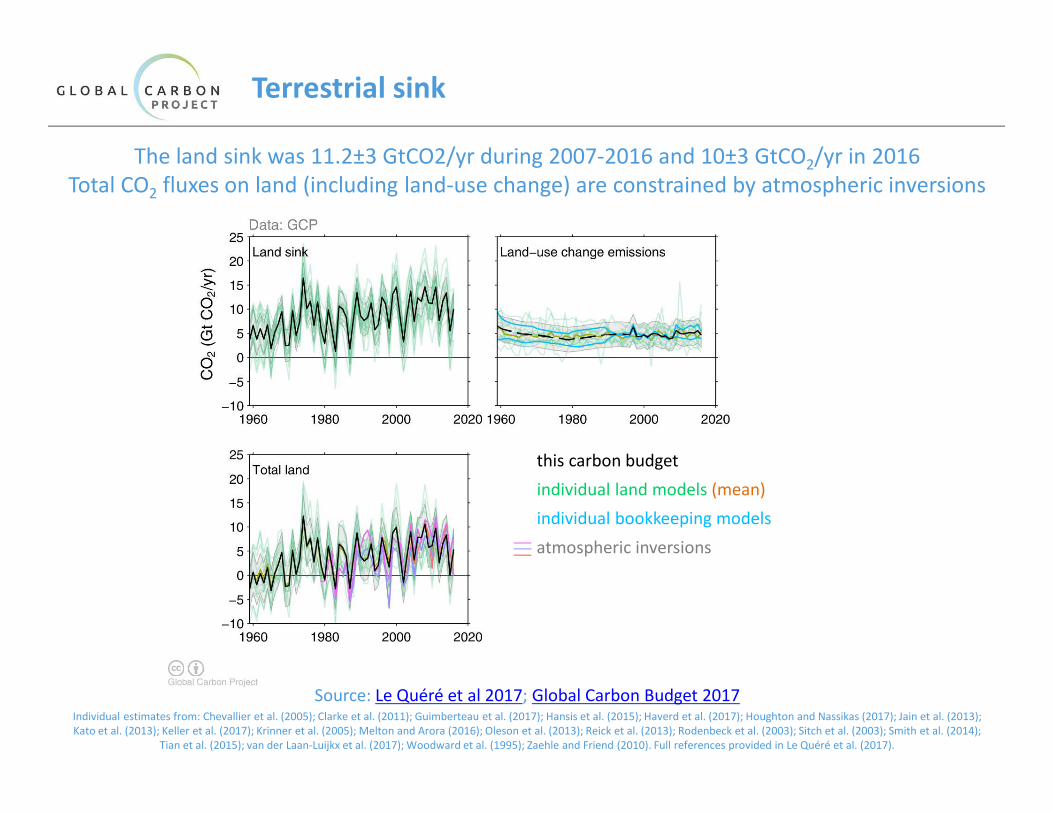
Terrestrial sink
The land sink was 11.2±3 GtCO2/yr during 2007-2016 and 10±3 GtCO2/yr in 2016
Total CO2 fluxes on land (including land-use change) are constrained by atmospheric inversions
Source: Le Quéré et al 2017; Global Carbon Budget 2017Individual estimates from: Chevallier et al. (2005); Clarke et al. (2011); Guimberteau et al. (2017); Hansis et al. (2015); Haverd et al. (2017); Houghton and Nassikas (2017); Jain et al. (2013);
Kato et al. (2013); Keller et al. (2017); Krinner et al. (2005); Melton and Arora (2016); Oleson et al. (2013); Reick et al. (2013); Rodenbeck et al. (2003); Sitch et al. (2003); Smith et al. (2014);
Tian et al. (2015); van der Laan-Luijkx et al. (2017); Woodward et al. (1995); Zaehle and Friend (2010). Full references provided in Le Quéré et al. (2017).
this carbon budget
individual land models (mean)
individual bookkeeping models
atmospheric inversions
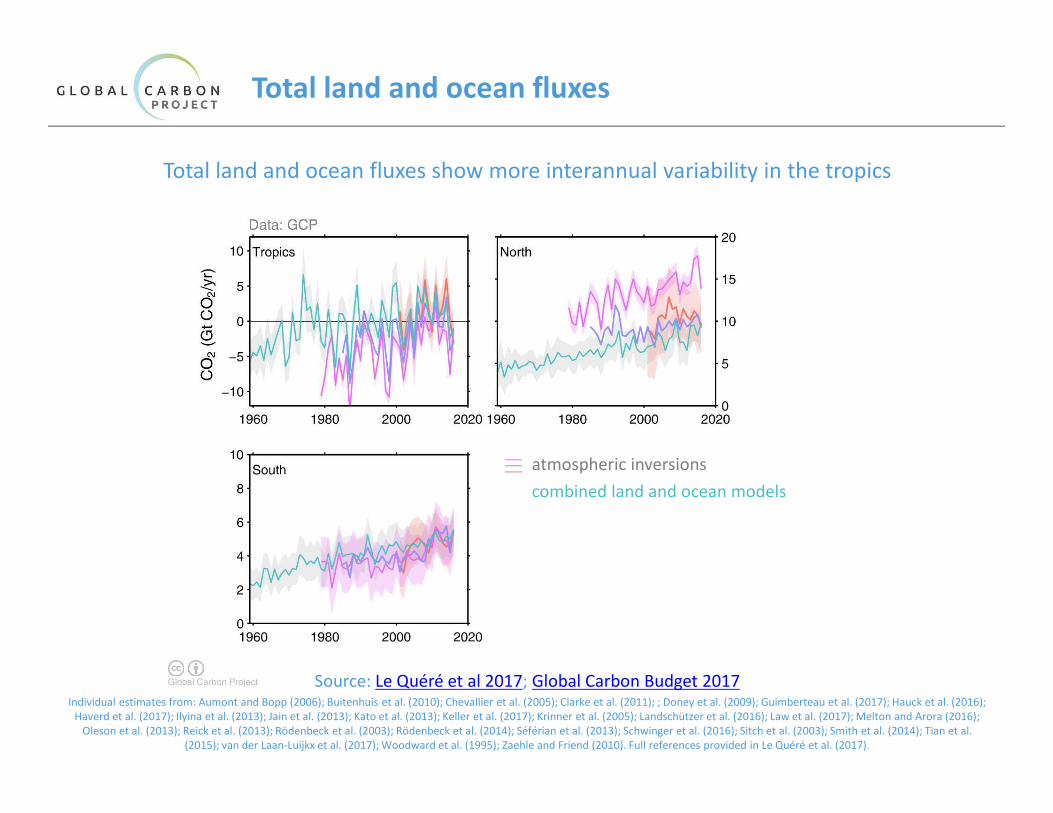
Total land and ocean fluxes
Total land and ocean fluxes show more interannual variability in the tropics
Source: Le Quéré et al 2017; Global Carbon Budget 2017Individual estimates from: Aumont and Bopp (2006); Buitenhuis et al. (2010); Chevallier et al. (2005); Clarke et al. (2011); ; Doney et al. (2009); Guimberteau et al. (2017); Hauck et al. (2016);
Haverd et al. (2017); Ilyina et al. (2013); Jain et al. (2013); Kato et al. (2013); Keller et al. (2017); Krinner et al. (2005); Landschützer et al. (2016); Law et al. (2017); Melton and Arora (2016);
Oleson et al. (2013); Reick et al. (2013); Rödenbeck et al. (2003); Rödenbeck et al. (2014); Séférian et al. (2013); Schwinger et al. (2016); Sitch et al. (2003); Smith et al. (2014); Tian et al.
(2015); van der Laan-Luijkx et al. (2017); Woodward et al. (1995); Zaehle and Friend (2010). Full references provided in Le Quéré et al. (2017).
atmospheric inversions
combined land and ocean models
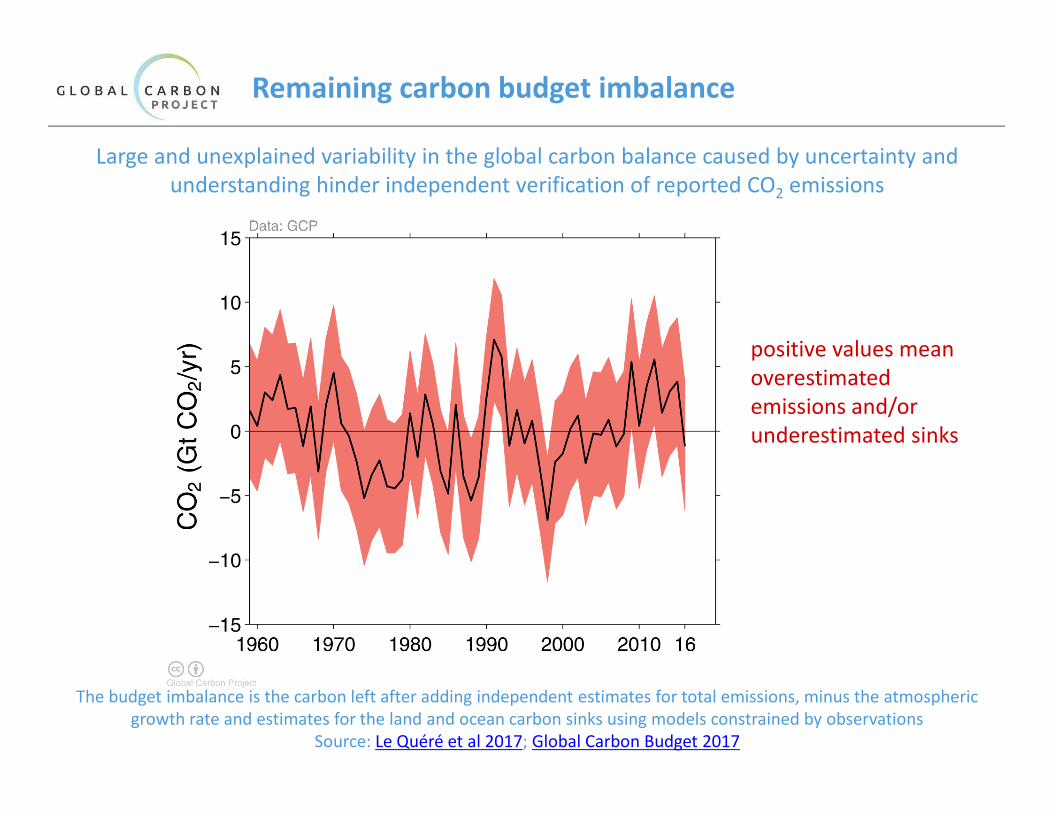
Remaining carbon budget imbalance
The budget imbalance is the carbon left after adding independent estimates for total emissions, minus the atmospheric
growth rate and estimates for the land and ocean carbon sinks using models constrained by observations
Source: Le Quéré et al 2017; Global Carbon Budget 2017
Large and unexplained variability in the global carbon balance caused by uncertainty and
understanding hinder independent verification of reported CO2 emissions
positive values mean
overestimated
emissions and/or
underestimated sinks

Global carbon budget
The cumulative contributions to the global carbon budget from 1870
The carbon imbalance represents the gap in our current understanding of sources and sinks
Figure concept from Shrink That Footprint
Source: CDIAC; NOAA-ESRL; Houghton and Nassikas 2017; Hansis et al 2015; Joos et al 2013;
Khatiwala et al. 2013; DeVries 2014; Le Quéré et al 2017; Global Carbon Budget 2016
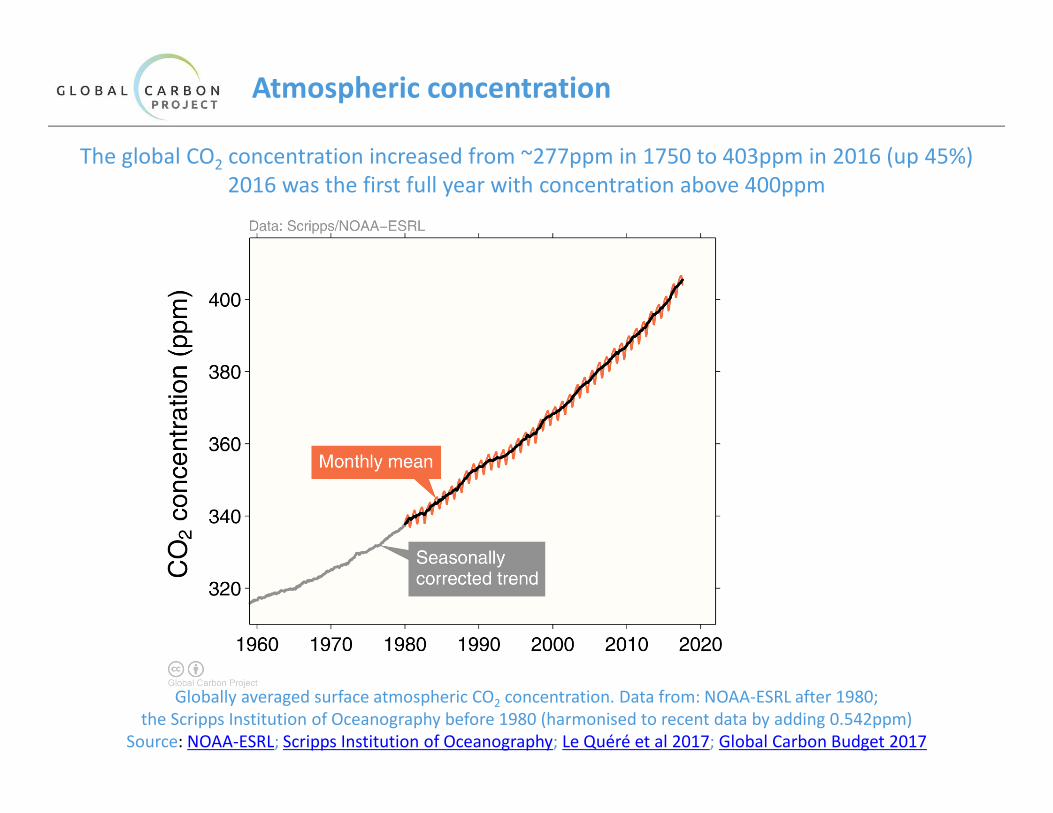
Atmospheric concentration
The global CO2 concentration increased from ~277ppm in 1750 to 403ppm in 2016 (up 45%)
2016 was the first full year with concentration above 400ppm
Globally averaged surface atmospheric CO2 concentration. Data from: NOAA-ESRL after 1980;
the Scripps Institution of Oceanography before 1980 (harmonised to recent data by adding 0.542ppm)
Source: NOAA-ESRL; Scripps Institution of Oceanography; Le Quéré et al 2017; Global Carbon Budget 2017
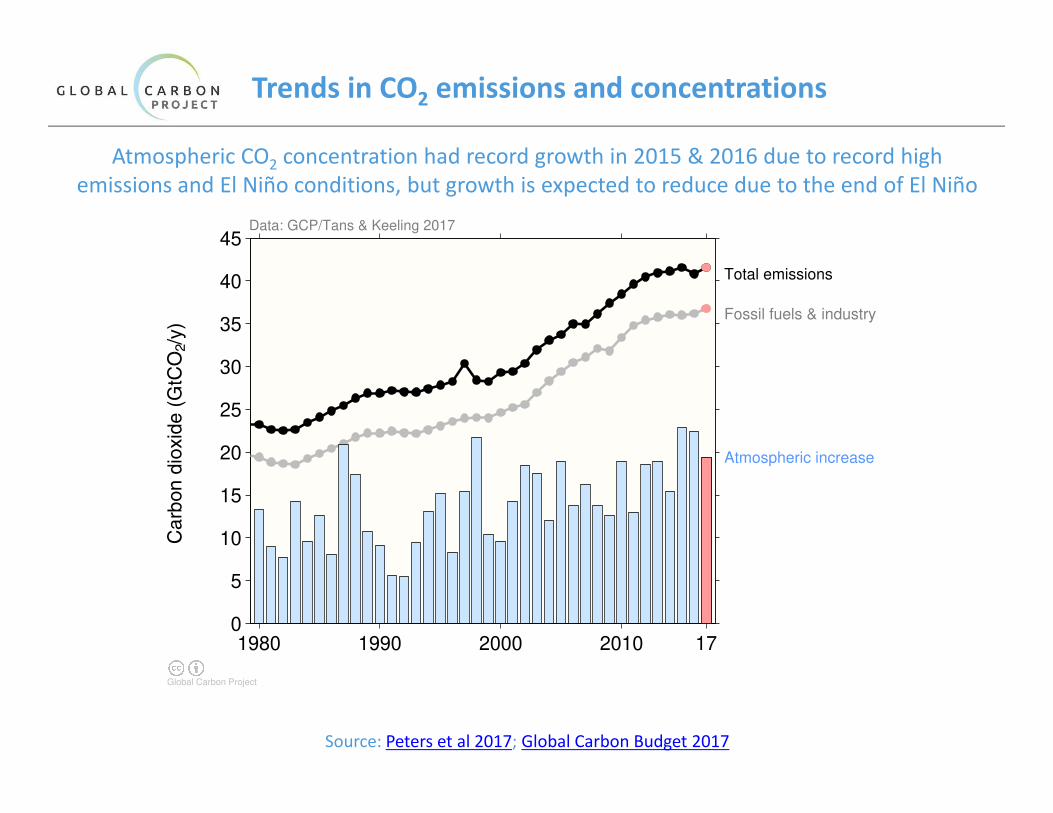
Trends in CO2 emissions and concentrations
Atmospheric CO2 concentration had record growth in 2015 & 2016 due to record high
emissions and El Niño conditions, but growth is expected to reduce due to the end of El Niño
Source: Peters et al 2017; Global Carbon Budget 2017
1980 1990 2000 2010 170
5
10
15
20
25
30
35
40
45
Atmospheric increase
Total emissions
Fossil fuels & industry
Car
bon
diox
ide
(GtC
O¿/
y)
Global Carbon Project
Data: GCP/Tans & Keeling 2017
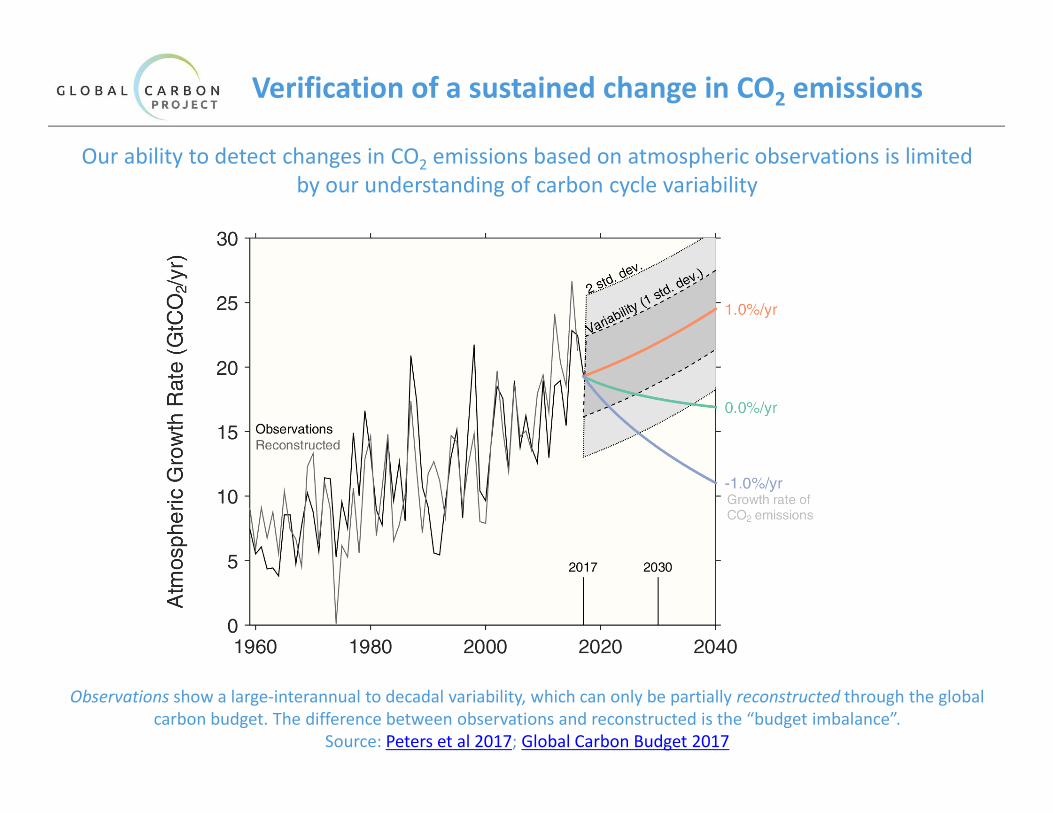
Verification of a sustained change in CO2 emissions
Our ability to detect changes in CO2 emissions based on atmospheric observations is limited
by our understanding of carbon cycle variability
Observations show a large-interannual to decadal variability, which can only be partially reconstructed through the global
carbon budget. The difference between observations and reconstructed is the “budget imbalance”.
Source: Peters et al 2017; Global Carbon Budget 2017
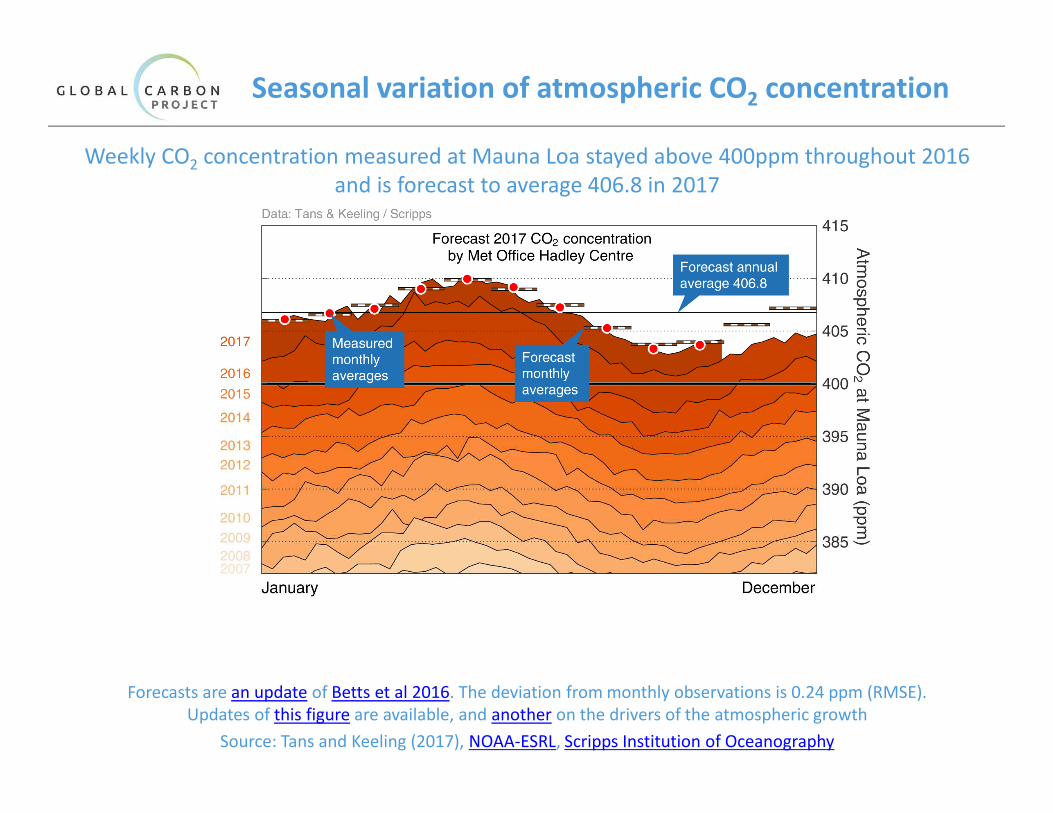
Seasonal variation of atmospheric CO2 concentration
Forecasts are an update of Betts et al 2016. The deviation from monthly observations is 0.24 ppm (RMSE).
Updates of this figure are available, and another on the drivers of the atmospheric growth
Source: Tans and Keeling (2017), NOAA-ESRL, Scripps Institution of Oceanography
Weekly CO2 concentration measured at Mauna Loa stayed above 400ppm throughout 2016
and is forecast to average 406.8 in 2017
End notes
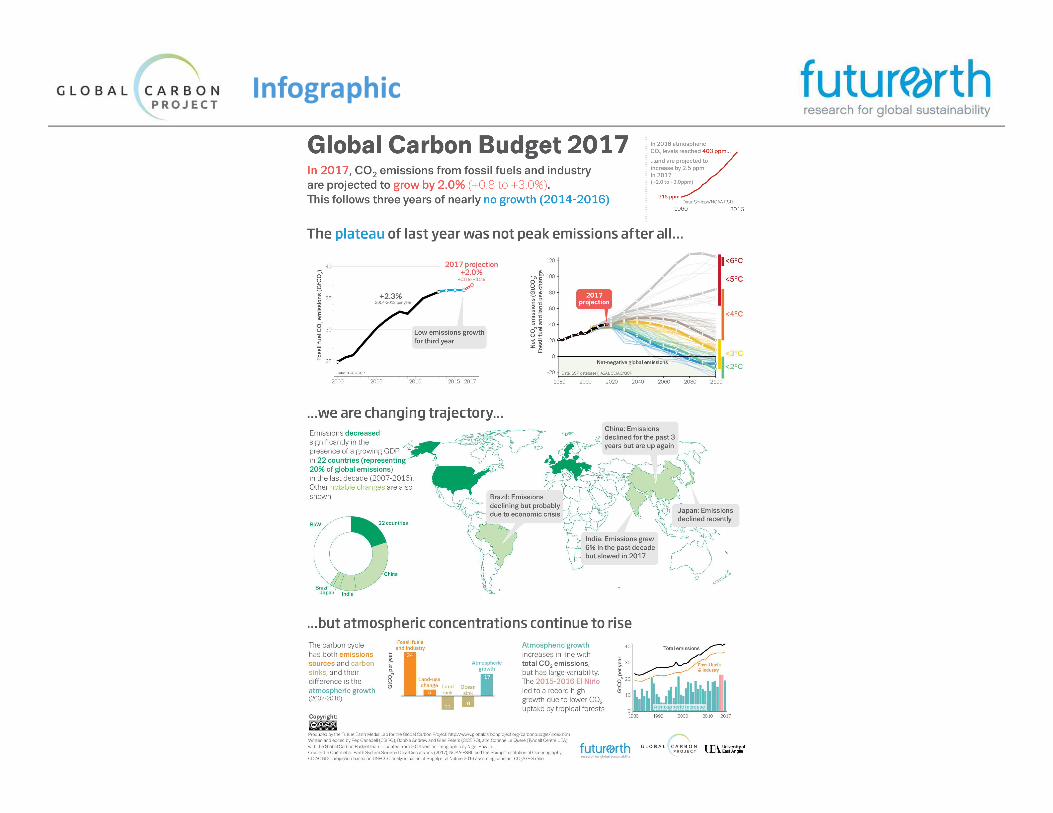
Infographic
Acknowledgements
The work presented in the Global Carbon Budget 2017
has been possible thanks to the contributions of
hundreds of people involved in observational networks,
modeling, and synthesis efforts.
We thank the institutions and agencies that provide
support for individuals and funding that enable the
collaborative effort of bringing all components together
in the carbon budget effort.
We thank the sponsors of the GCP and GCP support and
liaison offices.
We also want thank each of the many funding
agencies that supported the individual
components of this release. A full list in provided
in Table B1 of Le Quéré et al. 2017.
https://doi.org/10.5194/essdd-2017-123
We also thanks the Fondation BNP Paribas for
supporting the Global Carbon Atlas.
This presentation was created by Robbie Andrew
with Pep Canadell, Glen Peters and
Corinne Le Quéré in support of the international
carbon research community.
License
Attribution 4.0 International (CC BY 4.0)
This deed highlights only some of the key features and terms of the actual license. It is not a license and has no legal value. You should carefully review all of the terms
and conditions of the actual license before using the licensed material. This is a human-readable summary of (and not a substitute for) the license.
You are free to:
Share — copy and redistribute the material in any medium or format
Adapt — remix, transform, and build upon the material
The licensor cannot revoke these freedoms as long as you follow the license terms.
Under the following terms:
Attribution — You must give appropriate credit, provide a link to the license, and indicate if changes were made. You may do so in any reasonable manner, but not in
any way that suggests the licensor endorses you or your use.
No additional restrictions — You may not apply legal terms or technological measures that legally restrict others from doing anything the license permits.
You do not have to comply with the license for elements of the material in the public domain or where your use is permitted by an applicable exception or limitation.
No warranties are given. The license may not give you all of the permissions necessary for your intended use. For example, other rights such as publicity, privacy, or
moral rights may limit how you use the material.