global investment trends and prospects
TRANSCRIPT

CHAPTER I
GLOBAL INVESTMENT TRENDS AND PROSPECTS

2 World Investment Report 2021 Investing in Sustainable Recovery
1. Global trends
Global foreign direct investment (FDI) flows fell by 35 per cent in 2020, reaching $1 trillion,
from $1.5 trillion in 2019 (figure I.1). This is the lowest level since 2005 and almost 20 per
cent lower than the 2009 trough after the global financial crisis. The lockdowns around the
world in response to the COVID-19 pandemic slowed down existing investment projects,
and the prospects of a recession led multinational enterprises (MNEs) to re-assess new
projects. The fall in FDI was significantly sharper than the fall in gross domestic product
(GDP) and trade.
FDI plummeted in developed and transition economies, falling by 58 per cent in both. It
decreased by a more moderate 8 per cent in developing economies, mainly because of
resilient flows in Asia (up 4 per cent). As a result, developing economies accounted for two
thirds of global FDI, up from just under half in 2019.
Both the steep decline in developed economies and the relatively strong showing in Asia
were influenced to a significant degree by large fluctuations in a small number of conduit
economies. Of the global decline of some $500 billion, almost one third was accounted
for by the Netherlands and caused by the liquidation of several large holding companies,
corporate reconfigurations and intrafirm financial flows. The uptick in Asia was mostly driven
by an increase in FDI flows to Hong Kong, China (up $46 billion from low levels in 2019),
A. CURRENT FDI TRENDS
Source: UNCTAD, FDI/MNE database (www.unctad.org/fdistatistics).
0
500
1 000
1 500
2 000
2 500
2007 2008 2009 2010 2011 2012 2013 2014 2015 2016 2017 2018 2019 2020
24-58%
312-58%
$999-35%
66% 663-8%
Developed economies
World total
Transition economies
Developing economies
FDI in�ows, global and by group of economies, 2007–2020 (Billions of dollars and per cent)Figure I.1.

Chapter I Global Investment Trends and Prospects 3
largely reflecting financial transactions by Chinese MNEs. Excluding the effects of conduit
flows, one-off transactions and intrafirm financial flows, the global decline was slightly more
moderate (about 25 per cent) and uniform (with flows to developing Asia down 6 per cent).1
The patterns in new greenfield investment announcements and international project finance
deals contrasted sharply with FDI patterns, with much steeper declines in developing
economies than in developed ones. Greenfield announcements in developing countries fell
by 44 per cent in value and international project finance deals by 53 per cent, compared
with 16 per cent and 28 per cent in developed
countries (table I.1). These investment types are
crucial for the development of productive capacity
and infrastructure and for the prospects for a
sustainable recovery.
The sudden and simultaneous interaction of
supply- and demand-side shocks triggered a
cascade of effects. The slowdown in project
activity (across greenfield, project finance and
cross-border mergers and acquisitions (M&As))
resulted in a large drop in new equity flows (figure
I.2). Intracompany loans were negative in many
countries because of changes in financial positions
within MNEs in response to the crisis. Lower
earnings also affected reinvestment; the profits
of the largest MNEs plunged by 36 per cent on
average. Although reinvested earnings declined by
only 7 per cent overall, in many large host countries
they declined significantly. For example, reinvested
earnings of foreign affiliates in the United States fell
by 44 per cent. In other countries with significant
investment in commodity-related industries,
reinvested earnings suffered from the combined
effects of the pandemic and the plummeting oil
prices early in the year.
The impact of the pandemic on global investment
trends was immediate and concentrated in the
Table I.1. Announced greenfi eld projects, cross-border M&As and international project fi nance deals, by group of economies, 2019–2020
Group of economies Type of FDI
Value (Billions of dollars) Growth rate
NumberGrowth
rate2019 2020 (%) 2019 2020 (%)
Developed economiesCross-border M&As 424 379 -11 5 802 5 225 -10Greenfi eld projects 346 289 -16 10 331 8 376 -19International project fi nance 243 175 -28 543 587 8
Developing economiesCross-border M&As 82 84 2 1 201 907 -24Greenfi eld projects 454 255 -44 7 240 4 233 -42International project fi nance 365 170 -53 516 443 -14
Transition economiesCross-border M&As 1 12 716 115 69 -40Greenfi eld projects 46 20 -58 697 371 -47International project fi nance 26 21 -18 59 31 -47
Source: UNCTAD, cross-border M&A database (www.unctad.org/fdistatistics) for M&As, information from the Financial Times Ltd, fDi Markets (www.fDimarkets.com) for announced greenfield FDI projects and Refinitiv SA for international project finance deals.
Source: UNCTAD, FDI/MNE database (www.unctad.org/fdistatistics).
2020 2019
- 200
- 100
0
100
200
300
400
500
600
700
Equity Reinvested earnings Loans
-7%
-55%
Global FDI in�ows, by components, 2019 and 2020 (Billions of dollars and per cent)
Figure I.2.
4 World Investment Report 2021 Investing in Sustainable Recovery
Source: UNCTAD, cross-border M&A database (www.unctad.org/fdistatistics) for M&As, information from the Financial Times Ltd, fDi Markets (www.fDimarkets.com) for announced green�eld FDI projects and Re�nitiv SA for international project �nance deals.
2019 quarterly 2020 quarterly2019 average 2020 average
2020 Q12019 Q1 Q2 Q3 Q4 2021 Q1
2020 Q12019 Q1 Q2 Q3 Q4 2021 Q1
2020 Q12019 Q1 2021 Q1Q2 Q3 Q4
0
1 000
2 000
3 000
4 000
5 000
6 000
0
500
1 000
1 500
2 000
2 500
0
50
100
150
200
250
300
350
4 565
3 2431 780 1 550
280 265-29%
-13%-5%
a. Green�eld projects b. Cross-border M&As c. International project �nance deals
Announced green�eld projects, cross-border M&As and international project �nance deals, 2019 Q1–2021 Q1
Figure I.3.
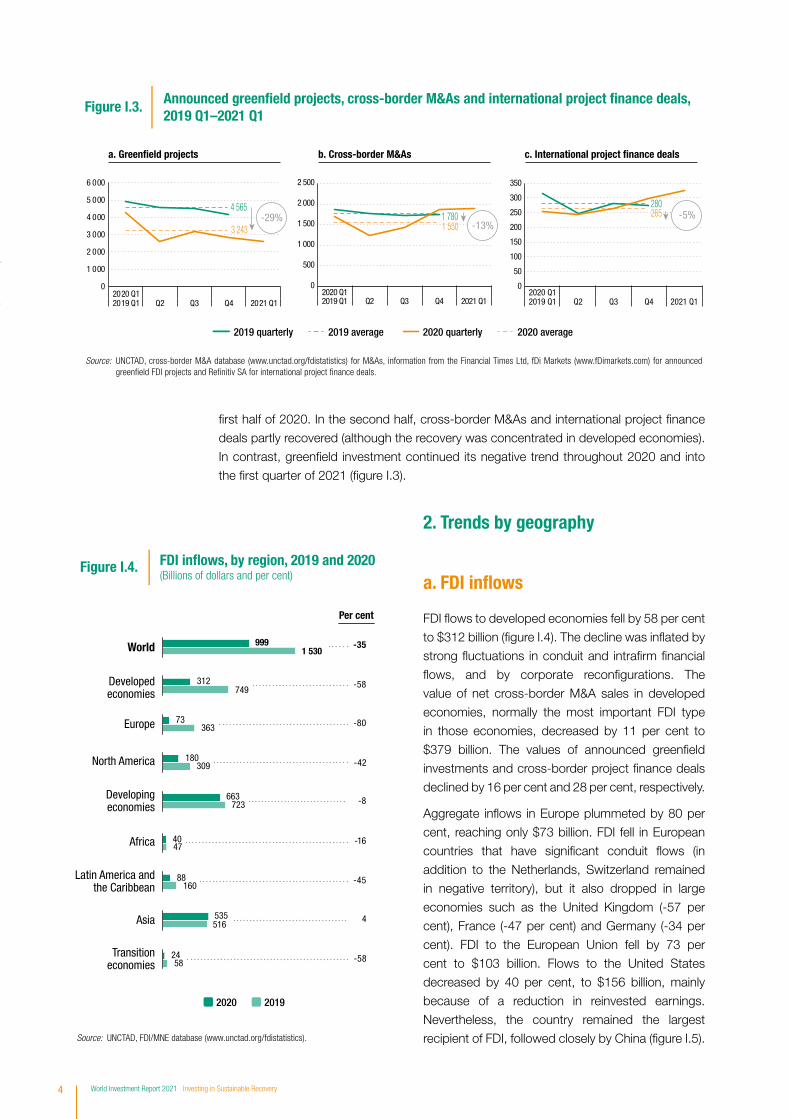
first half of 2020. In the second half, cross-border M&As and international project finance
deals partly recovered (although the recovery was concentrated in developed economies).
In contrast, greenfield investment continued its negative trend throughout 2020 and into
the first quarter of 2021 (figure I.3).
2. Trends by geography
a. FDI inflows
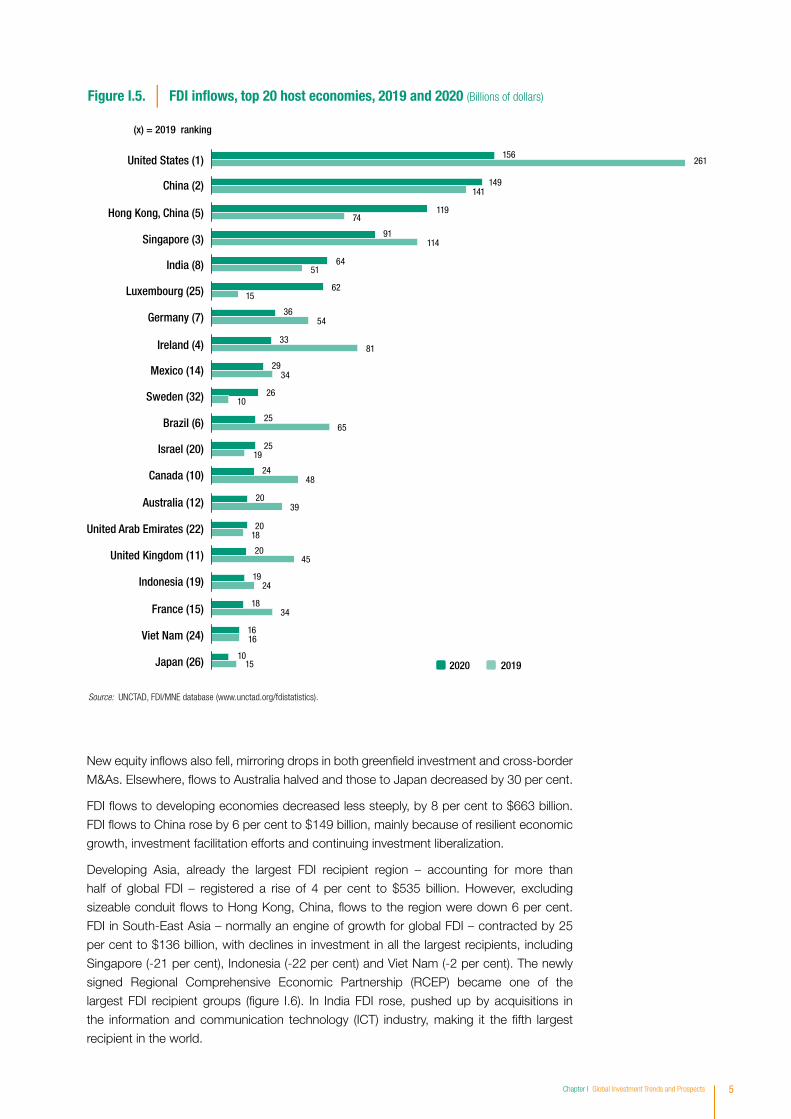
FDI flows to developed economies fell by 58 per cent
to $312 billion (figure I.4). The decline was inflated by
strong fluctuations in conduit and intrafirm financial
flows, and by corporate reconfigurations. The
value of net cross-border M&A sales in developed
economies, normally the most important FDI type
in those economies, decreased by 11 per cent to
$379 billion. The values of announced greenfield
investments and cross-border project finance deals
declined by 16 per cent and 28 per cent, respectively.
Aggregate inflows in Europe plummeted by 80 per
cent, reaching only $73 billion. FDI fell in European
countries that have significant conduit flows (in
addition to the Netherlands, Switzerland remained
in negative territory), but it also dropped in large
economies such as the United Kingdom (-57 per
cent), France (-47 per cent) and Germany (-34 per
cent). FDI to the European Union fell by 73 per
cent to $103 billion. Flows to the United States
decreased by 40 per cent, to $156 billion, mainly
because of a reduction in reinvested earnings.
Nevertheless, the country remained the largest
recipient of FDI, followed closely by China (figure I.5).
999
312
73
180
663
40
88
535
24
1 530
749
363
309
723
47
160
516
58
World
Developedeconomies
Europe
North America
Developingeconomies
Africa
Asia
Transitioneconomies
Latin America andthe Caribbean
Per cent
4
-35
-58
-80
-42
-8
-16
-45
-58
20192020
FDI in�ows, by region, 2019 and 2020 (Billions of dollars and per cent)
Figure I.4.
Source: UNCTAD, FDI/MNE database (www.unctad.org/fdistatistics).
Chapter I Global Investment Trends and Prospects 5
New equity inflows also fell, mirroring drops in both greenfield investment and cross-border
M&As. Elsewhere, flows to Australia halved and those to Japan decreased by 30 per cent.
FDI flows to developing economies decreased less steeply, by 8 per cent to $663 billion.
FDI flows to China rose by 6 per cent to $149 billion, mainly because of resilient economic
growth, investment facilitation efforts and continuing investment liberalization.
Developing Asia, already the largest FDI recipient region – accounting for more than
half of global FDI – registered a rise of 4 per cent to $535 billion. However, excluding
sizeable conduit flows to Hong Kong, China, flows to the region were down 6 per cent.
FDI in South-East Asia – normally an engine of growth for global FDI – contracted by 25
per cent to $136 billion, with declines in investment in all the largest recipients, including
Singapore (-21 per cent), Indonesia (-22 per cent) and Viet Nam (-2 per cent). The newly
signed Regional Comprehensive Economic Partnership (RCEP) became one of the
largest FDI recipient groups (figure I.6). In India FDI rose, pushed up by acquisitions in
the information and communication technology (ICT) industry, making it the fifth largest
recipient in the world.
Source: UNCTAD, FDI/MNE database (www.unctad.org/fdistatistics).
(x) = 2019 ranking
20192020
156
119
91
64
62
36
33
29
26
25
25
24
20
20
20
19
18
16
10
261
74
114
51
15
54
81
34
10
65
19
48
39
18
45
24
34
16
15
United States (1)
Hong Kong, China (5)
Singapore (3)
India (8)
Luxembourg (25)
Germany (7)
Ireland (4)
Mexico (14)
Sweden (32)
Brazil (6)
Israel (20)
Canada (10)
Australia (12)
United Arab Emirates (22)
United Kingdom (11)
Indonesia (19)
France (15)
Viet Nam (24)
Japan (26)
149141China (2)
FDI in�ows, top 20 host economies, 2019 and 2020 (Billions of dollars)Figure I.5.

6 World Investment Report 2021 Investing in Sustainable Recovery
FDI flows to Latin America and the Caribbean, Africa and transition economies tumbled as the collapse in export demand caused by the pandemic and a significant drop in commodity prices early in 2020 weighed heavily on their investment prospects. FDI in Latin America and the Caribbean dropped 45 per cent to $88 billion, the steepest decline among developing regions. Inflows to Brazil, Colombia, Chile and Peru plummeted while those to Mexico fell less sharply (by 15 per cent to $29 billion). FDI flows to Africa declined by 16 per cent in 2020 to $40 billion – a level last seen 15 years ago. Egypt remained the largest recipient in the region. In 2020, flows to the transition economies shrank by 58 per cent to $24 billion. Inflows plummeted in the Russian Federation, the largest economy of transition economies – from $32 billion in 2019 to $10 billion, reflecting its significant dependence on investment in the extractive industry.
b. FDI outflows
In 2020, MNEs from developed economies reduced their investment abroad by 56 per cent, to $347 billion. As a result, their share in global outward FDI dropped to a record low of 47 per cent. As with inflows, the decline in investment by major investor economies was exacerbated by strong volatility in conduit flows.
Aggregate outward investment by European MNEs (including large negative flows) fell by 80 per cent to $74 billion – the lowest amount since 1987. This fall was driven by sharp declines in outflows from the Netherlands, Germany, Ireland and the United Kingdom. Outflows from the Netherlands – normally among the largest source countries in Europe – dropped by $246 billion to -$161 billion, owing to corporate reconfigurations and holding-company liquidations. Despite several sizeable acquisitions abroad by German MNEs, large withdrawals of loans (-$55 billion) reduced FDI outflows by 75 per cent. In the United Kingdom, outflows declined from -$6 billion to -$33 billion, with continued large negative reinvested earnings. In addition, MNEs from the United Kingdom divested some of their assets abroad. For example, Tesco sold its stores in Thailand for $9.9 billion and Vodafone unloaded its tower assets in Italy for $5.8 billion.
624
405
305
343
299
912
344
263
209
207
59.061.5
26.233.9
19.725.9
22.220.6
19.320.4
G20
RCEP
BRICS
USMCA
CPTPP
2019–2020change (%)
Share in world FDI in�ows (%)
-31.6
-15.1
-13.7
-39.1
-30.7
4538 2.9
3.7AfCFTA -15.4
20192020
FDI in�ows in selected groups, 2019 and 2020 (Billions of dollars and per cent)
Figure I.6.
Source: UNCTAD, FDI/MNE database (www.unctad.org/fdistatistics).Note: G20 includes only the 19 member countries (excluding the European Union); AfCFTA = African Continental Free Trade Area; BRICS = Brazil, Russian Federation, India, China and South Africa; CPTPP = Comprehensive and Progressive Agreement for Trans-Paci�cPartnership; RCEP = Regional Comprehensive Economic Partnership; USMCA = United States–Mexico–Canada Agreement.
Chapter I Global Investment Trends and Prospects 7
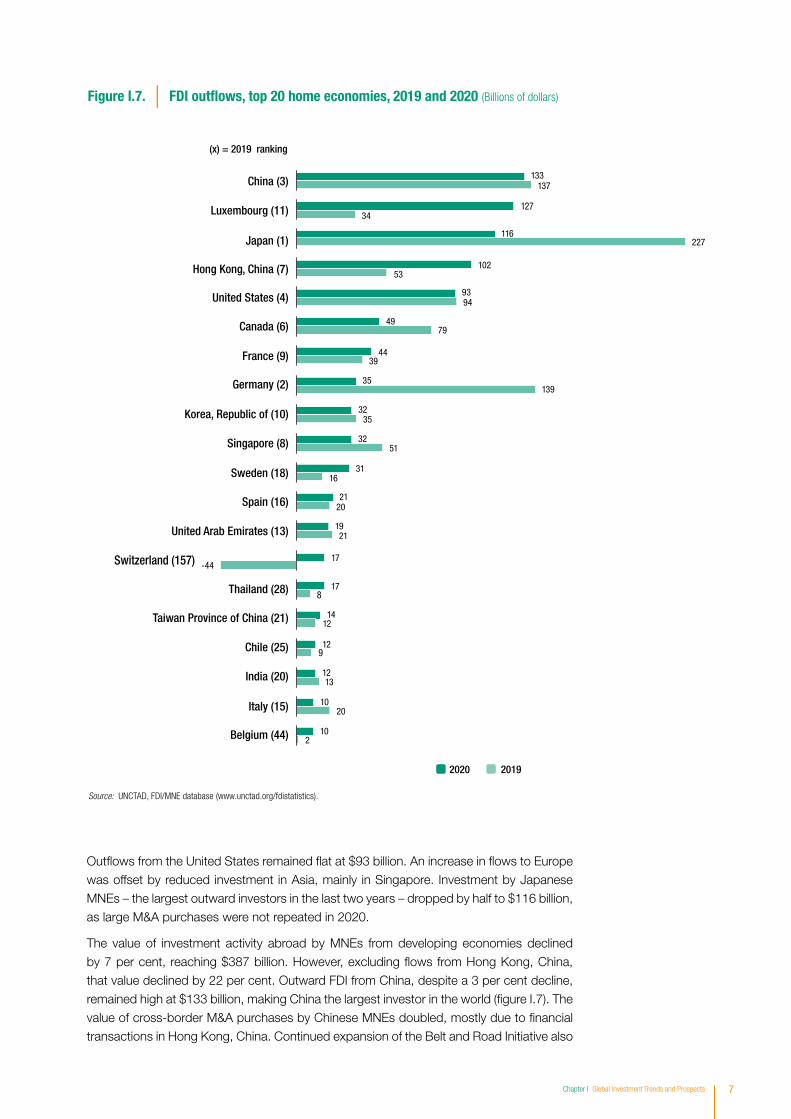
Outflows from the United States remained flat at $93 billion. An increase in flows to Europe was offset by reduced investment in Asia, mainly in Singapore. Investment by Japanese MNEs – the largest outward investors in the last two years – dropped by half to $116 billion, as large M&A purchases were not repeated in 2020.
The value of investment activity abroad by MNEs from developing economies declined by 7 per cent, reaching $387 billion. However, excluding flows from Hong Kong, China, that value declined by 22 per cent. Outward FDI from China, despite a 3 per cent decline, remained high at $133 billion, making China the largest investor in the world (figure I.7). The value of cross-border M&A purchases by Chinese MNEs doubled, mostly due to financial transactions in Hong Kong, China. Continued expansion of the Belt and Road Initiative also
Source: UNCTAD, FDI/MNE database (www.unctad.org/fdistatistics).
20192020
133
127
116
102
93
49
44
35
32
32
31
21
19
17
17
14
12
12
10
10
137
34
227
53
94
79
39
139
35
51
16
20
21
-44
8
12
9
13
20
2
China (3)
Luxembourg (11)
Japan (1)
Hong Kong, China (7)
United States (4)
Canada (6)
France (9)
Germany (2)
Korea, Republic of (10)
Singapore (8)
Sweden (18)
Spain (16)
United Arab Emirates (13)
Switzerland (157)
Thailand (28)
Taiwan Province of China (21)
Chile (25)
India (20)
Italy (15)
Belgium (44)
(x) = 2019 ranking
FDI out�ows, top 20 home economies, 2019 and 2020 (Billions of dollars)Figure I.7.
8 World Investment Report 2021 Investing in Sustainable Recovery
led to resilient FDI outflows amid the pandemic. Outflows from South-East Asia decreased by 16 per cent to $61 billion. Flows from Singapore dropped by 36 per cent, to $32 billion, with most investment going to other countries of the Association of Southeast Asian Nations (ASEAN). In contrast, outward FDI from Thailand more than doubled to $17 billion, mostly in financial services and manufacturing in neighbouring countries. Thai companies actively pursued cross-border M&A purchases (for instance, Bangkok Bank acquired Bank Permata in Indonesia for $2.3 billion).
Outward investment by Latin American MNEs collapsed in 2020, recording an overall disinvestment of -$3.5 billion, for the first time ever. The decline in value (of about $50 billion) was caused mostly by continued negative outflows from Brazil (-$26 billion), resulting from MNEs raising funds through their overseas subsidiaries and from a 41 per cent decrease of outward FDI from Mexico. Outflows from Chile, in contrast, rose by 25 per cent to $12 billion, as Chilean MNEs increased loans to their foreign affiliates abroad.
In 2020, FDI outflows from transition economies fell by 76 per cent to $6 billion, mostly driven by reduced investment overseas by Russian MNEs in extractive industries because of lower reinvested earnings (-83 per cent).
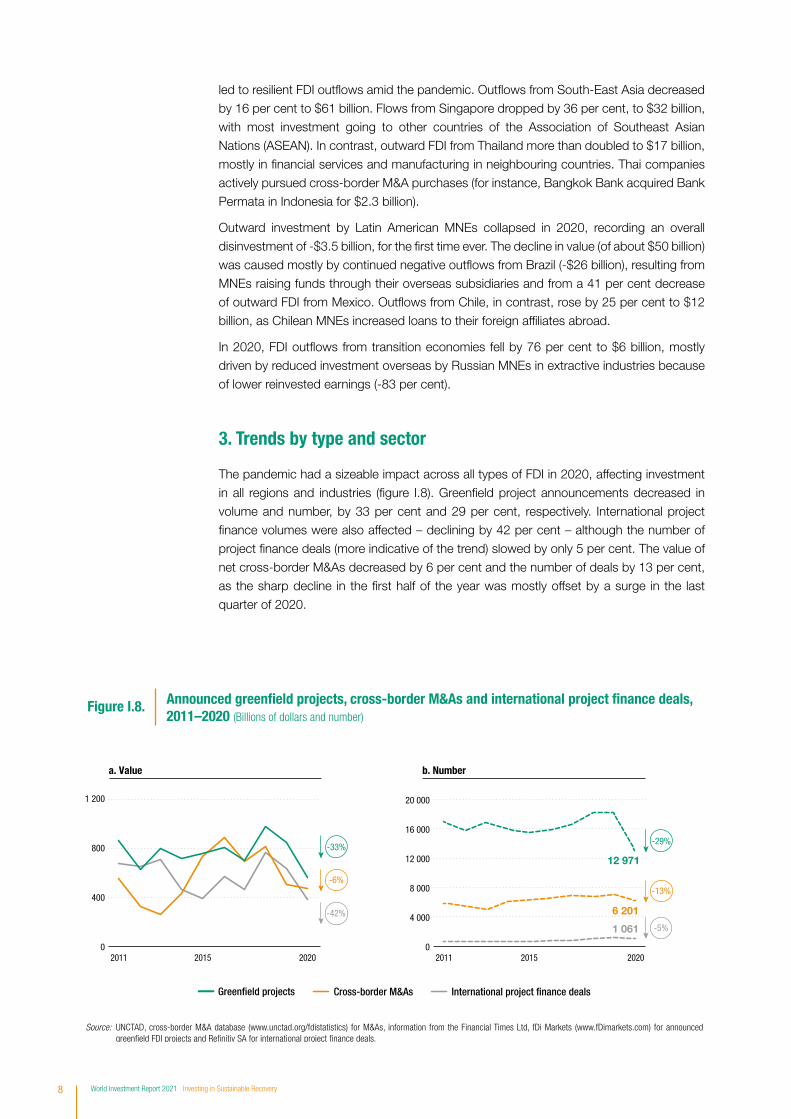
3. Trends by type and sector
The pandemic had a sizeable impact across all types of FDI in 2020, affecting investment in all regions and industries (figure I.8). Greenfield project announcements decreased in volume and number, by 33 per cent and 29 per cent, respectively. International project finance volumes were also affected – declining by 42 per cent – although the number of project finance deals (more indicative of the trend) slowed by only 5 per cent. The value of net cross-border M&As decreased by 6 per cent and the number of deals by 13 per cent, as the sharp decline in the first half of the year was mostly offset by a surge in the last quarter of 2020.
Source: UNCTAD, cross-border M&A database (www.unctad.org/fdistatistics) for M&As, information from the Financial Times Ltd, fDi Markets (www.fDimarkets.com) for announced green�eld FDI projects and Re�nitiv SA for international project �nance deals.
Green�eld projects Cross-border M&As International project �nance deals
a. Value b. Number
12 971
6 201
1 061
0
4 000
8 000
12 000
16 000
20 000
2011 2015 20200
400
800
1 200
2011 2015 2020
-42%
-6%
-33%
-5%
-13%
-29%
Figure I.8. Announced green�eld projects, cross-border M&As and international project �nance deals,2011–2020 (Billions of dollars and number)

Chapter I Global Investment Trends and Prospects 9
a. Greenfield investment trends
The value of announced greenfield investment projects fell to $564 billion in 2020 (table I.2), the lowest level ever recorded. The geographical focus of foreign investors shifted to developed economies. Consequently, developing countries faced an unprecedented downturn in greenfield FDI projects.
The importance of the primary sector continued to wane. The aggregate value of announced greenfield projects in the sector halved to $11 billion, representing less than 2 per cent of the total. More than half of that value came from a single $6.4 billion project in oil and gas extraction in Australia, announced by Royal Dutch Shell (Netherlands–United Kingdom).
The contraction in the number of greenfield project announcements was most pronounced in the manufacturing sector. The services sector, which represents half of the value of global greenfield projects in 2019, was less affected.
Greenfield announcements in energy generation and distribution decreased by 13 per cent to $99 billion, as foreign investors continued to invest more in renewable energy power projects than in projects based on fossil fuels. Projects in renewable energy, which hit a record high in terms of both value and number in 2019, were not immune from the global economic shock but showed resilience. Greenfield investment in renewables declined by only 5 per cent in value, to $88 billion, across 507 projects. All but one of the 10 highest-value energy projects announced by foreign investors in 2020 were in the renewable energy industry.
The pandemic boosted demand for digital infrastructure and services globally. This led to higher values of greenfield FDI project announcements targeting the ICT industry, rising by more than 22 per cent to $81 billion. Although the number of announced projects decreased by 13 per cent, the ICT industry attracted the largest share of projects. Major project announcements in this industry included a $6 billion deal by Telefónica (Spain) to build a fibre-optic network in Germany, a $2.8 billion investment by Amazon (United States) in ICT infrastructure in India and a $1.8 billion investment by Alphabet (United States) in Poland through Google.
Table I.2. Announced greenfi eld projects, by sector and selected industries, 2019–2020
Value (Billions of dollars) Growth rate
NumberGrowth rate
Sector/industry 2019 2020 (%) 2019 2020 (%)
Total 846 564 -33 18 261 12 971 -29Primary 21 11 -47 151 100 -34
Manufacturing 402 237 -41 8 180 5 139 -37
Services 422 315 -25 9 930 7 732 -22
Top 10 industries in value termsEnergy and gas supply 113 99 -13 560 529 -6
Information and communication 66 81 22 3 332 2 903 -13
Electronics and electrical equipment 53 46 -14 1 201 862 -28
Chemicals 47 40 -15 752 442 -41
Construction 66 35 -47 437 319 -27
Automotive 62 33 -47 1 022 558 -45
Coke and refi ned petroleum 94 30 -69 109 54 -50
Transportation and storage 43 26 -39 764 627 -18
Trade 22 23 5 688 572 -17
Finance and insurance 24 19 -19 1 028 715 -30
Source: UNCTAD, based on information from the Financial Times Ltd, fDi Markets (www.fDimarkets.com).

10 World Investment Report 2021 Investing in Sustainable Recovery
Greenfield project announcements in manufacturing industries registered a 41 per cent decline to $237 billion. In developing economies, where such investments are most important for industrial development, the decline mirrored the global trend, with a 42 per cent fall to $129 billion. Manufacturing projects remained concentrated in Asia ($101 billion) (figure I.9).
The energy price shock early in 2020 also affected resource-based processing industries, halving the number of investment announcements in coke and refined petroleum and reducing the value of announced projects by a third, to $30 billion. Nevertheless, several large projects were announced in this sector, among them one by Hengyi Group (China) for an investment exceeding $13 billion to build a refinery and petrochemical complex in Brunei Darussalam.
The number of new projects almost halved in the automotive and chemical industries as well. However, despite the decline worldwide, several large-scale investments in basic chemicals projects contributed to a minor increase in the value of projects in developing countries. The downward pressure on the value of announced investments in manufacturing was mitigated in part by significant projects in semiconductors and batteries for transport equipment. TSMC (Taiwan Province of China) announced an investment of $12 billion in a chip factory in the United States. Announcements of battery investments included $5.1 billion by Contemporary Amperex Technology (China) in Indonesia, $2.3 billion by Honeycomb Energy Technology (China) in Germany and $2.2 billion by Groupe PSA (France), also in Germany.
Natural resources-related industries Lower-skill industries Higher-skill industries
Source: UNCTAD, based on information from the Financial Times Ltd, fDi Markets (www.fDimarkets.com).Note: Natural resources-related industries include (i) coke, petroleum products and nuclear fuel; (ii) metals and metal products; (iii) non-metallic mineral products; and (iv) wood and wood products. Lower-skill industries include (i) food, beverages and tobacco and (ii) textiles, clothing and leather; higher-skill industries include all other manufacturing industries.
0
20
40
60
80
100
120
140
160
180
2007–2016 2017–2019Africa
2020 2007–2016 2017–2019Latin America
and theCaribbean
2020 2007–2016 2017–2019Asia
2020
-75% -46%
-40%
Figure I.9. Developing economies: announced FDI green�eld projects in manufacturing by value (Billions of dollars and per cent)
Table I.3. Announced international project fi nance deals, selected industries, 2019–2020
Value (Billions of dollars) Growth rate
NumberGrowth rate
Industry 2019 2020 (%) 2019 2020 (%)
Total 634 367 -42 1 118 1 061 -5
Top 10 industries by numberRenewable energy 179 167 -7 644 689 7
Energy 45 27 -40 95 68 -28
Oil and gas 151 33 -78 74 62 -16
Transport infrastructure 86 35 -59 66 49 -26
Mining 41 12 -72 71 46 -35
Telecommunication 65 31 -53 26 42 62
Residential/commercial real estate 18 10 -44 50 34 -32
Industrial real estate 18 36 101 36 30 -17
Water and sewerage 5 4 -25 22 19 -14
Petrochemicals 15 12 -19 12 16 33
Source: UNCTAD, based on data from Refinitiv SA.

Chapter I Global Investment Trends and Prospects 11
b. International project finance trends
International project finance activity was less affected by the crisis than greenfield investment, with a decline of only 5 per cent in the number of new projects. However, the relative resilience of project finance was due only to continued growth in renewable energy projects, which constitute more than half of project finance deals. The pandemic affected international deals more than projects led by domestic sponsors, as overall project finance activity remained stable. Greater risk aversity among international sponsors, often involved in the largest projects, led to a decline in total project values of 42 per cent, to $367 billion (table I.3) – the lowest level since 2003.
International project finance announcements in the oil and gas industry decreased by 78 per cent in value and 16 per cent in number compared with 2019. Within this industry, the most drastic contraction across developing regions was reported in Asia, where the value of announced investment fell from $68 billion to $17 billion, although the number of deals increased by 20 per cent.
In value terms, most project finance is in infrastructure – including transport infrastructure, power generation and distribution, and other utilities. The pandemic recovery and stimulus packages adopted in developed countries and regions, which focused largely on infrastructure, are therefore expected to provide a boost to international project finance. Infrastructure project finance in 2020 increased in telecommunication (62 per cent) but declined significantly in other key industries: energy (-28 per cent) and transport (-26 per cent).
The value of energy infrastructure projects fell to the lowest point in eight years (-40 per cent to $27 billion). Asia was the only region reporting growth, in both number and value of projects. Two major ones were announced in Viet Nam: a $5 billion gas-fired power plant proposed by ExxonMobil (United States) and a $2.2 billion coal-fired power plant developed by Thai MNEs in the Quang Tri Economic Zone.
Telecommunication investment increased broadly because of the pandemic-induced acceleration in digital adoption; however, this increase was not reflected in project finance announcements in ICT infrastructure in developing countries. The value of those announcements fell from $57 billion in 2019 to less than $7 billion (the 2019 value was inflated by a single large megaproject).
Table I.3. Announced international project fi nance deals, selected industries, 2019–2020
Value (Billions of dollars) Growth rate
NumberGrowth rate
Industry 2019 2020 (%) 2019 2020 (%)
Total 634 367 -42 1 118 1 061 -5
Top 10 industries by numberRenewable energy 179 167 -7 644 689 7
Energy 45 27 -40 95 68 -28
Oil and gas 151 33 -78 74 62 -16
Transport infrastructure 86 35 -59 66 49 -26
Mining 41 12 -72 71 46 -35
Telecommunication 65 31 -53 26 42 62
Residential/commercial real estate 18 10 -44 50 34 -32
Industrial real estate 18 36 101 36 30 -17
Water and sewerage 5 4 -25 22 19 -14
Petrochemicals 15 12 -19 12 16 33
Source: UNCTAD, based on data from Refinitiv SA.
12 World Investment Report 2021 Investing in Sustainable Recovery
In transport infrastructure, the 59 per cent decline in the value of announced investment was due to the smaller number of large-scale projects. With larger deals becoming more difficult to close in higher-risk environments, the number of projects exceeding $1 billion dropped by more than half (from 18 in 2019 to just 8 in 2020). In developed economies, the value of investment more than halved to $17 billion, despite an increase in the number of projects. In developing regions, only Africa registered an increase in the value of such projects, to $14 billion, owing to an $11 billion railway project announced in Zambia.
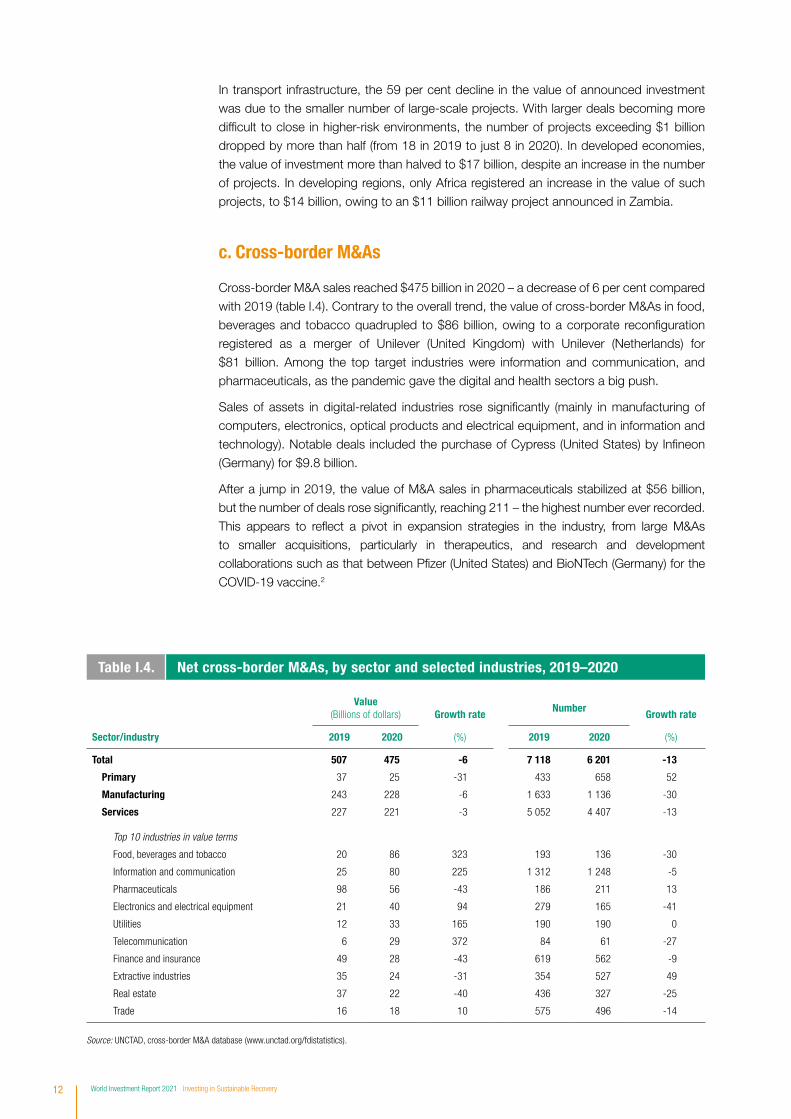
c. Cross-border M&As
Cross-border M&A sales reached $475 billion in 2020 – a decrease of 6 per cent compared with 2019 (table I.4). Contrary to the overall trend, the value of cross-border M&As in food, beverages and tobacco quadrupled to $86 billion, owing to a corporate reconfiguration registered as a merger of Unilever (United Kingdom) with Unilever (Netherlands) for $81 billion. Among the top target industries were information and communication, and pharmaceuticals, as the pandemic gave the digital and health sectors a big push.
Sales of assets in digital-related industries rose significantly (mainly in manufacturing of computers, electronics, optical products and electrical equipment, and in information and technology). Notable deals included the purchase of Cypress (United States) by Infineon (Germany) for $9.8 billion.
After a jump in 2019, the value of M&A sales in pharmaceuticals stabilized at $56 billion, but the number of deals rose significantly, reaching 211 – the highest number ever recorded. This appears to reflect a pivot in expansion strategies in the industry, from large M&As to smaller acquisitions, particularly in therapeutics, and research and development collaborations such as that between Pfizer (United States) and BioNTech (Germany) for the COVID-19 vaccine.2
Table I.4. Net cross-border M&As, by sector and selected industries, 2019–2020
Value (Billions of dollars) Growth rate
NumberGrowth rate
Sector/industry 2019 2020 (%) 2019 2020 (%)
Total 507 475 -6 7 118 6 201 -13
Primary 37 25 -31 433 658 52
Manufacturing 243 228 -6 1 633 1 136 -30
Services 227 221 -3 5 052 4 407 -13
Top 10 industries in value terms
Food, beverages and tobacco 20 86 323 193 136 -30
Information and communication 25 80 225 1 312 1 248 -5
Pharmaceuticals 98 56 -43 186 211 13
Electronics and electrical equipment 21 40 94 279 165 -41
Utilities 12 33 165 190 190 0
Telecommunication 6 29 372 84 61 -27
Finance and insurance 49 28 -43 619 562 -9
Extractive industries 35 24 -31 354 527 49
Real estate 37 22 -40 436 327 -25
Trade 16 18 10 575 496 -14
Source: UNCTAD, cross-border M&A database (www.unctad.org/fdistatistics).

Chapter I Global Investment Trends and Prospects 13
In developed countries, where cross-border M&As are a significant part of total FDI, the
value of deals decreased by 11 per cent, mostly in North America (-40 per cent) while
in Europe the increase of 25 per cent was inflated by the corporate reconfiguration in
the Netherlands.
In the primary sector (mainly in mining, quarrying and petroleum), M&A values fell by 31
per cent. Over the past decade, M&As in the sector have contracted steadily, reflecting a
continued trend of reduced investment in the upstream activities of the oil and gas industry.
Several large divestments were registered in the primary sector in 2020. For example, BP
(United Kingdom) sold its Alaska business to Hilcorp (United States) for $5.6 billion, and
Mubadala (United Arab Emirates) divested its shares in Borealis to OMV (Austria) for $4.7
billion. In developing Asia and in transition economies, however, the value M&A sales in the
sector still increased.
4. SDG investment trends in developing economies
The pandemic is exacerbating the SDG investment gap, particularly in LDCs and other
structurally weak economies. SDG-relevant greenfield investment in developing regions
is now 33 per cent lower than before the pandemic, and international project finance is
down by 42 per cent. This decline is much larger in developing countries than in developed
countries. Gains in investment in renewable energy and digital infrastructure in developed
economies reflect the asymmetric effect that public support packages will have on global
SDG investment trends. The drop in foreign investment may reverse the progress achieved
in promoting SDG investment in recent years, posing a risk to delivering the 2030 agenda
for sustainable development and to sustained post-pandemic recovery.
Greenfield and project finance investment activity fell markedly, with all but one of the
SDG investment sectors (renewable energy) registering double-digit declines from
the pre-COVID level (table I.5).
Table I.5. The pandemic impact on investment in SDGs: announced greenfi eld and project fi nance, change in value, 2019–2020 (Per cent)
InfrastructureTransport infrastructure, power generation and distribution (except renewables), telecommunication
-54HealthInvestment in health infrastructure, e.g. new hospitals
-54
Renewable energyInstallations for renewable energy generation, all sources
-8Food and agricultureInvestment in agriculture, research, rural development
-49
WASHProvision of water and sanitation to industry and households
-67EducationInfrastructural investment, e.g. new schools
-35
Source: UNCTAD.

14 World Investment Report 2021 Investing in Sustainable Recovery
a. Greenfield investment
In developing and transition economies, the positive trends in the pre-pandemic period were reversed by the COVID-19 crisis, except in the telecommunication sector. The number of announced greenfield projects was growing at a rate of 4 per cent annually in the pre-pandemic period (2015–2019), mostly led by the transport, telecommunication, WASH and education sectors (table I.6). The shock also worsened trends in sectors that were already struggling before the pandemic, such as power, food and agriculture and health.
The decline in the overall value of greenfield projects in LDCs was less pronounced, but the impact could be more detrimental than in other developing countries. Greenfield investment in food and agriculture (including processing industries), an important investment sector in LDCs, registered a drop of 91 per cent.3 This raises additional concerns about the impact in the poorest economies around the world and confirms the urgency to further mobilize investment for basic needs.
Table I.6. Announced greenfi eld projects in SDG sectors (Millions of dollars and per cent)
Developing and transition economies LDCs
SDG-relevant sector
Pre-pandemic trenda
(%)2019 2020
Pandemic impactb
(%)
Pre-pandemic trenda
(%)2019 2020
Pandemic impactb
(%)
Total
Value -5 137 192 92 266 -33 -8 12 711 9 808 -23
Number of projects 4 1 727 1 157 -33 -5 106 73 -31
Powerc
Value -23 18 144 10 571 -42 -32 1 480 3 446 133
Number of projects -10 29 15 -48 -19 3 3 -
Renewable energy
Value -5 42 594 30 180 -29 -21 2 030 3 204 58
Number of projects 5 259 195 -25 -3 15 20 33
Transport services
Value 9 27 115 11 221 -59 31 3 627 756 -79
Number of projects 2 347 196 -44 6 36 15 -58
Telecommunicationd
Value 6 19 107 24 197 27 -34 255 1 896 642
Number of projects 4 322 250 -22 -32 6 20 233
Water, sanitation and hygiene (WASH)
Value 4 1 894 598 -68 .. 61 - -100
Number of projects 4 19 7 -63 .. 1 - -100
Food and agriculture
Value -2 20 815 10 846 -48 19 4 703 408 -91
Number of projects 3 386 268 -31 -4 23 7 -70
Health
Value -6 6 252 3 840 -39 -15 419 77 -82
Number of projects 7 286 165 -42 4 14 5 -64
Education
Value 12 1 271 812 -36 22 137 21 -85
Number of projects 3 79 61 -23 -3 8 3 -63
Source: UNCTAD, based on Financial Times Ltd, fDi Markets (www.fdimarkets.com).a Compound annual growth rate (CAGR) for 2015–2019. b Changes from 2019 to 2020.c Excluding renewable energy. d Including information services activities.
Chapter I Global Investment Trends and Prospects 15
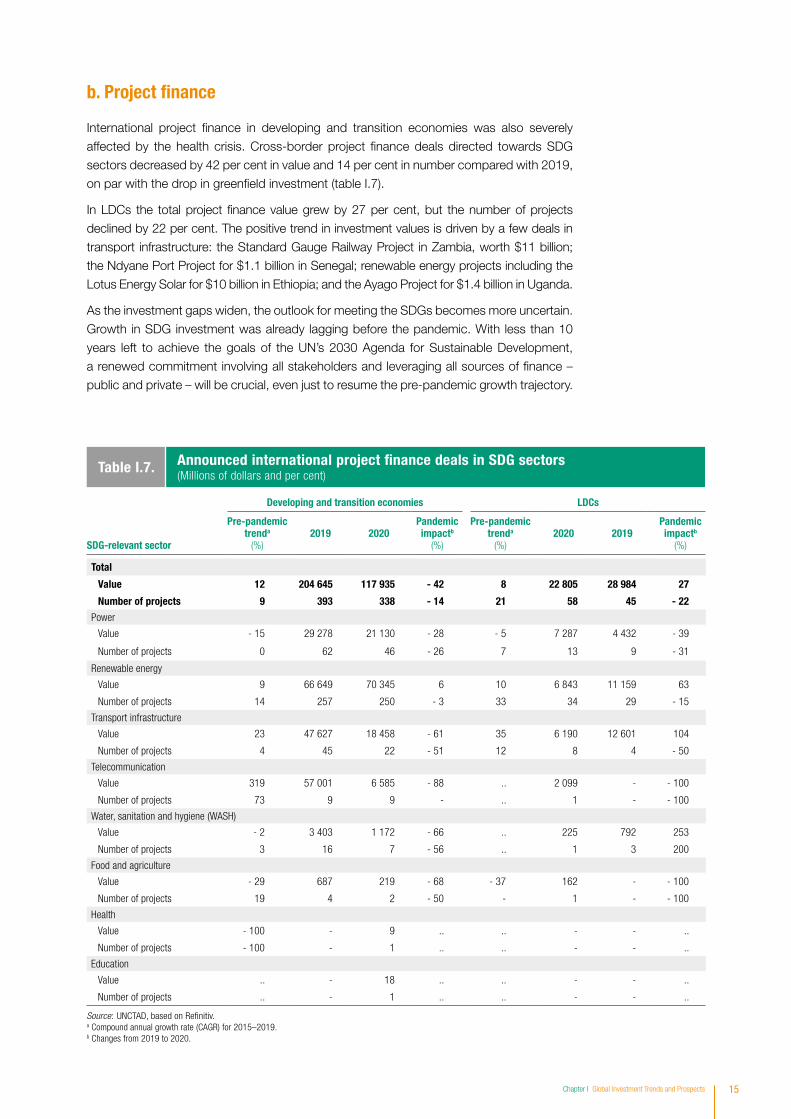
b. Project finance
International project finance in developing and transition economies was also severely affected by the health crisis. Cross-border project finance deals directed towards SDG sectors decreased by 42 per cent in value and 14 per cent in number compared with 2019, on par with the drop in greenfield investment (table I.7).
In LDCs the total project finance value grew by 27 per cent, but the number of projects declined by 22 per cent. The positive trend in investment values is driven by a few deals in transport infrastructure: the Standard Gauge Railway Project in Zambia, worth $11 billion; the Ndyane Port Project for $1.1 billion in Senegal; renewable energy projects including the Lotus Energy Solar for $10 billion in Ethiopia; and the Ayago Project for $1.4 billion in Uganda.
As the investment gaps widen, the outlook for meeting the SDGs becomes more uncertain. Growth in SDG investment was already lagging before the pandemic. With less than 10 years left to achieve the goals of the UN’s 2030 Agenda for Sustainable Development, a renewed commitment involving all stakeholders and leveraging all sources of finance – public and private – will be crucial, even just to resume the pre-pandemic growth trajectory.
Table I.6. Announced greenfi eld projects in SDG sectors (Millions of dollars and per cent)
Developing and transition economies LDCs
SDG-relevant sector
Pre-pandemic trenda
(%)2019 2020
Pandemic impactb
(%)
Pre-pandemic trenda
(%)2019 2020
Pandemic impactb
(%)
Total
Value -5 137 192 92 266 -33 -8 12 711 9 808 -23
Number of projects 4 1 727 1 157 -33 -5 106 73 -31
Powerc
Value -23 18 144 10 571 -42 -32 1 480 3 446 133
Number of projects -10 29 15 -48 -19 3 3 -
Renewable energy
Value -5 42 594 30 180 -29 -21 2 030 3 204 58
Number of projects 5 259 195 -25 -3 15 20 33
Transport services
Value 9 27 115 11 221 -59 31 3 627 756 -79
Number of projects 2 347 196 -44 6 36 15 -58
Telecommunicationd
Value 6 19 107 24 197 27 -34 255 1 896 642
Number of projects 4 322 250 -22 -32 6 20 233
Water, sanitation and hygiene (WASH)
Value 4 1 894 598 -68 .. 61 - -100
Number of projects 4 19 7 -63 .. 1 - -100
Food and agriculture
Value -2 20 815 10 846 -48 19 4 703 408 -91
Number of projects 3 386 268 -31 -4 23 7 -70
Health
Value -6 6 252 3 840 -39 -15 419 77 -82
Number of projects 7 286 165 -42 4 14 5 -64
Education
Value 12 1 271 812 -36 22 137 21 -85
Number of projects 3 79 61 -23 -3 8 3 -63
Source: UNCTAD, based on Financial Times Ltd, fDi Markets (www.fdimarkets.com).a Compound annual growth rate (CAGR) for 2015–2019. b Changes from 2019 to 2020.c Excluding renewable energy. d Including information services activities.
Table I.7. Announced international project fi nance deals in SDG sectors (Millions of dollars and per cent)
Developing and transition economies LDCs
SDG-relevant sector
Pre-pandemic trenda
(%)2019 2020
Pandemic impactb
(%)
Pre-pandemic trenda
(%)2020 2019
Pandemic impactb
(%)
Total
Value 12 204 645 117 935 - 42 8 22 805 28 984 27
Number of projects 9 393 338 - 14 21 58 45 - 22
Power
Value - 15 29 278 21 130 - 28 - 5 7 287 4 432 - 39
Number of projects 0 62 46 - 26 7 13 9 - 31
Renewable energy
Value 9 66 649 70 345 6 10 6 843 11 159 63
Number of projects 14 257 250 - 3 33 34 29 - 15
Transport infrastructure
Value 23 47 627 18 458 - 61 35 6 190 12 601 104
Number of projects 4 45 22 - 51 12 8 4 - 50
Telecommunication
Value 319 57 001 6 585 - 88 .. 2 099 - - 100
Number of projects 73 9 9 - .. 1 - - 100
Water, sanitation and hygiene (WASH)
Value - 2 3 403 1 172 - 66 .. 225 792 253
Number of projects 3 16 7 - 56 .. 1 3 200
Food and agriculture
Value - 29 687 219 - 68 - 37 162 - - 100
Number of projects 19 4 2 - 50 - 1 - - 100
Health
Value - 100 - 9 .. .. - - ..
Number of projects - 100 - 1 .. .. - - ..
Education
Value .. - 18 .. .. - - ..
Number of projects .. - 1 .. .. - - ..
Source: UNCTAD, based on Refi nitiv.a Compound annual growth rate (CAGR) for 2015–2019.b Changes from 2019 to 2020.

16 World Investment Report 2021 Investing in Sustainable Recovery
1. Global prospects
Global FDI flows are expected to bottom out in 2021 and recover some lost ground with an increase of 10–15 per cent. This would still leave FDI some 25 per cent below the 2019 level and more than 40 per cent below the recent peak in 2016 (figure I.10). Current forecasts show a further increase in 2022 which, at the upper bound of the projections, could bring FDI back to the 2019 level of $1.5 trillion.
The relatively modest recovery in global FDI projected for 2021 reflects lingering uncertainty about access to vaccines, the emergence of virus mutations and delays in the reopening of economic sectors. As FDI tends to trail other macroeconomic indicators after a shock, a full and broad-based recovery in flows to pre-pandemic levels is expected to take longer. This is despite expectations of a boom in capital expenditures by MNEs as a result of a peak in cash holdings and pent-up spending plans (for details, see section I.C). Increased expenditures on both fixed assets (e.g. machinery and equipment) and intangibles will not translate directly into a rapid FDI rebound, as confirmed by the sharp contrast between rosy forecasts for capital expenditures and still depressed greenfield project announcements.
Moreover, the FDI recovery will be uneven. Developed economies are expected to drive global growth in FDI, both because of strong cross-border M&A activity and large-scale public investment support. FDI inflows to Asia will remain resilient; the region has stood out as an attractive destination for international investment throughout the pandemic.
B. FDI PROSPECTS
Source: UNCTAD forecasting model.
Central projection
800
1 000
1 200
1 400
1 600
1 800
2 000
2 200
2015 2016 2017 2018 2019 2020 2021 2022
Figure I.10. Global FDI in�ows, 2015–2020 and 2021–2022 forecast (Billions of dollars)

Chapter I Global Investment Trends and Prospects 17
A substantial recovery of FDI to Africa and to Latin America and the Caribbean is unlikely in the near term. These regions have more structural weaknesses and less fiscal space, and they are more dependent on greenfield investment, which is expected to remain weak in 2021.
Early indicators – FDI projects in the first months of 2021 – confirm diverging trajectories between cross-border M&As, largely driven by financial market dynamics, and greenfield projects. After fully recovering in the second half of 2020, cross-border M&A activity remained broadly stable in the first quarter of 2021. Notably, both the number and the value of newly announced M&A deals are on the increase in 2021, suggesting a potential surge in M&A activity later in the year. Announced greenfield investment is not showing signs of recovery yet; after a significant contraction in 2020, it remained weak in early 2021.
The modest growth forecast for 2021 – to about $1.1–1.2 trillion – would still put global FDI flows slightly above the range projected this time last year (WIR20). (At the time, the forecast for 2020 was fully in line with the actual trend, at -35 per cent.)4 The upward revision is supported by several factors. Despite delays and setbacks, the deployment of vaccines will allow more and more countries to ease restrictions during the course of 2021. Excess savings by households and pent-up consumer demand are expected to drive growth, especially in wealthier economies. This will have positive spillovers for trade in goods and for commodity prices, which are both increasing. The anticipated growth spurt will likely raise corporate profitability, with a positive effect on the reinvested earnings component of FDI.
Moreover, governments in developed countries and higher-income emerging markets have responded to the COVID-19 crisis with large fiscal stimulus programmes, mostly in the form of transfers to distressed households and firms. As current measures wind down, both the European Union and the United States have pushed forward public investment strategies. Such measures will have a positive effect on FDI, particularly in the infrastructure, green and digital economy sectors. In addition, low borrowing costs and buoyant financial markets worldwide are pushing up cross-border M&A activity. The withdrawal of immediate fiscal support measures may also lead to a spike in M&As as distressed firms seek buyouts.
Supporting the upward revision of the forecast, global output and trade were more resilient than expected over 2020, so the outlook for 2021 has improved in recent months. The estimated contraction of the global economy in 2020 (at -3.3 per cent) is about one percentage point smaller than projected in the October 2020 World Economic Outlook of the International Monetary Fund (IMF); also, the latest forecast growth of global output for 2021 (from April) has been increased by 0.8 percentage points relative to the forecast of October 2020. Following a similar path, the World Trade Organization’s 2021 projection for global merchandise trade volume has also been revised upwards by 0.8 percentage points relative to October, after better-than-expected results in 2020. The expectation is now that trade will recover to pre-crisis levels by the end of 2021.
Current projections suggest that FDI will increase a further 15–20 per cent in 2022, up to $1.4 trillion. This would imply that FDI will largely recover by the end of 2022 in the baseline forecast, which assumes continued improvement in the health and economic situations over the next two years. The most optimistic upper-bound scenario implies the absence of subsequent regional or global crisis relapses, as well as rapid economic growth and high investor confidence. Under these conditions, FDI could fully recover to its pre-pandemic level of about $1.5 trillion by 2022. The lower-bound scenario reflects the possibility of a prolonged downturn in global FDI. Although FDI is not expected to contract further, it could remain at a low level – about $1.2 trillion, over 2021 and 2022.
18 World Investment Report 2021 Investing in Sustainable Recovery
A full recovery of FDI to historical levels is not assured. In the medium term, the pandemic could accelerate the push towards improving supply-chain resilience and lead to policy pressures for greater national or regional self-sufficiency. Tighter restrictions on international trade and investment have already emerged because of the pandemic. A rebalancing of global supply chains towards more local (domestic or regional) operations, possibly boosted by policy incentives, could exert lasting downward pressure on global FDI.
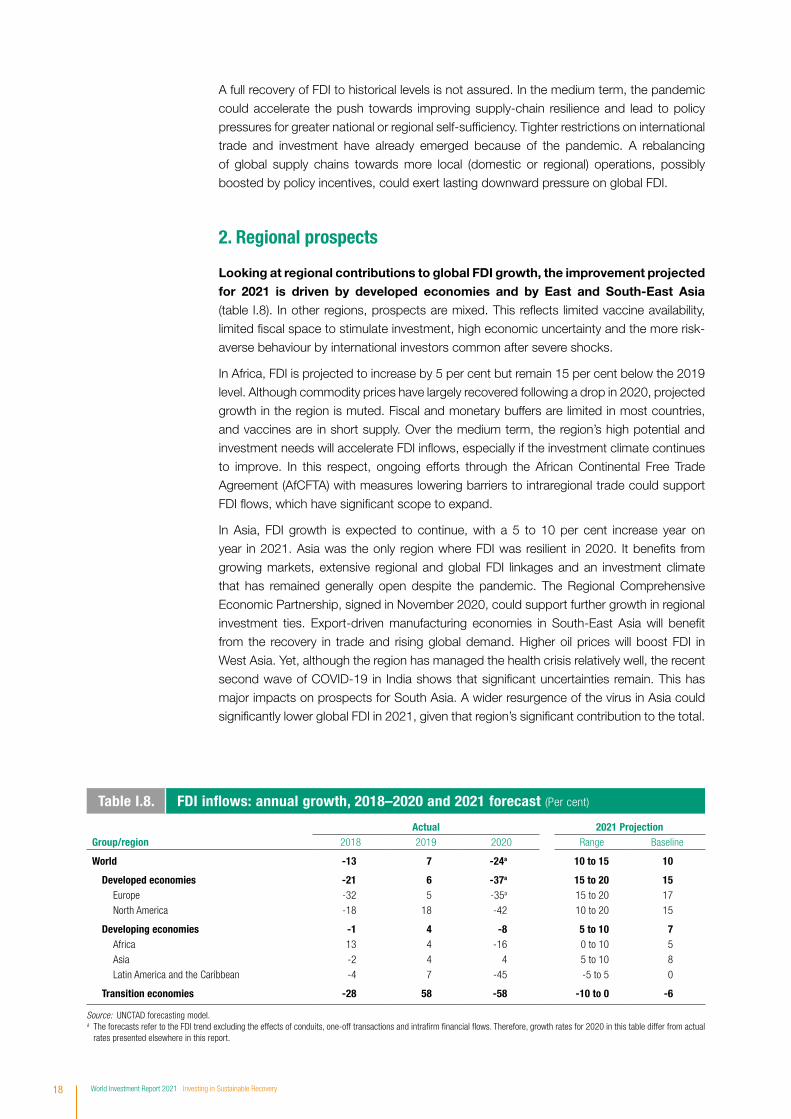
2. Regional prospects
Looking at regional contributions to global FDI growth, the improvement projected for 2021 is driven by developed economies and by East and South-East Asia (table I.8). In other regions, prospects are mixed. This reflects limited vaccine availability, limited fiscal space to stimulate investment, high economic uncertainty and the more risk-averse behaviour by international investors common after severe shocks.
In Africa, FDI is projected to increase by 5 per cent but remain 15 per cent below the 2019 level. Although commodity prices have largely recovered following a drop in 2020, projected growth in the region is muted. Fiscal and monetary buffers are limited in most countries, and vaccines are in short supply. Over the medium term, the region’s high potential and investment needs will accelerate FDI inflows, especially if the investment climate continues to improve. In this respect, ongoing efforts through the African Continental Free Trade Agreement (AfCFTA) with measures lowering barriers to intraregional trade could support FDI flows, which have significant scope to expand.
In Asia, FDI growth is expected to continue, with a 5 to 10 per cent increase year on year in 2021. Asia was the only region where FDI was resilient in 2020. It benefits from growing markets, extensive regional and global FDI linkages and an investment climate that has remained generally open despite the pandemic. The Regional Comprehensive Economic Partnership, signed in November 2020, could support further growth in regional investment ties. Export-driven manufacturing economies in South-East Asia will benefit from the recovery in trade and rising global demand. Higher oil prices will boost FDI in West Asia. Yet, although the region has managed the health crisis relatively well, the recent second wave of COVID-19 in India shows that significant uncertainties remain. This has major impacts on prospects for South Asia. A wider resurgence of the virus in Asia could significantly lower global FDI in 2021, given that region’s significant contribution to the total.
Table I.8. FDI infl ows: annual growth, 2018–2020 and 2021 forecast (Per cent)
Actual 2021 ProjectionGroup/region 2018 2019 2020 Range Baseline
World -13 7 -24a 10 to 15 10
Developed economies -21 6 -37a 15 to 20 15Europe -32 5 -35a 15 to 20 17
North America -18 18 -42 10 to 20 15
Developing economies -1 4 -8 5 to 10 7Africa 13 4 -16 0 to 10 5
Asia -2 4 4 5 to 10 8
Latin America and the Caribbean -4 7 -45 -5 to 5 0
Transition economies -28 58 -58 -10 to 0 -6
Source: UNCTAD forecasting model.a The forecasts refer to the FDI trend excluding the effects of conduits, one-off transactions and intrafirm financial flows. Therefore, growth rates for 2020 in this table differ from actual
rates presented elsewhere in this report.

Chapter I Global Investment Trends and Prospects 19
China remains a major catalyst of FDI flows to the region. Despite significant uncertainty surrounding developments related to geopolitical and commercial tensions, MNEs continue to invest heavily in China, considering it an indispensable strategic market. They are also encouraged by its rising purchasing power, well-developed infrastructure and generally favourable investment climate. Some MNEs may reshore or diversify away from China because of rising labour costs and the need to improve supply-chain resilience. However, the substantial flow of market-seeking FDI, particularly by MNEs in technology and services industries, is cushioning any negative trend in efficiency-seeking FDI. FDI diversification efforts benefit South-East Asia in particular.
FDI in Latin America and the Caribbean is projected to stabilize at 2020 levels, following a major contraction of 45 per cent in 2020. Latin America is severely affected by the COVID-19 crisis, and its recovery may lag that of other regions. Fiscal stimulus measures in the United States should provide some impulse to the wider region through trade and remittances but policy uncertainty is high, with general elections scheduled in 2021 and 2022 in several major FDI recipient economies (including Chile, Colombia and Brazil).
Economic prospects in North America and Europe have improved, following the extension of massive fiscal support and the roll-out of vaccines over the course of 2021. FDI is projected to increase by 15 to 20 per cent in Europe following the collapse in 2020 but will remain 30 per cent below 2019 levels. (Ultimately, values in Europe will depend in large part on further oscillations in financial flows through conduit economies, the effect of which is neutralized in UNCTAD’s forecasting methodology.) FDI in North America is also projected to increase by about 15 per cent. Fiscal stimulus measures and growing consumer demand are expected to revive the domestic economy in the United States. In the short term, however, several factors could increase uncertainty for international investors, including new corporate tax reforms and the possible continuation of trade tensions.
Transition economies dependent on oil and primary commodity revenues will benefit from rising prices. As a result of economic sanctions affecting the Russian Federation and low growth prospects in the region, FDI to this group has been weak for several years. It contracted by 58 per cent in 2020 and is not expected to increase in 2021. An improved investment outlook will depend on various factors, including the effective deployment of vaccines, an increase in global demand for primary commodities, and an easing of regional and international geopolitical tensions.
3. IPA expectations
Despite the continuation of the pandemic in 2021 and a far from promising immediate investment outlook, investment promotion agencies (IPAs) showed optimism in UNCTAD’s annual survey. Their expectations for FDI flows into their own countries in 2021 are high, with an overwhelming number expecting either an increase or a significant increase in inflows after a meagre year for most. At the global level (figure I.11), however, expectations were more tempered. Only 49 per cent of respondents foresee an increase in global FDI in 2021, indicating that IPAs acknowledge the challenges in attracting FDI in the current climate.
Source: UNCTAD.
GloballyOwn country
6
33
7
48
1
4
18
7
53
15
Signi�cantly decrease
Decrease
No change
Increase
Signi�cantly increase
IPA expectations: FDI in�ows, 2021 (Per cent of respondents)Figure I.11.
20 World Investment Report 2021 Investing in Sustainable Recovery
Source: UNCTAD.
7154
36 3220
China United States Germany United Kingdom Japan
Figure I.12. IPA expectations: largest investment-source economies, 2021 (Per cent of respondents)
Source: UNCTAD.
80
39 33 31 28
Agriculture and food
Informationand
communicationtechnology
Pharmaceuticals Electricity and utilities
Mining
Figure I.13.IPA expectations: most important industries for investment, 2021(Per cent of respondents)
Source: UNCTAD.
11
35
54
No change
Somewhat more important
Signi�cantly more important
Figure I.14.
IPA expectations: role of foreign investment in health-care in the pandemic aftermath (Per cent of respondents)
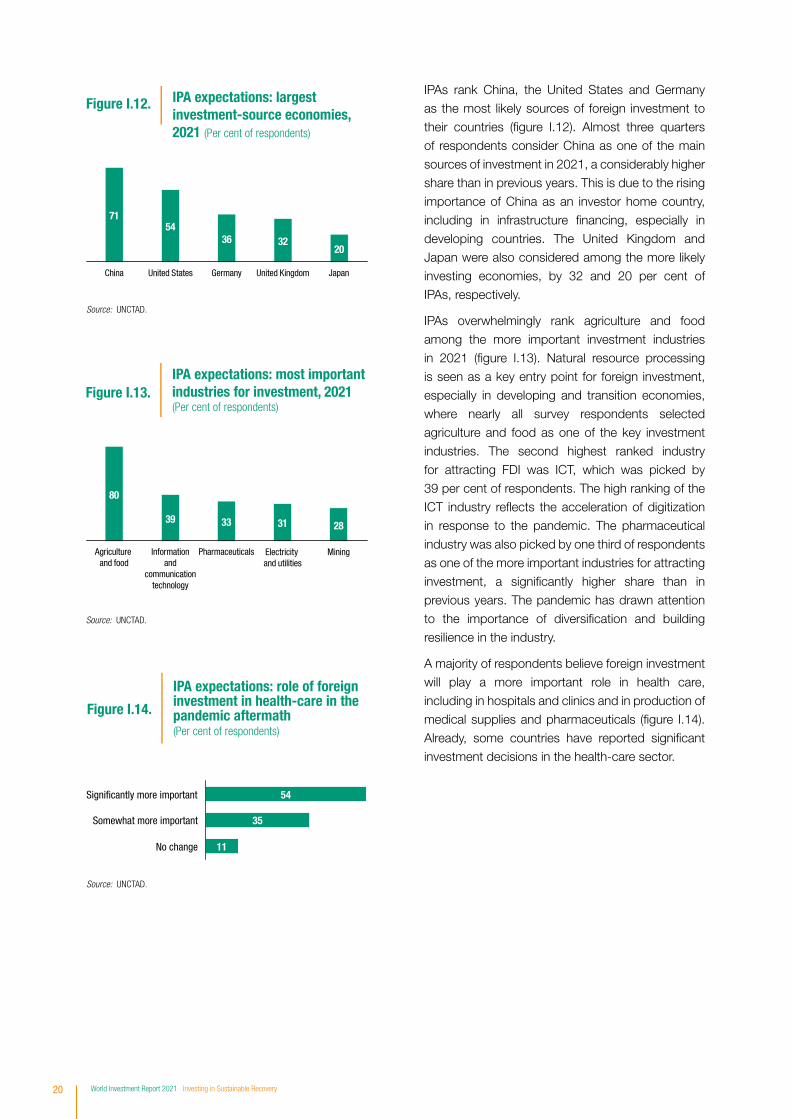
IPAs rank China, the United States and Germany as the most likely sources of foreign investment to their countries (figure I.12). Almost three quarters of respondents consider China as one of the main sources of investment in 2021, a considerably higher share than in previous years. This is due to the rising importance of China as an investor home country, including in infrastructure financing, especially in developing countries. The United Kingdom and Japan were also considered among the more likely investing economies, by 32 and 20 per cent of IPAs, respectively.
IPAs overwhelmingly rank agriculture and food among the more important investment industries in 2021 (figure I.13). Natural resource processing is seen as a key entry point for foreign investment, especially in developing and transition economies, where nearly all survey respondents selected agriculture and food as one of the key investment industries. The second highest ranked industry for attracting FDI was ICT, which was picked by 39 per cent of respondents. The high ranking of the ICT industry reflects the acceleration of digitization in response to the pandemic. The pharmaceutical industry was also picked by one third of respondents as one of the more important industries for attracting investment, a significantly higher share than in previous years. The pandemic has drawn attention to the importance of diversification and building resilience in the industry.
A majority of respondents believe foreign investment will play a more important role in health care, including in hospitals and clinics and in production of medical supplies and pharmaceuticals (figure I.14). Already, some countries have reported significant investment decisions in the health-care sector.
Chapter I Global Investment Trends and Prospects 21
Source: UNCTAD.
Decrease
No change
Moderately increase
Singi�cantly increase
6
16
34
44
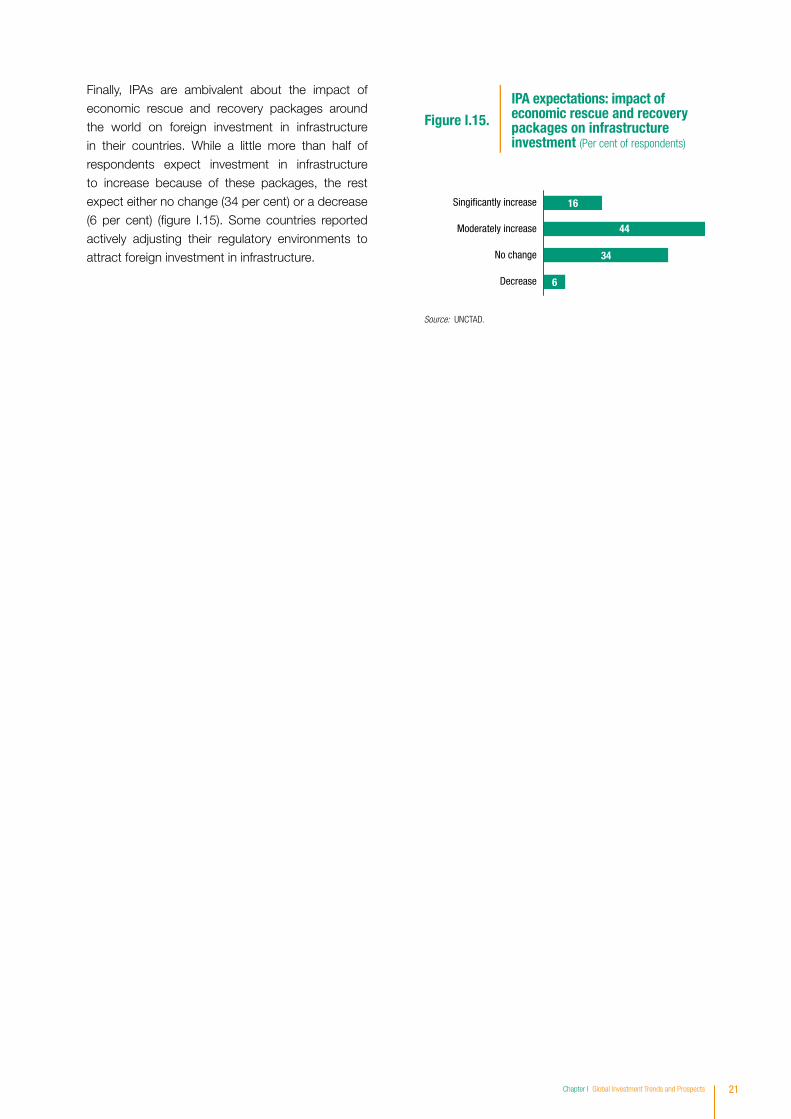
Figure I.15.
IPA expectations: impact of economic rescue and recovery packages on infrastructure investment (Per cent of respondents)
Finally, IPAs are ambivalent about the impact of economic rescue and recovery packages around the world on foreign investment in infrastructure in their countries. While a little more than half of respondents expect investment in infrastructure to increase because of these packages, the rest expect either no change (34 per cent) or a decrease (6 per cent) (figure I.15). Some countries reported actively adjusting their regulatory environments to attract foreign investment in infrastructure.

22 World Investment Report 2021 Investing in Sustainable Recovery
1. Key indicators of international production
Despite the drastic decline in global FDI flows during the crisis, international production will continue to play an important role in supporting economic growth and development. FDI flows overall remained positive, adding to capital stocks accumulated in foreign affiliate networks. Table I.9 provides an overview of key indicators of international production.
C. INTERNATIONAL PRODUCTION
Table I.9. Selected indicators of FDI and international production, 2020 and selected years
Value at current prices (Billions of dollars)
19902005–2007
(pre-crisis average)2017 2018 2019 2020
FDI infl ows 205 1 425 1 647 1 437 1 530 999
FDI outfl ows 244 1 464 1 605 871 1 220 740
FDI inward stock 2 196 14 607 33 162 32 784 36 377 41 354
FDI outward stock 2 255 15 316 32 851 31 219 34 351 39 247
Income on inward FDIa 82 1 119 2 084 2 375 2 202 1 745
Rate of return on inward FDIb 5.4 8.8 6.3 6.9 6.2 4.7
Income on outward FDIa 128 1 230 2 101 2 330 2 205 1 802
Rate of return on outward FDIb 7.6 9.5 6.4 6.8 6.3 4.9
Cross-border M&As 98.0 729.2 694.0 815.7 507.4 475.0
Sales of foreign affi liates 7 615 28 444 30 866 33 203 .. ..
Value-added (product) of foreign affi liates 1 588 6 783 8 244 8 254 .. ..
Total assets of foreign affi liates 7 305 70 643 114 441 110 220 .. ..
Employment by foreign affi liates (thousands)
30 861 68 057 82 600 85 504 .. ..
Memorandum
GDPc 23 627 52 546 80 834 85 893 87 345 84 538
Gross capital formationc 5 748 13 009 20 938 22 743 23 090 22 260
Royalties and licence fee receipts 31 179 391 427 419 394
Source: UNCTAD.
Note: Not included in this table are the value of worldwide sales by foreign affiliates associated with their parent firms through non-equity relationships and of the sales of the parent firms themselves. Worldwide sales, gross product, total assets, exports and employment of foreign affiliates are estimated by extrapolating the worldwide data of foreign affiliates of TNCs from Australia, Austria, Belgium, Canada, Czech Republic, Finland, France, Germany, Greece, Israel, Italy, Japan, Latvia, Lithuania, Luxembourg, Portugal, Slovenia, Sweden, Switzerland and the United States for sales; those from the Czech Republic, France, Israel, Japan, Portugal, Slovenia, Sweden, and the United States for value-added (product); those from Austria, Germany, Japan and the United States for assets; those from Czech Republic, Japan, Portugal, Slovenia, Sweden, and the United States for exports; and those from Australia, Austria, Belgium, Canada, Czech Republic, Finland, France, Germany, Italy, Japan, Latvia, Lithuania, Luxembourg, Macao (China), Portugal, Slovenia, Sweden, Switzerland, and the United States for employment, on the basis of three years average shares of those countries in worldwide outward FDI stock.
a Based on data from 168 countries for income on inward FDI and 142 countries for income on outward FDI in 2020, in both cases representing more than 90 per cent of global inward and outward stocks.
b Calculated only for countries with both FDI income and stock data.c Data from IMF (2021a).
Chapter I Global Investment Trends and Prospects 23
2. Internationalization trends of the largest MNEs
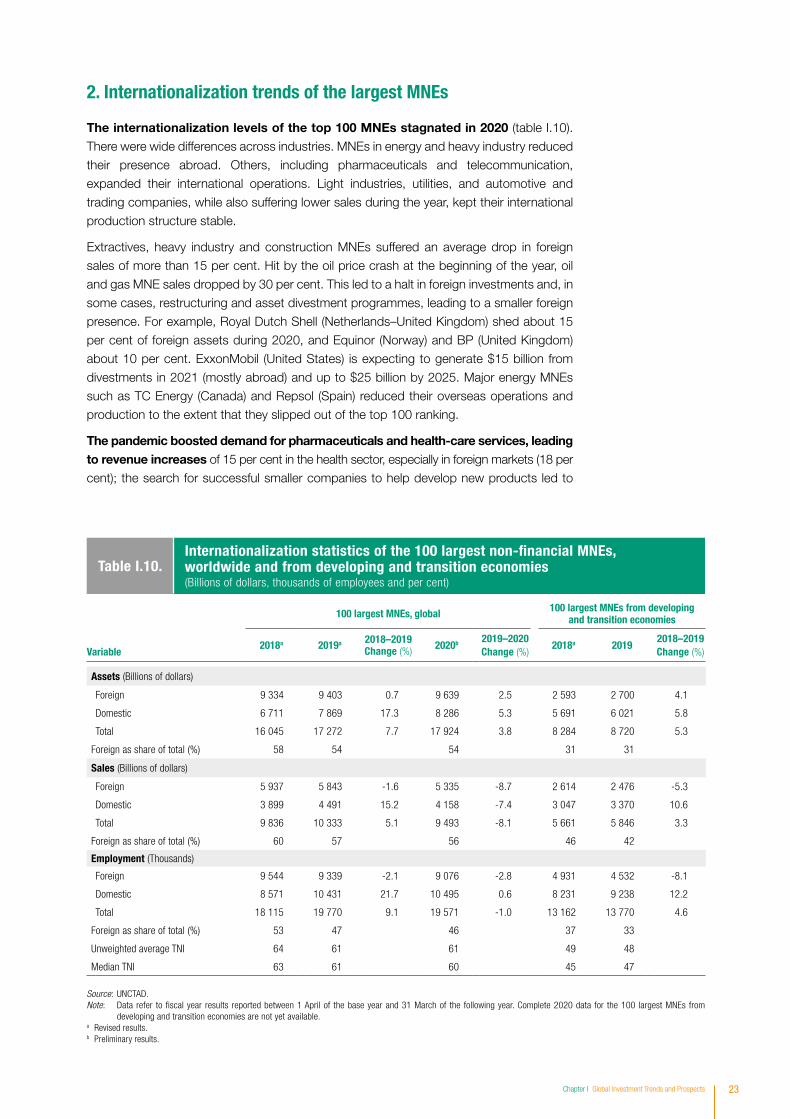
The internationalization levels of the top 100 MNEs stagnated in 2020 (table I.10). There were wide differences across industries. MNEs in energy and heavy industry reduced their presence abroad. Others, including pharmaceuticals and telecommunication, expanded their international operations. Light industries, utilities, and automotive and trading companies, while also suffering lower sales during the year, kept their international production structure stable.
Extractives, heavy industry and construction MNEs suffered an average drop in foreign sales of more than 15 per cent. Hit by the oil price crash at the beginning of the year, oil and gas MNE sales dropped by 30 per cent. This led to a halt in foreign investments and, in some cases, restructuring and asset divestment programmes, leading to a smaller foreign presence. For example, Royal Dutch Shell (Netherlands–United Kingdom) shed about 15 per cent of foreign assets during 2020, and Equinor (Norway) and BP (United Kingdom) about 10 per cent. ExxonMobil (United States) is expecting to generate $15 billion from divestments in 2021 (mostly abroad) and up to $25 billion by 2025. Major energy MNEs such as TC Energy (Canada) and Repsol (Spain) reduced their overseas operations and production to the extent that they slipped out of the top 100 ranking.
The pandemic boosted demand for pharmaceuticals and health-care services, leading to revenue increases of 15 per cent in the health sector, especially in foreign markets (18 per cent); the search for successful smaller companies to help develop new products led to
Table I.10.Internationalization statistics of the 100 largest non-fi nancial MNEs, worldwide and from developing and transition economies (Billions of dollars, thousands of employees and per cent)
100 largest MNEs, global 100 largest MNEs from developing and transition economies
Variable2018a 2019a 2018–2019
Change (%) 2020b 2019–2020 Change (%)
2018a 20192018–2019 Change (%)
Assets (Billions of dollars)
Foreign 9 334 9 403 0.7 9 639 2.5 2 593 2 700 4.1
Domestic 6 711 7 869 17.3 8 286 5.3 5 691 6 021 5.8
Total 16 045 17 272 7.7 17 924 3.8 8 284 8 720 5.3
Foreign as share of total (%) 58 54 54 31 31
Sales (Billions of dollars)
Foreign 5 937 5 843 -1.6 5 335 -8.7 2 614 2 476 -5.3
Domestic 3 899 4 491 15.2 4 158 -7.4 3 047 3 370 10.6
Total 9 836 10 333 5.1 9 493 -8.1 5 661 5 846 3.3
Foreign as share of total (%) 60 57 56 46 42
Employment (Thousands)
Foreign 9 544 9 339 -2.1 9 076 -2.8 4 931 4 532 -8.1
Domestic 8 571 10 431 21.7 10 495 0.6 8 231 9 238 12.2
Total 18 115 19 770 9.1 19 571 -1.0 13 162 13 770 4.6
Foreign as share of total (%) 53 47 46 37 33
Unweighted average TNI 64 61 61 49 48
Median TNI 63 61 60 45 47
Source: UNCTAD.Note: Data refer to fi scal year results reported between 1 April of the base year and 31 March of the following year. Complete 2020 data for the 100 largest MNEs from
developing and transition economies are not yet available.a Revised results.b Preliminary results.
24 World Investment Report 2021 Investing in Sustainable Recovery
numerous international acquisitions and an average 20 per cent increase in foreign assets
for pharmaceuticals MNEs. The biggest of such deals was the acquisition by Novartis
(Switzerland) of The Medicines (United States) for $7.4 billion.
Accelerated digitalization benefitted tech MNEs. For hardware and IT companies,
the increase in international revenues (10 per cent) did not lead to an increase in cross-
border acquisitions, as the number of announced deals in the second quarter of 2020
would have predicted (WIR20). Increased regulatory scrutiny of top tech MNE activities
and market positions slowed down their foreign investments in the second half of the year.
Their foreign asset profile was also negatively affected by the gradual move away from
China of Apple (United States) and Intel (United States), which reduced assets in China
by 20 per cent and more than 80 per cent, respectively. In contrast, purely digital tech
and delivery services companies such as Alphabet (United States), Tencent (China) and
Amazon (United States) saw their foreign revenues increase by two thirds on average, and
their foreign assets were almost 30 per cent higher in value at the end of fiscal year 2020.
During the past year Amazon alone announced about $12 billion of greenfield investments
to strengthen its logistics and retail network. As part of the boom in e-commerce and
delivery services, Deutsche Post (Germany) also invested heavily in its foreign assets,
re-entering the top 100 ranking.
The pandemic impact was uneven also within industries, with some MNEs accelerating
foreign activities on the back of consolidation trends, possibly precipitated by the crisis.
For example, the longer-term consolidation of the automotive industry led to the tie-up of Fiat-
Chrysler (Italy–United States) and Groupe PSA (France) to create Stellantis (Netherlands).5
Similarly, the consolidation of the telecommunication industry drove Deutsche Telekom
(Germany) up in the ranking, while Liberty Global (United Kingdom) re-entered the top 100
after several years of absence. At the same time, fierce price competition combined with
the need to invest in new 5G networks pushed Vodafone (United Kingdom) to spin off its
tower assets, a move that other integrated telecommunication companies are considering
so as to create a more agile company while monetizing costly infrastructure.
The overseas investment activity of top developing-country MNEs was muted,
as many operate in the worst affected industries: extractives and heavy industry.
The tech giant Tencent (China) was the largest investor from emerging markets as it
acquired a participation of 10 per cent in the music publisher Universal Music (United
States) for $3.3 billion and a software publisher, Leyou (Hong Kong, China) for almost
$1.4 billion. The only other big transaction from emerging-market MNEs was the acquisition
by State Grid (China) of electric power distributor Chilquinta (Chile) for $2.2 billion, a deal
that was announced in mid-2019.
The gradual decrease of the aggregate transnationality index (TNI) over the last five years
is explained mostly by geographical and industry compositional effects and only marginally
by the reversal of internationalization of individual MNEs (figure I.16). The number of MNEs
from emerging markets in the global top 100 increased from 8 in 2015 to 15 in 2020.
Their lower transnationality levels affect aggregate internationalization levels. The entry of
Saudi Aramco (Saudi Arabia) in 2019, with a TNI of 15 per cent, and State Grid (China)
in 2017, with a TNI below 5 per cent, were particularly impactful. In much the same way,
within the technology industry, the gradual addition of digital companies such as Amazon
(United States), Alphabet (United States) and Tencent (China) brought about a gradual
decline in the average TNI for the industry.
Internationalization reversal processes are much slower. The restructuring of companies such
as ExxonMobil (United States), Airbus (France–Netherlands), Repsol (Spain) and General
Motors (United States) implied a reduction of their TNI by about 10 percentage points over

Chapter I Global Investment Trends and Prospects 25
the last 10 years. The effect of last year’s asset sales in extractives and heavy industries, which were at the core of the ranking in the past, only adds to their decline in numbers (from about 30 in 2010 to 21 last year), accelerating the growing presence in the ranking of MNEs with a much lighter asset footprint, such as digital and pharmaceuticals companies.
The increasing importance of intangibles in the global economy is reflected in the growing importance of technology companies in the ranking, boosted by the crisis. Although their number remained constant at 13 MNEs, their share of foreign sales in the total ranking increased by five percentage points to 22 per cent. This was achieved without a corresponding increase in the share of foreign assets, highlighting their ability to reach foreign markets without the corresponding productive investment. For pharmaceutical companies, this trend is slower and less apparent because – although much of their value is based on intangibles – their production processes still rely on tangible assets.
Despite falling revenues and earnings, MNEs managed to maintain constant cash from operations. They also secured additional financing, mostly in the form of debt. The average rate of new issuance of corporate debt doubled in 2020. At the same time, acquisitions decreased and capital expenditures remained stable, leading to soaring cash balances. Many corporations also raised equity capital, reversing a recent trend to buy back shares. In 2020 the top 5,000 non-financial listed MNEs increased their cash holdings by more than 25 per cent to $8 trillion.
Differences in exposure to the crisis across industries compounded differences related to size and access to credit. The tourism and travel industries saw operating cash declining by 90 per cent but were able to increase debt more than tenfold. With very low interest rates, investors were willing to finance firms that were strong enough to outlive the crisis, favouring the largest MNEs. While, on average, the top 5,000 MNEs doubled their issuance of debt, the top quarter of corporations (by 2019 revenues) almost tripled it.
Source: UNCTAD.Note: TNI averages are unweighted.
TNI emerging economies
TNI tech MNEs
Total TNI
TNI developed economies
35
40
45
50
55
60
65
70
75
80
2010 2011 2012 2013 2014 2015 2016 2017 2018 2019 2020
Average TNI by region and for tech MNEs, 2010–2020 (Per cent)
Figure I.16.
26 World Investment Report 2021 Investing in Sustainable Recovery
In the top 100 MNEs, average levels of cash and liquid assets also rose significantly, especially in highly integrated industries such as the automotive industry; for example, Toyota Motors (Japan) increased cash holdings by more than $30 billion (up 68 per cent) and Volkswagen (Germany) by $22 billion. The high levels of cash on hand in the largest MNEs could boost further consolidation activity and investment in the coming years.
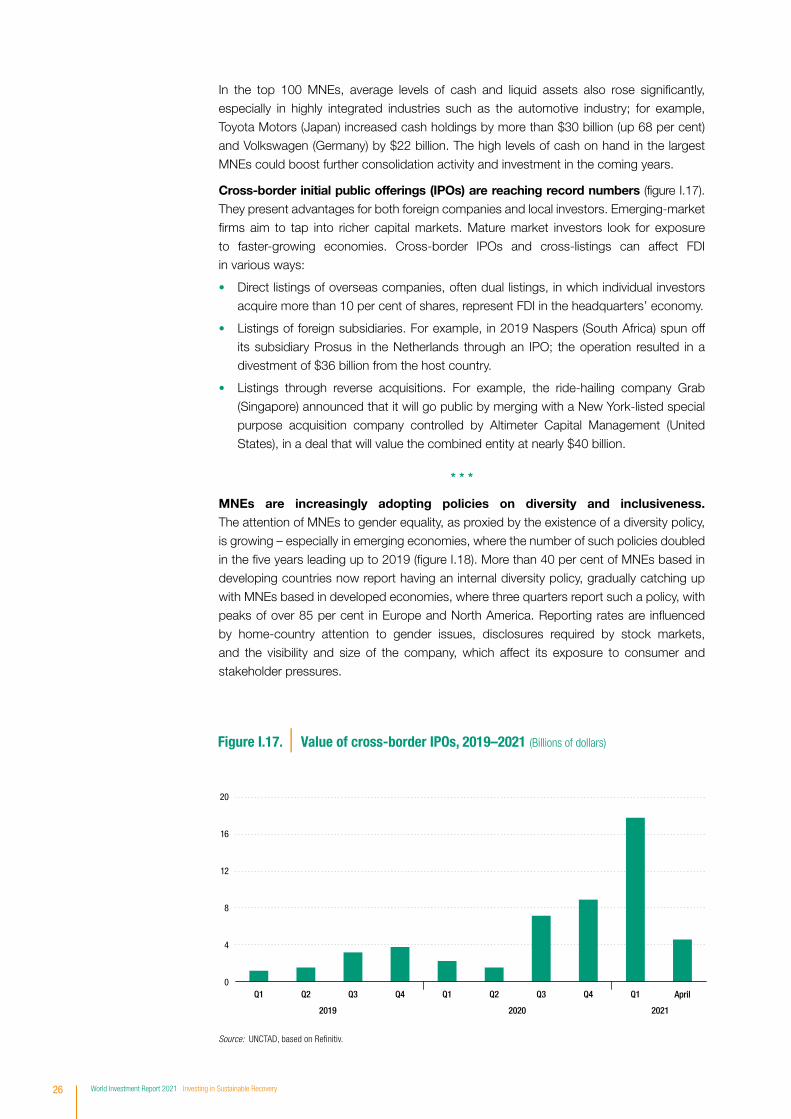
Cross-border initial public offerings (IPOs) are reaching record numbers (figure I.17). They present advantages for both foreign companies and local investors. Emerging-market firms aim to tap into richer capital markets. Mature market investors look for exposure to faster-growing economies. Cross-border IPOs and cross-listings can affect FDI in various ways:
• Direct listings of overseas companies, often dual listings, in which individual investors acquire more than 10 per cent of shares, represent FDI in the headquarters’ economy.
• Listings of foreign subsidiaries. For example, in 2019 Naspers (South Africa) spun off its subsidiary Prosus in the Netherlands through an IPO; the operation resulted in a divestment of $36 billion from the host country.
• Listings through reverse acquisitions. For example, the ride-hailing company Grab (Singapore) announced that it will go public by merging with a New York-listed special purpose acquisition company controlled by Altimeter Capital Management (United States), in a deal that will value the combined entity at nearly $40 billion.
* * *
MNEs are increasingly adopting policies on diversity and inclusiveness. The attention of MNEs to gender equality, as proxied by the existence of a diversity policy, is growing – especially in emerging economies, where the number of such policies doubled in the five years leading up to 2019 (figure I.18). More than 40 per cent of MNEs based in developing countries now report having an internal diversity policy, gradually catching up with MNEs based in developed economies, where three quarters report such a policy, with peaks of over 85 per cent in Europe and North America. Reporting rates are influenced by home-country attention to gender issues, disclosures required by stock markets, and the visibility and size of the company, which affect its exposure to consumer and stakeholder pressures.
Source: UNCTAD, based on Re�nitiv.
0
4
8
12
16
20
Q1 Q2 Q3 Q4 Q1 Q2 Q3 Q4 Q1 April
202120202019
Value of cross-border IPOs, 2019–2021 (Billions of dollars)Figure I.17.

Chapter I Global Investment Trends and Prospects 27
3. State-owned multinational enterprises
In response to the COVID-19 crisis, governments have taken a vast array of measures to support the business sector. In some cases, rescue packages include the acquisition of equity stakes in companies in financial distress, potentially increasing the number and presence of State-owned enterprises (SOEs) in the economy (figure I.19). To date, the impact on the number of State-owned MNEs (SO-MNEs) has been limited – especially in comparison with the increase in that number during the global financial crisis a decade ago – for several reasons:
• Bailout programmes have relied mostly on the provision of credit lines, grants and payroll support rather than equity injections.
• Bailouts have focused on the worst-affected industries, especially travel and tourism, where firms were already partly State owned (for example, Finnair (Finland), SAS (Denmark–Sweden) and Emirates (United Arab Emirates)) or were purely domestic companies (such as Network Rail in the United Kingdom).
• Capital injections may still be ongoing or planned (for example, the rescue of Liberty Steel in the United Kingdom or the Eurostar between the United Kingdom and France).
• Injections may come in the form of warrants or convertibles, deferring the possibility of increased state ownership to the future (for example, Southwest and Delta airlines in the United States, and Air New Zealand).
Source: UNCTAD, based on Re�nitiv. Update of UNCTAD (2021) Multinational Enterprises and the International Transmission of Gender Policies and Practices, Geneva.
Transition economies
Developing economies
World average
Developed economies
0
10
20
30
40
50
60
70
80
2013 2014 2015 2016 2017 2018 2019
Share of top 5,000 MNEs with a diversity policy, average and by economic group, 2013–2019 (Per cent)
Figure I.18.
Source: UNCTAD.
8
5
15
8
New SO-MNEs
Potential new SO-MNEs
Already SO-MNEs
Not MNEs
Figure I.19.Companies nationalized in response to the COVID-19 crisis, 2020–2021 (Number)
28 World Investment Report 2021 Investing in Sustainable Recovery
Except for a few cases in emerging Asian economies (China, Hong Kong (China) and Singapore) all equity injections took place in developed economies, and in particular in Europe. In emerging economies, capital injections occurred on already State-owned carriers (Singapore Airlines, Cathay Pacific, China Eastern and Southern airlines). Across developed countries two different approaches were followed, with programmes in the United States and New Zealand privileging equity-backed loans and convertibles, while European countries chose to buy equity stakes in several cases.
The COVID-19 crisis slowed down ongoing privatization programmes owing to elevated uncertainty and lower market demand. For example, programmes in Brazil and Viet Nam suffered setbacks. Brazil launched its privatization programme at the end of 2018 with the expectation to reduce the number of SOEs from 134 to 12. During 2020 only two privatizations were completed: the sale of the insurance company La Caixa (subsidiary of La Caixa Federal) and of two
subsidiaries of Petrobras. Viet Nam approved the privatization of 174 SOEs between 2016 and 2020. The pandemic significantly delayed plans for several companies, including MobiFone, Agribank, Northern Food, Vinacomin and Vietnam National Chemical Group.
Overall, the number of SO-MNEs in 2020 increased by 7 per cent with respect to 2019, to about 1,600. In addition to the companies included following COVID-19-related bailout programmes, several more were nationalized for reasons not related to the pandemic. About two thirds of the new SO-MNEs are included because of minority participations by public pension funds or sovereign wealth funds.6 The remaining new SO-MNEs are companies for which information about their governance structure became available only now. With the exception of a few from Africa, these are all in transition economies (Belarus and Ukraine) and are typically smaller companies with a single affiliate in a neighbouring country (e.g. the Russian Federation). Often these companies are a legacy of highly integrated markets and are not active in international capital markets (WIR19).
SO-MNEs from emerging markets drastically reduced their international acquisitions in 2020, from $37 billion to $24 billion (figure I.20). The decrease followed a longer-term trend of a fall in overseas activity by emerging SO-MNEs and underscored their vulnerability to the crisis.
Source: UNCTAD, based on Re�nitiv and Orbis BvD.
Developed economies Developing and transition economies
18 17 2235 29
52
97
64
122
51
37
24
2015 2016 2017 2018 2019 2020
Figure I.20.Cross-border acquisitions by SO-MNEs, 2015–2020(Billions of dollars)

Chapter I Global Investment Trends and Prospects 29
The momentum for regional FDI is expected to grow over the coming years. Policy pressures for strategic autonomy, business resilience considerations and economic cooperation will boost regional production networks. However, a shift towards more intraregional FDI would represent much more of a break with the past than commonly thought: new data on FDI networks shows that, to date, investment links are still more global than regional in scope.
There is widespread expectation that international production networks will become more regional in scope in the post-pandemic world (Enderwick and Buckley, 2020). WIR20 lists regionalization as one of four more likely trajectories for international production by 2030. However, the starting point – the geographical spread of FDI networks today – is often unclear. The measurement of the size of intraregional investment stock is not straightforward. Indirect investment flows through conduit jurisdictions and pass-through entities make it difficult to discern geographical patterns in the global FDI network (WIR16 and WIR19). Identifying intraregional FDI requires separating ultimate ownership (UO) patterns from purely financial flow patterns. This section proposes a new analytical framework to provide a clearer account of trends in intraregional investment, addressing the statistical challenges caused by indirect FDI.
The simplest approach to sizing intraregional investment is to sum the values of bilateral FDI stock involving any two countries – a direct investor and a direct recipient – in the same region. This lumps together different bilateral links that are quite diverse, including not only direct links between an ultimate investor (or owner) and a final destination but also double-counted pass-through investment (an investor from within the region invests in another country in the region through a conduit in a third country in the region) and pass-through investment where either the final productive investment or the ultimate owner is located outside the region.
These different types of links are all relevant because they provide a picture of the regional exposure of countries in terms of external assets and liabilities, revealing patterns of financial integration. However, not all components contribute equally to real economic integration. Links in which both the ultimate owner and the investment are located within the region are arguably more relevant than “artificial” intraregional investment links created by investors from outside the region choosing to channel their investment in the region through a regional hub, where they might locate a holding company, regional headquarters or back-office functions.
The total value of intraregional FDI can be decomposed into investment in conduit entities – either double-counted regional investment or investment with an ultimate recipient outside the region – and non-conduit investment in productive assets. Investment in productive assets can then originate from extraregional ultimate investors or from regional ultimate investors (figure I.21). The latter corresponds to the UO component of intraregional FDI. Recent advances in UNCTAD’s methodology for the measurement of conduit investment and the tracking of UO links make it possible to quantify each component (box I.1).
D. INTRAREGIONAL FDI

30 World Investment Report 2021 Investing in Sustainable Recovery
Source: UNCTAD bilateral FDI database. UNCTAD estimates.
71
62
Intraregional FDI Conduit Non-conduit Extraregional ultimate
Intraregional ultimate (UO)
29
9
100 = $18 trillion
Intraregional FDI stock: bilateral inward stock by main components, 2019 (Trillions of dollars and per cent)
Figure I.21
Box I.1. Measuring intraregional investment
The simplest approach to the measurement of intraregional FDI is to sum the bilateral FDI stocks between any two countries in a region. This approach aggregates several types of bilateral links:
Case A. Direct links between an ultimate investor and an ultimate recipient.
Case B. Conduit investment between an ultimate investor and an ultimate recipient in the region.
Case C. Direct links with an ultimate recipient outside the region.
Case D. Direct links with an ultimate investor outside the region.
Other cases are possible that can be reconducted to these four archetypes. Components A, B1, B2, C1 and D2 in box figure I.1.1 are generally reported as bilateral FDI stock in official statistics, although with some differences across international organizations. Unlike the IMF Coordinated Direct Investment Survey (IMF-CDIS), UNCTAD removes investment through special-purpose entities (SPEs) from aggregate stock figures when reported by countries, thus partially addressing cases B and C. A systematic approach to the analysis of intraregional investment requires sizing all conduit investment, not only that reflected by reported SPEs, and addressing case D (extraregional ultimate investors).
A full decomposition of intraregional FDI stock enables the analytical transition from intraregional FDI to intraregional UO links – links between a real investment in productive assets in one economy (ultimate recipient) and the investors who ultimately control the assets in another economy (ultimate owner) in the same region.
Intraregional FDI (labelled 1 in the figure) encompasses all bilateral links between two economies in the same region. Data can be obtained from balance-of-payment statistics. Primary sources include UNCTAD bilateral FDI database, international direct investment statistics of the Organization for Economic Cooperation and Development (OECD) and IMF-CDIS.
Inward FDI to conduit entities (labelled 2 in the figure) includes either double-counted intraregional investment (case B) or intraregional FDI that is then routed to economies outside the region (case C) through SPEs. Only a limited, but growing, number of countries report separate FDI positions on SPEs. For those countries that do not report SPEs it is possible to estimate their importance; this report uses UNCTAD’s implied investment method (WIR15; Bolwijn et al., 2018). The IMF employed an approach similar to that of UNCTAD to estimate “phantom” FDI (Damgaard et al., 2019). The UNCTAD approach builds on the assumption of a relationship between GDP and FDI stock; economies with a disproportionate amount of FDI relative to their size are identified as outliers and the oversized component is associated with conduit structures or SPEs. This report employs a hybrid approach that uses SPE data where available and confines the estimation only to countries that do not report on SPEs. Statistical issues related to conduit FDI and different estimation methods are discussed in Casella et al. (2021).
/…

Chapter I Global Investment Trends and Prospects 31
Box I.1. Measuring intraregional investment (Concluded)
The separate treatment of SPEs reduces but does not eliminate the impact of conduit FDI on the sizing of intraregional investment. The simple removal of conduit FDI on the recipient side of the investment link is insufficient because extraregional investors often use regional conduits (case D). In practice, financial centres receive and transmit a mix of intra- and extra-regional FDI (B2 and D2 respectively, in the figure). The solution to this problem is to apply to non-conduit recipients (i.e. final destinations of productive assets) the UNCTAD Markov chain approach to estimate the distribution of ultimate investors (Casella, 2019).a After applying the Markov chain computation, only the share of productive investment corresponding to ultimate investors within the region (labelled 3 in the figure) is retained as intraregional UO links, while the rest is extraregional.
One caveat applies to the computation of the final component of the regional decomposition through the Markov chain methodology. This methodology captures all investment (in productive assets) with an ultimate investor within the region. This includes also regional round-tripping – investment with an ultimate investor within the region and a conduit outside the region. This case does not involve any direct intraregional FDI links, so it is not included in the decomposition in the box figure. At the global level, extraregional round-tripping can be assumed to be small, at less than 5 per cent of regional FDI stock (WIR16), so that the Markov chain method estimates an upper bound that is a good approximation of the actual component. For some regions extraregional round-tripping may be larger, for example for transition economies characterized by significant investment through Cyprus.
Source: UNCTAD.a Before this application to intraregional FDI, the UNCTAD Markov chain approach had been used by UNCTAD to analyse the global FDI network (WIR19) and by the OECD to
assess the economic impact of base erosion and profit-shifting measures (Turban et al., 2020).
Source: UNCTAD.
Case A: Direct = ultimate investment
Case B: Regional double-counting
Case C: Extraregional ultimate recipient
Case D: Extraregional ultimate investor
A
Region
B1 B2
C1
C2
D2
D1
2. Implied investment method
3. Markov chain approach
1. Bilateral FDI statistics Deltas
Intraregional FDI(bilateral FDI links between countries in the same region)
Conduit(conduit recipients)
Non-conduit(non-conduit
recipients)
Extraregional ultimate (ultimate investors outside
the region)
A
B1 + B2
C1
D2
B1
C1
A
B2
D2D2
A
B2
Intraregional ultimate
(ultimate investors inside the region)
Box �gure I.1.1. Intraregional FDI, decomposition explained

32 World Investment Report 2021 Investing in Sustainable Recovery
The results show that intraregional FDI is less important than it appears from bilateral investment links. The total value of bilateral FDI stock between economies
in the same region was $18 trillion in 2019, equivalent to 47 per cent of total FDI (figure
I.22).7 This appears significant: one of every two dollars of cross-border FDI involves
two countries within the same region. However, looking through regional investment
hubs and counting only links between ultimate investors and final destinations (the
location of the productive asset), the total falls to $11 trillion, or 30 per cent of total FDI.
At least one third of intraregional FDI is either double-counted or has an ultimate investor
outside the region.
The growth of intraregional investment is also relatively slow. Bilateral FDI stock
within regions grew at an average annual rate of 4 per cent in the period 2009–2019,
slower than global FDI stock. Consequently, the share of intraregional FDI in total FDI stock
decreased from 56 per cent in 2009 to 47 per cent in 2019 – and the share of intraregional
UO links from 34 per cent to 30 per cent.
The growth of intraregional FDI links was higher in the first half of the decade (2009–2014 CAGR:
5.2 per cent) before slowing in the second half (2015–2019 CAGR: 3.0 per cent). The growth
of intraregional UO links was substantially constant over that period. The difference may reflect
the rapid growth of conduit flows in the early period and the subsequent slowdown in the face
of stronger public and policy scrutiny of MNE tax practices. Ongoing international tax reforms
could further accelerate the process of realignment between UO and direct investment links.
The size and relative importance of intraregional investment stocks varies significantly by region (table I.11). It ranges from 67 per cent of total FDI stock in Europe,
to 12 per cent in Latin America and the Caribbean, and 10 per cent in Africa. The amount
of intraregional FDI depends on total investment and the degree of economic integration in
the region, but also on the presence of large regional investment hubs. Investment hubs in
Europe and East Asia, such as Luxembourg, the Netherlands and Hong Kong, China, are
among the largest FDI recipients globally.
The ultimate investor view provides a more realistic perspective of actual differences in real
economic integration than the direct view. In almost all regions the value of intraregional
UO links is smaller than that of intraregional FDI. In most cases it is more than a third lower.
Source: UNCTAD bilateral FDI database. UNCTAD estimates.Note: CAGR = compound annual growth rate.
18.0
2009
Direct (intraregional FDI)
2019
Share of total FDI inward stock
7.611.3
2009 2019
4.1%
CAGR
4.0%
CAGR
56% 47% 34% 30%
Ultimate (intraregional UO)
12.0
Intraregional investment, bilateral inward stock, 2009 and 2019 (Trillions of dollars and per cent)
Figure I.22.
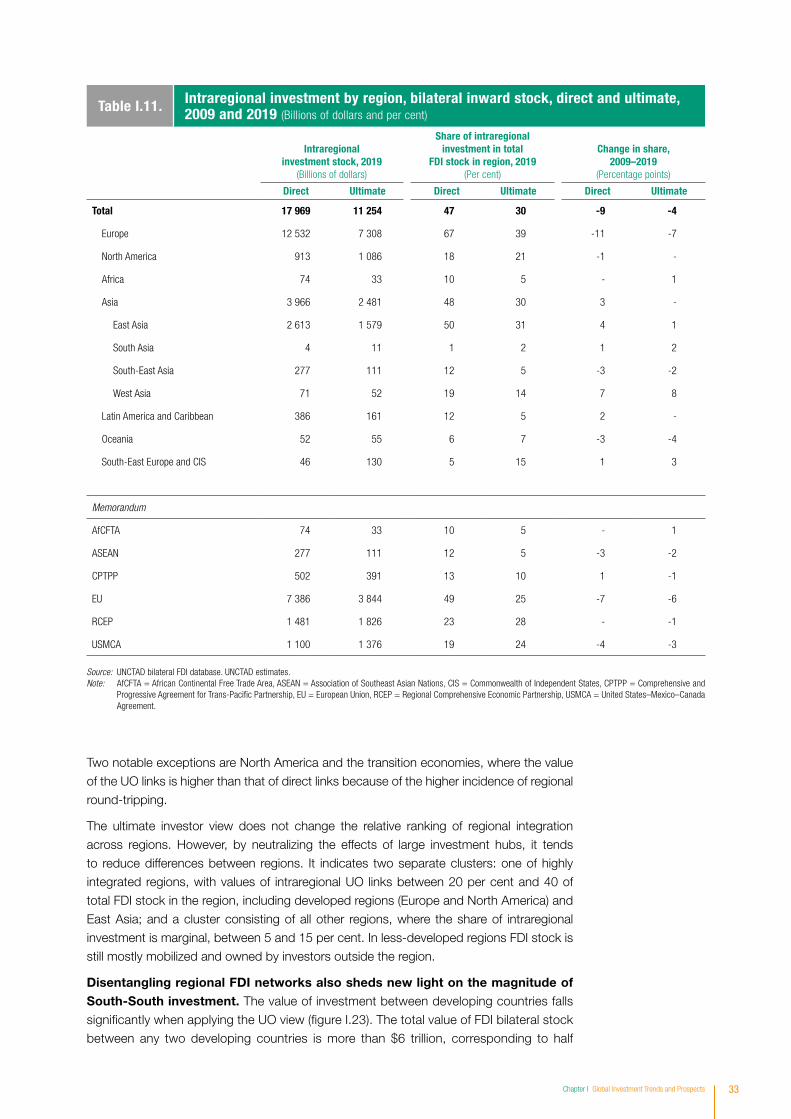
Chapter I Global Investment Trends and Prospects 33
Two notable exceptions are North America and the transition economies, where the value of the UO links is higher than that of direct links because of the higher incidence of regional round-tripping.
The ultimate investor view does not change the relative ranking of regional integration across regions. However, by neutralizing the effects of large investment hubs, it tends to reduce differences between regions. It indicates two separate clusters: one of highly integrated regions, with values of intraregional UO links between 20 per cent and 40 of total FDI stock in the region, including developed regions (Europe and North America) and East Asia; and a cluster consisting of all other regions, where the share of intraregional investment is marginal, between 5 and 15 per cent. In less-developed regions FDI stock is still mostly mobilized and owned by investors outside the region.
Disentangling regional FDI networks also sheds new light on the magnitude of South-South investment. The value of investment between developing countries falls significantly when applying the UO view (figure I.23). The total value of FDI bilateral stock between any two developing countries is more than $6 trillion, corresponding to half
Table I.11. Intraregional investment by region, bilateral inward stock, direct and ultimate, 2009 and 2019 (Billions of dollars and per cent)
Intraregional investment stock, 2019
(Billions of dollars)
Share of intraregional investment in total
FDI stock in region, 2019 (Per cent)
Change in share, 2009–2019
(Percentage points)
Direct Ultimate Direct Ultimate Direct Ultimate
Total 17 969 11 254 47 30 -9 -4
Europe 12 532 7 308 67 39 -11 -7
North America 913 1 086 18 21 -1 -
Africa 74 33 10 5 - 1
Asia 3 966 2 481 48 30 3 -
East Asia 2 613 1 579 50 31 4 1
South Asia 4 11 1 2 1 2
South-East Asia 277 111 12 5 -3 -2
West Asia 71 52 19 14 7 8
Latin America and Caribbean 386 161 12 5 2 -
Oceania 52 55 6 7 -3 -4
South-East Europe and CIS 46 130 5 15 1 3
Memorandum
AfCFTA 74 33 10 5 - 1
ASEAN 277 111 12 5 -3 -2
CPTPP 502 391 13 10 1 -1
EU 7 386 3 844 49 25 -7 -6
RCEP 1 481 1 826 23 28 - -1
USMCA 1 100 1 376 19 24 -4 -3
Source: UNCTAD bilateral FDI database. UNCTAD estimates.Note: AfCFTA = African Continental Free Trade Area, ASEAN = Association of Southeast Asian Nations, CIS = Commonwealth of Independent States, CPTPP = Comprehensive and
Progressive Agreement for Trans-Pacific Partnership, EU = European Union, RCEP = Regional Comprehensive Economic Partnership, USMCA = United States–Mexico–Canada Agreement.

34 World Investment Report 2021 Investing in Sustainable Recovery
Source: UNCTAD bilateral FDI database. UNCTAD estimates.Note: CAGR = compound annual growth rate.
6.2
2009
Direct (south-south FDI)
2019
As a share of global inward FDI stock
1.0
2009 2019
9.8%
CAGR
9.0%
CAGR
12% 16% 5% 7%
As a share of inward FDI stock in developing countries
44% 49% 19% 19%
Ultimate (south-south UO)
2.5 2.5
Investment between developing countries, bilateral inward stock, 2009 and 2019 (Trillions of dollars and per cent)
Figure I.23.
of the total FDI stock in developing countries. However, the value of UO links amounts only to $2.5 trillion, corresponding to only 20 per cent of total FDI stock in developing countries. Yet, the importance of South-South investment has been increasing in both the direct and ultimate views.
Chapter I Global Investment Trends and Prospects 35
1 UNCTAD’s underlying FDI trend index shows the trend in FDI excluding the effects of conduit flows, one-off transactions and intrafirm financial flows. For details on the methodology, see WIR19.
2 Ernst and Young, 12 January 2021, https://www.pharmaceutical-technology.com/features/biopharma-ey-ma-analysts-optimistic-for-2021-deals-after-a-mixed-2020/.
3 The food and agriculture sector comprises four major industries: (i) agriculture, forestry, and fishery (in the primary sector); (ii) manufacturing of food, beverages and tobacco; (iii) manufacturing of pesticide, fertilisers and other agricultural chemicals; and (iv) manufacturing of food product machinery. Due to the limitation of the dataset, manufacturing projects contribute a large proportion of the total value of investment announcements in this sector. In LDCs, a $3.3-billion fall in investment announcements in the manufacturing of pesticide, fertilisers and other agricultural chemicals) led to the 91 per cent decline in the food and agriculture investment from 2019 to 2020.
4 Excluding the effect of conduit flows, one-off transactions and intrafirm financial flows, the 2020 growth rate of global FDI becomes -24 per cent, as reported in table I.8. For methodological details on UNCTAD’s FDI forecasting model, see WIR20 and Vujanovic et al. (2021).
5 This merger will be finalized during 2021 and might not be completed until 2022.
6 Mostly in South Africa, Norway, the Republic of Korea, and Malaysia.
7 The FDI universe in this analysis is limited to countries that reported bilateral data in 2019, corresponding to more than 95 per cent of total FDI stock.
NOTES