good golly, why moly?
TRANSCRIPT
1
Good Golly, Why Moly?
The Stable Isotope Geochemistry of Molybdenum
Brian Kendall*
Department of Earth and Environmental Sciences
University of Waterloo
Waterloo, ON, Canada N2L 3G1
Tais W. Dahl*
Natural History Museum of Denmark
University of Copenhagen
Copenhagen, Denmark
Ariel D. Anbar
School of Earth and Space Exploration
School of Molecular Sciences
Arizona State University
Tempe, AZ 85287
* Both authors contributed equally to this work.
Accepted Manuscript for Reviews in Mineralogy and Geochemistry
2017
https://doi.org/10.2138/rmg.2017.82.16
1
1. INTRODUCTION 1
“The Answer to the Great Question... Of Life, the Universe and Everything... Is... 2
Forty-two,” said Deep Thought, with infinite majesty and calm… “I checked it very 3
thoroughly,” said the computer, “and that quite definitely is the answer.” 4
5
― Douglas Adams, The Hitchhiker's Guide to the Galaxy 6
7
Molybdenum (Mo) – the element with atomic number 42 – possesses unique properties that 8
make it the answer to many questions in the geosciences, life sciences, and industry. 9
In the geosciences, the redox sensitivity of Mo makes it particularly useful for answering 10
questions about environmental redox conditions. In particular, it was first suggested as an ocean 11
paleoredox proxy over 30 years ago (Holland, 1984; Emerson and Huested, 1991) – an 12
application that finally came to fruition in the late 1990s and 2000s when understanding of Mo 13
geochemical behavior in modern environments improved significantly (e.g., Crusius et al., 1996; 14
Helz et al., 1996, 2011; Morford and Emerson, 1999; Erickson and Helz, 2000; Barling et al., 15
2001; Siebert et al., 2003, 2005; Arnold et al., 2004; Vorlicek et al., 2004; Morford et al., 2005; 16
Algeo and Lyons, 2006; McManus et al., 2006; Poulson et al., 2006; Anbar et al., 2007; Wille et 17
al., 2007; Pearce et al., 2008; Archer and Vance, 2008; Neubert et al., 2008; Scott et al., 2008; 18
Gordon et al., 2009; Poulson Brucker et al., 2009). 19
In the life sciences, nature settled on Mo as the answer to the challenge of biological N2 fixation 20
at least ~ 2 billion years ago (Boyd et al., 2011), with the evolution of the Mo-dependent 21
nitrogenase enzyme. Molybdenum is also at the heart of nitrate reductase enzymes, which are 22
essential for assimilatory and dissimilatory nitrate reduction (Glass et al., 2009). Therefore, Mo 23
is central to the nitrogen biogeochemical cycle. This biological role combines with its 24
geochemical behavior in ways that might drive aspects of the coevolution of life and 25
environment (Anbar and Knoll, 2002). 26
Industrially, Mo is variously used as a catalyst, pigment, steel additive, and lubricant. Most of 27
this use is in different types of steel, to improve physical properties like hardness and 28
temperature strength, as well as chemical properties, notably corrosion resistance. Over 230,000 29
metric tons are used each year, mostly in China (IMOA, 2016). Porphyry molybdenum and 30
copper-molybdenum deposits are the most important sources of molybdenite, the ore mineral of 31
Mo. 32
Isotope geochemists were drawn to Mo because of its biogeochemical importance and economic 33
value, and its seven stable isotopes, all relatively abundant (10 – 25%) and covering a relatively 34
wide mass range of ~ 8% (Fig. 1). Beginning in the late 1990s, equipped with new multiple 35
collector inductively coupled plasma mass spectrometers, they began to wonder if Mo isotope 36
compositions varied significantly, and if Mo isotope fractionation could provide new answers to 37
yet more questions. 38

2
The subsequent ~15 years of research yielded an emphatic answer of “yes”, centered in particular 39
on paleoceanographic applications, but also extending to the solid Earth geosciences and other 40
areas. 41
This review provides an overview of this maturing isotope system, with an emphasis on 42
paleoredox applications that dominate the literature. It is intended as an update of the reviews 43
written when the Mo isotope system was still emerging (Anbar, 2004; Anbar and Rouxel, 2007). 44
Section 2 covers analytical methodology. Sections 3 and 4 provide the necessary context for Mo 45
isotope studies by reviewing Mo biogeochemistry and Mo isotope fractionation factors. Section 46
5 explores Mo isotope variations in meteorites and Earth reservoirs, with an emphasis on the 47
large database for marine sediments. In the context of modern observations of the ocean Mo 48
cycle, the use of Mo isotopes as a local and global ocean paleoredox proxy is synthesized in 49
section 6. In section 7, we explore the rapidly growing application of Mo isotopes to ore 50
deposits, oil, and anthropogenic tracing, areas that are expected to see strong growth in the near 51
future. 52
2. ANALYTICAL CONSIDERATIONS 53
Data Reporting 54
Molybdenum stable isotope fractionation is conventionally reported in δ98Mo notation as parts 55
per thousand deviation of the 98Mo/95Mo ratio relative to a universal reference material. Older 56
data were reported relative to in-house reference materials thought to be identical in composition. 57
However, the analytical precision has improved since then and a common reference material is 58
necessary because various in-house reference materials now differ by up to 0.37‰ (Goldberg et 59
al., 2013). The Mo standard solution, NIST-SRM-3134, has been defined as an international 60
reference material, and is assigned a distinct δ98Mo value of 0.25‰ to account for its offset from 61
the most common in-house standards used previously (Nägler et al., 2014). On this scale, the Mo 62
isotope composition of samples can be calculated as follows: 63
δ98Mo = [(98Mo/95Mo)sample /(98Mo/95Mo)NIST-SRM-3134) – 1] × 1000 + 0.25 [‰] 64
If the δ98Mo of the in-house reference material relative to the NIST-SRM-3134 standard is 65
known, then it is possible to re-normalize the Mo isotope composition of a sample from the in-66
house reference scale to the NIST-SRM-3134 scale. If the isotopic offset between the in-house 67
and NIST-SRM-3134 standards is not known, it is still possible to convert between the two 68
scales by measuring a well-known secondary standard such as seawater (e.g., IAPSO) or the 69
USGS rock reference material SDO-1, which has δ98Mo = 1.05 ± 0.14‰ (2σ = 2 standard 70
deviations) on the NIST-SRM-3134 scale (Goldberg et al. 2013; Nägler et al., 2014). 71

3
Hence, the NIST-SRM-3134 scale facilitates the comparison of future work with almost all older 72
data within a reasonable level of precision. On this scale, open ocean water samples have δ98Mo 73
= 2.34 ± 0.10‰ irrespective of ocean basin or water depth (Barling et al., 2001; Siebert et al., 74
2003; Greber et al., 2012; Nakagawa et al., 2012; Goldberg et al., 2013), except in the deep 75
waters of restricted anoxic basins (Nägler et al., 2011; Noordmann et al., 2015) or in highly 76
productive surface ocean waters (Kowalski et al., 2013). This is indistinguishable from the 77
canonical value of 2.3‰ suggested from earlier work. In this review, all values of δ98Mo are 78
reported relative to NIST-SRM-3134 = 0.25‰. 79
Chemical Separation 80
The Mo isotope composition of molybdenite (MoS2) can be measured precisely and accurately 81
using mass spectrometry after sample dissolution and dilution because Mo and S are the only 82
major elements in the molybdenite crystal structure (Barling et al., 2001). However, most other 83
natural materials have low Mo abundances (<100 ppm) and much higher concentrations of other 84
elements, and thus require pre-concentration and purification of Mo before the isotope 85
composition can be measured. Doing so minimizes the problem of matrix effects, which arise 86
when the presence of other elements causes the formation of ionic compounds with masses that 87
are similar to those of the Mo isotopes. Such "interferences" on Mo isotope masses can preclude 88
accurate measurement of Mo isotope compositions unless adequately corrected for or minimized. 89
Removal of Fe and Mn is particularly critical to minimize the formation of argides, which 90
produce polyatomic interferences at masses 94-97. For example, the Fe/Mo ratio in the analyte 91
should be less than 1 to avoid measurable interferences when using multiple collector inductively 92
coupled plasma mass spectrometry (MC-ICP-MS) (Malinovsky et al., 2005). Zirconium has 93
isobaric interferences with Mo on masses 92, 94 and 96, but Mo is efficiently separated from Zr 94
during purification. Both Ru and doubly-charged W interfere on masses 96-100 and 92, 95
respectively, but this has mainly been a concern for synthetic materials and meteorite samples 96
(Burkhardt et al., 2011; Migeon et al., 2015). Other elements including Si may affect the 97
measured isotope ratios, and Si/Mo ratios less than 50 are recommended to avoid such matrix 98
effects (Malinovsky et al., 2005). 99
For studies exploring Mo isotope variations in meteorites, where nucleosynthetic anomalies may 100
affect the Mo isotope compositions, the measurement of purified Mo without interferences from 101
Zr, Ru, and W is particularly important. Furthermore, comparison of mass-dependent Mo isotope 102
variations in meteorites requires a correction for the nucleosynthetic anomalies found in most 103
meteorite classes except for achondritic, lunar, and Martian meteorites (Burkhardt et al., 2014). 104

4
Traditionally, Mo is separated from the matrix elements using ion exchange chromatography. 105
Most schemes deploy both an anion exchange column (e.g., Bio-Rad™ AG1-X8, Dowex AG1, 106
Eichrom AG1X8) to separate Mo from Zr and most other matrix elements, and a cation exchange 107
column (e.g., Bio-Rad™ AG50W-X8 or TRU-spec) to mainly separate Mo from Fe (Anbar et 108
al., 2001; Barling et al., 2001; Siebert et al., 2001; Pietruszka et al., 2006; Migeon et al., 2015). 109
However, purification using a chelating resin (Malinovsky et al., 2005), anion-only resin (Siebert 110
et al., 2001; Pearce et al., 2009; Nagai and Yokoyama, 2016), or two distinct cation resins 111
(Archer and Vance, 2008; Burkhardt et al., 2011) has also been successfully done. 112
A key observation is that Mo isotopes are fractionated during elution in anion exchange systems 113
(e.g., Bio-Rad™ AG1-X8, Dowex AG1) (Anbar et al., 2001; Siebert et al., 2001). The magnitude 114
of fractionation depends on the column yield, but is large enough (~1‰/amu) to completely 115
swamp natural variability (Anbar et al., 2001; Siebert et al., 2001). Therefore, it is necessary to 116
either ensure quantitative yields during purification or to make a correction for isotope 117
fractionation induced by this process. Mixing and equilibrating sample Mo with a double spike 118
of known composition before purification allows for such a correction (discussed further below). 119
Mass Spectrometry 120
A fundamental challenge to stable isotope studies (not including mass-independent Mo isotope 121
variations produced by nucleosynthesis; Dauphas et al., 2002a, 2002b, 2004; Yin et al., 2002; 122
Fujii et al., 2006; Burkhardt et al., 2011, 2012) is that mass spectrometry induces mass-123
dependent isotope fractionation. Therefore, precise determination of the Mo stable isotope 124
composition depends on a precise correction for such fractionation processes. 125
The magnitude of isotope fractionation differs markedly between MC-ICP-MS and thermal 126
ionization mass spectrometry (TIMS). For MC-ICP-MS, the instrumental mass bias is large 127
(+17‰/amu), but very stable, whereas TIMS produces variable mass bias of smaller magnitude, 128
at -6.4‰/amu and -0.5‰/amu for positively and negatively charged ions, respectively (Wieser et 129
al., 2007; Nagai and Yokoyama, 2016). In both cases, the instrumental isotope fractionation 130
exceeds the variability in nature (~1‰/amu), and thus a correction for instrumental mass bias is 131
necessary. Wieser et al. (2007) compared the various mass spectrometric techniques and 132
concluded that MC-ICP-MS is the optimal method for accurately measuring the isotope 133
composition of Mo in natural materials. 134

5
The earliest Mo isotope measurements were performed using TIMS in positive ion mode (P-135
TIMS) with a Mo+ beam, resulting in an analytical precision of 6‰/amu for each Mo isotope 136
ratio, xMo/100Mo (Murthy, 1962, 1963; Wetherill, 1964). The large uncertainty was due to the 137
low ionization potential of Mo. Recently, it has been demonstrated that the latest generation 138
TIMS instruments operating in negative ion mode (N-TIMS), measuring MoO3-, can yield 139
precisions of <0.01‰/amu for xMo/100Mo (Nagai and Yokoyama, 2016). To achieve highly 140
precise Mo isotope ratios using N-TIMS, it is important to measure and correct for the oxygen 141
isotope composition of the MoO3- ions. 142
Three strategies have been applied to correct for instrumental mass bias during mass 143
spectrometric analysis, including 1) standard-sample bracketing, 2) elemental spiking, and 3) 144
double spiking. All methods are applicable to MC-ICP-MS, whereas double spiking is needed 145
for TIMS analysis. 146
All three methods are summarized below. 147
Standard-sample bracketing. The simplest correction for instrumental mass bias is comparison 148
of the sample to a standard run under the same instrumental conditions. Usually, analyses of 149
samples are bracketed by standards to cope with systematic instrumental drift. This correction 150
assumes that instrumental mass bias: a) has a constant drift during analysis, and b) does not vary 151
systematically between samples and standards. In TIMS, instrumental mass bias changes 152
continuously during analysis as a result of isotope enrichment during thermal evaporation and 153
ionization (Murthy, 1962, 1963). Therefore, the standard-sample bracketing method is more 154
applicable to MC-ICP-MS, where the instrumental mass bias is not a time-dependent 155
phenomenon (Maréchal et al., 1999). This approach has been successful for some non-traditional 156
isotope systems, including Fe (Beard et al., 2003), and may be suitable for isotopic analysis of 157
molybdenite (Pietruszka et al., 2006). However, an efficient purification protocol is required for 158
a trace metal such as Mo because variation in instrumental mass bias arising from matrix 159
differences between sample and standard solutions cannot be corrected for. If efficient 160
purification cannot be achieved, then other mass bias correction methods must be applied. 161
Element spike. In MC-ICP-MS, it is possible to dope the purified sample solution with another 162
element immediately before analysis and simultaneously monitor changes in instrumental mass 163
bias and Mo isotope fractionation in the sample. In principle, this correction is applicable without 164
standard-sample bracketing, but typically it is used in combination with bracketing standards 165
doped in an identical fashion as the samples. Some of the first modern observations of Mo 166
isotope fractionation in geological materials employed Zr and Ru element spikes to yield δ98Mo 167
values with a precision of ~0.3‰ (2σ) (Anbar et al., 2001). Later refinements improved precision 168
to ~0.15‰ (2σ) (e.g., Duan et al., 2010). However, this approach rests on the assumption that the 169
instrumental mass bias of Zr or Ru isotopes varies systematically with the instrumental mass bias 170
of Mo isotopes. 171
6
Isotopic double spike. For both MC-ICP-MS and TIMS, a correction for mass-dependent isotope 172
fractionation that occurs during non-quantitative chromatographic purification and mass 173
spectrometric analysis can be made using an isotopic double spike. The spike consists of two Mo 174
isotopes with a known isotopic ratio. The fundamental advantage of this approach is that the 175
spike isotopes follow exactly the same fractionation law as the isotopes of interest. This method 176
can correct for isotope fractionation incurred during both chemical separation and mass 177
spectrometry (Wetherill, 1964; Siebert et al., 2001). Therefore, a more pure chemical separation 178
can be prioritized instead of an optimum yield. 179
Due to its large number of stable isotopes (Fig. 1), Mo is particularly suitable for the double 180
spike method, which thus has become the favored method for correcting isotope fractionation 181
induced in the laboratory (Skierszkan et al., 2015). Several laboratories have calibrated and 182
adopted a 97Mo-100Mo spike to obtain δ98Mo data on an in-house standard solution that has a 183
long-term external reproducibility of better than ±0.12‰, reaching as low as 0.04‰ (2σ) (Siebert 184
et al., 2001; Goldberg et al., 2013; Willbold et al., 2016). Data from molybdenite samples 185
utilizing TIMS and a 94Mo-100Mo spike with no chemical purification yielded Mo isotope ratios 186
with uncertainties of 0.12‰/amu at the 2σ level (Hannah et al., 2007; Wieser et al., 2007). 187
Recently, Nagai and Yokohama (2016) utilized a 92Mo-97Mo-100Mo triple spike and N-TIMS to 188
determine Mo isotope ratios in a standard solution with a reproducibility of ~0.01‰/amu at the 189
2σ level (i.e., ~10 ppm on the 96Mo/95Mo ratio). 190
3. CHEMICAL AND BIOLOGICAL CONTEXT 191
Aqueous Geochemistry 192
In the surface environment, interest in Mo has long revolved around its dynamic redox behavior 193
(e.g., Bertine and Turekian, 1973; Morford and Emerson, 1999). Under oxygenated conditions, 194
Mo is a highly mobile and conservative element that accumulates in seawater to such an extent 195
that it is the most abundant transition metal in the oceans (~ 107 nmol kg-1; Morris, 1975; 196
Bruland, 1983; Collier, 1985). In contrast, in H2S-bearing waters, Mo is readily removed from 197
solution, leading to pronounced sedimentary enrichments (e.g., Bertine and Turekian, 1973; 198
Emerson and Huested, 1991; Crusius et al., 1996; Scott and Lyons, 2012). This bimodal 199
behavior has made Mo – and its isotopes – particularly powerful for paleoredox investigations. 200
7
This bimodality can be understood in terms of chemical speciation. Mo is easily oxidized, so 201
that Mo(VI) species occupy the largest area of Eh-pH phase space, particularly at typical 202
seawater and freshwater conditions (Fig. 2). Mo(VI) readily forms the oxyanion molybdate 203
(MoO42-), which coordinates only weakly with other environmentally common inorganic 204
ligands such as Cl- or OH-. Thus, the tetrahedrally coordinated oxyanion MoO42- is thought to 205
dominate aqueous speciation. However, recent work suggests a significant role for Mo(V) 206
species such as MoO2+ (Wang et al., 2011). The potential importance of this species can be seen 207
in Fig. 2, which compares the distribution of Mo species in Eh-pH space (a) with, and (b) 208
without MoO2+. This cationic species could be important at pH < 8 in dysoxic settings, but the 209
behavior of Mo in oxic surface waters generally fits with the low reactivity of MoO42-. Organic 210
complexes also play a role in natural environments, which has been recognized for a long time 211
(Szilagyi, 1967; Nissenbaum and Swaine, 1976), and remains an active area of investigation 212
(Wichard et al., 2009). 213
The best analogy for Mo environmental chemistry is S, with MoO42- and SO4
2- having similar 214
behaviors and distributions due to similar charges, coordination, and ionic radii as well as 215
element redox behaviors. Not surprisingly, Mo and SO42- concentrations are well-correlated in 216
surface water systems (Miller et al., 2011). 217
Other molybdate species, such as HMoO4- and H2MoO4 ("molybdic acid"), become 218
quantitatively important only at pH < 6 (Fig. 2), but may play a role in Mo adsorption to 219
cationic surfaces. Aqueous polynuclear molybdate species ("polymolybdates") such as Mo6O192-220
, Mo7O242-, or Mo8O26
4- will dominate the solution at pH < 8 when Mo concentrations are >1 221
mM, while MoO42- should dominate at all concentrations below 100 µM above a pH of 4 (Baes 222
and Mesmer, 1976). While millimolar-level Mo concentrations are rare in the environment, 223
polymolybdates are implicated on some mineral surfaces. Such octahedrally coordinated Mo 224
compounds may play an important role in Mo adsorption to Mn and Fe oxides, reflecting a 225
change in Mo coordination geometry after MoO42- has been attracted to protonated oxide 226
mineral surfaces, as discussed further below (Wasylenki et al., 2011). 227
In sulfidic aqueous solutions, MoO42- is progressively transformed into thiomolybdate species 228
(MoO4-xSx2-; Saxena et al., 1968; Diemann and Müller, 1973). At [H2S]aq > 11 µM, the stable 229
thiomolybdate species is MoS42- (Erickson and Helz, 2000). This “switchpoint” corresponds to 230
22-125 µM total sulfide (∑S2- = H2S + HS- + S2-) at a pH of 7-8, typical of natural sulfidic 231
waters. 232
Polynuclear Mo sulfide species including Mo2S72-, Mo4S15
6-, and Mo4S132-, are reported from 233
continuous acidification experiments with molar-level thiomolybdate solutions (Saxena et al., 234
1968). Ultimately, the hexavalent MoS3 dominates at pH < 2.4 (Helz et al., 1996). Polynuclear 235
Mo sulfide species have not been observed in sulfidic experiments with 40-350 µM Mo, and are 236
probably irrelevant at the low Mo concentration in sulfidic aqueous environments (<10 nM) 237
(Vorlicek et al., 2004). 238

8
As discussed further below, it is well-documented that Mo is rapidly removed from solution in 239
H2S-rich waters. Early studies assumed that MoS2 precipitated via molybdate reduction in 240
natural sulfidic systems (Amrhein et al., 1993): 241
MoS42- + 2 e- + 2 HS- + 6 H+ <=> MoS2 + 4 H2O ΔG0 = - 314.3 kJ/mol 242
However, MoS2 precipitation is kinetically hindered in most Earth surface environments studied 243
to date (e.g., Helz et al., 1996; Bostick et al., 2003; Chappaz et al., 2008; Dahl et al., 2013a). 244
Instead, the chemistry of thiomolybdate species likely plays a role. In particular, these species 245
are thought to be particle-reactive (Helz et al., 1996) and so may be removed from solution in 246
association with sinking particulates (discussed below in section 5). Yet, there is still a large gap 247
in our understanding of this removal process. 248
Mo is found as distinct Mo(IV)-sulfide compounds in unknown, submicron, dispersed forms in 249
anoxic muds and organic-rich mudrocks (Helz et al., 1996; Bostick et al., 2003; Dahl et al., 250
2013a). Hence, post-thiomolybdate reactions involve a Mo reduction step. Zero-valent sulfur 251
present in natural sulfidic environments can reduce thiomolybdate to form highly reactive Mo 252
polysulfide anions (Vorlicek et al., 2004) that, in turn, readily adsorb onto FeS2, FeS (Bostick et 253
al., 2003; Helz et al., 2004), and clay minerals (i.e., illite and Fe-contaminated kaolinite and 254
montmorillonite) (Helz et al., 2004). Scavenging with particulate organic matter is indicated in 255
experiments with sulfate reducing bacteria where Mo precipitation occurs on the periphery of 256
cells (Biswas et al., 2009). This may also explain the general relationship between Mo and 257
organic carbon contents in euxinic sediments (discussed further below). 258
More recently, it was hypothesized that Mo removal in sulfidic systems is controlled by 259
precipitation of an Fe(II)-Mo(VI) sulfide phase to form nanoscale mineral particles with the 260
chemical formula Fe5Mo3S14 (Helz et al., 2011). This Mo-Fe-S phase would be consistent with 261
the observed association of Mo with organic matter in sediments, since Mo-Fe-sulfides may be 262
embedded in an organic matrix (Dahl et al., 2013a). The actual removal pathway(s) remain an 263
area for future study. 264
Biology 265
Molybdenum is the only second-row transition metal in the periodic table that is required by 266
most living organisms (Hille, 2002). Like Fe, Mo is an essential micronutrient required by 267
enzymes catalyzing key reactions in global C, S, and N metabolism (e.g., Mendel and Bittner, 268
2006). This capacity makes Mo an important element in biology despite its scarcity at the 269
Earth’s surface (~1 ppm), and has presumably led to the evolution of efficient processes for Mo 270
uptake, such as production of siderophore-like binding ligands that target Mo (e.g., Liermann et 271
al., 2005; Bellenger et al., 2008). 272

9
The reason for the critical biological role of Mo is probably due to the low reduction potentials 273
of several oxidation states compared with other metals (Fig. 3). The fact that multiple Mo 274
oxidation states can be accessed over a narrow range of voltages makes Mo relatively "redox 275
labile" at low environmental Eh, but it also means that the energy gain from Mo redox 276
transformations is small compared to many other elements. Therefore, unlike Fe and Mn, Mo is 277
not used as a terminal electron acceptor or donor in metabolic pathways. 278
The redox lability makes Mo well-suited as a co-factor in enzymes that catalyze redox reactions. 279
The enzymes that utilize Mo can be grouped into two broad categories: (1) the nitrogenases and 280
(2) the mononuclear Mo enzymes (Stiefel, 1997). 281
Nitrogenase is the enzyme responsible for nitrogen fixation that converts atmospheric N2 to 282
biologically-useful NH3. Biological nitrogen fixation only occurs in prokaryotes, and is essential 283
for maintaining the nitrogen cycle on Earth. In nitrogenases, Mo sits in a multinuclear Fe-Mo-S 284
cluster known as the FeMo-cofactor, where the six-electron transfer reduction takes place (Rees 285
et al., 2005). Alternative nitrogenases utilizing Fe, W or V in place of Mo do exist, but they are 286
markedly less efficient (Miller and Eady, 1988; Eady, 1996). 287
The remaining Mo-containing enzymes include more than 30 distinct enzymes that govern a 288
wide variety of bioessential redox processes of environmental, agronomic, and health relevance. 289
Examples include nitrate reductase, sulfite oxidase, formate dehydrogenase, xanthine oxidase, 290
DMSO reductase, and aldehyde oxidase (Hille, 1996; Stiefel, 1997). These enzymes are not 291
confined to prokaryotes, but also occur in eukaryotic organisms, including humans. They all 292
contain the Mo cofactor (Moco), which is chemically, biochemically, and genetically distinct 293
from the nitrogenase cofactor (FeMoco). The Moco enzymes all share common structural 294
features with Mo situated at the active center coordinated via S to one or two unusual pterin 295
ligands ("molybdopterin" ligands) and usually one or more oxo groups, depending on the 296
oxidation state of the Mo center. These enzymes carry out two electron transfer (O transfer) 297
reactions (Romao et al., 1997). 298
Molybdenum deficiency is rare, as are disorders of Mo metabolism, but symptoms may be 299
induced in diets rich in Cu or W, which are Mo antagonists. On the other hand, 300
tetrathiomolybdate has a strong affinity for Cu, and is an active agent for treatment of disorders 301
of copper metabolism (Alvarez et al., 2010). 302
Molybdenum plays an important role in biology despite its scarcity at the Earth's surface, likely 303
reflecting a combination of the unique chemical character of this element, evolutionary 304
adaptation to higher Mo availability in increasingly more oxygenated oceans, or a legacy of 305
early evolution in Mo-rich environments such as prebiotic chemical evolution in association 306
with sulfide minerals (e.g., Crick and Orgel, 1973; Anbar and Knoll, 2002). 307

10
Molybdenum limitation (< 5 nM) in some freshwater lakes can limit rates of nitrogen fixation 308
and nitrate reduction when NH4+ is unavailable and biology must rely on N2 and NO3
- as sole N 309
sources (Glass et al., 2012). Growth experiments show that N2 fixation slows down at 1-5 nM 310
Mo in cyanobacteria, presumably due to the expression of high affinity ModABC MoO42- 311
uptake systems, which are widely distributed in bacteria and archaea (Zerkle et al., 2006; Glass 312
et al., 2010). 313
It has been hypothesized that Mo concentrations in Proterozoic oceans were low enough that 314
Mo and N could have co-limited marine primary production (Anbar and Knoll, 2002). The Mo 315
concentration in seawater was lower in the Proterozoic, but it is unclear how this influenced 316
marine productivity (Scott et al., 2008; Dahl et al., 2011; Reinhard et al., 2013a). Phylogenetic 317
studies suggest that the Nif proteins necessary for N2 fixation were not present in the last 318
universal common ancestor (LUCA). Molecular clock estimates suggest a Proterozoic origin, 319
some 2,200–1,500 Myr ago (Raymond et al., 2003; Boyd et al., 2011; David and Alm, 2011), 320
although a recent estimate suggests nitrogen fixing cyanobacteria diversified only 850–635 Myr 321
ago (Sánchez-Baracaldo et al., 2014). In contrast, the Moco enzymes are distributed widely 322
amongst extant organisms in the tree of life and could have been present in LUCA (Schoepp-323
Cothenet et al., 2012). The Mo availability and Mo requirements of early life continue as 324
subjects of scrutiny. 325
4. FRACTIONATION FACTORS 326
Molybdenum isotope fractionation during both abiotic and biotic chemical reactions has been 327
studied in controlled laboratory experiments, in natural systems, and in theoretical ab initio 328
calculations. Key conclusions from these studies are reviewed below. 329
The Mo isotope fractionation observed to date is mass-dependent. Mass-dependent stable isotope 330
fractionation is fundamentally a quantum chemical phenomenon arising from differences in the 331
zero-point energies (ZPEs) between chemical bonds that are identical except for isotopic 332
substitution (Bigeleisen, 1947; Urey, 1947). The mass dependence of bond strengths leads to 333
differences in reaction rate constants, which give rise to kinetic isotope effects when reactions 334
are unidirectional or incomplete. It also leads to mass dependence of equilibrium constants, so 335
that an isotope offset exists between the reactant and product even for a system that has had 336
infinite time to react (e.g., White, 2015). 337
Adsorption to Mn Oxides 338

11
The largest Mo isotope fractionation in nature occurs during Mo adsorption onto Mn oxides in 339
oxic seawater. This process has been studied in controlled laboratory experiments, which show 340
that lighter Mo isotopes are preferentially adsorbed onto the mineral surface. Experiments with 341
poorly crystalline potassium birnessite (~K0.5Mn3+Mn4+O4·1.5H2O) in synthetic seawater yield a 342
fractionation factor Δ98Mosolution-MnOx = 2.7 ± 0.1 ‰ at 25°C (or = 1.0027; ~ ( – 1) x 1000) 343
(Barling and Anbar, 2004; Wasylenki et al., 2008). This finding is in excellent agreement with 344
the isotopic difference between Mo in seawater and natural ferromanganese sediments (Barling 345
et al., 2001; Siebert et al., 2003; Arnold et al., 2004). This fractionation is only weakly dependent 346
on temperature and ionic strength (Wasylenki et al., 2008). It follows the behavior of closed-347
system equilibrium isotope exchange rather than an open-system with irreversible Rayleigh 348
distillation (Fig. 4), suggesting that the mechanism is a reversible equilibrium isotope effect 349
(Barling and Anbar, 2004). 350
Ironically, this substantial isotope fractionation appears to be decoupled from the versatile redox 351
chemistry of Mo, and instead results from the change in Mo coordination geometry between 352
MoO42- in oxic seawater and Mo adsorbed onto the mineral (Siebert et al., 2003; Wasylenki et 353
al., 2011; Kashiwabara et al., 2011). Whereas MoO42- is tetrahedrally coordinated, EXAFS 354
studies reveal that Mo on the mineral surface is present as octahedrally coordinated 355
polymolybdate species (e.g., Mo6O192-). Ab initio calculations show that Mo isotope fractionation 356
between MoO42- and polymolybdates in solution produces the observed fractionation factor 357
across a range of temperatures (Wasylenki et al., 2011). Mo may also exist in solution and on 358
surfaces in other octahedrally coordinated compounds, such as Mo(OH)6 and MoO3(H2O)3, but 359
these species do not reproduce the observed isotope fractionation (Liu, 2008; Oyerinde et al., 360
2008; Wasylenki et al., 2008). 361
The predicted concentration of polynuclear Mo species in seawater is <10-41 M, corresponding to 362
< 8000 molecules in the entire ocean. Hence, the mechanism of Mo isotope fractionation on Mn 363
oxide surfaces highlights the unique chemistry possible on mineral surfaces. Most likely, 364
protonated surfaces attract negatively charged MoO42- to the mineral surface. Diprotonated 365
molybdic acid at the surface could lead to the formation of polymolybdates (Wasylenki et al., 366
2011). 367
Adsorption to Fe Oxides and Oxyhydroxides 368

12
A range of fractionation factors occur during Mo adsorption onto magnetite, ferrihydrite, 369
goethite, and hematite minerals, with lighter Mo isotopes preferentially removed from solution 370
(Goldberg et al., 2009). The isotopic difference between the solid (A) and dissolved (B) phases 371
increases at higher pH, and also varies with mineralogy, increasing in the order magnetite 372
(Δ98Mo = 0.83 ± 0.60 ‰) < ferrihydrite (Δ98Mo = 1.11 ± 0.15 ‰) < goethite (Δ98Mo = 1.40 ± 373
0.48 ‰) < hematite (Δ98Mo = 2.19 ± 0.54 ‰) at 25°C. The observed isotope behavior is 374
consistent with both adsorption onto the mineral surface and adsorption of different Mo 375
species/structures from solution. For example, both molybdate and an octrahedrally coordinated 376
Mo compound may adsorb onto the mineral with decreasing molybdate affinity for the minerals 377
in the order listed above. The Mo speciation in the Fe-oxyhydroxide minerals has not been 378
directly measured. 379
Sulfidic Species 380
Molybdate reacts with hydrogen sulfide in anoxic aqueous solutions to form thiomolybdates 381
following the reaction scheme: 382
MoO42- → MoO3S
2- → MoO2S22- → MoOS3
2- → MoS42- 383
(mono-) (di-) (tri-) (tetra-) thiomolybdate 384
Each step involves a ligand exchange with S donated from H2S, and O inserted into H2O. There 385
is a geochemical switchpoint at [H2S]aq = 11 µM, above which Mo exists primarily as 386
tetrathiomolybdate (MoS42-) (Erickson and Helz, 2000). The intermediate oxythiomolybdates are 387
only minor species in solution. For example, MoS42- should account for up to 83% of the total 388
dissolved Mo pool in the deep Black Sea, with MoOS32- being the second most abundant species 389
(Nägler et al., 2011). The more S-rich oxythiomolybdate species are considered particle-reactive 390
and so will be removed from solution. 391
Ab initio calculations indicate that there is a large isotope fractionation associated with each step 392
in this reaction scheme (Tossell, 2005). At equilibrium, the isotopic differences calculated for the 393
(MoO42- - MoO2S2
2-) pair and the (MoO42- - MoS4
2-) pair at 25°C are -2.4‰ and -5.4‰, 394
respectively (recalculated to δ98Mo; Tossell, 2005; Nägler et al., 2011). By interpolation, the four 395
isotope fractionation factors are Δ98Mo0,1 = Δ98Mo1,2 = 1.20‰ and Δ98Mo2,3 = Δ98Mo3,4 = 396
1.50‰, where the subscripts (x,y) represent the number of S atoms in the reactant (x) and 397
product (y) species. The magnitude of fractionation is higher in cooler waters, e.g. Δ98Mo0,1 = 398
Δ98Mo1,2 = 1.40‰ and Δ98Mo2,3 = Δ98Mo3,4 = 1.75‰ in the deep Black Sea (9°C). 399

13
Although the thiomolybdate species have not been measured separately, observations from the 400
Black Sea, Lake Cadagno, and Kyllaren Fjord show that the sulfidic waters are ~0.5‰ heavier 401
than the source waters (Dahl et al., 2010a; Nägler et al., 2011; Noordmann et al., 2015). The 402
muted fractionation relative to that predicted from ab initio calculations can be reconciled if 403
multiple oxythiomolybdate species are particle-reactive and scavenged to the sediments (Dahl et 404
al., 2010a; Nägler et al., 2011). Indeed, controlled precipitation experiments with FeS2 show that 405
both MoOS32- and MoS4
2- are particle-reactive (Vorlicek et al., 2004). Although the fractionation 406
factors between consecutive oxythiomolybdate species in solution are large, there is little or no 407
isotope offset expressed between sediments and the Mo source (e.g., seawater) because Mo is 408
quantitatively scavenged from the deep waters in these restricted euxinic basins (Neubert et al., 409
2008; Dahl et al., 2010a; Nägler et al., 2011; Noordmann et al., 2015). 410
Biological Processes 411
Molybdenum assimilation in the nitrogen-fixing soil bacterium, A. Vinelandii, is associated with 412
the preferential incorporation of lighter Mo isotopes, with a fractionation of Δ98Mo = -0.45‰ 413
(Liermann et al., 2005; Wasylenki et al., 2007). The uptake pathway involves Mo chelation by 414
high-affinity metal-binding ligands, such as the cathecolate "molybdophore" azotochelin, where 415
Mo sits in an octahedral coordination geometry (Bellenger et al., 2008). There are several 416
possible fractionating steps, including Mo release from the chelate, conversion to tetrahedrally 417
coordinated MoO42-, and uptake in the periplasmic modA transporter protein. The latter is 418
common among bacteria and archaea. Isotope fractionation could result from: 1) simple kinetic 419
effects associated with irreversible Mo transport; 2) coordination changes during incomplete 420
uptake or release from the chelating ligand and/or the Mo transporter protein; or 3) sorption of 421
Mo onto the cell surface (Liermann et al., 2005; Wasylenki et al., 2007). Molybdenum 422
adsorption onto organic matter of algal origin may cause Mo isotope fractionation with a similar 423
isotope enrichment factor (–0.3‰) in productive surface waters (Kowalski et al., 2013). 424
However, Mo isotope fractionation during uptake may not be the only biological story. Studies 425
of the filamentous heterocystous cyanobacterium Anabaena Variabilis also show isotope 426
fractionation between cells and media (Zerkle et al., 2011). A. Variabilis is a freshwater species 427
with Mo-dependent enzymes capable of both N2-fixation and nitrate reduction. Heterocystous 428
cyanobacteria are relatively rare in the modern oceans. However, several lines of evidence point 429
to shared biochemical pathways for Mo uptake and utilization in marine and freshwater 430
cyanobacteria (Zerkle et al., 2011). The isotope fractionation depended on the cell function. 431
During growth on nitrate, A. Variabilis consistently produced Δ98Mocells-media of -0.3 ± 0.1 ‰. 432
When fixing N2, A. Variabilis produced Δ98Mocells-media of -0.9 ± 0.2 ‰ during exponential 433
growth and -0.5 ± 0.1 ‰ during the stationary phase (very slow metabolic/growth rates). This 434
variability demonstrates that Mo isotope fractionation can be more complex than a simple kinetic 435
effect during Mo uptake because the same uptake system was likely involved in all experiments. 436

14
To explain these observations, Zerkle et al. (2011) hypothesized a reaction network model that 437
assumes no isotope fractionation during Mo transport into and out of the cell, and equilibrium 438
isotope fractionation between tetrahedrally bound MoO42- in storage proteins and octahedrally 439
bound Mo in the enzymes, applying a fractionation factor α98/95 = 0.9982 derived from ab initio 440
calculations. They infer that the isotope fractionation is influenced by the relative proportion of 441
Mo bound to storage proteins vs. Mo bound to enzymes. This model indicates that the largest 442
isotope fractionation was observed during N2 fixation because at conditions of high Mo demand, 443
less Mo is bound to storage proteins (Zerkle et al., 2011). 444
High-temperature Melt Systems 445
Limited data are available for fractionation factors between mineral-melt pairs and silicate-metal 446
liquid pairs in high-temperature systems. Voegelin et al. (2014) estimated biotite-melt and 447
hornblende-melt fractionation factors at ~700°C using Mo isotope data from volcanic dacite 448
(representing quenched melt) and single mineral separates. In the two dacite samples they 449
examined, biotite and hornblende had lower δ98Mo than the host rock, with the largest expression 450
of isotope fractionation being 0.4‰ and 0.6‰, respectively, in the sample with the lower 451
abundance of these minerals. Hence, these are minimum fractionation factors for biotite-melt and 452
hornblende-melt pairs, respectively. 453
Fractionation of Mo isotopes during metal-liquid segregation has also been investigated 454
experimentally at 1400°C and 1600°C using a centrifuging piston cylinder, with the goal of 455
exploring the use of Mo isotopes for inferring the temperature of planetary core formation (Hin 456
et al., 2013). These experiments suggest that the fractionation factor between metal and silicate 457
liquids is insensitive to oxygen fugacity at the conditions expected for core formation, as well as 458
silicate melt composition and the C and Sn content of metallic melts. An equilibrium Mo isotope 459
fractionation factor of 0.19 ± 0.03 ‰ and 0.12 ± 0.02 ‰ (95% confidence interval), favoring 460
lighter isotopes in the metallic melt, was determined for 1400°C and 1600°C, respectively. From 461
these measurements, Hin et al. (2013) inferred the temperature dependence of Δ98Mo to be 462
Δ98Mometal–silicate= −4.70 (± 0.59) × 105/T2 (2σ). Hence, resolvable Mo isotope fractionation 463
between silicate and metallic liquids is expected to occur up to 2500°C (>0.06‰). 464
5. MOLYBDENUM ISOTOPES IN MAJOR RESERVOIRS 465
Meteorites 466

15
Most iron meteorites and ordinary, enstatite, and carbonaceous chondrites have a narrow range 467
of δ98Mo (average = 0.09 ± 0.02 ‰; 95% confidence interval, n = 12) (Fig. 5; Burkhardt et al., 468
2014). Higher δ98Mo for some iron meteorites and carbonaceous chondrites may reflect 469
evaporative loss of isotopically light Mo, although isotopic heterogeneity in the region of 470
carbonaceous chondrite formation is also a possibility. Achondrites typically have higher δ98Mo 471
(up to ~1.2‰) than chondrites because of the preferential removal of lighter Mo isotopes to 472
metallic liquids during planetary differentiation (Burkhardt et al., 2014), as confirmed by 473
experiments on silicate-metal isotopic partitioning (Hin et al., 2013). The temperature at which 474
silicate and metal phases segregated during planetary differentiation can be estimated using the 475
achondrite δ98Mo and the metal-silicate equilibrium fractionation factor assuming quantitative 476
metal segregation in the core (e.g., 1800 ± 200 °C for the moon). However, some achondrites 477
have δ98Mo that is higher than modeled for planetary core formation. This high δ98Mo may 478
reflect later processes such as high-temperature metamorphism or terrestrial weathering of fallen 479
meteorites on Earth's surface (Burkhardt et al., 2014). 480
High-precision Mo isotope measurements in meteorites have revealed mass-independent 481
variations in isotope composition arising from nucleosynthetic processes. Heavy elements such 482
as Mo were synthesized in red giant stars (s-process) and supernovae (r-process and p-process) 483
and so bulk meteorites exhibit small, but resolvable, mass-independent nucleosynthetic isotope 484
anomalies in many elements, including Mo, that indicate presolar dust was not isotopically 485
homogenized by high temperatures and mixing during solar system formation (Dauphas et al., 486
2002a, 2002b, 2004, Yin et al., 2002; Chen et al., 2004; Burkhardt et al. 2011, 2012). With 487
respect to tracing isotopic heterogeneity within the early solar system and inferring the source of 488
solar nebula material, the Mo isotope system is a valuable tool because four of the Mo isotopes 489
are produced by only one nucleosynthetic process: 92Mo and 94Mo from the p-process; 96Mo 490
from the s-process; and 100Mo from the r-process (Arlandini et al., 1999). 491
Early studies demonstrated Mo isotope heterogeneity in solar system materials. Dauphas et al. 492
(2002a, 2002b) reported isotopic evidence from iron meteorites, mesosiderites, pallasites, and 493
chondrites for s-process depletion and/or enrichment in r- and p-process nuclides relative to 494
terrestrial samples. Carbonaceous chondrites were found to have decoupled p- and r- process 495
anomalies, even though both processes are associated with supernovae, implying that the feeding 496
zone(s) of carbonaceous chondrites contained material from multiple supernova sources that had 497
not been isotopically homogenized (Yin et al., 2002; Chen et al., 2004). 498

16
Although one early study did not find nucleosynthetic anomalies in either primitive or 499
differentiated meteorites (Becker and Walker 2003), likely because isotope measurements were 500
being done at the edge of analytical capabilities at the time, recent analyses have confirmed these 501
findings (Burkhardt et al., 2011, 2012). Notable exceptions include angrites, IAB-IIICD irons, 502
and Martian meteorites, which have terrestrial isotopic compositions. Most other bulk meteorites 503
exhibit depletions in Mo produced by the s-process. Carbonaceous chondrites such as Murchison 504
seem to have multiple presolar components of variable isotopic composition, including calcium-505
aluminum-rich inclusions predominantly enriched in r-process Mo and SiC grains enriched in s-506
process Mo (Dauphas et al., 2002b; Burkhardt et al., 2011, 2012). By contrast, the Earth is 507
enriched in s-process Mo, implying that Earth accreted from material of different isotopic 508
composition compared with the known meteorite classes (Burkhardt et al., 2011). 509
The Mo isotope anomalies in bulk meteorites for each meteorite class are well-correlated with 510
Ru isotope anomalies as predicted by nucleosynthesis theory, thus confirming that the observed 511
anomalies resulted from variations in s-process contributions from low-mass AGB stars 512
(Dauphas et al., 2004; Burkhardt et al., 2011). The magnitude of nucleosynthetic anomalies is 513
generally greater in meteorites that are older and derived from smaller parent bodies, suggesting 514
progressive isotopic homogenization of the solar nebula over time. Because carbonaceous 515
chondrites have even larger nucleosynthetic Mo isotope anomalies than expected given their old 516
age, the material that formed these primitive meteorites may have originated from further out in 517
the solar system (where isotopic homogenization proceeded more slowly at lower temperatures) 518
compared with other meteorites (Burkhardt et al., 2011). 519
The Mantle and Crust 520
The average δ98Mo of the bulk silicate Earth (BSE; crust + mantle; the mantle dominates the 521
mass balance) is estimated to be 0.04 ± 0.12 ‰ (2σ) using four sets of komatiite samples from 522
widely separated localities (Greber et al., 2015a). Komatiites provide a good estimate of the 523
mantle δ98Mo because the high degree of partial mantle melting necessary to form komatiitic 524
melts results in essentially quantitative melting of sulfide minerals in the mantle source, and thus 525
complete transfer of Mo and its isotope composition from the mantle source to melts. The 526
excellent agreement between the δ98Mo of the BSE and chondritic meteorites indicates that full 527
isotopic equilibrium was attained between the Earth's core and mantle at high temperatures 528
(>2500°C) during the moon-forming impact (Greber et al., 2015a). At such high temperatures, 529
Mo isotope fractionation between co-existing metal and silicate phases is minimal (Hin et al., 530
2013). 531
In contrast to the isotopic homogeneity of most meteoritic and mantle materials, pronounced 532
variability exists in the δ98Mo of the crust. Indeed, the entire range of δ98Mo observed in solid 533
Earth materials is represented by the rocks and minerals of Earth's crust. Significant efforts have 534
thus been devoted to explaining this isotopic variability. 535

17
Data from subduction zones reveal that Mo isotope fractionation accompanies crustal formation. 536
In the Mariana island arc, lavas have δ98Mo up to 0.3‰ higher than the average mantle/BSE 537
value, suggesting that continental crust has slightly higher δ98Mo than the mantle (Freymuth et 538
al., 2015; Greber et al., 2015a). The source of the isotopically heavy Mo may be fluids released 539
during dehydration of the subducting slab. In the Aegean continental arc (Kos Island, Greece), 540
fractional crystallization is suggested to have increased the δ98Mo of magmas as they evolved to 541
more silica-rich compositions (Voegelin et al., 2014). The δ98Mo of biotite and hornblende 542
mineral separates suggests minimum melt-crystal fractionation factors of 0.4‰ and 0.6‰, 543
respectively, with lighter isotopes preferentially incorporated into the fractionating crystals. 544
Hence, fractional crystallization may explain the higher δ98Mo of dacites (0.6 ‰) compared with 545
basalts (0.3‰) at Kos Island. By contrast, negligible Mo isotope fractionation was observed in a 546
suite of basalts to rhyolites in a mid-ocean ridge setting (Hekla volcano, Iceland). At the 547
Icelandic locality, all samples yield an average δ98Mo of 0.10 ± 0.05 ‰ that is indistinguishable 548
from the mantle (Yang et al., 2015). 549
These observations indicate that the types of minerals crystallizing from the magma and their 550
associated liquid-crystal fractionation factors exert some control on Mo isotope fractionation 551
during magmatic differentiation. Amphibole and biotite did not crystallize from the largely 552
anhydrous Hekla magmas, thus possibly explaining the lack of Mo isotope fractionation during 553
magmatic differentiation in that mid-ocean ridge setting (Yang et al., 2015). Hence, the tectonic 554
environment (e.g., subduction zone versus mid-ocean ridge) may influence high temperature Mo 555
isotope fractionation via its effect on magmatic chemistry. 556
Least-altered mid-ocean ridge basalts from near the Mariana arc have δ98Mo similar to the 557
mantle, suggesting that decompression partial melting in the upper mantle is not accompanied by 558
appreciable Mo isotope fractionation (Freymuth et al., 2015). The lack of Mo isotope 559
fractionation in anhydrous systems may thus allow Mo isotopes to serve as a tracer of parent 560
magma composition and possibly depleted versus enriched mantle sources (e.g., from analysis of 561
ocean island basalts; Freymuth et al., 2015; Yang et al., 2015). 562
Crustal sulfide minerals and organic-rich mudrocks are most likely the major host phases of Mo 563
in Earth's crust and also hold the distinction of having the widest variability in δ98Mo. Significant 564
efforts have been devoted to characterizing the δ98Mo of crustal sulfide minerals, particularly 565
molybdenite, because of their relevance for studies on ore mineralization. Rayleigh distillation, 566
fluid boiling, and redox reactions are thought to be responsible for the wide variation in the 567
δ98Mo of molybdenites (–1.4‰ to +2.5‰; Hannah et al., 2007; Mathur et al., 2010; Greber et al., 568
2011, 2014; Shafiei et al., 2015; Breillat et al., 2016). Organic-rich mudrocks are characterized 569
by a wide range in δ98Mo (from about –1.3‰ to +2.5‰) that is controlled primarily by local and 570
global ocean redox conditions, as shown by recent papers that compiled Mo isotope data for 571
these rocks (Dahl et al., 2010b; Duan et al., 2010; Wille et al., 2013; Chen et al., 2015; Kendall 572
et al., 2015a; Partin et al., 2015). 573
18
The pronounced isotopic variability in crustal rocks makes it difficult to precisely constrain the 574
average δ98Mo of the upper continental crust. Voegelin et al. (2014) calculated an average δ98Mo 575
of ~0.3‰ based on the limited dataset of basalts and granites. A recent compilation of nearly 400 576
molybdenite samples yielded an average of ~0.3‰, but is associated with a large 2σ (1.04‰) 577
(Breillat et al., 2016). Molybdenites crystallize from hydrothermal fluids that have isotopically 578
heavier Mo than the silica-rich magmas from which they exsolved, and thus the average δ98Mo 579
of molybdenites likely represents a maximum value for the average crust (Greber et al., 2014). 580
Igneous pyrites rather than molybdenites may be the most important Mo reservoir in the crust 581
(Miller et al., 2011), but inadequate data are available to quantify their isotopic composition. 582
The isotopic distribution of Mo in marine sediments has implications for crustal and mantle 583
cycling of Mo. Deep-ocean pelagic sediments deposited from oxygenated bottom waters are 584
enriched in isotopically light Mo whereas continental margins generally have sediments with 585
isotopically heavier Mo because of reducing conditions in regions of high primary productivity 586
(upwelling) or basin restriction (see the next section on the oceans). Pelagic sediments are 587
preferentially incorporated into subduction zones compared with marginal sediments, resulting in 588
an upper crust that is isotopically heavier compared with igneous rocks (Neubert et al., 2011; 589
Freymuth et al., 2015). 590
The isotopically light Mo from subducted pelagic sediments may be returned to Earth's surface 591
via seafloor hydrothermal systems (Neubert et al., 2011) or volcanism (Freymuth et al., 2015). 592
High δ98Mo in Mariana arc lavas may reflect Mo isotope fractionation during dehydration of the 593
subducting slab (Freymuth et al., 2015). If so, this process would cause the subducted slab to 594
have low δ98Mo. Incorporation of subducted oceanic lithosphere into mantle plumes may return 595
this isotopically light Mo to Earth's surface by intraplate volcanism. This hypothesis has yet to be 596
tested rigorously through analysis of ocean island basalts. 597
The Oceans 598
Global seawater has a uniform δ98Mo of 2.34 ± 0.10 ‰ (Barling et al., 2001; Siebert et al., 2003; 599
Nakagawa et al., 2012). The uniformity of this value and its magnitude can be understood in 600
terms of the ocean budget of Mo. 601
Mo is thought to have a comparatively straightforward ocean budget (Fig. 6), entering largely 602
dissolved in river waters and leaving primarily in association with authigenic Fe-Mn oxides and 603
anoxic sediments underlying oxic or anoxic waters, where hydrogen sulfide is present (Crusius et 604
al., 1996; Morford and Emerson, 1999; Scott et al., 2008; Scott and Lyons, 2012; Reinhard et al., 605
2013a). The high concentration of Mo in the modern oceans is largely dictated by the high 606
solubility of Mo phases and slow removal rate of MoO42- in the presence of dissolved O2. 607
Essentially, Mo is readily transferred from crust to oceans during oxidative weathering but, 608
because settings in which bottom water O2 < 5 μM represent only ~ 0.3% of the modern seafloor, 609
Mo is very slowly removed from the oceans. 610

19
Quantitatively, the oceanic input is entirely dominated by riverine supply with a small (~5%) 611
contribution from low-temperature hydrothermal systems (Wheat et al., 2002; Miller et al., 2011; 612
Reinhard et al., 2013a). Rivers discharge 3.1×10⁸ mol yr-1 to the oceans with an average 613
dissolved concentration of 8.0 nmol kg-1 (Miller et al., 2011). Dust and aerosols are negligible 614
fluxes (Morford and Emerson, 1999). Anthropogenic Mo contributions may also be low but are 615
not well constrained (Miller et al., 2011). From this, the oceanic residence time for Mo is 616
calculated as ~440 kyr (Miller et al., 2011), which is ~40% lower than previous estimates 617
(Morford and Emerson, 1999; Scott et al., 2008). Nevertheless, this is still more than two orders 618
of magnitude higher than the ocean mixing time of ~1.5 kyr (Sarmiento and Gruber, 2006). 619
Therefore, the average Mo atom circulates the oceans ~300 times before it comes to rest in 620
sediments. Hence, the oceans are well-mixed with respect to Mo, resulting in a homogeneous 621
elemental and isotopic distribution across almost all oceans basins (Collier, 1985; Morris, 1975; 622
Nakagawa et al., 2012). The largest variations in the Mo concentration of oxygenated seawater 623
are only ~ 5% on a salinity-normalized basis (Tuit, 2003). 624
An unusual feature of the Mo isotope system is that seawater represents the isotopically heaviest 625
Mo reservoir on Earth. This observation is readily explained by observations of modern marine 626
sediments (see below), which indicate that any expression of Mo isotope fractionation between 627
seawater and sediments always results in preferential removal of lighter Mo isotopes to 628
sediments, thus driving seawater to higher δ98Mo. 629
Ocean Inputs. Surface fluids display a linear relationship between Mo and SO42- (R2 = 0.69), 630
implying that the predominant source of Mo is oxidative weathering of sulfide minerals and that 631
Mo is transported in the form of the hexavalent oxyanion with geochemical behavior similar to 632
that of SO42- (Miller et al., 2011). 633
Rivers are characterized by a wide range in δ98Mo values between –0.1‰ and +2.3‰ (Archer 634
and Vance, 2008; Pearce et al., 2010a; Neubert et al., 2011; Voegelin et al., 2012; Wang et al., 635
2015). Archer and Vance (2008) calculated an average riverine δ98Mo of 0.7‰ based on 636
analyses of waters representing ~22% of global riverine discharge. This implies that modern 637
average riverine δ98Mo is higher than the eroding upper continental crust and BSE (Archer and 638
Vance, 2008; Neubert et al., 2011). 639

20
Multiple mechanisms have been suggested to explain the isotopic fractionation between rivers 640
and the eroding upper crust. During weathering, isotopically light Mo can be adsorbed to residual 641
phases in soils that have experienced net Mo loss relative to the original bedrock (Archer and 642
Vance, 2008; Pearce et al., 2010a; Liermann et al., 2011; Siebert et al., 2015; Wang et al., 2015). 643
Organic-rich soils may have a net gain in Mo with higher δ98Mo compared to the original 644
bedrock (Siebert et al., 2015). However, if all Mo in soils is ultimately released to rivers, then 645
long-term Mo isotope fractionation between the eroding upper crust and rivers should not occur 646
(Dahl et al., 2011; Neubert et al., 2011). Adsorption of isotopically light Mo to river particulates 647
is probably of minor importance given that most Mo is dissolved in solution (Archer and Vance, 648
2008; Wang et al., 2015). Desorption of isotopically light Mo from particulates may occur in 649
some estuaries (Pearce et al., 2010a) whereas in others some isotopically light Mo may be 650
retained in estuarine sediments, causing the release of isotopically heavy Mo to the oceans 651
(Rahaman et al., 2014). Catchment lithology may exert significant control on the δ98Mo of 652
individual rivers via incongruent dissolution during weathering of easily oxidized phases like 653
sulfide minerals and organic matter that commonly have higher δ98Mo than crustal silicate 654
minerals (Neubert et al., 2011; Voegelin et al., 2012). 655
Low-temperature hydrothermal systems provide a subordinate contribution of Mo to the oceans 656
(Wheat et al., 2002; Miller et al., 2011; Reinhard et al., 2013a), but this flux and its isotopic 657
composition are poorly constrained. The lone study for the flank of the Juan de Fuca ridge 658
suggests that Mo is released to the oceans with a δ98Mo of 0.8‰. However, it is not clear 659
whether the isotopic signature truly reflects seawater-basalt reactions or was inherited from Mo 660
diffusion into basaltic rocks from overlying sediments (McManus et al., 2002). High-temperature 661
hydrothermal fluids are not a source of Mo to the oceans (Miller et al., 2011). A terrestrial 662
hydrothermal spring from West Iceland has a δ98Mo of –3.5‰ but the reason for this 663
exceptionally light isotopic signature is not known (Pearce et al., 2010a). 664
Ocean Outputs. Significant Mo isotope fractionation occurs in the marine environment during 665
removal to sediments (Fig. 7). To first order, the magnitude of Mo isotope fractionation between 666
seawater and sediments correlates with the redox state of the local depositional environment. 667
Well-oxygenated settings are characterized by the largest Mo isotope fractionations, whereas the 668
most reducing conditions (associated with intense water column euxinia in restricted basins) may 669
result in direct capture of seawater δ98Mo by organic-rich sediments. Depositional environments 670
of intermediate redox state have a wide range in δ98Mo. In addition to redox conditions, other 671
factors may affect the δ98Mo of sediments, such as the operation of a Fe-Mn particulate shuttle 672
(Herrmann et al., 2012; Scholz et al., 2013). Careful consideration of local depositional 673
conditions is important for proper application of Mo isotopes in ancient sedimentary rocks as an 674
ocean paleoredox proxy. The three major types of sedimentary sinks, and their isotope 675
systematics, are summarized below. 676

21
The euxinic sink. The geochemical behavior of Mo changes sharply in H2S-bearing systems, so 677
much that it has been likened to a "geochemical switch" (Helz et al., 1996; Erickson and Helz, 678
2000). This change is seen in the concentration depth profiles of these elements in the Black Sea 679
and other restricted sulfidic basins (Fig. 8) (Emerson and Huested, 1991; Neubert et al., 2008; 680
Dahl et al., 2010a; Helz et al. 2011; Noordmann et al., 2015). For example, in the Black Sea, 681
oxygenated surface waters give way to deeper anoxic waters at ~ 100 m, with [H2S]aq > 11 µM 682
below ~ 400 m water depth. The total Mo concentration across this redox transition declines 683
from ~ 40 nmol kg-1 at the surface to ~ 3 nmol kg-1 below the chemocline (Emerson and Huested, 684
1991; Nägler et al., 2011). 685
In euxinic settings, removal of Mo from the water column leads to strong Mo enrichments in the 686
underlying sediments relative to its average crustal abundance of ~1-2 ppm. The magnitude of 687
this enrichment depends on Mo availability in the euxinic water column (Algeo and Lyons, 688
2006). In relatively unrestricted ocean settings, Mo removal to euxinic sediments is readily 689
balanced by Mo recharge to the deep waters, resulting in high Mo enrichments (often >100 ppm) 690
in sediments (Scott and Lyons, 2012). By contrast, euxinic sediments in highly restricted basins 691
with slow rates of deepwater renewal (including the Black Sea), euxinic sediments deposited 692
rapidly (high sedimentation rates), and intermittently euxinic sediments typically have more 693
modest Mo enrichments of ~25-100 ppm (Scott and Lyons, 2012). 694
Particle scavenging in the euxinic water column is widely accepted as an important Mo flux to 695
euxinic sediments. Once the thiomolybdate switch has been achieved, Mo is scavenged by 696
forming bonds with metal-rich particles, organic compounds, and/or iron sulfides. The relative 697
importance of these host phases is not well understood, although pyrite was recently ruled out as 698
a major Mo carrier (Chappaz et al., 2014). Early studies of settling particles caught in sediment 699
traps in the anoxic part of the water column suggested that most Mo removal occurs below the 700
sediment-water interface (Francois, 1988; Emerson and Huested, 1991; Crusius et al., 1996). 701
However, more recent studies indicate that Mo removal can also occur within euxinic water 702
columns (Dahl et al., 2010a; Helz et al., 2011). The particle affinity of thiomolybdates is also 703
used to explain the general linear relationship between Mo and total organic carbon (TOC) 704
contents in sediments. This may suggest a direct connection between Mo and settling organic 705
particles (e.g., Brumsack and Gieskes, 1983; Algeo and Lyons, 2006). However, correlation does 706
not mean causation. The Mo-TOC relationships may be indirect, since both organic matter and 707
Mo preferentially accumulate in basins with higher sulfide concentrations (Helz et al., 1996). 708
Regardless of the mechanistic details, euxinic sedimentary settings account for removal of ~ 6-709
15% of the Mo entering the oceans via rivers each year, despite sulfidic waters only covering ~ 710
0.05-0.10% of the seafloor today (Scott et al., 2008; Reinhard et al., 2013a). Paleoredox 711
investigations suggest the euxinic sink was much greater in the past (see section 6). 712

22
Global seawater δ98Mo is recorded by organic-rich sediments in the deep Black Sea and Kyllaren 713
fjord where bottom waters are strongly euxinic ([H2S]aq > 11 μM], MoO42– (molybdate) is 714
quantitatively converted to highly reactive MoOS32– (trithiomolybdate) and MoS4
2– 715
(tetrathiomolybdate), and Mo is quantitatively removed from sulfidic bottom waters (Erickson 716
and Helz, 2000; Barling et al., 2001; Arnold et al., 2004; Vorlicek et al., 2004; Neubert et al., 717
2008; Noordmann et al., 2015). The long seawater Mo residence time enables the δ98Mo of 718
strongly euxinic sediments in a partially restricted marine basin like the Black Sea to be a proxy 719
for global seawater δ98Mo (Barling et al., 2001; Arnold et al., 2004; Neubert et al., 2008; 720
Noordmann et al., 2015). 721
Quantitative Mo removal may not be characteristic of all basins with strongly euxinic bottom 722
waters because the rate of Mo removal to sediments depends on other factors such as pH and 723
sulfur speciation as well as [H2S]aq (Helz et al., 2011; Vorlicek et al. 2004). Non-quantitative 724
removal of dissolved Mo will result in euxinic sediments with a lower δ98Mo than global 725
seawater (and enrichment of overlying euxinic bottom waters in isotopically heavy Mo; Nägler 726
et al., 2011, Noordmann et al., 2015). The Mo isotope fractionation between dissolved MoS42– or 727
MoOS32– and authigenic solid Mo may be 0.5 ± 0.3 ‰ (Nägler et al., 2011), which is non-trivial 728
and can lead to an overestimate of the global extent of ocean euxinia if it is incorrectly assumed 729
that ancient euxinic organic-rich mudrocks directly recorded seawater δ98Mo. 730
When bottom waters are intermittently euxinic or contain low [H2S]aq (< 11 μM), a wide range of 731
δ98Mo (–0.6 to +1.8‰) is observed in the underlying sediments, likely reflecting the slow and 732
incomplete conversion of molybdate to thiomolybdates (Arnold et al., 2004; Nägler et al., 2005; 733
Neubert et al., 2008; Dahl et al. 2010a, Noordmann et al., 2015). Such conditions are 734
characteristic of less restricted continental margin basins (e.g., Baltic Sea and Cariaco Basin) as 735
well as shallower waters proximal to the chemocline along the margins of more restricted basins 736
(e.g., water depths of ~100-400 m in the Black Sea). The sediment δ98Mo is not well-correlated 737
with [H2S]aq at sulfide concentrations below the geochemical switchpoint of Mo. For 738
intermittently euxinic basins, frequent periodic flushing by oxygenated seawater probably has a 739
significant impact on sediment δ98Mo via the formation of Fe-Mn (oxyhydr)oxides and their 740
reductive dissolution in anoxic sediments (Scholz et al., 2013; Noordmann et al., 2015). A Fe-741
Mn shuttle is likely to be important for efficient transfer of Mo to sediments in less restricted 742
redox-stratified basins and in oxygen minimum zones along upwelling continental margin 743
systems where the redox cline occurs in the water column and deep water renewal times are fast 744
enough to sustain the Fe-Mn shuttle (Algeo and Tribovillard, 2009; Scholz et al., 2013). 745

23
However, some puzzling observations remain to be explained. For example, weakly euxinic 746
sediments on the shallow Black Sea margin have significantly lighter δ98Mo compared with the 747
weakly euxinic sediments of the deep Cariaco Basin. In modern and ancient environments, 748
distinguishing between the Mo isotope effects of incomplete thiomolybdate formation, the 749
operation of an Fe-Mn shuttle, and periodic ventilation of anoxic basins is not a straightforward 750
task. Careful comparisons with other geochemical redox proxies may narrow the range of 751
possible mechanisms involved (e.g., Herrmann et al., 2012; Azrieli-Tal et al., 2014), but there is 752
still no general approach for this. In such scenarios, the δ98Mo of euxinic sediments is only a 753
minimum estimate for global seawater δ98Mo. 754
The oxic sink. Surprisingly in view of the stability of MoO42- in solution, Mo enrichment to 755
concentrations of 100s – 1000s of ppm, correlated with Mn content, is seen in ferromanganese 756
oxide sediments, especially crusts, nodules, and some oxic pelagic sediments in the abyssal part 757
of the oceans (Cronan and Tooms, 1969; Bertine and Turekian, 1973; Calvert and Price, 1977; 758
Cronan, 1980; Calvert and Piper, 1984; Shimmield and Price, 1986). Such enrichment most 759
likely reflects authigenic accumulation of Mo by adsorption to and/or co-precipitation with Mn 760
oxide phases. This phenomenon is observed in the laboratory (Chan and Riley, 1966; Barling and 761
Anbar, 2004; Wasylenki et al., 2008, 2011). 762
This removal process is associated with a large equilibrium isotope fractionation of ~3‰ 763
occurring between Fe-Mn nodules or crusts (–0.7‰) and seawater (2.3‰), in excellent 764
agreement with experimental observations of Mo adsorption to birnessite (Fig. 4; Barling et al., 765
2001; Siebert et al., 2003; Barling and Anbar, 2004; Wasylenki et al., 2008; Poulson Brucker et 766
al., 2009). A similar isotope fractionation was also inferred for hydrothermal Mn crusts (Ryukyu 767
arc; Goto et al., 2015). 768
Because ferromanganese crusts and nodules accumulate very slowly and the Mo enrichments in 769
widely disseminated pelagic sediments are small (Morford and Emerson, 1999), the Mo 770
concentration and isotopic composition of the oceans is much more sensitive to the extent of 771
ocean euxinia than to oxygenated conditions. As Mn oxides are buried into organic-matter 772
containing sediments, they experience reductive dissolution and liberate adsorbed Mo into the 773
pore waters. In the absence of H2S, Mo will diffuse into the overlying water column and thus the 774
majority of Mo is not permanently buried, particularly in continental margin settings. In this 775
scenario, Mn oxide-rich sediments can be considered failed sinks (e.g., Baja California; 776
Shimmield and Price, 1986). Even though deep-sea sediments also leak Mo, these sediments are 777
so widespread that they still constitute an important Mo sink. A range of estimates suggests that 778
some 30-50% of the riverine Mo supply is buried via the Mn oxide pathway in deep-sea 779
sediments (Bertine and Turekian, 1973; Morford and Emerson, 1999; Scott et al., 2008; Reinhard 780
et al., 2013a). Hence, the oxic sink is disproportionately small compared with the euxinic sink 781
given that >80% and ≤0.1% of the seafloor is covered by well-oxygenated and euxinic waters, 782
respectively (Reinhard et al., 2013a). 783

24
The intermediate sink (“sulfidic at depth” - SAD). In the last decade, it has become clear that 784
a substantial portion of Mo removal occurs neither in fully oxic nor in fully euxinic systems. 785
Investigations of Mo in marine sediments and pore waters indicate that Mo is also removed from 786
solution under less intensely reducing conditions (Fig. 9). Authigenic Mo enrichments occur in 787
sediments overlain by waters in which O2 < 10 μM (Fig. 9c), where both Mn oxides and sulfate 788
are reduced (Emerson and Huested, 1991; Crusius et al., 1996; Dean et al., 1999; Zheng et al., 789
2000; Nameroff et al., 2002). The sedimentary Mo enrichments in these “sulfidic at depth” 790
systems are smaller (typically < 25 ppm) than in euxinic settings (Scott and Lyons, 2012; Dahl et 791
al., 2013b). Current estimates suggest that ~50-65% of oceanic Mo removal occurs in these 792
environments (Morford and Emerson, 1999; McManus et al., 2006; Reinhard et al., 2013a). 793
In settings with >10 μM of O2 in the bottom waters, where Mn oxides form in the water column 794
(Shaw et al., 1990), solid-phase Mo enrichment can develop in two redox zones within the 795
sediment (Fig. 9b). First, transient authigenic Mo accumulation occurs at the upper limit of the 796
manganiferous zone, where Mo is released to the pore fluids as Mn oxides undergo reductive 797
dissolution. Secondly, a permanent Mo enrichment is found in the underlying sulfidic zone, 798
where thiomolybdates can form. This two-fold maximum enrichment is exemplified in the 799
sediments of the fjordic estuary Loch Etive in Western Scotland and in the Gulf of St. Lawrence 800
(Malcolm, 1985; Sundby et al., 2004). At many localities in the modern oceans, the Mn-reducing 801
zone is located in the water column and/or the sulfidic capture zone is located at a large enough 802
depth below the sediment-water interface that only small authigenic Mo enrichments (up to ~3 803
ppm) are expressed in the sediments because most Mo escaped back into the water column (Fig. 804
9a). This occurs for example in Boston Harbor, USA, Bay of Biscay and Thau lagoon in France, 805
and in the Californian and Mexican border basins (Zheng et al., 2000; Chaillou et al., 2002; 806
Elbaz-Poulichet et al., 2005; Poulson et al., 2006; Siebert et al., 2006; Morford et al., 2007; 807
Poulson Brucker et al., 2009). 808
The isotopic composition of Mo in anoxic sediments deposited from mildly oxygenated to 809
anoxic (but non-sulfidic) bottom waters depends on a number of factors, including the Fe and 810
Mn content of the (oxyhydr)oxides, the crystallinity of Fe (oxyhydr)oxides, and the amount of 811
dissolved H2S in sediment pore waters (Poulson Brucker et al., 2009; Goldberg et al., 2009, 812
2012). Goldberg et al. (2012) identified three groups: 1) Mn-rich sediments with low dissolved 813
porewater H2S (δ98Mo = –1.0‰ to +0.4‰); 2) Fe-rich sediments with low dissolved porewater 814
H2S (δ98Mo = –0.5‰ to +2.0‰); and 3) sediments with high dissolved porewater H2S (δ98Mo = 815
1.6 ± 0.2 ‰). The low δ98Mo of the first group simply reflects the large Mo isotope fractionation 816
between seawater and Mn-rich oxides. 817

25
In the second group, the most reactive and poorly crystalline Fe (oxyhydr)oxides (e.g., 818
ferrihydrite) are reduced in the Mn-reducing and upper part of the Fe reduction zones in 819
sediments. The magnitude of isotope fractionation during Mo adsorption to poorly crystalline Fe 820
(oxyhydr)oxides is smaller compared with Mn oxides (Goldberg et al., 2009), resulting in 821
sediments with δ98Mo between 0.5‰ and 2.0‰. By contrast, the lower part of the Fe reduction 822
zone is characterized by sediments with lower δ98Mo between –0.5‰ and +1.0‰ because of a 823
larger Mo isotope fractionation during Mo adsorption to more crystalline Fe (oxyhydr)oxides 824
such as hematite and goethite (Goldberg et al., 2009). 825
The third group may be influenced by Mo isotope fractionation during formation of intermediate 826
thiomolybdates, and is represented by open-ocean sediments in continental margin settings 827
where bottom waters are O2-deficient (< 10 μM) and pronounced microbial H2S production 828
occurs in sediment pore waters (Poulson et al., 2006; Siebert et al., 2006; Poulson Brucker et al., 829
2009; Goldberg et al., 2012). This group likely dominates the overall Mo isotope composition of 830
the SAD sink because the higher H2S concentrations in pore waters promote more efficient 831
removal of Mo to sediments. 832
Lakes 833
The Mo isotopic composition of lakes has received less attention compared with marine systems. 834
Molybdenum enrichment processes found in sulfidic marine environments were also recognized 835
in euxinic lake settings (Dahl et al., 2010a; Helz et al., 2011). Smaller Mo enrichments were 836
found in the seasonally dysoxic Castle Lake in California (Glass et al., 2013). Using sediment 837
cores from lakes in Sweden and Russia, Malinovsky et al. (2007) showed that lower δ98Mo in 838
lake sediments is generally associated with deposition from oxygenated bottom waters whereas 839
higher δ98Mo occurs in sediments deposited from anoxic bottom waters. This behavior was also 840
observed in two lakes in eastern Canada (Chappaz et al., 2012). Dahl et al. (2010a) examined in 841
detail the Mo isotope budget of meromictic Lake Cadagno in Switzerland to better understand 842
Mo isotope fractionation in redox-stratified water columns. The oxygenated shallow and sulfidic 843
deep parts of the lake were found to have distinctive δ98Mo (0.8‰ and 1.7‰, respectively) in 844
part because of two different Mo sources to the lake (riverine inputs and groundwater at 0.8‰ 845
and 1.4‰, respectively). The higher δ98Mo of the sulfidic deep waters (1.7‰) compared with the 846
groundwater source (1.4‰) suggests that removal of isotopically light Mo to sediments enriched 847
the sulfidic deep waters in isotopically heavy Mo. 848
6. APPLICATION TO OCEAN PALEOREDOX 849

26
Observations from modern environments (e.g., Emerson and Huested, 1991; Crusius et al., 1996; 850
Helz et al., 1996; Morford and Emerson, 1999; Erickson and Helz, 2000; Zheng et al., 2000; 851
Morford et al., 2005; Algeo and Lyons, 2006; Algeo and Tribovillard, 2009; Scott and Lyons, 852
2012; Dahl et al. 2013b) have led to the use of Mo concentrations in sediments as a tracer of 853
local ocean redox conditions and the degree of water mass restriction between a local 854
sedimentary basin and the open ocean during deposition. The Mo concentration of euxinic 855
organic-rich mudrocks (ORMs) deposited in unrestricted or weakly restricted sedimentary basins 856
has been used to obtain a first-order estimate of the global seawater Mo concentration and thus 857
the extent of atmosphere-ocean oxygenation (e.g., Scott et al., 2008; Reinhard et al., 2013a). For 858
similar reasons, it was logical to also explore the use of Mo isotopes in ORMs as an ocean redox 859
proxy (Barling et al., 2001; Siebert et al., 2003; Arnold et al., 2004). This approach has now been 860
extended to chemical sedimentary rocks, notably carbonates, phosphorites, and iron formations 861
(Voegelin et al., 2009; Wen et al., 2011; Baldwin et al., 2013). The discovery that both local and 862
global ocean redox conditions control the δ98Mo of marine sediments has led to ocean 863
paleoredox studies being the most prominent application of the Mo stable isotope system. 864
Local Depositional Conditions 865
Building upon observations of modern environments (described in section 5), the Mo isotope 866
composition of sediments scales with the degree of anoxia in the local depositional environment 867
(Fig. 7). This means that the δ98Mo of ancient ORMs may be used to infer local bottom water 868
redox conditions at different locations in the world if seawater δ98Mo is known. Such an 869
approach is possible for the past ~60 Myr when seawater δ98Mo was generally constant and close 870
to the modern-day value of 2.3‰ as inferred from Pacific and Atlantic Fe-Mn crusts (at a 871
temporal resolution of 1-3 Ma) assuming a constant isotopic offset of ~3‰ between these 872
sedimentary materials and the contemporaneous open ocean (Siebert et al., 2003). 873
Given that the δ98Mo of ORMs is influenced by both global and local ocean redox conditions, 874
Mo isotopes should not be used alone to infer the redox state of local bottom waters when no 875
constraint on seawater δ98Mo is available. Hence, Mo isotope data for older ORMs can provide 876
insight on local depositional conditions only in combination with independent proxies for local 877
bottom water redox conditions, particularly Mo enrichments, Mo/U and Mo/Re ratios, and 878
sedimentary Fe speciation (Crusius et al., 1996; Morford and Emerson, 1999; Morford et al., 879
2005; Poulton and Canfield, 2005, 2011; Tribovillard et al., 2006, 2012; Algeo and Tribovillard, 880
2009; Scott and Lyons, 2012). 881
27
The usefulness of Mo isotopes as a local redox proxy for Pleistocene-Holocene sediments can be 882
illustrated by recent studies on the Black Sea and eastern Mediterranean Sea. As expected, older 883
oxic-limnic sediments (Unit IIB, III) in the Black Sea record lighter δ98Mo compared with more 884
recent anoxic sediments (Unit I, IIA) (Nägler et al., 2005). Development of strongly euxinic 885
bottom waters in the Bosporus Inlet region around 350-300 B.P. was inferred from an excursion 886
to high δ98Mo (similar to modern seawater) in sediments. Arnold et al. (2012) linked this 887
increase in bottom water sulfide concentrations to shoaling of the chemocline (by more than 65 888
m) in response to water circulation and temperature changes brought on by the Little Ice Age. 889
The δ98Mo of the overlying sediments declines upsection, reflecting a transition to modern well-890
oxygenated conditions in the Bosporus Inlet region. 891
Sapropels from the eastern Mediterranean Sea exhibit more complicated stratigraphic trends in 892
δ98Mo. The youngest organic-rich sapropel (S1) has lighter δ98Mo in its lower part compared 893
with the overlying more oxygenated sediments (Reitz et al., 2007; Azrieli-Tal et al., 2014), a 894
finding that is contrary to modern environments where more oxygenated sediments typically 895
have lower δ98Mo. Reitz et al. (2007) suggested that propagation of an oxidation front into the 896
more reducing sapropel remobilized and transported Mo downwards in the sediment until Mo 897
was co-precipitated with Mn oxides at the oxidation front. In contrast, Azrieli-Tal et al. (2014) 898
used a combination of redox-sensitive metal enrichments and Fe isotope data to show that local 899
bottom waters were euxinic during early sapropel deposition and less reducing during late 900
sapropel deposition, and separated by a transient ventilation event associated with cold climatic 901
conditions at ~8.2 ka. The lightest δ98Mo (< –0.7‰) in the lower sapropel was suggested to 902
reflect weakly euxinic conditions ([H2S]aq < 11 μM) that caused a large Mo isotope fractionation 903
between the sediments and overlying seawater (Azrieli-Tal et al., 2014), similar to that observed 904
in the shallower part of the modern Black Sea (Neubert et al., 2008). 905
Scheiderich et al. (2010a) also used redox-sensitive metal concentrations and S isotope data from 906
eight Pleistocene Mediterranean sapropels to conclude that euxinic bottom water conditions 907
generally prevailed during sapropel deposition. The range in δ98Mo (0.3-1.8‰) in the sapropels 908
is consistent with deposition from weakly euxinic bottom waters, albeit with a smaller degree of 909
seawater-sediment isotope fractionation compared with lower S1. Hemipelagic sediments 910
beneath the sapropels have high δ98Mo, in some cases exceeding modern seawater δ98Mo, 911
despite trace metal and S isotope evidence for oxygenated bottom water conditions. These 912
observations suggest that preferential removal of isotopically light Mo to the sapropels enriched 913
pore fluids in isotopically heavy Mo. Downward diffusion of the pore fluids would enable 914
transfer of isotopically heavy Mo to the underlying hemipelagic sediments. 915

28
Studies on the Paleocene-Eocene thermal maximum (~55.9 Ma) and Eocene Thermal Maximum 916
2 (~54.1 Ma) provide an example of using Mo isotopes and redox-sensitive metal enrichments to 917
reconstruct the development of transient euxinic conditions along ocean margins in response to 918
hyperthermal events (Dickson and Cohen, 2012; Dickson et al., 2012). In both cases, the euxinia 919
was fingerprinted by a stratigraphic excursion to higher Mo and Re enrichments and higher 920
δ98Mo in Arctic ocean sediments. The highest δ98Mo (~2.0-2.1‰) approaches the modern 921
seawater value, consistent with limited Mo isotope fractionation between seawater and sediments 922
and thus the development of strongly euxinic bottom waters ([H2S]aq > 11 μM). Dickson et al. 923
(2014) further showed that early Eocene anoxic sediments from two continental margin sites in 924
the Tethys Ocean were deposited from non-euxinic or intermittently euxinic bottom waters 925
(based on Fe speciation data) and had a highest δ98Mo that was ~0.7‰ lower than the highest 926
δ98Mo observed from the Arctic Ocean euxinic sediments. This 0.7‰ offset is similar to that 927
observed between modern anoxic continental margin sediments and global seawater (Poulson et 928
al., 2006; Poulson Brucker et al., 2009). 929
The δ98Mo of ORM deposited from euxinic waters (independently verified by trace metal and Fe 930
speciation data) has also been used along with Mo/U ratios to fingerprint the operation of an Fe-931
Mn particulate shuttle. Specifically, low δ98Mo (< 1‰) and high Mo/U ratios (≥3x the molar 932
Mo/U seawater ratio) in the Late Pennsylvanian Hushpuckney Shale (Midcontinent Sea, USA) 933
and late Ediacaran Doushantuo Formation (South China) raise the possibility that an Fe-Mn 934
particulate shuttle delivered isotopically light Mo to sediments (Herrmann et al., 2012; Kendall 935
et al., 2015a). These examples, along with the Mediterranean sapropels, demonstrate that both 936
weakly euxinic conditions and operation of an Fe-Mn particulate shuttle can compromise the 937
ability of euxinic ORM to record open ocean δ98Mo. 938
Reconstructing the Oceanic Mo Isotope Mass Balance 939
Global ocean redox conditions can be inferred through mass balance modelling of the oceanic 940
Mo isotope budget. Initial models used a simple isotope mass balance involving two oceanic Mo 941
sinks (oxic and euxinic) (Arnold et al., 2004). Modern studies now typically use more 942
complicated models that take into account both Mo burial fluxes and the isotopic composition of 943
three sinks (oxic, sulfidic at depth, and euxinic; see section 5) as well as the scaling of Mo burial 944
fluxes to the size of the global seawater Mo reservoir (e.g., Dahl et al., 2011; Reinhard et al., 945
2013a; Chen et al., 2015). Rivers are typically assumed to be the only major source of Mo to the 946
oceans in the Proterozoic and Phanerozoic, as they are today. This is a reasonable assumption for 947
a world with an oxygenated atmosphere (i.e., following the Great Oxidation Event [GOE]) given 948
that subaerial oxidative dissolution of crustal sulfide minerals is efficient even at low O2 levels 949
(to <0.001% and <0.026-0.046% of present levels in the case of pyrite and molybdenite, 950
respectively; Reinhard et al., 2009, 2013b; Greber et al., 2015b). 951
29
From the perspective of the magnitude of Mo isotope fractionation in marine environments, two 952
of the three oceanic Mo sinks are easy to define. The oxic sink (FOX) is typically associated with 953
Mo adsorption onto Mn oxides and Fe-Mn crusts beneath well-oxygenated bottom waters, which 954
is represented by a Mo isotope fractionation factor of ~3‰. A euxinic sink (FEUX) has often been 955
used to denote environments where sediments are deposited from highly sulfidic bottom waters 956
([H2S]aq > 11 μM) and Mo removal from those bottom waters is nearly quantitative, thus 957
enabling preservation of seawater δ98Mo in the sediments. The third sink (FSAD) has traditionally 958
been used to represent all other environments of more intermediate redox character, which range 959
from mildly oxygenated to weakly euxinic bottom waters (e.g., Kendall et al., 2009, 2011; Dahl 960
et al., 2010b, 2011). The magnitude of Mo isotope fractionation in the environments represented 961
by this third sink span the entire range between the oxic and strongly euxinic end-members. An 962
average Mo isotope fractionation of ~0.7‰ is typically chosen to represent this sink because this 963
is the common Mo isotope offset from overlying seawater observed in continental margin 964
sediments where bottom waters are weakly oxygenated, dissolved O2 penetrates < 1 cm below 965
the sediment-water interface, and dissolved sulfide is present in shallow sediment pore fluids 966
(Poulson et al., 2006; Poulson Brucker et al., 2009). 967
One complication is the weakly euxinic sink (bottom water [H2S]aq <11 μM), which is 968
characterized by a wide range of Mo isotope fractionations (up to 3‰ in the shallow Black Sea 969
near the chemocline). For mass balance modelling that integrates Mo burial fluxes with the Mo 970
isotope mass balance, it is problematic to assign weakly euxinic settings to the SAD sink because 971
both weakly and strongly euxinic settings have Mo burial fluxes that are significantly higher than 972
in non-euxinic settings (e.g., Scott et al., 2008; Reinhard et al., 2013a). Hence, a compromise is 973
to assign a small Mo isotope fractionation of ~0.5‰ to the euxinic sink such that it represents 974
both strongly and weakly euxinic conditions (e.g., Chen et al., 2015). This Mo isotope 975
fractionation is observed in the deep weakly euxinic Cariaco Basin (Arnold et al., 2004), which 976
may be a good analogue for ancient euxinic environments. In this modelling approach, the 977
assumption that the SAD sink is dominated by the weakly oxygenated settings (Fig. 9c; where 978
Mo isotope fractionation averages 0.7‰; Poulson et al., 2006; Poulson Brucker et al., 2009) is 979
further justified because Mo burial in such settings is more efficient compared with mildly 980
oxygenated settings where dissolved sulfide occurs farther below the sediment-water interface 981
(Fig. 9b). Hence, the average δ98Mo of the oxic, SAD, and euxinic sinks are –0.7‰, 1.6‰, and 982
1.8‰, respectively, for seawater δ98Mo = 2.3‰. 983
The oceanic Mo isotope mass balance equation can thus be represented as: 984
δRIVER = fOX δOX + fSAD δSAD + fEUX δEUX 985

30
where f = fraction of each sink flux relative to the total oceanic Mo burial flux (fRIVER = 1), fOX + 986
fSAD + fEUX = 1, and δ = δ98Mo. Modern budget estimates (fOX = 30-50%, fSAD = 50-65%, fEUX = 987
6-15%) yield values for the average riverine input, δRIVER = 0.5-0.9‰, in good agreement with 988
the observed value of ~ 0.7‰ (Morford and Emerson 1999; Archer and Vance, 2008; Scott et al. 989
2008, Reinhard et al., 2013a). Each f term in the equation can be linked to that redox setting’s 990
average global Mo burial flux, which scales with the size of the global oceanic Mo reservoir. For 991
each F term, this can be expressed as: 992
F = F0 × R/R0 993
where R denotes the size of the global oceanic Mo reservoir, F is the burial flux (g m–2 yr–1), and 994
the subscript 0 denotes the modern value. Each f term in the Mo isotope mass balance equation 995
can be replaced by the following expression that relates each sink flux to its areal fraction: 996
f = [(F0 × R/R0) × (ATOTAL × fA)] / FRIVER 997
where fA = fraction of seafloor represented by the sink and A = total seafloor area covered by the 998
three sinks. In this way, the global seawater δ98Mo can be modelled as a function of the areal 999
extent of each sink (Dahl et al. 2011; Reinhard et al., 2013a; Chen et al., 2015). A limitation of 1000
this model is that the average Mo burial flux for each sink is based on observations from 1001
continental margin settings (8% of the modern seafloor), where burial fluxes are higher 1002
compared with the abyssal seafloor. Hence, the rate at which the global seawater Mo reservoir is 1003
drawn down in response to an expansion of ocean anoxia onto the abyssal seafloor will be 1004
overestimated (e.g., fA > 8%). Addressing this weakness would require a more complicated 1005
modelling approach that scales burial fluxes from continental margin to abyssal seafloor (cf., 1006
Dahl et al. 2011; Reinhard et al., 2013a). 1007
The mass balance model reveals that a combination of high Mo concentrations and high δ98Mo in 1008
ancient euxinic ORM is best interpreted as evidence for a large oceanic Mo reservoir and 1009
widespread ocean oxygenation (Fig. 10). By contrast, low Mo concentrations and low δ98Mo in 1010
euxinic ORM point to extensive ocean anoxia. 1011
Inferring Seawater δ98Mo from Sedimentary Archives 1012

31
ORMs. Application of Mo isotopes as a global ocean redox proxy depends on knowledge of 1013
ancient seawater δ98Mo. The growing database of δ98Mo from modern environments consistently 1014
shows that organic-rich sediments deposited from strongly euxinic bottom waters in semi-1015
restricted basins are most likely to directly capture global seawater δ98Mo (Arnold et al., 2004; 1016
Neubert et al., 2008; Noordmann et al., 2015). Hence, ORM is the predominant lithology for 1017
inferring ancient seawater δ98Mo. Independent indicators are used to establish that ORM were 1018
deposited from euxinic bottom waters, especially Mo enrichments and extensive pyritization of 1019
biogeochemically highly reactive Fe (Fe-bearing mineral phases that can react with dissolved 1020
sulfide in the water column or in sediment pore waters during early diagenesis; e.g., Arnold et 1021
al., 2004; Neubert et al., 2008; Gordon et al., 2009; Pearce et al., 2010b; Dahl et al., 2010b; Scott 1022
and Lyons, 2012). The latter is identified by a combination of high ratios of highly reactive Fe to 1023
total Fe (typically >0.38; indicating anoxic bottom waters) and high ratios of pyrite Fe to highly 1024
reactive Fe (>0.7; indicating dissolved sulfide in those anoxic waters) (Raiswell and Canfield, 1025
1998; Poulton and Raiswell, 2002; Poulton and Canfield, 2011). 1026
Seawater δ98Mo will be directly captured by ORM if bottom water sulfide concentrations were 1027
high enough (i.e., [H2S]aq >> 11 μM) to enable quantitative conversion of molybdate to highly 1028
particle-reactive Mo species, and if Mo removal from bottom waters was quantitative or nearly 1029
so. Assessing whether these conditions were met for ancient ORM is not always straightforward 1030
because local redox proxies such as Mo concentrations and Fe speciation cannot quantitatively 1031
constrain the dissolved sulfide concentration of euxinic bottom waters. 1032
However, careful comparison of elemental and Mo isotope data can provide clues. Positively 1033
correlated stratigraphic variations in the δ98Mo and Mo enrichments of euxinic ORM suggest that 1034
changes in seawater δ98Mo are being captured because such a correlation is the expected 1035
response to changes in the global seawater Mo inventory and ocean redox conditions. By 1036
contrast, high Mo enrichments and low δ98Mo (i.e., similar to igneous rocks) in ORM indicates 1037
weakly euxinic bottom waters during deposition. High Mo enrichments indicate a sizable 1038
oceanic Mo reservoir and thus a significant extent of ocean oxygenation whereas the low δ98Mo 1039
portrays a conflicting viewpoint of widespread ocean anoxia. This apparent contradiction can be 1040
resolved by invoking a large Mo isotope fractionation between weakly euxinic bottom waters 1041
and sediments. A combination of high Mo enrichments and low δ98Mo may also be explained by 1042
operation of an Fe-Mn particulate shuttle, particularly if high Mo/U ratios are observed in ORM 1043
(Algeo and Tribovillard, 2009; Herrmann et al., 2012; Kendall et al., 2015a). In either scenario, 1044
another isotope redox proxy that is less sensitive to dissolved sulfide concentrations and the Fe-1045
Mn particulate shuttle is needed to infer the extent of global ocean oxygenation, such as U 1046
isotopes (Asael et al., 2013; Kendall et al., 2015a). 1047

32
Even if bottom waters are strongly euxinic, Mo isotope fractionation between the sediments and 1048
seawater will occur if Mo removal from bottom waters is not quantitative. In the deep Black Sea, 1049
near-quantitative removal of Mo from bottom waters is indicated by low Mo enrichments 1050
compared with TOC contents (average Mo/TOC ratio of 4.5 ppm/wt%) in the euxinic sediments 1051
(Algeo and Lyons, 2006; Neubert et al., 2008; Scott and Lyons, 2012). Higher Mo/TOC ratios in 1052
ORM are suggestive of non-quantitative Mo removal, which may be associated with a Mo 1053
isotope fractionation of up to ~0.5 ± 0.3‰ between dissolved and authigenic Mo in a strongly 1054
euxinic setting (Nägler et al., 2011). Hence, the δ98Mo of euxinic ORM with high Mo/TOC ratios 1055
must be regarded as a minimum value for global seawater δ98Mo. 1056
Fe-Mn Crusts. Hydrogenous Fe-Mn crusts have been used to trace the evolution of seawater 1057
δ98Mo over the past 60 Myr (Siebert et al., 2003). This approach takes advantage of the constant 1058
isotopic offset of ~3‰ that is observed between modern Mn oxides and seawater. The Mo 1059
isotope record of hydrogenous Fe-Mn crusts from the Atlantic and Pacific Oceans are 1060
homogeneous and similar to modern Mn oxides, suggesting that the global ocean redox 1061
conditions during the Cenozoic Era were generally similar to today. However, the poor temporal 1062
resolution of Fe-Mn crusts (1-3 Ma) means that short-term variations in global ocean redox 1063
conditions will not be well represented. In addition, the possibility of re-equilibration with 1064
younger seawater cannot easily be excluded. The use of Fe-Mn crusts to reconstruct seawater 1065
δ98Mo is also limited to the recent geological past because subduction of oceanic lithosphere has 1066
destroyed the vast majority of this record. 1067
Carbonates. Primary carbonate precipitates and phosphorites may also directly record seawater 1068
δ98Mo in some cases (Voegelin et al., 2009; Wen et al., 2011; Romaniello et al., 2016). 1069
Molybdenum occurs at sub-crustal abundance in most carbonate rocks (<< 1 ppm), and 1070
carbonates probably constitute a negligible sink for marine Mo. In carbonate rocks, Mo may be 1071
bound to detrital silicate minerals, organic matter, sulfide minerals, and carbonate minerals. To 1072
avoid detrital material that may have a different Mo isotope composition from authigenic Mo, 1073
leaching of carbonate rocks can be done with dilute HCl, which primarily dissolves the carbonate 1074
fraction. Otherwise, total digestion techniques can be used and the effect of the detrital 1075
component on Mo concentrations and isotopic compositions can be evaluated using immobile 1076
elements such as Al or Ti (Voegelin et al., 2009, 2010). 1077

33
In comparison with fine-grained siliciclastic sediments, little Mo isotope data are available for 1078
modern carbonate sediments (Voegelin et al., 2009; Romaniello et al., 2016). However, initial 1079
data are encouraging. Most modern skeletal organisms, including bivalves and gastropods, have 1080
low and strongly variable Mo contents (0.004-0.120 ppm) and isotope compositions (δ98Mo = 1081
0.07-2.19‰), suggesting a biological Mo isotope fractionation that preferentially incorporates 1082
lighter Mo isotopes into shells. Corals, however, display a nearly uniform Mo concentration 1083
(0.02-0.03 ppm) and a narrow range of δ98Mo values (2.0-2.2‰) that are slightly lighter than 1084
modern seawater. This could mean that MoO42- in oxic seawater is principally incorporated 1085
directly as an impurity in the crystal lattice, but there are currently no controlled laboratory 1086
experiments to confirm this chemical pathway. Nevertheless, corals are a potential archive of 1087
δ98Mo in ancient seawater (Voegelin et al., 2009). 1088
Mo isotope fractionation is also observed to be small in some non-skeletal carbonates, including 1089
ooids and in bulk carbonate sediments with high sulfide levels in pore waters (Voegelin et al., 1090
2009; Romaniello et al., 2016). Bahamian ooid sands thought to contain pure non-skeletal calcite 1091
contain a narrow range of Mo concentrations (0.02-0.04 ppm) and δ98Mo values (2.0-2.2‰) that 1092
are only slightly lower than modern seawater (2.3‰). Other ooids contain a detrital Mo 1093
component and display lower δ98Mo values (Voegelin et al., 2009). Bulk carbonate sediments 1094
from shallow water settings in the Bahamas also display low Mo concentrations (<0.2 ppm) and 1095
δ98Mo that is ~1‰ lower than seawater when pore water sulfide concentrations are low (i.e., 1096
[H2S]aq < 20 µM; Romaniello et al., 2016). By contrast, high Mo concentrations (2–28 ppm) and 1097
seawater-like δ98Mo are found in carbonate sediments containing high levels of pore water 1098
sulfide ([H2S]aq = 20–300 µM). Hence, the ability of non-skeletal carbonates to record coeval 1099
seawater δ98Mo may depend on redox conditions in a fashion similar to siliciclastic sediments 1100
(Romaniello et al., 2016). 1101
Tracing Atmosphere-Ocean Oxygenation Using Mo Isotopes 1102
With these caveats in mind, we provide an overview of how the Mo isotope compositions of 1103
sedimentary rocks have been used to trace oxygenation of Earth’s surface environment. The Mo 1104
isotope system is used in two distinct ways depending on atmospheric pO2 levels. The first is to 1105
search for evidence of free O2 in the Archean environment, with the goal of constraining the 1106
onset of oxygenic photosynthesis and the transition from an anoxic to an oxygenated atmosphere. 1107
The second is to constrain the global extent of oxygenated seafloor during various intervals in 1108
the Proterozoic and Phanerozoic, with the major goals being to infer the magnitude of oceanic 1109
anoxic events associated with major Phanerozoic mass extinctions, and to determine when 1110
Earth’s oceans became predominantly oxygenated. 1111
Part 1: Searching for Free O2 in the Archean Surface Environment 1112

34
Molybdenum isotope data from Archean ORMs, carbonates, and iron formations play a 1113
prominent role in ongoing efforts to trace the dynamics of initial Earth surface oxygenation 1114
leading up to the GOE. In such studies, evidence is sought for Mo isotope fractionation in 1115
surface environments (e.g., rivers, oceans), which is manifested in the form of δ98Mo values in 1116
sedimentary rocks that are higher or lower than the range observed in crustal igneous rocks. If 1117
such δ98Mo values are found, an assessment is made on whether environmental O2 is likely to 1118
explain them. These assessments take into account the range of Mo isotope variations and their 1119
correlation with other geochemical redox proxies. Most studies have focused on late Archean 1120
sedimentary rocks (2.7-2.5 Ga) deposited in the Hamersley Basin, Western Australia (Duan et 1121
al., 2010; Kurzweil et al., 2015a) and the Transvaal Basin and Griqualand West Basin, South 1122
Africa (Wille et al., 2007; Voegelin et al., 2010; Czaja et al., 2012; Eroglu et al., 2015) (Fig. 11). 1123
The 2.5 Ga Mt. McRae Shale in drillcore ABDP-9 (Hamersley Basin) has been intensively 1124
studied at high stratigraphic resolution using a diverse range of elemental and isotopic (S, Mo, U, 1125
N, Se, Os) redox proxies (Anbar et al., 2007; Kaufman et al., 2007; Garvin et al., 2009; Reinhard 1126
et al., 2009; Duan et al., 2010; Kendall et al., 2013, 2015b; Stüeken et al., 2015). In the Mt. 1127
McRae Shale, δ98Mo ranges between 0.9‰ and 1.8‰ (Duan et al., 2010). The highest δ98Mo 1128
values are found in euxinic ORM (as inferred from sedimentary Fe speciation analyses) 1129
characterized by small but distinctive Mo enrichments and isotopic evidence for a dissolved 1130
marine Mo reservoir during an episode of mild environmental oxygenation. One explanation for 1131
the high δ98Mo values is the removal of isotopically light Mo to oxide minerals, thus leaving 1132
behind a dissolved pool of isotopically heavy Mo in seawater that was sequestered into euxinic 1133
sediments. Isotopic fractionation during riverine transport and in weakly euxinic settings may 1134
also have contributed to the high seawater δ98Mo. Using mass balance calculations, Duan et al. 1135
(2010) showed that in a largely anoxic world, the δ98Mo of a small seawater Mo reservoir is 1136
susceptible to significant modification by isotope fractionation, thus enabling high seawater 1137
δ98Mo to occur without extensive oxygenation. 1138
Building upon these initial efforts, Kurzweil et al. (2015a) measured the δ98Mo of ORMs, 1139
carbonates, and iron formations from the underlying 2.6-2.5 Ga stratigraphic units of the 1140
Hamersley Group. Although the stratigraphic resolution of this data is low, a general pattern of 1141
increasing δ98Mo occurs upsection, peaking in the Mt. McRae Shale. This stratigraphic trend 1142
may capture an overall increase of seawater δ98Mo in the Hamersley Basin, but it is also possible 1143
there was only a single episode of mild environmental oxygenation during Mt. McRae time 1144
(Anbar et al., 2007; Duan et al., 2010; Kendall et al., 2015b). In sedimentary rocks older than the 1145
Mt. McRae Shale, δ98Mo typically ranges between 0.5‰ and 1.0‰ and thus is either similar to 1146
or only slightly higher than igneous rock compositions, suggesting limited Mo isotope 1147
fractionation at low O2 levels. 1148

35
The Mo isotope data from ca. 2.7-2.5 Ga ORMs and carbonates of the Transvaal Basin and 1149
Griqualand West Basin, deposited on the platform and slope of the Campbellrand-Malmani 1150
carbonate platform, are also consistent with mild environmental oxygenation but yield a 1151
significantly more complex stratigraphic pattern (Wille et al., 2007; Voegelin et al., 2010; Czaja 1152
et al., 2012; Eroglu et al., 2015). Appreciable differences were commonly observed between the 1153
δ98Mo of ORMs and carbonates in close stratigraphic proximity. These differences may be 1154
explained by isotope fractionation associated with non-euxinic bottom water redox conditions 1155
during deposition of some ORMs (Voegelin et al., 2010) and by detrital and diagenetic 1156
modification of carbonate Mo isotope signatures (Eroglu et al., 2015). Nevertheless, the 1157
occurrence of high δ98Mo values (>1.0‰) and the association of negative Fe with positive Mo 1158
isotope signatures at multiple stratigraphic levels in the Ghaap Group are consistent with at least 1159
episodic environmental oxygenation in the vicinity of the Campbellrand-Malmani carbonate 1160
platform (Wille et al., 2007; Voegelin et al., 2010; Czaja et al., 2012; Eroglu et al., 2015). The 1161
coupled Fe-Mo isotope data suggest oxidation of Fe2+ to Fe3+ by photosynthetic O2, thus 1162
producing Fe oxides that adsorbed Mo from seawater (Czaja et al., 2012). Other geochemical 1163
data, such as Fe speciation and Re/Mo ratios, from the shallow water and slope sediments are 1164
also consistent with the episodic presence of free O2 in bottom waters (Kendall et al., 2010; 1165
Zerkle et al., 2012). 1166
Most older Archean ORMs (3.4-2.7 Ga) have minimal Mo enrichments and δ98Mo values that 1167
are similar to or only slightly higher than igneous rocks. The Mo data indicate limited oxidative 1168
mobilization of Mo and minimal fractionation of Mo isotopes in the surface environment, and 1169
thus low environmental O2 levels (Siebert et al., 2005; Wille et al., 2007, 2013). High δ98Mo 1170
values of up to 1.8‰ were found in ORM at the base of a banded iron formation sequence in the 1171
ca. 2.75 Ga Carajás Formation (southern Brazil), but post-depositional potassic metasomatism 1172
may have altered the Mo isotope compositions (Cabral et al., 2013). 1173
In contrast to the limited isotopic variation in most pre-2.7 Ga Archean ORMs, a wide range of 1174
δ98Mo (spanning ~ 2.5‰) is observed in the iron formations of the 2.95 Ga Sinqeni Formation 1175
(Pongola Supergroup, South Africa) (Planavsky et al., 2014). A positive correlation is observed 1176
between Fe/Mn ratios and δ98Mo in these iron formations. This observation suggests that a 1177
greater magnitude of Mo isotope fractionation (producing negative δ98Mo) was associated with 1178
adsorption of Mo to Mn oxides that formed during local, transient episodes of O2 production. A 1179
similar correlation between Fe/Mn ratios and δ98Mo was also observed for ca. 1.88 Ga iron 1180
formations deposited in the Animikie Basin (Lake Superior) after the GOE (Planavsky et al., 1181
2014). 1182

36
In summary, the Mo isotopic composition of Archean sedimentary rocks, together with other 1183
elemental and isotopic redox proxies, are consistent with the emerging notion of “whiffs of O2” 1184
(i.e., episodic increases in environmental O2 levels) between the evolution of oxygenic 1185
photosynthesis and the GOE (Anbar et al., 2007; Lyons et al., 2014; Kendall et al., 2015b). For 1186
the Mo isotope record, these dynamic fluctuations in surface oxygenation are manifested in the 1187
temporal overlap of intervals containing fractionated and non-fractionated δ98Mo relative to the 1188
igneous baseline. 1189
Part 2: Tracing Global Ocean Oxygenation in the post-GOE World 1190
Next, we provide an overview of global ocean redox conditions during the Phanerozoic and 1191
Proterozoic Eons from the perspective of the Mo isotope system. The Mo isotope data from each 1192
stratigraphic section tells its own story for a specific interval of Earth history. A broader 1193
temporal perspective on changes in global ocean redox conditions since the GOE can be obtained 1194
from a compilation of Mo isotope data from euxinic ORM (Dahl et al., 2010b; Duan et al., 2010; 1195
Wille et al., 2013; Chen et al., 2015; Kendall et al., 2015a; Partin et al., 2015; Fig. 12). The 1196
maximum δ98Mo found in ORM for any time interval provides the most conservative estimate of 1197
seawater δ98Mo during any particular period of Earth history. Lower δ98Mo values within each 1198
interval either indicate that fluctuations in seawater δ98Mo occurred during that interval, or that 1199
Mo isotope fractionation occurred locally between seawater and sediments because of weakly 1200
euxinic conditions, non-quantitative removal of Mo from bottom waters, or operation of an Fe-1201
Mn particulate shuttle. 1202
Two observations are immediately apparent from the compilation. As expected, the Phanerozoic 1203
world overall had higher seawater δ98Mo and thus was more oxygenated compared with the 1204
Proterozoic (Fig. 12a), consistent with numerous other types of elemental and isotopic data from 1205
sedimentary rocks (e.g., Lyons et al., 2014). Second, the Phanerozoic witnessed oscillations in 1206
seawater δ98Mo in response to changes in global ocean redox conditions, including across the 1207
Proterozoic-Phanerozoic boundary and in the early Paleozoic (Dahl et al., 2010b; Chen et al., 1208
2015; Kendall et al., 2015a). A moderate positive correlation is observed between the highest 1209
δ98Mo and average Mo/TOC ratios of ORM in the compilation (Fig. 12b). Such a correlation is 1210
expected because a large seawater Mo inventory, reflected by high Mo/TOC ratios in ORM, 1211
should be associated with a more oxygenated ocean floor, resulting in high seawater δ98Mo. 1212

37
In addition to having low δ98Mo (≤1.4‰), Proterozoic ORM deposited between 2050 and 640 1213
Ma are characterized by Mo/TOC ratios that are intermediate between Archean and Phanerozoic 1214
ORM (Arnold et al., 2004; Scott et al., 2008; Kendall et al., 2009, 2011, 2015a; Dahl et al., 2011; 1215
Asael et al., 2013; Reinhard et al., 2013a; Partin et al., 2015). Mass balance models suggest that 1216
the oceanic Mo reservoir was probably <20% of today, and that the maximum extent of ocean 1217
euxinia was <1-10% of the seafloor (Dahl et al., 2011; Reinhard et al., 2013a; Chen et al., 2015). 1218
These observations are consistent with a redox-stratified ocean structure, specifically oxygenated 1219
surface waters, euxinic mid-depth waters along productive ocean margins, and either ferruginous 1220
or weakly oxygenated deep waters. The oceanic Mo isotope mass balance model cannot 1221
distinguish between weakly oxygenated and ferruginous sinks for Mo (both included in the SAD 1222
sink) because the magnitude of Mo isotope fractionation in such settings is similar (Goldberg et 1223
al., 2009, 2012; Dahl et al., 2010b; Kendall et al., 2015a). 1224
We emphasize that variations in pre-Ediacaran Proterozoic seawater δ98Mo were likely and that 1225
some of the maximum δ98Mo may still only represent minimum values for global seawater. In 1226
particular, those intervals with high Mo enrichments (e.g., Velkerri Formation; > 100 ppm Mo; 1227
Kendall et al., 2009) likely reflect non-quantitative removal of Mo from bottom waters, 1228
suggesting that Mo isotope fractionation was expressed between seawater and sediments. Hence, 1229
it is possible that seawater δ98Mo reached higher values at least sporadically between the GOE 1230
and Neoproterozoic Oxidation Event. Future work will improve the temporal resolution of the 1231
pre-Ediacaran Proterozoic database and better constrain the range of seawater δ98Mo. 1232
The Proterozoic-Phanerozoic transition is currently an interval of intense scrutiny. Excursions to 1233
high δ98Mo (≥2‰), similar to modern seawater, are observed in late Ediacaran (Kendall et al. 1234
2015a) and early Cambrian ORM (Wille et al., 2008; Chen et al., 2015; Wen et al., 2015; Cheng 1235
et al., 2016), as well as in early Cambrian phosphorite deposits (Wen et al., 2011). Similarly, 1236
high δ98Mo is also observed in early Hirnantian ORMs deposited at a time of global cooling and 1237
glaciation (Zhou et al., 2012, 2015). However, lower δ98Mo values (<2‰) dominate late 1238
Ediacaran and early Phanerozoic (pre-Devonian) ORMs (Lehmann et al., 2007; Wille et al., 1239
2008; Dahl et al., 2010b; Xu et al., 2012; Zhou et al., 2012, 2015; Chen et al., 2015; Kendall et 1240
al., 2015a; Kurzweil et al., 2015b; Wen et al., 2015; Cheng et al., 2016). These low values may 1241
reflect a more deoxygenated global ocean state. Alternatively, they can be attributed to Mo 1242
isotope fractionation in the local depositional environment because of weakly euxinic or non-1243
euxinic conditions or the operation of an active Fe-Mn particulate shuttle (e.g., Neubert et al., 1244
2008; Gordon et al., 2009; Herrmann et al., 2012). Therefore, it is not clear if the high δ98Mo 1245
values represent a permanent transition to a more oxygenated ocean state, episodic oxygenation, 1246
or even an episode of expanded Mo burial with large isotope fractionations in reducing settings, 1247
specifically the weakly euxinic sink (Wille et al., 2008; Dahl et al. 2010b; Boyle et al. 2014; 1248
Chen et al. 2015; Kendall et al., 2015a). Those ORM with high Mo enrichments and high δ98Mo 1249
are likely to reflect, at minimum, episodes of widespread oxygenation because such conditions 1250
permit both a large oceanic Mo inventory and high seawater δ98Mo. 1251

38
The Mo isotope composition of ORM has been measured during biotic crises, when expansions 1252
of anoxic and sulfidic water masses are thought to have eliminated large portions of the marine 1253
fauna. The predicted consequence on seawater δ98Mo during a significant expansion of ocean 1254
euxinia is a shift to lower values. Indeed, this behavior is recorded in ORMs both from the 1255
Toarcian oceanic anoxic event (~ 183 Ma, Pearce et al. 2008) and from the Late Cambrian 1256
SPICE event (~ 500 Ma, Gill et al. 2009). However, sediments deposited in basins where the 1257
redox conditions of the local bottom waters changed from oxygenated to euxinic can see a 1258
positive shift in δ98Mo, due to the smaller fractionation between seawater and sediments 1259
expressed in most anoxic environments compared with oxygenated settings (e.g., Zhou et al., 1260
2012; Proemse et al., 2013). 1261
An example of this process is observed in sediments deposited in deep-water slope environments 1262
during the Late Permian extinction event at Buchanan Lake in the Sverdrup Basin, Arctic 1263
Canada. These sediments show a large positive shift in δ98Mo values from -2.0‰ to 2.2‰, 1264
requiring local redox changes. Moreover, the positive δ98Mo trend is associated with a dramatic 1265
increase to high Mo enrichments (up to 80 ppm), thus confirming increasingly more reducing 1266
conditions in the local basin during peak δ98Mo values (Proemse et al., 2013). A similar scenario 1267
was observed in the Shangsi section, Southern China (Zhou et al. 2012). Other parts of the 1268
Sverdrup basin remained oxygenated during the mass extinction event, suggesting shallow water 1269
anoxia was not a global phenomenon. This observation is consistent with the near-modern 1270
seawater δ98Mo values in sediments deposited during the local peak in reducing conditions, 1271
which suggest a substantial oxic Mo sink existed at this time (Proemse et al., 2013). 1272
Sediments from the Late Jurassic Kimmeridge Clay Formation (155-148 Ma) show evidence for 1273
slightly more widespread euxinia than today (Pearce et al. 2010b), whereas sections from the 1274
Cenomanian-Turonian oceanic anoxic event (~ 94 Ma, OAE2) suggest seawater δ98Mo decreased 1275
to ~1‰ at the peak of the event (Westermann et al., 2014; Dickson et al., 2016; Goldberg et al., 1276
2016). Many samples from OAE2 sections have δ98Mo well below the average oceanic input 1277
(i.e., < 0.6‰), implying Mo isotope fractionation between seawater and sediments during 1278
deposition. This observation illustrates how difficult it is to record seawater δ98Mo through time. 1279
Expansions of anoxic waters during hyperthermal events is observed using local redox proxies at 1280
multiple sites during the Paleocene-Eocene thermal maximum and the early Eocene thermal 1281
maximum 2 (Dickson and Cohen, 2012; Dickson et al., 2012, 2014). The δ98Mo values in these 1282
ORMs are persistently high (2.1‰) and close to modern seawater (2.3‰), suggesting that 1283
expanded ocean anoxia was limited to the short duration (~100-200 kyr) of the warming events. 1284

39
In summary, studies of the post-GOE world highlight that the Mo isotope paleoredox proxy can 1285
trace variations in the global extent of ocean euxinia, with a greater extent of such conditions 1286
suggested by low Mo enrichments and low δ98Mo in ORM deposited from locally euxinic 1287
bottom waters. By contrast, high Mo enrichments coupled with high δ98Mo values (i.e., similar to 1288
modern seawater) in ORM are a strong indicator of widespread ocean oxygenation. In some 1289
cases, it is possible that the δ98Mo of euxinic ORM can be significantly lower than the seawater 1290
composition because of deposition from weakly euxinic bottom waters or the operation of an Fe-1291
Mn shuttle in shallower basins where the chemocline is close to the sediment-water interface. In 1292
such cases, the Mo data from ORM can provide misleading information. Hence, it is good 1293
practice to couple Mo isotope data with other paleoredox proxies to provide the most robust 1294
information on global ocean redox conditions. 1295
7. APPLICATION TO NATURAL RESOURCES 1296
Ore Deposits 1297
Application of the Mo isotope system as a process tracer for ore deposits is in its infancy. Initial 1298
studies explored the range of Mo isotope compositions for different deposit types, and the 1299
relationship between Mo isotope variations, fractionation mechanisms, mineralization processes, 1300
and fluid sources for individual deposits. 1301
Predictably, these initial efforts have concentrated on molybdenite (the principal ore mineral of 1302
Mo), which is approximately 60% Mo by weight and often dominates the Mo mass balance in 1303
mineralizing systems. Rhenium concentrations in molybdenites may range from a few ppm to 1304
several weight percent due to the tendency for Re4+ to substitute for Mo4+, thus enabling the use 1305
of the Re-Os geochronometer to date the timing of molybdenite crystallization and associated 1306
mineralization (Stein et al., 2001; Golden et al., 2013). Hence, Mo, S, and Re stable isotope 1307
compositions and Re-Os crystallization ages from molybdenites have potential to shed detailed 1308
insight on the alteration and mineralization processes responsible for many different types of ore 1309
deposit, including porphyry copper(-molybdenum), porphyry molybdenum, lode gold, granite-1310
pegmatite, greisen, skarn, and iron oxide copper-gold deposits (Breillat et al., 2016). A 1311
particularly attractive feature of molybdenite is the robustness of this mineral to post-ore events 1312
such as granulite facies metamorphism and intense deformation (Stein et al., 2001). 1313

40
The total range of Mo isotope variation in molybdenites is ~4‰, with isotopic compositions 1314
ranging between –1.37‰ and +2.52‰ (Fig. 13; Breillat et al., 2016). The average δ98Mo of 1315
molybdenites is 0.29 ± 1.04‰ (2SD). Significant variability in the δ98Mo of molybdenites can 1316
occur for specific categories of ore deposits (> 2‰) and even within single deposits (> 1‰), 1317
including at the cm-scale (Hannah et al., 2007; Mathur et al., 2010; Greber et al., 2011, 2014; 1318
Segato et al., 2015; Shafiei et al., 2015; Breillat et al., 2016). By contrast, minimal Mo isotope 1319
variation is observed between the fractions of single coarse grains cut along and across cleavage 1320
planes for a number of molybdenites from different porphyry deposits (Segato et al., 2015). No 1321
discernible trends are observed for the δ98Mo of molybdenites through time (Hannah et al., 2007; 1322
Breillat et al., 2016). 1323
Temperature may exert an influence on the δ98Mo of molybdenites in an ore deposit. For 1324
example, molybdenite from porphyry and granite deposits, representing higher temperature 1325
crystallization, have lower δ98Mo (average of about 0.1‰ for each type; Shafiei et al., 2015; 1326
Breillat et al., 2016). By contrast, higher δ98Mo is observed in molybdenites deposited by lower 1327
temperature fluids, such as in greisen and iron oxide copper-gold deposits (average of about 1328
1.25‰ and 1.07‰, respectively; Breillat et al., 2016). However, preliminary studies reveal that 1329
Mo isotope fractionation in ore-forming systems is probably also influenced by Rayleigh 1330
distillation, fluid boiling, variations in redox conditions, and possibly molybdenite crystal 1331
structure (Hannah et al., 2007; Mathur et al., 2010; Greber et al., 2011, 2014; Shafiei et al., 1332
2015). Significant overlap is observed in the δ98Mo of molybdenites from different ore deposit 1333
types (Segato et al., 2015; Breillat et al., 2016), indicating that isotopic variations should be 1334
interpreted in the context of an individual deposit's geological history rather than the type of ore 1335
deposit it represents. 1336
In magmatic-hydrothermal environments, Mo may be transported as a number of different 1337
species, such as MoO3, MoO3∙nH2O, MoO42–, HMoO4
–, H2MoO4, MoO(OH)Cl2, MoO2Cl2, 1338
K2MoO4, KHMoO4, Na2MoO4, NaHMoO4, and NaHMoO2S2 (e.g., Candella and Holland, 1984; 1339
Cao, 1989; Farges et al., 2006; Rempel et al., 2006, 2009; Ulrich and Mavrogenes, 2008; Zhang 1340
et al., 2012). The dominant species involved and their associated isotope fractionations are 1341
poorly understood. Molybdenum may be transported in the vapor state as MoO3∙nH2O (Rempel 1342
et al., 2006, 2009) and crystallize from the vapor upon reaction with H2S. If correct, this means 1343
that Mo isotope fractionation is possible at high temperatures. For example, Rayleigh distillation 1344
associated with molybdenite precipitation along a fracture system would result in different δ98Mo 1345
for earlier (proximal) and later (distal) molybdenites (Hannah et al., 2007). The degree of 1346
covariation between Mo and S isotope compositions in molybdenites from a single deposit 1347
represents one test of this hypothesis because in an ore-forming system with limited Mo and S 1348
availability, the isotopic signatures of both elements should be positively correlated if Rayleigh 1349
distillation is the main mechanism of isotope fractionation (Hannah et al., 2007). Paired Mo and 1350
S isotope analyses have not yet been reported for molybdenite. 1351

41
Fluid boiling may explain some Mo isotope variations in porphyry systems because of the 1352
formation of brine and vapor components with different Mo isotope compositions (Greber et al., 1353
2014; Shafiei et al., 2015). Lighter Mo isotopes may preferentially partition into the vapor phase 1354
whereas heavier Mo isotopes remain in the brine (Shafiei et al., 2015). In the Kerman porphyry 1355
copper deposits of Iran, a high-temperature (400-600°C) brine phase deposited isotopically 1356
heavy Mo in the early stages of mineralization, whereas the vapor phase (300-400°C) 1357
crystallized isotopically lighter molybdenite in the hydrothermal fracture system (Fig. 14). 1358
Hence, Shafiei et al. (2015) suggested that the δ98Mo of molybdenites in a porphyry system will 1359
evolve to lower values over time and with distance from the mineralizing source. The crystal 1360
structure of the molybdenite may exert some control on the Mo isotope composition, with 1361
heavier Mo isotopes preferentially taken up by the denser 2H polytype compared with the less 1362
dense 3R polytype (Shafiei et al., 2015). 1363
Redox reactions and multiple hydrothermal events may also exert a major control on Mo isotope 1364
fractionation in ore-forming systems. Molybdenites from Late Paleozoic high temperature (300-1365
600°C) quartz-molybdenite veins (Aar Massif, Switzerland) have a bimodal distribution in 1366
δ98Mo, with peaks at ~0.2‰ and ~1.1‰ (Greber et al., 2011). Single-stage Rayleigh distillation 1367
is thus not the main mechanism responsible for Mo isotope fractionation. Isotopic variability in 1368
the molybdenites at both small (cm apart) and large (different hand samples) scales suggests Mo 1369
isotope fractionation was influenced by redox conditions during precipitation of molybdenite 1370
during separate episodes of fluid expulsion from an evolving magma (Greber et al., 2011). 1371
Magmatic evolution and redox reactions may lead to higher δ98Mo of molybdenites in a 1372
porphyry system over time (Greber et al., 2014). In the porphyry Questa deposit (New Mexico, 1373
U.S.A.), three major fractionation mechanisms were identified by Greber et al. (2014) that 1374
operated over a temperature range of ~700 to 350°C. First, removal of isotopically lighter Mo 1375
into minerals during fractional crystallization can enrich the remaining melt in isotopically 1376
heavier Mo. Second, fluids exsolved from the magma are preferentially enriched in isotopically 1377
heavier Mo isotopes. Third, lighter Mo isotopes are preferentially incorporated into molybdenite 1378
during crystallization, causing the remaining fluid to have an isotopically heavier composition. 1379
Hence, later-stage molybdenites can have higher δ98Mo than earlier-stage molybdenites. In the 1380
Questa deposit, this is reflected by a low δ98Mo for a rhyolite formed after fluid exsolution (~ –1381
0.57‰) and successively higher median δ98Mo for molybdenite in igneous-phase magmatic-1382
hydrothermal breccia (–0.29‰), hydrothermal-phase magmatic-hydrothermal breccia (–0.05‰), 1383
and stockwork veins (+0.22‰) (Fig. 15; Greber et al., 2014). 1384

42
The work of Greber et al. (2014) and Shafiei et al. (2015) on porphyry deposits suggests that the 1385
δ98Mo of hydrothermal fluids and molybdenite may evolve to either lower or higher values over 1386
time and with distance from the mineralizing source, depending on the relative influence of 1387
various processes (fluid boiling, magmatic evolution, fluid exsolution, redox reactions) on the 1388
Mo isotope systematics of an ore-forming system. It is also possible that the spatiotemporal 1389
variations within a single deposit will be obscured by the interplay of multiple processes 1390
operating at different scales, times, and locations within the ore-forming system. 1391
The starting Mo isotope composition of an ore-forming porphyry system can also influence the 1392
isotope compositions of molybdenites. Based on the comparison of Nd isotope data from 1393
magmatic rocks with Mo isotope data from molybdenites for a number of different deposits, 1394
Wang et al. (2016) suggested that porphyry systems with crustal magma sources will precipitate 1395
molybdenites with generally higher δ98Mo compared with mantle-derived magmatic systems. 1396
Molybdenum isotope studies point to the importance of redox reactions on the δ98Mo of Mo-1397
bearing mineral phases in low-temperature systems (Ryb et al., 2009; Greber et al., 2011; Song 1398
et al., 2011). In a Pliocene low-temperature system (100-160°C) in Switzerland, molybdate may 1399
have been transported by oxidizing surface waters into brecciated rocks (Grimsel breccia) where 1400
it was reduced, leading to precipitation of Mo-bearing sulfide phases (Greber et al., 2011; the 1401
mineralogy could not be identified by the authors). The larger Mo isotope variation of ~3‰ in 1402
the brecciated rocks compared with individual high-temperature systems may reflect a 1403
combination of lower temperature crystallization, reduction of MoO42– (an uncommon species in 1404
high-temperature systems), and multiple stages of re-dissolution and re-precipitation of Mo 1405
(Greber et al., 2011). Variable redox conditions and depositional environments (open marine 1406
versus restricted) were invoked to explain the range of Mo isotope compositions in the different 1407
orebodies of the Dajiangping pyrite deposit in China (Song et al., 2011). 1408
A study of Mo-rich iron oxide veins by Ryb et al. (2009) revealed significant Mo isotopic 1409
variation of greater than 4‰ in a low temperature mineralizing system associated with the Dead 1410
Sea transform. The isotopic variation likely reflects interaction of dense evaporitic marine brines 1411
(δ98Mo ~ 2.3‰) with isotopically lighter igneous and sedimentary rocks, as well as Rayleigh 1412
distillation of Mo isotopes along the brine flow path. The latter is suggested to explain Mo 1413
isotope compositions in the iron oxide veins that are higher than seawater δ98Mo. This study 1414
demonstrates that Mo isotopes have the potential to be used as both a source and process tracer 1415
for subsurface fluid migration. 1416
Petroleum Systems 1417
43
Petroleum metal isotope geochemistry has potential for oil-source rock and oil-oil correlation 1418
and tracing petroleum generation and reservoir processes, but has not advanced beyond the 1419
exploratory stage. The Mo isotopic analysis of oils is an analytically challenging problem caused 1420
by both the highly complex nature of oil matrices as well as the low Mo concentration of oils 1421
(typically ppb to low ppm; Ventura et al., 2015). However, as shown by Ventura et al. (2015), it 1422
is expected these challenges can be circumvented for the Mo stable isotope system by using the 1423
double spike method (to minimize matrix effects) as well as high temperature and pressure 1424
microwave digestion of bulk oil samples. Another possible fruitful approach is to develop 1425
techniques to isolate the Mo-rich fraction(s) of oils (e.g., similar to asphaltene separation for Re-1426
Os isotope analyses; Selby et al., 2007; Mahdaoui et al., 2013). 1427
Within a single petroleum-producing sedimentary basin, distinctive δ98Mo may be preserved in 1428
different petroleum source rocks because of: a) differences in the global seawater δ98Mo 1429
associated with variations in global ocean redox conditions; and/or b) differences in the 1430
magnitude of Mo isotope fractionation between local seawater and sediments caused by 1431
differences in the dissolved O2 and H2S concentrations of local bottom waters (Ventura et al., 1432
2015). If the Mo isotope composition of oils is not affected by oil migration or reservoir 1433
processes, then it may be possible to infer the relative importance of different source rocks to oil 1434
reservoirs by comparing the Mo isotope compositions of oils and source rocks (Archer et al., 1435
2012). This approach would complement traditional methods of oil-source rock correlation using 1436
light stable isotopes and biomarkers. 1437
The Mo isotope composition of oil may not be affected by oil maturation, migration, and 1438
biodegradation on the scale of a sedimentary basin, thus raising the possibility of using Mo 1439
isotopes for oil-source rock correlation (Archer et al., 2012). However, it is not known if source 1440
rock Mo isotope compositions are transferred directly to oils. Furthermore, systematic studies are 1441
required to assess the impact on oil Mo isotope compositions by other reservoir processes such 1442
as thermochemical sulfate reduction, which is known to affect the isotopic composition of other 1443
redox-sensitive metals like Re and Os (Lillis and Selby, 2013). Ventura et al. (2015) reported a 1444
range of ~1.1‰ (from –0.1‰ to 1.0‰) for four crude oils from the Campos Basin (Brazil), but 1445
did not measure the δ98Mo of the lacustrine source rocks. A total range of ~1.5‰ was reported 1446
by Archer et al. (2012) for multiple petroleum systems. 1447
Anthropogenic Tracing 1448

44
Application of Mo isotopes as an anthropogenic tracer is confined to a small number of studies. 1449
Although anthropogenic Mo is only a small component in most lacustrine and marine settings 1450
studied to date (Dahl et al., 2010a; Scheiderich et al. 2010b; Glass et al. 2012), it has been 1451
reported from some localities (e.g., Chappaz et al., 2012; Rahaman et al., 2014). Chappaz et al. 1452
(2012) used the δ98Mo of sediments to fingerprint the addition of anthropogenic Mo to lakes in 1453
eastern Canada from smelting or fossil fuel combustion. In both cases, the anthropogenic source 1454
was characterized by a distinct isotope composition of 0.1 ± 0.1 ‰. Rahaman et al. (2014) 1455
calculated that anthropogenic Mo may account for up to 27% of the dissolved Mo load in the 1456
Tapi estuary that drains into the Arabian Sea. The δ98Mo of aerosols may also be useful as a 1457
tracer of urban anthropogenic emissions (Lane et al., 2013). It is expected that development of 1458
Mo isotopes as an anthropogenic tracer will accelerate in the near future. 1459
However, distinguishing isotopically between natural and anthropogenic Mo is not always 1460
straightforward because anthropogenic source signatures may be overprinted by natural Mo 1461
isotope fractionation in the environment or because of isotopic similarities between the natural 1462
and anthropogenic sources of Mo. For example, sediments from the Baltimore Harbor (a site of 1463
smelting operations) that are enriched in Mo did not have a different δ98Mo compared with 1464
uncontaminated sediments elsewhere in the Chesapeake Bay, in contrast to Os isotope data. 1465
Hence, the Mo is either not anthropogenic in origin or the natural and anthropogenic Mo have 1466
identical isotopic compositions (Scheiderich et al., 2010b). Neubert et al. (2011) could not find 1467
clear evidence for anthropogenic contamination by industry and agriculture in the concentration 1468
and isotopic composition of dissolved Mo in small rivers from India, Switzerland, and China. 1469
8. CONCLUSIONS 1470
The Mo isotope system has matured into a valuable paleoceanographic tracer, as reflected by the 1471
large number of studies that seek to characterize local and global ocean redox conditions on the 1472
ancient Earth. Although it has long been recognized that rivers are the only major source of Mo 1473
to the modern oceans, research efforts over the past decade revealed that there are three major 1474
Mo sinks: well-oxygenated settings, sulfidic sediments overlain by weakly oxygenated bottom 1475
waters, and euxinic settings characterized by the presence of H2S in the water column. The 1476
δ98Mo of ancient seawater is most commonly inferred from ORM deposited from strongly 1477
euxinic bottom waters in semi-restricted marine basins. However, the difficulty of distinguishing 1478
between strongly versus weakly euxinic conditions during ORM deposition makes it challenging 1479
to confirm that such rocks do indeed record the seawater Mo isotope composition. Chemical 1480
sediments including carbonates, phosphorites, and iron formations have recently also been used 1481
to infer seawater δ98Mo. 1482

45
Building from observations of Mo isotope fractionation in modern environments, a wealth of 1483
studies have sought to constrain the past extent of global ocean oxygenation from the δ98Mo of 1484
Proterozoic and Phanerozoic sedimentary archives, and to look for the Mo isotope expression of 1485
initial environmental oxygenation on the Archean Earth. From these studies, it is clear that both 1486
local and global conditions affect sedimentary δ98Mo. In addition, the Mo isotope paleoredox 1487
proxy is most sensitive to the extent of ocean euxinia, rather than to oxygenated versus anoxic 1488
(euxinic and ferruginous) conditions, because the rate of Mo burial into sediments correlates with 1489
dissolved H2S concentrations. Hence, the Mo isotope system should be used in combination with 1490
other geochemical proxies to obtain the most reliable information on paleoredox conditions. 1491
Refinements in our understanding of the modern oceanic Mo isotope budget, including the 1492
significance of biological Mo isotope fractionation and Mo isotope behavior in weakly euxinic 1493
settings, will further improve the Mo isotope paleoredox proxy. 1494
New applications to other low-temperature systems (petroleum and anthropogenic tracing) as 1495
well as to high-temperature environments (meteorites, magmatic systems, and ore deposits) are 1496
rapidly emerging. Many basic questions have yet to be answered. Are Mo isotopes useful for oil-1497
source rock correlation or for tracing oil reservoir processes? Can spatial variations in the Mo 1498
isotope composition of molybdenite be used as a vector to mineralization, or for fingerprinting 1499
specific processes in ore-forming systems (e.g., fluid boiling, Rayleigh distillation, redox 1500
variations, single versus multiple mineralization events)? Will Mo isotopes become a prominent 1501
anthropogenic tracer, or does natural fractionation of Mo isotopes limit this application? What 1502
more can Mo isotopes tell us about the evolution of magmatic systems, metamorphic prograde-1503
retrograde paths, mantle reservoirs and fluxes, and early solar system processes? 1504
The Mo isotope system was part of the first wave of non-traditional stable isotope systems to be 1505
explored. We fully expect that it will continue to hold a prominent position in studies of low- and 1506
high-temperature geochemistry. 1507
Acknowledgements 1508
Kendall acknowledges support from an NSERC Discovery Grant (RGPIN-435930). Dahl 1509
acknowledges a grant from the VILLUM Foundation (VKR023127). Anbar acknowledges 1510
support from NSF 1338810. Martin Wille, Ryan Mathur, and two anonymous reviewers 1511
provided helpful comments and suggestions. Xinming Chen produced updated Eh-pH diagrams. 1512
Alysa Segato is thanked for providing constructive suggestions on Mo isotopes in natural 1513
resources. Susan Selkirk and Xinze Lu provided valuable assistance with drafting of the figures. 1514
REFERENCES 1515
Algeo TJ, Lyons TW (2006) Mo–total organic carbon covariation in modern anoxic marine 1516
environments: Implications for analysis of paleoredox and paleohydrographic conditions. 1517
Paleoceanogr 21:1-23 1518

46
1519
Algeo TJ, Tribovillard N (2009) Environmental analysis of paleoceanographic systems based on 1520
molybdenum-uranium covariation. Chem Geol 268:211-225 1521
1522
Alvarez HM, Xue Y, Robinson CD, Canalizo-Hernandez MA, Marvin RG, Kelly RA, 1523
Mondragon A, Penner-Hahn JE, O'Halloran TV (2010) Tetrathiomolybdate inhibits copper 1524
trafficking proteins through metal cluster formation. Science 327:331-334 1525
1526
Amrhein C, Mosher PA, Brown AD (1993) The effects of redox on Mo, U, B, V, and As 1527
solubility in evaporation pond soils. Soil Science 155:249-255 1528
1529
Anbar AD (2004) Molybdenum stable isotopes: observations, interpretations, directions. Rev 1530
Mineral Geochem 55:429-454 1531
1532
Anbar AD, Knoll AH (2002) Proterozoic Ocean Chemistry and Evolution: A Bioinorganic 1533
Bridge? Science 297:1137-1142 1534
1535
Anbar AD, Rouxel O (2007) Metal Stable Isotopes in Paleoceanography. Ann Rev Earth Planet 1536
Sci 35:717-746 1537
1538
Anbar AD, Knab KA, Barling J (2001) Precise determination of mass-dependent variations in 1539
the isotopic composition of molybdenum using MC-ICPMS. Anal Chem 73:1425-1431 1540
1541
Anbar AD, Duan Y, Lyons TW, Arnold GL, Kendall B, Creaser RA, Kaufman AJ, Gordon GW, 1542
Scott C, Garvin J, Buick R (2007) A whiff of oxygen before the Great Oxidation Event? Science 1543
317:1903-1906 1544
1545
Archer C, Vance D (2008) The isotopic signature of the global riverine molybdenum flux and 1546
anoxia in the ancient oceans. Nature Geosci 1:597-600 1547
1548
Archer C, Elliott T, van den Boorn S, van Bergen P (2012) Mo and Ni isotope systematics in 1549
petroleum fluids across subsurface alteration gradients. Mineral Mag 76:1433 1550
1551
Arlandini C, Käppeler F, Wisshak K, Gallino R, Lugaro M, Busso M, Straniero O (1999) 1552
Neutron capture in low-mass asymptotic giant branch stars: cross sections and abundance 1553
signatures, Astrophys J 525:886-900 1554
1555
Arnold GL, Anbar AD, Barling J, Lyons TW (2004) Molybdenum isotope evidence for 1556
widespread anoxia in Mid-Proterozoic oceans. Science 304:87-90 1557
1558
Arnold GL, Lyons TW, Gordon GW, Anbar AD (2012) Extreme change in sulfide 1559
concentrations in the Black Sea during the Little Ice Age reconstructed using molybdenum 1560
isotopes. Geology 40:595-598 1561
1562
Asael D, Tissot FLH, Reinhard CT, Rouxel O, Dauphas N, Lyons TW, Ponzevera E, Liorzou C, 1563
Chéron S (2013) Coupled molybdenum, iron and uranium stable isotopes as oceanic paleoredox 1564
proxies during the Paleoproterozoic Shunga Event. Chem Geol 362:193-210 1565

47
1566
Azrieli-Tal I, Matthews A, Bar-Matthews M, Almogi-Labin A, Vance D, Archer C, Teutsch N 1567
(2014) Evidence from molybdenum and iron isotopes and molybdenum-uranium covariation for 1568
sulphidic bottom waters during Eastern Mediterranean sapropel S1 formation. Earth Planet Sci 1569
Lett 393:231-242 1570
1571
Baes CF, Mesmer RE (1976) Hydrolysis of cations. Wiley, New York 1572
1573
Baldwin GJ, Nägler TF, Greber ND, Turner EC, Kamber BS (2013) Mo isotopic composition of 1574
the mid-Neoproterozoic ocean: an iron formation perspective. Precambr Res 230:168-178 1575
1576
Barling J, Arnold GL, Anbar AD (2001) Natural mass-dependent variations in the isotopic 1577
composition of molybdenum. Earth Planet Sci Lett 193:447-457 1578
1579
Barling J, Anbar AD (2004) Molybdenum isotope fractionation during adsorption by manganese 1580
oxides. Earth Planet Sci Lett 217:315-329 1581
1582
Beard BL, Johnson CM, Skulan JL, Nealson KH, Cox L, Sun H (2003) Application of Fe 1583
isotopes to tracing the geochemical and biological cycling of Fe. Chem Geol 195:87-117 1584
1585
Becker H, Walker RJ (2003) Efficient mixing of the solar nebula from uniform Mo isotopic 1586
composition of meteorites. Nature 425:152-155 1587
1588
Bellenger JP, Wichard T, Kustka AB, Kraepiel AML (2008) Uptake of molybdenum and 1589
vanadium by a nitrogen-fixing soil bacterium using siderophores. Nature Geosci 1:243-246 1590
1591
Bertine K, Turekian K (1973) Molybdenum in marine deposits. Geochim Cosmochim Acta 1592
37:1415-1434 1593
1594
Bigeleisen J (1947) Calculation of equilibrium constants for isotopic exchange reactions. J Chem 1595
Phys 15:261-267 1596
1597
Biswas KC, Woodards NA, Xu H, Barton LL (2009) Reduction of molybdate by sulfate-1598
reducing bacteria. Biometals 22:131-139 1599
1600
Bostick BC, Fendorf S, Helz GR (2003) Differential adsorption of molybdate and 1601
tetrathiomolybdate on pyrite (FeS2). Environ Sci Technol 37:285-291 1602
1603
Boyd ES, Anbar AD, Miller S, Hamilton TL, Lavin M, Peters JW (2011) A late methanogen 1604
origin for molybdenum-dependent nitrogenase. Geobiol 9:221-232 1605
1606
Boyle RA, Dahl TW, Dale AW, Shields-Zhou GA, Zhu M, Brasier MD, Canfield DE, Lenton 1607
TM (2014) Stabilization of the coupled oxygen and phosphorus cycles by the evolution of 1608
bioturbation. Nature Geosci 7:671-676 1609
1610
Breillat N, Guerrot C, Marcoux E, Négrel P (2016) A new global database of δ98Mo in 1611
molybdenites: a literature review and new data. J Geochem Explor 161:1-15 1612
1613
48
Bruland KW (1983) Trace elements in seawater. In: Chemical Oceanography. Riley JP, Chester 1614
R (eds) Academic Press, London, p 157-220 1615
1616
Brumsack H, Gieskes J (1983) Interstitial water trace-metal chemistry of laminated sediments 1617
from the Gulf of California, Mexico. Mar Chem 14:89-106 1618
1619
Burkhardt C, Kleine T, Oberli F, Pack A, Bourdon A, Wieler R (2011) Molybdenum isotope 1620
anomalies in meteorites: constraints on solar nebula evolution and origin of the Earth. Earth 1621
Planet Sci Lett 312:390-400 1622
1623
Burkhardt C, Kleine T, Dauphas N, Wieler R (2012) Origin of isotopic heterogeneity in the solar 1624
nebula by thermal processing and mixing of nebular dust. Earth Planet Sci Lett 357-358:298-307 1625
1626
Burkhardt C, Hin RC, Kleine T, Bourdon B (2014) Evidence for Mo isotope fractionation in the 1627
solar nebula and during planetary differentiation. Earth Planet Sci Lett 391:201-211 1628
1629
Cabral AR, Creaser RA, Nägler T, Lehmann B, Voegelin AR, Belyatsky B, Pašava J, Seabra 1630
Gomes Jr AA, Galbiatti H, Böttcher ME, Escher P (2013) Trace-element and multi-isotope 1631
geochemistry of Late-Archean black shales in the Carajás iron-ore district, Brazil. Chem Geol 1632
362:91-104 1633
1634
Calvert SE, Piper DZ (1984) Geochemistry of ferromanganese nodules from DOMES site A, 1635
Northern Equatorial Pacific: Multiple diagenetic metal sources in the deep sea. Geochim 1636
Cosmochim Acta 48:1913-1928 1637
1638
Calvert SE, Price NB (1977) Geochemical variation in ferromanganese nodules and associated 1639
sediments from the pacific ocean. Mar Chem 5:43-74 1640
1641
Candela PA, Holland HD (1984) The partitioning of copper and molybdenum between silicate 1642
melts and aqueous fluids. Geochim Cosmochim Acta 48:373-380 1643
1644
Cao X (1989) Solubility of molybdenite and the transport of molybdenum in hydrothermal 1645
solutions. PhD Dissertation, Iowa State University, Ames, Iowa 1646
1647
Chaillou, G, Anschutz P, Lavaux G, Schafer J, Blanc G (2002) The distribution of Mo, U, and 1648
Cd in relation to major redox species in muddy sediments of the Bay of Biscay. Mar Chem 1649
80:41-59 1650
1651
Chan KM, Riley JP (1966) The determination of molybdenum in natural waters, silicates and 1652
biological materials. Anal Chim Acta 36:220-229 1653
1654
Chappaz A, Gobeil C, Tessier A (2008) Geochemical and anthropogenic enrichments of Mo in 1655
sediments from perennially oxic and seasonally anoxic lakes in Eastern Canada. Geochim 1656
Cosmochim Acta 72:170-184 1657
1658
Chappaz A, Lyons TW, Gordon GW, Anbar AD (2012) Isotopic fingerprints of anthropogenic 1659
molybdenum in lake sediments. Environ Sci Technol 46:10934-10940 1660

49
1661
Chappaz A, Lyons TW, Gregory DD, Reinhard CT, Gill BC, Li C, Large RR (2014) Does pyrite 1662
act as an important host for molybdenum in modern and ancient euxinic sediments? Geochim 1663
Cosmochim Acta 126:112-122 1664
1665
Chen JH, Papanastassiou DA, Wasserburg GJ, Ngo HH (2004) Endemic Mo isotopic anomalies 1666
in iron and carbonaceous meteorites. Lunar Planet Sci XXXV, 1431 1667
1668
Chen X, Ling H-F, Vance D, Shields-Zhou GA, Zhu M, Poulton SW, Och LM, Jiang S-Y, Li D, 1669
Cremonese L, Archer C (2015) Rise to modern levels of ocean oxygenation coincided with the 1670
Cambrian radiation of animals. Nature Comm 6:7142 1671
1672
Cheng M, Li C, Zhou L, Algeo TJ, Zhang F, Romaniello S, Jin CS, Lei LD, Feng LJ, Jiang SY 1673
(2016) Marine Mo biogeochemistry in the context of dynamically euxinic mid-depth waters: a 1674
case study of the lower Cambrian Niutitang shales, South China. Geochim Cosmochim Acta 1675
183:79-93 1676
1677
Collier RW (1985) Molybdenum in the Northeast Pacific-Ocean. Limnol Oceanogr 30:1351-1678
1354 1679
1680
Crick FHC, Orgel LE (1973) Directed Panspermia. Icarus 19:341-346 1681
1682
Cronan DS (1980) Underwater minerals. Academic Press, London 1683
1684
Cronan DS, Tooms JS (1969) The geochemistry of manganese nodules and associated pelagic 1685
deposits from the Pacific and Indian Oceans. Deep Sea Research 16:335-359 1686
1687
Crusius J, Calvert S, Pedersen T, Sage D (1996) Rhenium and molybdenum enrichments in 1688
sediments as indicators of oxic, suboxic and sulfidic conditions of deposition. Earth Planet Sci 1689
Lett 145:65-78 1690
1691
Czaja AD, Johnson CM, Roden EE, Beard BL, Voegelin AR, Nägler TF, Beukes NJ, Wille M 1692
(2012) Evidence for free oxygen in the Neoarchean ocean based on coupled iron-molybdenum 1693
isotope fractionation. Geochim Cosmochim Acta 86:118-137 1694
1695
Dahl TW, Anbar AD, Gordon GW, Rosing MT, Frei R, Canfield DE (2010a) The behavior of 1696
molybdenum and its isotopes across the chemocline and in the sediments of sulfidic Lake 1697
Cadagno, Switzerland. Geochim Cosmochim Acta 74:144-163 1698
1699
Dahl TW, Hammarlund EU, Anbar AD, Bond DPG, Gill BC, Gordon GW, Knoll AH, Nielsen 1700
AT, Schovsbo NH, Canfield DE (2010b) Devonian rise in atmospheric oxygen correlated to the 1701
radiations of terrestrial plants and large predatory fish. Proc Natl Acad Sci USA 107:17911-1702
17915 1703
1704
Dahl TW, Canfield DE, Rosing MT, Frei RE, Gordon GW, Knoll AH, Anbar AD (2011) 1705
Molybdenum evidence for expansive sulfidic water masses in ~750 Ma oceans. Earth Planet Sci 1706
Lett 311:264-274 1707

50
1708
Dahl TW, Chappaz A, Fitts JP, Lyons TW (2013a) Molybdenum reduction in a sulfidic lake: 1709
evidence from X-ray absorption fine-structure spectroscopy and implications for the Mo 1710
paleoproxy. Geochim Cosmochim Acta 103:213-231 1711
1712
Dahl TW, Ruhl M, Hammarlund EU, Canfield DE, Rosing MT, Bjerrum CJ (2013b) Tracing 1713
euxinia by molybdenum concentrations in sediments using handheld x-ray fluorescence 1714
spectroscopy (HH-XRF). Chem Geol 360-361:241-251 1715
1716
Dauphas N, Marty B, Reisberg L (2002a) Molybdenum evidence for inherited planetary scale 1717
isotope heterogeneity of the protosolar nebula. Astrophys J 565:640-644 1718
1719
Dauphas N, Marty B, Reisberg L (2002b) Molybdenum nucleosynthetic dichotomy revealed in 1720
primitive meteorites. Astrophys J 569:139-142 1721
1722
Dauphas N, Davis AM, Marty B, Reisberg L (2004) The cosmic molybdenum-ruthenium isotope 1723
correlation. Earth Planet Sci Lett 226:465-475 1724
1725
David LA, Alm EJ (2011) Rapid evolutionary innovation during an Archaean genetic expansion. 1726
Nature 469:93-96 1727
1728
Dean W, Piper D, Peterson L (1999). Molybdenum accumulation in Cariaco basin sediment over 1729
the past 24 ky: A record of water-column anoxia and climate. Geology 27:507-510 1730
1731
Dickson AJ, Cohen AS (2012) A molybdenum isotope record of Eocene Thermal Maximum 2: 1732
Implications for global ocean redox during the early Eocene. Paleoceanogr 27:PA3230 1733
1734
Dickson AJ, Cohen AS, Coe AL (2012) Seawater oxygenation during the Paleocene-Eocene 1735
Thermal Maximum. Geology 40:639-642 1736
1737
Dickson AJ, Cohen AS, Coe AL (2014) Continental margin molybdenum isotope signatures 1738
from the early Eocene. Earth Planet Sci Lett 404:389-395 1739
1740
Dickson AJ, Jenkyns HC, Porcelli D, van den Boorn S, Idiz E (2016) Basin-scale controls on the 1741
molybdenum-isotope composition of seawater during Oceanic Anoxic Event 2 (Late 1742
Cretaceous). Geochim Cosmochim Acta 178:291-306 1743
1744
Diemann, E., Müller, A., 1973. Schefel- und Selenverbindungen von übergangsmetallen mit d0-1745
konfiguration (Thio and Seleno compounds of the transition metals with the d0 configuration) 1746
Coord Chem Rev 10:79-122 1747
1748
Duan Y, Anbar AD, Arnold GL, Lyons TW, Gordon GW, Kendall B (2010) Molybdenum 1749
isotope evidence for mild environmental oxygenation before the Great Oxidation Event. 1750
Geochim Cosmochim Acta 74:6655-6668 1751
1752
Eady, R.R., 1996. Structure-Function Relationships pf Alternative Nitrogenases. Chem Rev 1753
96:3013-3030 1754
1755

51
Elbaz-Poulichet, F., Seidel, J.L., Jézéquel, D., Metzger, E., Prévot, F., Simonucci, C., Sarazin, 1756
G., Viollier, E., Etcheber, H., Jouanneau, J.-M., Weber, O., Radakovitch, O., 2005. Sedimentary 1757
record of redox-sensitive elements (U, Mn, Mo) in a transitory anoxic basin (the Thau lagoon, 1758
France). Mar Chem 95:271-281 1759
1760
Emerson, S., Huested, S.S., 1991. Ocean anoxia and the concentrations of molybdenum and 1761
vanadium in seawater. Mar Chem 34:177-196 1762
1763
Erickson BE, Helz GR (2000) Molybdenum (VI) speciation in sulfidic waters: stability and 1764
lability of thiomolybdates. Geochim Cosmochim Acta 64:1149-1158 1765
1766
Eroglu S, Schoenberg R, Wille M, Beukes N, Taubald H (2015) Geochemical stratigraphy, 1767
sedimentology, and Mo isotope systematics of the ca. 2.58-2.50 Ga-old Transvaal Supergroup 1768
carbonate platform, South Africa. Precambr Res 266:27-46 1769
1770
Farges F, Siewert R, Ponader CW, Brown Jr GE, Pichavant M, Behrens H (2006) Structural 1771
environments around molybdenum in silicate glasses and melts. II. Effect of temperature, 1772
pressure, H2O, halogens, and sulfur. Can Mineral 44:755-773 1773
1774
Freymuth H, Vils F, Willbold M, Taylor RN, Elliott T (2015) Molybdenum mobility and isotopic 1775
fractionation during subduction at the Mariana arc. Earth Planet Sci Lett 432:176-186 1776
1777
Francois, R., 1988. A study on the regulation of the concentrations of some trace metals (Rb, Sr, 1778
Zn, Pb, Cu, V, Cr, Ni, Mn and Mo) in Saanich Inlet Sediments, British Columbia, Canada. Mar 1779
Geol 83:285-308 1780
1781
Frausto da Silva JJ, Williams RJP (2001) The Biological Chemistry of the Elements: The 1782
Inorganic Chemistry of Life. Clarendon Press, Oxford 1783
1784
Fujii T, Moynier F, Telouk P, Albarède F (2006) Mass-independent isotope fractionation of 1785
molybdenum and ruthenium and the origin of isotopic anomalies in Murchison. Astrophys J 1786
647:1506 1787
1788
Garvin J, Buick R, Anbar AD, Arnold GL, Kaufman AJ (2009) Isotopic evidence for an aerobic 1789
nitrogen cycle in the latest Archean. Science 323:1045-1048 1790
1791
Gill BC, Lyons TW, Dahl T, Saltzman M, Gordon G, Anbar AD (2009) Multiple geochemical 1792
proxies reveal a Late Cambrian ocean anoxic event. Geochim Cosmochim Acta 73:A436 1793
1794
Glass JB, Wolfe-Simon F, Anbar AD (2009) Coevolution of metal availability and nitrogen 1795
assimilation in cyanobacteria and algae. Geobiol 7:100-123 1796
1797
Glass J, Wolfe-Simon F, Elser J, Anbar A (2010) Molybdenum-nitrogen co-limitation in 1798
freshwater and coastal heterocystous cyanobacteria. Limnol Oceanogr 55:667-676 1799
1800
Glass JB, Axler RP, Chandra S, Goldman CR (2012) Molybdenum limitation of microbial 1801
nitrogen assimilation in aquatic ecosystems and pure cultures. Front Microbiol 3:1-11 1802
1803
52
Glass JB, Chappaz A, Eustis B, Heyvaert AC, Waetjen DP, Hartnett HE, Anbar AD (2013) 1804
Molybdenum geochemistry in a seasonally dysoxic Mo-limited lacustrine ecosystem. Geochim 1805
Cosmochim Acta 114:204-219. 1806
1807
Goldberg T, Archer C, Vance D, Poulton SW (2009) Mo isotope fractionation during adsorption 1808
to Fe (oxyhydr)oxides. Geochim Cosmochim Acta 73:6502-6516 1809
1810
Goldberg T, Archer C, Vance D, Thamdrup B, McAnena A, Poulton SW (2012) Controls on Mo 1811
isotope fractionations in a Mn-rich anoxic marine sediment, Gullmar Fjord, Sweden. Chem Geol 1812
296-297:73-82 1813
1814
Goldberg T, Gordon G, Izon G, Archer C, Pearce CR, McManus J, Anbar AD, Rehkämper M 1815
(2013) Resolution of inter-laboratory discrepancies in Mo isotope data: an intercalibration. J 1816
Anal At Spectrom 28:724-735 1817
1818
Goldberg T, Poulton SW, Wagner T, Kolonic SF, Rehkämper M (2016) Molybdenum drawdown 1819
during Cretaceous Oceanic Anoxic Event 2. Earth Planet Sci Lett 440:81-91 1820
1821
Golden J, McMillan M, Downs RT, Hystad G, Goldstein I, Stein HJ, Zimmerman A, Sverjensky 1822
DA, Armstrong JT, Hazen RM (2013) Rhenium variations in molybdenite (MoS2): evidence for 1823
progressive subsurface oxidation. Earth Planet Sci Lett 366:1-5 1824
1825
Gordon GW, Lyons TW, Arnold GL, Roe J, Sageman BB, Anbar AD (2009) When do black 1826
shales tell molybdenum isotope tales? Geology 37:535-538 1827
1828
Goto KT, Shimoda G, Anbar AD, Gordon GW, Harigane Y, Senda R, Suzuki K (2015) 1829
Molybdenum isotopes in hydrothermal manganese crust from the Ryukyu arc system: 1830
Implications for the source of molybdenum. Mar Geol 369:91-99 1831
1832
Greber ND, Hofmann BA, Voegelin AR, Villa IM, Nägler TF (2011) Mo isotope composition in 1833
Mo-rich high- and low-T hydrothermal systems from the Swiss Alps. Geochim Cosmochim Acta 1834
75:6600-6609 1835
1836
Greber, ND, Siebert C, Nägler TF, Pettke T (2012) δ98/95Mo values and molybdenum 1837
concentration data for NIST SRM 610, 612 and 3134: Towards a common protocol for reporting 1838
Mo data. Geostand Geoanal Res 36:291-300 1839
1840
Greber ND, Pettke T, Nägler TF (2014) Magmatic-hydrothermal molybdenum isotope 1841
fractionation and its relevance to the igneous crustal signature. Lithos 190-191:104-110 1842
1843
Greber ND, Puchtel IS, Nägler TF, Mezger K (2015a) Komatiites constrain molybdenum isotope 1844
composition of the Earth's mantle. Earth Planet Sci Lett 421:129-138 1845
1846
Greber ND, Mäder U, Nägler TF (2015b) Experimental dissolution of molybdenum-sulphides at 1847
low oxygen concentrations: a first-order approximation of late Archean atmospheric conditions. 1848
Earth Space Science 2:173-180 1849
1850

53
Hannah JL, Stein HJ, Wieser ME, de Laeter JR, Varner MD (2007) Molybdenum isotope 1851
variations in molybdenite: Vapor transport and Rayleigh fractionation of Mo. Geology 35:703-1852
706 1853
1854
Helz GR, Bura-Nakić E, Mikac N, Ciglenečki I (2011) New model for molybdenum behavior in 1855
euxinic waters. Chem Geol 284:323-332 1856
1857
Helz GR, Miller CV, Charnock JM, Mosselmans JFW, Pattrick RAD, Garner CD, Vaughan DJ, 1858
(1996) Mechanism of molybdenum removal from the sea and its concentration in black shales: 1859
EXAFS evidence. Geochim Cosmochim Acta 60:3631-3642 1860
1861
Helz GR, Vorlicek TP, Kahn MD (2004) Molybdenum Scavenging by Iron Monosulfide. 1862
Environ Sci Technol 38:4263-4268 1863
1864
Herrmann AD, Kendall B, Algeo TJ, Gordon GW, Wasylenki LE, Anbar AD (2012) Anomalous 1865
molybdenum isotope trends in Upper Pennsylvanian euxinic facies: Significance for use of 1866
δ98Mo as a global marine redox proxy. Chem Geol 324-325:87-98 1867
1868
Hille R (1996) The mononuclear molybdenum enzymes. Chem Rev 96:2757-2816 1869
1870
Hille R (2002) Molybdenum and tungsten in biology. Trends Biochem Sci 27:360-367 1871
1872
Hin RC, Burkhardt C, Schmidt MW, Bourdon B, Kleine T (2013) Experimental evidence for Mo 1873
isotope fractionation between metal and silicate liquids. Earth Planet Sci Lett 379:38-48 1874
1875
Holland HD (1984) The Chemical Evolution of the Atmosphere and Oceans. Princeton 1876
University Press, Princeton 1877
1878
International Molybdenum Association (2016). http://www.imoa.info/ 1879
1880
Kashiwabara T, Takahashi Y, Tanimizu M, Usui A (2011) Molecular-scale mechanisms of 1881
distribution and isotopic fractionation of molybdenum between seawater and ferromanganese 1882
oxides. Geochim Cosmochim Acta 75:5762-5784 1883
1884
Kaufman AJ, Johnston DT, Farquhar J, Masterson AL, Lyons TW, Bates S, Anbar AD, Arnold 1885
GL, Garvin J, Buick R (2007) Late Archean biospheric oxygenation and atmospheric evolution. 1886
Science 317:1900-1903 1887
1888
Kendall B, Creaser RA, Gordon GW, Anbar AD (2009) Re-Os and Mo isotope systematics of 1889
black shales from the Middle Proterozoic Velkerri and Wollogorang Formations, McArthur 1890
Basin, northern Australia. Geochim Cosmochim Acta 73:2534-2558 1891
1892
Kendall B, Reinhard CT, Lyons TW, Kaufman AJ, Poulton SW, Anbar AD (2010) Pervasive 1893
oxygenation along late Archean ocean margins. Nature Geosci 3:647-652 1894
1895
Kendall B, Gordon GW, Poulton SW, Anbar AD (2011) Molybdenum isotope constraints on the 1896
extent of late Paleoproterozoic ocean euxinia. Earth Planet Sci Lett 307:450-460 1897
1898

54
Kendall B, Brennecka GA, Weyer S, Anbar AD (2013) Uranium isotope fractionation suggests 1899
oxidative uranium mobilization at 2.50 Ga. Chem Geol 362:105-114 1900
1901
Kendall B, Komiya T, Lyons TW, Bates SM, Gordon GW, Romaniello SJ, Jiang G, Creaser RA, 1902
Xiao S, McFadden K, Sawaki Y, Tahata M, Shu D, Han J, Li Y, Chu X, Anbar AD (2015a) 1903
Uranium and molybdenum isotope evidence for an episode of widespread ocean oxygenation 1904
during the late Ediacaran Period. Geochim Cosmochim Acta 156:173-193 1905
1906
Kendall B, Creaser RA, Reinhard CT, Lyons TW, Anbar AD (2015b) Transient episodes of mild 1907
environmental oxygenation and oxidative continental weathering during the late Archean. 1908
Science Adv 1:e1500777 1909
1910
Kowalski N, Dellwig O, Beck M, Gräwe U, Neubert N, Nägler TF, Badewien TH, Brumsack HJ, 1911
van Beusekom JEE, Böttcher ME (2013) Pelagic molybdenum concentration anomalies and the 1912
impact of sediment resuspension on the molybdenum budget in two tidal systems of the North 1913
Sea. Geochim Cosmochim Acta 119:198-211 1914
1915
Kurzweil F, Wille M, Schoenberg R, Taubald H, Van Kranendonk MJ (2015a) Continuously 1916
increasing δ98Mo values in Neoarchean black shales and iron formations from the Hamersley 1917
Basin. Geochim Cosmochim Acta 164:523-542 1918
1919
Kurzweil F, Drost K, Pašava J, Wille M, Taubald H, Schoeckle D, Schoenberg R (2015b) 1920
Coupled sulfur, iron and molybdenum isotope data from black shales of the Teplá-Barrandian 1921
unit argue against deep ocean oxygenation during the Ediacaran. Geochim Cosmochim Acta 1922
171:121-142 1923
1924
Lane S, Proemse BC, Tennant A, Wieser ME (2013) Concentration measurements and isotopic 1925
composition of airborne molybdenum collected in an urban environment. Anal Bioanal Chem 1926
405:2957-2963 1927
1928
Lehmann B, Nägler TF, Holland HD, Wille M, Mao J, Pan J, Ma D, Dulski P (2007) Highly 1929
metalliferous carbonaceous shale and Early Cambrian seawater. Geology 35:403-406 1930
1931
Liermann LJ, Guynn RL, Anbar A, Brantley SL (2005) Production of a molybdophore during 1932
metal-targeted dissolution of silicates by soil bacteria. Chem Geol 220:285-302 1933
1934
Liermann LJ, Mathur R, Wasylenki LE, Nuester J, Anbar AD, Brantley SL (2011) Extent and 1935
isotopic composition of Fe and Mo release from two Pennsylvania shales in the presence of 1936
organic ligands and bacteria. Chem Geol 281:167-180 1937
1938
Liu Y (2008) Theoretical study on the mechanism of the removal of Mo from seawater in oxic 1939
environment. Geochim Cosmochim Acta 72:A564 1940
1941
Lillis PG, Selby D (2013) Evaluation of the rhenium-osmium geochronometer in the Phosphoria 1942
petroleum system, Bighorn Basin of Wyoming and Montana, USA. Geochim Cosmochim Acta 1943
118:312-330 1944
1945

55
Lyons TW, Reinhard CT, Planavsky NJ (2014) The rise of oxygen in Earth’s early ocean and 1946
atmosphere. Nature 506:307-315 1947
1948
Mahdaoui F, Reisberg L, Michels R, Hauteville Y, Poirier Y, Girard J-P (2013) Effect of the 1949
progressive precipitation of petroleum asphaltenes on the Re-Os radioisotope system. Chem Geol 1950
358:90-100 1951
1952
Malcolm S (1985) Early diagenesis of molybdenum in estuarine sediments. Mar Chem 16:213-1953
225 1954
1955
Malinovsky D, Rodushkin I, Baxter DC, Ingri J, Öhlander B (2005) Molybdenum isotope ratio 1956
measurements on geological samples by MC-ICPMS. Inter J Mass Spec 245:94-107 1957
1958
Malinovsky D, Hammarlund D, Ilyashuk B, Martinsson O, Gelting J (2007) Variations in the 1959
isotopic composition of molybdenum in freshwater lake systems. Chem Geol 236:181-198 1960
1961
Maréchal CN, Telouk P, Albarede F (1999) Precise analysis of copper and zinc isotopic 1962
compositions by plasma-source mass spectrometry. Chem Geol 156:251-273 1963
1964
Mathur R, Brantley S, Anbar A, Munizaga F, Maksaev V, Newburry R, Vervoort J, Hart G 1965
(2010) Variation of Mo isotopes from molybdenite in high-temperature hydrothermal ore 1966
deposits. Min Deposit 45:43-50 1967
1968
Mayer AJ, Wieser ME (2014) The absolute isotopic composition and atomic weight of 1969
molybdenum in SRM 3134 using an isotopic double spike. J Anal At Spectrom 29:85-94 1970
1971
McManus J, Nägler TF, Siebert C, Wheat CG, Hammond DE (2002) Oceanic molybdenum 1972
isotope fractionation: diagenesis and hydrothermal ridge-flank alteration. Geochem Geophys 1973
Geosyst 3:1078, 10.1029/2002GC000356 1974
1975
McManus J, Berelson WM, Severmann S, Poulson RL, Hammond DE, Klinkhammer GP, Holm 1976
C (2006) Molybdenum and uranium geochemistry in continental margin sediments: Paleoproxy 1977
potential. Geochim Cosmochim Acta 70:4643-4662 1978
1979
Mendel RR, Bittner F (2006). Cell biology of molybdenum. Biochim Biophys Acta 1763:621-1980
635 1981
1982
Migeon V, Bourdon B, Pili E, Fitoussi C (2015) An enhanced method for molybdenum 1983
separation and isotopic determination in uranium-rich materials and geological samples. J Anal 1984
At Spectrom 30:1988-1996 1985
1986
Miller CA, Peucker-Ehrenbrink B, Walker BD, Marcantonio F (2011) Re-assessing the surface 1987
cycling of molybdenum and rhenium. Geochim Cosmochim Acta 75:7146-7179 1988
1989
Miller RW, Eady RR (1988) Molybdenum and vanadium nitrogenases of Azotobacter 1990
chroococcum. Biochem J 256:429-432 1991
1992
56
Morford JL, Emerson S (1999) The geochemistry of redox sensitive trace metals in sediments. 1993
Geochim Cosmochim Acta 63:1735-1750 1994
1995
Morford JL, Emerson SR, Breckel EJ, Kim SH (2005) Diagenesis of oxyanions (V, U, Re, and 1996
Mo) in pore waters and sediments from a continental margin. Geochim Cosmochim Acta 1997
69:5021-5032 1998
1999
Morford JL, Martin WR, Kalnejais LH, François R, Bothner M, Karle I-M (2007) Insights on 2000
geochemical cycling of U, Re and Mo from seasonal sampling in Boston Harbor, Massachusetts, 2001
USA. Geochim Cosmochim Acta 71:895-917 2002
2003
Morris AW (1975) Dissolved molybdenum and vanadium in the northeast Atlantic Ocean. Deep 2004
Sea Res 22:49-54 2005
2006
Murthy VR (1962) Isotopic anomalies of molybdenum in some iron meteorites. J Geophys Res 2007
67:905-907 2008
2009
Murthy VR (1963) Elemental and isotopic abundances of molybdenum in some meteorites. 2010
Geochim Cosmochim Acta 27:1171-1178 2011
2012
Nagai Y, Yokoyama T (2016) Molybdenum isotopic analysis by negative thermal ionization 2013
mass spectrometry (N-TIMS): effects on oxygen isotopic composition. J Anal At Spectrom 2014
31:948-960 2015
2016
Nägler TF, Siebert C, Lüschen H, Böttcher ME (2005) Sedimentary Mo isotope record across the 2017
Holocene fresh - brackish water transition of the Black Sea. Chem Geol 219:283-295 2018
2019
Nägler TF, Neubert N, Böttcher ME, Dellwig O, Schnetger B (2011) Molybdenum isotope 2020
fractionation in pelagic euxinia: evidence from the modern Black and Baltic Seas. Chem Geol 2021
289:1-11 2022
2023
Nägler TF, Anbar AD, Archer C, Goldberg T, Gordon GW, Greber ND, Siebert C, Sohrin Y, 2024
Vance D (2014) Proposal for an international molybdenum isotope measurement standard and 2025
data representation. Geostand Geoanal Res 38:149-151 2026
2027
Nakagawa Y, Takano S, Firdaus ML, Norisuye K, Hirata T, Vance D, Sohrin Y (2012) The 2028
molybdenum isotopic composition of the modern ocean. Geochem J 46:131-141 2029
2030
Nameroff TJ, Balistrieri LS, Murray JW (2002). Suboxic trace metal geochemistry in the Eastern 2031
Tropical North Pacific. Geochim Cosmochim Acta 66:1139-1158 2032
2033
Neubert N, Nägler TF, Böttcher ME (2008) Sulfidity controls molybdenum isotope fractionation 2034
onto euxinic sediments: Evidence from the modern Black Sea. Geology 36:775-778 2035
2036
Neubert N, Heri AR, Voegelin AR, Nägler TF, Schlunegger F, Villa IM (2011) The 2037
molybdenum isotopic composition in river water: constraints from small catchments. Earth 2038
Planet Sci Lett 304:180-190 2039
2040

57
Nissenbaum A, Swaine D (1976). Organic matter-metal interactions in recent sediments: the role 2041
of humic substances. Geochim Cosmochim Acta 40:809-816 2042
2043
Noordmann J, Weyer S, Montoya-Pino C, Dellwig O, Neubert N, Eckert S, Paetzel M, Böttcher 2044
ME (2015) Uranium and molybdenum isotope systematics in modern euxinic basins: case studies 2045
from the central Baltic Sea and the Kyllaren fjord (Norway). Chem Geol 396:182-195 2046
2047
Oyerinde OF, Weeks CL, Anbar AD, Spiro TG (2008) Solution structure of molybdic acid from 2048
Raman spectroscopy and DFT analysis. Inorg Chim Acta 361:1000-1007 2049
2050
Partin CA, Bekker A, Planavsky NJ, Lyons TW (2015) Euxinic conditions recorded in the ca. 2051
1.93 Ga Bravo Lake Formation, Nunavut (Canada): implications for oceanic redox evolution. 2052
Chem Geol 417:148-162 2053
2054
Pearce CR, Cohen AS, Coe AL, Burton KW (2008) Molybdenum isotope evidence for global 2055
ocean anoxia coupled with perturbations to the carbon cycle during the Early Jurassic. Geology 2056
36:231-234 2057
2058
Pearce CR, Cohen AS, Parkinson IJ (2009) Quantitative Separation of Molybdenum and 2059
Rhenium from Geological Materials for Isotopic Determination by MC-ICP-MS. Geostand 2060
Geoanal Res 33:219-229 2061
2062
Pearce CR, Burton KW, Pogge von Strandmann PAE, James RH, Gíslason S (2010a) 2063
Molybdenum isotope behavior accompanying weathering and riverine transport in a basaltic 2064
terrain. Earth Planet Sci Lett 295:104-114 2065
2066
Pearce CR, Coe AL, Cohen AS (2010b) Seawater redox variations during the deposition of the 2067
Kimmeridge Clay Formation, United Kingdom (Upper Jurassic): evidence from molybdenum 2068
isotopes and trace metal ratios. Paleoceanogr PA4213 2069
2070
Pietruszka A, Walker RJ, Candela PA (2006) Determination of mass-dependent molybdenum 2071
isotopic variations by MC-ICP-MS: an evaluation of matrix effects. Chem Geol 225:121-136 2072
2073
Planavsky NJ, Asael D, Hofmann A, Reinhard CT, Lalonde SV, Knudsen A, Wang X, Ossa FO, 2074
Pecoits E, Smith AJB, Beukes NJ, Bekker A, Johnson TM, Konhauser KO, Lyons TW, Rouxel 2075
OJ (2014) Evidence for oxygenic photosynthesis half a billion years before the Great Oxidation 2076
Event. Nature Geosci 7:283-286 2077
2078
Poulson RL, Siebert C, McManus J, Berelson WM (2006) Authigenic molybdenum isotope 2079
signatures in marine sediments. Geology 34:617-620 2080
2081
Poulson Brucker RL, McManus J, Severmann S, Berelson WM (2009) Molybdenum behavior 2082
during early diagenesis: insights from Mo isotopes. Geochem Geophys Geosyst 10:Q06010 2083
2084
Poulton SW, Canfield DE (2005) Development of a sequential extraction procedure for iron: 2085
implications for iron partitioning in continentally derived particulates. Chem Geol 214:209-221 2086
2087

58
Poulton SW, Canfield DE (2011) Ferruginous conditions: a dominant feature of the ocean 2088
through Earth’s history. Elements 7:107-112 2089
2090
Poulton SW, Raiswell R (2002) The low-temperature geochemical cycle of iron: from 2091
continental fluxes to marine sediment deposition. Amer J Sci 302:774-805 2092
2093
Proemse BC, Grasby SE, Wieser ME, Mayer B, Beauchamp B (2013) Molybdenum isotopic 2094
evidence for oxic marine conditions during the latest Permian extinction. Geology 41:967-970 2095
2096
Rahaman W, Goswami V, Singh SK, Rai VK (2014) Molybdenum isotopes in two Indian 2097
estuaries: Mixing characteristics and input to oceans. Geochim Cosmochim Acta 141:407-422 2098
2099
Raiswell R, Canfield DE (1998) Sources of iron for pyrite formation in marine sediments. Amer 2100
J Sci 298:219-245 2101
2102
Raymond J, Siefert JL, Staples CR, Blankenship RE (2003) The Natural History of Nitrogen 2103
Fixation. Mole Biol Evol 21:541-554 2104
2105
Rees DC, Akif Tezcan F, Haynes CA, Walton MY, Andrade S, Einsle O, Howard JB (2005) 2106
Structural basis of biological nitrogen fixation. Phil Trans Series A Math Phys Eng Sci 363:971-2107
984; discussion 1035-1040 2108
2109
Reinhard CT, Raiswell R, Scott C, Anbar AD, Lyons TW (2009) A late Archean sulfidic sea 2110
stimulated by early oxidative weathering of the continents. Science 326:713:716 2111
2112
Reinhard CT, Planavsky NJ, Robbins LJ, Partin CA, Gill BC, Lalonde SV, Bekker A, Konhauser 2113
KO, Lyons TW (2013a) Proterozoic ocean redox and biogeochemical stasis. Proc Natl Acad Sci 2114
USA 110:5357-5362 2115
2116
Reinhard CT, Lalonde SV, Lyons TW (2013b) Oxidative sulfide dissolution on the early Earth. 2117
Chem Geol 362:44-55 2118
2119
Reitz A, Wille M, Nägler TF, de Lange GJ (2007) Atypical Mo isotope signatures in eastern 2120
Mediterranean sediments. Chem Geol 245:1-8 2121
2122
Rempel K, Migdisov A, Williams-Jones A (2006) The solubility and speciation of molybdenum 2123
in water vapour at elevated temperatures and pressures: implications for ore genesis. Geochim 2124
Cosmochim Acta 70:687-696 2125
2126
Rempel KU, Williams-Jones AE, Migdisov AA (2009) The partitioning of molybdenum (VI) 2127
between aqueous liquid and vapour at temperatures up to 370°C. Geochim Cosmochim Acta 2128
73:3381-3392 2129
2130
Romaniello SJ, Herrmann AD, Anbar AD (2016) Syndepositional diagenetic control of 2131
molybdenum isotope variations in carbonate sediments from the Bahamas. Chem Geol 438:84-2132
90 2133
2134
59
Romao MJ, Knäblein J, Huber R, Moura JJG (1997) Structure and function of molybdopterin 2135
containing enzymes. Progress Biophys Molec Biol 68:121-144 2136
2137
Ryb U, Erel Y, Matthews A, Avni Y, Gordon GW, Anbar AD (2009) Large molybdenum isotope 2138
variations trace subsurface fluid migration along the Dead Sea transform. Geology 37:463-466 2139
2140
Sánchez-Baracaldo P, Ridgwell A, Raven JA (2014). A Neoproterozoic Transition in the Marine 2141
Nitrogen Cycle. Current Biol 24:652-657 2142
2143
Sarmiento JL, Gruber N (2006) Ocean Biogeochemical Dynamics. Princeton University Press, 2144
New Jersey, USA 2145
2146
Saxena RS, Jain MC, Mittal ML (1968). Electrometric investigations of an acid-thiomolybdate 2147
system and the formation of polyanions. Aus J Chem 21:91-96 2148
2149
Schoepp-Cothenet B, van Lis R, Philippot P, Magalon A, Russell MJ, Nitschke W (2012). The 2150
ineluctable requirement for the trans-iron elements molybdenum and/or tungsten in the origin of 2151
life. Scientific Reports 2:263 2152
2153
Scheiderich K, Zerkle AL, Helz GR, Farquhar J, Walker RJ (2010a) Molybdenum isotope, 2154
multiple sulfur isotope, and redox-sensitive element behavior in early Pleistocene Mediterranean 2155
sapropels. Chem Geol 279:134-144 2156
2157
Scheiderich K, Helz GR, Walker RJ (2010b) Century-long record of Mo isotopic composition in 2158
sediments of a seasonally anoxic estuary (Chesapeake Bay). Earth Planet Sci Lett 289:189-197 2159
2160
Scholz F, McManus J, Sommer S (2013) The manganese and iron shuttle in a modern euxinic 2161
basin and implications for molybdenum cycling at euxinic ocean margins. Chem Geol 355:56-68 2162
2163
Scott C, Lyons TW (2012) Contrasting molybdenum cycling and isotopic properties in euxinic 2164
versus non-euxinic sediments and sedimentary rocks: Refining the paleoproxies. Chem Geol 2165
324–325:19–27 2166
2167
Scott C, Lyons TW, Bekker A, Shen Y, Poulton SW, Chu X, Anbar AD (2008) Tracing the 2168
stepwise oxygenation of the Proterozoic ocean. Nature 452:456–459 2169
2170
Segato A, Kendall B, Hanley J (2015) Further insights into Mo isotope variations in 2171
molybdenites from different ore deposits. Geol Soc Am Abstr Progr 47:243 2172
2173
Selby D, Creaser RA, Fowler MG (2007) Re-Os elemental and isotopic systematics in crude oils. 2174
Geochim Cosmochim Acta 71:378-386 2175
2176
Shafiei B, Shamanian G, Mathur R, Mirnejad H (2015) Mo isotope fractionation during 2177
hydrothermal evolution of porphyry systems. Min Deposit 50:281-291 2178
2179
Shaw TJ, Gieskes JM, Jahnke RA (1990) Early diagenesis in differing depositional 2180
environments: The response of transition metals in pore water. Geochim Cosmochim Acta 2181
54:1233-1246 2182

60
2183
Shimmield G, Price N (1986). The behaviour of molybdenum and manganese during early 2184
sediment diagenesis offshore Baja California, Mexico. Mar Chem 19:261-280 2185
2186
Siebert C, Nägler TF, Kramers JD (2001) Determination of molybdenum isotope fractionation by 2187
double-spike multicollector inductively coupled plasma mass spectrometry. Geochem Geophys 2188
Geosyst 2:2000GC000124 2189
2190
Siebert C, Nägler TF, von Blanckenburg F, Kramers JD (2003) Molybdenum isotope records as 2191
a potential new proxy for paleoceanography. Earth Planet Sci Lett 211:159-171 2192
2193
Siebert C, Kramers JD, Meisel TH, Morel PH, Nägler TF (2005) PGE, Re-Os, and Mo isotope 2194
systematics in Archean and early Proterozoic sedimentary systems as proxies for redox 2195
conditions of the early Earth. Geochim Cosmochim Acta 69:1787-1801 2196
2197
Siebert C, McManus J, Bice A, Poulson R, Berelson WM (2006) Molybdenum isotope 2198
signatures in continental margin sediments. Earth Planet Sci Lett 241:723-733 2199
2200
Siebert C, Pett-Ridge JC, Opfergelt S, Guicharnaud RA, Halliday AN, Burton KW (2015) 2201
Molybdenum isotope fractionation in soils: Influence of redox conditions, organic matter, and 2202
atmospheric inputs. Geochim Cosmochim Acta 162:1-24 2203
2204
Skierszkan EK, Amini M, Weis D (2015) A practical guide for the design and implementation of 2205
the double-spike technique for precise determination of molybdenum isotope compositions of 2206
environmental samples. Anal Bioanal Chem 407:1925-1935 2207
2208
Smith RM, Martell AE (2004) NIST critically selected stability constants of metal complexes 2209
database. NIST Standard Reference Database 46, Version 8.0. National Institute of Standards 2210
and Technology. 2211
2212
Song S, Hu K, Wen H, Zhang Y, Li K, Fan H (2011) Molybdenum isotopic composition as a 2213
tracer for low-medium temperature hydrothermal ore-forming systems: A case study on the 2214
Dajiangping pyrite deposit, western Guangdong Province, China. Chinese Science Bull 56:2221-2215
2228 2216
2217
Stein HJ, Markey RJ, Morgan JW, Hannah JL, Scherstén A (2001) The remarkable Re-Os 2218
chronometer in molybdenite: how and why it works. Terra Nova 13:479-486 2219
2220
Stiefel EI (1997) Chemical keys to molybdenum enzymes. J Chem Soc Dalton Trans 21:3915–2221
3923 2222
2223
Stüeken EE, Buick R, Anbar AD (2015) Selenium isotopes support free O2 in the latest Archean. 2224
Geology 43:259-262 2225
2226
Sundby B, Martinez P, Gobeil C (2004). Comparative geochemistry of cadmium, rhenium, 2227
uranium, and molybdenum in continental margin sediments. Geochim Cosmochim Acta 2228
68:2485-2493 2229

61
2230
Szilagyi M (1967) Sorption of molybdenum by humus preparations. Geochem Internat 4:1165-2231
1167 2232
2233
Tossell JA (2005) Calculating the partitioning of the isotopes of Mo between oxidic and sulfidic 2234
species in aqueous solution. Geochim Cosmochim Acta 69:2981-2993 2235
2236
Tribovillard N, Algeo TJ, Lyons T, Riboulleau A (2006) Trace metals as paleoredox and 2237
paleoproductivity proxies: an update. Chem Geol 232:12-32 2238
2239
Tribovillard N, Algeo TJ, Baudin F, Riboulleau A (2012) Analysis of marine environmental 2240
conditions based on molybdenum–uranium covariation—Applications to Mesozoic 2241
paleoceanography. Chem Geol 324-325:46-58 2242
2243
Tuit C (2003) The marine biogeochemistry of molybdenum, Massachussets Institute of 2244
Technology and Woods Hole Oceanographic Institution. PhD thesis 2245
2246
Ulrich T, Mavrogenes J (2008) An experimental study of the solubility of molybdenum in H2O 2247
and KCl-H2O solutions from 500°C to 800°C, and 150 to 300 MPa. Geochim Cosmochim Acta 2248
72:2316-2330 2249
2250
Urey HC (1947) The thermodynamic properties of isotopic substances. J Chem Soc 562-581 2251
2252
Ventura GT, Gall L, Siebert C, Prytulak J, Szatmari P, Hürlimann M, Halliday AN (2015) The 2253
stable isotope composition of vanadium, nickel, and molybdenum in crude oils. Appl Geochem 2254
59:104-117 2255
2256
Voegelin AR, Nägler TF, Samankassou E, Villa IM (2009) Molybdenum isotopic composition of 2257
modern and Carboniferous carbonates. Chem Geol 265:488-498 2258
2259
Voegelin AR, Nägler TF, Beukes NJ, Lacassie JP (2010) Molybdenum isotopes in late Archean 2260
carbonate rocks: Implications for early Earth oxygenation. Precambr Res 182:70-82 2261
2262
Voegelin AR, Nägler TF, Pettke T, Neubert N, Steinmann M, Pourret O, Villa IM (2012) The 2263
impact of igneous bedrock weathering on the Mo isotopic composition of stream waters: Natural 2264
samples and laboratory experiments. Geochim Cosmochim Acta 86:150-165 2265
2266
Voegelin AR, Pettke T, Greber ND. von Niederhäusern B, Nägler TF (2014) Magma 2267
differentiation fractionates Mo isotope ratios: evidence from the Kos Plateau Tuff (Aegean Arc). 2268
Lithos 190:440-448 2269
2270
Vorlicek TP, Kahn MD, Kasuya Y, Helz GR (2004) Capture of molybdenum in pyrite-forming 2271
sediments: role of ligand-induced reduction by polysulfides. Geochim Cosmochim Acta 68:547-2272
556 2273
2274
Wang D, Aller RC, Sañudo-Wilhelmy SA (2011) Redox speciation and early diagenetic behavior 2275
of dissolved molybdenum in sulfidic muds. Marine Chem 125:101–107 2276
2277

62
Wang Y, Zhou L, Gao S, Li JW, Hu ZF, Yang L, Hu ZC (2016) Variation of molybdenum 2278
isotopes in molybdenite from porphyry and vein Mo deposits in the Gangdese metallogenic belt, 2279
Tibetan plateau and its implications. Min Deposit 51:201-220 2280
2281
Wang Z, Ma J, Li J, Wei G, Chen X, Deng W, Xie L, Lu W, Zou L (2015) Chemical weathering 2282
controls on variations in the molybdenum isotopic composition of river water: Evidence from 2283
large rivers in China. Chem Geol 410:201-212 2284
2285
Wasylenki LE, Anbar AD, Liermann LJ, Mathur R, Gordon GW, Brantley SL (2007) Isotope 2286
fractionation during microbial metal uptake measured by MC-ICP-MS. J Anal At Spectrom 2287
22:905-910 2288
2289
Wasylenki LE, Rolfe BA, Weeks CL, Spiro TG, Anbar AD (2008) Experimental investigation of 2290
the effects of temperature and ionic strength on Mo isotope fractionation during adsorption to 2291
manganese oxides. Geochim Cosmochim Acta 72:5997-6005 2292
2293
Wasylenki LE, Weeks CL, Bargar JR, Spiro TG, Hein JR, Anbar AD (2011) The molecular 2294
mechanism of Mo isotope fractionation during adsorption to birnessite. Geochim Cosmochim 2295
Acta 75:5019-5031 2296
2297
Wen H, Carignan J, Zhang Y, Fan H, Cloquet C, Liu S (2011) Molybdenum isotopic records 2298
across the Precambrian-Cambrian boundary. Geology 39:775-778 2299
2300
Wen H, Fan H, Zhang Y, Cloquet C, Carignan J (2015) Reconstruction of early Cambrian ocean 2301
chemistry from Mo isotopes. Geochim Cosmochim Acta 164:1-16 2302
2303
Westermann S, Vance D, Cameron V, Archer C, Robinson SA (2014) Heterogeneous 2304
oxygenation states in the Atlantic and Tethys oceans during Oceanic Anoxic Event 2. Earth 2305
Planet Sci Lett 404:178-189 2306
2307
Wetherill GW (1964) Isotopic composition and concentration of molybdenum in iron meteorites. 2308
J Geophys Res 69:4403-4408 2309
2310
Wheat CG, Mottl MJ, Rudnicki M (2002) Trace element and REE composition of a low-2311
temperature ridge-flank hydrothermal spring. Geochim Cosmochim Acta 66:3693-3705 2312
2313
White WM (2015) Isotope Geochemistry. Wiley-Blackwell. 2314
2315
Wichard T, Mishra B, Myneni SCB, Bellenger J-P, Kraepiel AML (2009). Storage and 2316
bioavailability of molybdenum in soils increased by organic matter complexation. Nature Geosci 2317
2:625-629 2318
2319
Wieser ME, De Laeter JR, Varner MD (2007) Isotope fractionation studies of molybdenum. 2320
Internat J Mass Spec 265:40-48 2321
2322

63
Willbold M, Hibbert K, Lai YJ, Freymuth H, Hin RC, Coath C, Vils F, Elliott T (2016) High-2323
precision mass-dependent molybdenum isotope variations in magmatic rocks determined by 2324
double-spike MC-ICP-MS. Geostand Geoanal Res, Online Version (Early View) 2325
2326
Wille M, Kramers JD, Nägler TF, Beukes NJ, Schröder S, Meisel TH, Lacassie JP, Voegelin AR 2327
(2007) Evidence for a gradual rise of oxygen between 2.6 and 2.5 Ga from Mo isotopes and Re-2328
PGE signatures in shales. Geochim Cosmochim Acta 71:2417-2435 2329
2330
Wille M, Nägler TF, Lehmann B, Schröder S, Kramers JD (2008) Hydrogen sulphide release to 2331
surface waters at the Precambrian/Cambrian boundary. Nature 453:767-769 2332
2333
Wille M, Nebel O, Van Kranendonk MJ, Schoenberg R, Kleinhanns IC, Ellwood MJ (2013) Mo-2334
Cr isotope evidence for a reducing Archean atmosphere in 3.46-2.76 Ga black shales from the 2335
Pilbara, Western Australia. Chem Geol 340:68-76 2336
2337
Xu L, Lehmann B, Mao J, Nägler TF, Neubert N, Böttcher ME, Escher P (2012) Mo isotope and 2338
trace element patterns of Lower Cambrian black shales in South China: Multi-proxy constraints 2339
on the paleoenvironment. Chem Geol 318-319:45-59 2340
2341
Yang J, Siebert C, Barling J, Savage P, Liang Y-H, Halliday AN (2015) Absence of 2342
molybdenum isotope fractionation during magmatic differentiation at Hekla volcano, Iceland. 2343
Geochim Cosmochim Acta 162:126-136 2344
2345
Yin Q, Jacobsen SB, Yamashita K (2002) Diverse supernova sources of pre-solar material 2346
inferred from molybdenum isotopes in meteorites. Nature 415:881-883 2347
2348
Zerkle AL, Scheiderich K, Maresca JA, Liermann LJ, Brantley SL (2011) Molybdenum isotope 2349
fractionation by cyanobacterial assimilation during nitrate utilization and N2 fixation. Geobiol 2350
9:94-106 2351
2352
Zerkle AL, House CH, Cox RP, Canfield DE (2006). Metal limitation of cyanobacterial N2 2353
fixation and implications for the Precambrian nitrogen cycle. Geobiol 4:285-297 2354
2355
Zerkle AL, Claire MW, Domagal-Goldman SD, Farquhar J, Poulton SW (2012) A bistable 2356
organic-rich atmosphere on the Neoarchaean Earth. Nature Geosci 5:359-363 2357
2358
Zhang L, Audétat A, Dolejš D (2012) Solubility of molybdenite (MoS2) in aqueous fluids at 600-2359
800°C, 200 MPa: A synthetic fluid inclusion study. Geochim Cosmochim Acta 77:175-185 2360
2361
Zheng Y, Anderson RF, Geen AV, Kuwabara K. (2000) Authigenic molybdenum formation in 2362
marine sediments: A link to pore water sulfide in the Santa Barbara Basin. Geochim Cosmochim 2363
Acta 64:4165-4178 2364
2365
Zhou L, Wignall PB, Su J, Feng Q, Xie S, Zhao L, Huang J (2012) U/Mo ratios and δ98/95Mo as 2366
local and global redox proxies during mass extinction events. Chem Geol 324-325:99-107 2367
2368

64
Zhou L, Algeo TJ, Shen J, Hu Z, Gong H, Xie S, Huang J, Gao S (2015) Changes in marine 2369
productivity and redox conditions during the Late Ordovician Hirnantian glaciation. Palaeogeogr 2370
Palaeoclimatol Palaeoecol 420:223-234 2371
Figure Captions 2372
Figure 1. Abundances of the seven stable isotopes of Mo, based on Mayer and Wieser (2014). 2373
2374
Figure 2. Eh-pH diagram showing dissolved Mo speciation in the system Mo-H2O-H2S, 2375
assuming that Mo = 10-6 M and S = 10-4 M. Molybdate protonation constants from H2MoO4 2376
and HMoO4- are from Smith and Martell (2004). The Mo speciation below the SO4
2- – H2S 2377
transition is not well known. The boundary between MoO42– and MoS4
2– was calculated using 2378
equilibrium constants from Erickson and Helz (2000). Other metastable thiomolybdates are not 2379
indicated. a) Classical diagram that does not include MoO2+, modified from Anbar (2004). b) 2380
Diagram that includes MoO2+, recognizing the possible importance of Mo(V) species (Wang et 2381
al., 2011). 2382
2383
Figure 3. Standard reduction potentials (at pH = 7 relative to the hydrogen electrode) for the 2384
different oxidation states of Mo, Fe and Mn. The slope between any two points is equal to the 2385
redox potential. In contrast to most metals, Mo has multiple oxidation states that span a small 2386
range of potentials. Modified from Frausto da Silva and Williams (2001). 2387
2388
Figure 4. Mo isotope fractionation between Mo-bearing solutions and synthetic Mn oxides (-2389
MnO2), measured over 2–96 hours at pH = 6.5–8.5. Residual Mo in solution (■) was measured 2390
for all experiments. Mo adsorbed to oxide particle surfaces (●) was either measured or inferred 2391
from mass balance. Dissolved Mo was systematically heavier than adsorbed Mo with a 2392
fractionation factor of 1.0027 ± 0.0008. The data are not consistent with an irreversible 2393
Rayleigh-type distillation process, but instead point to closed system equilibrium in which Mo 2394
isotopes exchange continuously between Mn oxide surfaces and solution (i.e., a reversible 2395
process). Modified from Barling and Anbar (2004). 2396
2397
Figure 5. Molybdenum isotope composition of meteorites, the upper mantle (represented by 2398
komatiites), various crustal reservoirs, marine sediments, crude oil, and seawater. See text for 2399
sources of data. 2400
2401
Figure 6. A schematic depiction of the Mo elemental budget in the modern oceans. Rough 2402
estimates of the Mo fluxes in 108 mol/yr are shown (see text for discussion). Sources of data: 2403
rivers: Miller et al. (2011); low-T hydrothermal fluids: Wheat et al. (2002); oxic, sulfidic at depth 2404
(i.e., dissolved sulfide is confined to sediment pore waters), and euxinic (i.e., dissolved sulfide is 2405
in the overlying water column) sediments: Scott et al. (2008) and Reinhard et al. (2013a) (scaled 2406
in proportion to the combined river and low-T hydrothermal fluid fluxes). 2407

65
2408
Figure 7. Molybdenum isotope composition of the sources and sinks of Mo in the modern 2409
oceans. The Mo isotope system is unusual compared with other isotope systems in that seawater 2410
is the isotopically heaviest reservoir, a consequence of the preferential removal of isotopically 2411
light Mo to sediments in all redox environments except strongly euxinic settings. See text for 2412
sources of data. 2413
2414
Figure 8. Mo concentration and isotopic composition in sediments at various water depths in the 2415
modern Black Sea, illustrating the change in geochemical behavior across the O2-H2S 2416
chemocline (note the break in scale). a) Mo concentrations. b) Mo isotope compositions. The 2417
two black and white dots denote samples whose Mo content is significantly influenced by detrital 2418
material. c) Dissolved hydrogen sulfide concentrations. At [H2S]aq concentrations greater than 11 2419
μM (below ~400 m water depth), the δ98Mo of the sediments becomes similar to the open ocean 2420
seawater δ98Mo. Modified from Neubert et al. (2008). 2421
2422
Figure 9. Molybdenum cycling in different redox settings. The relative concentrations of Mo 2423
and Mn increase from left to right in each profile and the dissolved Mo species in the bottom 2424
waters are shown along the top of each profile. a) Non-euxinic sediments with a manganous zone 2425
and no sulfidic zone. b) Non-euxinic sediments with both manganous and sulfidic zones. c) Non-2426
euxinic sediments with a sulfidic zone and no manganous zone. d) Euxinic sediments where 2427
thiomolybdates are present in bottom waters. Examples of each category are from Baja 2428
California (Shimmield and Price, 1986), Loch Etive, Scotland (Malcolm, 1985), Santa Barbara, 2429
California basin (Poulson-Brucker et al., 2009), Black Sea (Neubert et al., 2008), and the Cariaco 2430
Basin (Dean et al., 1999). The Mo concentration of average crustal rocks is shown. In non-2431
euxinic environments, Mo concentrations in sediments are typically < 25 ppm (the crustal 2432
concentration and 25 ppm are shown as grey dashed lines). The heavy dashed line illustrates the 2433
higher Mo concentrations in Cariaco Basin euxinic sediments compared with the more restricted 2434
Black Sea. Modified from Scott and Lyons (2012). 2435
2436
Figure 10. Relationship between the relative sizes of the oxic, sulfidic at depth, and euxinic 2437
sinks on the seawater Mo isotope composition, as derived from mass balance modelling. The 2438
black dot represents the modern Mo isotope budget. The shaded region encompassed by the 2439
arrow represents the overall direction that seawater δ98Mo would take in response to increased 2440
deep ocean oxygenation. The hatched area represents mass balance solutions that are unrealistic 2441
because it would require that both the oxic and euxinic sinks expand at the expense of the 2442
“sulfidic at depth” sink. F = flux; Ox = oxic sink; SAD = sulfidic at depth sink; EUX = euxinic 2443
sink. Modified from Chen et al. (2015). 2444
2445

66
Figure 11. Mo isotope compositions of late Archean sedimentary rocks from the Hamersley 2446
Basin (Western Australia), and Griqualand West Basin (South Africa), modified from Kurzweil 2447
et al. (2015). Sedimentary rocks containing higher δ98Mo than the igneous baseline point to 2448
fractionation of Mo isotopes in surficial environments, consistent with mild environmental 2449
oxygenation. M.M. = Marrra Mamba Formation; Lo = Lokammona Formation; Bo = Boomplaas 2450
Formation. Sources of data: Wille et al. (2007), Duan et al. (2010), Voegelin et al. (2010), 2451
Kurzweil et al. (2015). 2452
2453
Figure 12. a) Temporal record of Mo isotope compositions in euxinic organic-rich mudrocks. 2454
For each time interval, the squares represent the highest δ98Mo, whereas circles represent other 2455
data. b) Comparison of the highest δ98Mo and associated average Mo/TOC ratios of the time 2456
intervals. High δ98Mo and Mo/TOC indicates widespread ocean oxygenation whereas low δ98Mo 2457
and Mo/TOC indicates significant ocean anoxia. Exceptions to this trend (upper left circle) are 2458
the modern, highly restricted Black Sea and Jurassic oceanic anoxic events (both causing low 2459
Mo/TOC). The Jurassic oceanic anoxic events were followed by a return to widespread 2460
oxygenation and high seawater δ98Mo. See text for sources of data. Modified from Kendall et al. 2461
(2015a). 2462
2463
Figure 13. Range and mean of the Mo isotope compositions in molybdenite from different types 2464
of ore deposit. The strong overlap in δ98Mo among different ore deposit types indicates that Mo 2465
isotopes cannot be used to fingerprint the type of mineralization. IOGC = iron oxide copper-gold 2466
deposits. Modified from Breillat et al. (2016). 2467
2468
Figure 14. Molybdenum isotope compositions of molybdenite from different stages of 2469
mineralization in the Kerman porphyry copper deposits, Iran. The black bars represent the 2470
average δ98Mo for each mineralization stage. In this deposit, the molybdenite data suggest an 2471
overall evolution of the mineralizing fluid to lower δ98Mo over time. Modified from Shafiei et al. 2472
(2015). 2473
2474
Figure 15. Molybdenum isotope compositions of molybdenite from different stages of 2475
mineralization in the Questa porphyry deposit, New Mexico, U.S.A. Black bars represent the 2476
median Mo isotope composition of each mineralization stage. This deposit provides an example 2477
of possible fluid evolution to higher δ98Mo over time. MHBX = magmatic-hydrothermal breccia; 2478
STW = stockwork veins. Modified from Greber et al. (2014). 2479
2480
2481
2482
2483
2484
2485
2486

67
Figure 1 2487
2488
2489
2490
2491
2492
2493
2494
2495
2496
2497
2498
2499
2500
2501
2502
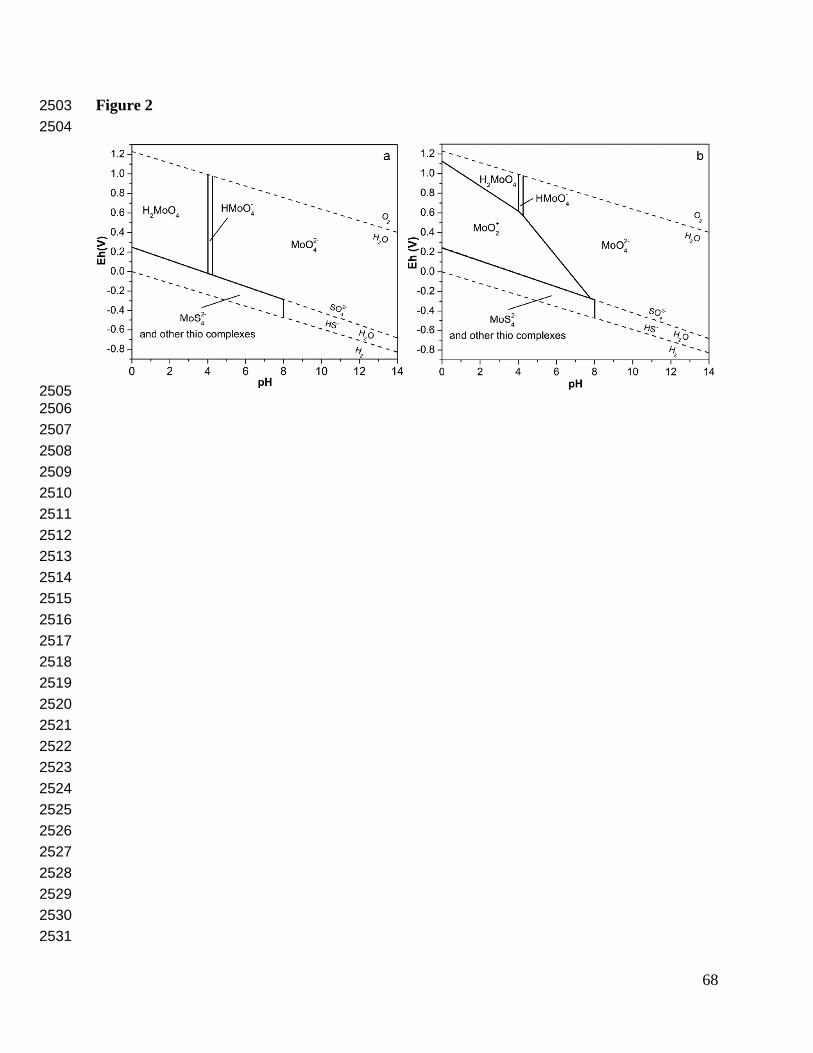
68
Figure 2 2503
2504
2505
2506
2507
2508
2509
2510
2511
2512
2513
2514
2515
2516
2517
2518
2519
2520
2521
2522
2523
2524
2525
2526
2527
2528
2529
2530
2531

69
Figure 3 2532
2533
2534
2535
2536
2537
2538
2539
2540
2541
2542
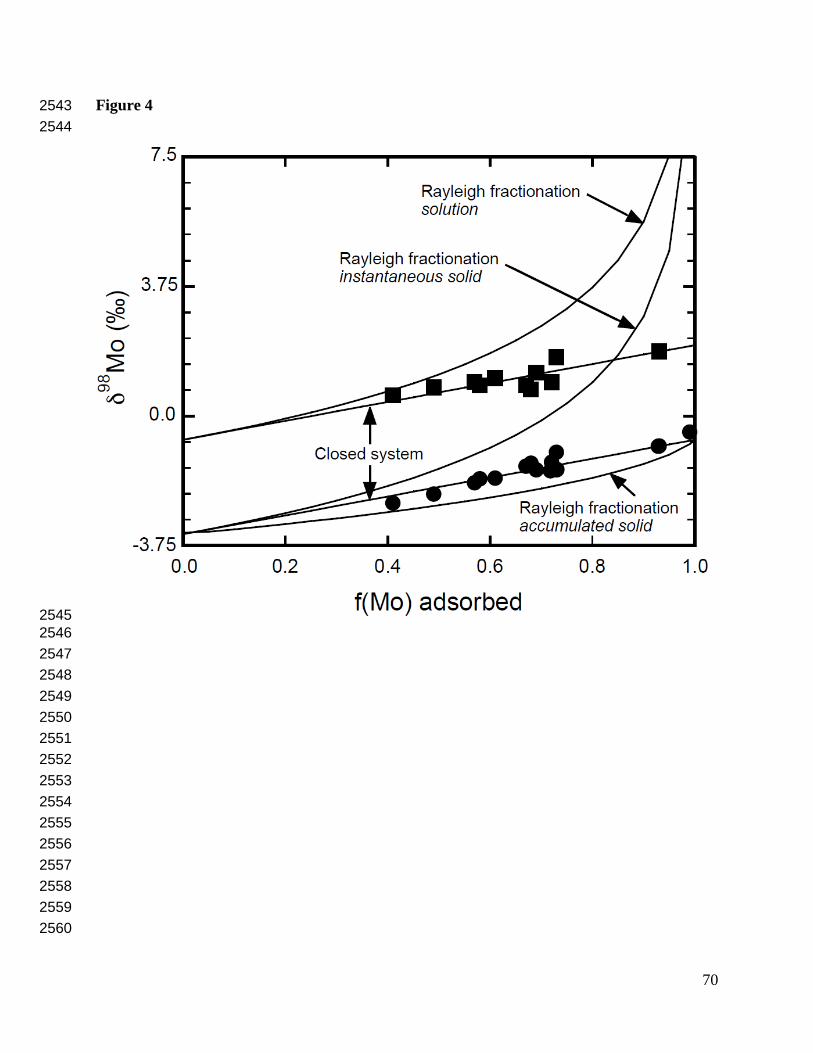
70
Figure 4 2543
2544
2545
2546
2547
2548
2549
2550
2551
2552
2553
2554
2555
2556
2557
2558
2559
2560
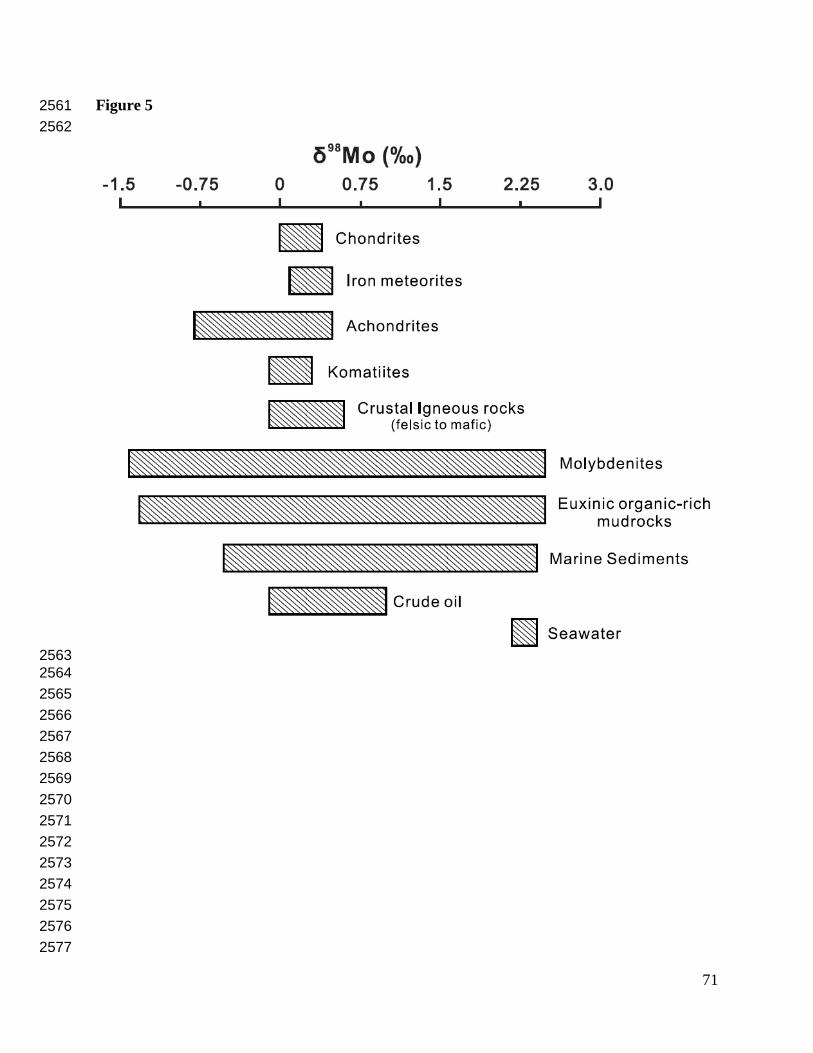
71
Figure 5 2561
2562
2563
2564
2565
2566
2567
2568
2569
2570
2571
2572
2573
2574
2575
2576
2577

72
Figure 6 2578
2579
2580
2581
2582
2583
2584
2585
2586

73
Figure 7 2587
2588
2589
2590
2591
2592
2593
2594
2595
2596
2597
2598
2599
2600
2601
2602
2603
2604
2605
2606

74
Figure 8 2607
2608
2609
2610
2611
2612
2613
2614
2615
2616
2617
2618
2619
2620
2621
2622
2623
2624
2625

75
Figure 9 2626
2627
2628
2629
2630
2631
2632
2633
2634
2635
2636
2637
2638
2639
2640
2641
2642
2643
2644
2645
2646
2647
2648

76
Figure 10 2649
2650
2651
2652
2653
2654
2655
2656
2657
2658
2659
2660
2661

77
Figure 11 2662
2663
2664
2665
2666
2667
2668
2669
2670
2671
2672
2673
2674
2675
2676
2677
2678
2679
2680
2681
2682
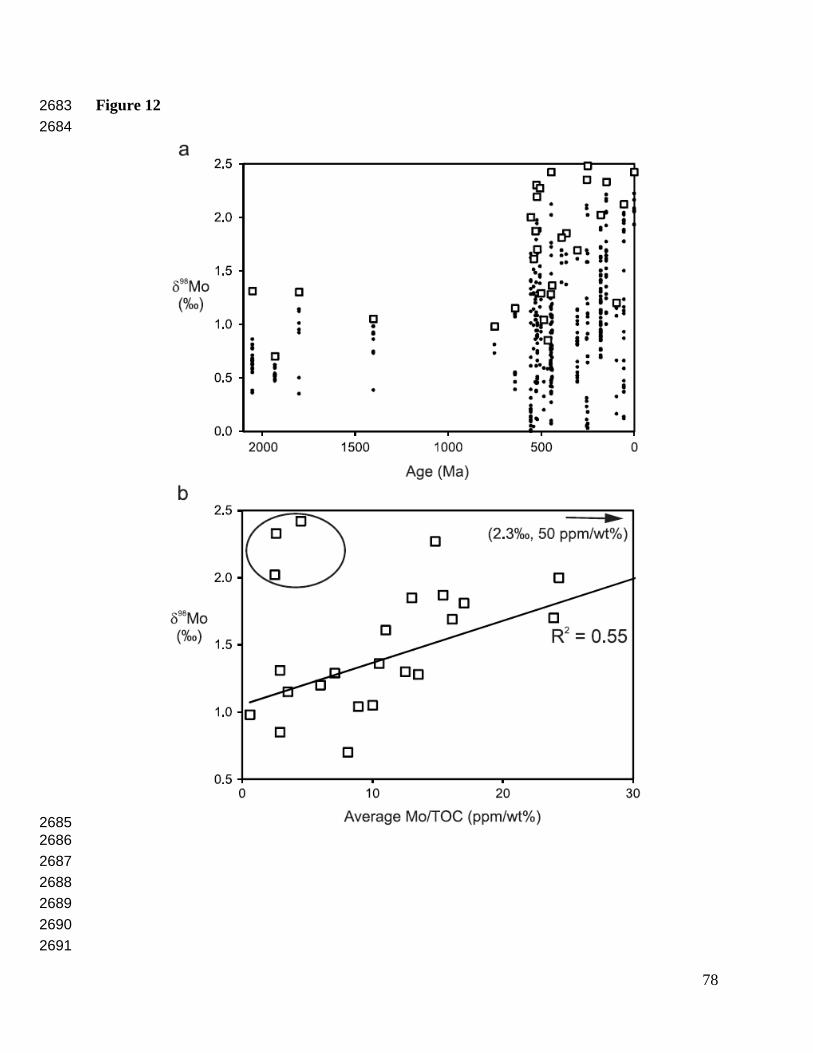
78
Figure 12 2683
2684
2685
2686
2687
2688
2689
2690
2691

79
Figure 13 2692
2693
2694
2695
2696
2697
2698
2699
2700
2701
2702
2703
2704
2705
2706
2707

80
Figure 14 2708
2709
2710
2711
2712
2713
2714
2715
2716
2717
2718
2719

81
Figure 15 2720
2721
2722