gordon t long - mta-2011-10-ri-executive_brief - euro experiment results) 2011.05.10
TRANSCRIPT

8/3/2019 Gordon T Long - MTA-2011-10-Ri-Executive_Brief - Euro Experiment Results) 2011.05.10
http://slidepdf.com/reader/full/gordon-t-long-mta-2011-10-ri-executivebrief-euro-experiment-results-20110510 1/14
1 October 2011 Edition Restricted & Confidential
Copyright 2011 © Gordon T. Long All Rights Reserved [email protected]
Monthly Market Analytics & Technical Analysis
October 2011 Edition - Euro Experiment: The Results Are In.
Gordon T Long
10/5/2011

8/3/2019 Gordon T Long - MTA-2011-10-Ri-Executive_Brief - Euro Experiment Results) 2011.05.10
http://slidepdf.com/reader/full/gordon-t-long-mta-2011-10-ri-executivebrief-euro-experiment-results-20110510 2/14
2 October 2011 Edition Restricted & Confidential
Copyright 2011 © Gordon T. Long All Rights Reserved [email protected]
Monthly Market Analytics & Technical Analysis
OCTOBER 2011 EDITION
MONTHLY MARKET UPDATE: PLAN IV
MARKET ANALYTICS .................................................................................... 3
HIGHLIGHTS - W HAT Y OU N EED TO K NOW ........................................................................................................................................... 3
CURRENT MACRO EXPECTATIONS ................................................................................................................................................. 4
Long Term Linear Regressions and Boundary Conditions ................................................................................. 5 Head & Shoulders................................................................................................................................. 8 Global Macro Driver - Our Proprietary Techno-Fundamental Bridge ................................................................... 12

8/3/2019 Gordon T Long - MTA-2011-10-Ri-Executive_Brief - Euro Experiment Results) 2011.05.10
http://slidepdf.com/reader/full/gordon-t-long-mta-2011-10-ri-executivebrief-euro-experiment-results-20110510 3/14
3 October 2011 Edition Restricted & Confidential
Copyright 2011 © Gordon T. Long All Rights Reserved [email protected]
MARKET ANALYTICS
HIGHLIGHTS - What You Need to Know
The market action since March 2009 is a bear market counter rally that has completed the classic ending 5 Wave3-3-3-3-3 diagonal pattern we have been predicting since March 2009. The Bear Market, which started in 2000, willresume in full force once a broad 'rounded top' formation is completed with cascading weakness across multiplemarkets presently being clearly evident. The rounded top formation is not yet completed.
We are now in the midst of a Global 'rolling top'. We are seeing broad based weakening analytics and cascadingwarning signals. This behavior is typically seen near major reversals. It is all part of a final topping formation anda long term right shoulder technical construction pattern. I expect the rounded top to be shown to have beencentered on the markets June 17th Quadruple Witch. It will take a further 1-2 months to complete.
Rounded Top patterns are extremely difficult to trade as trading reversals are significant and frequent with highvolatility. This adds to the confusion about market direction. The market behavior should be viewed as the market
forces being in the process of systemically changing balance. It is very typical of major reversals.They are protracted affairs.
Highlighted examples of continuing weakening analytics and warning signals are as follows:
CONSUMERS
-Consumer and small business sentiment remains at levels associated with other recent recessions. Thetrend in sentiment since the Financial Crisis lows has been one of slow improvement. The recent finalnumbers from the Michigan survey are consistent with deep recessions.- The University of Michigan Consumer Sentiment Index has plunged from 77.5 in February to 59.4 inSeptember. There was a similar large drop in August 1990, another in September 2001, and a third one inOctober 2008. All three were associated with recessions and turned out to be big sell signals for the stockmarket.

8/3/2019 Gordon T Long - MTA-2011-10-Ri-Executive_Brief - Euro Experiment Results) 2011.05.10
http://slidepdf.com/reader/full/gordon-t-long-mta-2011-10-ri-executivebrief-euro-experiment-results-20110510 4/14
4 October 2011 Edition Restricted & Confidential
Copyright 2011 © Gordon T. Long All Rights Reserved [email protected]
- The Consumer Confidence numbers after totally collapsing in August and falling to 44.5, werebasically flat in September at 45.4. The Present Situation however fell to 32.5 from 34.3. Twice asmany respondents thought that business conditions would worsen as improve.- What continues to stand out to me is that against comparable prints taken at financial crises andtragedies of the past, such as the October 1987 market crash, Desert Storm, LTCM, the dot com collapse,September 11, Katrina, and Lehman, they are substantially WORSE and getting worse fast!
INVESTORS
- The NFIB Small Business Optimism Index stands at 88.1, well below 100 and continues to deteriorate.- The National Association of Active Investment Managers (NAAIM) shows that on average they areextremely bearish at 22.19%, having plummeted from last quarter's average of 66.99%.- The American Association of Independent Investors shows that we now have more Bears than Bulls. Thisis what we would expect as the Secular Market resumes. However we are reaching levels which ofteninitiate counter rallies.- The National Association of Active Investment Managers (NAAIM) shows that on average they areextremely bearish at 4.18%, having plummeted from last quarter's average of 66.99%.- The Smart Money is now beginning to buy while the Emotional money is now selling. Significantly, forthe first time since the fall of 2009 the Smart Money Index broke above its 200 DMA.-With approximately 10% of the S&P 500 above their 200 DMA we have an over-sold market. With only10% of the S&P 500 above their 50 DMA we have a moderately over-sold market which is nearingsupport levels. The market is now looking for a support base to launch a short term relief rally.-Markets can and often fall the greatest during periods considered as being oversold. The sell-off fromoverbought levels was not unexpected. A bounce from the current oversold levels, likewise should not beunexpected. Look for divergence to occur between falling prices and a higher oversold low. This shouldindicate a short to intermediate, tradable low is in.-The McClellan Oscillator has dropped significantly and is now looking for support. Markets can fall furtherlooking for support, however the 21 Day suggests it is near at hand since it seldom reaches this low alevel.- The Surprise Index measures the divergence between actual data and economists' forecasts, and istherefore another form of sentiment or expectations index. Economists are at a near record divergenceagainst the reality of the data, and net bullish market sentiment is also at a near record divergence to howthe data is coming outversus expectations. This ishighly unusual and shouldbe considered a marketwarning.
CURRENT MACRO EXPECTATIONS
OUR CURRENT MACROEXPECTATIONS FOR FINANCIAL
EQUITY MARKETS
The following schematic best represents the US S&P 500 Stock
Index
We still consider ourselves to be
WITHIN the Rounded "M" Top.
We will need to put in the right
side 'external strength' of the
"M" pattern later this fall.
HOWEVER, the bottom of the "V"
is not yet in - Early fall will be
scary!

8/3/2019 Gordon T Long - MTA-2011-10-Ri-Executive_Brief - Euro Experiment Results) 2011.05.10
http://slidepdf.com/reader/full/gordon-t-long-mta-2011-10-ri-executivebrief-euro-experiment-results-20110510 5/14
5 October 2011 Edition Restricted & Confidential
Copyright 2011 © Gordon T. Long All Rights Reserved [email protected]
Long Term Linear Regressions and Boundary Conditions
Long time observers of the markets know that markets tend to always migrate to the mean. The question istherefore what mean are we talking about?
The following chart examines the key regressions presently in place at higher "degrees". It is important toexamine these regressions because many algorithm driven trading systems have some element of this statisticalanalytic within their constructs. 'En Mass' they therefore act a mysterious magnets within the financial markets.
KEY REGRESSIONS
1. Regression starting since the era of 'irrational exuberance' began in 1995,2. Regression starting since the dot.com bubble high correction in 2000,3. Regression starting since the pre-financial crisis high in 2007
The three regressions show a convergence at the present time.
LONG TERM OSCILLATOR
We have overlaid a 160 Weekly Moving Average on the three regressions. Most algorithm driven analysis uses 20,40 and 80 WMA for shorter to intermediate views of the market.
We have circled the intersection of the above with a red circle and the current trading price for the S&P 500.

8/3/2019 Gordon T Long - MTA-2011-10-Ri-Executive_Brief - Euro Experiment Results) 2011.05.10
http://slidepdf.com/reader/full/gordon-t-long-mta-2011-10-ri-executivebrief-euro-experiment-results-20110510 6/14
6 October 2011 Edition Restricted & Confidential
Copyright 2011 © Gordon T. Long All Rights Reserved [email protected]
CONTROLLING BANDS
We have next placed Bomar Bands which were fitted using an 80 WMA and 2 Standard Deviations. We can see thatthey have a strong control over the present extremes of the market.
Bollinger Bands have proven that there is a high probability that once the 80 WMA is broached that the marketswill weaken or strengthen until the other band is reached and a 'cross over' is achieved. We appear to be presentlyengaged in such a market movement and can expect the market to want to minimally 'touch' the lower bandpresently at 1025 on the S&P 500 and rising.
Gann construction lines have been placed on the chart (red ellipse) suggesting a tentative Elliott wave count into2012 and 2013.
Indications are strong that 2012 and 2013 will be poor years for the US equity markets.
8/3/2019 Gordon T Long - MTA-2011-10-Ri-Executive_Brief - Euro Experiment Results) 2011.05.10
http://slidepdf.com/reader/full/gordon-t-long-mta-2011-10-ri-executivebrief-euro-experiment-results-20110510 7/14
7 October 2011 Edition Restricted & Confidential
Copyright 2011 © Gordon T. Long All Rights Reserved [email protected]
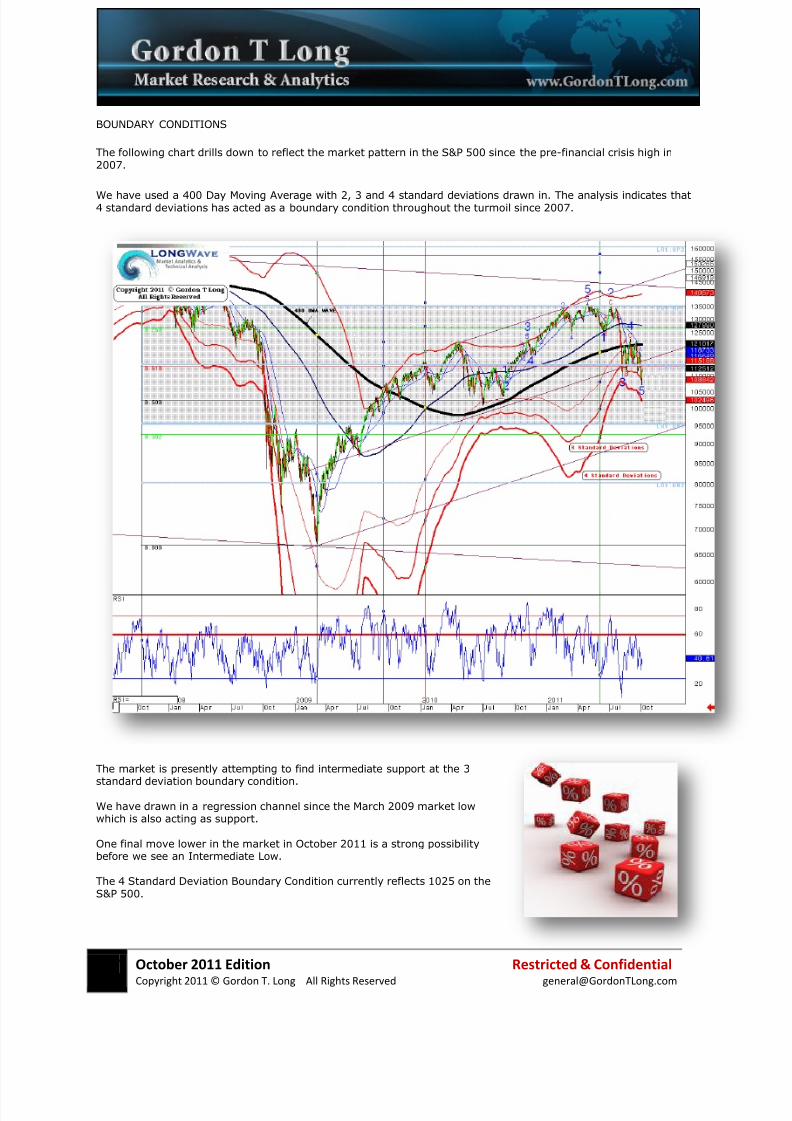
BOUNDARY CONDITIONS
The following chart drills down to reflect the market pattern in the S&P 500 since the pre-financial crisis high in2007.
We have used a 400 Day Moving Average with 2, 3 and 4 standard deviations drawn in. The analysis indicates that4 standard deviations has acted as a boundary condition throughout the turmoil since 2007.
The market is presently attempting to find intermediate support at the 3
standard deviation boundary condition.
We have drawn in a regression channel since the March 2009 market lowwhich is also acting as support.
One final move lower in the market in October 2011 is a strong possibilitybefore we see an Intermediate Low.
The 4 Standard Deviation Boundary Condition currently reflects 1025 on theS&P 500.

8/3/2019 Gordon T Long - MTA-2011-10-Ri-Executive_Brief - Euro Experiment Results) 2011.05.10
http://slidepdf.com/reader/full/gordon-t-long-mta-2011-10-ri-executivebrief-euro-experiment-results-20110510 8/14
8 October 2011 Edition Restricted & Confidential
Copyright 2011 © Gordon T. Long All Rights Reserved [email protected]
Head & Shoulders
We have a very strong indication that we have a classic "Head and Shoulders" pattern in the US equity market
when viewed over the last 15 years. The S&P 500 pattern is very suggestive that we have a major long term high
in the equity markets.

8/3/2019 Gordon T Long - MTA-2011-10-Ri-Executive_Brief - Euro Experiment Results) 2011.05.10
http://slidepdf.com/reader/full/gordon-t-long-mta-2011-10-ri-executivebrief-euro-experiment-results-20110510 9/14
9 October 2011 Edition Restricted & Confidential
Copyright 2011 © Gordon T. Long All Rights Reserved [email protected]
If we examine the right shoulder of the above pattern we see 'fractals' of this pattern with smaller degree "Head
and Shoulders" present.
If these pattern are valid any Intermediate rally will be short lived and 2012 and 2013 will be a continuation of the
secular bear market which we believe we have been in experiencing since December 1999 when measured in 'real'
terms versus nominal terms.
Though the Head and Shoulders pattern gives very reliable
target projections (measured from the head to the neckline)
it is too early to reliably use them.
We look for a confirmation of the validity of the pattern. This
will come with the size and speed of the coming 'counter
rally' which will be part of what we outline in this document
as a 'rounded top'.

8/3/2019 Gordon T Long - MTA-2011-10-Ri-Executive_Brief - Euro Experiment Results) 2011.05.10
http://slidepdf.com/reader/full/gordon-t-long-mta-2011-10-ri-executivebrief-euro-experiment-results-20110510 10/14
10 October 2011 Edition Restricted & Confidential
Copyright 2011 © Gordon T. Long All Rights Reserved [email protected]
Global Macro Driver - Our Proprietary Techno-Fundamental Bridge
Our Global Macro Analysis becomes critical in identifying and preparing for major market pivots.
Our Global Macro Economic Analysis is indicating the following outlook:
The recent events in Europe has precipitated a temporary flight to quality. The US Dollar and USTreasuries have been the recipients of this flight to safety as the US financial markets are seen to be asafe haven relative to other options.
These Global Macro developments have temporarily halted the previously weakening US dollar.
Any PERCEIVED SOULTIONS to the European Sovereign Debt Crisis, even if they are 'kick the can downthe road' policies, will result in the US dollar rapidly weakening.
When the reality of the European "Printing Efforts" finally set in, the Euro will weaken and the US Dollarwill resume its advance.

8/3/2019 Gordon T Long - MTA-2011-10-Ri-Executive_Brief - Euro Experiment Results) 2011.05.10
http://slidepdf.com/reader/full/gordon-t-long-mta-2011-10-ri-executivebrief-euro-experiment-results-20110510 11/14
11 October 2011 Edition Restricted & Confidential
Copyright 2011 © Gordon T. Long All Rights Reserved [email protected]
The Euro has confirmed this with its recent technical "Death Cross" with the 50 DMA moving through the 200 DMA.The 100 DMA is well advanced in following the 50 DMA
US Treasury prices will fall towards the lower descending channel as interest rates move higher (see below).

8/3/2019 Gordon T Long - MTA-2011-10-Ri-Executive_Brief - Euro Experiment Results) 2011.05.10
http://slidepdf.com/reader/full/gordon-t-long-mta-2011-10-ri-executivebrief-euro-experiment-results-20110510 12/14
12 October 2011 Edition Restricted & Confidential
Copyright 2011 © Gordon T. Long All Rights Reserved [email protected]
Eventually the problems in Europe will no longer act as a 'flight to safety trade' for the US Dollar. The US dollarwill weaken against hard currencies and more potentially stable economies and alternative investments.
As the US dollar weakens it will give a boost to the US Equity markets fundamentally because stocks arepriced in 'smaller' American dollars. Additionally, Global Corporations listed on US exchanges receive morethan 50% of their revenues outside of the USwhich will help with US earnings reporting.
With out-of-control US deficit spending pushing upUS Treasury Supply, and QE II stopping andthereby reducing US Treasury Demand (in additionto a flight to quality reversal), we can eventually
(after the flight to safety recedes) expect bondprices to fall and interest rates to climb.
Eventually increasing cost push will drive inflationin basic needs such as food, energy andconsumables. However, as disposable incomecontinues to fall the US Economy will begin anacceleration into a severe Bear Market andeconomic slowdown. The Bear Market which beganin December 1999 will resume with full force.

8/3/2019 Gordon T Long - MTA-2011-10-Ri-Executive_Brief - Euro Experiment Results) 2011.05.10
http://slidepdf.com/reader/full/gordon-t-long-mta-2011-10-ri-executivebrief-euro-experiment-results-20110510 13/14
13 October 2011 Edition Restricted & Confidential
Copyright 2011 © Gordon T. Long All Rights Reserved [email protected]
TARGETS
We expect the five wave set down to find support around 1075 with the possibility of 1030

8/3/2019 Gordon T Long - MTA-2011-10-Ri-Executive_Brief - Euro Experiment Results) 2011.05.10
http://slidepdf.com/reader/full/gordon-t-long-mta-2011-10-ri-executivebrief-euro-experiment-results-20110510 14/14
14 October 2011 Edition Restricted & Confidential
Gordon T LongPublisher & [email protected]
Gordon T Long is not a registered advisor and does not give investment advice. His comments are an expression of opinion only and shouldnot be construed in any manner whatsoever as recommendations to buy or sell a stock, option, future, bond, commodity or any o ther
financial instrument at any time. While he believes his statements to be true, they always depend on the reliability of his own crediblesources. Of course, he recommends that you consult with a qualified investment advisor, one licensed by appropriate regulatory agencies inyour legal jurisdiction, before making any investment decisions, and barring that you are encouraged to confirm the facts on your own beforemaking important investment commitments.
© Copyright 2011 Gordon T Long. The information herein was obtained from sources which Mr. Long believes reliable, but he does notguarantee its accuracy. None of the information, advertisements, website links, or any opinions expressed constitutes a solicitation of thepurchase or sale of any securities or commodities. Please note that Mr. Long may already have invested or may from time to time invest insecurities that are recommended or otherwise covered on this website. Mr. Long does not intend to disclose the extent of any currentholdings or future transactions with respect to any particular security. You should consider this possibility before investing in any securitybased upon statements and information contained in any report, post, comment or suggestions you receive from him.