graphical representation of linear equations in two variables
TRANSCRIPT

DETAILED SOLUTIONS AND CONCEPTSGRAPHICAL REPRESENTATION OF LINEAR EQUATIONS IN TWO VARIABLES
Prepared by Ingrid Stewart, Ph.D., College of Southern NevadaPlease Send Questions and Comments to [email protected]. Thank you!
PLEASE NOTE THAT YOU MUST BE ABLE TO DO THE FOLLOWING PROBLEMS WITHOUT A CALCULATOR!
Linear Equation in Two Variables
An equation in which two letters are used for variables and the exponent of the variables
is 1. Following are a few examples of linear equations in two variables:
2x - y = 4 y = -3x - 6 y = 2x 5x - 3y = 7
y = 2 y = -2 x = 4 x = - 4 These equations look different from the previous four examples. There is only one variable in each one!
Often we want to show a pictorial representation of equations in two variables to give us a better understanding of some of its characteristics. For example, the picture or graph of a linear equation is a straight line. We will show this with the help of the Cartesian Coordinate System.
The Cartesian Coordinate System
The Cartesian Coordinate System must have two intersecting axes. A horizontal one and a vertical one. Their point of intersection is called the Origin.
In mathematics, an equation is usually expressed in terms of x and y. It is standard procedure in mathematics to assign the x-variable to the horizontal axis, which is then called the x-axis, and the y-variable to the vertical axis, which is then called the y-axis.
Each axis must be partitioned into identical units using hash marks. Some or all of the hash marks MUST be numbered to indicate the "scale" of the axes.
Most common is ... -2, -1, 0, 1, 2 ... . However, ... - 4, -2, 0, 2, 4 ... might also be a reasonable choice. Actually, the "scale" often depends on the type of equation that is to be graphed.
NOTE: The units on the x-axis do not have to be equal to the units on the y-axis.
The location of points in the Cartesian Coordinate System is indicated by the ordered pair
(x, y), where x is called the x-coordinate and y is called the y-coordinate of the point.

The x-coordinate is always stated before the y-coordinate and the pair must be enclosed in parentheses.
The Cartesian Coordinate System is divided into four areas, which are called Quadrant I, Quadrant II, Quadrant III, and Quadrant IV.
Problem 1:
Plot the following points into a Cartesian Coordinate System.
(- 4, -2), (-3, 2), (0, -3), (2, 0), and (0, 0). The coordinates (0,0) are reserved for the Origin.
Strategy for Graphing Linear Equations in Two Variables
Find the coordinates of the intercepts, if they exist. Plot each ordered pair by making a dot. This is called Intercept Plotting. If less than two intercepts exist, find the coordinates of one or two points using the Point-by-Point Plotting Method. Plot each ordered pair by making a dot. Connect all dots to form a straight line extending the line a little beyond the last dot on either end.
A. Point-by-Point Plotting
This method allows us to generate ordered pairs using a given equation in two variables as a rule. The ordered pairs are then plotted in a coordinate system and when the resulting points are connected, we get a pictorial representation of the equation in two variables.
Pick a "sufficient" number of "appropriate" values for the variable x, and calculate each
corresponding value of y using the given equation in two variables. We say "sufficient" and "appropriate" because our pick of values often depends on other characteristics of an equation. We will demonstrate how to pick "appropriately" in the examples below!
NOTE: It is standard procedure to pick values for the variable assigned to the horizontal
axis of the Cartesian Coordinate System. This is usually the variable x in mathematics.

Write each x-value and its corresponding y-value as an ordered pair. These are our data points! Finally, plot each data point into your Cartesian Coordinate System.
B. Intercept Plotting
Intercept Plotting is a special case of Point-by-Point Plotting, and often an easy way to find points on the graph of an equation. But most of the time just finding intercepts will not allow you to graph a representative picture of an equation in two variables. That is why the Point-by-Point Plotting and the Intercept Methods should both be used together with other characteristics of the equation.
x-intercept: The x-intercept is the point at which the graph of an equation crosses or
touches the x-axis (horizontal axis). There the y-value is equal to 0.
y-intercept: The y-intercept is the point at which the graph of an equation crosses or
touches the y-axis (vertical axis). There the x-value is equal to 0.
We find the x-coordinate of the x-intercept by setting y equal to 0 in the equation and then compute the corresponding x-value.
We find the y-coordinate of the y-intercept by setting x equal to 0 in the equation and then compute the corresponding y-value. Write each x-value and its corresponding y-value as an ordered pair. These are our data points! Please note that the y-coordinates of the x-intercept are always 0. On the other hand, the x-coordinates of the y-intercept are always 0. Don't get confused! Finally, plot each data point into your Cartesian Coordinate System.
NOTE: Not all linear equations have x- and y-intercepts.
Problem 2:
Graph the linear equation 2x - y = 4.
Coordinates of the x-intercept (when y = 0):
2x - 0 = 4
x = 2
The coordinates of the x-intercept are (2, 0).
Coordinates of the y-intercept (when x = 0):
2(0) - y = 4
y = - 4
The coordinates of the y-intercept are (0, - 4).
Just for illustration purposes, let's find the coordinates of one additional point using the

Point-by-Point Plotting Method:
Let's choose x = 4. Please note that we could have chosen any other value, but looking at the existing points, it seemed that 4 was a reasonable choice.
Next, we will replace the x in 2x - y = 4 with 4.
That is, 2(4) - y = 4
8 - y = 4
and y = 4
The coordinates of the additional point are (4, 4).
Problem 3:
Graph the linear equation y = -3x - 6.
Coordinates of the x-intercept (when y = 0):
0 = -3x - 6
3x = -6
x = -2
The coordinates of the x-intercept are (-2, 0).
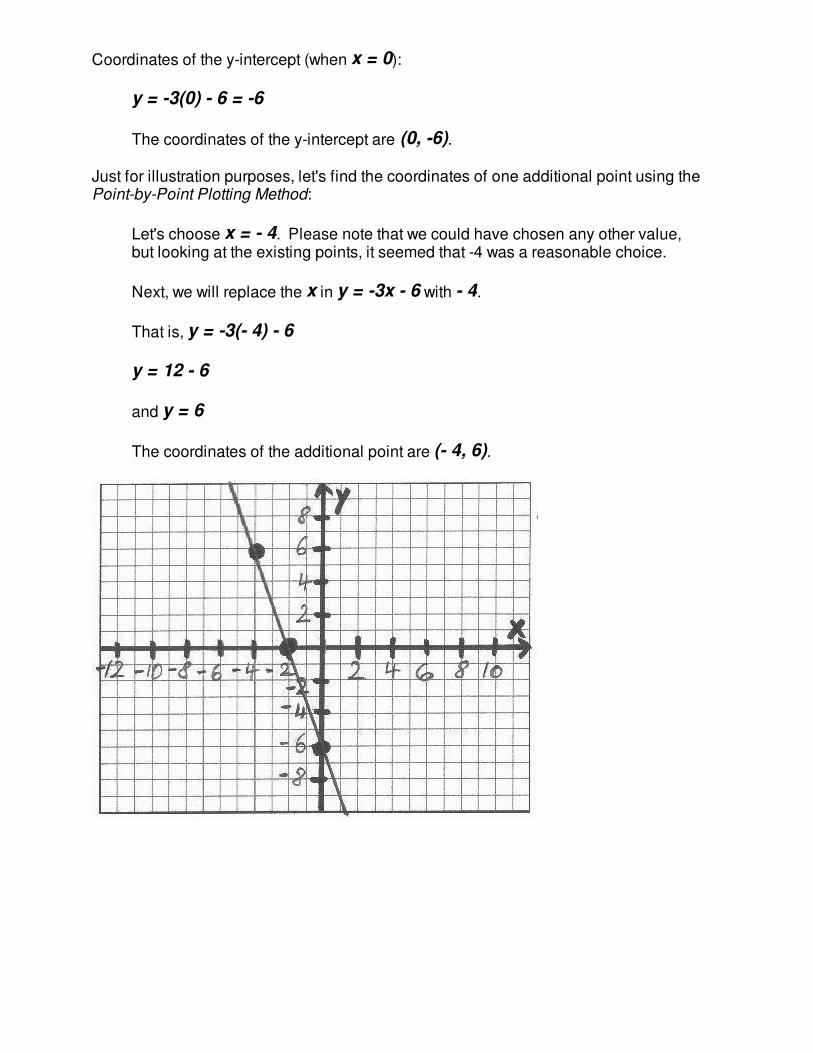
Coordinates of the y-intercept (when x = 0):
y = -3(0) - 6 = -6
The coordinates of the y-intercept are (0, -6).
Just for illustration purposes, let's find the coordinates of one additional point using the Point-by-Point Plotting Method:
Let's choose x = - 4. Please note that we could have chosen any other value, but looking at the existing points, it seemed that -4 was a reasonable choice.
Next, we will replace the x in y = -3x - 6 with - 4.
That is, y = -3(- 4) - 6
y = 12 - 6
and y = 6
The coordinates of the additional point are (- 4, 6).
Problem 4:
Graph the linear equation y = 2x.
Coordinates of the x-intercept (when y = 0):
0 = 2x
x = 0
The coordinates of the x-intercept are (0, 0).
Coordinates of the y-intercept (when x = 0):
y = 2(0)
y = 0
The coordinates of the y-intercept are (0, 0).
We find that the coordinates of the x- and y-intercept are the same. That is, we didn't get two data points ... and without two data points we cannot graph our linear equation. Here we definitely have to use the the Point-by-Point Plotting Method to find the coordinates of some other points.
Let's choose a positive and a negative value for x. Not too close to the point (0,0) so that we can draw an accurate line.
Let's use x = 4,
then y = 2(4)
and y = 8
The coordinates of the additional point are (4, 8).
Next, let's use x = - 4,
then y = 2(- 4)
and y = -8
The coordinates of the second point are (- 4, -8).

Problem 5:
Graph the linear equation 5x - 3y = 7.
Coordinates of the x-intercept (when y = 0):
The coordinates of the x-intercept are .
Coordinates of the y-intercept (when x = 0):
The coordinates of the y-intercept are .
When the coordinates of the intercepts are this "ugly", we often try to find data points that are easier to plot. Let's see if we can find some values for x that allow us to find "nicer" corresponding y-values.
How about x = -1 ?
then 5(-1) - 3y = 7
-5 - 3y = 7
y = - 4 and the coordinates of the point are (-1, - 4). Much nicer, wouldn't you agree?

Next, what about x = 2 ?
then 5(2) - 3y = 7
10 - 3y = 7
y = 1 and the coordinates of the second point are (2, 1).
Please note that we used "trial and error" to find these two values for x which then allowed me to calculate "nicer" y-values. However, this is not necessary! Certainly, we could have tried to plot the coordinates of the intercepts.
Problem 6:
Graph the following linear equations into ONE coordinate system.
y = 2 and y = -2
Please note that there is only one variable in each one! So how can we call them "linear equations in two variables" ?????? Oddly enough, they still fall into this category with the "missing" variable being allowed to take on any value.
YOU MUST MEMORIZE THE FOLLOWING:
Equation of Horizontal Lines
The equation of a horizontal line is y = b, where b is a constant and the y-coordinate of any point on the line.
Horizontal lines do not have an x-intercept, but they do have a y-
intercept at .

We now know that the graphs of y = 2 and y = -2 are horizontal lines with y-intercepts of
and , respectively.
Below are the graphs of these lines.
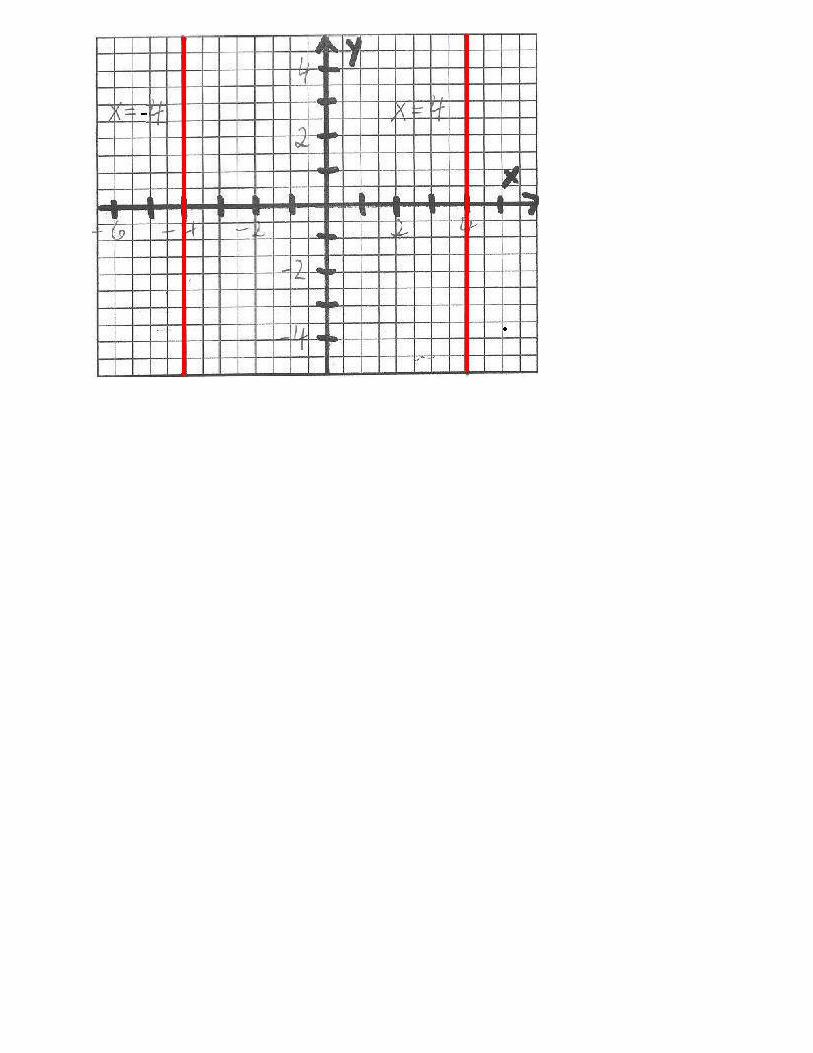
Problem 7:
Graph the following linear equations into ONE coordinate system.
x = 4 and x = - 4
Again, there is only one variable in each one!
YOU MUST MEMORIZE THE FOLLOWING:
Equation of Vertical Lines
The equation of a vertical line is x = a, where a is a constant and the x-coordinate of any point on the line.
Vertical lines do not have a y-intercept, but they do have an x-
intercept at .
We now know that the graphs of x = 4 and x = -4 are vertical lines with x-intercepts of
and , respectively.
Below are the graphs of these lines.