green shipping jul 09dfs
TRANSCRIPT

1
The Green of Shipping:Dawning of New Challenges
Singapore2 July 2009
Ah Kuan Seah & Soh Mei YanTechnology and Business Development
ABS
Joint Branch of RINA & IMarEST

2
Outline
The past and the present
The on-going efforts
The challenges

3
Long Road to Being Green
1954: International Convention for the Prevention of Pollution of the Sea by Oil (OILPOL) established by UK1958: IMCO formed; OILPOL transferred to IMCO1968: Tanker Torrey Canyon ran aground and spilled 120,000 tons of crude oil and polluted UK and French coasts 1973: International Convention for the Prevention of Pollution from Ships (MARPOL) adopted
covering pollution by • oil • chemicals • harmful substances
carried in packaged form • sewage• garbage

4
Long Road to Being Green
1978: Tanker Amoco Cadiz ran aground after steering gear failure and spilled 227,000t of crude oil, polluting the French coast
Protocol of 1978, relating to 1973 MAPOL (MARPOL 73/78) adopted1983: MARPOL 73/78 enter into force
1989: Tanker Exxon Valdez ran aground and spilled 37,000t of crude oil, polluting Alaskan coast
US OPA 90; Amendments to MARPOL 73/78 Annex I to require double hull; single hull tanker phase out1993: New Reg 13F and 13G came into effect
1999: Tanker Erika experienced structural failure and sank; spilled 15,000t of heavy oil, polluting French coast
EU introduced “Erika” Packages; IMO adopted changes to Reg 13G, CAS2002 new Reg 13G came into effect
2002: Tanker Prestige experienced structural damage and sank in heavy weather; spilled 64,000t of oil
EU, IMO introduced further accelerated phase out2005 new phase out scheme came into effect

5
1989: A Pivotal Year9 Nov. 1989
4 June 1989
24 March 1989
Ref: TIME magazine, 29 June 2009

6
Oil Tankers – Pre Exxon Valdez
Delivered >1 Jun 1982
≥ 20k DWTSegregated ballast tanks + protective locations; COW
≥ 40k DWTSegregated
ballast tanks or COW
Delivered >31 Dec 1979
≥ 70k DWTSegregated ballast tanks
Segregated Ballast Tanks; Limitation of Tank Size; COW
≤ 150 GTTank size limit per hypothetical outflowDamage stability

7
Oil Tankers – Post Exxon Valdez
Delivered ≥ 6 Jul 1996
5000 DWT
5k DWT Double hull
< 5k DWT (from 600 DWT)Double hull or Double btm + 700m3 max
Cat 1:Del 5 Apr 82, meet DH 5 Apr 05
Del > 5 Apr 82, meet DH 2005
Cat 1: tankers 20k DWT do not meet 1 Jun 82 requirements
Cat 2: tankers 20k DWT meet 1 Jun 82 requirements
Cat 3: tankers 5k DWT
20,000 DWTCat 2:Del 5 Apr 77, meet DH 5 Apr 05
Del < 1 Jan 78, meet DH 2005
Del 1978 – 79, meet DH 2006
Del 1980 – 81, meet DH 2007
Del 1982, meet DH 2008
Del 1983, meet DH 2009
Del 1984, meet DH 2010
Cat 3:Same as Cat 2
Cat 2 and Cat 3 tankers 15 year after built to meet Condition Assessment Scheme (CAS)
Cat 2 and Cat 3 tankers may operate beyond dates specified if permitted by Admin, subject to CAS, but only up to 2015 or 25 years old whichever earlier

8
The 6 Annexes of MARPOL
Annex I - Oil 2 Oct 83 6 Jul 93 1 Sep 02 5 Apr 05;
1 Jan 07MARPOL 73/78 Revised 13F,
13GRevised 13G Revised 13G,
new 13H; Revised text
Annex II - Chemicals 6 Apr 87 1 Jan 07Revised Annex II
Annex III - Packaged 1 Jul 92
Annex IV - Sewage 27 Sep 03
Annex V - Gabage 31 Dec 88
Annex VI - SOx NOx… 19 May 05 1 Jul 10Amdt
1980 1990 2000 2010
Exxon Valdez
Erika Prestige
Long gestation periods

9
Oily Water Separator
1973 regulations require 100ppm discharge standardGravity separation; exceedance alarm and manual stopping
2002/3 amendments require 15ppm discharge standardExceedance alarm and manual stopping
Automatic stopping for units installed after 1 Jan 05
Improvements in technology:From gravity separation to multi-stage processing
From simple light scattering to multiple light scattering
Still, many reported complaints
Multiple wasteoil streams
Inadequatecapacity – holdingtanks, separator

10
Best Practice is Still a Guideline
Systems for handling oily wastes in machinery spaces incorporating integrated bilge water treatment (IBTS)
Clean drains collected separately from oily drains• Oily drains collected and drained to oil residue tanks• Clean drains collected and drained to clean drain tanks
Pre-treatment of oily bilge water using bilge primary tank
Clean Drains• From engine cooling
water; boiler drain• Clean drain tank • O/B discharge
Oily Bilge Water• From bilge wells• Bilge primary tank• Oily BW holding tank• Oily water separator• Sludge to oil residue• 15ppm O/B discharge
Oil Residues• From purifier sludge;
oil pump coaming; oil mist drain, OWS; etc.
• Oil residue drain tank
• From FO filter drain; FO pump and tank coaming drains, etc.
• FO drain tank• Incinerators, boilers• Shore discharge
MEPC.1 Circ.64212 Nov 2008

11
Example of an Integrated System

12
IMO Marches On
Convention on antifouling systems1960: organotin (tributyltin or TBT) found cost-effective in antifouling1970-80: discovered high concentration of TBT caused collapse of shell-fishery in many locations1988: IMO notified 2001: IMO adopted convention on control of harmful antifouling systems prohibiting TBT and other organotin18 Sept. 2008: enter into force
Spawning new technology in antifoulingTBT-free biocide release coating
• Rosin based • Self-polishing co-polymer (SPC)
Biocide-free coating• Non-stick/foul release prevents fouling attachments
Energy-saving potential

13
IMO Marches On
Convention on ballast water management1988: harmful effect of transfer of aquatic organisms in ballast water first discussed in IMO1992: UNCED Earth Summit requested IMO to take action1997: IMO adopted Res.A868(20) Guidelines2004: IMO adopted the convention for control and management of ships’ ballast water and sedimentsEnter into force: pending
Spawning new technology in BWT Ballast water treatment systems require:
• Mostly multi-stage processes• Land test and shipboard test for type
approval• Treatment system using “active
substance” requires basic approval and final approval from IMO
OceanSaver system incorporating back-flush filter, cavitator, N2 super saturator, electrolytic disinfector

14
IMO Marches On
Convention on ship recycling1998: first discussed2004: adopted guidelines, Res. A962(23)2009: adopted convention for safe and environmentally sound recycling of shipsEnter into force will require ratification by ship recycling states whose total annual recycled ships is at least 3% of their combined fleet in past 10 years
Inventory of Hazardous Materials (IHM)• Part 1 – contained in ship’s structures and
equipment• Part 2 – generated operationally• Part 3 – contained in ship’s store
Source: ABS Regulatory Affairs
SRP = ship recycling plan
DASR = Document of Authorization for ship recycling
15
IMO Marches On
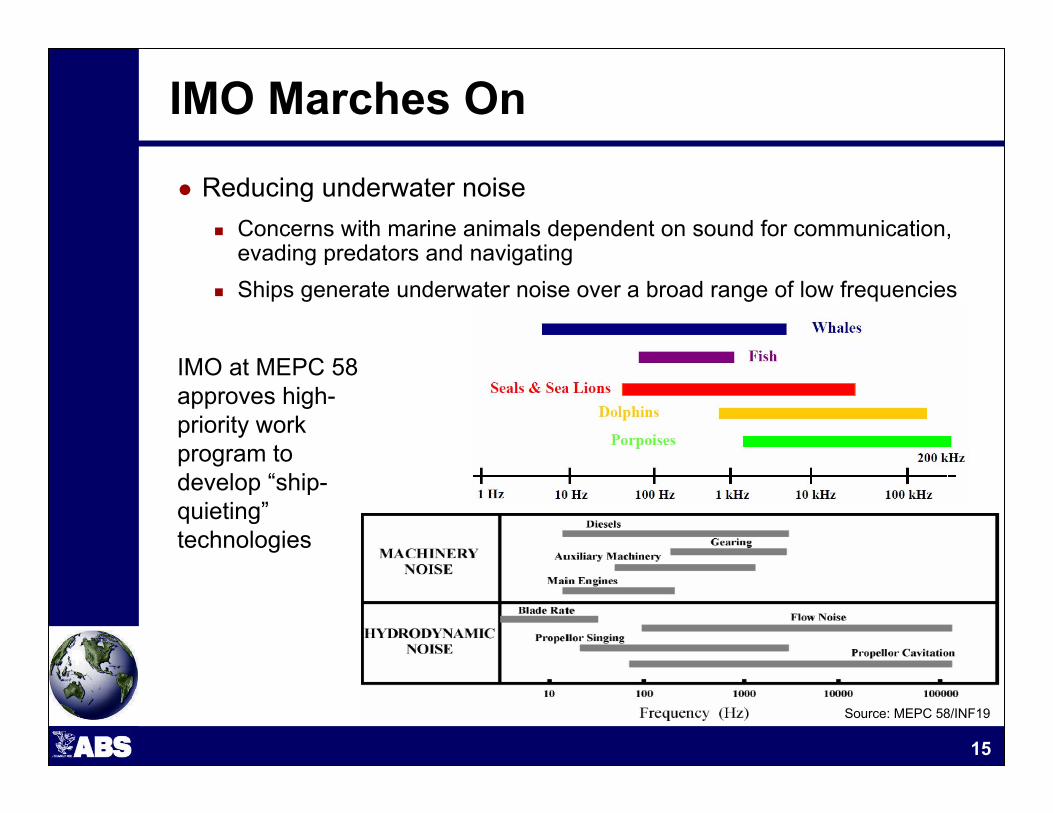
Reducing underwater noiseConcerns with marine animals dependent on sound for communication, evading predators and navigatingShips generate underwater noise over a broad range of low frequencies
Source: MEPC 58/INF19
IMO at MEPC 58 approves high-priority work program to develop “ship-quieting”technologies

16
Perhaps Greatest Challenge Lies with GHG
In 2007, total shipping CO2 emission: 1,019m tonnes, or 3.3% of global CO2 emissions
Germany’s CO2 emission (2006): 843m tonnes
Africa continent’s CO2 emission: ~3.6% of global
Pulp, paper and printing industry CO2 emission: ~1% of global
Shipping emission will grow by factor of 2.4~3.0 by 2050Will surpass Africa in a few years
Source: MEPC 58/INF.6
Source: UNFCCC Secretariat

17
Shipping is Still the Most “CO2-Efficient”

18
Keying into a Global Policy
Stabilizing greenhouse gas in the atmosphere is a global effort
Energy efficiency and renewables will have to account for most of the cut
450 policy will have 50% chance of keeping global temperature rise below 2°C
Source: IEA World Energy Outlook 2008

19
Rx for a Cooler America1. Put a firm price on greenhouse-gas pollution
by passing national cap-and-trade program like the Lieberman-Warner bill, and use that leverage to bring developing countries into an international carbon regimen
2. Offset rising power prices caused by carbon cap by priming the economy for a massive “efficiency surge” that will cut waste and improve energy productivity
3. Pump up research-and-development into renewable energy sources like solar and wind, and support companies bringing new technologies to market
And the Conventional Wisdom
TIME magazine (28 April 2008 issue) sporting a non-traditional green frame, quote:
CAP AND TRADE EFFICIENCY SURGE
RENEWABLE ENERGY SOURCES

20
IMO Strategy on CO2 Emission Reduction
Outcome of MEPC 58 (10 Oct 2008)Debate on “common but differentiated responsibilities” (CBDR)
GHG Working Group conduct studies:“Energy Efficiency Design Index” – for new ships
“Energy Efficiency Operational Index” – for all ships
Ship Efficiency Management Plan
Best Practices
Impact on shipping
Market-based measures (e.g. emission trading scheme, FO tax)To be further debated in depth in MEPC 59
21
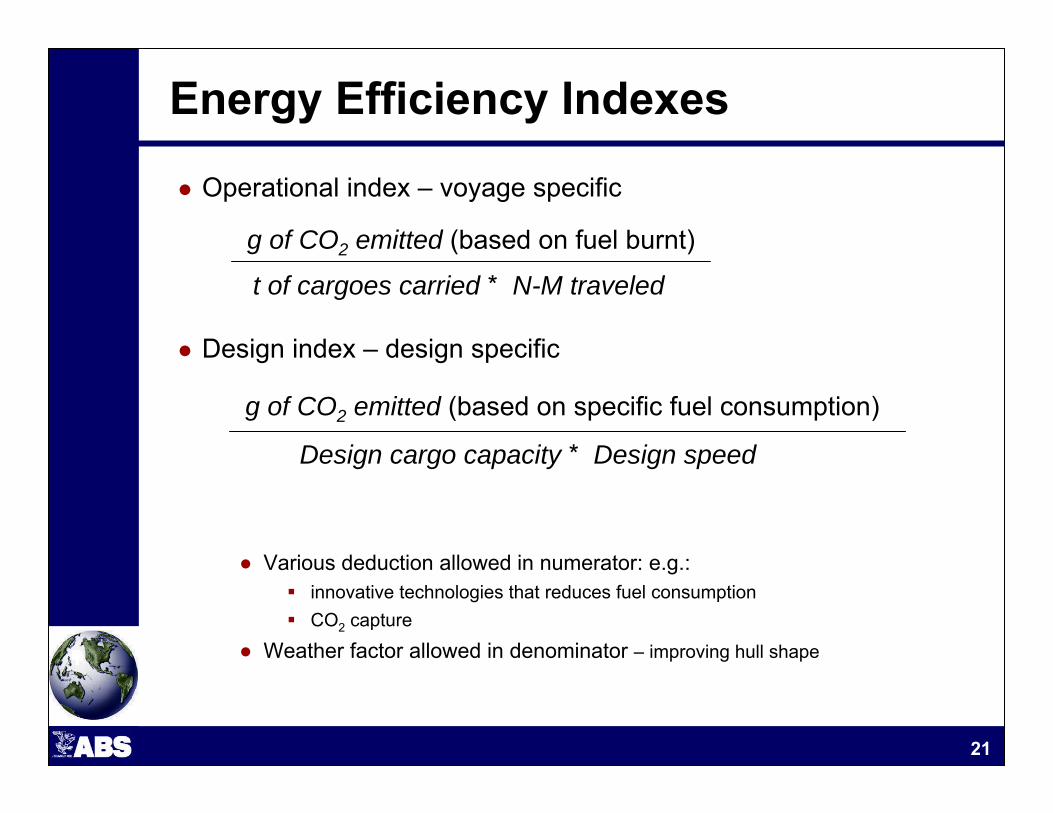
Energy Efficiency Indexes
Operational index – voyage specific
Design index – design specific
g of CO2 emitted (based on fuel burnt)
t of cargoes carried * N-M traveled
g of CO2 emitted (based on specific fuel consumption)
Design cargo capacity * Design speed
● Various deduction allowed in numerator: e.g.: innovative technologies that reduces fuel consumption CO2 capture
● Weather factor allowed in denominator – improving hull shape
22
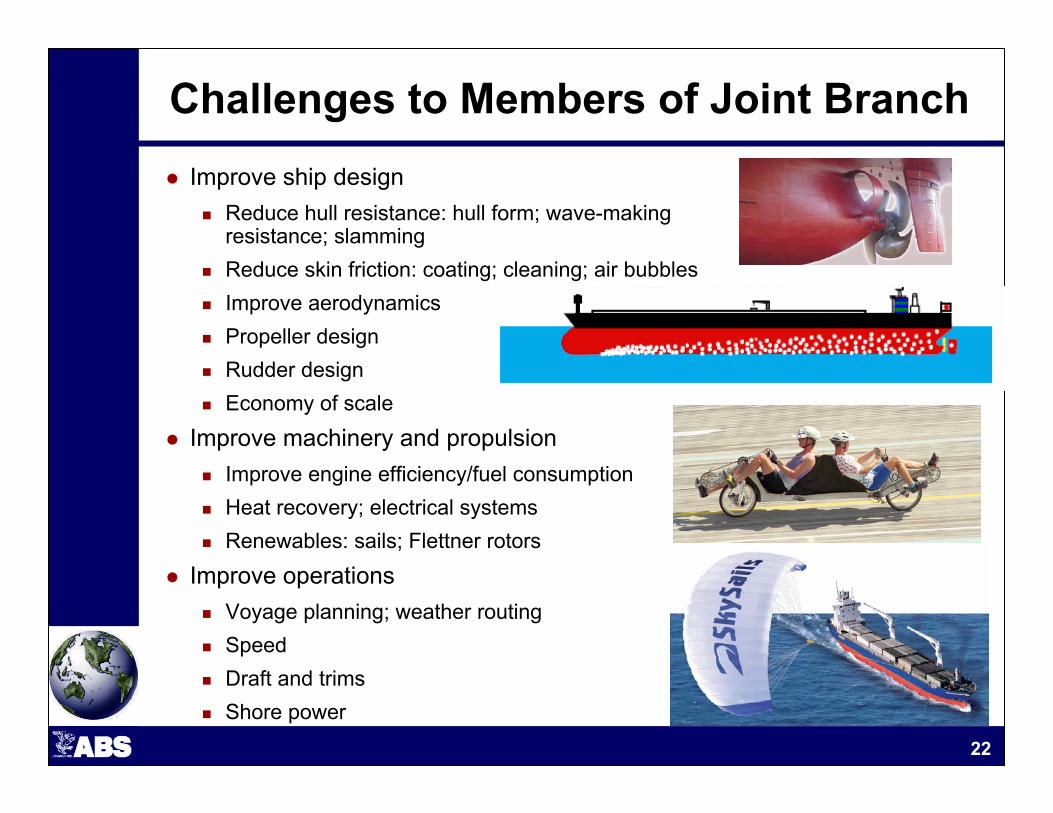
Challenges to Members of Joint BranchImprove ship design
Reduce hull resistance: hull form; wave-making resistance; slammingReduce skin friction: coating; cleaning; air bubblesImprove aerodynamicsPropeller designRudder designEconomy of scale
Improve machinery and propulsionImprove engine efficiency/fuel consumptionHeat recovery; electrical systems Renewables: sails; Flettner rotors
Improve operationsVoyage planning; weather routingSpeed Draft and trimsShore power

23
Improving Ship Design
Reduce hull resistanceLower speed ships (tankers, bulkers) –Fr ~ 0.15
Skin friction resistance dominant
Strategy: reducing skin friction
Higher speed ships (containerships)
Wave making resistance dominant
Strategy: reducing wave-making resistance (bulbous bow, trim operation,reduce speed)
Source: Sasaki, ITTC 2008
Fr
Fr

24
Improving Ship Design
Improve propeller efficiency
Improve wake – target improvement (3-5%)
Fit wake “smoothers”, e.g. wake equalizing duct,reaction fins, spoilers
Recover propeller energy –target improvement (up to 15%)
Contra-rotating propellers (CRP): ~15% improvement in efficiency claimed in 19th ITTC report
Additional thrust fins: – developed and patented by IHI 1984; 4-8% improvement in efficiency claimed in 19th ITTC report
Containership wake Aframax tanker wake

25
Propeller Efficiency Cookie Box
Asymmetrical stern
Gruthues spoilers Stern tunnel
Mitsui integrated ducted propeller
Kawasaki Rudder-bulb fins
IHI Additional Thrusting Fins
Contracted Tip propellers
Grim wheel
Modern contra rotating
propellers Hitachi Zosen nozzle
Mitsui OSK Propeller boss
cap fins
TakekumaReaction fins
Stern flap
Wake-equalizing duct

26
Improving Engine Fuel Efficiency
Fuel efficiency of prime movers 10MWLow speed diesel engines: 49-50%Medium speed diesel engines: 48-49%High speed diesel engines: 42-43%Steam turbines: 27-32%Reheat steam turbines: 34-38%Gas turbines: 30-35%
Historical improvements in 2-stroke diesel
Typical 1960's Modern DieselModern diesel with efficient
WHRShaft HP 36-40% 49-50% 54-55%Exhaust gas loss 35-36% 25-26% 21-22%Heat loss thru cooling water, LO, etc
25-28% 24-25% 22-23%
Rdiation 0.5-1% 0.5-1% 0.5-1%SFOC g/kWh ~211 [1] ~171 [0.8] ~155 [0.74]
27
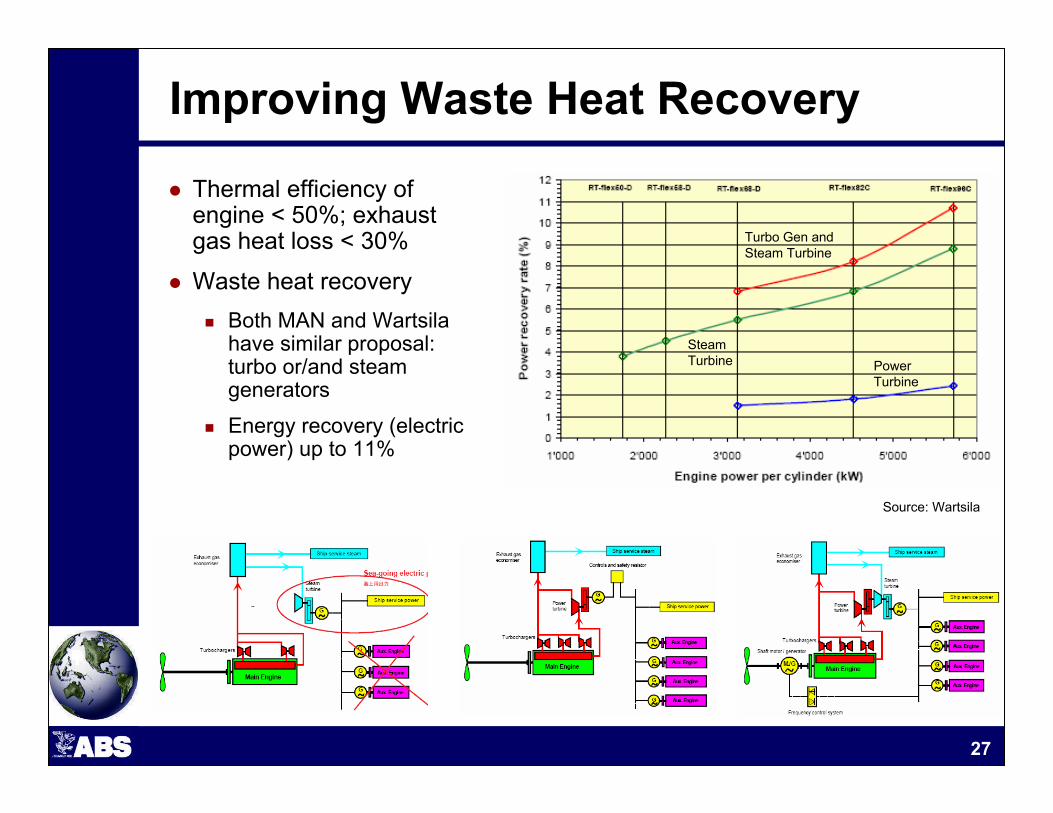
Improving Waste Heat Recovery
Thermal efficiency of engine < 50%; exhaust gas heat loss < 30%
Waste heat recoveryBoth MAN and Wartsilahave similar proposal: turbo or/and steam generators
Energy recovery (electric power) up to 11%
Turbo Gen and Steam Turbine
Steam Turbine Power
Turbine
Source: Wartsila

28
Improving Operations
Scenario: move 10 million TEU 5,000NM within 1 year (250 sailing days)
Source: BIMCO @ WMTC 2009
Slow steaming will result in reduced CO2emission, despite increase in number of ships employed

29
Natural Gas as FuelExtensive studies made comparing gas v. HFO as fuel for LNG carriers
Energy consumption: DFDE comparable to 2-stroke diesel
CO2 emission: DFDE can reduce by ~20%
IMO - t of CO2 / t of fuel, HFO v. NG: 3.114 v. 2.693 (13.5% credit for NG)
DF-Electric155,000 cbm LNG Carrier; Total 40MW Source: Wartsila Dual Fuel LNGCs – Gastech 08
HFOGasGas
Gas
Gas
Gas
Gas

30
The Renewables
NYK’s PCC Auriga Leader – 200m x 32m x 34m; 6200 cars; 18,700 dwt
● 328 solar panels, USD 1.68m, 40 kW, ~0.3% of installed power
Source: www.crunchgear.com
Wind Energy
Skysails - Weather and route dependent
● On trial for 2 feeder-size ships Michel A and Beluga Skysails
● Towing force example: model SKS320 – 16t with 25-kt wind; 133m MPP vessel propeller thrust 23t
● Annual fuel saving: 10~30% claimedSource: www.skysails.info
Solar Energy
Wartsila’s concepts● Wing shaped sails
of composite material installed on deck – possible efficiency gain of ~20%
● Flettner rotors installed on deck – provides thrusts in direction perpendicular to wind Source: www.wartsila.com

31
The RenewablesBiofuels● Potential net CO2 saving but various drawbacks● 2nd generation biofuels based on Fischer Tropsch (FT) biomass to liquid (BTL)
process hold more promise● Marine application concerns:
■ Less calorific value than fossil fuel – engine derating required■ Currently lack worldwide marine biofuel standard – premixed or blending on board ■ Regarded as “noxious liquid” under Annex II; regulatory uncertainty■ Other: shelf life, dedicated system and switching between fuels
Ref: IEA: Transition from 1st to 2nd
Generation Boifuel Technologies 2008

32
Take Note of
The scrubber – removing SOx and NOx and CO2?
Source: Ecospec press conference 16 Jan 2009

33
The Shape of Things to Come?
Source: ISOPE 2005 – Y Minami et al, National Maritime Research Institute, Japan

34
The Shape of Things to Come?
Strategies:● Reduce hull weight
● Reduce friction
● LNG-based fuel cells
● Solar energy
● Wind power
NYK Super Eco Ship 2030
Source: NYK press release

35
The Shape of Things to Come?
No ballast water –pentamaran hull, no stern propeller and no rudder
No emission –only renewables: wind, wave, current, fuel cell and hydrogen
Target: 2025
WalleniusWilhelmsen’s
Environmentally-Sound Ship Orcelle
Photovoltaic panels Sails
Fins to harness wave energy
Source: Wallenius Wilhelmsen Green Flagship

36
The Greening of Shipping
Being “green”: Place high importance on ecological and environmental goals
Increasingly linked to “sustainable development”
IMO conventions so far drives pollution prevention in marine environment
Mitigate GHG emission through:energy efficiency; employing renewable energy and, not least, market-based measures
will bring about truly the Greening of Shipping
Sustainable Development:“…development that meets the needs of the present without compromising the ability of the future generations to meet their own needs” – WCED, 1987
Integration of economic, social, environment – Rio World Summit, 1992
Mainstreaming of environment –IPPC, 2007

37
www.eagle.org