gwi social
TRANSCRIPT
GWI SOCIALGlobalWebIndex’s quarterly report on the latest trends in social networking
Q3 2015
SUMMARY
GWI Social is where GlobalWebIndex presents the very latest figures for social networking behaviors and engagement levels across 34 global markets.
Drawing on data from our most recent wave of research, we offer insights on:
• Daily time devoted to social networking• Multi-networking behaviors• The most popular networks globally• Top actions on Facebook and Twitter• The rise of messaging apps
With our data representing 90% of the global internet audience, we offer the most up-to-date and comprehensive view of behaviors among digital consumers and highlight a number of demographic- and market-specific stories.
In this summary version, we present some of the key headlines and numbers.
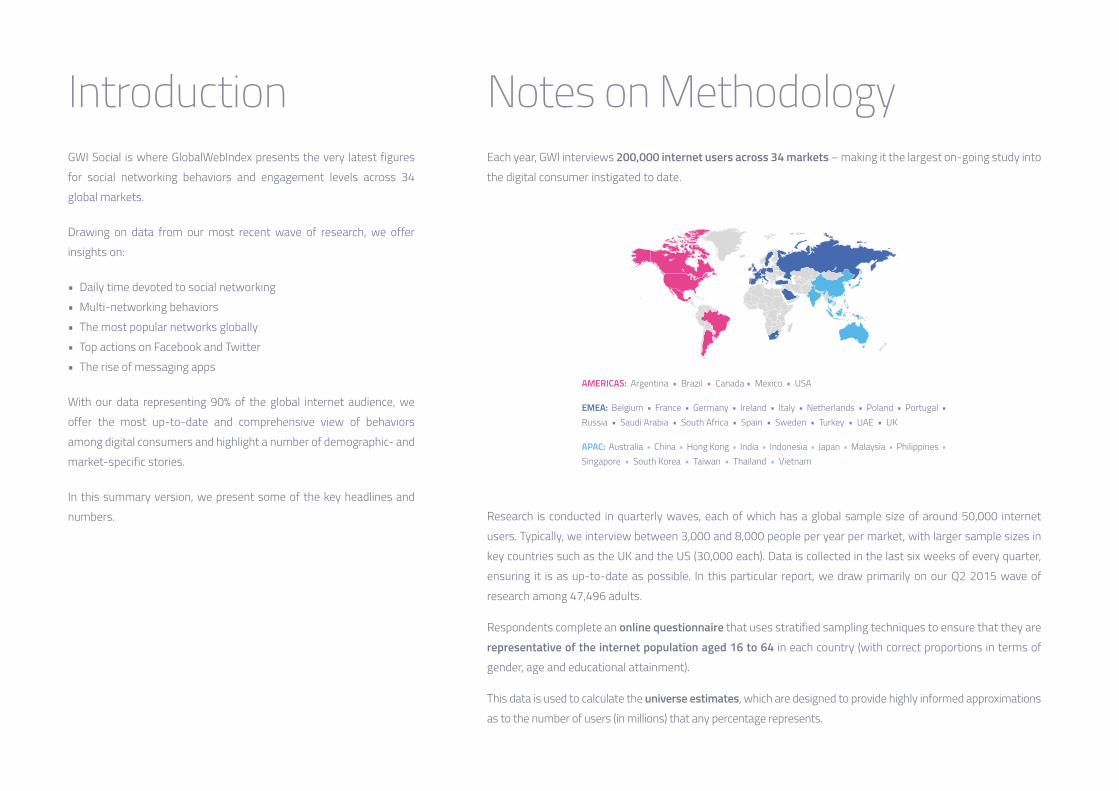
IntroductionEach year, GWI interviews 200,000 internet users across 34 markets – making it the largest on-going study into the digital consumer instigated to date.
Research is conducted in quarterly waves, each of which has a global sample size of around 50,000 internet users. Typically, we interview between 3,000 and 8,000 people per year per market, with larger sample sizes in key countries such as the UK and the US (30,000 each). Data is collected in the last six weeks of every quarter, ensuring it is as up-to-date as possible. In this particular report, we draw primarily on our Q2 2015 wave of research among 47,496 adults.
Respondents complete an online questionnaire that uses stratified sampling techniques to ensure that they are representative of the internet population aged 16 to 64 in each country (with correct proportions in terms of gender, age and educational attainment).
This data is used to calculate the universe estimates, which are designed to provide highly informed approximations as to the number of users (in millions) that any percentage represents.
Notes on Methodology
EMEA: Belgium • France • Germany • Ireland • Italy • Netherlands • Poland • Portugal • Russia • Saudi Arabia • South Africa • Spain • Sweden • Turkey • UAE • UK
AMERICAS: Argentina • Brazil • Canada • Mexico • USA
APAC: Australia • China • Hong Kong • India • Indonesia • Japan • Malaysia • Philippines • Singapore • South Korea • Taiwan • Thailand • Vietnam
GWI’S USAGE DEFINITIONS
We measure three forms of engagement with social platforms, defined as follows:
• Account Ownership/Membership – those who say they have an account on a social network
• Visitation – those who say they have visited the network in question in the last month (via any device)
• Active Usage – those who have an account and say they have used or contributed to the network in the last month (via any device)
These definitions are consistent across all of the platforms we track and thus allow accurate comparisons between networks. In contrast, self-published figures from social networks tend to use a wide and competing range of factors, but would typically utilize ‘Visitation’ as a definition of ‘Active Usage’. To see an example of this and explore GWI’s numbers in more detail, please download the Understanding Facebook’s User Numbers trend from the Insight Store.
CHINA
In addition to using local networks, it’s clear that large numbers of internet users in China are connecting to major global platforms such as Facebook via VPNs, Proxy Servers and other tools – something we address in the charts dedicated to Chinese social networking and which we explore further in our Market Report on China’s internet population.
However, due to the sheer scale of the Chinese market, its high number of local social networks and the official restrictions it places on global platforms such as Facebook and Twitter, China is excluded from most of the global charts featured in this report which track specific/named platforms (see the base of each one for confirmation).
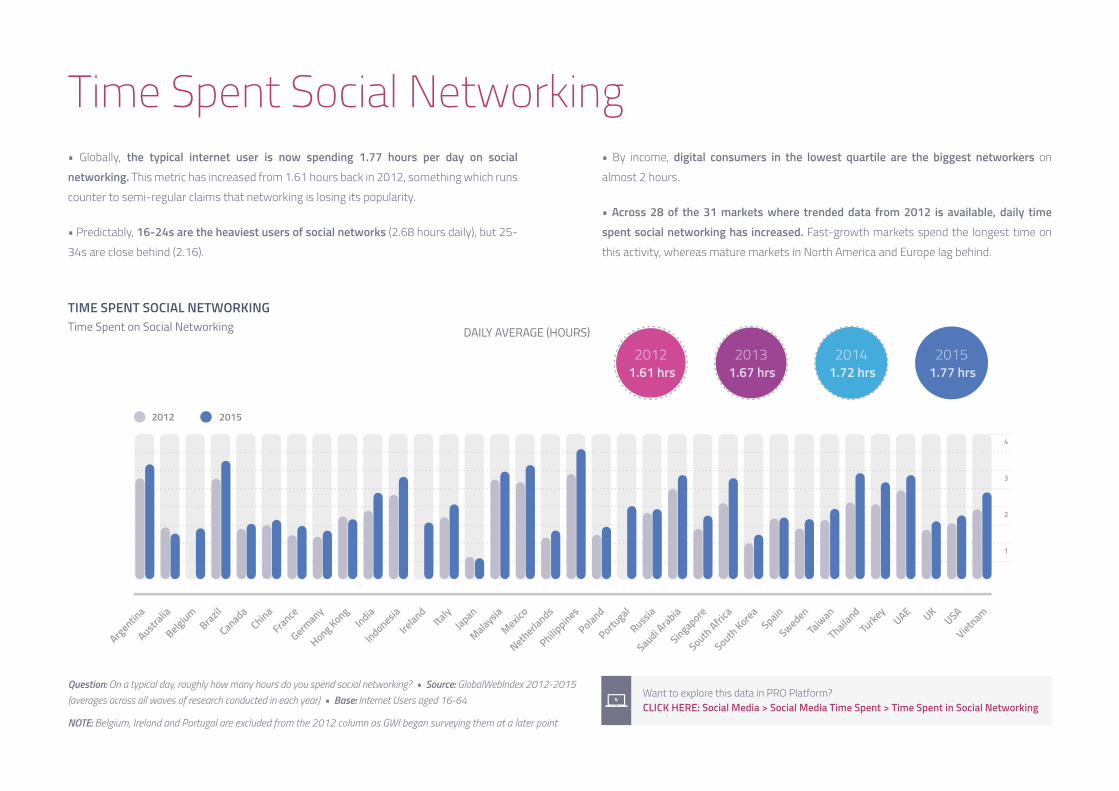
Time Spent Social Networking • Globally, the typical internet user is now spending 1.77 hours per day on social networking. This metric has increased from 1.61 hours back in 2012, something which runs counter to semi-regular claims that networking is losing its popularity.
• Predictably, 16-24s are the heaviest users of social networks (2.68 hours daily), but 25-34s are close behind (2.16).
• By income, digital consumers in the lowest quartile are the biggest networkers on almost 2 hours.
• Across 28 of the 31 markets where trended data from 2012 is available, daily time spent social networking has increased. Fast-growth markets spend the longest time on this activity, whereas mature markets in North America and Europe lag behind.
TIME SPENT SOCIAL NETWORKINGTime Spent on Social Networking
Question: On a typical day, roughly how many hours do you spend social networking? • Source: GlobalWebIndex 2012-2015 (averages across all waves of research conducted in each year) • Base: Internet Users aged 16-64
NOTE: Belgium, Ireland and Portugal are excluded from the 2012 column as GWI began surveying them at a later point
Want to explore this data in PRO Platform? CLICK HERE: Social Media > Social Media Time Spent > Time Spent in Social Networking
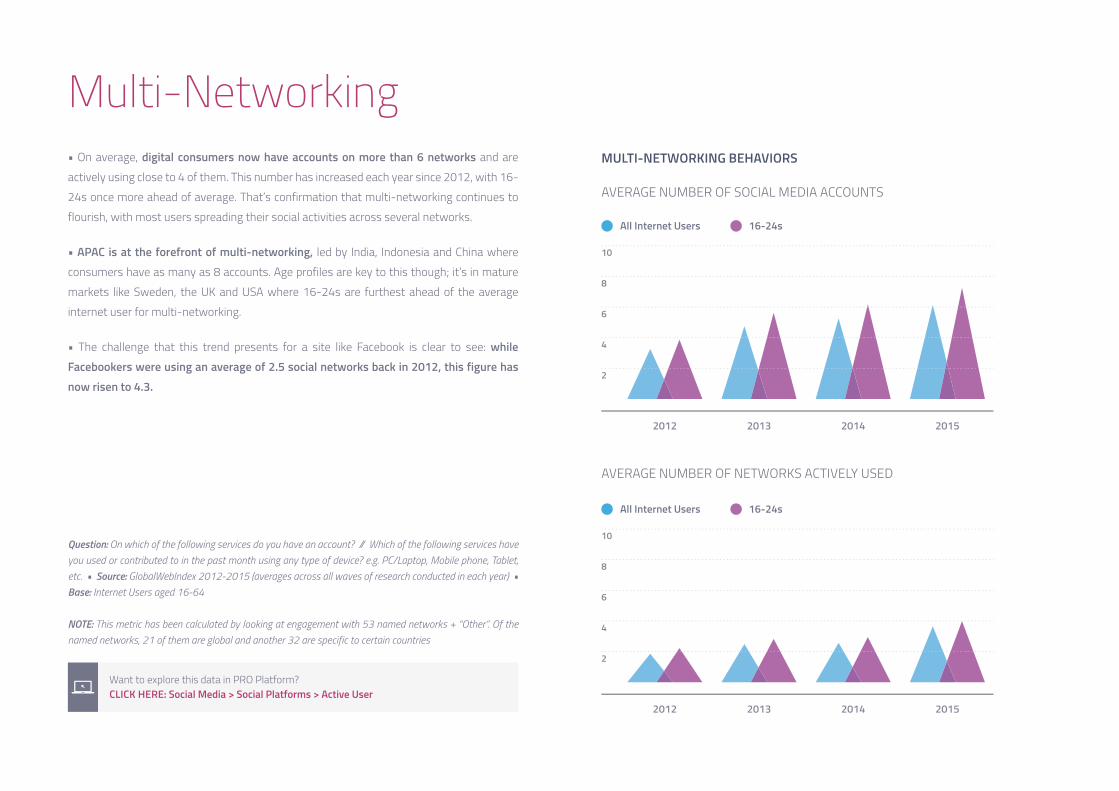
Multi-Networking • On average, digital consumers now have accounts on more than 6 networks and are actively using close to 4 of them. This number has increased each year since 2012, with 16-24s once more ahead of average. That’s confirmation that multi-networking continues to flourish, with most users spreading their social activities across several networks.
• APAC is at the forefront of multi-networking, led by India, Indonesia and China where consumers have as many as 8 accounts. Age profiles are key to this though; it’s in mature markets like Sweden, the UK and USA where 16-24s are furthest ahead of the average internet user for multi-networking.
• The challenge that this trend presents for a site like Facebook is clear to see: while Facebookers were using an average of 2.5 social networks back in 2012, this figure has now risen to 4.3.
Question: On which of the following services do you have an account? // Which of the following services have you used or contributed to in the past month using any type of device? e.g. PC/Laptop, Mobile phone, Tablet, etc. • Source: GlobalWebIndex 2012-2015 (averages across all waves of research conducted in each year) • Base: Internet Users aged 16-64
NOTE: This metric has been calculated by looking at engagement with 53 named networks + “Other”. Of the named networks, 21 of them are global and another 32 are specific to certain countries
Want to explore this data in PRO Platform? CLICK HERE: Social Media > Social Platforms > Active User
MULTI-NETWORKING BEHAVIORS
AVERAGE NUMBER OF SOCIAL MEDIA ACCOUNTS
AVERAGE NUMBER OF NETWORKS ACTIVELY USED
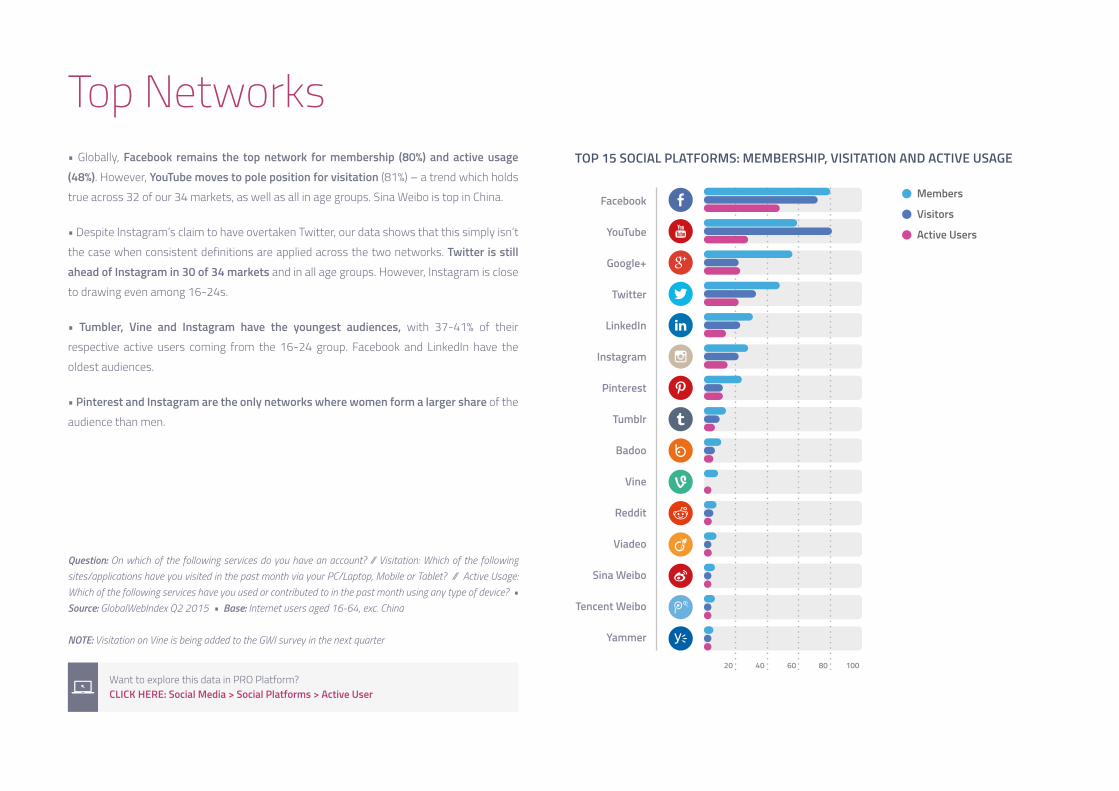
Top Networks• Globally, Facebook remains the top network for membership (80%) and active usage (48%). However, YouTube moves to pole position for visitation (81%) – a trend which holds true across 32 of our 34 markets, as well as all in age groups. Sina Weibo is top in China.
• Despite Instagram’s claim to have overtaken Twitter, our data shows that this simply isn’t the case when consistent definitions are applied across the two networks. Twitter is still ahead of Instagram in 30 of 34 markets and in all age groups. However, Instagram is close to drawing even among 16-24s.
• Tumbler, Vine and Instagram have the youngest audiences, with 37-41% of their respective active users coming from the 16-24 group. Facebook and LinkedIn have the oldest audiences.
• Pinterest and Instagram are the only networks where women form a larger share of the audience than men.
TOP 15 SOCIAL PLATFORMS: MEMBERSHIP, VISITATION AND ACTIVE USAGE
Question: On which of the following services do you have an account? // Visitation: Which of the following sites/applications have you visited in the past month via your PC/Laptop, Mobile or Tablet? // Active Usage: Which of the following services have you used or contributed to in the past month using any type of device? • Source: GlobalWebIndex Q2 2015 • Base: Internet users aged 16-64, exc. China
NOTE: Visitation on Vine is being added to the GWI survey in the next quarter
Want to explore this data in PRO Platform? CLICK HERE: Social Media > Social Platforms > Active User
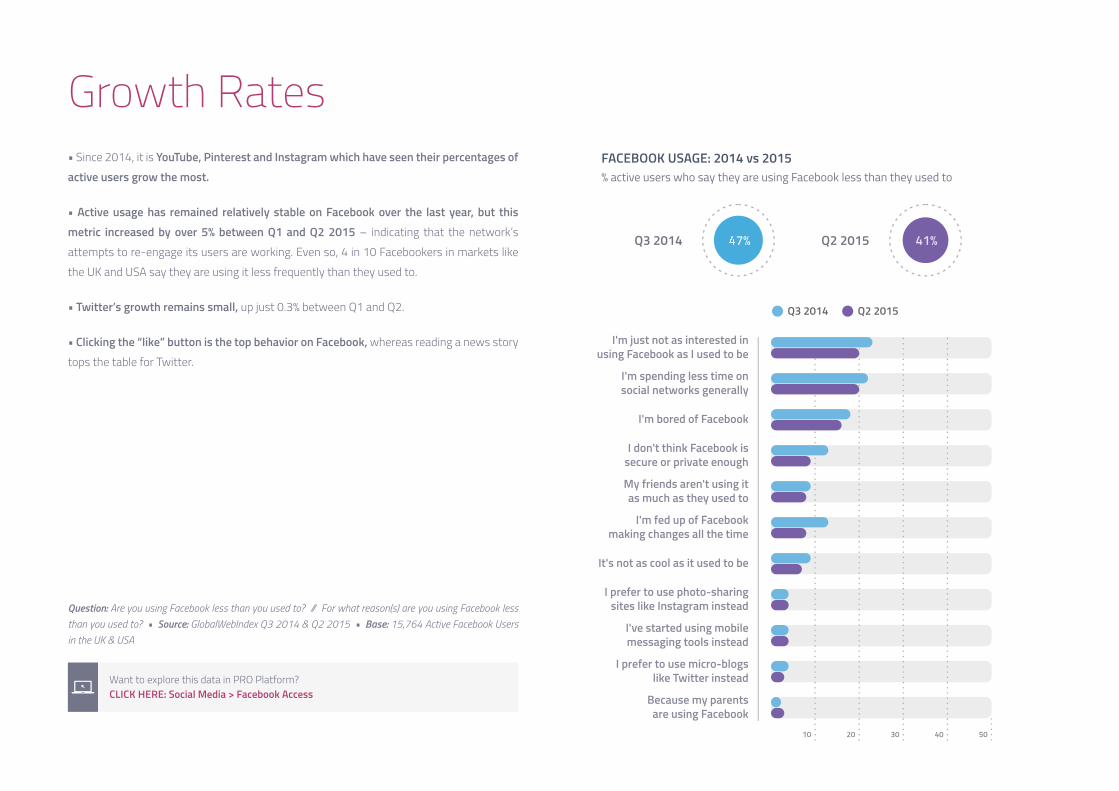
Growth Rates• Since 2014, it is YouTube, Pinterest and Instagram which have seen their percentages of active users grow the most.
• Active usage has remained relatively stable on Facebook over the last year, but this metric increased by over 5% between Q1 and Q2 2015 – indicating that the network’s attempts to re-engage its users are working. Even so, 4 in 10 Facebookers in markets like the UK and USA say they are using it less frequently than they used to.
• Twitter’s growth remains small, up just 0.3% between Q1 and Q2.
• Clicking the “like” button is the top behavior on Facebook, whereas reading a news story tops the table for Twitter.
FACEBOOK USAGE: 2014 vs 2015% active users who say they are using Facebook less than they used to
Question: Are you using Facebook less than you used to? // For what reason(s) are you using Facebook less than you used to? • Source: GlobalWebIndex Q3 2014 & Q2 2015 • Base: 15,764 Active Facebook Users in the UK & USA
Want to explore this data in PRO Platform? CLICK HERE: Social Media > Facebook Access
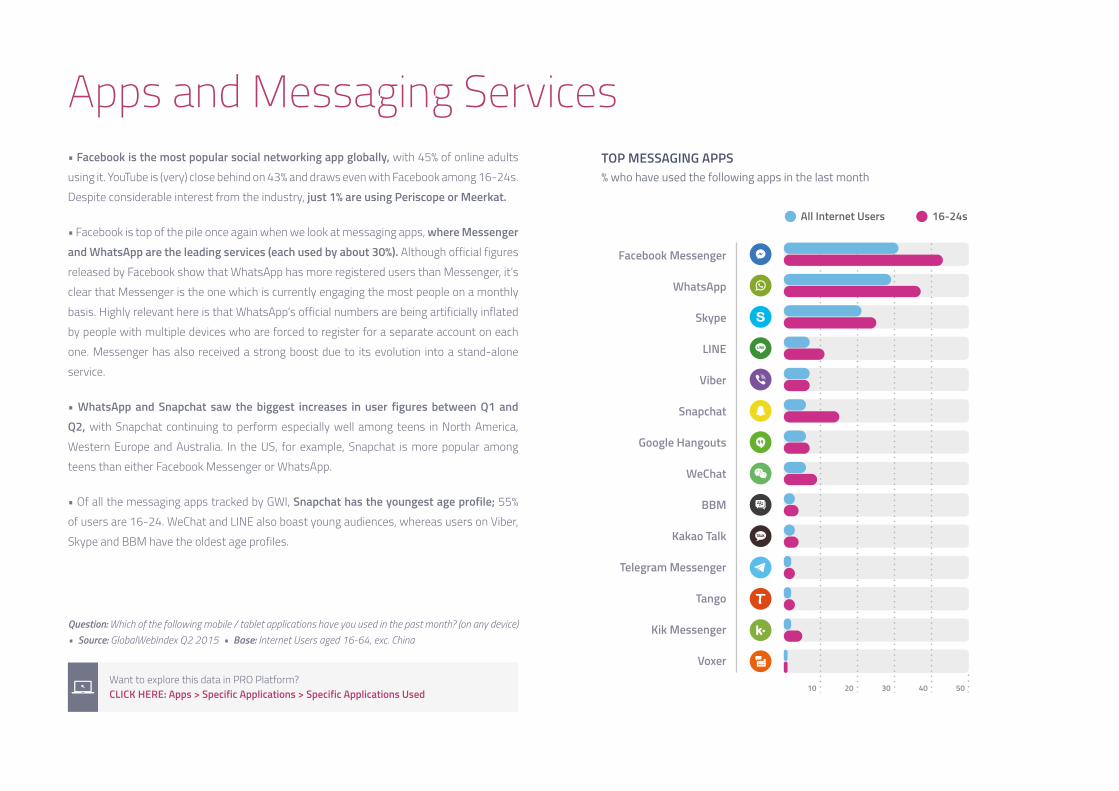
Apps and Messaging Services• Facebook is the most popular social networking app globally, with 45% of online adults using it. YouTube is (very) close behind on 43% and draws even with Facebook among 16-24s. Despite considerable interest from the industry, just 1% are using Periscope or Meerkat.
• Facebook is top of the pile once again when we look at messaging apps, where Messenger and WhatsApp are the leading services (each used by about 30%). Although official figures released by Facebook show that WhatsApp has more registered users than Messenger, it’s clear that Messenger is the one which is currently engaging the most people on a monthly basis. Highly relevant here is that WhatsApp’s official numbers are being artificially inflated by people with multiple devices who are forced to register for a separate account on each one. Messenger has also received a strong boost due to its evolution into a stand-alone service.
• WhatsApp and Snapchat saw the biggest increases in user figures between Q1 and Q2, with Snapchat continuing to perform especially well among teens in North America, Western Europe and Australia. In the US, for example, Snapchat is more popular among teens than either Facebook Messenger or WhatsApp.
• Of all the messaging apps tracked by GWI, Snapchat has the youngest age profile; 55% of users are 16-24. WeChat and LINE also boast young audiences, whereas users on Viber, Skype and BBM have the oldest age profiles.
TOP MESSAGING APPS% who have used the following apps in the last month
Question: Which of the following mobile / tablet applications have you used in the past month? (on any device) • Source: GlobalWebIndex Q2 2015 • Base: Internet Users aged 16-64, exc. China
Want to explore this data in PRO Platform? CLICK HERE: Apps > Specific Applications > Specific Applications Used

Copyright © Trendstream Limited 2015 All rights, including copyright, in the content of GlobalWebIndex (GWI) webpages and publications (including, but not limited to, GWI reports and blog posts) are owned and controlled by Trendstream Limited. In accessing such content, you agree that you may only use the content for your own personal non-commercial use and that you will not use the content for any other purpose whatsoever without an appropriate licence from, or the prior written permission of, Trendstream Limited. • Trendstream Limited uses its reasonable endeavours to ensure the accuracy of all data in GWI webpages and publications at the time of publication. However, in accessing the content of GWI webpages and publications, you agree that you are responsible for your use of such data and Trendstream Limited shall have no liability
to you for any loss, damage, cost or expense whether direct, indirect consequential or otherwise, incurred by, or arising by reason of, your use of the data and whether caused by reason of any error, omission or misrepresentation in the data or otherwise.
www.globalwebindex.net
Jason ManderHead of Trends
T +44 20 7731 1614 /// A GlobalWebIndex, Bedford House, 69-79 Fulham High Street, London, SW6 3JW, England
@thejasonmander