handbook of emergy evaluation issued in a series of folios · folio #1 introduces concepts and...
TRANSCRIPT

Handbook of Emergy Evaluation
A Compendium of Data for Emergy ComputationIssued in a Series of Folios
Folio #4 (2nd printing)Emergy of Florida Agriculture
Sherry L. Brandt-Williams
August 2001Revised September 2002
Center for Environmental PolicyEnvironmental Engineering Sciences
Box 116450University of Florida
Gainesville, 32611-6450

2
Preface, Handbook of Emergy Evaluation
Emergy, spelled with an “m,” is a universal measure of real wealth of the work ofnature and society made on a common basis. Calculations of emergy production andstorage provide a basis for making choices about environment and economy follow-ing the general public policy to maximize real wealth, production and use (maximumempower). To aid evaluations, this handbook provides data on emergy contents andthe computations on which they were based. A series of Folios are to be issued.Folio #1 introduces concepts and evaluates the empower of the geobiosphere.
There may be Folios by many authors, who take the initiative to make new calcula-tions or assemble results from the extensive but dispersed literature. Data on emergycontent are in published papers, books, reports, theses, dissertations, and unpub-lished manuscripts. Tabulating unit emergy values and their basis is the main pur-pose of this handbook. Presentations document the sources of data and calculations.As received, Folios will go to reviewers, back to authors for revision and back forpublication. Each will have an index to indicate the page where emergy is evaluated.Each Folio should be usable without reference to other Folios.
Policy on Literature Review and ConsistencyThis handbook is based on emergy evaluations assembled from various reports andpublished literature plus new tables prepared by Folio authors. Our policy is topresent previous calculations with due credit and without change except those re-quested by original authors. This means that unit emergy values in some tables maybe different from those in other tables. Some tables may be more complete thanothers. No attempt is made to make all the tables consistent. Explanatory footnotesare retained. The diversity of efforts and authors enriches the information availableto users, who can make changes and recalculate as they deem desirable to be morecomplete, update, or otherwise revise for their purposes.
The increase in global emergy base of reference to 15.83 E24 sej/yr (Folios #1 and#2) changes all the unit emergy values which directly and indirectly are derived fromthe value of global annual empower. Two alternatives are suggested when using thevalues from this handbook with previously published unit emergy value: Eitherincrease the older values or decrease the new values by a factor for the change in thebase used. For example, to use unit emergy values based on the 1996 solar empowerbase (9.44 E24 sej/yr), multiply those values by 1.68. Or, multiply the emergy valuesof this handbook by 0.60 to keep values on the older base. This Folio #4 uses 15.83E24 sej/yr.
— Howard T. Odum and Mark T. Brown

3
Introduction to Folio #4
Folio #4 presents emergy evaluations for 23 agricultural commodities raisedin the state of Florida, U.S.A., and for two fertilizers produced and usedextensively within Florida. All emergy values have been updated to reflectnew global process transformities presented in Folio #1. Products with greaterthan 5000 ha in traditional commercial cultivation in Florida are included(Pierce, 1995). Alligator, although not in extensive production, is includedas an example of Florida aquaculture. Part I has evaluation tables for alliga-tors and agricultural commodities. Part 2 evaluates fertilizer. Part 3 summa-rizes indices.
This folio evaluates three key ratios relevant to agriculture: transformity (sej/J), an energy specific ratio; emergy per mass (sej/g), a convenient ratio forproducts usually traded by weight; and empower density (sej/ha/yr), usefulfor landscape evaluations of energy concentration. Empower density (arealempower density) identifies centers of energy hierarchy and compares spa-tial organization at a landscape scale similar to measures of developmentdensity used by city planners.
ProceduresThe agricultural commodity evaluations presented in this folio primarily usedata published by Fluck et al. (1992) which are a compendium and aggrega-tion of agricultural statistics for commercial production in Florida from 1974to 1992. The main categories of environ-mental input for each commodityare the same (Figure 1), with differences in input of goods and services.
To avoid counting the same environmental energy source twice, all work thatcan be attributed to dispersion of solar energy-–insolation, rain and evapo-transpiration—were calculated and listed, but only evapotranspiration wasused to determine total emergy flows. Evapotranspiration specific to eachproduct was estimated from an agricultural field simulation (Smajstrla, 1990)based on the climatic region of the state with the most hectares in productionfor the commodity.
Total average daily caloric consumption for manual labor was that assumednecessary to support an average 8 hour work day. Because the person-hoursallocated to each production system were averaged over the total hectares inproduction, his 2000 annual work hours were allocated to many hectares ofproduction. Consequently, the total human energy consumption was multi-plied by the fraction of annual work hours documented for each hectare ofcultivation. The transformity of uneducated labor (Odum, 1996) was ap-plied. Manual labor was separated from services provided by humans with a

4
Erosion rates were estimated using some assumptions about most likely soil typeand landscape characteristics for Florida locations having large acreage in agri-cultural production. A tour of one to three fields of every commodity and a briefinterview with the managing grower were used to determine method for till/plant/harvest, and appropriate factors chosen for soil loss equations (Moore and Wil-son, 1992; Griffin et al., 1988), with the exception of cotton. These values wereaveraged with values presented in Pimentel et al. (1995) for commodities notspecifically covered in the Pimentel analysis. Cotton soil loss is taken directlyfrom Pimentel (1995).
Evaluations end at harvest of each product. They do not include any processingthat may be required for table-ready foods. Transportation to market is also notincluded. However, emergy ratios are calculated using dry weight of usable oredible product.
Several evaluations, including all notes, calculations and references, are presentedin their entirety. Remaining evaluations present only the input tables and thoseassumptions that are different from the full samples provided. Transformitiesused in the evaluations are listed in the notes, with reference to source; the valuesused are 1.68 times higher than calculated with earth energy baseline used in1996. See the Preface of this folio.
2. Emergy Evaluation Tables for Florida Agriculture
Tables 1-22 evaluate alligators and commodities in Florida agricluture.
higher level of education, farm management or veterinarian services for example.
Figure 1. Energy diagram of inputs evaluated for products of Florida agriculture.

5Table 1
Annual Emergy Used to Produce Alligator Products, per Hectare__________________________________________________________________
Inputs Solar EmergyNote Item ha-1 yr-1 E13 sej/ha/yr__________________________________________________________________1 Sun 6.35 E13 J 62 Evapotranspiration 5.76 E10 J 893 Net topsoil loss 0.00 J 04 Fuel 6.96 E11 J 77135 Electricity 4.25 E10 J 6806 Potash 0.00 g K 07 Feed, grain 2.75 E11 J 37078 Feed, livestock 8.81 E11 J 782809 Lime 0.00 g 010 Pesticides 0.00 g 011 Phosphate 0.00 g P 012 Nitrogen 0.00 g N 013 Labor 1.48 E9 J 65814 Services 2.94 E4 $ 1086615 Total emergy --------- 101,993__________________________________________________________________16 Total yield, dry weight 2.69 E6 g17 Total yield, energy 7.15 E10 J18 Emergy per mass 3.79 E11 sej/g19 Transformity 1.43 E7 sej/J20 Empower density 1.02 E18 sej/ha/yr in the pens
5.10 E17 sej/ha/yr for pens and bufferFAECM = Florida Agricultural Energy Consumption ModelASFIRS = Agricultural Field Scale Irrigation Requirements Simulation ModelDAP = Diammonium phosphate (super phosphate) fertilizer1. Transformity 1 by definition. Solar insolation calculated using solar constant of 2Langleys/sec and integration over changing surface area for a one year period at latitude27.00 N, longitude 82.00 W: 6.9 E9 J/m2/yr. Albedo 8% (NASAeosweb). Annual energy= (Avg. total annual insolation J/yr/m2)(Area m2)(1 - albedo).2. Transformity for evapotranspiration 15,423 sej/J (Odum, 1996) corrected by factor of1.68 (Odum et al., 2000). Grain evapotranspiration = 2.33 E10 J/acre/yr (ASFIRS esti-mate, Smajstrla, 1990). Annual energy = (evapotranspiration J/acre/yr)(area ha)(2.47 acres/ha).3. Erosion rate estimated as less than 0.01 g/m2/yr for aquaculture.4. Fuel includes diesel, gasoline and lubricants and uses petroleum products transformity6.60 E4 sej/J (Odum 1996) corrected by factor of 1.68 (Odum et al., 2000). Gallons offuel/ha/yr from FAECM data (Fluck, 1992). Annual energy = (Gallons fuel)(1.32 E8 J/gal).5. Transformity for electricity from average U.S. coal plant 1.60 E5 sej/J (Odum, 1996)
6
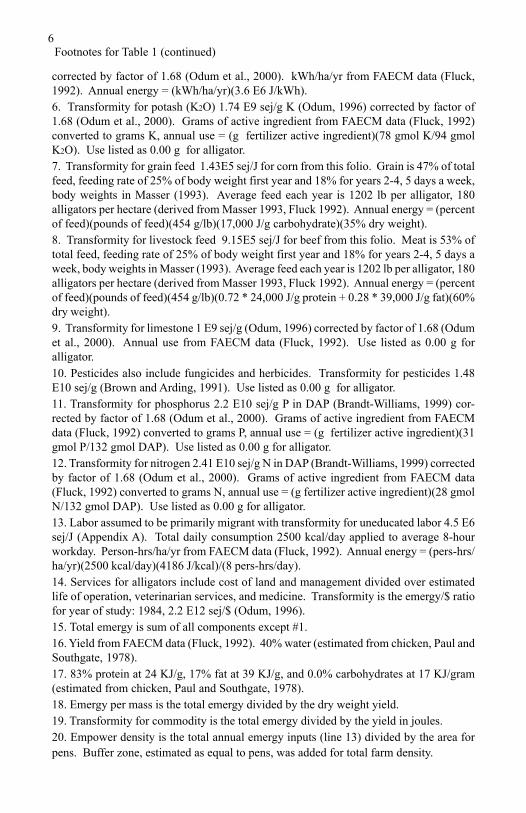
corrected by factor of 1.68 (Odum et al., 2000). kWh/ha/yr from FAECM data (Fluck,1992). Annual energy = (kWh/ha/yr)(3.6 E6 J/kWh).6. Transformity for potash (K2O) 1.74 E9 sej/g K (Odum, 1996) corrected by factor of1.68 (Odum et al., 2000). Grams of active ingredient from FAECM data (Fluck, 1992)converted to grams K, annual use = (g fertilizer active ingredient)(78 gmol K/94 gmolK2O). Use listed as 0.00 g for alligator.7. Transformity for grain feed 1.43E5 sej/J for corn from this folio. Grain is 47% of totalfeed, feeding rate of 25% of body weight first year and 18% for years 2-4, 5 days a week,body weights in Masser (1993). Average feed each year is 1202 lb per alligator, 180alligators per hectare (derived from Masser 1993, Fluck 1992). Annual energy = (percentof feed)(pounds of feed)(454 g/lb)(17,000 J/g carbohydrate)(35% dry weight).8. Transformity for livestock feed 9.15E5 sej/J for beef from this folio. Meat is 53% oftotal feed, feeding rate of 25% of body weight first year and 18% for years 2-4, 5 days aweek, body weights in Masser (1993). Average feed each year is 1202 lb per alligator, 180alligators per hectare (derived from Masser 1993, Fluck 1992). Annual energy = (percentof feed)(pounds of feed)(454 g/lb)(0.72 * 24,000 J/g protein + 0.28 * 39,000 J/g fat)(60%dry weight).9. Transformity for limestone 1 E9 sej/g (Odum, 1996) corrected by factor of 1.68 (Odumet al., 2000). Annual use from FAECM data (Fluck, 1992). Use listed as 0.00 g foralligator.10. Pesticides also include fungicides and herbicides. Transformity for pesticides 1.48E10 sej/g (Brown and Arding, 1991). Use listed as 0.00 g for alligator.11. Transformity for phosphorus 2.2 E10 sej/g P in DAP (Brandt-Williams, 1999) cor-rected by factor of 1.68 (Odum et al., 2000). Grams of active ingredient from FAECMdata (Fluck, 1992) converted to grams P, annual use = (g fertilizer active ingredient)(31gmol P/132 gmol DAP). Use listed as 0.00 g for alligator.12. Transformity for nitrogen 2.41 E10 sej/g N in DAP (Brandt-Williams, 1999) correctedby factor of 1.68 (Odum et al., 2000). Grams of active ingredient from FAECM data(Fluck, 1992) converted to grams N, annual use = (g fertilizer active ingredient)(28 gmolN/132 gmol DAP). Use listed as 0.00 g for alligator.13. Labor assumed to be primarily migrant with transformity for uneducated labor 4.5 E6sej/J (Appendix A). Total daily consumption 2500 kcal/day applied to average 8-hourworkday. Person-hrs/ha/yr from FAECM data (Fluck, 1992). Annual energy = (pers-hrs/ha/yr)(2500 kcal/day)(4186 J/kcal)/(8 pers-hrs/day).14. Services for alligators include cost of land and management divided over estimatedlife of operation, veterinarian services, and medicine. Transformity is the emergy/$ ratiofor year of study: 1984, 2.2 E12 sej/$ (Odum, 1996).15. Total emergy is sum of all components except #1.16. Yield from FAECM data (Fluck, 1992). 40% water (estimated from chicken, Paul andSouthgate, 1978).17. 83% protein at 24 KJ/g, 17% fat at 39 KJ/g, and 0.0% carbohydrates at 17 KJ/gram(estimated from chicken, Paul and Southgate, 1978).18. Emergy per mass is the total emergy divided by the dry weight yield.19. Transformity for commodity is the total emergy divided by the yield in joules.20. Empower density is the total annual emergy inputs (line 13) divided by the area forpens. Buffer zone, estimated as equal to pens, was added for total farm density.
Footnotes for Table 1 (continued)

7
Table 2Annual Emergy Use to Support Beef, with Two Steers per Hectare
Inputs Solar EmergyNote Item ha-1 yr-1 E13 sej/ha/yr1 Sun 6.53 E13 J 62 Evapotranspiration 1.15 E11 J 2983 Net topsoil loss 6.33 E7 J 14 Fuel 1.20 E10 J 1335 Electricity 0.00 J 06 Potash 6.89 E4 g K 137 Lime 5.52 E5 g 938 Pesticides 1.08 E4 g 279 Phosphate 7.63 E3 g P 2810 Nitrogen 3.09 E4 g N 12511 Labor 8.40 E7 J 3712 Services 3.68 E2 $ 13613 Total emergy --------- 891__________________________________________________________________14 Total yield, dry weight 1.84 E5 g15 Total yield, energy 1.04 E10 J16 Emergy per mass 4.85 E10 sej/g17 Transformity 8.60 E5 sej/J18 Empower density 8.91 E15 sej/ha/yr__________________________________________________________________Acronyms are identified in Table 1.
1. Transformity 1 by definition. Solar insolation calculated using solar constant of 2Langleys/sec and integration over changing surface area for a one year period at latitude27.00 N, longitude 82.00 W: 6.9 E9 J/m2/yr. Albedo 8% (NASAeosweb). Annual energy= (Avg. total annual insolation J/yr/m2)(Area m2)(1 - albedo).2. Transformity for evapotranspiration 15,423 sej/J (Odum, 1996) corrected by factor of1.68 (Odum et al., 2000). Pasture evapotranspiration = 4.66 E10 J/acre/yr (ASFIRS esti-mate, Smajstrla, 1990). Annual energy = (evapotranspiration J/acre/yr)(area ha)(2.47 acres/ha).3. Transformity for organic soil 7.38 E4 sej/J (Odum, 1996) corrected by factor of 1.68(Odum et al., 2000). Erosion rate estimated at 7.0 g/m2/yr (Pimentel et al., 1995) with0.04% organics in soil. The energy content in organic soil is 5.4 kcal/g (Ulgiati et al.,1992). The net loss of topsoil is (farmed area)(erosion rate). The energy of soil used, orlost, = (net loss topsoil)(% organic)(5.4 kcal/g)(4186 J/kcal).4. Fuel includes diesel, gasoline and lubricants and uses petroleum products transformity6.60 E4 sej/J (Odum, 1996) corrected by factor of 1.68 (Odum et al., 2000). Gallons offuel/ha/yr from FAECM data (Fluck, 1992). Annual energy = (Gallons fuel)(1.32 E8 J/gal).

8
5. Transformity for electricity from average U.S. coal plant 1.60 E5 sej/J (Odum, 1996)corrected by factor of 1.68 (Odum et al., 2000). kWh/ha/yr from FAECM data (Fluck,1992). Annual energy = (kWh/ha/yr)(3.6 E6 J/kWh).6. Transformity for potash (K2O) 1.74 E9sej/g K (Odum, 1996) corrected by factor of1.68 (Odum et al., 2000). Grams of active ingredient from FAECM data (Fluck, 1992)converted to grams K, annual use = (g fertilizer active ingredient)(78 gmol K/94 gmolK2O). Use taken from pasture data.7. Transformity for limestone 1 E9 sej/g (Odum, 1996) corrected by factor of 1.68 (Odumet al., 2000). Annual use from FAECM data (Fluck, 1992). Use taken from pasture data.8. Pesticides also include fungicides and herbicides. Transformity for pesticides 1.48E10 sej/g (Brown and Arding, 1991). Use taken from pasture data.9. Transformity for phosphorus 2.2 E10 sej/g P in DAP (Brandt-Williams, 1999) cor-rected by factor of 1.68 (Odum et al., 2000). Grams of active ingredient from FAECMdata (Fluck, 1992) converted to grams P, annual use = (g fertilizer active ingredient)(31gmol P/132 gmol DAP). Use taken from pasture data.10. Transformity for nitrogen 2.41 E10 sej/g N in DAP (Brandt-Williams, 1999) correctedby factor of 1.68 (Odum et al., 2000). Grams of active ingredient from FAECM data(Fluck, 1992) converted to grams N, annual use = (g fertilizer active ingredient)(28 gmolN/132 gmol DAP). Use taken from pasture data.11. Labor assumed to be primarily migrant with transformity for uneducated labor 4.5 E6sej/J (Appendix A). Total daily consumption of 2500 kcal/day applied to average 8-hourworkday. Person-hours/ha/yr from FAECM data (Fluck, 1992). Annual energy = (pers-hrs/ha/yr)(3000 kcal/day)(4186 J/kcal)/(8 pers-hrs/day).12. Services for beef include cost of land and management divided over estimated life ofoperation, veterinarian services, vaccination and medicine. Transformity is the emergy/$ratio for year of study: 1981, 2.7 E12 sej/$ (Odum, 1996).13. Total emergy is sum of all components except #1.14. Yield from FAECM data (Fluck, 1992) given as dry weight.15. 72% protein at 24 KJ/g, 28% fat at 39 KJ/g, and 0.0% carbohydrates at 17 KJ/gram(Paul and Southgate, 1978).16. Emergy per mass is the total emergy divided by the dry weight yield.17. Transformity for commodity is the total emergy divided by the yield in joules.18. Empower density is the total annual flows into a unit area over a year, i.e. the totalemergy line #13 because a single hectare was evaluated for a year in this study.
Footnotes for Table 2 (continued)

9
Table 3Emergy Evaluation of Bell Pepper, per ha per year
Inputs Solar EmergyNote Item ha-1 yr-1 E13 sej/ha/yr1 Sun 6.35 E13 J 62 Evapotranspiration 5.43 E10 J 1413 Net topsoil loss 7.69 E9 J 954 Fuel 5.57 E10 J 6185 Electricity 7.49 E8 J 206 Potash 1.72 E5 g K 327 Lime 0.00 g 08 Pesticides 1.31 E5 g 3309 Phosphate 5.27 E4 g P 19510 Nitrogen 4.40 E4 g N 17811 Labor 1.64 E9 J 72812 Services 2.11 E3 $ 57813 Total emergy --------- 3,572__________________________________________________________________14 Total yield, dry weight 1.82 E6 g15 Total yield, energy 3.87 E10 J16 Emergy per mass 1.64 E10 sej/g17 Transformity 7.71 E5 sej/J18 Empower density 2.99 E16 sej/ha/yr__________________________________________________________________Acronyms are identified in Table 1.
1. Transformity 1 by definition. Solar insolation calculated using solar constant of 2Langleys/sec and integration over changing surface area for a one year period at latitude27.00 N, longitude 82.00 W: 6.9 E9 J/m2/yr. Albedo 8% (NASAeosweb). Annual energy= (Avg. total annual insolation J/yr/m2)(Area m2)(1 - albedo).2. Transformity for evapotranspiration (Et) 15,423 sej/J (Odum, 1996) corrected by fac-tor of 1.68 (Odum et al., 2000). Pepper evapotranspiration = 4.66 E10 J/acre/yr (ASFIRSestimate, Smajstrla, 1990). Annual energy = (evapotranspiration J/acre/yr)(area ha)(2.47acres/ha).3. Transformity for organic soil 7.38 E4 sej/J (Odum, 1996) corrected by factor of 1.68(Odum et al., 2000). Erosion rate estimated at 850 g/m2/yr (Pimentel et al., 1995; Mooreand Wilson, 1992; Griffin et al., 1988) with 0.04% organics in soil. The energy content inorganic soil is 5.4 kcal/g (Ulgiati et al., 1992). The net loss of topsoil is (farmed area)(erosionrate). The energy of soil used or lost = (net loss topsoil)(% organic)(5.4 kcal/g)(4186 J/kcal).4. Fuel includes diesel, gasoline and lubricants and uses petroleum products transformity6.60 E4 sej/J (Odum, 1996) corrected by factor of 1.68 (Odum et al., 2000). Gallons offuel/ha/yr from FAECM data (Fluck, 1992). Annual energy = (Gallons fuel)(1.32 E8 J/gal).

10
5. Transformity for electricity from average U.S. coal plant =1.60 E5 sej/J (Odum, 1996)corrected by factor of 1.68 (Odum et al., 2000). kWh/ha/yr from FAECM data (Fluck,1992). Annual energy = (kWh/ha/yr)(3.6 E6 J/kWh).6. Transformity for potash (K2O) 1.74 E9 sej/g K (Odum, 1996) corrected by factor of1.68 (Odum et al., 2000). Grams of active ingredient from FAECM data (Fluck, 1992)converted to grams K, annual use = (g fertilizer active ingredient)(78 gmol K/94 gmolK2O).7. Transformity for limestone 1 E9 sej/g (Odum, 1996) corrected by factor of 1.68 (Odumet al., 2000). Annual use from FAECM data (Fluck, 1992) estimated as negligible for bellpeppers.8. Pesticides also include fungicides and herbicides. Transformity for pesticides 1.48E10 sej/g (Brown and Arding, 1991).9. Transformity for phosphorus 2.2 E10 sej/g P in DAP (Brandt-Williams, 1999) cor-rected by factor of 1.68 (Odum et al., 2000). Grams of active ingredient from FAECMdata (Fluck, 1992) converted to grams P, annual use = (g fertilizer active ingredient)(31gmol P/132 gmol DAP).10. Transformity for nitrogen 2.41 E10 sej/g N in DAP (Brandt-Williams, 1999) cor-rected by factor of 1.68 (Odum et al., 2000). Grams of active ingredient from FAECMdata (Fluck, 1992) converted to grams N, annual use = (g fertilizer active ingredient)(28gmol N/132 gmol DAP).11. Labor assumed to be primarily migrant with transformity for uneducated labor 4.5 E6sej/J (Appendix A). Total daily consumption of 2500 kcal/day applied to average 8-hourworkday and divided over total area possible to work in a given day. Person-hrs/ha/yrfrom FAECM data (Fluck, 1992). Annual energy = (pers-hrs/ha/yr)(2500 kcal/day)(4186J/kcal)/(8 pers-hrs/day) = J/ha/yr12. Services for bell peppers include cost of land and management divided over estimatedlife of operation, and annual expenditures on seedlings and equipment rental. Transformityis the emergy/$ ratio for year of study: 1981, 2.7 E12 sej/$ (Odum, 1996).13. Total emergy is sum of all components except #1.14. Yield from FAECM data (Fluck, 1992) given as fresh weight. 93.5% water (Paul andSouthgate, 1978).15. 26% protein at 24 KJ/g, 11% fat at 39KJ/g, and 63% carbohydrates at 17 KJ/gram(Paul and Southgate, 1978).16. Emergy per mass is the total emergy divided by the dry weight yield.17. Transformity for commodity is the total emergy divided by the yield in joules.18. Empower density is the total annual flows into a unit area over a year, i.e. the totalemergy line #13 because a single hectare was evaluated for a year in this study.
Footnotes for Table 3 (continued)

11Table 4
Emergy Evaluation of Eggs, per 100 hens per year__________________________________________________________________
Inputs Solar EmergyNote Item 100 hens-1 yr-1 E13 sej/100 hens/yr1 Sun 8.31 E13 J 82 Evapotranspiration 6.05 E10 J 1573 Net topsoil loss 4.25 E9 J 5274 Fuel 4.89 E10 J 5425 Electricity 3.06 E9 J 826 Potash 1.57 E5 g K 297 Lime 5.25 E5 g 888 Pesticides 0.00 g 09 Phosphate 2.95 E4 g P 10910 Nitrogen 7.99 E4 g N 32311 Labor 1.56 E10 J 692712 Services 1.21 E3 $ 33113 Total emergy -------- 9,145__________________________________________________________________14 Total yield, eggs 2.29 E4 eggs15 Total yield, dry weight 8.55 E5 g16 Total yield, energy 2.08 E10 J17 Emergy per egg 3.99 E12 sej/egg18 Emergy per mass 1.07 E11 sej/g19 Transformity 4.40 E6 sej/J20 Empower density 3.99 E20 sej/ha/yr layer houses
2.26 E18 sej/ha/yr egg farmAcronyms are identified in Table 1.Items with the same data sources, transformities and assumptions as tables 1-3 are notrepeated here; items 1, 2 and 4 -11 include the 1.4 ha grain corn feed requirements(Austic and Nesheim, 1990).
2. Grain corn Et = 2.45 E10 J/acre/yr (ASFIRS estimate, Smajstrla, 1990).3. Erosion rate estimated at 4700 g/m2/yr (estimated from Pimentel et al., 1995; Mooreand Wilson, 1992; Griffin et al., 1988) for corn production.12. Services for eggs include cost of land, buildings and management divided over esti-mated life of operation, feed shipment and pullet replacement. Transformity is the emergy/$ ratio for year of study: 1988, 1.75 E12 sej/$ (Odum, 1996).14. Yield from FAECM data (Fluck, 1992) given as number of eggs per 100 hens.15. 60.8 g/egg, (Cotterill et al., 1977), 74.8% water (Paul and Southgate, 1978).16. 13.4 g edible, 97 cal per edible portion of egg (Cotterill et al., 1977).20. Empower density was calculated from industry average of 34 ft2/100 hens (estimatedfrom Austic and Nesheim 1990, 3 racks of cages, 3 hens per cage) for the layer housevalue. Suggested manure treatment is 1 acre per 1000 hens (Douglas 1992), and thisbuffer zone was used to calculate empower density for an egg farm. Hens are not givenrun of the buffer zone; they remain in their cages for their entire lifespan.

12
Table 5Emergy Evaluation of Oranges, per ha per year
__________________________________________________________________ Inputs Solar Emergy
Note Item ha-1 yr-1 E13 sej/ha/yr__________________________________________________________________1 Sun 6.35 E13 J 62 Evapotranspiration 6.51 E10 J 1683 Net topsoil loss 6.33 E8 J 84 Fuel 1.99 E10 J 2215 Electricity 4.68 E8 J 136 Potash 2.36 E5 g K 447 Lime 2.40 E5 g 408 Pesticides 1.79 E4 g 459 Phosphate 1.12 E4 g P 4210 Nitrogen 3.01 E4 g N 12211 Labor 2.71 E8 J 12012 Services 3.01 E2 $ 12113 Total emergy -------- 944__________________________________________________________________14 Total yield, dry weight 4.91 E6 g15 Total yield, energy 8.65 E10 J16 Emergy per mass 1.92 E9 sej/g17 Transformity 1.09 E5 sej/J18 Empower density 9.44 E15 sej/ha/yr__________________________________________________________________Acronyms are identified in Table 1.Items with the same data sources, transformities and assumptions as tables 1-3 arenot repeated here.
2. Citrus evapotranspiration = 2.63 E10 J/acre/yr (ASFIRS estimate, Smajstrla, 1990).312. Services for oranges include cost of tree stock, land, buildings and managementdivided over estimated life of operation. Transformity is the emergy/$ ratio for yearof study: 1983, 2.4 E12 sej/$ (Odum, 1996).14. Yield from FAECM data (Fluck, 1992) given as dry mass.15. 8.6% protein at 24 KJ/g, 0% fat at 39 KJ/g, and 91.4% carbohydrates at 17 KJ/gram (Paul and Southgate, 1978).

13
Table 6Emergy Evaluation of Cabbage, per ha per year
__________________________________________________________________Inputs Solar Emergy
Note Item ha-1 yr-1 E13 sej/ha/yr__________________________________________________________________1 Sun 6.35 E13 J 62 Evapotranspiration 6.30 E10 J 1633 Net topsoil loss 7.69 E9 J 954 Fuel 1.74 E10 J 1935 Electricity 1.36 E9 J 376 Potash 1.86 E5 g K 347 Lime 5.65 E5 g 958 Pesticides 6.60 E3 g 179 Phosphate 4.60 E4 g P 17010 Nitrogen 4.75 E4 g N 19211 Labor 2.05 E8 J 9112 Services 4.43 E2 $ 12113 Total emergy -------- 1,209__________________________________________________________________14 Total yield, dry weight 2.31 E6 g15 Total yield, energy 4.47 E10 J16 Emergy per mass 5.23 E9 sej/g17 Transformity 2.71 E5 sej/J18 Empower density 1.21 E16 sej/ha/yr__________________________________________________________________Acronyms are identified in Table 1.Items with the same sources, transformities and assumptions as tables 1-3 are notrepeated here.
2. Cabbage evapotranspiration = 2.55 E10 J/acre/yr (ASFIRS estimate, Smajstrla,1990).3. Erosion rate estimated at 850 g/m2/yr (Pimentel et al., 1995; Moore and Wilson,1992; Griffin et al., 1988)12. Services for cabbage include cost of transplants, land, and maintenance dividedover estimated life of operation. Transformity is the emergy/$ ratio for year of study:1989, 1.63 E12 sej/$ (Odum, 1996).14. Yield from FAECM data (Fluck, 1992) given as # crates. 50 lb/crate (William,1984). 90.3% water (Paul and Southgate, 1978)15. 33% protein at 24 KJ/g, 0% fat at 39 KJ/g, and 67% carbohydrates at 17 KJ/gram(Paul and Southgate, 1978).

14
Table 7Emergy Evaluation of Corn (Sweet), per ha per year
__________________________________________________________________ Inputs Solar Emergy
Note Item ha-1 yr-1 E13 sej/ha/yr__________________________________________________________________1 Sun 6.35 E13 J 62 Evapotranspiration 6.05 E10 J 1573 Net topsoil loss 2.44 E10 J 3034 Fuel 1.25 E10 J 1385 Electricity 0 J 06 Potash 1.39 E5 g K 267 Lime 0 g 08 Pesticides 1.11 E4 g 289 Phosphate 3.95 E4 g P 14610 Nitrogen 5.71 E4 g N 23111 Labor 2.54 E8 J 11312 Services 7.76 E2 $ 21213 Total emergy ------- 1,315__________________________________________________________________14 Total yield, dry weight 5.29 E6 g15 Total yield, energy 1.04 E11 J16 Emergy per mass 2.49 E9 sej/g17 Transformity 1.26 E5 sej/J18 Empower density 1.31 E16 sej/ha/yr__________________________________________________________________Acronyms are identified in Table 1.Items with the same sources, transformities and assumptions as tables 1-3 are notrepeated here.
2. Corn evapotranspiration = 2.45 E10 J/acre/yr (ASFIRS estimate, Smajstrla, 1990).3. Erosion rate estimated at 2700 g/m2/yr (estimated from Pimentel et al., 1995;Moore and Wilson, 1992; Griffin et al., 1988) .12. Services for corn include cost of land and management divided over estimatedlife of operation. Transformity is the emergy/$ ratio for year of study: 1990, 1.55E12 sej/$ (Odum, 1996).14. Yield from FAECM data (Fluck, 1992) given as lbs. 65.2% water (Paul andSouthgate, 1978)15. 13.6% protein at 24 KJ/g, 7.9% fat at 39 KJ/g, and 78.5% carbohydrates at 17KJ/gram (Paul and Southgate, 1978).

15
Table 8Emergy Evaluation of Cucumbers, per ha per year
__________________________________________________________________Inputs Solar Emergy
Note Item ha-1 yr-1 E13 sej/ha/yr__________________________________________________________________1 Sun 6.35 E13 J 62 Evapotranspiration 6.02 E10 J 1563 Net topsoil loss 7.69 E9 J 954 Fuel 2.19 E10 J 2435 Electricity 0 J 06 Potash 1.49 E5 g K 277 Lime 5.65 E5 g 958 Pesticides 4.90 E4 g 1239 Phosphate 4.20 E4 g P 15510 Nitrogen 4.75 E4 g N 19211 Labor 6.41 E8 J 28512 Services 1.50 E3 $ 41113 Total emergy -------- 2,013__________________________________________________________________14 Total yield, dry weight 1.33 E7 g15 Total yield, energy 2.61 E11 J16 Emergy per mass 1.34 E9 sej/g17 Transformity 6.84 E4 sej/J18 Empower density 1.78 E16 sej/ha/yr__________________________________________________________________Acronyms are identified in Table 1.Items with the same sources, transformities and assumptions as tables 1-3 are notrepeated here.
2. Cucumbers evapotranspiration = 2.44 E10 J/acre/yr (ASFIRS estimate, Smajstrla,1990).3. Erosion rate estimated at 850 g/m2/yr (estimated from Pimentel et al., 1995;Moore and Wilson, 1992; Griffin et al., 1988).12. Services for cucumbers include cost of land and management divided over esti-mated life of operation. Transformity is the emergy/$ ratio for year of study: 1990,1.55 E12 sej/$ (Odum, 1996).14. Yield from FAECM data (Fluck, 1992) given as bushels. 55 lb/bu (William,1984). 96.4% water (Paul and Southgate, 1978)15. 24% protein at 24 KJ/g, 4% fat at 39 KJ/g, and 72% carbohydrates at 17 KJ/gram(Paul and Southgate, 1978).

16
Table 9Emergy Evaluation of Green Beans, per ha per year
__________________________________________________________________ Inputs Solar Emergy
Note Item ha-1 yr-1 E13 sej/ha/yr__________________________________________________________________1 Sun 6.35 E13 J 62 Evapotranspiration 5.65 E10 J 1463 Net topsoil loss 7.69 E9 J 954 Fuel 1.94 E10 J 2155 Electricity 1.65 E9 J 446 Potash 6.98 E4 g K 137 Lime 5.65 E5 g 958 Pesticides 1.22 E4 g 319 Phosphate 1.98 E4 g P 7310 Nitrogen 2.38 E4 g N 9611 Labor 6.23 E7 J 2812 Services 1.87 E3 $ 51213 Total emergy ------- 1,371__________________________________________________________________14 Total yield, dry weight 5.55 E5 g15 Total yield, energy 1.12 E10 J16 Emergy per mass 2.43 E10 sej/g17 Transformity 1.20 E6 sej/J18 Empower density 1.35 E16 sej/ha/yr__________________________________________________________________Acronyms are identified in Table 1.Items with the same sources, transformities and assumptions as tables 1-3 are notrepeated here.
2. Green beans evapotranspiration = 2.29 E10 J/acre/yr (ASFIRS estimate, Smajstrla,1990).3. Erosion rate estimated at 850 g/m2/yr (estimated from Pimentel et al., 1995;Moore and Wilson, 1992; Griffin et al., 1988).12. Services for green beans include cost of harvest equipment, land and manage-ment divided over estimated life of operation. Transformity is the emergy/$ ratio foryear of study: 1990, 1.55 E12 sej/$ (Odum, 1996).14. Yield from FAECM data (Fluck, 1992) given as bushels. 30 lbs/bu (William,1984). 89% water (Paul and Southgate, 1978).15. 36% protein at 24 KJ/g, 3% fat at 39 KJ/g, and 61% carbohydrates at 17 KJ/gram(Paul and Southgate, 1978).

17
Table 10Emergy Evaluation of Lettuce (Romaine), per ha per year
__________________________________________________________________Inputs Solar Emergy
Note Item ha-1 yr-1 E13 sej/ha/yr__________________________________________________________________1 Sun 6.35 E13 J 62 Evapotranspiration 5.27 E10 J 1363 Net topsoil loss 7.69 E9 J 954 Fuel 2.63 E10 J 2915 Electricity 0 J 06 Potash 1.86 E5 g K 347 Lime 0 g 08 Pesticides 4.43 E4 g 1129 Phosphate 2.63 E4 g P 9710 Nitrogen 4.75 E4 g N 19211 Labor 3.87 E8 J 17212 Services 1.65 E3 $ 45213 Total emergy ------- 1,721__________________________________________________________________14 Total yield, dry weight 8.08 E5 g15 Total yield, energy 1.87 E10 J16 Emergy per mass 1.96 E10 sej/g17 Transformity 8.45 E5 sej/J18 Empower density 1.58 E16 sej/ha/yr__________________________________________________________________Acronyms are identified in Table 1.Items with the same sources, transformities and assumptions as tables 1-3 are notrepeated here.
2. Lettuce evapotranspiration = 2.13 E10 J/acre/yr (ASFIRS estimate, Smajstrla,1990).3. Erosion rate estimated at 850 g/m2/yr (estimated from Pimentel et al., 1995;Moore and Wilson, 1992; Griffin et al., 1988).12. Services for lettuce includes repairs and custom work. Transformity is the emergy/$ ratio for year of study: 1990, 1.55 E12 sej/$ (Odum, 1996).14.Yield from FAECM data (Fluck, 1992) given as crates. 30 lb/crate (Williams,1984). 96% water (Paul and Southgate, 1978).15. 38% protein at 24 KJ/g, 16% fat at 39 KJ/g, and 46% carbohydrates at 17 KJ/gram (Paul and Southgate, 1978).

18
Table 11Emergy Evaluation of Peanuts, per ha per year
__________________________________________________________________ Inputs Solar Emergy
Note Item ha-1 yr-1 E13 sej/ha/yr__________________________________________________________________1 Sun 6.35 E13 J 62 Evapotranspiration 5.27 E10 J 1363 Net Topsoil Loss 7.69 E9 J 954 Fuel 1.01 E10 J 1125 Electricity 2.05 E9 J 556 Potash 8.38 E4 g K 157 Lime 9.04 E5 g 1528 Pesticides 1.52 E4 g 389 Phosphate 1.19 E4 g P 4410 Nitrogen 3.56 E3 g N 1411 Labor 3.00 E7 J 1312 Services 6.67 E2 $ 20213 Total emergy ------- 878__________________________________________________________________14 Total Yield, dry weight 2.95 E5 g15 Total Yield, energy 9.5 E9 J16 Emergy per mass 2.97 E10 sej/g17 Transformity 9.21 E5 sej/J18 Empower Density 8.78 E15 sej/ha/yr__________________________________________________________________Acronyms are identified in Table 1.Items with the same sources, transformities and assumptions as tables 1-3 are notrepeated here.
2. Peanuts evapotranspiration = 2.13 E10 J/acre/yr (ASFIRS estimate, Smajstrla,1990).3. Erosion rate estimated at 850 g/m2/yr (estimated from Pimentel et al., 1995;Moore and Wilson, 1992; Griffin et al., 1988).12. Services for peanuts include spraying, drying, repairs and other fixed costs.Transformity is the emergy/$ ratio for year of study: 1987, 1.8 E12 sej/$ (Odum,1996).14. Yield from FAECM data (Fluck, 1992) given as lb. 3.1% water (Paul andSouthgate, 1978).15. 30% protein at 24 KJ/g, 60% fat at 39 KJ/g, and 10% carbohydrates at 17 KJ/gram (Paul and Southgate, 1978).

19
Table 12Emergy Evaluation of Potatoes, per ha per year
__________________________________________________________________ Inputs Solar Emergy
Note Item ha-1 yr-1 E13 sej/ha/yr__________________________________________________________________1 Sun 6.35 E13 J 62 Evapotranspiration 5.77 E10 J 1493 Net topsoil loss 7.69 E9 J 954 Fuel 1.75 E10 J 1945 Electricity 1.36 E9 J 376 Potash 1.63 E5 g K 307 Lime 5.65 E5 g 958 Pesticides 3.45 E4 g 879 Phosphate 3.95 E4 g P 14610 Nitrogen 4.75 E4 g N 19211 Labor 1.37 E8 J 6112 Services 1.59 E3 $ 43513 Total emergy ------- 1,571__________________________________________________________________14 Total yield, dry weight 5.43 E6 g15 Total yield, energy 8.55 E10 J16 Emergy per mass 2.80 E9 sej/g17 Transformity 1.78 E5 sej/J18 Empower density 1.52 E16 sej/ha/yr__________________________________________________________________Acronyms are identified in Table 1.Items with the same sources, transformities and assumptions as tables 1-3 are notrepeated here.
2. Potato evapotranspiration = 2.34 E10 J/acre/yr (ASFIRS estimate, Smajstrla, 1990).3. Erosion rate estimated at 850 g/m2/yr (estimated from Pimentel et al., 1995;Moore and wilson, 1992; Griffin, 1988).12. Services for potatoes include repairs and interest divided over period of opera-tion. Transformity is the emergy/$ ratio for year of study: 1990, 1.55 E12 sej/$(Odum, 1996).14. Yield from FAECM data (Fluck, 1992). 75.8% water (Paul and Southgate, 1978).15. 9% protein at 24 KJ/g, 1% fat at 39 KJ/g, and 90% carbohydrates at 17 KJ/gram(Paul and Southgate, 1978).

20
Table 13Emergy Evaluation of Tomatoes, per ha per year
__________________________________________________________________ Inputs Solar Emergy
Note Item ha-1 yr-1 E13 sej/ha/yr__________________________________________________________________1 Sun 6.35 E13 J 62 Evapotranspiration 6.02 E10 J 1563 Net topsoil loss 6.33 E7 J 14 Fuel 7.37 E10 J 8175 Electricity 0 J 06 Potash 1.39 E5 g K 267 Lime 3.29 E6 g 5538 Pesticides 1.59 E5 g 4019 Phosphate 4.60 E4 g P 17010 Nitrogen 4.75 E4 g N 19211 Labor 8.56 E8 J 38112 Services 4.38 E3 $ 119913 Total emergy ------- 4,202__________________________________________________________________14 Total yield, dry weight 2.43 E6 g15 Total yield, energy 4.54 E10 J16 Emergy per mass 1.60 E10 sej/g17 Transformity 8.57 E5 sej/J18 Empower density 3.90 E16 sej/ha/yr__________________________________________________________________Acronyms are identified in Table 1.Items with the same sources, transformities and assumptions as tables 1-3 are notrepeated here.
2. Tomato evapotranspiration = 2.44 E10 J/acre/yr (ASFIRS estimate, Smajstrla,1990).3. Erosion rate estimated at 7 g/m2/yr (Pimentel et al., 1995) for protected soils.12. Services for tomatoes include cost of stakes, plastic, land, buildings and manage-ment divided over estimated life of use. Transformity is the emergy/$ ratio for yearof study: 1990, 1.55 E12 sej/$ (Odum, 1996).14. Yield from FAECM data (Fluck, 1992). 93.4% water (Paul and Southgate, 1978)15. 24% protein at 24 KJ/g, 0% fat at 39 KJ/g, and 76% carbohydrates at 17 KJ/gram(Paul and Southgate, 1978).

21
Table 14Emergy Evaluation of Watermelon, per ha per year
__________________________________________________________________ Inputs Solar Emergy
Note Item ha-1 yr-1 E13 sej/ha/yr__________________________________________________________________1 Sun 6.35 E13 J 62 Evapotranspiration 5.43 E10 J 1403 Net topsoil loss 7.69 E9 J 954 Fuel 2.07 E10 J 2305 Electricity 0 J 06 Potash 7.44 E4 g K 147 Lime 0 g 08 Pesticides 3.79 E4 g 969 Phosphate 2.63 E4 g P 9710 Nitrogen 2.86 E4 g N 11611 Labor 4.00 E8 J 17812 Services 1.05 E3 $ 28813 Total emergy —- 1,253__________________________________________________________________14 Total yield, dry weight 1.88 E7 g15 Total yield, energy 3.29 E11 J16 Emergy per mass 6.67 E8 sej/g17 Transformity 3.81 E4 sej/J18 Empower density 1.25 E16 sej/ha/yr__________________________________________________________________Acronyms are identified in Table 1.Items with the same sources, transformities and assumptions as tables 1-3 are notrepeated here;
2. Watermelon evapotranspiration = 2.2 E10 J/acre/yr (ASFIRS estimate, Smajstrla,1990).3. Erosion rate estimated at 850 g/m2/yr (estimated from Pimentel et al., 1995;Moore and Wilson, 1992; Griffin et al., 1988).12. Services for watermelon include cost land and management divided over esti-mated life of operation. Transformity is the emergy/$ ratio for year of study: 1981,2.7E12 sej/$ (Odum, 1996).14. Yield from FAECM data (Fluck, 1992) given as fresh. 47% water (Paul andSouthgate, 1978)15. 7% protein at 24 KJ/g, 0% fat at 39 KJ/g, and 93% carbohydrates at 17 KJ/gram(Paul and Southgate, 1978).

22
Table 15Emergy Evaluation of Corn (Grain), per ha per year
__________________________________________________________________ Inputs Solar Emergy
Note Item ha-1 yr-1 E13 sej/ha/yr__________________________________________________________________1 Sun 6.35 E13 J 62 Evapotranspiration 6.05 E10 J 1573 Net topsoil loss 4.25 E10 J 5274 Fuel 8.12 E9 J 905 Electricity 7.85 E8 J 216 Potash 1.12 E5 g K 217 Lime 3.73 E5 g 638 Pesticides 1.69 E3 g 49 Phosphate 2.11 E4 g P 7810 Nitrogen 5.71 E4 g N 23111 Labor 1.32 E7 J 612 Services 4.39 E2 $ 13313 Total emergy ------- 1,335__________________________________________________________________14 Total yield, dry weight 9.17 E5 g15 Total yield, energy 1.81 E10 J16 Emergy per mass 1.45 E10 sej/g17 Transformity 7.37 E5 sej/J18 Empower density 1.33 E16 sej/ha/yr__________________________________________________________________Acronyms are identified in Table 1.Items with the same sources, transformities and assumptions as tables 1-3 are notrepeated here
2 Corn evapotranspiration = 2.45 E10 J/acre/yr (ASFIRS estimate, Smajstrla,1990).3 Erosion rate estimated at 4700 g/m2/yr (Pimentel et al., 1995) tilled.12 Services for corn include cost of land and management divided over estimatedlife of operation. Transformity is the emergy/$ ratio for year of study: 1987, 1.8E12sej/$ (Odum, 1996).14 Yield from FAECM data (Fluck, 1992) given as bushels. 56 lb/bu (William,1984). 65% water (Paul and Southgate, 1978)15 13.6% protein at 24 KJ/g, 7.9% fat at 39 KJ/g, and 78.5% carbohydrates at 17KJ/gram (Paul and Southgate, 1978).

23
Table 16Annual Emergy Used to Produce Milk, per Cow per year
__________________________________________________________________ Inputs Solar Emergy
Note Item cow-1 yr-1 E13 sej/cow/yr__________________________________________________________________1 Sun 1.48 E14 J 152 Evapotranspiration 1.51 E11 J 3913 Net topsoil loss 7.69 E9 J 954 Fuel 1.75 E10 J 1945 Electricity 5.02 E9 J 1356 Potash 1.49 E5 g K 287 Lime 9.28 E5 g 1568 Pesticides 2.33 E3 g 69 Phosphate 3.35 E4 g P 12410 Nitrogen 5.07 E4 g N 20511 Labor 1.28 E8 J 5712 Services 2.19 E3 $ 117713 Total emergy ------- 2,568__________________________________________________________________14 Total yield, dry weight 7.63 E5 g15 Total yield, energy 1.98 E10 J16 Emergy per mass 3.37 E10 sej/g17 Transformity 1.29 E6 sej/J18 Empower density 1.90 E18 sej/ha/yr feed lot 5.19 E16 sej/ha/yr average S. FL. farm__________________________________________________________________Acronyms are identified in Table 1.Items with the same sources, transformities and assumptions as tables 1-3 are not re-peated here; items 1-3 and 7-11 include both area of domicile and feed requirements,estimated at 0.25 ha hay, 0.76 ha corn and 1.48 ha soybeans (estimated from personalcommunication, Lourd, 1996)
12. Services for milk include cost of veterinarians, medicines, transport of feed, dairyaged bulls, maintenance and capital costs divided over estimated life of operation.Transformity is the emergy/$ ratio for year of study: 1980, 3.2 E12 sej/$ (Odum, 1996).14. Yield from FAECM data (Fluck, 1992). 87.6% water (Paul and Southgate, 1978)15. 28% protein at 24 KJ/g, 32% fat at 39 KJ/g, and 40% carbohydrates at 17 KJ/gram(Paul and Southgate, 1978).18. Average of 10 - 50 cows per acre in feed lot, 4-9 months a year (pers. comm.,Lourds, 1996). Empower density = (30 cows/acre)(emergy per cow)(2.47 acres/ha).Total dairy farm acreage in Okeechobee watershed was 15,500 acres with 12,655 cows(Gale et al. 1993).

24
Table 17Emergy Evaluation of Oats, per ha per year
__________________________________________________________________ Inputs Solar Emergy
Note Item ha-1 yr-1 E13 sej/ha/yr__________________________________________________________________1 Sun 6.35 E13 J 62 Evapotranspiration 6.05 E10 J 1563 Net topsoil loss 7.69 E9 J 954 Fuel 2.59 E9 J 295 Electricity 0 J 06 Potash 9.29 E4 g K 177 Lime 0 g 08 Pesticides 0 g 09 Phosphate 1.32 E4 g P 4910 Nitrogen 5.11 E4 g N 20711 Labor 4.79 E6 J 212 Services 1.30 E2 $ 4413 Total emergy ------- 599__________________________________________________________________14 Total yield, dry weight 1.36 E6 g15 Total yield, energy 2.72 E10 J16 Emergy per mass 4.40 E9 sej/g17 Transformity 2.20 E5 sej/J18 Empower density 5.99 E15 sej/ha/yr__________________________________________________________________Acronyms are identified in Table 1.Items with the same sources, transformities and assumptions as tables 1-3 are notrepeated here.
2. Oats evapotranspiration = 2.45 E10 J/acre/yr (ASFIRS estimate, Smajstrla, 1990).3. Erosion rate estimated at 850 g/m2/yr (estimated from Pimentel et al., 1995;Moore and Wilson, 1992; Griffin et al., 1988).12. Services for oats include repairs and fixed costs. Transformity is the emergy/$ratio for year of study: 1985, 2.0 E12 sej/$ (Odum, 1996).14. Yield from FAECM data (Fluck, 1992) given as 41.7 bushels per acre. 32 lb/bushel (USFDA 1980), 8.9% water (Paul and Southgate 1978),15. 13.2% protein at 24 KJ/g, 9.2% fat at 39 KJ/g, and 77.6% carbohydrates at 17KJ/gram (Paul and Southgate, 1978).

25
Table 18Emergy Evaluation of Soybeans, per ha per year
__________________________________________________________________ Inputs Solar Emergy
Note Item ha-1 yr-1 E13 sej/ha/yr__________________________________________________________________1 Sun 6.35 E13 J 62 Evapotranspiration 6.15 E10 J 1593 Net topsoil loss 1.81 E7 J <14 Fuel 7.01 E6 J 685 Electricity 2.97 E8 J 86 Potash 3.73 E4 g K 77 Lime 3.72 E5 g 628 Pesticides 7.07 E2 g 29 Phosphate 1.05 E4 g P 3910 Nitrogen 2.38 E3 g N 1011 Labor 7.34 E6 J 312 Services 1.48 E2 $ 4113 Total emergy ------- 401__________________________________________________________________14 Total yield, dry weight 4.04 E5 g15 Total yield, energy 9.86 E9 J16 Emergy per mass 9.87 E9 sej/g17 Transformity 4.04 E5 sej/J18 Empower density 3.99 E15 sej/ha/yr__________________________________________________________________Acronyms are identified in Table 1.Items with the same sources, transformities and assumptions as tables 1-3 are notrepeated here.
2. Soybeans evapotranspiration = 2.49 E10 J/acre/yr (ASFIRS estimate, Smajstrla,1990).3. Erosion rate estimated at 2 g/m2/yr no till (estimated from Pimentel et al., 1995;Moore and Wilson, 1992; Griffin et al., 1988).12. Services for soybeans include repairs and fixed costs. Transformity is the emergy/$ ratio for year of study: 1989, 1.63 E12 sej/$ (Odum, 1996).14. Yield from FAECM data (Fluck, 1992) given as bushels. 60 lb/bushel (William1984). 70% water (Stetens Livsmedelsverk 1988)15. 40% protein at 24 KJ/g, 21% fat at 39 KJ/g, and 39% carbohydrates at 17 KJ/gram (Stetens Livsmedelsverk 1988).

26
Table 19Emergy Evaluation of Sugarcane, per ha per year
__________________________________________________________________ Inputs Solar Emergy
Note Item ha-1 yr-1 E13 sej/ha/yr__________________________________________________________________ 1 Sun 6.35 E13 J 6 2 Evapotranspiration 6.83 E10 J 177 3 Net topsoil loss 7.69 E9 J 95 4 Fuel 5.46 E9 J 63 5 Electricity 0 J 0 6 Potash 1.49 E5 g K 27 7 Lime 0 g 0 8 Pesticides 1.96 E3 g 5 9 Phosphate 1.05 E4 g P 3910 Nitrogen 0 g N 011 Labor 1.37 E7 J 612 Services 1.35 E3 $ 45413 Total emergy ------- 870__________________________________________________________________14 Total yield, dry weight 2.27 E7 g15 Total yield, energy 4.12 E11 J16 Emergy per mass 3.81 E8 sej/g17 Transformity 2.10 E4 sej/J18 Empower density 8.66 E15 sej/ha/yr__________________________________________________________________Acronyms are identified in Table 1.Items with the same sources, transformities and assumptions as tables 1-3 are notrepeated here.
2. Sugarcane evapotranspiration = 2.76 E10 J/acre/yr (ASFIRS estimate, Smajstrla,1990).3. Erosion rate estimated at 850 g/m2/yr (estimated from Pimentel et al., 1995;Moore and Wilson, 1992; Griffin et al., 1988) .12. Services for sugarcane include customs charges, repairs and fixed costs.Transformity is the emergy/$ ratio for year of study: 1985, 2.0 E12 sej/$ (Odum,1996).14. Yield from FAECM data (Fluck, 1992). 75% water (Ulgiati, 1992).15. 16% protein at 24 KJ/g, 0% fat at 39 KJ/g, and 84% carbohydrates at 17 KJ/gram(estimated from Paul and Southgate, 1978).

27
Table 20Emergy Evaluation of Cotton, per ha per year
__________________________________________________________________ Inputs Solar Emergy
Note Item ha-1 yr-1 E13 sej/ha/yr__________________________________________________________________1 Sun 6.35 E13 J 52 Evapotranspiration 5.80 E10 J 1503 Net topsoil loss 8.23 E10 J 10204 Fuel 9.70 E9 J 1085 Electricity 3.15 E8 J 86 Potash 7.44 E4 g K 147 Lime 5.65 E5 g 958 Pesticides 4.97 E3 g 139 Phosphate 1.58 E4 g P 5810 Nitrogen 1.90 E4 g N 77211 Labor 8.90 E7 J 4012 Services 4.07 E2 $ 12313 Total emergy ------- 1,737__________________________________________________________________14 Total yield, dry weight 7.38 E5 g15 Total yield, energy 1.25 E10 J16 Emergy per mass 2.31 E10 sej/g17 Transformity 1.36 E6 sej/J18 Empower density 1.71 E16 sej/ha/yr__________________________________________________________________Acronyms are identified in Table 1.Items with the same sources, transformities and assumptions as tables 1-3 are notrepeated here.
2. Cotton evapotranspiration = 2.35 E10 J/acre/yr (ASFIRS estimate, Smajstrla,1990).3. Erosion rate estimated at 9100 g/m2/yr (Pimentel et al., 1995).12. Services for cotton include ginning, interest and fixed costs. Transformity is theemergy/$ ratio for year of study: 1987, 1.8 E12 sej/$ (Odum, 1996).14. Yield from FAECM data (Fluck, 1992) given as bales. 480 lb/bale (Pierce, 1995)15. 100% carbohydrates at 17 KJ/gram (Paul and Southgate, 1978).
28
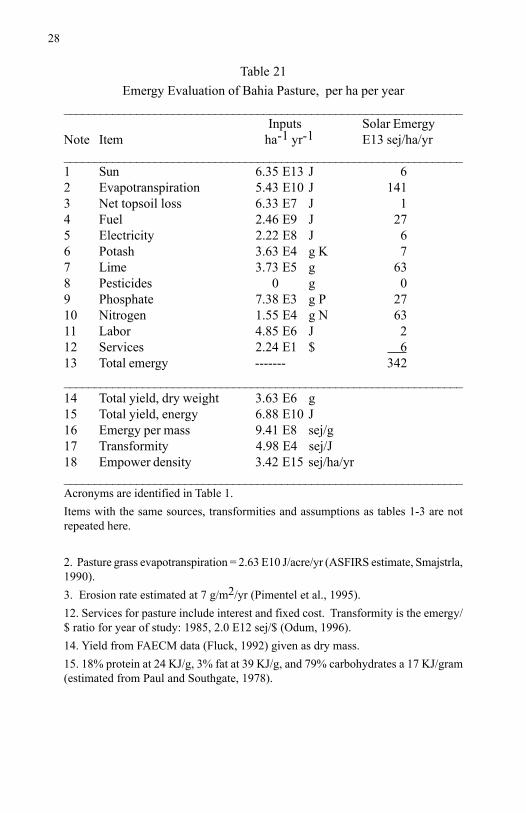
Table 21Emergy Evaluation of Bahia Pasture, per ha per year
__________________________________________________________________ Inputs Solar Emergy
Note Item ha-1 yr-1 E13 sej/ha/yr__________________________________________________________________1 Sun 6.35 E13 J 62 Evapotranspiration 5.43 E10 J 1413 Net topsoil loss 6.33 E7 J 14 Fuel 2.46 E9 J 275 Electricity 2.22 E8 J 66 Potash 3.63 E4 g K 77 Lime 3.73 E5 g 638 Pesticides 0 g 09 Phosphate 7.38 E3 g P 2710 Nitrogen 1.55 E4 g N 6311 Labor 4.85 E6 J 212 Services 2.24 E1 $ 613 Total emergy ------- 342__________________________________________________________________14 Total yield, dry weight 3.63 E6 g15 Total yield, energy 6.88 E10 J16 Emergy per mass 9.41 E8 sej/g17 Transformity 4.98 E4 sej/J18 Empower density 3.42 E15 sej/ha/yr__________________________________________________________________Acronyms are identified in Table 1.Items with the same sources, transformities and assumptions as tables 1-3 are notrepeated here.
2. Pasture grass evapotranspiration = 2.63 E10 J/acre/yr (ASFIRS estimate, Smajstrla,1990).3. Erosion rate estimated at 7 g/m2/yr (Pimentel et al., 1995).12. Services for pasture include interest and fixed cost. Transformity is the emergy/$ ratio for year of study: 1985, 2.0 E12 sej/$ (Odum, 1996).14. Yield from FAECM data (Fluck, 1992) given as dry mass.15. 18% protein at 24 KJ/g, 3% fat at 39 KJ/g, and 79% carbohydrates a 17 KJ/gram(estimated from Paul and Southgate, 1978).

29
Table 22Emergy Evaluation of Pecans, per ha per year
__________________________________________________________________ Inputs Solar Emergy
Note Item ha-1 yr-1 E13 sej/ha/yr__________________________________________________________________1 Sun 6.35 E13 J 62 Evapotranspiration 6.50 E10 J 1683 Net topsoil loss 6.33 E8 J 84 Fuel 1.32 E10 J 1465 Electricity 2.96 E8 J 86 Potash 7.54 E4 g K 147 Lime 3.73 E5 g 638 Pesticides 7.20 E3 g 189 Phosphate 2.11 E4 g P 7810 Nitrogen 4.88 E4 g N 11811 Labor 4.53 E7 J 2012 Services 2.11 E3 $ 34413 Total emergy ------- 986__________________________________________________________________14 Total yield, dry weight 8.00 E5 g15 Total yield, energy 2.30 E10 J16 Emergy per mass 1.23 E10 sej/g17 Transformity 4.28 E5 sej/J18 Empower density 9.84 E15 sej/ha/yr__________________________________________________________________Acronyms are identified in Table 1.Items with the same sources, transformities and assumptions as tables 1-3 are notrepeated here.
2. Pecan evapotranspiration = 2.63 E10 J/acre/yr (ASFIRS estimate, Smajstrla, 1990).3. Erosion rate estimated at 70 g/m2/yr (estimated from Pimentel et al., 1995; Mooreand Wilson, 1992; Griffin et al., 1988) for orchards.12. Services for pecans include cost of tree stock, land, buildings and managementdivided over estimated life of operation. Transformity is the emergy/$ ratio for yearof study: 1989, 1.63 E12 sej/$ (Odum, 1996).14. Yield (Sibbet et al.1998) given as dry in shell weight per acre; dry edible portion42% of nut weight (Hall 2000).15. Calorie content 6.87 Kcal/g (Hall 2000),

30
3. Emergy Evaluation of Fertilizers
Most Florida agricultural industries now use “superphosphate” fertilizer, ordiammonium phosphate (DAP) for increased productivity. This fertilizer,produced by ammonification and concentration of phosphorous acid (P2O5),is a more bioavailable form of phosphorus than phosphate rock, as well as asource of nitrogen fertilization.
The emergy per mass ratios are much higher than previously reported forphosphate fertilizer (Odum, 1996) because this evaluation takes the initialphosphate rock process through two more concentrating steps. The valuesfor emergy per gram phosphorus and nitrogen resulting from the DAP evalu-ation were used in the emergy evaluations of all Florida agriculture presentedin this folio.
The emergy evaluation for the base component, P2O5 (Table 23), and thefinal fertilizer, DAP (Table 24), were evaluated using industrial process in-formation and annual reports from IMC-Agrico, a production firm in Florida.Similar processes have been in use internationally for 50 years (Shreve, 1945;industry communication from a Florida fertilizer plant operator wishing toremain anonymous, 1996).
4. Summary Tables of Emergy Ratios
Listings of the emergy ratios calculated from the preceding tables are sum-marized in Tables 25-26 for quick reference.
Emergy RatiosValues calculated for transformity (emergy/energy) and emergy per mass ra-tios (Table 25) exhibit high variability between products within the state ofFlorida. Products with the lowest transformities — sugarcane, watermelonsand oranges — have been in production in the state for over a century and areparticularly well suited for the specific soil types prevalent in the areas of thestate in production. Mass production of eggs, with the highest transformity,is a relative newcomer to the state. It is a high intensity process housing 24layers per square meter with cages stacked 6 to 8 high, and requires coolingand extensive veterinarian services (Austic and Nesheim, 1990).
Empower Density (Empower Concentration per Area)Areal empower densities of egg and poultry production (Table 26), are com-parable to a power plant and higher than most developed cities. Empowerdensities of most agricultural commodities in Florida are similar to those ofrural nations or small American towns. For comparative data see Odum(1996), Lambert (1999), Brandt-Williams (1999).

31
Table 23Emergy Evaluation of Phosphorous Acid, 35% P2O5
__________________________________________________________________Note Item Inputs Solar Emergy
E12 sej__________________________________________________________________1 Water 1.40 E8 J 112 Phosphate rock 7.49 E5 g P 4,9073 Electricity 1.89 E8 J 514 Labor 1.05 E6 J 435 H2SO4 (94%) 8.85 E5 g 136
Total emergy ------- 5,149__________________________________________________________________6 Total yield 9.08 E5 g
Total phosphorus in yield 3.96 E5 g P7 Emergy per gram, P2O5 5.67 E9 sej/g
Emergy per gram, phosphorus 1.30 E10 sej/g P__________________________________________________________________1. Water - 7.5 E3 gal (Shreve, 1945)(7.5 E3 gal)(3785.43 cm3/gal(1g/cm3)(4.94 E3 J/g) = 1.40 E8 JTransformity for stored water 4.1 E4 sej/J (Odum, 1996) corrected by factor of 1.68(Odum et al., 2000).2. Phosphate rock, 70 BPL - 2350 lb (Shreve, 1945)(0.7)(2350 lb)(454 g/lb) = 7.49 E5Transformity for mined phosphate rock = 3.9 E9 sej/g (Odum, 1996) corrected byfactor of 1.68 (Odum et al., 2000).3. Electricity - 5.25 E1 (Shreve, 1945)(5.25 E1 kWh)(3.6 E6 J/kWh) = 1.89 E8 J4. Labor - 8 E-1 pers-hrs (Shreve, 1945)(8 E-1 pers-hrs)(2500 kcal/day)(4186 J/kcal)/(8 pers-hrs/day) = 1.05 E6 JTransformity - high school graduate (Odum, 1996)5. Sulfuric acid - 1950 lb (Shreve, 1945)(1950 lb)(454 g/lb) = 8.85 E5 gTransformity for 20% sulfuric acid 9.13 E7 sej/g (Odum et al., 2000) with a linearconcentration factor assumed for 94% acid, corrected by factor of 1.68 (Odum et al.,2000).6. Yield - 908 kg 35% P2O5Ratio P to P2O5: 62 gmol P/142 gmol P2O57. Total emergy divided by yield mass

32
Table 24Emergy Evaluation of Diammonium (Superphosphate) Fertilizer
__________________________________________________________________Note Item Inputs Solar Emergy
E16 sej__________________________________________________________________1 Fuel 2.74 E14 J 1,3152 Electricity 1.08 E15 J 17,2803 Labor 2.43 E12 J 5,9784 NH3 2.78 E11 g N 127,8805 P2O5 (35%) 1.14 E12 g 646,3806 Capital, 1984 3.69 E5 $ 81
1981 2.51 E6 $ 678 1979 2.84 E5 $ 99 1975 1.56 E6 $ 936Total emergy ------- 800,627
__________________________________________________________________7 Total yield 2.41 E12 g DAP
5.53 E11 g P5.05 E11 g N
8 Emergy per mass 3.32 E9 sej/g DAP1.45 E10 sej/g P1.59 E10 sej/g N
DAP = Diammonium Phosphate
1. Fuel - 2.6 E6 therms natural gas (IMC-AGRICO, 1995)(2.6 E6 therms)(1.05 E8 J/therm) = 2.74 E14 J2. Electricity - 3.01 E8 kWh (IMC-AGRICO, 1995)(3.01 E8 kWh)(3.6 E6 J/kWh) = 1.08 E15 J3. Labor - 1.86 E6 pers-hrs (IMC-AGRICO, 1995)(1.86 E6 pers-hrs)(2500 kcal/day)(4186 J/kcal)/(8 pers-hrs/day) = 2.43 E12 JTransformity - high school graduate (Odum, 1996)4. Ammonia - 3.37 E11 g (IMC-AGRICO, 1995; Shreve, 1945)(3.37 E11 g)(14g N/17g NH3) = 2.78 E11 g N5. P2O5 - 35% - 1.14 E12 g (IMC-AGRICO, 1995; Shreve, 1945)6. Capital = (plant capital costs)/(life expectancy)/(% of capacity dedicated to DAP)7. Yield - 2.4 E9 kg (NH4)2(HPO4)Ratio P: 31 gmol P/ 132 gmol DAP; Ratio N: 28 gmol N/ 132 gmol DAP8. Total emergy divided by yield mass

33
Table 25Transformities and Emergy per Mass Ratios
__________________________________________________________________Transformity Emergy per mass Emergy Table3
Commodity E4 sej/J E8 sej/g #__________________________________________________________________Table ready foods 1Bell pepper 77 164 3Cabbage 27 52 6Corn, sweet 13 25 7Cucumbers 7 13 8Eggs 440 1070 4Green beans 120 243 9Lettuce 85 196 10Oranges 11 19 5Peanuts 92 297 11Pecans 43 123 22Potato 18 28 12Tomatoes 86 160 13Watermelon 4 7 14Unprocessed foods 2Alligator 1430 3790 1Beef 86 485 2Corn, grain 74 145 15Milk 129 337 16Oats 22 44 17Soybeans 40 99 18Sugarcane 2 4 19Non-food ItemsCotton 136 231 20Sod/hay (Bahia grass) 5 9 21__________________________________________________________________1 Products not requiring processing prior to sale2 Dry weight of edible product; no processing energy is included
3 Emergy evaluation table in Section 1

34
Table 26
Empower Densities1
__________________________________________________________________
Commodity E15 sej/ha/yr Commodity E15 sej/ha/yr__________________________________________________________________Table ready foods Unprocessed foodsBell pepper 30 Alligator 1,029
2
Cabbage 12 5103
Corn, sweet 13 Beef, range fed 9Cucumbers 18 Corn,grain 13Eggs 398,652
2Milk 1,937
2
2,2603
523
Green beans 14 Oats 6Lettuce 16 Soybeans 4Oranges 9 Sugarcane 9Peanuts 9Pecans 10Potato 15 Non-food ItemsTomatoes 39 Cotton 17Watermelon 13 Sod/hay 3__________________________________________________________________1 Emergy yield per hectare from Tables 1-222 For hen houses or feed lot without buffer zone3 For entire egg farm or dairy and alligator operation with estimated buffer zones.
Table 27Emergy per Mass Ratios for Florida Fertilizers1
__________________________________________________________________
Fertilizer Emergy per Mass Emergy per Mass P Emergy per Mass N sej/g total sej/g P sej/g N
__________________________________________________________________
DAP 3.32 E9 1.45 E10 1.59 E10P2O5 5.67 E9 1.30 E10 -------__________________________________________________________________DAP = Diammonium Phosphate1 Complete emergy evaluations presented in Tables 23 and 24, Section 2.
35
Acknowledgement
The author wishes to gratefully acknowledge Sergio Ulgiati and CharlotteLagerberg for information and advice on the initial analysis, and to thank H.T.Odum, M.T. Brown and one anonymous reviewer for comments. Special thanksto J. Breeze for document set-up and to students of M.T. Brown for proofing.
Literature Cited
Austic, R. and M. Nesheim. 1990. Poultry Production. Lea and Febiger, Philadelphia,PA.
Brandt-Williams S. 1999. Evaluation of Watershed Control of Two Central FloridaLakes: Newnans Lake and Lake Weir. Ph.D. Dissertation, EnvironmentalEngineering Sciences, Univ. of Florida, Gainesville.
Brown, M.T. and J. Arding. 1991. Transformities Working Paper. Center for Wet-lands, Univ. of Florida, Gainesville.
Buchanan, William, 2000. Statement of Legislative Director for the American Councilfor Immigration Reform Before the Subcommittee on Immigration and Claims ofthe Judiciary Committee United States House of Representatives June 15, 2000.
Cotterill, O.J., W. Marion and E.C. Naber. 1977. A nutrient reevaluation of shell egg.Poultry Science 56:1927.
Douglas, C. 1992. A Guide to Commercial Poultry Production in Florida. RF-AA075,Florida Cooperative Extension Service, IFAS, Gainesville, Florida.
Farm Labor Survey (FLS), 2000. Quarterly reports. U.S. Department of Agricultureand National Agriculture Statistics Survey, February/May/August/November2000.
Fluck, R. C., B. S. Panesar, and C. D. Baird. 1992b. Florida Agricultural EnergyConsumption Model. Final Report to the Florida Energy Extension Service, Inst.of Food and Agricultural Sciences, Univ. of Florida, Gainesville.
Gale, J., D. Line, D. Osmond, S. Coffey, J. Spooner, J. Arnold, T. Hoban and R.Wimberly, 1993. Evaluation of the Experimental Rural Clean Water Program.USEPA publication # EPA-841-R-93-005.
Griffin, M.L., D.B. Beasley, and J.J. Fletcher. 1988. Estimating soil loss on topo-graphically nonuniform field and farm units. J. of Soil and Water Conservation43:326-331.
Hall, G.D. 2000. Pecan food potential in prehistoric North America. Economic Botany54(1):103-112.
Harris, J. and F. Benedict, 1919. A Biometric Study of Basal Metabolism in Man.Publication # 279, Carnegie Institution of Washington, Washington.
IMC-AGRICO. 1995. IMC-AGRICO Annual Report 1995. IMC Global, Northbrook,IL.
Lambert, D. 1999. A Spatial Emergy Model for Alachua County, Florida. Ph.D.Dissertation, Urban and Regional Planning, Univ. of Florida, Gainesville.
Lourds, L.C. 1996. Personal communication with IFAS Agricultural Extension Agent,Gainesville, FL.
Masser, M. P. 1993. Alligator Production – Grow-out and Harvest. SRAC Publication232, Southern Regional Aquaculture Center, Stoneville, Mississippi.
Moore, I.D. and J.P. Wilson. 1992. Length-slope factors for the revised Universal Soil

36
Loss Equation: simplified method of estimation. J. of Soil and Water Conserva-tion 47:423-428.
NASA EOSWEB, 2002. http://eosweb.larc.nasa.gov/cgi-bin/sse/sse.cgiNational Agricultural Workers Survey (NAWS), 2000. Research Report #8 of the
National Agricultural Workers Survey (NAWS), Department of Labor, March2000.
Odum, H.T. 1996. Environmental Accounting, Emergy and Decision Making. Wiley,NY.
Odum, H.T. 2000. Folio #2: Emergy of global Processes. Handbook of EmergyEvaluation: A compendium of data for emergy computation issued in a series offolios. Center for Environmental Policy, Univ. of Florida, Gainesville.
Odum, H.T., M.T. Brown, and S. L. Brandt-Williams. 2000. Folio #1: Introduction andglobal budget. Handbook of Emergy Evaluation: A compendium of data foremergy computation issued in a series of folios. Center for Environmental Policy,Univ. of Florida, Gainesville.
Odum, H.T., E.C. Odum and M. Blissett. 1987. Ecology and Economy: “Emergy”Analysis and Public Policy in Texas. Policy Research Project Report #78.Lyndon B. Johnson School of Public Affairs, Univ. of Texas, Austin.
Paul, A. and D. Southgate. 1978. McCance and Widdowson’s The Com-position ofFoods. Elsevier/North-Holland Biomedical Press, London, U.K.
Pierce, A. (Ed.) 1995. Florida Statistical Abstract. Univ. Press of Florida, Gainesville,FL.
Pimentel, D., C. Harvey, P. Resosudarmo, K. Sinclair, D. Kurz, M. McNair, S. Crist, L.Shprotz, L. Fitton, R. Saffouri and R. Blair. 1995. Environmental and economiccosts of soil erosion and conservation benefits. Science 267: 117-1121.
Shreve, R.N. 1945. The Chemical Process Industries. McGraw Hill, NY.Sibbett, G., K. Klonsky and P. Livingston. 1998. Sample costs to establish a pecan
orchard and produce pecans. University of California Cooperative Extension,Department of Agriculture and Resource Economics.
Smajstrla, A.G. 1990. Agricultural Field Scale Irrigation Requirements SimulationModel (AFSIRS) Vol. 5.5. Dept. of Agricultural Engineering, Inst. of Food andAgricultural Sciences (IFAS), Univ. of Florida, Gainesville.
Statens Livsmedelsverk (Swedish National Food Administration), 1988.Livsmedelstabell - Energi och näringsämnen. Statens Livsmedelsverk, Uppsala,
William, R.D. 1984. Growing Quality Vegetables in Florida. Florida CooperativeExtension Service Circular 473. Inst. of Food and Agricultural Sciences (IFAS),Univ. of Florida, Gainesville.

37Appendix A
These diagrams illustrate the determination of the transformity for annual energyflows to migrant labor.
The following assumptions were made in this evaluation:1) The majority of Florida farm labor is a mix of legal and illegal immigrantsreceiving about 60% of average legal wages of $6500/yr (derived fromBuchanan 2000, FLS 2000 and NWAS 2000).2) Work, play and sleep are coproduct energies, not splits, all being necessary forthe health of an individual human, and being, on average, equal 8-hour segments.

383) Basal metabolism was calculated for a male, 30 years of age, 150 pounds(Harris and Benedict 1919).4) Values for work were calculated using 7 hours of heavy labor and 1 hour oflow level activity, play was 1 hour of moderately intense sport and 7 hours oflow intensity activity, while sleep requires 45 calories per hour (Harris andBenedict 1919).5) The amount of American life experience gained each year is roughly equiva-lent to the wages earned.6) 90% of a migrant farmer’s diet will be carbohydrates. This was used todetermine the appropriate transformity for food inputs.7) The emergy to dollar ratio was approximately $1.1 E12 sej/$ for year 2002.
References are included in the literature list on pgs. 35-36.

39
Index of Emergy Evaluation in Folio #4
Alligator, 5, 33, 34
Bahia grass, 21, 33, 34
Beef, 7, 33, 34
Bell pepper, 9, 33, 34
Cabbage, 13, 33, 34
Corn, grain, 22, 33, 34
Corn, sweet, 14, 33, 34
Cotton, 27, 33, 34
Cucumbers, 15, 33, 34
Eggs, 11, 33, 34
Fertilizer, 31, 32, 34 Diammonium phosphate (DAP), 32, 34 Phosphorous acid P2O5, 31, 34
Green beans, 16, 33, 34
Lettuce, 17, 33, 34
Milk, 23, 33, 34
Migrant farm labor, 37
Oats, 24, 33, 34
Oranges, 12, 33, 34
Pasture, see Bahia grass
Peanuts, 18, 33, 34
Pecans, 29, 33, 34
Potatoes, 19, 33, 34
Sod/hay, see Bahia grass
Soybeans, 25, 33, 34
Sugarcane, 26, 33, 34
Tomatoes, 20, 33, 34
Watermelon, 21, 33, 34

40Notes