ho homestake mining company jesse of californiar. toepfer
TRANSCRIPT
=E) Homestake Mining Company of CaliforniaHO _I__AE Jesse R. Toepfer
Grants Project Closure Manager
20 November 2014
ATTN Mr. David L. MayersonMining Environmental Compliance SectionGround Water Quality BureauNew Mexico Environment DepartmentP.O. Box 5469Santa Fe, New Mexico 87502-5469
RE: Homestake's Responses to NMED's Comments Received 22 September 2014 Pertaining toHomestake's TPP Alluvial Pilot Testing Summary Report dated 3 July 2014
Mr. Mayerson:
Homestake Mining Company of California (HMC) received from the New Mexico Environment Department(NMED) comments in a letter dated 22 September 2014, entitled Homestake Mining Company ofCalifornia millsite/DP-200 - Comments from NMED's review of "Responses to NMED commentsregarding Homestake's November 2013 'Update on treatment activities"' (August 21, 2014) and "TPP[Tripolyphosphate] alluvial pilot testing summary report" (July 3, 204).
Enclosed with this letter you will find HMC's responses to NMED's comments in the aforementioned letter.NMED's 22 September letter and comments are also herein enclosed.
On behalf of Homestake, I hope this information is helpful to your department and will be of value to youduring the review process. Please feel free to contact me directly at 505.290.3067 if you have anyquestions or comments pertaining to this material.
Respectfully,
Jesse R. ToepferClosure ManagerHOMESTAKE MINING COMPANY OF CALIFORNIA
Copy To:
Mr. Jack Parrott, US Nuclear Regulatory Commission - Rockville, MarylandMr. Sai Appaji, US Environmental Protection Agency, Region 6 - Dallas, TexasMr. Wayne Canon, New Mexico Office of the State Engineer - Albuquerque, New MexicoMs. Deborah Barr, US Department of Energy, Office of Legacy Management - Grand Junction, ColoradoMr. David Shafer, US Department of Energy, Office of Legacy Management - Westminster, ColoradoMr. Bill Ferdinand, Barrick Gold - Salt Lake City, UtahMr. Patrick Malone, Barrick Gold - Salt Lake City, UtahMr. George Hoffman, Hydro Engineering - Casper, WyomingMr. Phil DeDycker, ARCADIS U.S., Inc. - Denver, Colorado
hMs
Homestake Mining Company P.O. Box 98, Grants, NM 87020 Tele: (505) 287-4456 Fax: (505) 287-9289
HOMESTAKE MINING COMPANY OF CALIFORNIA
Grants Reclamation Project
Homestake's Responses to NMED's Comments Received 22September 2014 Pertaining to Homestake's TPP Alluvial Pilot
Testing Summary Report Dated 3 July 2014
Submitted On:20 November 2014
Submitted To:New Mexico Environment Department
Submitted By:Homestake Mining Company of California

Responses to NMED Comments Received Regarding the TPP Alluvial Pilot Testing Summary Report 20 November 2014
Comment Page # Quoted Text NMED Comment ResponseNumber __ [_ _ _ _ __ _ _ __ _
"Responses to NMED comments regarding Homestake's November 2013 'Update on treatment activities"' (August 21, 2014)
1 Comment This difference in Another important consideration for the This is correct; TPP reacts with water (hydrolysis) to formI retardation and achievable development of a "barrier" also should include orthophosphate (the form of phosphorus that reacts with
distribution is an important amount and rate of orthophosphate formation to uranium (and calcium) to form low-solubility uranium-consideration for continued precipitate sufficient uranium to achieve the phosphate minerals (and calcium phosphate (apatite)). Theapplication of the uranium concentration standard considering hydrolysis reaction occurs over a period of days, aftertechnology-the design ... of a continued influx of background uranium injection the TPP is transported downgradient and reacts (andtransect of injection points concentrations. sorbs) along the groundwater flow-path. One way to ensureto create a "barrier" will that a discrete barrier is emplaced is to inject and extractensure complete lateral groundwater, recirculating the TPP across a targeted treatmentdistribution between the zone. This approach will be evaluated in the next phase of thepoints. alluvial pilot testing.
2 Comment The uranium-phosphate On page 20 of the Report, HMC stated that it Low-solubility uranium minerals have been documented to2 precipitates that form during was unable to directly identify the uranium and form in laboratory testing performed by the US Department of
TPP injection have very low calcium phosphate mineral phases during soil Energy (DOE) at Pacific Northwest National Laboratorysolubility under ambient coring and analysis. Therefore, please explain (PNNL); Dawn Wellman (cited in the quoted text) is one ofaquifer conditions (Wellman the basis for this statement. the lead researchers for this work.et al., 2005).
Since the mineral phases could not be identified Although these minerals were not directly identified in soilin this test phase, please explain how HMC can coring, this does not mean that they did not form, but rather isassure the long-term efficacy of any proposed due to the difficulty in sampling and recovery of soilbarrier containing these minerals. Uranium treatment efficacy is the
best means of demonstrating that these phases have formed.
"TPP alluvial pilot testing summary report" (July 3, 2ý014)
3 6 These uranium minerals As previously noted, HMC has stated that the Attachment 1 to this comment response letter includes ahave very low solubility mineral phases that are presumed to have formed stability diagram for uranium phosphate minerals as providedunder ambient aquifer could not be identified during analysis. in Jerden et al., 2003. Note that variations in ambientconditions... temperature and pressure will not significantly affect the
Please present stability diagrams from stability fields for the various forms of uranium shown in theauthoritative geochemical references to illustrate diagram. The most important factors that affect uraniumthis stability under varying conditions of Eh, pH, phosphate mineral stability are pH and phosphatetemperature and pressure that would be expected concentration.in the natural environment.
Homestake Mining Company of California2

Responses to NMED Comments Received Regarding the TPP Alluvial Pilot Testing Summary Report 20 November 2014
Comment Page # Quoted Text NMED Comment ResponseNumber
4 7-10 Not applicable Evaluation of tracer breakthrough and washout The local gradient within the S Area is dominated by theshould have included characterization of the hydraulic barrier; the closest reversal well to the S Area is welllocal ground water gradients within each test SO, and the closest re-injection well is WRI 8. Groundwaterplot prior to the inception of tracer injection, flow in the S Area is generally to the southwest. In the X Area,
the hydraulic gradient is relatively flat, with groundwater flowalso to the southwest.
5 11 Water from nearby Please address to what degree the use of water Use of water with uranium concentrations in excess of theextraction wells.. .was with uranium concentrations in excess of the alluvial site standard did not, and will not, adversely affectutilized to mix the injection alluvial aquifer site standard as injectate may process effectiveness. This water was amended with TPP andsolution. Measured uranium adversely impact process effectiveness. CaCI2 reagents and then injected into the ground; treatmentconcentrations in the occurred in the ground and the amendment was adequate toinjectate solution.. .are treat uranium in the extracted water and groundwater. Thiswithin the range observed in approach will be used for the next phase of the pilot test,other wells proximal to the where water will be extracted, amended, and then re-injected.pilot test areas...
6 12 Following the injections [in Please explain how the quantities of post- The quantities of water used to "flush" the injection well tothe S area], 1,200 gallons of injectate solution water were determined for minimize potential for fouling due to mineral precipitation atwater from S4 was injected each of the test plot areas. the well were based upon the volume of the well bore (belowto minimize precipitate the water table) as well as the sand pack and the amount ofbuild-up and potential Please explain if any difference in precipitate fluid that the aquifer could accept. In the S area, the largerfouling in the injection build-up and fouling was noted between the test volume was used due to the length of the screened-interval (15well.. .Following the plot areas S and X resulting from the different to 20 ft), and ease of fluid injection in this area, whereas in theinjections [in the X area] water sources that were used after injectate. X area, the smaller volume was used to the shorter screened-100 gallons of reverse interval (10 ft), smaller targeted treatment area, and lowerosmosis water was injected injectability.to minimize precipitatebuild-up and potential There was no difference noted in fouling or precipitate build-fouling in the injection well. up as the injection wells maintained their capacity to accept
injection fluids during the entire course of the pilot test.
Homestake Mining Company of California
3
Responses to NMED Comments Received Regarding the TPP Alluvial Pilot Testing Summary Report 20 November 2014
Comment Page # Quoted Text NMED Comment ResponseNumber
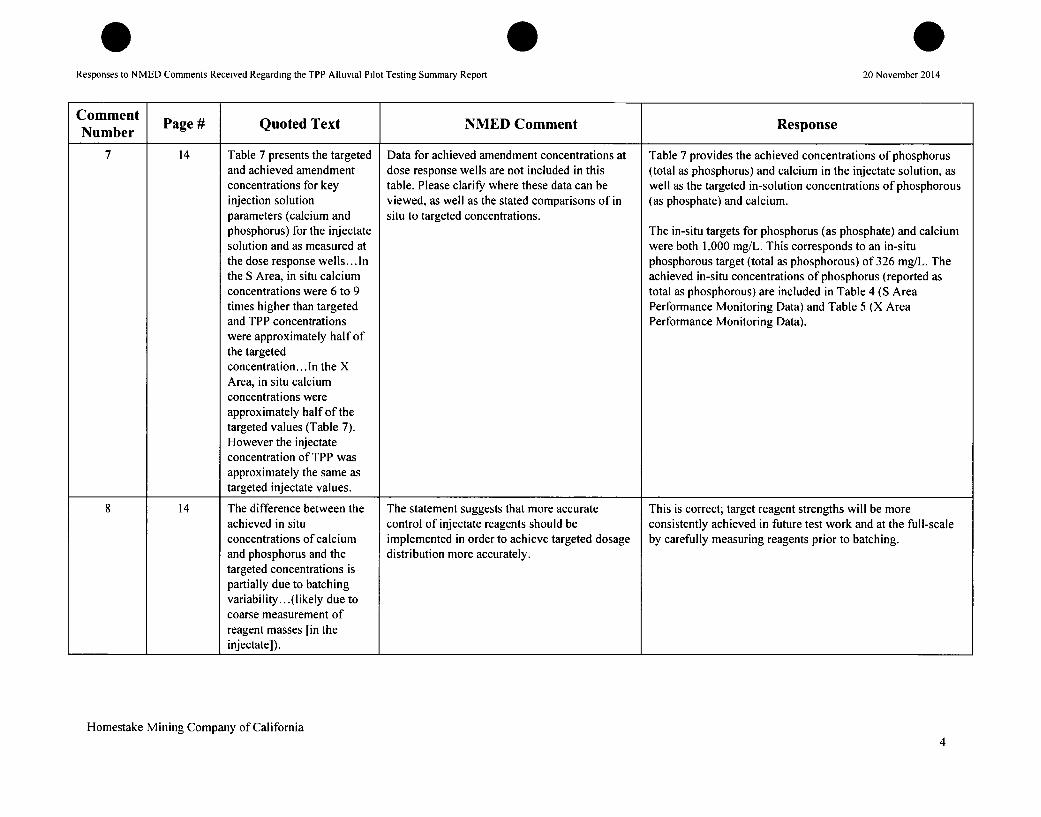
7 14 Table 7 presents the targeted Data for achieved amendment concentrations at Table 7 provides the achieved concentrations of phosphorusand achieved amendment dose response wells are not included in this (total as phosphorus) and calcium in the injectate solution, asconcentrations for key table. Please clarify where these data can be well as the targeted in-solution concentrations of phosphorousinjection solution viewed, as well as the stated comparisons of in (as phosphate) and calcium.parameters (calcium and situ to targeted concentrations.phosphorus) for the injectate The in-situ targets for phosphorus (as phosphate) and calciumsolution and as measured at were both 1,000 mg/L. This corresponds to an in-situthe dose response wells... In phosphorous target (total as phosphorous) of 326 mg/L. Thethe S Area, in situ calcium achieved in-situ concentrations of phosphorus (reported asconcentrations were 6 to 9 total as phosphorous) are included in Table 4 (S Areatimes higher than targeted Performance Monitoring Data) and Table 5 (X Areaand TPP concentrations Performance Monitoring Data).were approximately half ofthe targetedconcentration.. .In the XArea, in situ calciumconcentrations wereapproximately half of thetargeted values (Table 7).However the injectateconcentration of TPP wasapproximately the same astargeted injectate values.
8 14 The difference between the The statement suggests that more accurate This is correct; target reagent strengths will be moreachieved in situ control of injectate reagents should be consistently achieved in future test work and at the full-scaleconcentrations of calcium implemented in order to achieve targeted dosage by carefully measuring reagents prior to batching.and phosphorus and the distribution more accurately.targeted concentrations ispartially due to batchingvariability.. .(likely due tocoarse measurement ofreagent masses [in theinjectate]).
Homestake Mining Company of California4
Responses to NMED Comments Received Regarding the TPP Alluvial Pilot Testing Summary Report 20 November 2014
Comment Page # Quoted Text NMED Comment ResponseNumber
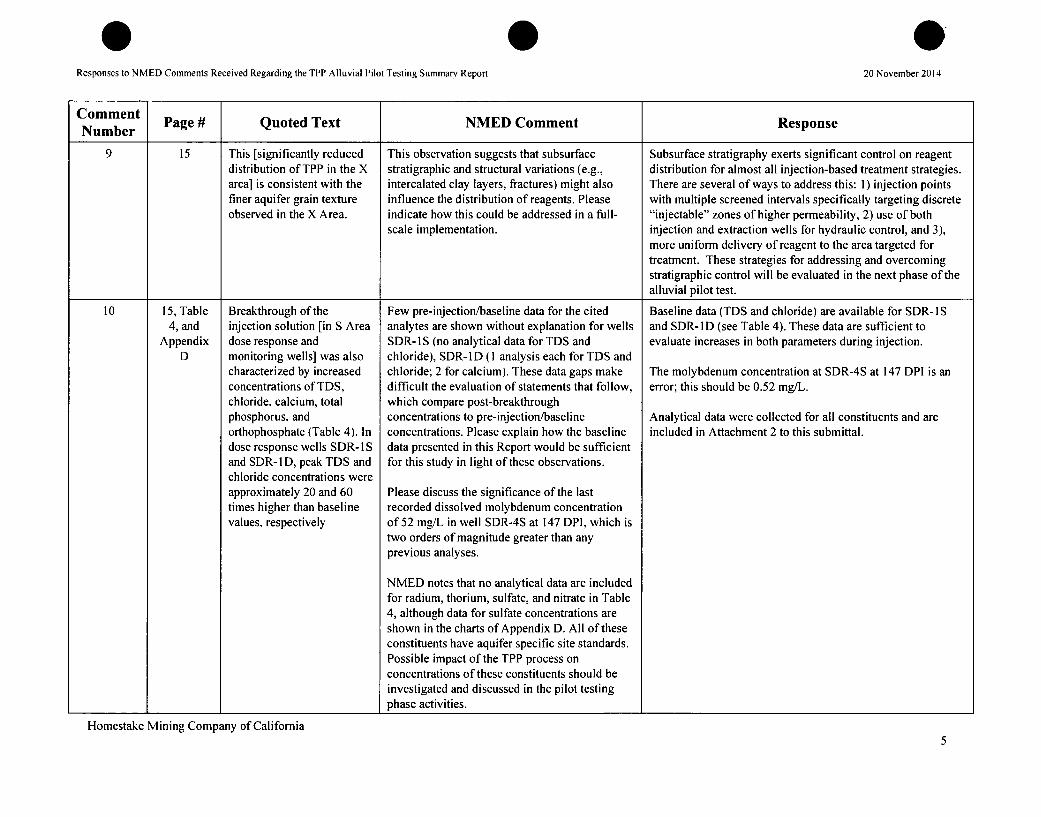
9 15 This [significantly reduced This observation suggests that subsurface Subsurface stratigraphy exerts significant control on reagentdistribution of TPP in the X stratigraphic and structural variations (e.g., distribution for almost all injection-based treatment strategies.area] is consistent with the intercalated clay layers, fractures) might also There are several of ways to address this: 1) injection pointsfiner aquifer grain texture influence the distribution of reagents. Please with multiple screened intervals specifically targeting discreteobserved in the X Area. indicate how this could be addressed in a full- "injectable" zones of higher permeability, 2) use of both
scale implementation. injection and extraction wells for hydraulic control, and 3),more uniform delivery of reagent to the area targeted fortreatment. These strategies for addressing and overcomingstratigraphic control will be evaluated in the next phase of thealluvial pilot test.
10 15, Table Breakthrough of the Few pre-injection/baseline data for the cited Baseline data (TDS and chloride) are available for SDR-IS4, and injection solution [in S Area analytes are shown without explanation for wells and SDR-1D (see Table 4). These data are sufficient to
Appendix dose response and SDR-IS (no analytical data for TDS and evaluate increases in both parameters during injection.D monitoring wells] was also chloride), SDR-ID (I analysis each for TDS and
characterized by increased chloride; 2 for calcium). These data gaps make The molybdenum concentration at SDR-4S at 147 DPI is anconcentrations of TDS, difficult the evaluation of statements that follow, error; this should be 0.52 mg/L.chloride, calcium, total which compare post-breakthroughphosphorus, and concentrations to pre-injection/baseline Analytical data were collected for all constituents and areorthophosphate (Table 4). In concentrations. Please explain how the baseline included in Attachment 2 to this submittal.dose response wells SDR-1S data presented in this Report would be sufficientand SDR-ID, peak TDS and for this study in light of these observations.chloride concentrations wereapproximately 20 and 60 Please discuss the significance of the lasttimes higher than baseline recorded dissolved molybdenum concentrationvalues, respectively of 52 mg/L in well SDR-4S at 147 DPI, which is
two orders of magnitude greater than anyprevious analyses.
NMED notes that no analytical data are includedfor radium, thorium, sulfate, and nitrate in Table4, although data for sulfate concentrations areshown in the charts of Appendix D. All of theseconstituents have aquifer specific site standards.Possible impact of the TPP process onconcentrations of these constituents should beinvestigated and discussed in the pilot testingphase activities.
Homestake Mining Company of California5

Responses to NMED Comments Received Regarding the TPP Alluvial Pilot Testing Summary Report 20 November 2014
Comment Page # Quoted Text NMED Comment ResponseNumber
11 16 [Tracer] Washout was slow Please explain the significance, if any, of Tracer washout in the X Area was slower than the S Area duein [X area] dose response observed tracer washout rates with respect to to the lower groundwater flux and aquifer permeability in thiswells.., performance of the TPP process area. However, this slower washout does not negatively affect
performance of the TPP (a longer residence time for the TPPin the area influenced by the injected reagent is beneficial andallows for the treatment zone to be established as TPP ishydrolyzed to orthophosphate). The main challenge, however,with lower permeability is the difficulty in achieving a largedistribution of the injected reagent.
12 16, Table Breakthrough of the As for monitor wells in the S area (see Comment Baseline data are presented for one time period prior to5, and injection solution [within 10 above), few pre-injection/baseline data for injection (70 days pre-injection) for XDR-1, XDR-2, XDR-3
Appendix the X area dose response TDS and chloride are shown without explanation and XDR-4. Although this appears to be a limited data set, it isD wells] was also for wells XDR- 1, XDR-2, XDR-3 and XDR-4 (1 adequate to evaluate changes in TDS and chloride (the
characterized by increased analysis each). These data gaps make difficult changes were marked relative to baseline). In addition, theconcentrations of TDS, the evaluation of statements that follow, which baseline data are consistent with data available for monitoringchloride, and calcium... compare post-breakthrough concentrations to wells in this area that are routinely monitored and reported in
pre-injection/baseline concentrations. Please the annual groundwater monitoring report.explain how the baseline data presented in thisReport we be sufficient for this study in light of Analytical data were collected for all constituents are includedthese observations, in Attachment 2 to this submittal.
As stated previously, the pilot testing processshould include all analytes for which aquifer-specific site standards are established.
Homestake Mining Company of California6

0 0Responses to NMED Comments Received Regarding the TPP Alluvial Pilot Testing Summary Report 20 November 2014
Comment Page # Quoted Text NMED Comment ResponseNumber
13 17, Table At SMW-1, the uranium Although uranium concentrations did diminish SMW-I is outside of the direct influence of the TPP injection4, and concentrations decreased to 0.047 mg/L at 15 DPI as stated, NMED notes (outside of the radius of influence of the injection and beyond
Figure 8 from 1.44 mg/L to 0.047 that concentrations immediately rebounded to the dose response wells labeled with the prefix "SDR"). As themg/L (at 15 DPI). The high above the aquifer-specific site standard of 0.16 data show, even outside of the direct influence of the TPPuranium concentration mg/L by 21 DPI, and showed an increasing injection there was notable uranium treatment. The slightdetected at only one point trend through the remainder of data presented. increase in uranium concentrations is likely due to subtlepost-injection (at 20 DPI) in variations in groundwater flow direction (with groundwaterthis well is likely a The referenced high uranium concentrations of bypassing the emplaced treatment zone), as well as diminishedlaboratory error 1.56 is shown on Table 4 to occur at 15 DPI, ability of the phosphate to immobilize uranium. Although
not 20 DPI as stated herein. Please clarify this treatment longevity after just one injection was significant,discrepancy. treatment capacity diminishes over time with continual influx
of uranium into the treatment area. Continued sustainedtreatment capacity will be evaluated in the second phase of thealluvial pilot test.
The reference to the concentration of uranium (1.56 mg/L)
noted at 20 DPI is an error and this should be 15 DPI, asindicated correctly in Table 4.
14 17 Treatment trends at SMW- Please explain the significance of this SMW-3S and SMW-4S are further downgradient of the3S and SMW-4S are observation, injection well, even further than SMW-I (discussed above). Atsomewhat irregular; this greater distance downgradient, there is greater possibilityhowever, these wells are that subtle changes in flow direction that results indowngradient from the groundwater bypassing the injection wells will be noted asinjection wells.., concentration fluctuations at SMW-3S and SMW-4S.
The next phase of pilot testing will establish a larger,contiguous barrier such that changes in groundwater flowdirection will not result in perceived degradation in treatmentperformance.
Homestake Mining Company of California7

0Responses to NMED Comments Received Regarding the TPP Alluvial Pilot Testing Summary Report 20 November 2014
Comment Page # Quoted Text NMED Comment ResponseNumber
15 17, Table Uranium treatment remained NMED notes that uranium concentrations in It is important to note that the total volume of TPP injected4, and high after the injection SIW-D, SDR-IS, SMW-I and possibly SMW- into the injection wells in the S Area was limited (-6,700
Figure 8 solution had washed out... 4S appear to show rapid rebound from the lowest gallons injected into each well (shallow and deep injectionuranium concentrations achieved to end at wells), and the achieved radius of influence was approximatelyconcentrations near or above the aquifer-specific 10 feet. A treatment zone was established over a very limitedsite standard of 0.16 mg/L by the end of the data extent of the aquifer, purposefully at a small scale to evaluatepresented. Also, as HMC notes, baseline treatment efficacy. Even at this small scale, treatmenturanium concentrations in these wells ranged performance was good, and treatment was sustained for anfrom just above the referenced standard to extended period of time (out to 147 days post injection atapproximately one order of magnitude above the SDR-IS). This well (SDR-IS) is within the achieved radius ofstandard. Therefore it would appear that long- influence. The other wells are outside of the direct influence ofterm treatment efficacy was limited in this area. the injection, and as discussed above, slight increasing trends
at downgradient monitoring wells are likely due to changes ingroundwater flow direction and gradual loss of treatmentcapacity after just one limited injection.
16 18 ... the uranium concentration NMED notes that uranium concentrations had As discussed in the report, TPP reagent distribution wasdecreased from 5.25 mg/L to risen above baseline levels at the conclusion of limited in the X Area because of the lower permeability of the2.30 mg/L (at 15 DPI) at the data presented, and the lowest uranium aquifer in this area. In addition, due to the nature of the soil inXDR-I... concentration achieved in this well did not meet this area (finer-grained silts and clays), the TPP sorbs more
the applicable standard of 0.16 mg/L strongly onto the aquifer soil (TPP will sorb less to sands).Even with limited distribution, however, treatment efficacywas noted and was sustained for a period of time. Note that thepilot test involved only one injection, and with additionalinjections it is likely that reduction in uranium concentrationswill increase. At this full-scale the treatment of uranium in anarea with lower permeability, and greater ability to sorb andretard the injected TPP, would be treated over multipleinjections, and uranium mass-flux through the treatment zonewould be reduced significantly.
Homestake Mining Company of California8

Responses to NMED Comments Received Regarding the TPP Alluvial Pilot Testing Summary Report 20 November 2-014
Comment Page # Quoted Text NMED Comment ResponseNumber
17 19, Table These data demonstrate that Uranium concentrations at or below the aquifer- The lithology in the X Area was challenging due to the nature5, and the TPP amendment specific site standard of 0.16 mg/L were of the aquifer soil, consisting of a larger proportion of fine-
Appendix immobilized uranium in the achieved at only two wells in the X Area- grained material as compared to the S Area. The lowerD X Area, but overall injection well XIW and XDR-1. Post-treatment permeability in the X Area resulted in a limited volume of the
treatment efficiency was uranium concentrations that were achieved at aquifer around the injection well that was influenced by thesomewhat lower than XDR-2 appear to be steady at the conclusion of TPP injection, and likely significant movement of reagentobserved in the S Area. the data presented, but at concentrations through preferential flow paths, limiting the establishment of a
approximately twice the applicable standard. cohesive treatment zone.Analytical data from other X Area wellsindicate no, or at best, transient reduction to At the full-scale, lithologic variability will be addressed byuranium concentrations. In contrast to baseline screening multiple intervals with short-screens to targeturanium concentrations in S Area wells, discrete intervals (where appropriate and depending upon wellbaseline uranium concentrations in the X Area logs during well installation) and also through the use ofwere much higher, ranging from 4.63 mg/L in extraction wells coupled with injection wells to recirculateXIW at -70 DPI to 9.33 mg/L in XMW-4 at -I I water through the treatment zone to overcome this variabilityDPI. and achieve expanded distribution of injected reagent.
Please address how the design of a full-scaletreatment system can account for both lithologicvariability of pre-treatment baseline uraniumconcentrations.
Homestake Mining Company of California9
0Responses to NMED Comments Received Regarding the TPP Alluvial Pilot Testing Summary Report 20 November 2014
Comment Page # Quoted Text NMED Comment ResponseNumber
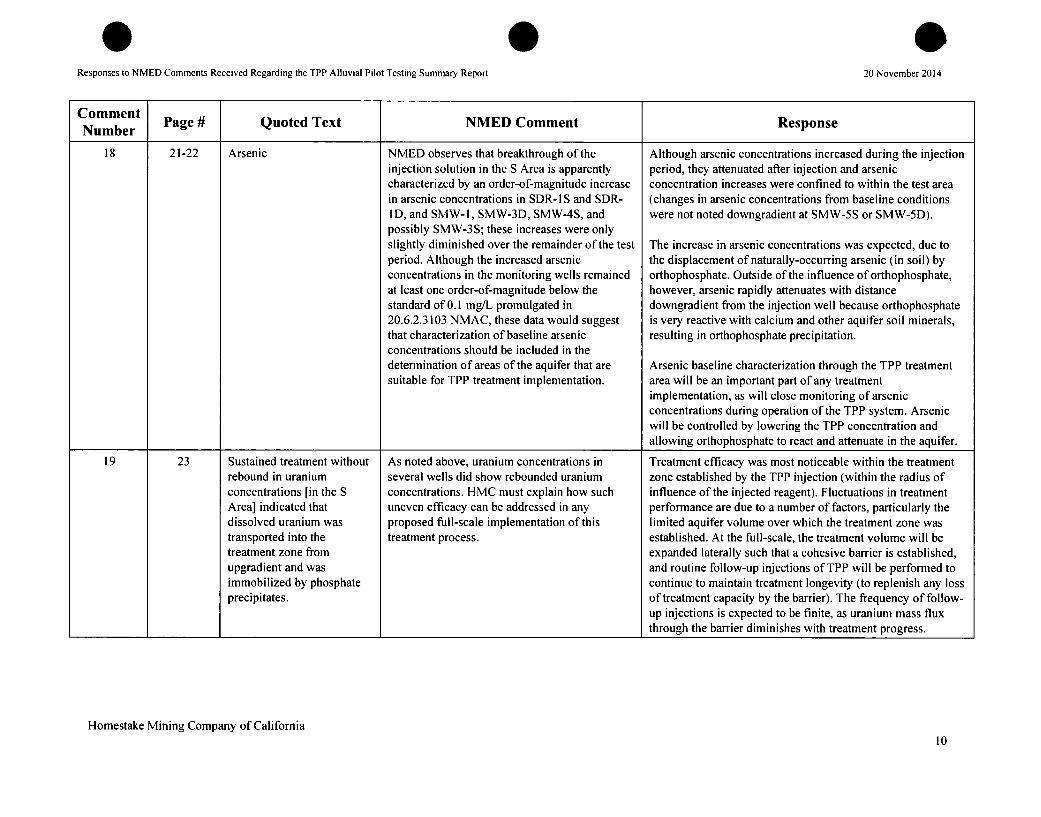
18 21-22 Arsenic NMED observes that breakthrough of the Although arsenic concentrations increased during the injectioninjection solution in the S Area is apparently period, they attenuated after injection and arseniccharacterized by an order-of-magnitude increase concentration increases were confined to within the test areain arsenic concentrations in SDR-IS and SDR- (changes in arsenic concentrations from baseline conditionsI D, and SMW-I, SMW-3D, SMW-4S, and were not noted downgradient at SMW-5S or SMW-5D).possibly SMW-3S; these increases were onlyslightly diminished over the remainder of the test The increase in arsenic concentrations was expected, due toperiod. Although the increased arsenic the displacement of naturally-occurring arsenic (in soil) byconcentrations in the monitoring wells remained orthophosphate. Outside of the influence of orthophosphate,at least one order-of-magnitude below the however, arsenic rapidly attenuates with distancestandard of 0.1 mg/L promulgated in downgradient from the injection well because orthophosphate20.6.2.3103 NMAC, these data would suggest is very reactive with calcium and other aquifer soil minerals,that characterization of baseline arsenic resulting in orthophosphate precipitation.concentrations should be included in thedetermination of areas of the aquifer that are Arsenic baseline characterization through the TPP treatmentsuitable for TPP treatment implementation. area will be an important part of any treatment
implementation, as will close monitoring of arsenicconcentrations during operation of the TPP system. Arsenicwill be controlled by lowering the TPP concentration andallowing orthophosphate to react and attenuate in the aquifer.
19 23 Sustained treatment without As noted above, uranium concentrations in Treatment efficacy was most noticeable within the treatmentrebound in uranium several wells did show rebounded uranium zone established by the TPP injection (within the radius ofconcentrations [in the S concentrations. HMC must explain how such influence of the injected reagent). Fluctuations in treatmentArea] indicated that uneven efficacy can be addressed in any performance are due to a number of factors, particularly thedissolved uranium was proposed full-scale implementation of this limited aquifer volume over which the treatment zone wastransported into the treatment process. established. At the full-scale, the treatment volume will betreatment zone from expanded laterally such that a cohesive barrier is established,upgradient and was and routine follow-up injections of TPP will be performed toimmobilized by phosphate continue to maintain treatment longevity (to replenish any lossprecipitates. of treatment capacity by the barrier). The frequency of follow-
up injections is expected to be finite, as uranium mass fluxthrough the barrier diminishes with treatment progress.
Homestake Mining Company of California10

Responses to NMED Comments Received Regarding the TPP Alluvial Pilot Testing Summary Report 20 November 2014
Comment Figure HMC ResponseNumber Number NMED Comment
20 4 Please explain the mechanism of coprecipitation, which is Co-precipitation involves the simultaneous precipitation of uranium withindicated to be applicable to uranium removal through calcium phosphate (apatite). In this process uranium is incorporated intoprecipitation of apatite, but for which uranium is not shown to apatite. Uranium may also sorb to apatite; this is more likely in the treatmentbe included in the chemical formula, zone when uranium has already been removed through formation of autinite
(calcium-uranium-phosphate) or apatite with incorporated uranium. In theAdsorptive bonds, as are indicated to be partially operable for presence of excess phosphate relative to uranium, calcium will react and formuranium removal by apatite, generally are weaker than inclusion apatite. Uranium dissolved in water that enters the treatment zone from
in the crystal matrix of uranyl phosphate precipitates. Please updgradient, can then sorb to apatite. Uranium sorption to apatite is generally
describe what controls the proportion of uranyl phosphate strong and, once sorbed, displacement of uranium may only occur under
formation over the other possible reactive products. extremes in pH. Additional details on the mechanism of uranium sorption andincorporation into apatite are provided in the following references: Fuller,C.C., J.R. Bargar, and J.A. Davis. 2003. Molecular-scale characterization ofuranium sorption by bone apatite materials for a permeable reactive barrierdemonstration. Environmental Science & Technology 37, no. 20: 4642-4649.DOI: 10.1021/es0343959.Fuller, C.C., J.R. Bargar, J.A. Davis, and M.J. Piana. 2002. Mechanisms ofuranium interactions with hydroxyapatite: Implications for groundwaterremediation. Environmental Science & Technology 36, no. 2: 158-165. DOI:10.1021/esO108483.
Homestake Mining Company of California
11

Responses to NMED Comments Received Regarding the TPP Alluvial Pilot Testing Summary Report 20 November 21014
Appendix B
Comment Page # Quoted Text NMED Comment ResponseNumber
21 9 The declines in [uranium] NMED notes that samples that were analyzed by Uranium removal from groundwater within the area targetedconcentration [in ground scanning electron microscopy and energy by the TPP injection occurred through precipitation reactionswater] were attributed to dispersive X-ray spectroscopy "did not show with orthophosphate, as described above. The inability touranium precipitation uranium," although HMC qualifies this directly recover these precipitates from within the treatmentthrough direct reaction with observation with the further notes these zone is not surprising due to the relatively large area oversoluble phosphate to form methodologies focus upon "limited area of a soil which the uranium precipitates within the treatment volume,uranium phosphate, and sample" (p. 8). Still, implementation of this and the very low concentration of resultant uranium in thethrough co-precipitation and remedial technology at full-scale will require aquifer soil after treatment. As discussed in Appendix B, theincorporation into calcium some direct observations about where and in lack of high-concentration zones of uranium precipitates isphosphate.. .While these what forms the uranium will be sequestered beneficial to the overall technology as uranium and phosphatemineral phases were not within the aquifer. minerals can be precipitated without creating significant loss indirectly identified in the soil permeability within the treatment zone.coring and analysis work,this is likely due to their The next phase of pilot testing will involve laboratory columnpresence in limited tests to simulate the aquifer system, with TPP applied to theconcentrations and column along with flowing groundwater recovered from theheterogeneity in distribution test area. After uranium is precipitated within the column,at the micron scale. additional studies will be done to evaluate the uranium
precipitated within the column, including an effort to furthercharacterize and identify the uranium minerals that formthrough TPP application. At the column scale the uraniumprecipitates should be readily identified.
Homestake Mining Company of California12

Responses to NMED Comments Received Regarding the TPP Alluvial Pilot Testing Summary Report 20 November 2014
Appendix C
Comment Page # Quoted Text NMED Comment ResponseNumber
22 5., Figure Uranium concentrations Please address the observation from Figure C-3 As shown in Figure C-3, during the "pull" phase of the push-C-3 during the pull phase were that uranium concentrations show an increasing pull test, additional pore volumes were removed beyond those22 below the baseline trend, ending above the baseline concentration at added during the "push" phase. The additional pore volumes
concentration of the conclusion of the data presented that were recovered likely were from the area of the aquifer0.05...mg/L, dropping to as outside of the treatment zone, resulting in an increase inlow as 0.038 mg/L... uranium concentrations at the conclusion of the test.
Homestake Mining Company of California13

Homestake's Responses to NMED's Comments Received 22 September 2014 Pertainingto Homestake's TPP Alluvial Pilot Testing Summary Report dated 3 July 2014
Attachment I - Stability of uranium phosphate minerals
0.7
0.5 75 Q0.65
05Ba K.mreta-autuinite Uaohnr • -2.0 . (Ba-u(V1)-Po,) -..
0.4 "" 0 , 0/
z40.3:Q
LL 0.25AC"
0 ..
0-.5 0 ,
' Ba meta~~-autunite Uaohn
o
-,1.0 . . .
m -30C5,
M--4.0 0O2( 4-P4
-42.5
0 .5.0 , 4 D,3 4~ 5 6 pH 7 8 9 10
The Eh-pH diagram (a) shows the stability of meta-autinite (barium-uranium-phosphate) acrossredox potential (Eh) and pH. This form of meta-autinite is present in the Coles Hill uranium oredeposit in Virginia, and is similar to calcium-uranium-phosphate (in this case barium replacescalcium). The stability of this uranium mineral phase extends to pH -8 when phosphate ispresent in excess relative to bicarbonate (as shown in diagram (b)). In the case of the

tripolyphosphate (TPP) alternative groundwater restoration strategy for the Grants ReclamationProject, this condition (excess phosphate relative to carbonate to promote formation of autiniteminerals) is brought about through the addition of TPP to groundwater. The Coles Hill uraniumdeposit has a large component of the ore that is phosphate-based; this demonstrates thestability of the uranium phosphate minerals over geologic time. Source: Jerden, J.L., and Sinha,A.K. 2003. Phosphate based immobilization of uranium in an oxidizing bedrock aquifer. AppliedGeochemistry 18: 823-843. Additional information on the solubility product of autinite and uranylhydrogen phosphate is provided in Lewis-Gorman, D., Shvareva, T., Kubato, K., Burns, P.C.,Wellman, D.M., McNamara, B., Szymanowski, J.E.S., Navrotsky, A., and Fein, J.B. 2009.Thermodynamic properties of autinie, uranyl hydrogen phosphate, and uranyl orthophosphatefrom solubility and calorimetric measurements. Environmental Science and Technology 43:7416-7422.

WHomestake's Responses to NMED's Comments Received 22 September 2014 Pertaining toHomestake's TPP Alluvial Pilot Testing Summary Report dated 3 July 2014
Attachment 2 - Analytical data for all analytes monitored during the TPP alluvial pilot test
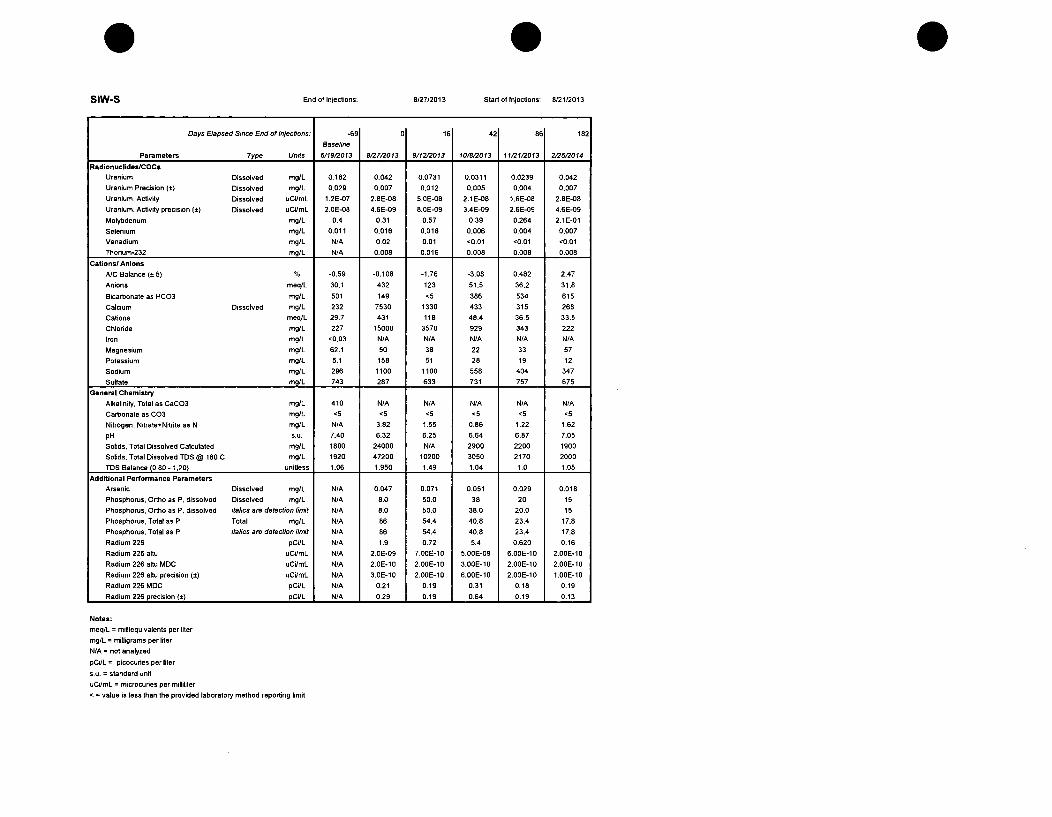
0 08/27/2013 Start of Injections: 8/21/2013Slw-S End of Injections:
Days Elapsed Since End of Injections: -69 0 161 42 86 182
BaselineParameters Type Units 61190013 81,72013 912013 10/8/2013 11/21/2013 212512014
RadionuclideslCOCs
Uranium Dissolved mg/L 0.182 0.042 0.0731 0.0311 0.0239 0.042
Uranium Precision (o) Dissolved mg/L 0.029 0.007 0.012 0.005 0.004 0.007
Uranium, Activity Dissolved uCi/mL 1.2E-07 2.8E-08 5.0E-08 2.1E-08 1.6E-08 2.8E-08
Uranium. Activity precision (I) Dissolved uCVmL 2.0E-08 4.6E-09 8.0E-09 3.4E-09 2.6E-09 4.6E-09
Molybdenum mg/L 0.4 0.31 0.57 0.39 0.264 2.1E-01
Selenium mg/L 0.011 0.016 0.018 0.006 0.004 0.007
Vanadium mg/L N/A 0.02 0.01 <0.01 <0.01 <0.01
Thonium-232 mglL N/A 0.008 0.016 0.008 0.008 0.008
Cations/Anions
A/C Balance (± 5) % -0.59 -0.108 -1.76 -3.08 0.482 2.47
Anions meq/L 30.1 432 123 51.5 36.2 31.8
Bicarbonate as HCO3 mg/L 501 149 '5 386 534 615
Calcium Dissolved mg/L 232 7530 1330 433 315 268
Cations meq/L 29.7 431 118 48.4 36.5 33.5
Chloride mgIL 227 15000 3570 929 343 222
Iron mg/L <0.03 N/A N/A N/A N/A N/A
Magnesium mg/L 62.1 50 38 22 33 57
Potassium mg/L 5.1 158 51 28 19 12
Sodium mg/L 296 1100 1100 558 404 347
Sulfate mg/L 743 287 633 731 757 675
General Chemistry
Alkalinity, Total as CaCO3 mg/L 410 N/A N/A N/A N/A N/A
Carbonate as C03 mg/L <5 <5 <5 <5 <5 '5
Nitrogen, Nitrate+Nitrite as N mg/L N/A 3.82 1.55 0.86 1.22 1.62
pH S.0. 7.40 6.32 6.25 6.64 6.87 7.05
Solids, Total Dissolved Calculated mglL 1800 24000 N/A 2900 2200 1900
Solids. Total Dissolved TDS @ 180 C mg/L 1920 47200 10200 3050 2170 2000
TDs Balance (0.80 - 1.20) unidess 1.06 1.950 1.49 1.04 1.0 1.05
Additional Performance Parameters
Arsenic Dissolved mg/L N/A 0.047 0.071 0.051 0.029 0.018
Phosphorus, Ortho as P. dissolved Dissolved mg/L N/A 8.0 50.0 38 20 15
Phosphorus, Ortho as P. dissolved italics are detection limit N/A 8.0 50.0 38.0 20.0 15
Phosphorus, Total as P Total mg/L N/A 86 54.4 40.8 23.4 17.8
Phosphorus, Total as P italics are detection limit N/A 86 54.4 40.8 23.4 17.8
Radium 226 pCi/L N/A 1.9 0.72 5.4 0.620 0.16
Radium 226 altu uCVmL N/A 2.0E-09 7.00E-10 5.00E-09 6.00E-10 2.00E-10
Radium 226 altu MDC uCVmL N/A 2.0E-10 2.00E-10 3.00E-10 2.00E-10 2.00E-10
Radium 226 ahu precision (5) uCC/mL N/A 3.0E-10 2.00E-10 6.00E-10 2.00E-10 1.00E-10
Radium 226 MDC pCi/L N/A 0.21 0.19 0.31 0.18 0.19
Radium 226 precision (±) pCi/L N/A 0.29 0.19 0.64 0.19 0.13
Notes:
meq/L = milliequivalents per liter
mg/L = milligrams per liter
N/A = not analyzed
pCi/L= picocuries per liter
s.u. = standard unit
uCi/mL = microcuries per milliliter
< = value is less than the provided laboratory method reporting limit

0SIW-D End of Injections: 8/27/2013 Start of Injections: 8/21/2013
Days Elapsed Since End of Injections: Base-ine69 0 16 42 11/21/201861 182
Parameters Type Units 6/19/2013 8/27/2013 9/12/2013 0/8/2013 3 2/25/2014
RadionuclideslCOCs
Uranium Dissolved mg/L 0.653 0.114 0.0467 0.081 0.108 0.307
Uranium Precision (5) Dissolved mg/L 0.105 0.018 0.008 0.013 0.017 0.050
Uranium, Activity Dissolved uCi/mL 4.4E-07 7.7E-08 3.2E-08 5.5E-08 7.3E-08 2.1E-07
Uranium, Activity precision (5) Dissolved uCi/mL 7.1E-08 1.2E-08 5.1E-09 8.9E-09 1.2E-08 3.4E-08
Molybdenum mg/L 0.81 0.41 1.17 1.55 1.04 1.02
Selenium mglL 0.028 0.016 0.021 0.020 0.015 0.022
Vanadium mg/L N/A 0.02 0.01 0.02 <0.01 <0.01
Thorium-232 mg/L N/A <0.005 0.025 0.008 <0.005 <0.005
Cations/ Anions
A/C Balance (± 5) % -1.68 -0.430 -1.21 -0.83 0.05 1.89
Anions meq/L 32.4 472 106 76.1 48.9 37.9
Bicarbonate as HCC3 mg/L 494 170 320 416 504 595
Calcium Dissolved mg/L 241 8290 959 615 364 306
Cations meq/L 31.3 468 104 74.8 49.0 39.3
Chloride mg/L 232 16400 3040 1770 793 349
Iron mg/L <0.03 N/A N/A N/A N/A N/A
Magnesium mg/L 63.7 59 93 80 59 59
Potassium . mg/L 5.1 154 31 21 15 12
Sodium mg/L 319 1050 1090 850 588 434
Sulfate mg/L 848 281 651 782 775 803
General Chemistry
Alkalinity, Total as CaCO3 mg/L 405 N/A N/A N/A N/A N/A
Carbonate as C03 mg/L <5 <5 <5 <5 <5 <5
Nitrogen, Nitrate-Nitrite as N mg/L N/A 3.92 1.61 1.26 1.43 1.79
pH s.c. 7.47 68.0 6.51 6.67 6.85 6.98
Solids, Total Dissolved Calculated mg/L 2000 26000 N/A 4400 2900 2300
Solids, Total Dissolved TDS @ 180 C mg/L 2020 48000 8540 4950 2910 2330
TDS Balance (0.80 - 1.20) unitless 1.03 1.830 1.42 1.13 1.01 1.02
Additional Performance Parameters
Arsenic Dissolved mg/L N/A 0.046 0.05 0.085 0.046 0.03
Phosphorus, Ortho as P, dissolved Dissolved mg/L N/A 5.0 17.8 31.0 22 16
Phosphorus, Ortho as P, dissolved italics are detection timit NIA 5 17.8 31 22 16
Phosphorus, Total as P Total mg/L N/A 24.3 26 36.8 28.6 21.2
Phosphorus, Total as P italics are detection irnmit N/A 24.3 26 36.8 28.6 21.2
Radium 226 pCi/L N/A 3.0 1.1 2.7 0.42 0.28
Radium 226 ahu uCi/mL N/A 3.0E-09 1.00E-09 3.00E-09 4.00E-10 3.00E-10
Radium 226 ahu MDC uCVmL N/A 2.0E-10 2.00E-10 2.00E-10 2.00E-10 2.00E-10
Radium 226 altu precision (±) uCi/mL N/A 4.0E-10 2.00E-10 4.00E-10 2.00E-10 1.00E-10
Radium 226 MDC pCi/L N/A 0.24 0.19 0.39 0.19 0.19
Radium 226 precision (5) pCi/L N/A 0.37 0.22 0.22 0.17 0.15
Notes:
meq/L = milliequivalents per liter
mg/L = milligrams per liter
N/A = not analyzed
pCi/L = picocuries per titer
s.u. = standard unit
uC/mL = microcuries per milliliter
< = value is less than the provided laboratory method reporting limit

SDR-1S End of Injections: 8127/2013 Start of Injection: 8/21/2013
Days Elapsed Since End of Injections: -69 -12 -5 -4 0 0 1 8 15 21 28 35 42
BaselineParameters Type Units 611912013 8/1512013 8122/2013 8123/2013 8127/2013 8/27/2013 8/2812013 9/4/2013 9/11/2013 9/1172013 9/24/2013 l01112013 10/8/2013
RadionuclideslCOCs
Uranium Dissolved mg/L 0.74 N/A 0.27 0.270 0.087 0.105 0.116 0.054 0.056 0.0577 0.0696 0.0572 0.063
Uranium Precision (I) Dissolved mg/L 0.119 N/A N/A N/A N/A 0.017 0.019 0.009 0.009 0.00931 0.0112 0.00924 0.0102
Uranium. Activity Dissolved uCi/mL 5.0E-07 N/A N/A N/A N/A 7.1E-08 7.8E-08 3.60E-08 3.80E-08 3.9E-08 4.7E-08 3.90E-08 4.3E-08
Uranium, Activity precision (4) Dissolved uCUmL 8.1E-08 N/A N/A N/A N/A 1.2E-08 1.3E-08 5.90E-09 6.10E-09 6.3E-09 7.6E-09 6.30E-09 6.9E-09
Molybdenum mg/L 0.99 N/A N/A N/A N/A 6.0E-01 6.0E-01 1 1.19 1.01 1.08 0.99 1.05
Selenium mg/L 0.025 N/A N/A N/A N/A 0.016 0.008 0.018 0.022 0.016 0.015 0.013 0.012
Vanadium mglL N/A N/A N/A N/A N/A 0.02 <0.01 0.01 <0.01 0.01 '0.01 <0.01 '0.01
"horium-232 mg/L N/A N/A N/A N/A N/A '0.005 <0.005 <0.005 0.02 0.007 0.008 0.013 <0.005
Cations/ Anions
A/C Balance (I 5) % -1.86 N/A N/A N/A N/A -0.66 -0.53 -1.05 1.32 1.06 0.594 -1.65 -1.72
Anions meq/L 32.0 N/A N/A N/A N/A 386 86.6 134 91.2 91.8 87.4 78.8 71.7
Bicarbonate as HCC3 mg/L 490 N/A N/A N/A N/A 214 392 338 400 390 405 428 444
Calcium Dissolved mg/L 228 N/A N/A N/A 750 6280 1040 1340 840 865 840 663 588
Cations meq/L 30.8 N/A N/A N/A N/A 381 85.7 132 93.6 93.7 88.5 76.3 69.3
Chloride mg/L 235 N/A N/A N/A N/A 13300 2340 4040 2460 2510 2340 1990 1660
Iron mg/L <0.03 N/A N/A N/A N/A N/A N/A N/A N/A N/A N/A N/A N/A
Magnesium mg/L 63.4 N/A N/A N/A N/A 68 66 136 113 117 103 89 81
Potassium mg/L 5.8 N/A N/A N/A N/A 131 28 27 18 18 17 15 14
Sodium mg/L 323 N/A N/A N/A N/A 1340 631 1210 963 930 866 815 758
Sulfate mg/L 826 N/A N/A N/A N/A 372 664 657 659 - 633 648 679 745
General Chemistry
Alkalinity, Total as CaCO3 mg/L 401 N/A N/A N/A N/A N/A N/A N/A N/A N/A N/A N/A N/A
Carbonate as C03 mglL '5 N/A N/A N/A N/A <5 v5 <5 <5 <5 <5 <5 <5
Nitrogen, Nitrate+Nitfite as N mg/L N/A N/A N/A N/A N/A 3.17 1.27 1.51 1.36 1.47 1.33 1.22 1.24
pH s.u. 7.35 N/A N/A N/A N/A 6.70 7.17 6.68 6.83 6.76 6.77 6.87 6.86
Solids, Total Dissolved Calculated mg/L 1900 N/A N/A N/A NIA 22000 5000 7600 5200 5300 5000 4500 4100
Solids, Total Dissolved TDS @ 180 C mg/L 1970 N/A N/A N/A N/A 40700 7640 11700 7200 6560 6050 5310 4780
lOS Balance (0.80 - 1.20) unitless 1.02 N/A N/A N/A N/A 1.89 1.54 1.53 1.37 1.23 1.21 1.19 1.16
Additional Performance Parameters
Arsenic Total mg/L N/A 0.0022 NIA N/A N/A N/A N/A N/A N/A N/A N/A N/A N/A
Arsenic Dissolved mg/L N/A N/A 0.0058 0.0047 0.0079 0.036 0.012 0.039 0.052 0.047 0.055 0.059 0.058
Phosphorus, Ortho as P, dissolved Dissolved mg/L N/A <2.5 9.4 15 <250 4 2.3 14 15 13 14 16 21
Phosphorus, Ortho as P, dissolved italics are detection limit N/A 2.5 9.4 15 250 4 2.3 14 15 13 14 16 21
Phosphorus, Total as P Total mg/L N/A 0.26 460 490 23 39.4 51.0 190.0 57.2 26 20.6 32.2 32
Phosphorus, Total as P italics are detection limit N/A 0.26 460 490 23 39.4 51 190 57.2 26 20.6 32.2 32
Radium 226 pCi/L N/A N/A N/A N/A N/A 3.2 0.44 0.46 0.28 1.5 1.8 0.43 0.86
Radium 226 altu uCi/mL N/A N/A N/A N/A N/A 3.0E-09 4.OOE-10 5.00E-10 3.O0E-10 1.00E-09 2.00E-09 4.00E-10 9.00E-10
Radium 226 altu MDC uCi/mL N/A N/A N/A N/A N/A 2.0E-10 3.00E-10 4.00E-10 1.00E-10 2.00E-10 1.00E-10 6.00E-11 2.00E-10
Radium 226 ahtu precision (t) uCi/mL N/A N/A N/A N/A N/A 4.OE-10 2.00E-10 3.00E-10 1.00E-10 3.00E-10 3.00E-10 1.00E-10 2.00E-10
Radium 226 MDC pC//L N/A N/A N/A N/A N/A 0.24 0.28 0.38 0.13 0.2 0.14 0.06 0.2
Radium 226 precision (a) pCV/L N/A N/A N/A N/A N/A 0.39 0.22 0.29 0.12 0.29 0.26 0.12 0.23
Notes:
meq/L = milliequivalents per liter
mg/L = milligrams per liter
N/A = not analyzed
pCiL' = picocuries per liter
s.u. = standard unit
uCi/mL = microcuries per milliliter
' = value is less than the provided laboratory method reporting limit

SDR-IS, cont.
Days Elapsed Since End of Injections: 56 71 85111/21/20 147 182
Parameters Type Units 1022/2013 111612013 11/220013 1/21/2014 2/25/2014
RadionuclidestCOCs
Uranium Dissolved mg/L 0.081 0.085 0.109 0.136 0.157
Uranium Precision (±) Dissolved mg/L 0.013 0.0138 0.0177 0.0219 0.0253
Uranium, Activity Dissolved uCi/mL 5.5E-08 5.8E-08 7.4E-08 9.2E-08 1.1E-07
Uranium, Activity precision (a) Dissolved uCi/mL 8.8E-09 9.3E-09 1.2E-08 1.5E-08 1.7E-08
Molybdenum mg/L 1.01 0.71 0.60 0.54 0.79
Selenium mg/L 0.011 0.011 0.007 0.009 0.014
Vanadium mg/L v0.05 <0.01 <1301 <0.01 <0,01
Trorium-232 mg/L 0.007 <0.005 0.006 v0.005 0.006
Cations/ Anions
A/C Balance (1 5) % 0.484 0.746 1.76 -1.03 1.96
Anions meq/L 55.2 48.8 43.5 35.9 36.1
Bicarbonate as HCD3 mg/L 482 510 544 605 610
Calcium Dissolved mg/L 475 432 379 291 302
Cations meq/L 55.8 49.6 45 35.2 37.6
Chloride mg/L 1100 824 633 326 309
Iron mg/L NIA N/A N/A N/A N/A
Magnesium mg/L 69 59 57 52 55
Potassium mg/L 12 11 11 10 11
Sodium mg/L 600 526 486 372 407
Sulfate mg/L 729 772 761 748 764
General Chemistry
Alkalinity, Total as CaCO3 mg/L N/A N/A N/A N/A N/A
Carbonate as C03 mg/L <5 '5 s5 <5 v5
Nitrogen, Nitrate+Nitrite as N mg/L 1.18 1.19 1.31 1.49 9.77
pH s. 6.97 7.06 7.03 7.22 7.06
Solids, Total Dissolved Calculated mg/L 3300 2900 2600 2100 2200
Solids, Total Dissolved TDS @ 180 C mg/L 3370 2820 2670 2180 2180
TDS Balance (0.80 - 1.20) unitless 1.03 0.97 1.02 1.02 1
Additional Performance Parameters
Arsenic Total mg/L NIA N/A N/A N/A N/A
Arsenic Dissolved mg/L 0.047 0.038 0.033 0.028 0.03
Phosphorus, Ortho as P, dissolved Dissolved mg/L 13 12 9 13 16
Phosphorus, Ortho as P, dissolved italics are detection /imit 13 12 9 13 16
Phosphorus. Total as P Total mg/L 24.3 24.6 24.8 16.8 38.7
Phosphorus, Total as P italics are detection lim/t 24.3 24.6 24.8 16.8 38.7
Radium 226 pCi/L 2 0.51 5.4 0.39 0.33
Radium 226 altu uCilmL 2.00E-09 5.00E-10 5.00E-09 4.00E-10 3.00E-10
Radium 226 altu MDC uCi/mL 1.OOE-10 1.00E-10 2.OOE-10 2.00E-10 2.00E-10
Radium 226 altu precision (±) uCitmL 3.OOE-10 1.00E-10 5.00E-10 1.OOE-10 2.00E-10
Radium 226 MDC pCV/L 0.12 0.14 0.18 0.16 0.2
Radium 226 precision (a) pCi/L1 0.26 0.15 0.49 0.15 0.16
Notes:
meq/L = milliequivalents per liter
mg/L = milligrams per liter
N/A = not analyzed
pCi/IL = picocuries per liter
s.u. = standard unit
uCi/mL = microcuries per milliliter
< = value is less than the provided laboratory method reporting limit

SDR-ID End of Injections: 8/27/2013 Start of Injection: 812 11 2013
Days Elapsed Since End of Injections: Baselin -69 -12 -5 -4 0 0 1 8 15 15 21 28 35
Parameters Type Units 6/1912013 8/152013 82212013 8f2312013 8f22712013 8f2712013 8/28/2013 9/412013 9/11/2013 9/11/2013 9/17/2013 912412013 10/1/2013
RadionuclideslCOCs
Uranium Dissolved mg/L 0.553 N/A 0.28 0.240 0.120 0.153 0.272 0.111 0.098 0.112 0.0964 0.13 0.138
Total N/A 1 N/A N/A N/A N/A N/A N/A N/A N/A N/A N/A N/A
Uranium Precision (t) Dissolved mg/L 0.089 N/A NIA N/A N/A 0.025 0.044 0.018 N/A 0.0181 0.0156 0.021 0.022
Uranium, Activity Dissolved uCi/mL 3.7E-07 N/A N/A N/A N/A 1.0E-07 1.8E-07 7.50E-08 N/A 7.60E-08 6.5E-08 8.8E-08 9.3E-08
Uranium, Activity precision (W/ Dissolved uCimL 6.0E-08 N/A N/A N/A N/A 1.7E-08 3.0E-08 1.20E-08 N/A 1.2E-08 1.1E-08 1.4E-08 1.5E-08
Molybdenum mg/L 0.47 N/A N/A NIA N/A 4.2E-01 5.7E-01 0.96 N/A 1.31 1.22 1.39 1.30
Selenium mg/L 0.007 N/A N/A N/A N/A 0.016 0.017 0.019 N/A 0.028 0.022 0.022 0.02
Vanadium mg/L N/A N/A N/A N/A N/A 0.02 l0.01 0.01 N/A 0.02 0.01 <0.01 <0.01
Thorium-232 mg/L N/A N/A N/A N/A N/A <0.005 <0.005 0.005 NIA 0.012 <0.005 v0.005 0.01
Cations/ Anions
A/C Balance (± 5) % -1.06 N/A N/A NIA N/A -0.46 -2.32 -1.21 N/A 1.74 -0.489 1.68 0.09
Anions meq/L 31.2 N/A N/A N/A N/A 461 83.7 114 N/A 102 103 93.4 84.6
Bicarbonate as HCO3 mg/L 467 N/A N/A N/A N/A 188 400 355 N/A 373 373 399 409
Calcium Dissolved mg/L 230 N/A N/A N/A 9300 8060 1040 1120 1000 961 964 880 743
Cations meq/L 30.5 N/A NIA N/A N/A 457 79.9 111 N/A 106 102 96.6 84.8
Chloride mg/L 223 N/A N/A N/A N/A 16000 2230 3320 N/A 2850 2830 2480 2200.00
Iron mg/L v0.03 N/A N/A N/A N/A N/A N/A N/A N/A N/A N/A N/A NIA
Magnesium mg/L 61.2 N/A N/A N/A N/A 66 63 113 N/A 113 115 105 100
Potassium mg/L 6.0 N/A N/A N/A N/A 148 25 28 N/A 26 24 22 20
Sodium mg/L 320 N/A N/A N/A N/A 1040 513 1040 N/A 110 999 1000 896
Sulfate mg/L 830 N/A N/A N/A N/A 291 677 634 N/A 675 721 731 680
General Chemistry
Alkalinity, Total as CaCO3 mg/L 383 N/A N/A N/A N/A N/A N/A N/A N/A N/A N/A N/A N/A
Carbonate as C03 mg/L <5 N/A N/A N/A N/A <5 v5 <5 N/A <5 <5 <5 v5
Nitrogen, Nitrate+Nitite as N mg/L NIA N/A N/A N/A N/A 3.79 1.42 1.59 N/A 1.43 1.61 1.47 1.53
pH s.u, 7.55 N/A N/A N/A N/A 6.76 7.26 6.75 N/A 6.74 6.67 6.68 6.78
Solids, Total Dissolved Calculated mg/L 1900 N/A N/A N/A N/A 26000 4700 6500 N/A 5900 5900 5400 4800
Solids, Total Dissolved TDS @ 180 C mgIL 2000 N/A N/A N/A N/A 43600 7590 9710 N/A 8220 7250 6340 5710
TDS Balance /0.80 - 1.20) unitless 1.05 N/A N/A N/A N/A 1.7 1.6 1.5 N/A 1.39 1.23 1.17 1.18
Additional Performance Parameters
Arsenic Total mg/L N/A v0.002 N/A N/A N/A N/A N/A N/A NIA N/A N/A N/A NIA
Arsenic Dissolved mg/L N/A N/A 0.0056 0.0042 0.0056 0.043 0.009 0.03 0.039 0.048 0.05 0.058 0.064
Phosphorus, Ortho as P, dissolved Dissolved mg/L N/A <2.5 7.1 25 v250 2 1.1 12 <500 16 17 36 16.0
Phosphorus, Ortho as P, dissolved italics are detection limit N/A 2.5 7.1 25 250 2 1.1 12 500 16 17 36 16
Phosphorus, Total as P Total mg/L N/A 0.07 450 520 22 29.8 41.0 21.2 61 64.8 29 21.2 25.7
Phosphorus, Total as P italics ar detection limit N/A 0.07 450 520 22 29.8 41 21.2 61 64.8 29 21.2 25.7
Radium 226 pCi/L N/A NIA N/A N/A N/A 2.8 0.6 0.58 N/A 0.4 1.2 0.73 0.38
Radium 226 altu uCi/mL N/A N/A N/A N/A N/A 3.0E-09 6.00E-10 6.00E-10 N/A 4.00E-10 1.00E-09 7.00E-10 4.00-E10
Radium 226 ahtu MDC uCirmL N/A N/A N/A N/A N/A 3.0E-10 3.00E-10 3.00E-10 N/A 2.00E-10 2.00E-10 1.00E-10 6.00E-11
Radium 226 ahtu precision (5) uCi/mL N/A N/A N/A N/A N/A 4.0E-10 2.00E-10 3.00E-10 N/A 1.00E-10 3.00E-10 2.00E-10 1.00E-10
Radium 226 MDC pCi/L N/A N/A N/A N/A N/A 0.28 0.3 0.35 N/A 0.16 0.2 0.14 0.06
Radium 226 precision (i) pCi/L N/A N/A N/A N/A N/A 0.40 0.24 0.29 NIA 0.15 0.26 0.18 0.12
Notes:
meq/L = mitliequivalents per liter
mg/L = milligrams per liter
N/A = not analyzed
pCi/L = picocuries per liter
s.u. = standard unit
uCi/mL = microcuries per milliliter
< = value is less than the provided laboratory method reporting limit

SDR-ID, cont.
Days Elapsed Since End of Injections: 42 56 71 85 147 182
Parameters Type Units 10/8/2013 10/22/2013 11/6/2013 11/20/2013 1/21/2014 2125/2014
RadionuclideslCOCs
Uranium Dissolved mg/L 0.162 0.215 0.487 0.164 0.232 0.302
Total N/A N/A N/A N/A N/A NIA
Uranium Precision (5) Dissolved mg/L 0.0261 0.0348 0.0786 0.0265 0.0374 0.0487
Uranium, Activity Dissolved uCilmL 1.1 E-07 1.5E-07 3.3E-07 1.1 E-07 1.6E-07 2.0E-07
Uranium, Activity precision (4) Dissolved uCi/mL 1.8E-08 2.4E-08 5.3E-08 1.8E-08 2.5E-08 3.3E-08
Molybdenum mg/L 1.35 1.43 1.08 0.88 0.79 0.98
Selenium mg/L 0.02 0.022 0.041 0.013 0.014 0.02
Vanadium mg/L '0.01 <0.01 0.02 <0.01 <0.01 <0.01
Thorium-232 mg/L 0.009 0.021 0.012 <0.005 <0.005 <0.005
Cations/ Anions
A/C Balance (± 5) % -2.03 -0.868 1.01 1.19 -0.51 2.12
Anions meq/L 80.8 61.3 55 48.5 38.1 35.3
Bicarbonate as HCO3 mg/L 414 457 492 522 604 609
Calcium Dissolved mg/L 669 482 466 400 306 316
Cations meq/L 77.5 60.2 56.1 49.6 37.7 39.9
Chloride mg/L 1980 1280 1020 812 381 361
Iron mg/L N/A N/A N/A N/A N/A N/A
Magnesium mg/L 94 76 156 64 55 59
Potassium mg/L 18 15 14 13 11 12
Sodium mg/L 826 679 618 554 404 436
Sulfate mg/L 772 760 772 765 777 790
General Chemistry
Alkalinity, Total as CaCO3 mg/L N/A N/A N/A N/A N/A N/A
Carbonate as C03 mg/L <5 <5 <5 <5 <5 <5
Nitrogen, Nitrate+Nitte as N mg/L 1.28 1.39 1.54 1.42 1.56 1.76
pH s.u. 6.74 6.91 7.00 6.93 7.12 7.02
Solids. Total Dissolved Calculated mg/L 4600 3600 3200 2900 2300 2300
Solids, Total Dissolved TDS @ 180 C mg/L 5380 3790 3180 2980 2340 2380
TDS Balance (0.80 - 1.20) unitless 1.17 1.06 0.98 1.03 1.03 1.03
Additional Performance Parameters
Arsenic Total mg/L N/A N/A N/A N/A NIA N/A
Arsenic Dissolved mg/L 0.060 0.063 0.001 0.038 0.03 0.031
Phosphorus, Ortho as P, dissolved Dissolved mg/L 22 18 22 11 13 17
Phosphorus, Ortho as P, dissolved italics am detection lirni 22 18 22 11 13 17
Phosphorus, Total as P Total mgIL 28.1 28.6 21.5 21.4 16.4 22.4
Phosphorus, Total as P italics are detection/irnit 28.1 28.6 21.5 21.4 16.4 22.4
Radium 226 pCi/L 0.33 2.9 0.23 4.8 0.3 0.12
Radium 226 altu uCi/mL 3.00E-10 3.00E-09 2.00E-10 5.00E-09 3.006-10 1.00E-10
Radium 226 altu MDC uCi/mL 2.06E-10 1.00E-10 1.0OE-10 2.00E-10 2.00E-10 2.00E-10
Radium 226 altu precision (4) uCi/mL 2.OOE-10 3.00E-10 1.00E-10 5.00E-10 1.00E-10 1.00E-10
Radium 226 MDC pCi/L 0.16 0.13 0.15 0.19 0.15 0.2
Radium 226 precision (±) pCi/L 0.18 0.32 0.12 0.47 0.13 0.13
Notes:
meq/L = milliequivalents per liter
mg/L = milligrams per liter
N/A = not analyzed
pCi/L = picocuries per liter
sou. = standard unit
uCi/mL = microcuries per milliliter
< = value is less than the provided laboratory method reporting limit

0SDR-2S End of Injections: 8/27/2013 Start of Injection: 8/21/2013
Days Elapsed Since End of lnjections: Baseline'69 -4 0 0 1 8 153 21 28 34 147
Parameters Type Units 6119,2013 812312013 8a2712013 812712013 812812013 41203 911112013 3 242013 9/302013 1212014
RadionuclideslCOCs
Uranium Dissolved mg/L 0.167 0.079 0.91 0.108 0.121 0.119 0.106 0.109 0.105 0.102 0.0945
Uranium Precision (+) Dissolved mg/L 0.027 N/A N/A 0.017 0.020 0.019 0.0170 0.0176 0.017 0.0164 0.0152
Uranium, Activity Dissolved uCi/mL 1.1E-07 N/A N/A 7.3E-08 8.2E-08 8.0E-08 7.1E-08 7.4E-08 7.1E-08 6.9E-08 6.4E-08
Uranium, Activity precision (i) Dissolved uCimL 1.8E-08 N/A N/A 1.2E-08 1.3E-08 1.3E-08 1.2E-08 1.2E-08 1.2E-08 1.1E-08 1.OE-08
Molybdenum mg/L 0.14 N/A N/A 0.18 0.2 0.21 0.196 0.19 0.186 0.15 0.12
Selenium mg/L 0.008 N/A N/A 0.005 0.006 0.004 0.006 0.005 0.004 0.005 0.004
Vanadium mg/L N/A N/A N/A <0.01 <0.01 <0.01 <0.01 <0.01 <0.01 <0.01 <0.01
Thorium-232 mg/L N/A N/A N/A '0.005 <0.005 <0.005 <0.005 <0.005 <0.005 <0.005 <0.005
Cations/ Anions
A/C Balance (it 5) % -0.74 N/A N/A -1.11 -1.31 -0.76 1.41 -0.53 1.9 -1.41 -1.49
Anions meq/L 31.3 N/A N/A 35.3 37.1 32.1 31.6 31.6 32.1 32.4 31.7
Bicarbonate as HCO3 mg/L 462 N/A N/A 516 493 520 523 541 551 564 607
Calcium Dissolved mg/L 218 N/A 300 265 283 238 242 235 247 239 225
Cations meq/L 30.8 N/A N/A 34.5 36.1 31.6 32.5 31.3 33.3 31.5 30.7
Chloride mg/L 244 N/A N/A 374 457 253 243 239 247 242 225
Iron mg/L <0.03 N/A N/A N/A N/A N/A N/A N/A N/A N/A N/A
Magnesium mg/L 60.0 N/A N/A 73 79 66 68 66 66 67 66
Potassium mg/L 11.3 N/A N/A 10 9 9 9 9 9 8 10
Sodium mg/L 338 N/A N/A 345 350 323 335 320 352 319 317
Sulfate mg/L 802 N/A N/A 782 775 790 777 766 772 786 738
General Chemistry
Alkalinity, Total as CaCO3 mg/L 378 N/A N/A N/A N/A N/A N/A N/A N/A N/A N/A
Carbonate as C03 mg/L '5 N/A N/A <5 <5 <5 <5 <5 <5 <5 <5
Nitrogen, Nitrate+Nitdte as N mg/L N/A N/A N/A 0.96 0.88 0.77 0.9 1.02 1.06 1.13 1.46
pH s.u. 7.46 N/A N/A 7.32 7.24 7.29 7.31 7.27 7.21 7.27 7.35
Solids, Total Dissolved Calculated mg/L 1900 N/A N/A 2100 2200 2000 2000 1900 2000 2000 1900
Solids. Total Dissolved TDS @ 180 C mg/L 1970 N/A N/A 2180 2310 2010 1990 1960 1990 2020 1950
TDS Balance (0.80 - 1.20) unitless 1.03 N/A N/A 1.02 1.04 1.03 1.02 1.02 1.02 1.03 1.03
Additional Performance Parameters
Arsenic Dissolved mg/L N/A <0.002 <0.002 0.001 0.002 0.001 0.002 0.001 0.002 0.001 <0.001
Phosphorus. ODrho as P, dissolved Dissolved mg/L N/A <2.5 <10 <0.2 <0.2 <0.2 <0.2 <0.2 <0.2 <0.4 '0.2
Phosphorus, Ortho as P, dissolved italics are detection limit N/A 2.5 10 0.2 0.2 0.2 0.2 0.2 0.2 0.4 0.2
Phosphorus, Total as P Total mg/L N/A <0.05 <0.05 0.025 0.028 0.015 0.04 0.057 0.052 0.021 0.018
Phosphorus. Total as P italics are detection limit N/A 0.05 0.05 0.025 0.028 0.015 0.04 0.057 0.052 0.021 0.018
Radium 226 pCV/L N/A N/A N/A 0.46 0.42 0.1 3.1 1.2 0.49 0.35 0.47
Radium 226 altu uCi/mL N/A N/A NIA 5.0E-10 4.00E-10 I.O0E-10 3.00E-09 1.00E-09 5.00E-10 4.00E-10 5.00E-10
Radium 226 altu MDC uCi/mL N/A N/A N/A 2.0E-10 3.00E-10 4.00E-10 2.00E-10 2.00E-10 1.00E-10 3.00E-10 2.00E-10
Radium 226 altu precision (i) uCi/mL N/A N/A N/A 2.0E-10 2.00E-10 2.00E-10 3.00E-10 3.000-10 1.00E-10 2.00E-10 2.00E-10
Radium 226 MDC pCi/L N/A N/A N/A 0.22 0.25 0.38 0.15 0.2 0.14 0.34 0.18
Radium 226 precision (±) pCi/L N/A N/A N/A 0.19 0.2 0.23 0.34 0.26 0.15 0.25 0.17
Notes:meq/L = milliequivalents per liter
mg/L = milligrams per liter
NIA = not analyzed
pC/L = picocucies per liter
s.u. = standard unit
uCi/mL = microcuries per milliliter
< = value is less than the provided laboratory method reporting limit

0SDR-2D End of Injections: 8127/2013 Start of Injection: 812112013
Days Elapsed Since End of Injections: Baseline-69 -4 0 0 1 8 15 21 28 34 147
Parameters Type Units 6/1942013 8)23/2013 812712013 8/2712013 8128/2013 9/4/2013 9/1112013 911 912412013 912012073 1/21/2014
RadionuclideslCOCs
Uranium Dissolved mglL 1.39 1.9 1.7 2.05 1.92 1.99 2.18 2.18 2.28 2.07 1.7
Uranium Precision (5) Dissolved mg/L 0.224 N/A N/A 0.331 0.310 0.321 0.353 0.351 0.367 0.333 0.2750
Uranium, Activity Dissolved uCi/mL 9.4E-07 N/A N/A 1.4E-06 1.3E-06 1.4E-06 1.5E-06 1.5E-06 1.5E-06 1.4E-06 1.2E-06
Uranium, Activity precision (W) Dissolved uCi/mL 1.5E-07 N/A N/A 2.2E-07 2.1E-07 2.2E-07 2.4E-07 2.40E-07 2.50E-07 2.3E-07 1.9E-07
Molybdenum mg/L 0.35 N/A N/A 0.64 0.61 0.66 0.72 0.75 0.827 0.73 0.88
Selenium mg/L <0.005 N/A N/A <0.001 <0.001 <0.001 <0.001 <0.001 v0.001 <0.001 <0.001
Vanadium mg/L N/A N/A N/A 0.01 <0v01 <0,01 <0.01 <0.01 <0.01 <0.01 <0.01
Thorium-232 mg/L N/A N/A N/A <0.005 <0.005 <0.005 <0.005 <0.005 <0.005 <0.005 <0.005
Cations/ Anions
A/C Balance (± 5) % 0.14 N/A N/A 9.4E-05 -1.47 -1.64 -1.91 -0.68 1.7 -0.281 -2.07
Anions meq/L 36.2 N/A N/A 36.9 36.8 38.1 38.6 37.4 38.6 46.8 40.3
Bicarbonate as HCO3 mglL 428 N/A N/A 523 517 515 531 527 531 511 572
Calcium Dissolved mg/L 284 N/A 320 280 273 281 282 283 299 375 299
Cations meq/L 36.3 N/A N/A 36.9 35.7 36.9 37.2 36.9 39.9 46.6 38.7
Chloride mg/L 166 N/A N/A 178 187 181 190 184 203 538 351
Iron mg/L <0.03 N/A N/A N/A N/A N/A N/A N/A N/A N/A N/A
Magnesium mg/L 73.6 N/A N/A 73 71 73 74 73 74 98 80
Potassium mglL 6.4 N/A N/A 6 6 6 6 6 6 7 6
Sodium mg/L 367 N/A N/A 385 370 382 387 382 433 451 391
Sulfate mg/L 1180 N/A N/A 1120 1110 1180 1180 1130 1160 1120 1010
General Chemistry
Alkalinity, Total as CaCO3 mg/L 351 N/A N/A N/A N/A N/A N/A N/A N/A N/A N/A
Carbonate as C03 mg/L <5 N/A N/A <5 <5 <5 v5 <5 <5 <5 <5
Nitrogen, NitratevNitlnte as N mg/L N/A N/A N/A 0.04 0.08 0.1 0.04 0.03 0.04 0.02 <0.01
pH s.u. 7.54 N/A N/A 7.58 7.47 7.52 7.48 7.5 7.45 7.42 7.49
Solids, Total Dissolved Calculated mg/L 2300 N/A N/A 2300 2300 2400 N/A 2300 2400 2900 2400
Solids, Total Dissolved TDS @ 180 C mg/L 2400 N/A N/A 2460 2370 2460 2430 2440 2490 2920 2580
TDS Balance (0.80 - 1.20) unitless 1.04 N/A N/A 1.06 1.03 1.03 1.01 1.04 1.02 1.02 1.06
Additional Performance Parameters
Arsenic Dissolved mg/L N/A <0.002 <0.002 0.002 0.002 0.002 0.003 0.003 0.001 0.003 0.002
Phosphorus. Ortho as P, dissolved Dissolved mg/L N/A <2.5 <10 <0.2 <0.2 <0.2 <0.2 <1 0.05 <0.2 <1
Phosphorus, Ortho as P, dissolved italics arm detection limit N/A 2.5 10 0.2 0.2 0.2 0.2 1 0.05 0.2 1
Phosphorus, Total as P Total mg/L N/A <0.05 0.068 0.05 0.04 0.04 0.06 0.04 0.01 0.047 0.042
Phosphorus. Total as P italics arc detection limit N/A 0.05 0.068 0.05 0.04 0.04 0.06 0.04 0.01 0.047 0.042
Radium 226 pCi/L N/A N/A N/A 0.49 0.79 0.61 1.2 1.6 1.3 1.1 0.86
Radium 226 altu uCi/mL N/A N/A N/A 5.0E-10 8.00E-10 6.00E-10 1.00E-09 2.00E-09 1.00E-09 1.00E-09 9.00E-10
Radium 226 altu MDC uC/mL N/A N/A N/A 2.0E-10 3.00E-10 4.00E-10 2.00E-10 2.00E-10 2.00E-10 3.00E-10 2.00E-10
Radium 226 altu precision (5) uCimL N/A N/A N/A 2.0E-10 2.00E-10 3.00E-10 2.00E-10 3.00E-10 3.00E-10 3.00E-10 2.00E-10
Radium 226 MDC pCi/L N/A N/A N/A 0.21 0.27 0.37 0.18 0.2 0.18 0.31 0.17
Radium 226 precision (±) pCi/LI N/A N/A N/A 0.18 0.25 0.31 0.22 0.29 0.28 0.33 0.2
Notes:
meq/L = mitieguivalents per liter
mg/L = milligrams per liter
N/A = not analyzed
pCU/L = picocuries per liter
s~u. = standard unit
uCi/mL = microcuries per milliliter
< = value is less than the provided laboratory method reporting limit
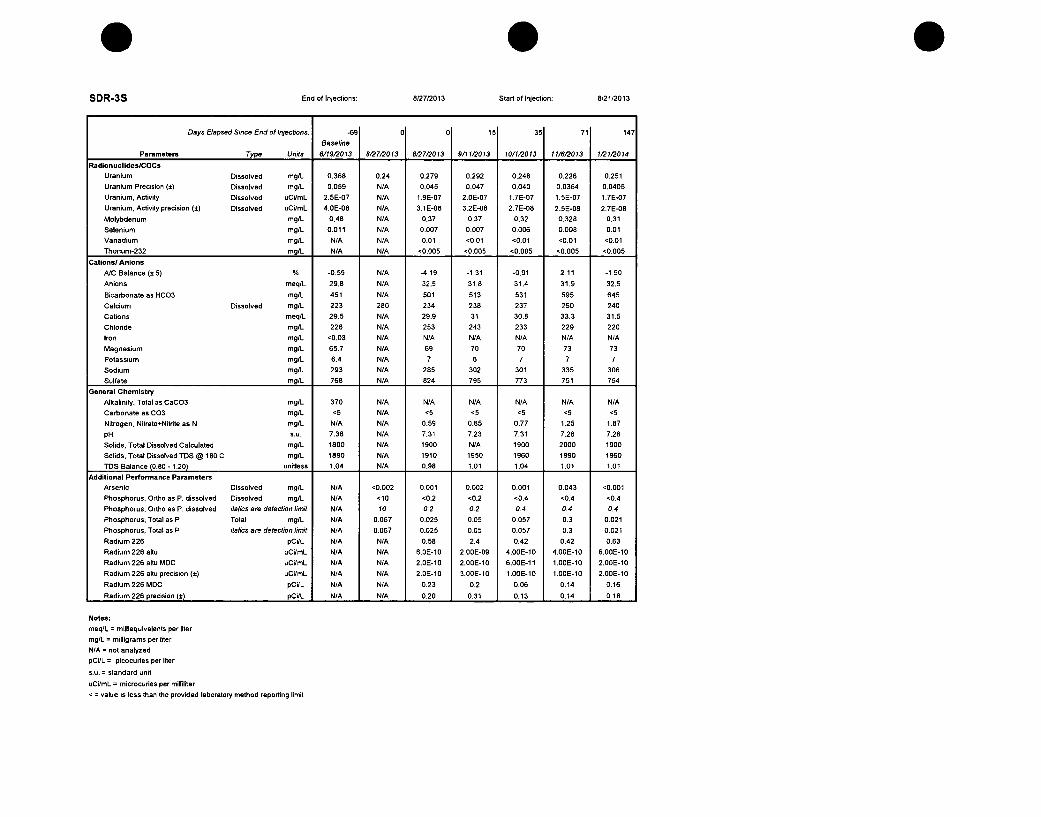
0SDR-3S End of Injections: 8/27/2013 Start of Injection: 8/21/2013
Days Elapsed Since End of Injections: Baseline-69 0 0 15 1 35 771 147
Parameters Type Units 611912013 802702013 802712013 9/1112013 10/1/2013 1//013 1/204
RadionuclideslCOCs
Uranium Dissolved mg/L 0.368 0.24 0.279 0.292 0.248 0.226 0.251
Uranium Precision (±) Dissolved mglL 0.059 N/A 0.045 0.047 0.040 0.0364 0.0405
Uranium, Activity Dissolved uCi/mL 2.5E-07 N/A 1.9E-07 2.0E-07 1.7E-07 1.5E-07 1.7E-07
Uranium, Activity precision (t) Dissolved uCilmL 4.0E-08 N/A 3.1E-08 3.2E-08 2.7E-08 2.5E-08 2.7E-08
Molybdenum mg/L 0.48 N/A 0.37 0.37 0.32 0.328 0.31
Selenium mg/L 0.011 N/A 0.007 0.007 0.006 0.008 0.01
Vanadium mg/L N/A N/A 0.01 <0.01 <0v01 <0.01 <0.01
Thorium-232 mg/L N/A N/A <0.005 <0.005 <0.005 <0.005 <0.005
Cations/ Anions
A/C Balance (± 5) % -0.55 N/A -4.19 -1.31 -0.91 2.11 -1.50
Anions meq/L 29.8 N/A 32.5 31.8 31.4 31.9 32.5
Bicarbonate as HCO3 mg/L 451 N/A 501 513 531 595 645
Calcium Dissolved mg/L 223 280 234 238 237 250 240
Cations meq/L 29.5 N/A 29.9 31 30.8 33.3 31.5
Chloride mglL 228 N/A 253 243 233 229 220
Iron mg/L '0.03 N/A N/A N/A N/A N/A N/A
Magnesium mg/L 65.7 N/A 69 70 70 73 73
Potassium mg/L 6.4 N/A 7 6 7 7 7
Sodium mglL 293 N/A 285 302 301 335 306
Sulfate mg/L 768 N/A 824 795 773 751 754
General Chemistry
Alkalinity, Total as CaCD3 mg/L 370 N/A N/A N/A N/A N/A N/A
Carbonate as C03 mg/L <5 N/A <5 <5 <5 v5 <5
Nitrogen, Nitrate-Nirite as N mg/L N/A N/A 0.59 0.65 0.77 1.25 1.87
pH s3u. 7.38 N/A 7.31 7.23 7.31 7.28 7.26
Solids, Total Dissolved Calculated mg/L 1500 N/A 1900 N/A 1900 2000 1900
Solids, Total Dissolved TDS @ 180 C mg/L 1890 N/A 1910 1950 1960 1990 1960
TDS Balance (0.80 - 1.20) onitless 1.04 N/A 0.98 1.01 1.04 1.01 1.01
Additional Performance Parameters
Arsenic Dissolved mg/L N/A <0.002 0.001 0.002 0.001 0.043 <0.001
Phosphorus. Ortho as P, dissolved Dissolved mg/L N/A <10 <0.2 '0.2 <0.4 <0.4 '0.4
Phosphorus, Ortho as P, dissolved italics am detection limit N/A 10 0.2 0.2 0.4 0.4 0.4
Phosphorus, Total as P Total mg/L N/A 0.067 0.025 0.05 0.057 0.3 0.021
Phosphorus, Total as P italics are detection limit N/A 0.067 0.025 0.05 0.057 0.3 0.021
Radium 226 pCi/L N/A N/A 0.58 2.4 0.42 0.42 0.63
Radium 226 altu uCitmL N/A N/A 6.0E-10 2.00E-09 4.00E-10 4.00E-10 6.000-10
Radium 226 allu MDC uCi/mL N/A N/A 2.0E-10 2.00E-10 6.00E-11 1.00E-10 2.000-10
Radium 226 altu precision (5) uCi/mL N/A N/A 2.0E-10 3.00E-10 1.00E-10 1.00E-10 2.000-10
Radium 226 MDC pCi/L N/A N/A 0.23 0.2 0.06 0.14 0.16
Radium 226 precision (8) pCi/L N/A N/A 0.20 0.31 0.13 0.14 0.18
Notes:
meq/L = milliequivalents per liter
mg/L = milligrams per liter
NIA = not analyzed
pCV/L = picocuries per liter
s.u. = standard unit
uCi/mL = microcuries per milliliter
< = value is less than the provided laboratory method reporting limit

SSDR-3D End of Injections: 8/2712013 Start of Injection: 8/21/2013
Days Elapsed Since End of Injections: -69 0 0 15 35 71 147
Baseline
Parameters Type Units 6/1192013 8/27/2013 8/27/2013 9/11/2013 10/1/2013 1116/2013 1/21/2014
RadionuclideslCOCs
Uranium Dissolved mg/L 0.398 0.94 1.12 1.34 1.2 1.12 0.897
Uranium Precision (5) Dissolved mg/L 0.064 N/A 0.180 0.217 0.194 0.181 0.145
Uranium, Activity Dissolved uCi/mL 2.7E-07 N/A 7.6E-07 9.1E-07 8.1E-07 7.6E-07 6.1E-07
Uranium, Activity precision (±) Dissolved uCi/mL 4.4E-08 NIA 1.2E-07 1.5E-07 1.3E-07 1.2E-07 9.8E-08
Molybdenum mg/L 0.42 N/A 0.5 0.59 0.57 0.7 0.64
Selenium mg/L 0.011 N/A v0.011 0.002 <0.001 0.002 <0.001
Vanadium mg/L N/A N/A <0.01 <0.01 <0.01 <0.01 0.02
Thorium-232 mg/L N/A N/A v0.005 <0.005 <0.005 <0.005 <0.005
Cations/ Anions
A/C Balance (± 5) % -1.80 N/A -4.32 -2.05 -0.15 1.97 1.60
Anions meq/L 31.2 N/A 34.6 38.5 48.4 49.5 48.2
Bicarbonate as HCO3 mg/L 450 N/A 503 497 491 507 501
Calcium Dissolved mg/L 221 270 243 288 400 410 381
Cations meq/L 30.1 N/A 31.7 36.9 48.2 51.4 49.7
Chloride mg/L 234 N/A 206 323 768 787 767
Iron mg/L <0.03 N/A N/A N/A N/A N/A N/A
Magnesium mg/L 64.0 N/A 66 77 106 104 99
Potassium mg/L 6.4 N/A 7 6 7 7 8
Sodium mg/L 314 N/A 323 370 445 510 514
Sulfate mg/L 829 NIA 988 1020 898 910 879
General Chemistry
Alkalinity, Total as CaCO3 mglL 369 N/A N/A N/A N/A N/A N/A
Carbonate as C03 mg/L <5 N/A <5 <5 <5 <5 <5
Nitrogen, Nitrate+Nitrite as N mg/L N/A N/A <0.05 0.02 0.07 0.03 <0.06
pH s.u. 7.36 N/A 7.44 7.37 7.41 7.46 7.31
Solids. Total Dissolved Calculated mg/L 1900 N/A 2100 N/A 2900 3000 2900
Solids, Total Dissolved TDS @ 180 C mg/L 1970 N/A 2170 2410 2960 3070 2980
TDS Balance (0.80 - 1.20) unitless 1.04 N/A 1.03 1.03 1.03 1.02 1.02
Additional Performance Parameters
Arsenic Dissolved mg/L N/A <0.002 0.002 0.003 0.002 0.002 0.001
Phosphorus, Ortho as P, dissolved Dissolved mg/L N/A <10 <0.2 <0.2 <0.4 <0.4 <0.4
Phosphorus, Ortho as P, dissolved italics are detection limit N/A 10 0.2 0.2 0.4 0.4 0.4
Phosphorus, Total as P Total mg/L N/A 0.06 0.016 0.03 0.03 0.05 0.019
Phosphorus, Total as P italics are detection Iimnit N/A 0.06 0.016 0.03 0.03 0.05 0.019
Radium 226 pCi/L N/A N/A 0.97 1.2 1.1 1.1 1.4
Radium 226 altu uCi/mL N/A N/A 1.0E-09 1.00E-09 1.00E-09 1.001-09 1.00E-09
Radium 226 altu MDC uCr/mL N/A N/A 2.0E-10 2.00E-10 6.00E-11 1.00E-10 2.00E-10
Radium 226 altu precision (±) uCi/mL N/A N/A 2.0E-10 2.00E-10 2.00E-10 2.00E-10 2.00E-10
Radium 226 MDC pCL/L N/A N/A 0.23 0.18 0.06 0.14 0.16
Radium 226 precision (a) pCi/L N/A N/A 0.24 0.22 0.2 0.2 0.24
Notes:
meq/L = mitliequivalents per liter
mg/L = milligrams per liter
N/A = not analyzed
pCi/L = picocuries per liter
s.u. = standard unit
uCi/mL = microcuries per mi/lititer
< = value is less than the provided laboratory method reporting limit

SDR-4S End of Injections: 8/27/2013 Start of Injection: 8/21/2013
Days Elapsed Since End of Injections; -69 12 -4 0 8 15 151 21 291 5 147Basel/neParameters Type Units 6/192013 8/15/2013 8,23/2013 8/27/2013 8/27/2013 8/28/2013 9/4/2013 8/112013 9/11/2013 9/17/2013 9/25/2013 / 1/21/204
RadionuclideslCOCs
Uranium Dissolved mg/L 0.499 NIA 0.34 0.46 0.529 0.549 0.45 0.420 0.455 0.478 0.444 0.444 0.514
Total NIA 0.44 N/A N/A N/A N/A N/A NIA N/A N/A NIA N/A N/A
Uranium Precision (±) Dissolved mg/L 0.081 N/A N/A N/A 0.0854 0.0886 0.0726 NIA 0.0734 0.0772 0.0717 0.0717 0.083
Uranium, Activity Dissolved uCi/mL 3.4E-07 N/A N/A N/A 3.6E-07 3.7E-07 3.0E-07 N/A 3.1E-07 3.20E-07 3.0E-07 3.0E-07 3.5E-07
Uranium, Activity precision (±j Dissolved uCi/mL 5.5E-08 N/A N/A N/A 5.8E-08 6.OE-08 4.9E-08 N/A 5.0E-08 5.20E-08 4.90E-08 4.9E-08 5.6E-08
Molybdenum mg/L 0.53 N/A N/A N/A 0.59 0.6 0.52 NIA 0.552 0.54 0.5 0.51 0.52
Selenium mglL 0.011 N/A N/A N/A 0.011 0.012 0.01 N/A 0.012 0.011 0.01 0.009 0.011
Vanadium mg/L N/A NIA N/A NIA 0.01 <0.01 <0.01 NIA <0.01 <0.01 '0.01 <0.01 <0.01
"horium-232 mg/L N/A N/A N/A N/A <0.005 <0.005 <0.005 NIA <0.005 <0.005 <0.005 <0.005 <0.005
Cations/ Anions
A/C Balance (± 5) % 0.34 N/A N/A N/A 0.77 -0.03 -1.98 N/A -0.33 -1.43 -0.655 -1.48 0.414
Anions meq/L 30.5 N/A N/A N/A 30.6 31.6 35.7 N/A 39 37.7 37.4 35.3 32.9
Bicarbonate as HCO3 mg/L 462 N/A N/A N/A 513 519 513 NIA 507 526 516 526 632
Calcium Dissolved mg/L 228 N/A N/A 250 232 235 271 330 319 303 298 273 250
Cations meqlL 30.7 N/A N/A N/A 31.1 31.4 34.4 NIA 38.7 36.6 37.0 34.3 33.1
Chloride mg/L 232 N/A N/A N/A 229 237 378 N/A 500 453 434 361 243
Iron mg/L '0.03 N/A N/A N/A N/A N/A N/A NIA N/A N/A NIA N/A N/A
Magnesium mg/L 68.4 N/A N/A N/A 69 70 80 NIA 95 89 88 81 76
Potassium mg/L 7.6 N/A N/A N/A 7 7 7 N/A 8 7 8 7 7
Sodium mg/L 311 N/A N/A N/A 314 316 322 N/A 340 320 336 318 328
Sulfate mglL 787 N/A N/A N/A 758 787 798 N/A 797 778 801 794 725
General Chemistry
Alkalinity, Total as CaCO3 mg/L 379 N/A N/A N/A N/A N/A N/A NIA N/A N/A NIA N/A N/A
Carbonate as C03 mgIL <5 N/A N/A N/A <5 <5 <5 N/A '5 <5 <5 <5 <5
Nitrogen, Nltrate+Nitrdte as N mglL N/A N/A N/A N/A 0.98 1.04 0.97 N/A 0.89 0.97 0.9 0.94 1.78
pH s.u. 7.35 N/A N/A N/A 7.32 7.26 7.27 NIA 7.24 7.23 7.21 7.28 7.3
Solids, Total Dissolved Calculated mg/L 1900 N/A N/A N/A 1900 1900 2100 NIA 2300 2200 2200 2100 2000
Solids, Total Dissolved TDS @ 180 C mg/L 1940 N/A NIA N/A 1940 1970 2210 NIA 2380 2300 2300 2190 2050
TDS Balance (0.80 - 1.20) unitless 1.04 N/A N/A NIA 1.03 1.02 1.04 N/A 1.020 1.03 1.020 1.050 1.030
Additional Performance Parameters
Arsenic Total mg/L N/A <0.002 N/A N/A N/A 0.002 N/A N/A N/A N/A N/A N/A N/A
Arsenic Dissolved mg/L N/A N/A '0.002 '0.002 0.002 N/A 0.001 '0.002 0.002 0.002 0.002 0.001 <0.001
Phosphorus, Ortho as P, dissolved Dissolved mg/L N/A <2.5 <2.5 <10 <0.2 <0.2 v0.2 <500 <0.2 '0.2 '0.2 '1 <I
Phosphorus, Ortho as P, dissolved italics are detection limit N/A 2.5 2.5 10 0.2 0.2 0.2 500 0.2 0.2 0.2 1 1
Phosphorus. Total as P Total mglL N/A 0 13 0.51 0.358 0.167 0.043 0.61 0.2 0.045 0.024 0.057 0.03
Phosphorus. Total as P italics are detection limit N/A 0.13 13 0.51 0.356 0.167 0.043 0.61 0.2 0.045 0.024 0.057 0.03
Radium 226 pCi/L N/A N/A N/A N/A 0.72 0.52 0.95 NIA 1.1 1.3 14 0.52 0.43
Radium 226 altu uCi/mL N/A N/A N/A N/A 7.0E-10 5.00E-10 1.00E-09 NIA 1.00E-09 1.006-09 1.00E-08 5.00E-10 4.00E-10
Radium 226 altu MDC uC/mL N/A N/A N/A N/A 2.0E-10 3.00E-10 4.00E-10 N/A 2.00E-10 2.00E-10 3.00E-10 6.006-11 2.00E-10
Radium 226 aftu precision (±) uC•imL N/A N/A N/A N/A 2.0E-10 2.006-10 4.00E-10 N/A 2.00E-10 3.00E-10 1.00E-09 1.00E-10 2.00E-10
Radium 226 MDC pCi/IL N/A N/A N/A N/A 0.23 0.27 0.38 N/A 0.16 0.2 0.28 0.06 0.16
Radium 226 precision (±) pCi/IL N/A N/A N/A N/A 0.22 0.22 0.35 NIA 0.22 0.27 0.97 0.14 0.15
Notes:
meq/L = milliequivalents per liter
mg/L = milligrams per liter
N/A = not analyzed
pCi/L = picocuries per liter
s.u. = standard unit
uCi/mL = microcuries per milliliter
n = value is less than the provided laboratory method reporting limit

SDR-4D End of Injections: 8127/2013 Start of Injection: 8/21/2013
Days Elapsed Since End of Injections: -69 12 -40 1 8 15 15 9 2172021 g Q 2911 29 3 147Parameters Type Units 6/19/2013 8/15/2013 8/23/2013 8/27/2013 8/27/2013 8/28/2013 9/4/2013 9/11/2013 9/11,2013 13 13 0/12013 1/21/2014
RadionuclideslCOCs
Uranium Dissolved mg/L 1.46 N/A 1.6 1.3 1.54 1.59 1.55 4.60 1.56 1.57 1.59 1.650 1.760
Uranium Precision (i) Dissolved mg/L 0.236 N/A N/A N/A 0.2480 0.2560 0.251 N/A 0.251 0.254 0.257 0.266 0.285
Uranium, Activity Dissolved uCi/mL 9.9E-07 N/A N/A N/A 1.0E-06 1.1E-06 1.1E-06 N/A 1.1E-06 1.10E-06 1.1E-06 1.1E-06 1.2E-06
Uranium, Activity precision (i) Dissolved uCi/mL 1.6E-07 N/A N/A N/A 1.7E-07 1.7E-07 1.7E-07 N/A 1.7E-07 1.70E-07 1.7E-07 1.8E-07 1.9E-07
Molybdenum mg/L 0.27 N/A N/A N/A 0.39 0.35 0.36 N/A 0.395 0.38 0.4 0.37 0.53
Selenium mg/L <0.005 N/A N/A N/A '0.001 <0.001 0.003 N/A 0.003 <0.001 <0.001 <0.001 <0.001
Vanadium mg/L N/A N/A N/A N/A <0.01 <0.01 <0.01 N/A <0.01 <0.01 <0.01 <0.01 0.01
Thorium-232 mg/L N/A N/A N/A N/A <0.005 <0.005 <0.005 N/A <0.005 <0.005 <0.005 <0.005 <0.005
Cations/ Anions
A/C Balance (± 5) % 0.09 N/A N/A N/A -1.28 -3.50 -1.37 N/A 0.17 -0.984 -1.94 -3 -1.14
Anions meq/L 34.9 N/A N/A N/A 38.2 44.8 47 N/A 46 44.1 46 43.7 38.3
Bicarbonate as HCO3 mg/L 447 N/A N/A N/A 500 495 493 N/A 509 507 519 513 551
Calcium Dissolved mg/L 265 N/A N/A 310 281 319 326 340 325 308 314 295 279
Cations meq/L 35.0 N/A N/A N/A 37.2 41.8 45.7 N/A 46.2 43.3 44.3 41.1 37.5
Chloride mg/L 191 N/A N/A N/A 311 548 615 N/A 589 506 542 452 282
Iron mg/L <0.03 N/A N/A N/A N/A NIA N/A N/A N/A N/A N/A N/A N/A
Magnesium mg/L 71.2 N/A N/A N/A 75 86 88 N/A 89 84 85 80 75
Potassium mg/L 6.2 N/A N/A N/A 6 6 7 N/A 7 6 7 6 7
Sodium mg/L 361 N/A N/A N/A 387 428 507 N/A 516 480 493 452 396
Sulfate mg/L 1070 N/A N/A N/A 1020 1020 1030 N/A 1010 1040 1070 1080 1030
General Chemistry
Alkalinity. Total as CaCO3 mg/L 366 N/A N/A N/A N/A N/A N/A N/A N/A N/A N/A NIA N/A
Carbonate as C03 mg/L <5 N/A N/A N/A '5 <5 <5 NIA '5 <5 <5 <5 <5
Nitrogen, Nitrate-Nitrite as N mg/L N/A N/A N/A N/A 0.1 <0.06 0.03 N/A 0.06 0.15 <0.1 0.03 <0.01
pH s.u. 7.59 N/A N/A N/A 7.55 7.46 7.51 N/A 7.50 7.46 7.46 7.53 7.47
Solids, Total Dissolved Calculated mg/L 2200 N/A N/A N/A 2400 2700 2800 N/A 2800 2700 2800 2600 2400
Solids, Total Dissolved TDS @ 180 C mg/L 2240 N/A N/A N/A 2410 2790 2970 N/A 2870 2770 2860 2740 2430
TDS Balance (0.80 - 1.20) unitless 1.03 N/A N/A N/A 1.03 1.04 1.05 N/A 1.020 1.03 1.030 1.050 1.030
Additional Performance Parameters
Arsenic Total mg/L NIA 0.003 N/A N/A N/A N/A N/A N/A N/A N/A NIA N/A N/A
Arsenic Dissolved mg/L N/A N/A 0.0032 0.0033 0.003 0.003 0.003 0.013 0.005 0.005 0.005 0.004 0.005
Phosphorus, Ortho as P, dissolved Dissolved mg/L N/A <2.5 <2.5 <10 <0.2 <0.2 '0.2 <500 <1 '0.2 <0.2 <1 <0.4
Phosphorus, Ortho as P, dissolved italics are detection limit N/A 2.5 2.5 10 0.2 0.2 0.2 500 1 0.2 0.2 1 0.4
Phosphorus, Total as P Total mg/L N/A <0.05 <0.05 0.18 0.05 0.05 0.08 2.7 0.15 0.19 0.28 0.29 0.788
Phosphorus, Total as P italics am detection limit N/A 0.05 0.05 0.18 0.05 0.05 0.08 2.7 0.15 0.19 0.28 0.29 0.788
Radium 226 pCi/L N/A N/A N/A N/A 1.1 1.5 1.2 NIA 1.4 1.9 3.1 0.7 0.71
Radium 226 altu uCi/mL N/A N/A N/A N/A 1.0E-09 2.00E-09 1.00E-09 N/A 1.00E-09 2.00E-09 3.00E-09 7.00E-10 7.00E-10
Radium 226 altu MDC uCi/mL N/A N/A N/A N/A 2.0E-10 3.00E-10 4.00E-10 N/A 1.00E-10 2.00E-10 3.00E-10 6.00E-11 2.00E-10
Radium 226 altu precision (±: uCi/mL N/A N/A N/A N/A 2.0E-10 2.00E-10 4.00E-10 NIA 2.00E-10 3.00E-10 5.00E-10 2.00E-10 2.00E-10
Radium 226 MDC pC//L N/A N/A N/A N/A 0.23 0.28 0.36 N/A 0.15 0.2 0.27 0.06 0.15
Radium 226 precision (5) pCVL/I N/A N/A N/A N/A 0.25 0.32 0.37 N/A 0.23 0.32 0.46 0.16 0.18
Notes:
meq/L = milliequivalents per liter
mg/L = milligrams per liter
N/A = not analyzed
pCi/L = picocudes per liter
sou. = standard unit
uCi/mL = microcuries per milliliter
< = value is less than the provided laboratory method reporting limit
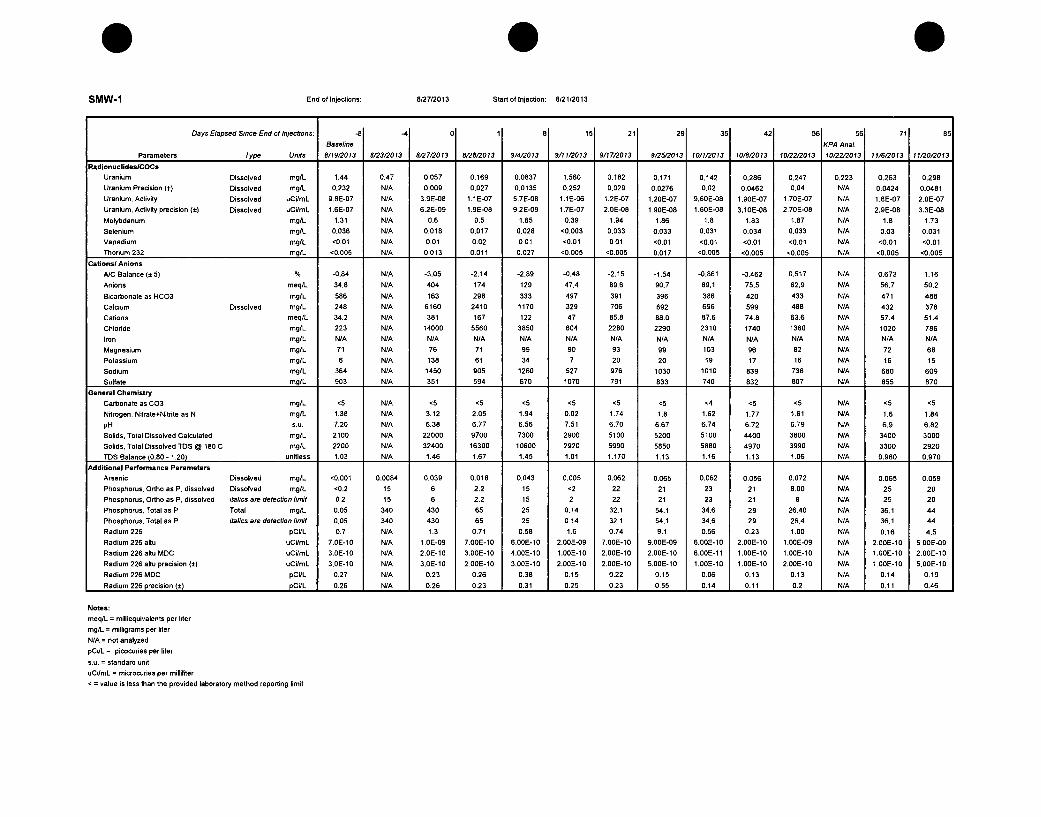
SMW-1 End of Injections: 8127/2013 Start of Injection: 8/2112013
Days Elapsed Since End of Injections: Baeie-8 -4 0 1 819120 15 912021 29 35 421 56 KP nl561 71 85
Parameters Type Units 8/19/22013 8 012 873 8070013 802820013 914013 3110013 9/1 3 805/2013 10/12013 104013 10/22/2013 1012212013 11/6/2013 1112012013
RadionuclideslCOCs
Uranium Dissolved mg/L 1.44 0.47 0.057 0.169 0.0837 1.560 0.182 0.171 0.142 0.286 0.247 0.223 0.263 0.298
Uranium Precision (i) Dissolved mg/L 0.232 NIA 0.009 0.027 0.0135 0.252 0.029 0.0276 0.02 0.0462 0.04 N/A 0.0424 0.0481
Uranium, Activity Dissolved uCi/mL 9.8E-07 N/A 3.9E-08 1.1E-07 5.7E-08 1.1E-06 1.2E-07 1.20E-07 9.60E-08 1.90E-07 1.70E-07 N/A 1.8E-07 2.0E-07
Uranium, Activity precision (i) Dissolved uCi/mL 1.6E-07 N/A 6.2E-09 1.9E-08 9.2E-09 1.7E-07 2.0E-08 1.90E-08 1.60E-08 3.10E-08 2.70E-08 N/A 2.9E-08 3.3E-08
Molybdenum mg/L 1.31 N/A 0.6 0.5 1.65 0.39 1.94 1.86 1.8 1.83 1.87 N/A 1.8 1.73
Selenium mg/L 0.036 N/A 0.018 0.017 0.028 <0.003 0.033 0.033 0.031 0.034 0.033 N/A 0.03 0.031
Vanadium mg/L v0.01 N/A 0.01 0.02 0.01 <0.01 0.01 <0.01 <0.01 <0.01 <0v01 N/A <0.01 <0.01
Thorium 232 mg/L <0.005 N/A 0.013 0.011 0.027 <0.005 <0.005 0.017 <0.005 <0.005 <0.005 N/A <0.005 <0.005
Cationsl Anions
AJC Balance (± 5) % -0.84 N/A -3.05 -2.14 -2.89 -0.48 -2.15 -1.54 -0.861 -0.462 0.517 N/A 0.673 1.16
Anions meq/L 34.8 N/A 404 174 129 47.4 89.6 90.7 89.1 75.5 62.9 N/A 56.7 50.2
Bicarbonate as HCD3 mg/L 586 N/A 163 296 333 497 391 396 386 420 433 N/A 471 488
Calcium Dissolved mg/L 248 N/A 6160 2410 1170 329 706 692 696 599 488 N/A 432 378
Cations meq/L 34.2 N/A 381 167 122 47 85.8 88.0 87.6 74.8 63.6 N/A 57.4 51.4
Chloride mg/L 223 N/A 14000 5560 3850 604 2280 2290 2310 1740 1360 N/A 1020 786
Iron mg/L N/A N/A N/A NIA N/A N/A N/A N/A N/A N/A N/A N/A N/A N/A
Magnesium mg/L 71 N/A 76 71 99 90 93 99 103 96 82 N/A 72 68
Potassium mg/L 6 N/A 138 61 34 7 20 20 19 17 16 N/A 16 15
Sodium mg/L 364 N/A 1450 905 1260 527 976 1030 1010 839 738 N/A 680 609
Sulfate mg/L 903 N/A 351 594 670 1070 791 833 740 832 807 N/A 855 870
General Chemistry
Carbonate as C03 mg/L <5 N/A <5 <5 <5 <5 <5 <5 <4 <5 <5 N/A <5 <5
Nitrogen, Nitrate+Nitrite as N mg/L 1.38 NIA 3.12 2.05 1.94 0.02 1.74 1.8 1.62 1.77 1.61 N/A 1.6 1.84
pH sou. 7.20 N/A 6.38 6.77 6.56 7.51 6.70 6.67 6.74 6.72 6.79 N/A 6.9 6.82
Solids, Total Dissolved Calculated mg/L 2100 N/A 22000 9700 7300 2900 5100 5200 5100 4400 3800 N/A 3400 3000
Solids, Total Dissolved TDS @ 180 C mg/L 2200 N/A 32400 16300 10600 2920 5990 5850 5880 4970 3990 N/A 3300 2920
TDS Balance (0.80 - 1.201 unitless 1.03 N/A 1.46 1.67 1.45 1.01 1.170 1.13 1.16 1.13 1.06 N/A 0.980 0.970
Additional Performance Parameters
Arsenic Dissolved mg/IL <0.001 0.0084 0.039 0.018 0.043 0.005 0.062 0.065 0.062 0.056 0.072 N/A 0.065 0.059
Phosphorus, Ortho as P, dissolved Dissolved mg/L <0.2 15 6 2.2 15 <2 22 21 23 21 8.00 N/A 25 20
Phosphorus, Ortho as P, dissolved italics are detection imfit 0.2 15 6 2.2 15 2 22 21 23 21 8 N/A 25 20
Phosphorus, Total as P Total mg/L 0.05 340 430 65 25 0.14 32.1 54.1 34.6 29 26.40 N/A 36.1 44
Phosphorus, Total as P italics are defection limit 0.05 340 430 65 25 0.14 32.1 54.1 34.6 29 26.4 N/A 36.1 44
Radium 226 pCi/L 0.7 N/A 1.3 0.71 0.58 1.6 0.74 9.1 0.56 0.23 1.00 N/A 0.16 4.5
Radium 226 altu uCi/mL 7.0E-10 N/A 1.0E-09 7.00E-10 6.00E-10 2.00E-09 7.00E-10 9.00E-09 6.00E-10 2.00E-10 1.00E-09 N/A 2.00E-10 5.006E09
Radium 226 altu MDC uCi/mL 3.0E-10 N/A 2.0E-10 3.00E-10 4.00E-10 1.00E-10 2.00E-10 2.00E-10 6.00E-11 1.006-10 1.00E-10 N/A 1.00E-10 2.00E-10
Radium 226 altu precision (±) uCi/mL 3.0E-10 N/A 3.06-10 2.00E-10 3.00E-10 2.00E-10 2.00E-10 5.00E-10 1.00E-10 1.00E-10 2.00E-10 N/A 1.00E-10 5.00E-10
Radium 226 MDC pCi/L 0.27 N/A 0.23 0.26 0.38 0.15 0.22 0.15 0.06 0.13 0.13 N/A 0.14 0.19
Radium 226 precision (:) pCi/L 0.26 N/A 0.26 0.23 0.31 0.25 0.23 0.55 0.14 0.11 0.2 N/A 0.11 0.46
Notes:
meq/L = milliequivalents per Iter
mg/L = milligrams per liter
N/A = not analyzed
pCi/L = picocuties per liter
s.u. = standard unit
uCi/mL = microcuries per millititer
< = value is less than the provided laboratory method reporting limit
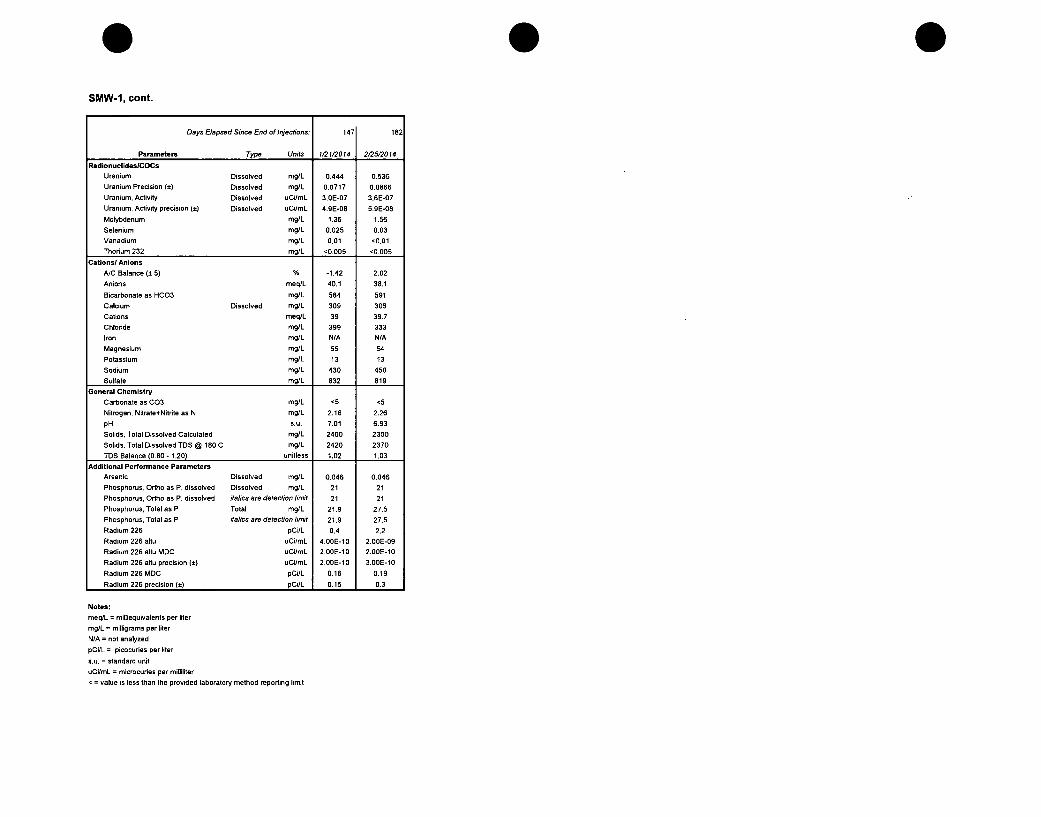
0SMW-1, cont.
Days Elapsed Since End of Injections: 147 182
Parameters Type Units 1/2112014 2/25/2014
Radionuclides/COCs
Uranium Dissolved mg/L 0.444 0.536
Uranium Precision (5) Dissolved mg/L 0.0717 0.0866
Uranium, Activity Dissolved uCilmL 3.0E-07 3.6E-07
Uranium, Activity precision (5) Dissolved uCi/mL 4.9E-08 5.9E-08
Molybdenum mg/L 1.36 1.56
Selenium mg/L 0.025 0.03
Vanadium mg/L 0.01 '0.01
Thorium 232 mg/L <0.005 <0.005
Cations/ Anions
A/C Balance (± 5) % -1.42 2.02
Anions meq/L 40.1 38.1
Bicarbonate as HCO3 mg/L 584 591
Calcium Dissolved mg/L 309 306
Cations meq/L 39 39.7
Chloride mg/L 399 333
Iron mg/L N/A NIA
Magnesium mg/L 55 54
Potassium mg/L 13 13
Sodium mg/L 430 450
Sulfate mg/L 832 819
General Chemistry
Carbonate as C03 mg/L '5 <5
Nitrogen, Nitrate+Nitrite as N mg/L 2.16 2.26
pH s.u. 7.01 6.93
Solids, Total Dissolved Calculated mg/L 2400 2300
Solids, Total Dissolved TDS @ 180 C mg/L 2420 2370
TDS Balance (0.80 - 1.20) unitless 1.02 1.03
Additional Performance Parameters
Arsenic Dissolved mg/L 0.046 0.046
Phosphorus. Ortho as P. dissolved Dissolved mg/L 21 21
Phosphorus, Ortho as P, dissolved italics are detection limit 21 21
Phosphorus, Total as P Total mg/L 21.9 27.5
Phosphorus, Total as P italics are detection limit 21.9 27.5
Radium 226 pCi/L 0.4 2.2
Radium 226 altu uCi/mL 4.00E-10 2.00E-09
Radium 226 altu MDC uCi/mL 2.00E-10 2.00E-10
Radium 226 altu precision (5) uCi/mL 2.00E-10 3.00E-10
Radium 226 MDC pCi/L 0.16 0.19
Radium 226 precision to) pCL , 0.15 0.3
Notes:meq/L = milliequivalents per liter
mg/L = milligrams per liter
N/A = not analyzed
pCi/L = picocuries per liter
s.u. = standard unit
uCi/mL = microcuries per milliliter
< = value is less than the provided laboratory method reporting limit
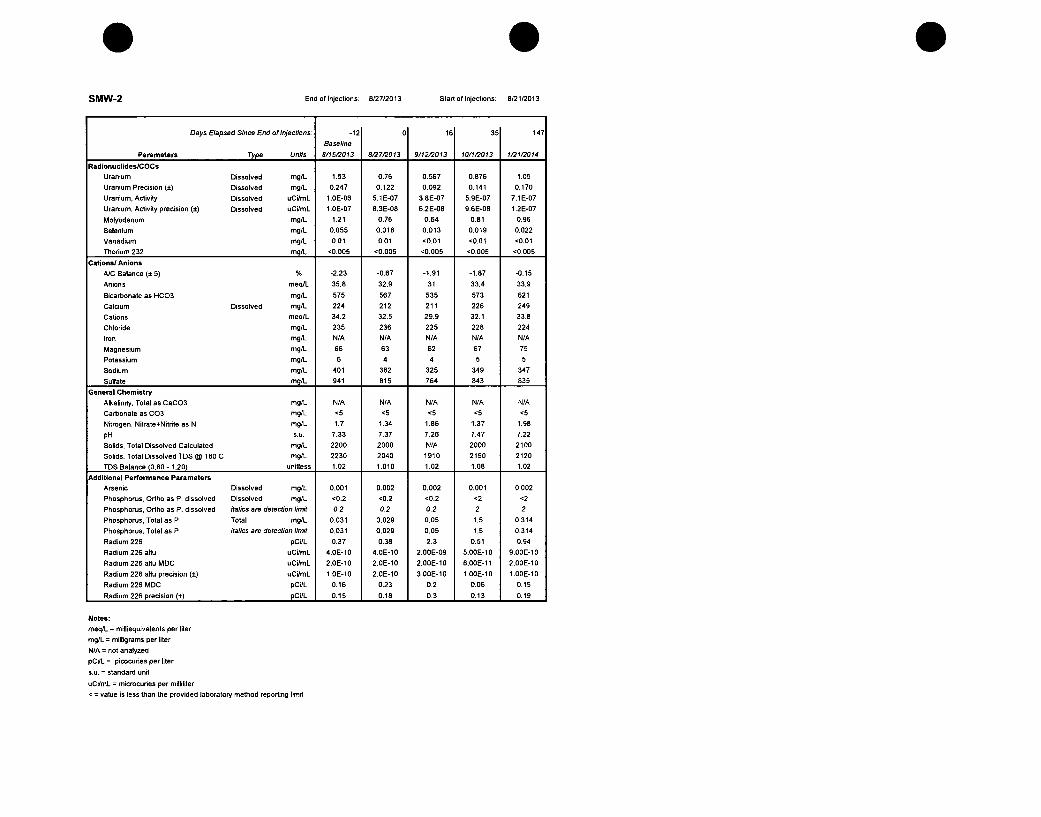
SMW-2 End of Injections: 8/27/2013 Start of Injections: 8/21/2013
Days Elapsed Since End of Injections:Baseline -12 0 16 15 147
Parameters Type Units 8/152013 8/27/2013 9/12/2013 10/1013 1/21/2014
Radionuclides/COCs
Uranium Dissolved mg/L 1.53 0.76 0.567 0.876 1.05
Uranium Precision (t) Dissolved mg/L 0.247 0.122 0.092 0.141 0.170
Uranium, Activity Dissolved uC/mL 1.0E-06 5.1E-07 3.8E-07 5.9E-07 7.1E-07
Uranium, Activity precision (0) Dissolved uCi/mL 1.0E-07 8.3E-08 6.2E-08 9.6E-08 1.2E-07
Molybdenum mg/L 1.21 0.76 0.64 0.81 0.96
Selenium mg/L 0.055 0.018 0.013 0.019 0.022
Vanadium mg/L 0.01 0.01 '0.01 '0.01 '0.01
Torodum 232 mg/L <0.005 <0.005 <0.005 <0.005 <0.005
Cations/ Anions
A/C Balance (± 5) % -2.23 -0.67 -1.91 -1.87 -0.15
Anions meq/L 35.8 32.9 31 33.4 33.9
Bicarbonate as HCO3 mg/L 575 567 535 573 621
Calcium Dissolved mg/L 224 212 211 226 249
Cations meqlL 34.2 32.5 29.9 32.1 33.8
Chloride mg/L 235 236 225 228 224
Iron mg/L N/A N/A N/A N/A N/A
Magnesium mg/L 66 63 62 67 75
Potassium mg/L 6 4 4 5 5
Sodium mg/L 401 382 325 349 347
Sulfate mg/L 941 815 764 843 835
General Chemistry
Alkalinity, Total as CaCO3 mg/L N/A N/A N/A N/A N/A
Carbonate as C03 mg/L <5 <5 <5 <5 <5
Nitrogen, NitratevNitrte as N mg/L 1.7 1.34 1.86 1.37 1.98
pH s.u. 7.33 7.37 7.26 7.47 7.22
Solids. Total Dissolved Calculated mg/L 2200 2000 N/A 2000 2100
Solids, Total Dissolved TDS @ 180 C mg/L 2230 2040 1910 2150 2120
TDS Balance (0.80 - 1.20) unitless 1.02 1.010 1.02 1.08 1.02
Additional Performance Parameters
Arsenic Dissolved mg/L 0.001 0.002 0.002 0.001 0.002
Phosphorus, Ortho as P, dissolved Dissolved mg/L <0.2 <0.2 <0.2 <2 <2
Phosphorus, Ortho as P, dissolved italics are detection limit 0.2 0.2 0.2 2 2
Phosphorus, Total as P Total mg/L 0.031 0.029 0.05 1.5 0.314
Phosphorus, Total as P italics are detection limit 0.031 0.029 0.05 1.5 0.314
Radium 226 pC/lI. 0.37 0.38 2.3 0.51 0.94
Radium 226 altu uCi/mL 4.0E-10 4.0E-10 2.00E-09 5.00E-10 9.O0E-10
Radium 226 altu MDC uCi/mL 2.0E-10 2.0E-10 2.00E-10 6.00E-11 2.00E-10
Radium 226 altu precision (0) uCi/mL 1.0E-10 2.0E-10 3.00E-10 1.00E-10 1.00E-10
Radium 226 MDC pC/lI. 0.16 0.23 0.2 0.06 0.15
Radium 226 precision (I) pCi/L1 0.15 0.18 0.3 0.13 0.19
Notes:
meq/IL = miltiequivalents per liter
mg/L = milligrams per liter
N/A = not analyzed
pCi/L = picocuries per liter
s.u. = standard unit
uCi/mL = microcuries per milliliter
< = value is less than the provided laboratory method reporting limit

SSMW-3S End of Injections: 8/2712013 Start of Injection: 8/21/2013
Days Elapsed Since End of Injections; Baseline-8 -4 0 1 8 16 21 925/2029 1 35 42 1 82156 711 85
Parameters Type Units 8/19/2013 8/23/2013 812712013 802802013 9/4/2013 8/120013 9/1712013 10/10013 10/80013 10201 11/013 1112002013
RadionuclidestCOCs
Uranium Dissolved mg/L 0.794 0.32 0.576 0.849 0.726 0.677 0.528 0.505 1.11 0.716 1.11 0.548 0.486
Uranium Precision (4) Dissolved mg/L 0.128 N/A 0.093 0.137 0.117 0.109 0.0851 0.0816 0.179 0.116 0.179 0.0884 0.0784
Uranium, Activity Dissolved uCi/mL 5.4E-07 N/A 3.9E-07 5.7E-07 4.9E-07 4.6E-07 3.6E-07 3.4E-07 7.50E-07 4.9E-07 7.50E-07 3.7E-07 3.3E-07
Uranium, Activity precision (4) Dissolved uCi/mL 8.7E-08 N/A 6.3E-08 9.3E-08 7.9E-08 7.4E-08 5.8E-08 5.5E-08 1.20E-07 7.8E-08 1.20E-07 6.0E-08 5.3E-08
Molybdenum mg/L 0.94 N/A 0.86 1.38 1.15 0.91 0.66 0.56 1.27 0.83 1.13 0.579 0.534
Selenium mg/L 0.019 N/A 0.019 0.022 0.021 0.016 0.01 0.009 0.023 0.015 0.022 0.01 0.007
Vanadium mg/L '0.01 N/A <0.01 0.01 <0.01 0.01 <0.01 <0.01 <0.01 <0.01 0.02 <0.01 <0.01
Thorium 232 mg/L <0.005 N/A 0.025 0.007 <0.005 <0.005 0.008 <0.005 <0.005 <0.005 <0.005 <0.005 <0.005
Cations/ Anions
A/C Balance (t 5) % -1.82 N/A -0.83 -1.15 -0.90 -1.00 -2.16 -0.70 -2.16 -1.54 0.435 4.42 1.77
Anions meq/L 34.3 N/A 56.1 85.7 47.1 36.6 34.6 33.3 35.4 34.5 35.6 32.2 33.7
Bicarbonate as HCO3 mg/L 524 N/A 491 466 517 524 538 529 565 551 570 551 566
Calcium Dissolved mg/L 241 N/A 427 867 374 264 234 229 224 229 246 251 244
Cations meq/L 33.1 N/A 55.2 83.8 46.3 35.9 33.1 32.8 33.9 33.5 35.9 25.2 34.9
Chloride mg/L 251 N/A 1070 2120 710 350 297 258 260 266 308 269 269
Iron mg/L N/A N/A N/A N/A N/A NIA N/A N/A NIA N/A N/A N/A N/A
Magnesium mg/L 65 N/A 72 103 69 64 62 62 65 64 74 72 71
Potassium mg/L 8 N/A 20 23 16 11 10 10 11 10 11 10 10
Sodium mg/L 356 N/A 630 723 495 395 370 367 393 379 397 379 381
Sulfate mg/L 893 N/A 857 868 880 853 818 821 891 853 838 744 800
General Chemistry
Carbonate as C03 mg/L <5 N/A <5 <5 <5 <5 <5 <5 <5 <5 <5 <5 <5
Nitrogen, Nitrate+Nitrite as N mg/L 0.77 NIA 0.46 0.97 2.09 1.81 1.71 1.5 2.14 1.62 1.62 1.21 1.43
pH sou. 7.23 N/A 7.20 7.11 7.19 7.21 7.25 7.27 7.33 7.23 7.29 7.36 7.16
Solids, Total Dissolved Calculated mg/L 2100 N/A 3400 4900 2800 N/A 2100 2000 2100.00 2100 2200 2000 2100
Solids, Total Dissolved TDS @ 180 C mg/L 2120 N/A 3640 6770 2880 2330 2120 2070 2230 2150 2290 2030 2070
TDS Balance (0.80 - 1.20) unitless 1.01 N/A 1.09 1.37 1.02 N/A 1.01 1.01 1.05 1.02 1.05 1.00 1.00
Additional Performance Parameters
Arsenic Dissolved mg/L <0.001 0.0026 0.013 0.002 0.01 0.008 0.006 0.015 0.007 0.006 0.005 0.003 0.003
Phosphorus, Ortho as P, dissolved Dissolved mg/L <0.2 2.7 1.4 18.8 3 4 <4 <4 2.9 2 1 0.8 1.6
Phosphorus, Ortho as P. dissolved italics are detection li/sit 0.2 2.7 1.4 18.8 3 4 4 4 2.9 2 1 0.8 1.6
Phosphorus, Total as P Total mglL 0.1 87 46.1 9.4 9.2 8.25 6.1 6.59 7.1 6.2 5.4 3.4 3.3
Phosphorus, Total as P italics are detection lirnit 0.1 87 46.1 9.4 9.2 8.25 6.1 6.59 7.1 6.2 5.4 3.4 3.3
Radium 226 pCi/L 1.5 N/A 0.65 0.83 0.99 1.1 2.0 1.7 0.71 0.93 2 0.64 3
Radium 226 altu uCi/mL 2.0E-09 N/A 6.0E-10 8.006-10 1.00E-09 1.00E-09 2.00E-09 2.00E-09 7.00E-10 9.00E-10 2.00E-09 6.006E-10 3.00E-09
Radium 226 altu MDC uCi/mL 3.0E-10 N/A 2.0E-10 3.00E-10 4.00E-10 2.00E-10 2.O0E-10 3.006-10 2.00E-10 2.00E-10 1.00E-10 1.00E-10 2.00E-10
Radium 226 astu precision (a) uCi/mL 3.0E-10 N/A 2.0E-10 3.00E-10 4.00E-10 2.00E-10 3.00E-10 4.00E-10 6.00E-11 2.00E-10 3.06E-10 2.00E-10 4.00E-10
Radium 226 MDC pCi/L. 0.27 NIA 0.24 0.29 0.39 0.19 0.21 0.28 0.06 0.18 13 0.15 0.19
Radium 226 precision (:) pCi/L 0.34 N/A 0.22 0.26 0.37 0.22 0.33 0.37 0.16 0.22 0.27 0.17 0.38
Notes:
meq/L = milliequivalents per liter
mg/L = milligrams per liter
N/A = not analyzed
pCi/L = picocuries per liter
s.u. = standard unit
uCi/mL = microcuries per milliliter
< = value is less than the provided laboratory method reporting limit

SMW-3S, cont.
Days Elapsed Since End of Injections: 147 182
Parameters Type Units 1121/2014 2/25/2014
RadionuclideslCOCs
Uranium Dissolved mg/L 0.62 0.40
Uranium Precision (i) Dissolved mglL 0.1 0.0644
Uranium, Activity Dissolved uCilmL 4.2E-07 2.7E-07
Uranium, Activity precision (±) Dissolved uCilmL 6.8E-08 4.4E-08
Molybdenum mg/L 0.63 0.464
Selenium mg/L 0.012 0.01
Vanadium mg/L v0.01 v0.01
Thorium 232 mg/L 0.008 0.008
Cations/ Anions
A/C Balance (± 5) % -0.183 3.08
Anions meq/L 34.1 32.9
Bicarbonate as HCD3 mg/L 622 633
Calcium Dissolved mg/L 249 249
Cations meq/L 34 35
Chloride mg/L 277 243
Iron mg/L NIA NIA
Magnesium mg/L 73 72
Potassium mg/L 8 9
Sodium mg/L 382 376
Sulfate mg/L 764 746
General Chemistry
Carbonate as C03 mg/L <S v5
Nitrogen, Nitrate+Nitrite as N mg/L 2.02 1.58
pH s.u. 7.29 7.18
Solids, Total Dissolved Calculated mg/L 2100 2000
Solids. Total Dissolved TDS @ 180 C mg/L 2110 2020
TDS Balance (0.80 - 1.20) unitless 1.02 1.00
Additional Performance Parameters
Arsenic Dissolved mg/L 0.003 0.002
Phosphorus, Ortho as P, dissolved Dissolved mg/L 1.7 1
Phosphorus, Ortho as P. dissolved italics are detection limit 1.7 1
Phosphorus, Total as P Total mg/L 2 1.5
Phosphorus, Total as P italics are detection limit 2 1.5
Radium 226 pCr/L 0.64 0.45
Radium 226 altu uCi/mL 6.00E-10 5.00E-10
Radium 226 altu MDC uCi/mL 2.00E-10 2.00E-10
Radium 226 altu precision (i) uCilmL 2.00E-10 2.00E-10
Radium 226 MDC pCilL 0.16 0.2
Radium 226 precision (+) pCiYL 0.17 0.17
Notes:
meq/L = milliequivalents per liter
mg/L = milligrams per liter
NIA = not analyzed
pCi/L = picocuries per liter
s.u. = standard unit
uCilmL = microcuries per milliliter
< = value is less than the provided laboratory method reporting limit

SMW-3D End of Injections: 812712013 Start of Injecfion: 8/21/2013
Days Elapsed Since End of Injections: -8 -4Baseline 0 18 16 21 29 35 42 56 71 85
Parameters Type Units 8/1912013 8,23/2013 6/27/2013 8/28/2013 9/4/2013 8/1212013 9/17/2013 9/25/2013 10/1/201"3 10/8/2013 t0/22/20t3 11/6/2013 11/20/2013
RadionuclideslCOCs
Uranium Dissolved mg/L 1.06 0.43 0.479 0.439 0.37 0.494 0.362 0.371 0.271 0.265 0.288 0.318 0.273
Uranium Precision (:) Dissolved mg/L 0.172 N/A 0.077 0.071 0.060 0.0797 0.0585 0.060 0.0437 0.043 0.0466 0.0513 0.044
Uranium, Activity Dissolved uCi/mL 7.2E-07 N/A 3.2E-07 3.0E-07 2.5E-07 3.3E-07 2.5E-07 2.50E-07 1.80E-07 1.80E-07 2.00E-07 2.2E-07 1.9E-07
Uranium, Activity precision (8) Dissolved uCi/mL 1.2E-07 N/A 5.2E-08 4.8E-08 4.1 E-08 5.4E-08 4.0E-08 4.10E-08 3.00E-08 2.90E-08 3.20E-08 3.5E-08 3.0E-08
Molybdenum mg/L 0.9 N/A 0.52 0.65 0.5 0.25 0.27 0.23 0.28 0.3 0.24 0.4 0.39
Selenium mg/L 0.013 N/A 0.002 0.001 <0.001 <0.001 <0.001 <0.001 <0.001 <0.001 0.003 0.004 <0.001
Vanadium mg/L 0.01 N/A 0.01 '0.01 '0.01 <0.01 <0.01 <0.01 <0.01 <0.01 <0.01 <0.01 <0.01
Thorium 232 mg/L <0.005 N/A <0.005 <0.005 0.02 <0.005 <0.005 <0.005 <0.005 <0.005 <0.005 <0.005 <0.005
Cations/ Anions
A/C Balance (15) % -1.98 N/A -4.39 -3.42 -1.58 -4.47 -0.77 -2.24 -0.77 -1.38 2.91 -0.668 1.35
Anions meq/L 35.7 N/A 52.8 56.8 58.9 75.8 82.1 95.7 94.3 101 93.7 92.9 87.7
Bicarbonate as HCD3 mg/L 562 N/A 492 505 469 435 425 430 415 408 424 423 433
Calcium Dissolved mg/L 259 N/A 463 459 480 627 720 792 815 868 868 797 778
Cations meq/L 34.3 N/A 48.4 53.1 57.1 69.3 80.8 91.6 92.9 97.8 99.3 91.7 90.1
Chloride mg/L 213 N/A 855 1050 1150 1770 2070 2490 2570 2750 2520 2450 2260
Iron mg/L N/A N/A N/A N/A N/A N/A N/A N/A N/A N/A N/A N/A N/A
Magnesium mg/L 71 N/A 66 80 104 142 164 185 191 201 195 179 169
Potassium mg/L 7 N/A 15 12 11 10 11 11 11 12 12 11 11
Sodium mg/L 354 N/A 448 536 559 599 716 839 832 863 911 849 853
Sulfate mg/L 983 N/A 974 905 886 866 788 870 707 757 731 796 785
General Chemistry
Carbonate as C03 mg/L <5 N/A <5 <5 <5 <5 S5 <5 <5 <5 v5 <5 <5
Nitrogen, Nitrate+Nitrite as N mg/L 0.29 N/A 0.05 0.09 0.04 0.04 0.03 <0.01 0.04 '0.01 0.05 0.02 <0.01
pH s.u, 7.28 N/A 7.26 7.28 7.23 7.16 7.17 7.11 7.15 7.04 7.10 7.11 6.93
Solids, Total Dissolved Calculated mg/L 2200 N/A 3100 3300 3400 N/A 4700 5400 5300.00 5700 5500 5300 5100
Solids, Total Dissolved TDS @ 180 C mg/L 2190 N/A 3250 3500 3720 5020 5600 6660 6870.00 7340 6630 6290 5680
TDS Balance 10.80 - 1.20) unitless 1.00 N/A 1.05 1.05 1.08 1.18 1.19 1.23 1.29 1.29 1.21 1.18 1.11
Additional Performance Parameters
Arsenic Dissolved mgl 0.001 0.0053 0.009 0.009 0.008 0.010 0.009 0.01 0.008 0.008 0.01 0.01 0.01
Phosphorus, Ortho as P, dissolved Dissolved mg/L <0.2 9.2 3.7 2 4 7.7 3.1 3.3 4.00 3.8 <4 3.7 4.7
Phosphorus, Ortho as P, dissolved italics are detection limit 0.2 9.2 3.7 2 4 7.7 3.1 3.3 4 3.8 4 3.7 4.7
Phosphorus, Total as P Total mg/L 0.02 170 21.4 11.4 8.6 9.05 7.49 6.6 6.10 6.3 5.8 6.8 7.1
Phosphorus, Total as P italics ar detection limit 0.02 170 21.4 11.4 8.6 9.05 7.49 6.56 6.1 6.3 5.8 6.8 7.1
Radium 226 pCilL 1.3 N/A 2.1 0.56 0.88 25 1.9 1.5 0.80 4.7 1.9 1.2 2.5
Radium 226 astu uCi/mL 1.OE-09 N/A 2.0E-09 6.00E-10 9.00E-10 3.00E-08 2.00E-09 1.00E-09 8.00E-10 5.00E-09 2.00E-09 1.00E-09 3.00E-09
Radium 226 altu MDC uCi/mL 36-10 N/A 2.0E-10 3.00E-10 4.00E-10 3.00E-10 2.O0E-10 3.00E-10 6.00E-11 2.00E-10 1.00E-10 1.00E-10 2.O0E-10
Radium 226 altu precision (a) uCi/mL 3E-10 N/A 3.0E-10 2.00E-10 3.00E-10 1.00E-09 3.00E-10 3.00E-10 2.00E-10 4.00E-10 3.00E-10 2.00E-10 3.O0E-10
Radium 226 MDC pCi/L 0.28 N/A 0.24 0.29 0.38 0.34 0.2 0.28 0.06 0.16 0.13 0.14 0.18
Radium 226 precision(s) pCV/L 0.32 N/A 0.33 0.24 0.35 1.4 0.32 0.34 0.16 0.42 0.26 0.2 0.34
Notes:
meq/L = milliequivalents per liter
mg/L = milligrams per liter
N/A = not analyzed
pCi/L = picocuries per liter
s.u. = standard unit
uCi/mL = microcuries per milliliter
< = value is less than the provided laboratory method reporting limit

SMW-3D, cont.
Days Elapsed Since End of Injections: 147 182
Parameters Type Units 102012014 2125/2014
RadionuclideslCOCs
Uranium Dissolved mg/L 0.14 0.13
Uranium Precision (5) Dissolved mg/L 0.0217 0.0204
Uranium, Activity Dissolved uCi/mL 9.1E-08 8.6E-08
Uranium, Activity precision (t) Dissolved uCi/mL 1.5E-08 1.4E-08
Molybdenum mg/L 0.55 0.723
Selenium mg/L 0.006 <0.001
Vanadium mg/L <0.01 <0.01
Thorium 232 mg/L <0.005 <0.005
Cations/Anions
A/C Balance (± 5) % -0.408 2.73
Anions meq/L 56.2 4989
Bicarbonate as HCO3 mg/L 497 537
Calcium Dissolved mg/L 458 410
Cations meq/L 55.7 52.7
Chloride mg/L 1100 825
Iron mg/L N/A N/A
Magnesium mg/L 99 87
Potassium mg/L 9 8
Sodium mg/L 563 572
Sulfate mg/L 786 817
General Chemistry
Carbonate as C03 mg/L <5 <5
Nitrogen, Nitrate+Nitrte as N mg/L 0.01 0.02
pH s.u. 7.32 7.08
Solids, Total Dissolved Calculated mg/L 3300 3000
Solids, Total Dissolved TDS @ 180 C mg/L 3400 3110
TDS Balance (0.80 - 1.20) unitless 1.03 1.03
Additional Performance Parameters
Arsenic Dissolved mgl 0.009 0.01
Phosphorus, Ortho as P, dissolved Dissolved mg/L 8.1 8
Phosphorus, Ortho as P, dissolved italics are detection limit 8.1 8
Phosphorus, Total as P Total mg/L 8.8 9.4
Phosphorus, Total as P italics are detection limit 8.8 9.4
Radium 226 pCitL 1.9 1.2
Radium 226 altu uCi/mL 2.00E-09 1.00E-09
Radium 226 altu MDC uCi/mL 2.00E-10 2.00E-10
Radium 226 altu precision (t) uCi/mL 3.00E-10 2.00E-10
Radium 226 MDC pCi/L 0.15 0.19
Radium 226 precision (5) pCil 0.27 0.23
Notes:
meq/L = milliequivalents per liter
mg/L = milligrams per liter
N/A = not analyzed
pCi/L = picocuries per liter
s.u. = standard unit
uCi/mL = microcuries per milliliter
< = value is less than the provided laboratory method reporting limit

SMW-4S End of Injections: 8/27/2013 Start of Injection: 8/21/2013
Days Elapsed Since End of Injections: -8 -4 0 1 8 16 21 29 35 10 4213 56 71 86Ba seline 191,0 17213 92,03 11103 0821Parameters Type Units 8/1912013 8/23,2013 8/27/2013 828/12013 42013013 10/222013 11/62013 11t21/2013
RadionuclidestCOCs
Uranium Dissolved mg/L 0.199 0.27 0.0478 0.133 0.0202 0.0433 0.0794 0.086 0.086 0.0005 0.0544 0.081 0.0762
Uranium Precision (/) Dissolved mg/L 0.032 NIA 0.008 0.022 0.0033 0.0070 0.0128 0.0139 0.0139 0.00008 0.00879 0.0131 0.0123
Uranium. Activity Dissolved uCa/mL 1.4E-07 NIA 3.2E-08 9.0E-08 1.4E-08 2.9E-08 5.4E-08 5.8E-08 5.80E-08 3.5E-10 3.70E-08 5.5E-08 5.2E-08
Uranium. Activity precision (±) Dissolved uCi/mL 2.2E-08 N/A 5.2E-09 1.5E-08 2.2E-09 4.7E-09 8.7E-09 9.4E-09 9.40E-09 5.6E-11 6.00E-09 8.9E-09 8.3E-09
Molybdenum mg/L 0.37 N/A 0.41 0.55 0.58 0.65 0.6 0.7 0.72 0.71 0.88 0.71 0.62
Selenium mg/L 0.008 N/A 0.016 0.017 0.023 0.015 0.015 0.014 0.012 '0.001 0.01 0.011 0.006
Vanadium mg/L <0.01 NIA 0.01 0.01 '0.01 0.01 0.01 <0.01 <0.01 <0.01 <0.01 <0.01 <0.01
Thodsum 232 mg/L <0.005 N/A <0.005 <0.005 <0.005 <0.005 0.02 0.023 <0.005 <0.005 0.009 <0.005 <0.005
Cations/ Anions
A/C Balance (± 5) % -1.75 N/A -1.81 -1.57 -1.79 -2.78 -0.94 -1.53 0.599 -1.66 3.3 0.533 0.506
Anions meq/L 31.0 N/A 271 142 163 137 133 125 119 124 87.7 62.7 53.2
Bicarbonate as HCO3 mg/L 514 N/A 245 325 292 294 340 365 356 356 398 474 515
Calcium Dissolved mg/L 234 N/A 3810 1780 1730 1460 1400 1270 1250 1240 940 591 471
Cations meq/L 29.9 NIA 261 138 157 130 130 121 120 120 93.7 63.4 53.7
Chloride mg/L 234 N/A 9090 4400 5110 4160 3990 3680 3560 3680 2370 1360 1000
Iron mg/L N/A N/A N/A N/A N/A N/A N/A N/A N/A N/A N/A N/A N/A
Magnesium mg/L 66 N/A 55 61 220 171 168 152 148 154 115 78 65
Potassium mg/L 6 N/A 108 54 44 31 25 23 22 22 21 15 16
Sodium mg/L 292 N/A 1470 983 1180 975 1060 1030 1030 1030 845 624 562
Sulfate mg/L 764 N/a 487 610 565 620 597 690 589 643 637 730 742
General Chemistry
Carbonate as C03 mg/L <5 N/A <5 <5 <5 <5 <5 <5 <5 <5 <5 <5 v5
Nitrogen, Nitrate+Nitrite as N mg/L 0.82 N/A 2.6 1.84 1.92 1.91 1.84 1.7 2.03 2.01 1.85 1.23 1.37
pH s.u. 7.20 N/A 6.57 6.80 6.47 6.47 6.70 6.70 6.82 6.70 6.81 7.01 6.93
Solids, Total Dissolved Calculated mg/L 1900 N/A 15000 8000 9000 N/A 7500 7000 6800 7000 5200 3700 3200
Solids, Total Dissolved TDS @ 180 C mg/L 1910 N/A 24200 13400 14400 12000 9550 9240 8860 9450 6730 3790 3200
TDS Balance (0.80 - 1.20) unitless 1.02 N/A 1.59 1.66 1.59 1.59 1.28 1.31 1.31 1.35 1.3 1.03 1.02
Additional Performance Parameters
Arsenic Dissolved mg/L '0.001 0.0064 0.03 0.017 0.039 0.043 0.033 0.028 0.03 0.025 0.029 0.029 0.03
Phosphorus, Ortho as P, dissolved Dissolved mg/L <0.2 10 6 2.4 19 23 21 11 <4 11 12 13 11
Phosphorus, Ortho as P, dissolved italics are detection limit 0.2 10 6 2.4 19 23 21 11 4 11 12 13 11
Phosphorus, Total as P Total mg/L 0.039 520 42.1 22.6 40.3 43.2 40 31.4 30.40 23.9 22.7 14.8 16.7
Phosphorus, Total as P italics am detection limit 0.039 520 42.1 22.6 40.3 43.2 40 31.4 30.4 23.9 22.7 14.8 16.7
Radium 226 pCi/L. 0.59 N/A 0.89 0.19 0.82 1.1 0.61 2.3 0.55 5.3 2.3 1.2 0.91
Radium 226 altu uCi/mL 6E-10 N/A 9.0E-10 2.00E-10 8.00E-10 1.00E-09 6.00E-10 2.00E-09 6.00E-10 5.00E-09 2.00E-09 1.00E-09 9.00E-10
Radium 226 altu MDC uCi/mL 3E-10 N/A 2.0E-10 2.00E-10 4.00E-10 2.OOE-10 2.00E-10 3.00E-10 5.00E-11 2.00E-10 1.00E-10 1.00E-10 2.00E-10
Radium 226 astu precision (8) uCi/mL 2E-10 N/A 2.0E-10 2.00E-10 3.00E-10 2.00E-10 2.00E-10 4.00E-10 1.0OE-10 5.00E-10 3.00E-10 2.00E-10 2.00E-10
Radium 226 MDC pCi/L. 0.27 N/A 0.24 0.25 0.37 0.18 0.2 0.27 0.05 0.16 0.14 0.14 0.19
Radium 226 precision (8) pCi/L. 0.24 N/A 0.23 0.17 0.33 0.21 0.21 0.4 0.13 0.46 0.3 0.2 0.23
Notes:
meq/L = milliequivalents per liter
mg/L = milligrams per liter
NIA = not analyzed
pCi/L = picocuries per liter
s.u. = standard unit
uCi/mL = microcuries per milliliter
' = value is less than the provided laboratory method reporting limit

0SMW-4S, cont.
Days Elapsed Since End of Injections: 147 182
Parameters Type Units 112112014 2/25/2014
RadionuclideslCOCs
Uranium Dissolved mg/L 0.114 0.084
Uranium Precision (5) Dissolved mg/L 0.0185 0.0136
Uranium, Activity Dissolved uCr/mL 7.7E-08 5.7E-08
Uranium, Activity precision (t) Dissolved uCi/mL 1.3E-08 9.2E-09
Molybdenum mg/L 0.37 0.37
Selenium mg/L 0.007 0.011
Vanadium mg/L '0.01 <0.01
Thorium 232 mg/L <0.005 <0.005
Cationsl Anions
A/C Balance (* 5) % -0.783 2.13
Anions meq/L 35.1 34.3
Bicarbonate as HCC3 mg/L 630 644
Calcium Dissolved mg/L 296 300
Cations meq/L 34.6 35.8
Chloride mg/L 295 266
Iron mg/L N/A NIA
Magnesium mg/L 53 57
Potassium mg/L 11 11
Sodium mg/L 347 366
Sulfate mg/L 708 735
General Chemistry
Carbonate as C03 mg/L <5 v5Nitrogen, Nitrate+Nitrite as N mg/L 1.63 1.65
pH s.u. 7.25 7.09
Solids, Total Dissolved Calculated mg/IL 2000 2100
Solids, Total Dissolved TDS @ 180 C mg/L 2100 2130
TDS Balance (0.80 - 1.20) unitless 1.020 1.020
Additional Performance Parameters
Arsenic Dissolved mg/L 0.017 0.017
Phosphorus, Ortho as P, dissolved Dissolved mg/L 18 10
Phosphorus, Ortho as P, dissolved italics are detection limit 18 10
Phosphorus, Total as P Total mg/L 12.5 15.8
Phosphorus, Total as P italics are detection limit 12.5 15.8
Radium 226 pCi/L 0.22 0.43
Radium 226 ahu uCi/mL 2.00E-10 4.00E-10
Radium 226 altu MDC uCi/mL 2.00E-10 2.00E-10
Radium 226 alto precision 1±) uCi/mL 1.00E-10 2.00E-10
Radium 226 MDC pCi/L 0.16 0.2
Radium 226 precision (i) pCi/L 0.12 0.17
Notes:
meq/L = mitliequivalents per liter
mg/L = milligrams per liter
N/A = not analyzed
pCi/L = picocuries per liter
s.u. = standard unit
uCi/mL = micrucuries per milliliter
< = value is less than the provided laboratory method reporting limit

SMW-4D End of Injections: 8127/2013 Start of Injection: 8/2112013
Days Eaped Since End of njecions: -8 -4 0 1 8 16 21 29 35 42 56 711 86 147Baseline1 /2213 /12031102,1
Parameters Type Units 8/1912013 8/23/2013 812712013 8/2802013 9/412013 912/12013 1120 10/83013 3 11/62013 110013 1021/2014
RadionuclideslCOCs
Uranium Dissolved mg/L 0.493 0.53 0.509 0.437 0.499 0.543 0.506 0.469 0.458 0.0566 0.295 0.230 0.165 0.065
Uranium Precision (i) Dissolved mg/L 0.080 N/A 0.082 0.071 0.0806 0.0876 0.0816 0.0758 0.0739 0.00914 0.0476 0.0372 0.0266 0.0105
Uranium, Activity Dissolved uCi/mL 3.3E-07 N/A 3.5E-07 3.0E-07 3.4E-07 3.7E-07 3.4E-07 3.2E-07 3.10E-07 3.8E-08 2.OOE-07 1.6E-07 1.1E-07 4.4E-08
Uranium, Activity precision (±) Dissolved uCi/mL 5.46-08 N/A 5.6E-08 4.8E-08 5.5E-08 5.9E-08 5.5E-08 5.1E-08 5.00E-08 6.2E-09 3.20E-08 2.5E-08 1.8E-08 7.1E-09
Molybdenum mg/L 0.54 N/A 0.32 0.41 0.3 0.2 0.17 0.14 0.13 0.22 0.18 0.20 0.26 0.54
Selenium mg/L 0.003 N/A v0.001 <0.001 <0.001 '0.001 <0.001 '0.001 <0.001 0.013 0.003 0.004 <0.001 v0.001
Vanadium mg/L <0.01 N/A '0.01 <0.01 <0.01 <0.01 <0.01 <0.01 <0.01 <0.01 <0.01 <0.01 <0.01 0.01
Thorium 232 mg/L <0.005 #M/A . <0.005 0.008 <0.005 <0.005 <0.005 <0.005 <0.005 <0.005 <0.005 <0.005 <0.005 <0.005
Cations/ Anions
A/C Balance (± 5) % -2.18 N/A -3.23 -4.57 -1.00 -0.43 -0.43 -0.82 -1.02 -1.26 1.99 2.11 1.16 0.423
Anions meq/L 33.8 N/A 42.1 61.5 64.4 92.8 107 116 113 107 101 89 82.8 53.3
Bicarbonate as HCD3 mg/L 532 N/A 485 491 448 418 405 384 382 399 404 419 431 501
Calcium Dissolved mg/L 250 N/A 330 498 526 820 984 1070 1050 983 997 868 765 458
Cations meq/L 32.4 N/A 39.4 56.1 63.1 92 106 114 111 105 105 92.8 84.7 53.8
Chloride mg/L 222 N/A 565 1270 1450 2540 3070 3330 3320 3070 2840 2390 2130 1030
Iron mg/L N/A N/A N/A N/A N/A N/A N/A N/A N/A N/A N/A N/A N/A N/A
Magnesium mg/L 66 N/A 87 129 140 194 221 224 211 198 181 145 130 76
Potassium mg/L 7 N/A 7 8 9 10 12 12 12 12 13 13 13 10
Sodium mg/L 330 N/A 361 469 577 803 890 968 944 896 920 857 816 561
Sulfate mg/L 905 N/A 873 849 779 690 669 757 643 685 676 708 750 777
General Chemistry
Carbonate as C03 mg/L '5 N/A <5 <5 <5 <5 <5 <5 <5 <5 <5 <5 <5 <5
Nitrogen, Nitrate+Nitrite as N mg/L <0.2 N/A 0.13 '0.06 <0.06 0.11 0.07 <0.1 <0.06 <0.06 0.09 <0.06 <0.06 <0.01
pH s.u. 7.39 N/A 7.43 7.33 7.35 7.24 7.17 7.14 7.16 7.10 7.06 7.09 6.96 7.14
Solids, Total Dissolved Calculated mg/L 2100 N/A 2500 3500 3700 N/A 6100 6600 6400 6100 5900 5200 4800 3200
Solids, Total Dissolved TDS @ 180 C mg/L 2070 N/A 2380 3900 4380 7600 8030 8630 8390 8190 7540 6200 5350 3320
TDS Balance (0.80 - 1.20) unitless 1.00 NIA 0.96 1.12 1.18 1.44 1.32 1.32 1.32 1.35 1.29 1.19 1.100 1.040
Additional Performance Parameters
Arsenic Dissolved mg/L 0.002 0.0047 0.005 0.004 0.004 0.009 0.01 0.01 0.006 0.006 0.006 0.008 0.008 0.011
Phosphorus, Ortho as P, dissolved Dissolved mg/L '0.2 <2.5 <0.2 <0.2 <0.2 <0.2 <0.2 <0.2 <1 <0.4 <4 <4 <2 2
Phosphorus, Ortho as P, dissolved italics am detection limit 0.2 2.5 0.2 0.2 0.2 0.2 0.2 0.2 I 0.4 4 4 2 2
Phosphorus, Total as P Total mg/L 0.03 3.90 0.68 0.62 0.4 0.33 0.3 0.44 0.7 0.5 0.672 1.48 1.41 3.7
Phosphorus, Total as P italics are detection irmit 0.03 3.9 0.68 0.62 0.4 0.33 0.3 0.44 0.7 0.5 0.672 1.48 1.41 3.7
Radium 226 pCi/L 1.7 N/A 1.3 1.9 3 3 5.8 4.5 2.7 2.4 3 1.8 4 1.3
Radium 226 altu uCi/mL 2.0E-09 N/A 1.0E-09 2.00E-09 3.00E-09 3.00E-09 6.00E-09 4.00E-09 3.00E-09 2.00E-09 3.06E-09 2.00E-09 4.00E-09 1.00E-09
Radium 226 altu MDC uCi/mL 3.0E-10 N/A 2.0E-10 3.00E-10 4.00E-10 2.00E-10 2.00E-10 3.00E-10 5.00E-11 2.00E-10 1.00E-10 1.00E-10 2.00E-10 2.00E-10
Radium 226 altu precision (a) uCi/mL 4.0E-10 N/A 3.0E-10 3.00E-10 5.00E-10 3.00E-10 5.00E-10 6.00E-10 3.00E-10 3.00E-10 3.00E-10 2.00E-10 4.00E-10 2.00E-10
Radium 226 MDC pCi/L 0.27 N/A 0.23 0.27 0.35 0.17 0.2 0.28 0.05 0.17 0.14 0.13 0.18 0.15
Radium 226 precision (±) pCi/L 0.35 N/A 0.26 0.33 0.53 0.32 0.54 0.55 0.29 0.32 0.34 0.24 0.42 0.22
Notes:
meq/L = milliequivalents per liter
mg/L = milligrams per liter
N/A = not analyzed
pCi/L = picocuries per liter
s.u. = standard unit
uCi/mL = microcuries per milliliter
' = value is less than the provided laboratory method reporting limit

SMW-4D, cont.
Days Elapsed Since End of Injections: 182
Parameters Type Units 2/2512014
Radionuclides/COCs
Uranium Dissolved mg/L 0.045
Uranium Precision (±) Dissolved mg/L 0.00747
Uranium, Activity Dissolved uCi/mL 3.1E-08
Uranium, Activity precision (5) Dissolved uCilmL 5.1 E-09
Molybdenum mg/L 0.619
Selenium mg/L 0.003
Vanadium mg/L <0.01
Thorium 232 mg/L <0.005
Cations/ Anions
A/C Balance (± 5) % 2.2
Anions meqlL 46.2
Bicarbonate as HCD3 mg/L 550
Calcium Dissolved mg/L 384
Cations meq/L 48.3
Chlodde mg/L 713
Iron mg/L NIA
Magnesium mg/L 64
Potassium mg/L 10
Sodium mg/L 544
Sulfate mgfL 786
General Chemistry
Carbonate as C03 mg/L v5
Nitrogen, Nitrate+Nitrite as N mg/L <0.06
pH so. 7.05
Solids, Total Dissolved Calculated mg/L 2800
Solids, Total Dissolved TDS @ 180 C mg/L 2850
TDS Balance 10.80 - 1.20) unitless 1.010
Additional Performance Parameters
Arsenic Dissolved mg/L 0.015
Phosphorus, Ortho as P, dissolved Dissolved mg/L 8
Phosphorus, Ortho as P, dissolved italics are detection linit 8
Phosphorus, Total as P Total mg/L 5.7
Phosphorus, Total as P italics are detection limit 5.7
Radium 226 pCilL 0.88
Radium 226 altu uCi/mL 9.00E-10
Radium 226 altu MDC uCi/mLi 2.00E-10
Radium 226 altu precision (±) uCi/mL 2.00E-10
Radium 226 MDC pCilL 0.2
Radium 226 precision () pCi/L1 0.21
Notes:
meq/L = milliequivalents per liter
mg/L = milligrams per liter
N/A = not analyzed
pCV/L = picocuries per titer
s.u. = standard unit
uCi/mL = microcuries per milliliter
< = value is less than the provided laboratory method reporting limit

SMW-5S End of Injections: 8/2712013 Start of Injection: 8/21/2013
Days Elapsed Since End of Injections: Base-in-12 • -seline112 0 1 8 15 22 29 35 71 147 182
Parameters Type Units 611511151 2013 8f2 7,2013 8/28/2013 9/4/2013 9/11/2013 9/18/12013 013 30/1/01 2013 P2110013 2/25/2014
Radionuclides/COCs
Uranium Dissolved mg/L N/A 0.439 0.483 0.470 0.457 0.448 0.467 0.504 0.501 0.517 0.475 0.399
Total 10 N/A N/A N/A N/A N/A N/A N/A N/A N/A N/A N/A
Uranium Precision (±) Dissolved mg/L NIA 0.071 0.078 0.076 0.0737 0.0722 0.0754 0.0814 0.0808 0.0835 0.0767 0.0644
Uranium. Activity Dissolved uCi/mL NIA 3.0E-07 3.3E-07 3.2E-07 3.1E-07 3.0E-07 3.2E-07 3.4E-07 3.4E-07 3.50E-07 3.2E-07 2.70E-07
Uranium, Activity precision (i) Dissolved uCVmL N/A 4.8E-08 5.3E-08 5.1E-08 5.0E-08 4.9E-08 5.1E-08 5.5E-08 5.5E-08 5.70E-08 5.2E-08 4.40E-08
Molybdenum mg/L NIA 0.63 0.65 0.68 0.68 0.69 0.71 0.71 0.71 0.779 0.71 0.71
Selenium mg/L NIA 0.011 0.012 0.013 0.013 0.012 0.013 0.012 0.011 0.01 0.007 0.009
Vanadium mg/L N/A <0.01 <0.01 <0.01 <0.01 0.01 0.01 '0.01 <0.01 <0.01 '0.01 <0.01
Thonum 232 mg/L NIA <0.005 <0.005 <0.005 <0.005 <0.005 <0.005 <0.005 <0.005 <0.005 <0.005 <0.005
Cations/ Anions
A/C Balance (± 5) % NIA -1.07 -3.68 -0.36 -0.70 -2.03 -0.521 -1.12 -2.76 1.87 0.212 2.03
Anions meq/L NIA 31.5 33.1 32.3 33.2 33 32.5 32.8 32.6 31.7 31.1 32
Bicarbonate as HCD3 mg/L NIA 581 588 577 596 595 589 579 575 545 548 588
Calcium Dissolved mg/L NIA 245 248 253 258 250 251 251 240 247 244 255
Cations meq/L NIA 30.8 30.8 32.1 32.7 31.7 32.2 32 30.9 32.9 31.2 33.3
Chloride mg/L NIA 222 237 230 235 234 232 236 237 234 235 239
Iron mg/L NIA N/A N/A N/A N/A N/A N/A N/A N/A N/A N/A N/A
Magnesium mg/L NIA 65 67 68 69 67 68 67 66 68 68 71
Potassium mg/L NIA 5 6 5 6 5 5 5 5 5 5 6
Sodium mg/L N/A 301 295 315 322 312 320 318 307 341 306 335
Sulfate mg/L N/A 754 808 786 807 799 783 793 794 776 744 747
General Chemistry
Carbonate as C03 mg/L NIA <5 <5 <5 <5 <5 <5 <5 <5 <5 <5 <5
Nitrogen, Nitrate+Nitrite as N mg/L N/A 1.37 1.34 1.41 1.37 1.32 1.36 1.4 1.25 1.09 0.99 1.38
pH s.u. N/A 7.25 7.27 7.20 7.20 7.16 7.12 7.21 7.24 7.31 7.28 7.12
Solids, Total Dissolved Calculated mg/L N/A 1900 2000 2000 2000 N/A 2000 2000 1900 2000 1900 2000
Solids, Total Dissolved TDS @ 180 C mg/L N/A 2060 2060 2050 2060 2010 1980 1990 1990 1950 1970 2020
TDS Balance (0.80 - 1.20) unitless N/A 1.080 1.04 1.04 1.02 1.01 1.00 1.00 1.030 0.99 1.040 1.020
Additional Performance Parameters
Arsenic Total ug/L 4.6 N/A N/A N/A N/A N/A N/A N/A N/A N/A N/A N/A
Arsenic Dissolved mg/L N/A <0.001 0.002 0.002 0.001 0.002 0.001 0.002 <0.001 0.001 <0.001 <0.001
Phosphorus, Ortho as P, dissolved Dissolved mg/L <2.5 <0.2 <0.2 <0.2 <0.2 <0.2 <0.2 <0.2 <0.4 <0.4 <0.4 <0.4
Phosphorus, Ortho as P, dissolved italics am detection limit 2.5 0.2 0.2 0.2 0.2 0.2 0.2 0.2 0.4 0.4 0.4 0.4
Phosphorus, Total as P Total mg/L <0.05 0.01 0.035 0.026 0.024 0.019 0.035 0.03 0.063 0.069 0.027 0.03
Phosphorus, Total as P italics are detection imfit 0.05 0.014 0.035 0.026 0.024 0.019 0.035 0.03 0.063 0.069 0.027 0.03
Radium 226 pCi/L N/A 0.97 0.9 0.38 0.43 0.62 0.16 1.4 0.48 0.58 0.41 0.33
Radium 226 aitu uCi/mL N/A 1.0E-09 9.g0-10 4.00E-10 4.006-10 6.00E-10 2.00E-10 1.00E-09 5.00E-10 6.00E-10 4.00E-10 3.00E-10
Radium 226 altu MDC uCi/mL N/A 1.06-10 2.0E-10 3.006-10 4.008-10 2.00E-10 2.00E-10 3.00E-10 6.00E-11 1.00E-10 2.00E-10 2.00E-10
Radium 226 altu precision (u) uCi/mL N/A 2.0E-10 2.0E-10 2.00E-10 3.00E-10 2.00E-10 1.00E-10 3.00E-10 1.00E-10 2.00E-10 2.00E-10 2.00E-10
Radium 226 MDC pC//L N/A 0.14 0.23 0.28 0.37 0.18 0.2 0.27 0.06 0.15 0.16 0.2
Radium 226 precision (±) pCiIL N/A 0.19 0.23 0.21 0.28 0.17 0.14 0.33 0.13 0.16 0.15 0.16
Notes:
meq/L = milliequivalents per liter
mg/L = milligrams per liter
N/A = not analyzed
pCV/L = picocuries per liter
s.u. = standard unit
uCi/mL = microcuries per milliliter
< = value is less than the provided laboratory method reporting limit

0 0SMW-5D End of Injections: 8/2712013 Start of Injection: 8/21(2013
Days Elapsed Since End of Injections: Baseline12 Baseline12 0 1 8 15 22 29 35 11/203 071 147 182
Parameters Type Units 8/15/2013 8/15/2013 8/27,2013 8/28/2013 9/4/2013 9/11/2013 9/18/2013 9/25/2013 //20 11 13 1/21/2014 2/25,2014
RadionuclideslCOCs
Uranium Dissolved mg/L N/A 0.178 0.146 0.12 0.168 0.217 0.21 0.234 0.218 0.293 0.270 0.324
Total 0.91 N/A N/A N/A N/A N/A N/A NIA N/A N/A N/A N/A
Uranium Precision (4) Dissolved mg/L N/A 0.029 0.024 0.0194 0.0270 0.0351 0.0339 0.0377 0.0352 0.0473 0.0435 0.0523
Uranium. Activity Dissolved uCi/mL N/A 1.2E-07 9.9E-08 8.2E-08 1.1 E-07 1.5E-07 1.4E-07 1.6E-07 1.5E-07 2.00E-07 1.8E-07 2.2E-07
Uranium, Activity precision (I) Dissolved uCi/mL N/A 1.9E-08 1.6E-08 1.3E-08 1.8E-08 2.4E-08 2.3E-08 2.6E-08 2.4E-08 3.20E-08 3.0E-08 3.5E-08
Molybdenum mg/L N/A 0.087 0.019 0.011 0.018 0.019 0.019 0.021 0.033 0.021 0.017 0.023
Selenium mg/L N/A 0.016 0.011 0.008 0.017 .0.32 0.026 0.02 0.02 0.044 0.032 0.072
Vanadium mg/L N/A <0.01 <0.01 <0.02 <0.01 <0.01 0.02 <0.01 <0.01 <0.01 <0.01 <0.01
Thorium 232 mg/L N/A <0.005 <0.005 <0.006 <0.005 <0.005 <0.005 <0.005 <0.005 <0.005 <0.005 <0.005
Cations/ Anions
A/C Balance (± 5) % N/A -1.53 -3.57 -1.96 -1.40 -2.34 -0.65 -1.51 -0.95 2.21 0.329 3.42
Anions meqlL NIA 52.5 53.5 53.9 41.7 40.3 40.3 41.5 42.7 40.6 46.7 45.5
Bicarbonate as HCO3 mg/L N/A 578 572 590 435 421 431 440 474 437 549 503
Calcium Dissolved mg/L N/A 436 431 455 322 307 313 318 330 329 371 361
Cations meq/L N/A 50.9 49.5 51.8 40.6 38.5 39.7 40.2 41.9 42.5 47.1 48.8
Chloride mg/L N/A 272 273 287 145 139 137 146 147 139 208 151
Iron mg/L N/A NIA N/A N/A N/A N/A N/A N/A N/A N/A N/A N/A
Magnesium mg/L N/A 111 111 116 85 81 84 84 88 85 100 100
Potassium mg/L N/A 7 7 7 6 6 6 6 6 6 7 7
Sodium mg/L N/A 457 436 447 399 375 393 397 413 433 463 514
Sulfate mg/L N/A 1700 1750 1730 1460 1420 1410 1450 1480 1420 1530 1590
General Chemistry
Carbonate as C03 mg/L N/A <5 <5 '5 <5 <5 <5 <5 <5 <5 <5 <5
Nitrogen, Nitrate-Nitrite as N mg/L N/A 0.05 0.02 0.03 0.04 0.1 0.07 <0.1 0.09 0.21 0.17 0.5
pH s.u. N/A 7.29 7.30 7.28 7.43 7.39 7.36 7.41 7.49 7.49 7.44 7.3
Solids, Total Dissolved Calculated mg/L N/A 3300 3300 3400 2700 N/A 2600 2600 2700 2600 3000 3000
Solids, Total Dissolved TDS @ 180 C mg/L N/A 3480 3420 3560 2710 2580 2600 2700 2780 2720 3160 3040
TDS Balance (0.80 - 1.20) unitless N/A 1.06 1.03 1.06 1.02 1.01 1.01 1.02 1.030 1.03 1.060 1.020
Additional Performance Parameters
Arsenic Total mg/L <0.002 0.002 0.003 0.003 0.003 0.003 0.003 0.003 0.002 0.002 0.002 0.002
Phosphorus, Ortho as P, dissolved Dissolved mg/L '2.5 <0.2 <0.2 <0.2 <0.2 <.2 <0.2 <0.2 <4 <0.2 <.2 <0.2
Phosphorus, Ormho as P, dissolved italics am detection limit 2.5 0.2 0.2 0.2 0.2 0.2 0.2 0.2 4 0.2 0.2 0.2
Phosphorus, Total as P Total mg/L <0.05 0.02 0.079 0.14 0.056 0.04 0.029 0.037 0.03 0.021 0.024 0.018
Phosphorus, Total as P italics are detection limit 0.05 0.016 0.079 0.14 0.056 0.04 0.029 0.037 0.03 0.021 0.024 0.018
Radium 226 pCi/IL N/A 1.5 1.6 1.6 1.4 1.8 1.5 2.2 1.1 0.85 1.8 1.1
Radium 226 astu uCi/mL N/A 2.0E-09 2.0E-09 2.00E-09 1.00E-09 2.00E-09 2.00E-09 2.00E-09 1.00E-09 9.00E-10 2.00E-09 1.00E-09
Radium 226 altu MDC uCi/mL N/A 1.0E-10 2.0E-10 3.00E-10 4.00E-10 2.00E-10 2.00E-10 4.00E-10 6.00E-11 1.00E-10 2.00E-10 2.00E-10
Radium 226 altu precision (I) uCi/mL N/A 2.0E-09 3.0E-10 3.00E-10 4.00E-10 3.00E-10 3.00E-10 3.00E-10 2.00E-10 2.00E-10 3.00E-10 2.00E-10
Radium 226 MDC pCi/L N/A 0.15 0.23 0.27 0.37 0.18 0.19 0.26 0.06 0.14 0.15 0.19
Radium 226 precision (I) pCL/L N/A 0.24 0.28 0.31 0.39 0.26 0.26 0.39 0.19 0.18 0.26 0.23
Notes:
meq/L = milliequivalents per liter
mg/L = milligrams per liter
N/A = not analyzed
pC/L = picocuries per liter
s.u. = standard unit
uCi/mL = microcuries per milliliter
< = value is less than the provided laboratory method reporting limit

0SMW-6 End of Injections: 8127/2013 Start of Injections: 8/2112013
Days Elapsed Since End of Injections: -8 0 16 35 71 147Baseline
Parameters Type Units 8/19/2013 8/27/2013 9/12/2013 10/1/2013 11/6/2013 1/21/2014
RadionuclideslCOCs
Uranium Dissolved mg/L 2.53 2.50 1.95 2.03 1.97 3.51
Uranium Precision (5) Dissolved mg/L 0.408 0.404 0.315 0.327 0.319 0.5660
Uranium, Activity Dissolved uCi/mL 1.7E-06 1.7E-06 1.3E-06 1.4E-06 1.3E-06 2.4E-06
Uranium, Activity precision (±) Dissolved uCi/mL 2.8E-07 2.7E-07 2.1E-07 2.2E-07 2.2E-07 3.86-07
Molybdenum mg/L 2.51 2.2 2.19 2.09 2.06 3.02
Selenium mg/L 0.048 0.052 0.035 0.039 0.042 0.096
Vanadium mg/L 0.01 <0.01 0.01 <0.01 <0.01 <0.01
Thorium 232 mg/L v0.005 <0.005 <0.005 <0.005 <0.005 <0.005
Cations/ Anions
A/C Balance (± 5) % -2.07 -1.57 -2.43 -1.38 1.75 -0.39
Anions meq/L 37.8 38.3 37.1 37.1 37.2 43
Bicarbonate as HCO3 mg/L 576 596 563 559 577 603
Calcium Dissolved mg/L 265 274 268 273 289 319
Cations meq/L 36.3 37.1 35.3 36.1 38.5 42.6
Chloride mg/L 235 237 252 234 232 231
Iron mg/L N/A N/A N/A NIA N/A NIA
Magnesium mg/L 79 79 77 80 83 96
Potassium mg/L 6 6 6 6 6 7
Sodium mg/L 376 386 354 361 394 429
Sulfate mg/L 1030 1050 993 1020 1020 1280
General Chemistry
Carbonate as C03 mg/L <5 <5 <5 <5 <5 v5Nitrogen, Nitrate+Nitrite as N mg/L 2.6 2.97 2.19 2.47 2.69 5.43
pH s.u. 7.20 7.29 7.17 7.23 7.30 7.25
Solids, Total Dissolved Calculated mg/L 2300 2400 N/A 2200 2300 2700
Solids, Total Dissolved TDS @ 180 C mg/L 2390 2390 2260 2310 2350 2720
TDS Balance (0.80 - 1.20) unitless 1.03 1.020 1 1.03 1.01 1.01
Additional Performance Parameters
Arsenic Dissolved mg/L v0.001 0.002 0.002 0.001 0.001 0.003
Phosphorus, Ortho as P, dissolved Dissolved mg/L <0.2 <0.2 0.6 <0.4 <0.4 <0.4
Phosphorus. Ortho as P, dissolved italics are detection limit 0.2 0.2 0.6 0.4 0.4 0.4
Phosphorus, Total as P Total mg/L 0.05 0.03 0.02 0.07 0.067 0.023
Phosphorus, Total as P italics are detection limit 0.05 0.031 0.02 0.07 0.067 0.023
Radium 226 pCV/L 0.71 0.85 0.8 0.67 0.44 0.9
Radium 226 altu uCi/mL 7.0E-09 8.0E-10 8.00E-10 7.00E-10 4.00E-10 9.00E-10
Radium 226 altu MDC uCi/mL 3.0E-10 2.0E-10 2.00E-10 6.00E-11 1.00E-10 1.00E-10
Radium 226 aftu precision (±) uCi/mL 3.0E-10 2.0E-10 2.00E-10 2.00E-10 1.00E-10 2.00E-10
Radium 226 MDC pC/iL 0.28 0.23 0.19 0.06 0.13 0.15
Radium 226 precision (±) pCi/L 0.26 0.22 0.2 0.15 0.14 0.19
Notes:
meq/L = milliequivalents per liter
mg/L = milligrams per liter
N/A = not analyzed
pCi/L = picocuries per liter
su., = standard unit
uCi/mL = microcuries per milliliter
< = value is less than the provided laboratory method reporting limit

Sxlw End of Injections: 8/27/2013 Start of Injection: 8/21/2013
Days Elapsed Since End of Injections: Baseline70 1 1 15 10/21/201551 112 182
Parameters Type Units 6/18/2013 8/28/2013 8/28/2013 9/11/2013 3 12/17/2013 2/25/2014
RadionuclideslCOCsUranium Dissolved mg/L 4.63 0.08 0.10 0.04 0.024 0.031 0.030
Uranium Precision (u) Dissolved mg/L 0.747 N/A 0.016 0.006 0.004 0.005 0.005Uranium, Activity Dissolved uCi/mL 3.1E-07 N/A 6.8E-08 2,4E-08 1.6E-08 2.1E-08 2.OE-08
Uranium, Activity precision (u) Dissolved uCi/mL 5.1E-08 N/A 1.1 E-08 3.9E-09 2.6E-09 3.4E-09 3.3E-09
Molybdenum mg/L 1.79 N/A 0.31 0.3 0.35 1.07 1.44
Selenium mg/L 0.382 N/A 0.034 0.027 0.059 0.153 0.134Vanadium mg/L N/A N/A <0.01 <0.01 <0.01 0.02 0.03
Thorium-232 mg/L N/A N/A <0.005 0.007 0.02 <0.005 <0.005
Cations/ AnionsA/C Balance (± 5) % -1.60 N/A 0.26 -0.78 -1.31 -1.22 3.29Anions meq/L 38.1 N/A 131 39.6 67.8 78.3 59
Bicarbonate as HCD3 mg/L 505 N/A 81 70 171 295 404
Calcium Dissolved mg/L 161 2500 2220 554 724 733 464
Cations meq/L 36.9 N/A 132 39 66.1 76.4 63Chloride mg/L 274 N/A 4520 1250 2080 2070 1170
Iron mg/L <0.03 N/A N/A N/A NIA N/A N/A
Magnesium mg/L 45.2 N/A 19 11 41 59 43Potassium mg/L 2.7 N/A 44 12 17 19 14
Sodium mg/L 578 N/A 425 233 601 793 827
Sulfate mg/L 1050 N/A 109 83 181 507 679
General Chemistry
Alkalinity, Total as CaCO3 mg/L 414 N/A NIA N/A N/A N/A N/A
Carbonate as C03 mg/L <5 N/A <5 <5 <5 <5 <5Nitrogen, Nitrate-Nitrite as N mg/L NIA N/A 2.5 2.57 2.76 3.17 2.4
pH s.u. 7.55 N/A 6.67 6.52 6.46 6.46 6.59
Solids, Total Dissolved Calculated mg/L 2400 N/A 7400 2200 3800 4400 3500
Solids, Total Dissolved TDS @ 180 C mg/L 2500 N/A 13400 4020 5400 4720 3690TDS Balance (0.80 - 1.20) unitless 1.04 N/A 1.81 1.82 1.43 1.07 1.06
Additional Performance ParametersArsenic Dissolved mg/L N/A 0.0048 0.015 0.013 0.047 0.093 0.115
Phosphorus, Ortho as P, dissolved Dissolved mg/L N/A <50 3.5 14.1 27 46 55Phosphorus, Total as P Total mg/L N/A 69 74 22.4 97 66.6 63.4Radium 226 pCi/L N/A N/A 1.4 0.29 6.1 1.0 0.27
Radium 226 altu uCi/mL N/A N/A 1.0E-09 3.00E-10 6.00E-09 1.00E-09 3.00E-10Radium 226 altu MDC uCi/mL N/A N/A 2.OE-10 2.00E-10 2.00E-10 2.00E-10 2.00E-10
Radium 226 altu precision (u) uCi/mL N/A N/A 3.OE-10 1.00E-10 5.00E-10 2.OOE-10 2.00E-10Radium 226 MDC pCi/L N/A N/A 0.22 0.17 0.19 0.16 0.2
Radium 226 precision (u) pCi/L NIA N/A 0.26 0.14 0.5 0.19 0.15
Notes:
meq/L = milliequivalents per litermg/L = milligrams per liter
N/A = not analyzed
pCi/L = picocuries per liter
s.u. = standard unit
uCi/mL = microcudes per milliliter
< = value is less than the provided laboratory method reporting limit

0 0XDR-1 End of Injections: 8/27/2013 Start of Injection: 8/21/2013
Days Elapsed Since End of Injections: -70e1ne7O 1 -51 7 15 151 122 34 55 701 112Parameters Type Units 6/18/2013 8/16/2013 8/22/2013' 8128/2013 812812 913121111/ 831 1111 2013 9/18/201 9/30/2013 10/21/2013 11/52013 12/17/2013
RadionuclideslCOCsUranium Dissolved mg/L 5.25 N/A 4.20 2.20 2.41 4.91 2.30 2.62 2.67 2.94 2.92 3.22 3.560
Total N/A 5.2 N/A N/A N/A N/A N/A N/A N/A N/A N/A N/A N/AUranium Precision (±) Dissolved mg/L 0.847 N/A N/A N/A 0.388 0.792 N/A 0.422 0.43 0.474 0.471 0.52 0.575
Uranium, Activity Dissolved uCi/mL 3.6E-06 N/A NIA NIA 1.6E-06 3.3E-06 N/A 1.8E-06 1.80E-06 2.OOE-06 2.0E-06 2.2E-06 2.4E-06
Uranium, Activity precision (+) Dissolved uCi/mL 5.7E-07 N/A NIA NIA 2.6E-07 5.4E-07 N/A 2.9E-07 2.90E-07 3.20E-07 3.2E-07 3.5E-07 3.9E-07
Molybdenum mg/L 1.16 N/A N/A N/A 2.20 1.76 N/A 1.86 1.83 2.03 1.94 1.98 1.74
Selenium mg/L 0.344 N/A N/A N/A 0.252 0.448 N/A 0.229 0.253 0.276 0.273 0.2 0.157Vanadium mg/L N/A N/A N/A N/A 0.03 0.01 N/A 0.03 0.02 0.02 0.03 0.03 0.03
Thorium-232 mg/L N/A N/A N/A N/A <0.005 0.047 N/A 1 0.005 u0.005 <0.005 0.012 0.01 <0.005
Cations/ Anions
A/C Balance (± 5) % 0.15 N/A NIA N/A -2.04 -1.87 N/A -0.44 -1.86 -1.11 -0.413 2.18 -3.92Anions meq/L 37.5 N/A NIA N/A 70.5 77.5 N/A 71.8 72.1 67.1 63.1 55.5 45.2
Bicarbonate as HCO3 mg/L 490 N/A NIA N/A 426 380 N/A 394 417 441 487 619 604
Calcium Dissolved mg/L 186 N/A 200 400 332 405 380 373 371 346 320 282 207Cations meq/L 37.7 N/A N/A N/A 67.6 74.6 N/A 71.2 69.5 65.6 62.6 58 41.8
Chloride mg/L 270 N/A NIA N/A 1640 2030 N/A 1790 1740 1470 1280 964 554
Iron mg/L u0.03 N/A NIA N/A N/A N/A N/A N/A NIA N/A N/A N/A N/AMagnesium mg/IL 51.4 N/A N/A N/A 91 108 N/A 100 98 92 84 79 54
Potassium mg/IL 3.7 N/A N/A N/A 5 5 N/A 5 5 4 4 4 3
Sodium mg/L 553 N/A N/A N/A 1000 1040 N/A 1020 984 935 909 858 620Sulfate mg/L 1040 N/A N/A N/A 810 657 N/A 691 754 837 882 836 908
General ChemistryAlkalinity, Total as CaCO3 mg/L 401 N/A N/A N/A N/A N/A N/A N/A NIA N/A N/A N/A N/A
Carbonate as C03 mg/L <5 N/A N/A N/A <5 <5 N/A <5 <5 <5 <5 <5 <5Nitrogen, Nitrate+Nitdte as N mg/IL N/A N/A N/A N/A 4.08 4.12 N/A 3.85 4.22 5.00 3.83 3.67 2.13
pH s.u. 7.47 N/A N/A N/A 7.16 7.23 N/A 7.23 7.1 7.14 7.11 7.18 7.28
Solids, Total Dissolved Calculated mg/L 2400 N/A N/A N/A 4100 4500 N/A 4200 4200 4000 3800 3400 2700
Solids, Total Dissolved TDS @ 180 C mg/L 2420 N/A N/A N/A 4040 4940 N/A 4390 4240 3940 4030 3410 2770TDS Balance 10.80 - 1.20) unitless 1.01 N/A N/A N/A 0.98 1.1 N/A 1.04 1.01 1 1.07 1.01 1.03
Additional Performance ParametersArsenic Total mg/L N/A 0.0025 N/A N/A N/A NIA N/A NIA NIA N/A N/A N/A N/AArsenic Dissolved mg/L N/A N/A 0.0085 0.026 0.029 0.024 0.03 0.032 0.034 0.045 0.041 0.044 0.042
Phosphorus, Ortho as P, dissolved Dissolved mg/L N/A <2.5 <2.5 <25 3.9 3 <500 3.9 3.9 10 6 5 8Phosphorus, Total as P Total mg/L N/A 0.25 7 11 10.5 5.3 7.5 6.2 5.6 7.89 6.84 7.31 6.83
Radium 226 pCi/L N/A NIA N/A N/A 0.67 0.92 N/A 0.95 1.1 0.67 4 0.98 1.1Radium 226 altu uCi/mL N/A N/A N/A N/A 7.0E-10 9.00E-10 N/A 1.00E-09 1.00E-09 7.00E-10 4.OOE-09 1.00E-09 1.00E-09
Radium 226 altu MDC uCi/mL N/A N/A N/A N/A 2.0E-10 3.00E-10 N/A 1.00E-10 2.00E-10 3.00E-10 2.OOE-10 1.00E-10 2.00E-10
Radium 226 altu precision (t) uCi/mL N/A N/A N/A N/A 2.0E-10 3.00E-10 N/A 2.OOE-10 2.00E-10 3.00E-10 4.OOE-10 2.00E-10 2.00E-10Radium 226 MDC pCi/L N/A N/A N/A N/A 0.22 0.34 N/A 0.14 0.19 0.31 0.17 0.12 0.17
Radium 226 precision (±) pCi/L N/A N/A N/A N/A 0.20 0.32 N/A 0.19 0.22 0.27 0.39 0.18 0.2
Notes:
meq/L = milliequivalents per litermg/L = milligrams per liter
N/A = not analyzed
pCi/L = picocunes per liter
s.u. = standard unituCi/mL = microcunes per milliliter< = value is less than the provided laboratory method reporting limit

0XDR-1, cont.
Days Elapsed Since End of Injections: 148 182
Parameters Type Units 112212014 2/25/2014
Radionuclides/COCsUranium Dissolved mg/L 4.930 5.560
Total N/A N/AUranium Precision (+) Dissolved mg/L 0.795 0.897Uranium, Activity Dissolved uCi/mL 3.3E-06 3.8E-06Uranium, Activity precision (±) Dissolved uCi/mL 5.4E-07 6.1E-07
Molybdenum mg/L 1.31 1.33Selenium mg/L 0.129 0.119Vanadium mg/L 0.02 0.03
Thorium-232 mg/L 0.007 <0.005Cations/ Anions
A/C Balance (± 5) % -2.46 4.71Anions meqIL 41.1 38.5Bicarbonate as HCO3 mg/L 619 645Calcium Dissolved mg/L 180 179Cations meq/L 39.1 42.3Chloride mg/L 413 314Iron mg/L N/A N/AMagnesium mg/L 50 50Potassium mg/L 3 3Sodium mg/L 595 670Sulfate mg/L 898 879
General ChemistryAlkalinity, Total as CaCO3 mg/L N/A N/ACarbonate as C03 mg/L <5 <5Nitrogen, Nitrate-Nitrite as N mg/L 1.67 1.45pH s.u. 7.38 7.29Solids. Total Dissolved Calculated mg/L 2500 2500Solids, Total Dissolved TDS @ 180 C mg/L 2580 2470TDS Balance 10.80 - 1.20) unitless 1.04 1
Additional Performance ParametersArsenic Total mg/L N/A N/AArsenic Dissolved mg/IL 0.041 0.03Phosphorus, Ortho as P, dissolved Dissolved mg/L 5.2 8Phosphorus, Total as P Total mg/L 6.7 6.14Radium 226 pCi/L 0.61 0.47Radium 226 altu uCi/mL 6.00E-10 5,O0E-10Radium 226 altu MDC uCi/mL 2.00E-10 2.OOE-10Radium 226 altu precision (±) uCi/mL 2.00E-10 2.O0E-10Radium 226 MDC pCi/L 0.17 0.19Radium 226 precision (±) pCi/L 0.18 0.17
Notes:
meq/L = milliequivalents per litermg/L = milligrams per liter
N/A = not analyzed
pCi/L = picocuries per liter
s.u. = standard unituCi/mL = microcuries per milliliter< = value is less than the provided laboratory method reporting limit

0 0XDR-2 End of Injections: 8127/2013 Start of Injection: 8121/2013
Days Elapsed Since End of Injections: Baseline70 Baseline-11 '-5 1 7 9/11 15 22 34 55 70 112 148 182
Parameters Type Units 6/18/2013 8116/1221 2013 8/28/2013 9/3/2013 112013 9/18/2013 9/30/2013 10/21/2013 11/5/2013 122013 013 1/22/2014 2/25/2014
RadlonuclideslCOCsUranium Dissolved mg/L 6.1 N/A 4.7 4.41 4.52 4.08 3.99 3.65 3.69 3.57 3.18 3.2 3.24Uranium Precision (+) Dissolved mg/L 0.984 N/A N/A 0.713 0.730 0.659 0.6430 0.589 0.595 0.577 0.513 0.5170 0.5230Uranium, Activity Dissolved uCi/mL 4.1E-06 N/A N/A 3.0E-06 3.1E-06 2.8E-06 2.7E-06 2.50E-06 2.50E-06 2.4E-06 2.2E-06 2.2E-06 2.2E-06
Uranium, Activity precision (+) Dissolved uCi/mL 6.7E-07 N/A N/A 4.8E-07 4.9E-07 4.5E-07 4.4E-07 4.00E-07 4.OOE-07 3.9E-07 3.5E-07 3.5E-07 3.5E-07
Molybdenum mg/L 0.95 N/A N/A 2.18 1.82 2.15 1.88 1.91 1.62 1.96 2.52 2.09 2.13Selenium mg/L 0.359 N/A N/A 0.297 0.301 0.298 0.324 0.299 0.266 0.276 0.203 0.143 0.128Vanadium mg/L N/A N/A N/A 0.02 <0.01 <0.01 0.02 <0.01 0.03 0.08 0.01 <0.01 0.02Thorium-232 mg/L N/A N/A N/A 0.014 <0.005 <0.005 <0.005 <0.005 <0.005 <0.005 <0.005 <0.005 <0.005
Cationsl AnionsA/C Balance (± 5) % -0.27 N/A N/A 0.07 0.32 0.65 -1.02 0.717 1.7 2.06 -2.29 -2.87 0.29Anions meq/L 37.7 N/A N/A 79.5 67.9 63.1 63.2 61.5 65.5 66.9 53 47.1 41.3
Bicarbonate as HCO3 mg/L 497 N/A N/A 432 465 460 466 467 444 495 558 603 607Calcium Dissolved mg/L 187 N/A 190 478 402 361 334 331 367 352 233 189 177Cations meq/L 37.5 N/A N/A 79.6 68.4 63.9 61.9 62.4 67.7 69.7 50.7 44.4 41.5Chloride mg/L 270 N/A N/A 1930 1500 1310 1290 1270 1500 1510 886 650 479Iron mg/L <0.03 N/A N/A N/A N/A N/A N/A N/A N/A N/A N/A N/A N/AMagnesium mg/L 51.7 N/A N/A 141 116 102 95 91 104 103 63 54 50Potassium mg/L 3.5 N/A N/A 7 5 5 5 4 5 5 4 3 3Sodium mg/L 547 N/A N/A 1010 889 859 857 880 936 1000 776 702 656Sulfate mg/L 1040 N/A N/A 868 857 895 924 865 764 754 889 976 842
General ChemistryAlkalinity, Total as CaCD3 mg/L 407 N/A N/A N/A N/A N/A N/A N/A N/A N/A N/A N/A N/A
Carbonate as C03 mg/L <5 N/A N/A <5 <5 <5 <5 <5 <5 <5 <5 <5 <5Nitrogen, Nitrate+Nitite as N mg/L N/A N/A N/A 4.47 4.55 5.51 4.9 4.38 4.93 4.68 2.93 1.98 1.64pH s.u. 7.45 N/A N/A 7.25 7.27 7.21 7.16 7.21 7.14 7.17 7.25 7.4 7.25
Solids, Total Dissolved Calculated mg/L 2400 N/A N/A 4700 4000 3800 3800 3700 3900 4000 3200 2800 2600Solids, Total Dissolved TDS @ 180 C mg/l 2480 N/A N/A 4750 4310 4090 3820 3840 4160 4120 3310 2880 2710TDS Balance (0.80 - 1.20) unitless 1.03 N/A N/A 1.01 1.07 1.08 1.01 1.04 1.06 1.02 1.04 1.02 1.06
Additional Performance ParametersArsenic Total mg/L N/A <0.002 <0.002 N/A N/A N/A N/A N/A N/A N/A N/A N/A N/AArsenic Dissolved mg/L N/A N/A <0.002 0.006 0.006 0.008 0.008 0.007 0.01 0.013 0.022 0.032 0.022Phosphorus. Ortho as P, dissolved Dissolved mg/L N/A 5.7 <2.5 <0.2 <0.4 <0.4 0.50 <1 <1 <1 4 5.8 3
Phosphorus, Total as P Total mg/L N/A <0.05 0.086 0.39 0.44 0.6 0.50 0.5 0.93 1.42 2.87 3.61 3.3Radium 226 pCi/L N/A N/A N/A 1.1 0.64 0.98 1.1 0.82 4.1 1 0.86 0.77 0.47Radium 226 altu uCi/mL N/A N/A N/A 1.0E-09 6.00E-10 1.00E-09 1.00E-09 8.00E-10 4.00E-09 1.00E-09 9.00E-10 8.00E-10 5.00E-10Radium 226 altu MDC uCi/mL N/A N/A N/A 2.0E-10 3.00E-10 1.00E-10 2.00E-10 3.00E-10 4.00E-10 1.00E-10 2.00E-10 2.00E-10 2.00E-10Radium 226 altu precision (C) uCi/mL N/A N/A N/A 2.0E-10 3.00E-10 2.00E-10 2.00E-10 3.00E-10 2.00E-10 2.00E-10 2.00E-10 2.00E-10 2.00E-10Radium 226 MDC pCi/L N/A N/A N/A 0.21 0.34 0.14 0.17 0.31 0.17 0.12 0.16 0.17 0.18
Radium 226 precision (+) pCi/L N/A N/A N/A 0.23 0.29 0.19 0.21 0.29 0.39 0.19 0.18 0.19 0.16
Notes:meq/L = milliequivalents per liter
mg/L = milligrams per liter
N/A = not analyzed
pCi/IL = picocuries per liter
s.u. = standard unit
uCi/mL = microcuries per milliliter< = value is less than the provided laboratory method reporting limit
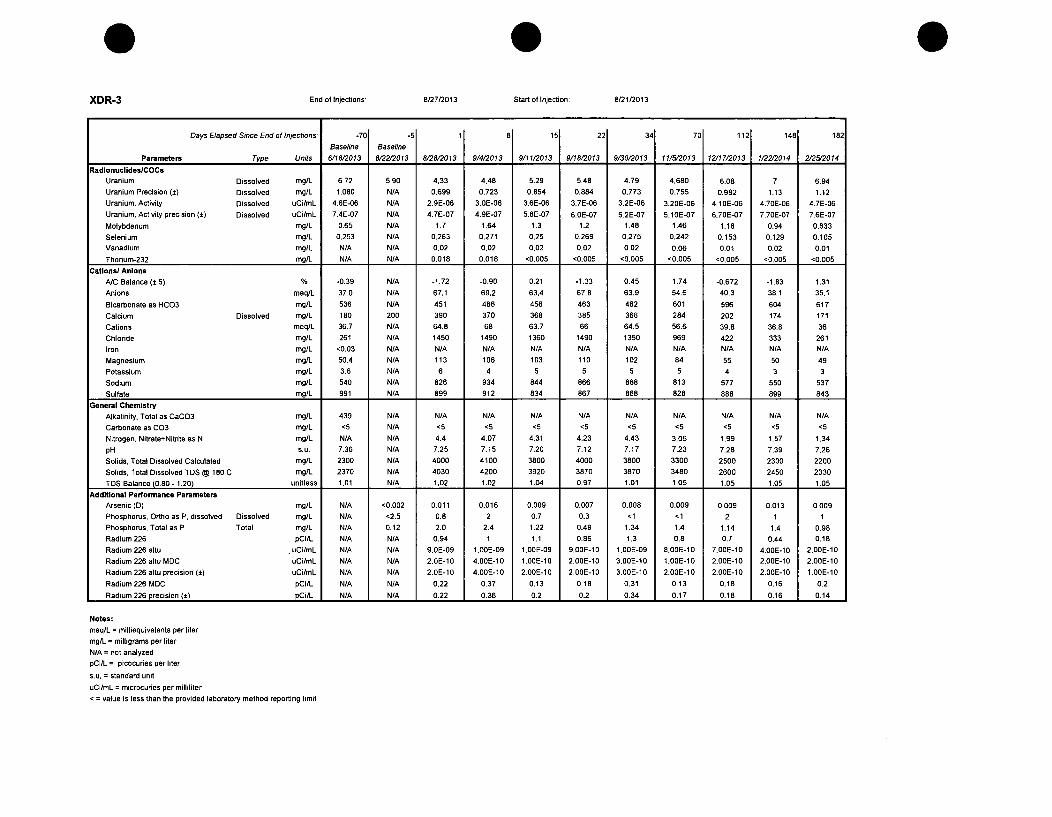
0XDR-3 End of Injections: 8/27/2013 Start of Injection: 8/21/2013
Days Elapsed Since End of Injections: -70 -5 1 8 15 22 34 70 112 148 182Baseline Baseline
Parameters Type Units 6/18/2013 8/22/2013 8/28/2013 9/4/2013 9/11/2013 9/18/2013 9/30/2013 11/5/12013 013 1/22/2014 2/25/2014
RadlonuclideslCOCsUranium Dissolved mg/L 6.72 5.90 4.33 4.48 5.29 5.48 4.79 4.680 6.08 7 6.94
Uranium Precision (±) Dissolved mg/L 1.080 N/A 0.699 0.723 0.854 0.884 0.773 0.755 0.982 1.13 1.12
Uranium, Activity Dissolved uCi/mL 4.6E-06 N/A 2.9E-06 3.0E-06 3.6E-06 3.7E-06 3.2E-06 3.20E-06 4.10E-06 4.70E-06 4.7E-06
Uranium, Activity precision (+) Dissolved uCi/mL 7.4E-07 N/A 4.7E-07 4.9E-07 5.8E-07 6.0E-07 5.2E-07 5.10E-07 6.70E-07 7.70E-07 7.6E-07
Molybdenum mg/L 0.65 N/A 1.7 1.64 1.3 1.2 1.48 1.46 1.18 0.94 0.833Selenium mg/L 0.253 N/A 0.263 0.271 0.25 0.269 0.275 0.242 0.153 0.129 0.105Vanadium mg/L N/A N/A 0.02 0.02 0.02 0.02 0.02 0.06 0.01 0.02 0.01
Thorium-232 mg/L N/A N/A 0.018 0.018 <0.005 <0.005 <0.005 <0005 <0.005 <0.005 <0.005
Cations/ AnionsNC Balance (± 5) % -0.39 N/A -1.72 -0.90 0.21 -1.33 0.45 1.74 -0.672 -1.83 1.31
Anions meq/L 37.0 N/A 67.1 69.2 63.4 67.8 63.9 54.6 40.3 38.1 35.1
Bicarbonate as HCO3 mg/L 536 N/A 451 486 456 463 462 601 596 604 617
Calcium Dissolved mg/L 180 200 390 370 368 385 366 284 202 174 171
Cations meq/L 36.7 N/A 64.8 68 63.7 66 64.5 56.6 39.8 36.8 36
Chloride mg/L 261 N/A 1450 1490 1360 1490 1350 969 422 333 261
Iron mg/L <0.03 N/A N/A N/A N/A N/A N/A N/A N/A N/A N/AMagnesium mg/L 50.4 N/A 113 106 103 110 102 84 55 50 49
Potassium mg/L 3.6 N/A 6 4 5 5 5 5 4 3 3
Sodium mg/L 540 N/A 826 934 844 866 868 813 577 550 537
Sulfate mg/L 991 N/A 899 912 834 867 868 828 888 899 843
General ChemistryAlkalinity, Total as CaCO3 mg/L 439 NIA N/A N/A N/A N/A N/A N/A N/A N/A N/A
Carbonate as C03 mg/L <5 N/A <5 <5 <5 <5 <5 <5 <5 <5 <5Nitrogen, Nitrate+Nitdte as N mg/L NIA NIA 4.4 4.07 4.31 4.23 4.43 3.06 1.99 1.57 1.34
pH s.u. 7.36 N/A 7.25 7.15 7.20 7.12 7.17 7.23 7.28 7.39 7.26
Solids, Total Dissolved Calculated mg/L 2300 N/A 4000 4100 3800 4000 3800 3300 2500 2300 2200
Solids, Total Dissolved TDS @ 180 C mg/L 2370 NIA 4030 4200 3920 3870 3870 3480 2600 2450 2330
TDS Balance (0.80 - 1.20) unitless 1.01 NIA 1.02 1.02 1.04 0.97 1.01 1.05 1.05 1.05 1.05
Additional Performance ParametersArsenic (D) mg/L N/A <0.002 0.011 0.016 0.009 0.007 0.008 0.009 0.009 0.013 0.009
Phosphorus, Ortho as P, dissolved Dissolved mg/L N/A <2.5 0.8 2 0.7 0.3 <1 <1 2 1 1
Phosphorus, Total as P Total mg/L N/A 0.12 2.0 2.4 1.22 0.49 1.34 1.4 1.14 1.4 0.98
Radium 226 pCi/L NIA N/A 0.94 1 1.1 0.86 1.3 0.8 0.7 0.44 0.18
Radium 226 altu uCi/mL N/A NIA 9.0E-09 1.00E-09 1.00E-09 9.00E-10 1.001-09 8.00E-10 7.00E-10 4.00E-10 2.00E-10
Radium 226 altu MDC uCi/mL N/A N/A 2.0E-10 4.00E-10 1.00E-10 2.00E-10 3.00E-10 1.00E-10 2.00E-10 2.00E-10 2.00E-10
Radium 226 altu precision (5) uCi/mL N/A N/A 2.0E-10 4.00E-10 2.00E-10 2.00E-10 3.00E-10 2.00E-10 2.00E-10 2.00E-10 1.00E-10
Radium 226 MDC pCi/L N/A N/A 0.22 0.37 0.13 0.18 0.31 0.13 0.18 0.16 0.2
Radium 226 precision (±) pCi/t N/A N/A 0.22 0.36 0.2 0.2 0.34 0.17 0.18 0.16 0.14
Notes:
meq/L = milliequivalents per litermg/L = milligrams per liter
NIA = not analyzedpCi/L = picocunes per liter
s.u. = standard unit
uCi/mL = microcuries per milliliter< = value is less than the provided laboratory method reporting limit

XDR-4 End of Injections: 8/27/2013 Start of Injection: 8/21/2013
Days Elapsed Since End of Injections: -aeie70 Baeie-5 1 1/11 15 15 221 ýý3 34 701 1/72112 1481 182
Parameters Type Units 6/18/2013 8/22/2013 812812013 812812013 9/412013 9/1112013 9/1112013 9/1812013 9/3012013 11/5/2013 1/22/2014 2/25/2014
RadlonuclldeslCOCsUranium Dissolved mg/L 6.58 6.00 3.40 3.87 4.67 1.40 5.40 6.000 6 8.42 7.68 8.530 8.120Uranium Precision (±) Dissolved mg/L 1.060 N/A N/A 0.625 0.7530 N/A 0.8710 0.944 1.0 1.36 1.24 1.38 1.31
Uranium, Activity Dissolved uCi/mL 4.5E-06 N/A N/A 2.6E-06 3.2E-06 N/A 3.7E-06 3.8E-06 4.10E-06 5.70E-06 5.2E-06 5.8E-06 5.5E-06
Uranium, Activity precision (±) Dissolved uCilmL 7.2E-07 N/A N/A 4.2E-07 5.1E-07 N/A 5.9E-07 6.4E-07 6.60E-07 9.20E-07 8.4E-07 9.3E-07 8.9E-07
Molybdenum mg/L 0.68 N/A N/A 2.22 1.29 N/A 1.49 1.26 1.06 0.642 0.560 0.47 0.477
Selenium mg/L 0.283 N/A N/A 0.29 0.246 N/A 0.275 0.264 0.205 0.124 0.120 0.106 0.111Vanadium mg/L N/A N/A N/A 0.02 0.01 N/A 0.01 0.02 <0.01 0.01 <0.01 <0.01 <0.01
Thorium-232 mg/L N/A N/A N/A <0.005 0.012 N/A <0.005 <0.005 <0.005 <0.005 <0.005 <0.005 <0.005
Cations/ AnionsA/C Balance (± 5) % 0.78 N/A N/A -1.50 0.11 N/A -0.34 -0.27 -1.79 4.67 1.18 -2.68 4.35Anions meq/L 36.9 N/A NIA 70 65 N/A 60 49.9 45.3 36.7 36.3 36.2 35.8
Bicarbonate as HCO3 mg/L 503 N/A N/A 483 442 N/A 517 550 585 597 624 646 629
Calcium Dissolved mg/L 185 210 420 352 376 350 320 250 219 181 188 164 179Cations meq/L 37.4 N/A N/A 68 65.2 N/A 59.6 49.7 43.7 40.3 37.1 34.3 39.1Chloride mg/L 264 N/A N/A 1500 1450 N/A 1140 725 535 316 261 246 245
Iron mg/L <0.03 N/A N/A N/A N/A N/A N/A N/A N/A N/A N/A N/A NIAMagnesium mg/L 50.7 N/A N/A 101 104 N/A 91 71 61 52 50 46 49Potassium mg/L 3.0 N/A N/A 4 5 N/A 4 3 3 3 3 3 3
Sodium mg/L 551 N/A N/A 965 866 N/A 829 718 636 619 540 512 598Sulfate mg/L 1010 N/A N/A 942 813 N/A 921 978 985 861 897 893 893
General ChemistryAlkalinity, Total as CaCO3 mg/L 412 N/A N/A N/A N/A N/A N/A N/A N/A N/A N/A N/A N/A
Carbonate as C03 mg/L <5 N/A N/A <5 <5 N/A <5 <5 <5 <5 <5 <5 <5
Nitrogen, Nitrate+Nitnte as N mg/L N/A N/A N/A 4.6 4.01 N/A 3.89 3.29 2.5 1.42 1.31 1.21 1.21pH s.u. 7.40 N/A N/A 7.23 7.22 N/A 7.23 7.20 7.27 7.29 7.29 7.38 7.27
Solids, Total Dissolved Calculated mg/L 2400 N/A N/A 4200 3900 N/A 3600 3100 2800 2400 2300 2200 2300
Solids, Total Dissolved TDS @ 180 C mg/L 2430 N/A N/A 3980 3960 N/A 3680 3000 2670 2440 2320 2260 2310TDS Balance (0.80 - 1.20) unitless 1.03 N/A N/A 0.96 1.02 N/A 1.02 0.980 0.96 1.03 1.01 1.02 1.00
Additional Performance ParametersArsenic (D) mg/L N/A 0.0058 0.025 0.024 0.008 0.0038 0.014 0.014 0.01 0.007 0.005 0.008 0.003Phosphorus, Ortho as P, dissolved Dissolved mg/L N/A <2.5 <25 2.4 0.6 <500 1.1 1 1 <1 <1 <0.4 <0.4Phosphorus, Total as P Total mg/L N/A 3.20 4.80 5.55 0.87 0.18 1.8 1.64 1.24 0.83 0.5 0.38 0.3
Radium 226 pCi/L N/A N/A N/A 0.56 0.66 N/A 1.1 0.73 0.72 0.99 7.4 0.51 0.4
Radium 226 altu uCi/mL N/A N/A NIA 6.0E-10 7.00E-10 N/A 1.00E-09 7.00E-10 7.OOE-10 1.00E-09 7.00E-09 5.00E-10 4.00E-10Radium 226 altu MDC uCi/mL N/A N/A NIA 2.0E-10 4.00E-10 N/A 1.00E-10 2.00E-10 3.00E-10 1.00E-10 2.00E-10 2.00E-10 2.00E-10
Radium 226 altu precision (±) uCi/mL N/A N/A N/A 2.08-10 3.00E-10 N/A 2.00E-10 2.00E-10 3.00E-10 2.00E-10 4.00E-10 2.00E-10 2.00E-10
Radium 226 MDC pCi/L N/A N/A N/A 0.21 0.36 N/A 0.14 0.19 0.33 0.13 0.2 0.17 0.19
Radium 226 precision (±) pCi/lI N/A N/A N/A 0.19 0.31 N/A 0.2 0.19 0.29 0.19 0.45 0.17 0.16
Notes:meq/L = milliequivalents per liter
mg/L = milligrams per liter
N/A = not analyzedpCi/L = picocuries per liter
s.u. = standard unit
uCi/mL = microcuries per milliliter< = value is less than the provided laboratory method reporting limit

0XMW-1 End of Injections: 8/27/2013 Start of Injection. 8/21/2013
Days Elapsed Since End of Injections: -11 1 7 15 22 34 55 70 112 148 181
Baseline
Parameters Type Units 8/16/2013 8/28/2013 9/312013 9/11/2013 9/18/2013 9/30/2013 10/21/2013 11/5/2013 12/17/2013 1/22/2014 2/24/2014
RadionuclideslCOCsUranium Dissolved mg/L 6.72 7.30 7.12 6.90 6 6 6.66 6.86 7.12 7.65 6.9
Uranium Precision (±) Dissolved mg/L 1.090 1.180 1.150 1.110 1.08 1.0 1.070 1.110 1.15 1.23 1.11
Uranium, Activity Dissolved uCilmL 4.6E-06 4.9E-06 4.8E-06 4.7E-06 4.3E-06 4.3E-06 4.5E-06 4.6E-06 4.80E-06 5.20E-06 4.67E-06
Uranium, Activity precision (±) Dissolved uCi/mL 7.4E-07 8.0E-07 7.8E-07 7.6E-07 7.3E-07 6.9E-07 7.3E-07 7.5E-07 7.80E-07 8.40E-07 7.54E-07
Molybdenum mg/L 0.28 0.27 0.29 0.292 0.28 0.24 0.23 0.246 0.250 0.24 0.298
Selenium mg/L 0.23 0.26 0.29 0.287 0.318 0.29 0.296 0.281 0.250 0.198 0.164Vanadium mg/L 0.01 <0.01 <0.01 <0.01 <0.01 <0.01 <0.01 0.05 <0.01 <0.01 <0.01
Thorium 232 mg/L <0.005 <0.005 <0.005 <0.005 <0.005 <0.005 <0.005 <0.005 <0.005 <0.005 <0.005
Cations/ AnionsA/C Balance (± 5) % -0.77 -0.59 -1.27 -0.31 -0.65 -1.00 -1.31 1.44 -2.27 -3.56 2.31
Anions meq/L 36.6 37.8 38.4 37.9 38.7 40.5 46.5 47.7 48.9 46.9 42.8
Bicarbonate as HCO3 mg/L 589 573 580 563 550 539 503 525 511 540 575
Calcium Dissolved mg/L 189 195 197 198 199 212 255 272 281 243 220
Cations meq/L 36.0 37.3 37.4 37.7 38.2 39.7 45.3 49.1 46.7 43.6 40.9
Chloride mg/L 251 268 296 268 298 377 662 716 713 637 486
Iron mg/L N/A N/A N/A N/A N/A N/A N/A N/A NIA N/A N/A
Magnesium mg/L 51 53 53 54 55 58 69 78 75 68 60
Potassium mg/L 3 3 3 3 3 3 3 3 4 3 3
Sodium mg/L 513 533 531 535 545 558 615 668 608 594 571
Sulfate mg/L 953 1000 1020 1010 1020 1010 941 893 978 961 945
General ChemistryCarbonate as C03 mg/L v5 <5 <5 <5 <5 <5 <5 <5 <5 <5 <5
Nitrogen, Nitrate+Nitrite as N mg/L 3.0 3.41 3.6 3.82 3.79 3.74 4.43 3.9 3.3 2.86 1.94
pH s.u. 7.39 7.40 7.38 7.30 7.26 7.29 7.17 7.20 7.18 7.36 7.24
Solids. Total Dissolved Calculated mg/L 2300 2400 2400 2400 2400 2500 2800 2900 3000 2800 2600
Solids, Total Dissolved TDS @ 180 C mg/L 2410 2450 2410 2400 2390 2410 2930 3170 3060 2940 2730
TDS Balance (0.80 - 1.20) unitless 1.05 1.030 1 1 0.98 0.96 1.04 1.08 1.04 1.05 1.06
Additional Performance ParametersArsenic (D) mg/L <0.001 0.001 0.001 0.001 0.001 0.001 0.002 0.001 0.002 0.008 0.001
Phosphorus, Ortho as P, dissolved Dissolved mg/L <0.2 <0.2 <0.2 <0.2 <0.2 <0.4 <0.4 0.9 <0.4 <0.2 <0.2
Phosphorus, Total as P Total mg/L 0.06 0.04 0.03 0.05 0.019 0.05 0.06 0.062 0.029 0.027 0.06
Radium 226 pCi/L 0.89 0.64 0.54 0.96 0.64 1.2 2.3 1.3 0.97 1 2
Radium 226 altu uCi/mL 9E-10 6.0E-10 5.00E-10 1.00E-09 6.00E-10 1.00E-09 2.00E-09 1.00E-09 1.00E-09 1.00E-09 N/A
Radium 226 altu MDC uCi/mL 3E-10 2.0E-10 4.00E-10 2E-10 2.00E-10 3.00E-10 2.00E-10 1.00E-10 2.00E-10 2.00E-10 N/A
Radium 226 altu precision (+) uCi/mL 35-10 2.0E-10 3.00E-10 2E-10 2.00E-10 3.00E-10 3.00E-10 2.00E-10 2.00E-10 2.00E-10 N/ARadium 226 MDC pCi/L 0.29 0.22 0.36 0.16 0.2 0.34 0.17 0.12 0.16 0.18 0.09
Radium 226 precision (5) pCi/L1 0.29 0.20 0.29 0.21 0.19 0.33 0.3 0.21 0.19 0.22 0.18
Notes:meq/L = milliequivalents per liter
mg/L = milligrams per liter
N/A = not analyzedpCi/L = picocuries per liter
s.u. = standard unit
uCi/mL = microcunes per milliliter
< = value is less than the provided laboratory method reporting limit

0XMW-2 End of Injections: 8/27/2013 Start of Injection: 8/21/2013
Days Elapsed Since End of Injections: -11 -11 7 15 22 34 70 112 148 181
Parameters Type Units 8/16/2013 8/16/2013 8/28/12013 9 013 311812013 9/18/3 9302013 11/5/2013 12/17/2013 1/22/2014 2124/2014
Radionuclides/COCsUranium Dissolved mg/L N/A 8.83 9.19 8.46 8.36 8 8 8.75 4.17 8.28 7.87
Total 7.1 N/A N/A N/A N/A N/A N/A N/A N/A N/A N/AUranium Precision (±) Dissolved mg/L N/A 1.430 1.480 1.370 1.350 1.320 1.300 1.41 0.673 1.34 1.27
Uranium, Activity Dissolved uCi/mL N/A 6.01-06 6.2E-06 5.7E-06 5.7E-06 5.4E-06 5.40E-06 5.90E-06 2.80E-06 5.6E-06 5.3E-06Uranium, Activity precision (C) Dissolved uCi/mL N/A 9.7E-07 1.0E-06 9.3E-07 9.1E-07 9.0E-07 8.80E-07 9.60E-07 4.60E-07 9.1E-07 8.6E-07
Molybdenum mg/L N/A 0.19 0.2 0.2 0.205 0.2 0.21 0.182 0.118 0.2 0.205
Selenium mg/L N/A 0.229 0.227 0.228 0.214 0.236 0.227 0.221 0.139 0.227 0.215Vanadium mg/L N/A <0.01 <0.01 <0.01 <0.01 <0.01 <0.01 0.02 <0.01 <0.01 <0.01
Thorium 232 mg/L N/A <0.005 <0.005 <0.005 <0.005 <0.005 <0.005 <0.005 <0.005 <0.005 <0.005
Cations/ AnionsA/C Balance I± 5) % N/A -2.70 -1.01 -2.08 -1.88 -1.57 0.62 5.28 -1.11 -3 3.95
Anions meq/L NIA 39.4 38.7 38.8 39 38.8 38.3 35.9 40.6 41.2 41.8
Bicarbonate as HCO3 mg/L N/A 618 610 613 607 606 614 464 569 551 570Calcium Dissolved mg/L N/A 198 201 198 199 196 204 194 209 208 208
Cations meq/L N/A 37.3 38.0 37.2 37.6 37.6 38.8 39.9 39.7 38.8 38.7
Chloride mg/L N/A 258 258 257 259 259 253 264 342 409 414Iron mg/L N/A N/A N/A N/A N/A N/A NIA N/A NIA N/A N/A
Magnesium mg/L N/A 54 55 54 55 54 55 57 57 58 57Potassium mg/IL N/A 3 3 2 2 2 2 2 2 3 3
Sodium mg/L N/A 527 537 524 532 535 553 586 564 544 541
Sulfate mg/L N/A 1050 1030 1030 1050 1030 1020 994 1030 992 1000General Chemistry
Carbonate as C03 mg/IL N/A <5 <5 <5 <5 <5 <5 <5 <5 <5 <5Nitrogen, Nitrate+Nitrite as N mg/L N/A 1.95 1.73 1.73 1.7 1.79 1.84 2.1 2.81 2.59 2.54
pH s.u. N/A 7.31 7.37 7.37 7.31 7.21 7.30 7.23 7.31 7.35 7.26Solids, Total Dissolved Calculated mg/IL N/A 2400 2400 2400 2400 2400 2400 2400 2500 2500 2500
Solids, Total Dissolved TDS @ 180 C mg/L N/A 2440 2400 2440 2470 2370 2430 2390 2490 2670 2630
TDS Balance (0.80 - 1.20) unitless N/A 1.00 0.99 1.01 1.02 0.98 1 1 0.99 1.06 1.05
Additional Performance ParametersArsenic (T) mg/L <0.002 <0.001 0.001 0.001 0.001 0.001 0.001 N/A N/A N/A N/AArsenic (D) mg/L <0.002 <0.001 0.001 0.001 0.001 0.001 0.001 0.001 0.001 0.008 0.002
Phosphorus, Ortho as P, dissolved Dissolved mg/L 4.4 <0.2 <0.2 <0.2 <0.2 <0.2 <0.4 <0.4 <0.4 <0.2 <0.2Phosphorus, Total as P Total mg/L 0.15 0.029 0.046 0.077 0.074 0.03 0.12 0.059 0.038 0.084 0.08Radium 226 pCi/IL N/A 0.28 0.28 0.47 0.47 0.34 3 1.3 12 0.76 5.6
Radium 226 altu uCi/mL N/A 3.0E-10 3.0E-10 5.0E-10 5.00E-10 3.00E-10 3.00E-09 1.00E-09 1.001-08 8.00E-10 N/ARadium 226 altu MDC uCi/mL N/A 2.0E-10 2.0E-10 4.00E-10 2.00E-10 2.00E-10 3.00E-10 1.000-10 3.00E-10 2.00E-10 N/A
Radium 226 altu precision (±) uCi/mL N/A 1.0E-10 2.0E-10 3.00E-10 2.00E-10 2.00E-10 5.00E-10 2.00E-10 7.00E-10 2.OOE-10 N/A
Radium 226 MDC pCi/L. N/A 0.16 0.23 0.36 0.15 0.2 0.34 0.14 0.31 0.17 0.1
Radium 226 precision (C) pCi/LI N/A 0.14 0.17 0.28 0.15 0.16 0.52 0.22 0.71 0.19 0.31
Notes:meq/L = milliequivalents per liter
mg/L = milligrams per liter
N/A = not analyzedpCi/L = picocuries per liter
s.u. = standard unit
uCi/mL = microcuries per milliliter
< = value is less than the provided laboratory method reporting limit

0XMW-3 End of Injections: 8/27/2013 Start of Injections 8/21/2013
Days Elapsed Since End of Injections: -1 -11 1 7 15 22 34 70 112 148
Baseline 1 11 18213 9310Parameters Type Units 8/16&2013 8/16/2013 8/28/2013 013/2013 911201 93/2013 11/5/2013 12/17/2013 112212014
Radionuclides/COCsUranium Dissolved mg/L 9.12 8.86 8.73 8.28 8.36 8 8 9.42 8.54 8.96
Uranium Precision (:) Dissolved mg/L 1.470 1.430 1.410 1.340 1.350 1.320 1.2 1.52 1.38 1.45
Uranium, Activity Dissolved uCi/mL 6.2E-06 6.0E-06 5.9E-06 5.6E-06 5.7E-06 5.2E-06 5.20E-06 6.40E-06 5.80E-06 6.1E-06
Uranium, Activity precision (4) Dissolved uCi/mL 1.OE-06 9.7E-07 9.5E-07 9.OE-07 9.1E-07 8.9E-07 8.40E-07 1.00E-06 9.30E-07 9.8E-07
Molybdenum mg/L 0.15 0.14 0.16 0.14 0.15 0.13 0.15 0.142 0.162 0.14
Selenium mg/L 0.239 0.245 0.207 0.232 0.238 0.255 0.253 0.25 0.234 0.207Vanadium mg/L n0.01 <0.01 0.02 <0.01 <0.01 0.02 <O.01 <0.01 <0.01 <0.01
Thorium 232 mg/L <0.005 <0.005 n0.005 <0.005 <0.005 <0.005 <0.005 <0.005 <0.005 <0.005
Cations/ Anions
A/C Balance (± 5) % -0.44 -1.96 -1.11 -1.74 0.50 -1.93 -1.80 3.61 -0.622 -2.81
Anions meq/L 37.7 39.0 38.5 38.6 38.7 39.4 40 37.4 39.4 38.3
Bicarbonate as HCO3 mg/IL 612 608 621 607 610 608 607 517 592 598
Calcium Dissolved mg/L 200 200 200 200 206 201 205 199 216 189
Cations meq/L 37.3 37.5 37.7 37.3 39.1 37.9 38.6 40.2 38.9 36.2
Chloride mg/IL 243 256 259 259 257 270 270 266 269 255
Iron mg/L N/A N/A N/A N/A N/A NIA NIA N/A N/A N/A
Magnesium mg/L 54 54 54 54 56 54 56 56 56 52
Potassium mg/IL 3 3 2 2 2 2 2 2 3 2Sodium mg/IL 526 530 533 524 554 536 545 588 538 516
Sulfate mg/L 999 1050 1010 1020 1030 1050 1080 1020 1060 1020
General ChemistryCarbonate as C03 mg/L 5 <5 <5 <5 <5 <5 <5 <5 v5 <5Nitrogen. Nitrate-Nitrite as N mg/L 2.11 1.09 1.83 1.87 1.91 1.96 1.92 1.87 1.98 1.72
pH s.u. 7.31 7.31 7.38 7.34 7.32 7.23 7.27 7.22 7.24 7.31
Solids, Total Dissolved Calculated mg/L 2400 2400 2400 2400 2400 2400 2500 2400 2500 2400
Solids, Total Dissolved TDS @ 180 C mg/L 2490 2520 2430 2510 2440 2420 2460 2460 2440 2440
TDS Balance (0.80- 1.20) unitless 1.06 1.04 1.01 1.05 1 0.99 0.99 1.01 0.99 1.03
Additional Performance ParametersArsenic Dissolved mg/L <0.001 <0.001 0.001 0.001 0.002 0.001 0.001 0.001 0.001 <0.001Phosphorus, Ortho as P, dissolved Dissolved mg/L <0.2 <0.2 <0.2 n0.2 <0.2 <0.2 <0.2 <0.4 <0.4 <0.2
Phosphorus. Total as P Total mg/L 0.02 0.1 0.1 0.05 0.14 0.038 0.075 0.096 0.029 0.078
Radium 226 pCi/L 1.7 0.25 0.46 0.24 0.44 0.35 0.68 0.38 0.40 0.54
Radium 226 altu uCi/mL 2.0E-09 3.0E-10 5.0E-10 2.00E-10 4.00E-10 4.00E-10 7.00E-10 4.00E-10 4.00E-10 5.00E-10
Radium 226 altu MDC uCi/mL 1E-10 2.0E-10 2.0E-10 4.00E-10 2.00E-10 2.00E-10 3.00E-10 1.00E-10 2.00E-10 2.00E-10
Radium 226 altu precision (+) uCi/mL 2E-10 1.0E-10 2.0E-10 2.00E-10 2.00E-10 2.00E-10 3.00E-10 1.00E-10 1.00E-10 2.00E-10
Radium 226 MDC pCi/IL 0.14 0.17 0.22 0.36 0.15 0.19 0.35 0.14 0.16 017
Radium 226 precision (±) pCi/L 1 0.25 0.13 0.18 0.25 0.15 0.16 0.3 0.13 0.14 0.17
Notes:meq/L = milliequivalents per liter
mg/L = milligrams per literN/A = not analyzedpCi/L = picocuries per liter
s.u. = standard unit
uCi/mL = microcuries per millilitern = value is less than the provided laboratory method reporting limit

XMW-4 End of Injections: 8/27/2013 Start of Injection: 8/2112013
Days Elapsed Since End of Injections: -11 1 15 34 148
Baseline
Parameters Type Units 8/1612013 8/28&2013 911112013 9/30/2013 1/22/2014
Radlonuclldes/COCsUranium Dissolved mg/L 9.33 9.37 8.64 8.61 10
Uranium Precision (+) Dissolved mg/L 1.510 1.510 1.400 1.390 1.620
Uranium, Activity Dissolved uCi/mL 6.3E-06 6.3E-06 5.9E-06 5.8E-06 6.8E-06Uranium, Activity precision (+) Dissolved uCi/mL 1.0E-06 1.0E-06 9.5E-07 9.4E-07 1.1E-06
Molybdenum mg/L 0.2 0.21 0.214 0.21 0.18
Selenium mg/L 0.241 0.222 0.22 0.217 0.261Vanadium mg/L <0.01 n0.01 <O.01 <0.01 <O.01
Thorum 232 mg/L <0.005 n0.005 <0.005 <0.005 <0.005
Cations/ AnionsA/C Balance (± 5) % -2.65 -0.80 0.15 0.25 -3.51
Anions meq/L 39.4 39.0 38.9 38.7 39.2
Bicarbonate as HCO3 mg/L 618 603 600 599 570
Calcium Dissolved mg/L 194 198 201 201 189
Cations meq/L 37.3 38.3 39 38.9. 36.6
Chloride mg/L 255 271 272 262 256
Iron mg/L N/A N/A N/A NIA NIAMagnesium mg/L 52 54 55 54 52
Potassium mg/L 3 3 3 3 3
Sodium mg/L 535 552 560 560 523Sulfate mg/L 1050 1030 1030 1030 1090
General Chemistry
Carbonate as C03 mg/L <5 <5 <5 <5 <5Nitrogen, Nitrate+Nitrite as N mg/L 2.06 1.77 1.75 1.7 1.91
pH s.u. 7.38 7.46 7.36 7.27 7.34
Solids, Total Dissolved Calculated mg/L 2400 2400 2400 2400 2400
Solids, Total Dissolved TDS @ 180 C mg/L 2500 2450 2450 2430 2480
TDS Balance (0.80 - 1.20) unitless 1.02 1.00 1 1 1.02
Additional Performance ParametersArsenic Dissolved mg/L <0.001 0.001 0.002 0.001 0.008Phosphorus. Ortho as P, dissolved Dissolved mg/L <0.2 <0.2 <0.2 <0.4 <0.2
Phosphorus, Total as P Total mg/L 0.04 0.14 0.11 0.031 0.05
Radium 226 pCi/L 0.34 0.66 0.81 1.7 0.97
Radium 226 altu uCi/mL 3.0E-10 7.0E-10 8.00E-10 2.00E-09 1.00E-09
Radium 226 altu MDC uCi/mL 2.0E-10 2.0E-10 2.00E-10 3.00E-10 2.00E-10
Radium 226 altu precision (±) uCi/mL 1.0E-10 2.0E-10 2.00E-10 4.00E-10 2.00E-10
Radium 226 MDC pCi/L 0.16 0.21 0.15 0.34 0.18
Radium 226 precision () pCi/L. 0.14 0.20 0.19 0.41 0.22
Notes:meq/L = milliequivalents per litermg/L = milligrams per literN/A = not analyzed
pCi/L = picocuries per liters.u. = standard unit
uCi/mL = microcunes per milliliter< = value is less than the provided laboratory method reportng limit

0XMW-5 End of Injections: 8/27/2013 Start of Injection: 8/21/2013
Days Elapsed Since End of Injections: -11 1 15115 3 34 148 181
BaselineParameters Type Units 8/16/2013 8/28/2013 9/11/2013 9/30/2013 1/22/2014 2/24/2014
Radionuclldes/COCsUranium Dissolved mg/L 8.21 8.31 7.87 7 7.91 7.08Uranium Precision (it) Dissolved mg/L 1.320 1.340 1.270 1.200 1.280 1.140
Uranium, Activity Dissolved uCi/mL 5.6E-06 5.6E-06 5.3E-06 4.9E-06 5.4E-06 4.8E-06
Uranium, Activity precision (+) Dissolved uCi/mL 9.OE-07 9.1E-07 8.6E-07 8.0E-07 8.6E-07 7.7E-07
Molybdenum mg/L 0.53 0.55 0.573 0.51 0.32 0.439
Selenium mg/L 0.129 0.132 0.137 0.157 0.19 0.184Vanadium mg/L <0.01 <0.01 <0.01 <0.01 <0.01 <0.01
Thorium 232 mg/L <0.005 <0.005 <0.005 <0.005 <0.005 <0.005
Catlonst Anions
A/C Balance (± 5) % -0.62 -1.65 -0.85 -2.09 -4.27 2.53
Anions meq/L 35.5 37.5 37.1 37.6 62.8 48.8
Bicarbonate as HCO3 mg/L 621 641 635 622 482 528
Calcium Dissolved mg/L 173 179 180 177 355 265Cations meq/L 35.1 36.3 36.5 36 57.7 46.4
Chloride mg/L 235 256 252 259 1330 765
Iron mg/L N/A NIA N/A N/A N/A NIAMagnesium mg/L 49 51 51 51 105 76
Potassium mg/L 4 3 3 3 5 4
Sodium mg/L 515 531 533 528 716 618
Sulfate mg/L 899 951 938 964 839 894
General ChemistryCarbonate as C03 mg/L <5 <5 <5 <5 <5 <5
Nitrogen, Nitrate-Nitrite as N mg/L 1.71 1.34 1.45 1.79 3.25 2.5
pH s.u. 7.47 7.46 7.43 7.35 7.26 7.28
Solids, Total Dissolved Calculated mg/L 2200 2300 2300 2300 3600 2900
Solids, Total Dissolved TDS @ 180 C mg/L 2330 2350 2300 2290 3850 3110
TDS Balance (0.80- 1.20) unitless 1.05 1.010 1 0.99 1.06 1.08
Additional Performance ParametersArsenic Dissolved mg/L <0.001 0.001 0.001 0.001 0.009 0.002
Phosphorus, Ortho as P, dissolved Dissolved mg/L <0.2 00.2 0.5 <0.4 00.2 <0.2
Phosphorus. Total as P Total mg/L 0.019 0.07 0.15 0.166 0.229 0.24
Radium 226 pCi/L 2.4 0.38 0.41 0.76 0.89 5.6
Radium 226 altu uCi/mL 2.0E-09 4.0E-10 4.00E-10 8.00E-10 9.00E-10 N/A
Radium 226 altu MDC uCi/mL 2.0E-10 2.0E-10 2.00E-10 4.O0E-10 2.00E-10 N/A
Radium 226 altu precision (+) uCi/mL 3E-10 2.0E-10 1.00E-10 3.00E-10 2.00E-10 N/ARadium 226 MDC pCi/L 0.16 0.21 0.15 0.37 0.17 0.09
Radium 226 precision (+) pCi/L 0.31 0.17 0.15 0.32 0.21 0.3
Notes:
meq/L = milliequivalents per litermg/L = milligrams per liter
N/A = not analyzedpCi/L = picocuries per liter
s.u. = standard unit
uCi/mL = microcuries per milliliter< = value is less than the provided laboratory method reporting limit

XMW-6 End of Injections: 8/27/2013 Start of Injection: 8/21/2013
Days Elapsed Since End of Injections: -11 1 15 34 148
BaselineParameters Type Units 8116/2013 8/28/2013 9/11/2013 9/30/2013 1/22/2014
RadionuclldeslCOCsUranium Dissolved mg/L 7.65 7.42 6.64 7 8.32Uranium Precision (±) Dissolved mg/L 1.230 1.200 1.07 1.100 1.340
Uranium, Activity Dissolved uCi/mL 5.2E-06 5.OE-06 4.5E-06 4.4E-06 5.6E-06
Uranium, Activity precision (+) Dissolved uCi/mL 8.4E-07 8.1E-07 7.3E-07 7.2E-07 9.1E-07
Molybdenum mg/L 0.75 0.7 0.694 0.69 0.66Selenium mg/L 0.092 0.091 0.081 0.099 0.116Vanadium mg/L n0.01 n0.01 <0.01 <0.01 00.01Thorium 232 mg/L <0.005 0.005 0.005 <0.005 <0.005
Cations/ Anions
A/C Balance (± 5) % -2.80 -1.28 0.15 -1.60 -2.34Anions meq/L 36.3 36.1 35 36.4 36.4
Bicarbonate as HCO3 mg/L 622 618 617 617 595
Calcium Dissolved mg/L 165 172 167 171 169
Cations meq/L 34.4 35.2 35.1 35.3 34.8Chloride mg/L 254 258 246 254 250Iron mg/L N/A N/A N/A N/A N/A
Magnesium mg/L 47 48 48 49 49Potassium mg/L 4 5 5 5 5Sodium mg/L 509 517 521 519 509
Sulfate mg/L 907 896 861 919 942
General ChemlstryCarbonate as C03 mg/L <5 <5 <5 <5 <5Nitrogen, Nitrate-Nitrite as N mg/L 1.17 1.18 1.14 1.22 1.41
pH s.u. 7.38 7.46 7.41 7.34 7.33Solids, Total Dissolved Calculated mg/L 2200 2200 2200 2200 2200
Solids, Total Dissolved TDS @ 180 C mg/L 2210 2270 2180 2190 2330TDS Balance (0.80 - 1.20) unitless 0.99 1.02 1 0.97 1.04
Additional Performance ParametersArsenic Dissolved mg/L <0.001 0.001 0.001 0.001 0.005
Phosphorus, Ortho as P, dissolved Dissolved mg/L 00.2 0.2 <0.2 <0.2 <0.2Phosphorus. Total as P Total mg/L 0.023 0.141 0.044 0.04 0.039Radium 226 pCi/L 0.3 0.75 0.65 0.51 0.83
Radium 226 altu uCi/mL 3.0E-10 8.0E-10 7.00E-10 5.00E-10 8.00E-10Radium 226 altu MDC uCi/mL 2.0E-10 2.0E-10 2.00E-10 4.00E-10 2.00E-10
Radium 226 altu precision (u) uCi/mL 1.0E-10 2.0E-10 2.0GE-10 3.00E-10 2.00E-10Radium 226 MDC pCi/L 0.16 0.22 0.15 0.35 0.19
Radium 226 precision (±) pCi/L 0.14 0.21 0.18 0.28 0.21
Notes:meq/L = milliequivalents per liter
mg/L = milligrams per liter
N/A = not analyzedpCi/L = picocuries per liter
s.u. = standard unit
uCi/mL = microcuries per milliliter< = value is less than the provided laboratory method reporting limit

NEW MEXICOENVIRONMENT DEPARTMENT
Harold Runnels Building1190 St. Francis Drive
P.O. Box 5469, Santa Fe, New Mexico 87502-5469Phone (505) 827-2855 Fax (505) 827-2965
www.nmenv.state.nm usSUSANA MARTINEZGovernor
JOHN A. SANCHEZLieutenant Governor
RYAN FLYNNSecretary
BUTCH TONGATEDeputy Secretary
CERTIFIED MAIL-RETURN RECEIPT REQUESTED
September 22, 2014
Jesse Toepfer, Closure ManagerHomestake Mining Company of CaliforniaP.O. Box 98Grants, NM 87020
RE: Homestake Mining Company of California uranium millsitelDP-200-Comments from NMED's review of "Responses to NMED commentsregarding Homestake's November 2013 'Update on treatment activities"'(August 21, 2014) and "TPP [Tripolyphosphate] alluvial pilot testingsummary report" (July 3, 2014)
Dear Mr. Toepfer:
During preparation of comments on the above-referenced July 3, 2014 report ("Report"),the New Mexico Environment Department (NMED) received Homestake MiningCompany of California's (HMC's) August 21, 2014 responses to NMED comments onthe November 2013 report, which included a brief overview of HMC's TPP testing. Forexpediency, NMED is including herein comments only for the TPP section from HMC'sAugust 21, 2014 submittal. Additional comments on other sections of HMC's August21, 2014 submittal will be forthcoming in a separate letter.
"Responses to NMED comments regarding Homestake's November 2013 'Updateon treatment activities"' (August 21, 2014)
E Quoted text NMED comments
This difference in retardation and Another important consideration forachievable distribution is an the development of a "barrier" also
1 important consideration for continued should include amount and rate ofapplication of the technology-the orthophosphate formation todesign.. .of a transect of injection precipitate sufficient uranium to

Jesse Toepfer, Homestake Mining Company of CaliforniaRE: Homestake Mining Company of California uranium millsitelDP-200--Comments from NMED's review of "Responses
to NMED comments regarding Homestake's November 2013 'Update on treatment activities"' (August 21, 2014) and"TPP [Tripolyphosphate] alluvial pilot testing summary report (July 3, 2014)
September 22, 2014
E Quoted text NMED comments
points to create a "barrier" will ensure achieve the uranium concentrationcomplete lateral distribution between standard considering continuedthe points, influx of background uranium
concentrations.The uranium-phosphate precipitates On page 20 of the Report, HMCthat form during TPP injection have stated that it was unable to directlyvery low solubility under ambient identify the uranium and calciumaquifer conditions (Wellman et al. phosphate mineral phases during2005). soil coring and analysis. Therefore,
please explain the basis for this2 statement.
Since the mineral phases could notbe identified in this test phase,please explain how HMC canassure the long-term efficacy of anySproposed barrier.
"TPP alluvial pilot testing summary report" (July 3, 2014)Main report text
E Quoted text NMED comments
These uranium minerals have As previously noted, HMC hasvery low solubility under stated that the mineral phasesambient aquifer conditions... that are presumed to have
formed could not be identified
3 6 during analysis.
Please present stabilitydiagrams from authoritativegeochemical references toillustrate this stability under
Page 2/12
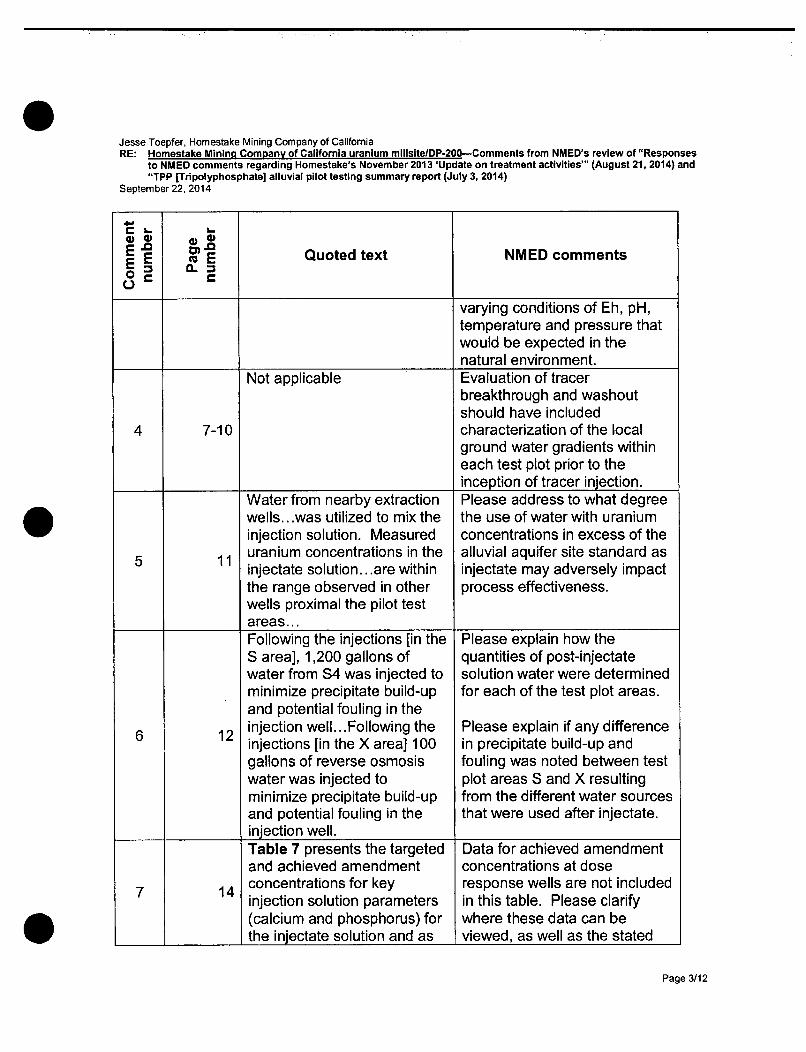
Jesse Toepfer, Homestake Mining Company of CaliforniaRE: Homestake Mining Company of California uranium millsitelDP-200-Comments from NMED's review of "Responses
to NMED comments regarding Homestake's November 2013 'Update on treatment activities"' (August 21, 2014) and"TPP [Tripolyphosphate] alluvial pilot testing summary report (July 3, 2014)
September 22. 2014
EQuoted text NMED comments
varying conditions of Eh, pH,temperature and pressure thatwould be expected in thenatural environment.
Not applicable Evaluation of tracerbreakthrough and washoutshould have included
4 7-10 characterization of the localground water gradients withineach test plot prior to theinception of tracer injection.
Water from nearby extraction Please address to what degreewells.. .was utilized to mix the the use of water with uraniuminjection solution. Measured concentrations in excess of theuranium concentrations in the alluvial aquifer site standard asinjectate solution.. .are within injectate may adversely impactthe range observed in other process effectiveness.wells proximal the pilot testareas...Following the injections [in the Please explain how theS area], 1,200 gallons of quantities of post-injectatewater from S4 was injected to solution water were determinedminimize precipitate build-up for each of the test plot areas.and potential fouling in the
6 12 injection well.. .Following the Please explain if any differenceinjections [in the X area] 100 in precipitate build-up andgallons of reverse osmosis fouling was noted between testwater was injected to plot areas S and X resultingminimize precipitate build-up from the different water sourcesand potential fouling in the that were used after injectate.injection well.Table 7 presents the targeted Data for achieved amendmentand achieved amendment concentrations at dose
7 14 concentrations for key response wells are not includedinjection solution parameters in this table. Please clarify(calcium and phosphorus) for where these data can bethe injectate solution and as viewed, as well as the stated
Page 3/12

Jesse Toepfer, Homestake Mining Company of CaliforniaRE: Homestake Mining Company of California uranium millsiteIDP-200-Comments from NMED's review of "Responses
to NMED comments regarding Homestake's November 2013 'Update on treatment activities"' (August 21, 2014) and"TPP [Tripolyphosphate] alluvial pilot testing summary report (July 3, 2014)
September 22, 2014
mE Quoted text NMED commentsE E3 a. 3utdtx
measured at the dose comparisons of in situ toresponse wells... In the S targeted concentrations.Area, in situ calciumconcentrations were 6 to 9times higher than targetedand TPP concentrations wereapproximately half of thetargeted concentration... Inthe X Area, in situ calciumconcentrations wereapproximately half of thetargeted values, while TPPconcentrations were twoorders of magnitude lowerthan targeted values (Table7). However the injectateconcentration of TPP wasapproximately the same astargeted injectate values.The difference between the The statement suggests thatachieved in situ more accurate control ofconcentrations of calcium and injectate reagents should bephosphorous and the targeted implemented in order to
8 14 concentrations is partially due achieve targeted dosageto batching variability.. .(likely distribution more accurately.due to coarse measurementof reagent masses [in theinjectate]).This [significantly reduced This observation suggests thatdistribution of TPP in the X subsurface stratigraphic andArea] is consistent with the structural variations (e.g.,finer aquifer grain texture intercalated clay layers,
9 15 observed in the X Area fractures) might also influencethe distribution of reagents.Please indicate how this couldbe addressed in a full-scaleimplementation.
Page 4/12

Jesse Toepfer, Homestake Mining Company of CaliforniaRE: Homestake Mining Company of California uranium millsitelDP-200-Comments from NMED's review of "Responses
to NMED comments regarding Homestake's November 2013 'Update on treatment activities"' (August 21, 2014) and"TPP [Tripolyphosphate] alluvial pilot testing summary report (July 3, 2014)
September 22, 2014
4.')
E 50E E E Quoted text NMED comments0E .
Breakthrough of the injectionsolution [in S Area doseresponse and monitoringwells] was also characterizedby increased concentrationsof TDS, chloride, calcium,total phosphorous, andorthophosphate (Table 4). Indose response wells SDR-1Sand SDR-1 D, peak TDS andchloride concentrations wereapproximately 20 and 60times higher than baselinevalues, respectively
10
15, Table4, and
AppendixD
Few pre-injection/baseline datafor the cited analytes are shownwithout explanation for wellsSDR-1 S (no analytical data forTDS and chloride), SDR-1 D (1analysis each for TDS andchloride; 2 for calcium). Thesedata gaps make difficult theevaluation of statements thatfollow, which compare post-breakthrough concentrations topre-injection/baselineconcentrations. Please explainhow the baseline datapresented in this Report wouldbe sufficient for this study inlight of these observations.
Please discuss the significanceof the last recorded dissolvedmolybdenum concentration of52 mg/I in well SDR-4S at 147DPI, which is two orders ofmagnitude greater than anyprevious analyses.
NMED notes that no analyticaldata are included for radium,thorium, sulfate, and nitrate inTable 4, although data forsulfate concentrations areshown in the charts ofAppendix D. All of theseconstituents have aquifer-specific site standards.Possible impact of the TPPprocess on concentrations of
Page 5/12

Jesse Toepfer, Homestake Mining Company of CaliforniaRE: Homestake Mining Company of California uranium millsiteIDP-200-Comments from NMED's review of "Responses
to NMED comments regarding Homestake's November 2013 'Update on treatment activities"' (August 21, 2014) and"TPP [Tripolyphosphate] alluvial pilot testing summary report (July 3, 2014)
September 22, 2014
E w. Quoted text NMED comments
these constituents should beinvestigated and discussed inthe pilot testing phase activities.
[Tracer] Washout was slow in Please explain the significance,all [X area] dose response if any, of observed tracer
11 16 wells... washout rates with respect toperformance of the TPPprocess.
Breakthrough of the injection As for monitor wells in the Ssolution [within the X area area (see Comment 10 above),dose response wells] was few pre-injection/baseline dataalso characterized by for TDS and chloride are shownincreased concentrations of without explanation for wellsTDS, chloride, and calcium... XDR-1, XDR-2 XDR-3, and
XDR-4 (1 analysis each).These data gaps make difficultthe evaluation of statementsthat follow, which compare
16, Table post-breakthrough
12 5, and concentrations to pre-Appendix injection/baseline
D concentrations. Please explainhow the baseline datapresented in this Report wouldbe sufficient for this study inlight of these observations.
As stated previously, the pilottesting process should includeall analytes for which aquifer-specific site standards areestablished.
At SMW-1, the uranium Although uranium17, Table concentrations decreased concentrations did diminish to
13 4, and from 1.44 mg/L to 0.047 mg/L 0.047 mg/L at 15 DPI as stated,Figure 8 (at 15 DPI). The high NMED notes that
uranium concentration concentrations immediately
Page 6/12
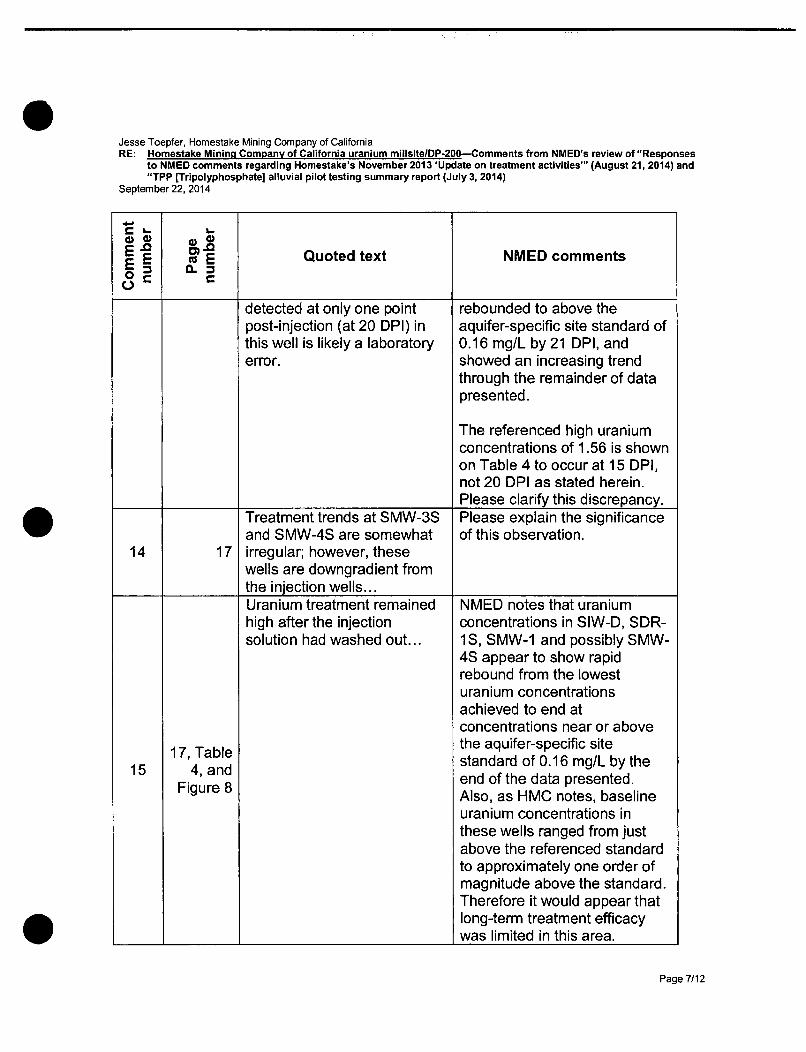
Jesse Toepfer, Homestake Mining Company of CaliforniaRE: Homestake Mining Company of California uranium millsitelDP-200-Comments from NMED's review of "Responses
to NMED comments regarding Homestake's November 2013 'Update on treatment activities"' (August 21, 2014) and"TPP [Tripolyphosphate] alluvial pilot testing summary report (July 3, 2014)
September 22, 2014
E E E Quoted text NMED comments
detected at only one point rebounded to above thepost-injection (at 20 DPI) in aquifer-specific site standard ofthis well is likely a laboratory 0.16 mg/L by 21 DPI, anderror. showed an increasing trend
through the remainder of datapresented.
The referenced high uraniumconcentrations of 1.56 is shownon Table 4 to occur at 15 DPI,not 20 DPI as stated herein.Please clarify this discrepancy.
Treatment trends at SMW-3S Please explain the significanceand SMW-4S are somewhat of this observation.
14 17 irregular; however, thesewells are downgradient fromthe injection wells...Uranium treatment remained NMED notes that uraniumhigh after the injection concentrations in SIW-D, SDR-solution had washed out... 1S, SMW-1 and possibly SMW-
4S appear to show rapidrebound from the lowesturanium concentrationsachieved to end atconcentrations near or above
17, Table the aquifer-specific site
15 4, and standard of 0.16 mg/L by the
Figure 8 end of the data presented.Also, as HMC notes, baselineuranium concentrations inthese wells ranged from justabove the referenced standardto approximately one order ofmagnitude above the standard.Therefore it would appear thatlong-term treatment efficacywas limited in this area.
Page 7/12
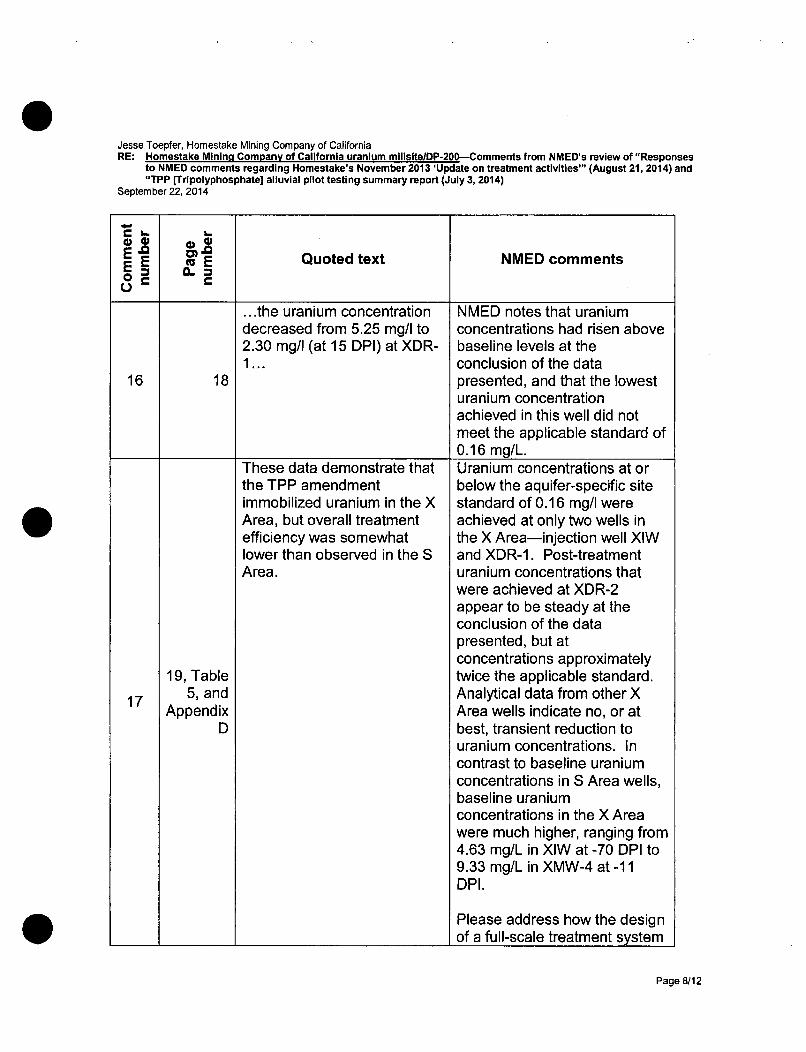
Jesse Toepfer. Homestake Mining Company of CaliforniaRE: Homestake Mining Company of California uranium millsitelDP-200--Comments from NMED's review of "Responses
to NMED comments regarding Homestake's November 2013 'Update on treatment activities"' (August 21, 2014) and"TPP [Tripolyphosphate] alluvial pilot testing summary report (July 3, 2014)
September 22, 2014
EO "E . E Quoted text NMED comments
...the uranium concentration NMED notes that uraniumdecreased from 5.25 mg/I to concentrations had risen above2.30 mg/I (at 15 DPI) at XDR- baseline levels at the1... conclusion of the data
16 18 presented, and that the lowesturanium concentrationachieved in this well did notmeet the applicable standard of0.16 mg/L.
These data demonstrate that Uranium concentrations at orthe TPP amendment below the aquifer-specific siteimmobilized uranium in the X standard of 0.16 mg/I wereArea, but overall treatment achieved at only two wells inefficiency was somewhat the X Area-injection well XIWlower than observed in the S and XDR-1. Post-treatmentArea. uranium concentrations that
were achieved at XDR-2appear to be steady at theconclusion of the datapresented, but atconcentrations approximately
19, Table twice the applicable standard.
17 5, and Analytical data from other XAppendix Area wells indicate no, or at
D best, transient reduction touranium concentrations. Incontrast to baseline uraniumconcentrations in S Area wells,baseline uraniumconcentrations in the X Areawere much higher, ranging from4.63 mg/L in XIW at -70 DPI to9.33 mg/L in XMW-4 at -11DPI.
Please address how the designof a full-scale treatment system
Page 8/12

Jesse Toepfer, Homestake Mining Company of CaliforniaRE: Homestake Mining Company of California uranium milisltelDP-200-Comments from NMED's review of "Responses
to NMED comments regarding Homestake's November 2013 'Update on treatment activities.' (August 21, 2014) and"TPP [Tripolyphosphate] alluvial pilot testing summaryreport (July 3, 2014)
September 22, 2014
E E E Quoted text NMED comments
can account for both lithologicvariability and the variability ofpre-treatment baseline uraniumconcentrations.
Arsenic NMED observes thatbreakthrough of the injectionsolution in the S Area isapparently characterized by anorder-of-magnitude increase inarsenic concentrations in SDR-1S and SDR-1D, and SMW-1,SMW-3D, SMW-4S, andpossibly SMW-3S; theseincreases were only slightlydiminished over the remainderof the test period. Although the
18 21-22 increased arsenicconcentrations in themonitoring wells remained atleast one order-of-magnitudebelow the standard of 0.1 mg/Ipromulgated in 20.6.2.3103NIMAC, these data wouldsuggest that characterization ofbaseline arsenic concentrationsshould be included in thedetermination of areas of theaquifer that are suitable for TPPtreatment implementation.
Sustained treatment without As noted above, uraniumrebound in uranium concentrations in several wellsconcentrations [in the S Area] did show rebounded uraniumindicated that dissolved concentrations. HMC musturanium was transported into explain how such uneventhe treatment zone from efficacy can be addressed inupgradient and was any proposed full-scaleimmobilized by the phosphate implementation of this
Page 9/12

Jesse Toepfer, Homestake Mining Company of CaliforniaRE: Homestake Mining Company of California uranium millsite/DP-200-Comments from NMED's review of "Responses
to NMED comments regarding Homestake's November 2013 'Update on treatment activities"' (August 21, 2014) and"TPP [Tripolyphosphate] alluvial pilot testing summary report (July 3, 2014)
September 22, 2014
E E'E Quoted text NMED comments
CL)
precipitates, treatment process.
Main text figures
oE "E I E NMED comments
Please explain the mechanism of coprecipitation, which is indicatedto be applicable to uranium removal through precipitation of apatite,but for which uranium is not shown to be included in the chemicalformula.
20 4 Adsorptive bonds, as are indicated to be partially operable for
uranium removal by apatite, generally are weaker than inclusion inthe crystal matrix of uranyl phosphate precipitates. Please describewhat controls the proportion of uranyl phosphate formation over theother possible reactive products.
Page 10/12
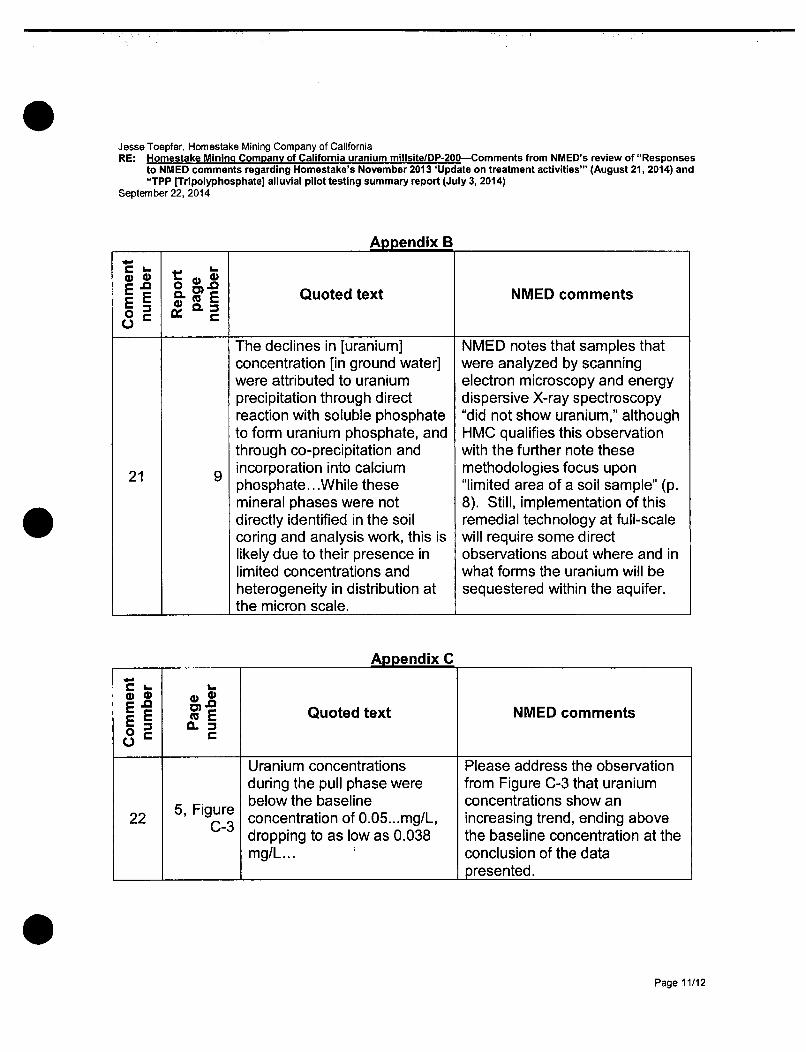
Jesse Toepfer, Homestake Mining Company of CaliforniaRE: Homestake Mining Company of California uranium millsitelDP-200-Comments from NMED's review of "Responses
to NMED comments regarding Homestake's November 2013 'Update on treatment activities.' (August 21, 2014) and"TPP [Trlpolyphosphate] alluvial pilot testing summary report (July 3, 2014)
September 22, 2014
Appendix B
4i) t 0 4)E E . ") E Quoted text NMED comments
The declines in [uranium] NMED notes that samples thatconcentration [in ground water] were analyzed by scanningwere attributed to uranium electron microscopy and energyprecipitation through direct dispersive X-ray spectroscopyreaction with soluble phosphate "did not show uranium," althoughto form uranium phosphate, and HMC qualifies this observationthrough co-precipitation and with the further note these
21 9 incorporation into calcium methodologies focus uponphosphate.. .While these "limited area of a soil sample" (p.mineral phases were not 8). Still, implementation of thisdirectly identified in the soil remedial technology at full-scalecoring and analysis work, this is will require some directlikely due to their presence in observations about where and inlimited concentrations and what forms the uranium will beheterogeneity in distribution at sequestered within the aquifer.the micron scale.
Appendix C
E Quoted text NMED comments
Uranium concentrations Please address the observationduring the pull phase were from Figure C-3 that uranium
5 below the baseline concentrations show an22 FC-3 concentration of 0.05.. .mg/L, increasing trend, ending above
dropping to as low as 0.038 the baseline concentration at themg/L... conclusion of the data
presented.
Page 11/12

Jesse Toepfer, Homestake Mining Company of CaliforniaRE: Homestake Mining Company of California uranium millsitelDP-200-Comments from NMED's review of "Responses
to NMED comments regarding Homestake's November 2013 'Update on treatment activities"' (August 21, 2014) and"TPP [Tripolyphosphate] alluvial pilot testing summary report (July 3, 2014)
September 22, 2014
Please submit additional information to respond to these comments within 60 days ofthis letter. Please contact me by telephone at (505) 476-3777 or atdavid.mayerson(,state.nm.us if you have any questions.
Sincerely,
Mining Environmental Compliance SectionGround Water Quality BureauNew Mexico Environment Department
Copies:Sairam Appaji, EPAJack Parrott, NRC
Page 12/12