how packaging of juice products influence customer experience
TRANSCRIPT
WAGENINGEN UR
How Packaging of Juice Products Influence
Customer Experience Master Thesis
Initiator: Marketing and Consumer Behaviour Group at Wageningen University
Author: Shuwen Yang
Student number: 890204980080
First supervisor: Prof. dr. ir. JCM (Hans) van Trijp
Second supervisor: Dr. ir. PW (Ellen) van Kleef
Period: November 2013 – April 2014

I
Acknowledgement
I would like to express my special appreciation and thanks to my main supervisor Professor Dr. Hans
van Trijp, who has been a tremendous mentor for me. He inspired me and encouraged my research
during the past six month. I would also like to thank my second supervisor Dr. Ellen van Kleef for her
comments to my research.
I would like to thank everyone who participated in my research. My research could not be completed
without their contribution.
I would like to thank Xiaoli Yang for helping me designing the simulations used in the research.
I would like to thank my co-referents, Jildau van den Berg and Nigel Steenis, for their
recommendations and inspiring questions during my presentations. Special thanks to Nigel Steenis,
who helped me by reading through my thesis and correcting my grammar mistakes.
Further thanks to all my friends in Wageningen for accompanying with me. They cheered me up
whenever I feel frustrated.
Last but not least, I would like to give ultimate thanks to my parents for supporting me and
encouraging me. I couldn’t finish my thesis without them.
II
Abstract
Providing consumers with positive customer experience is regarded as one way to increase their
purchase intention. Using an internet-based survey in Wagenignen University, the aim of this work is
to investigate whether and how three packaging elements (image of healthy people, health claim and
healthy choice label) on orange juice product package influence perceived customer experience, and
thus influence the purchase intention of healthy juice.
The results indicate that perceived customer experience does not affect the influence of the
packaging elements on the purchase intention of healthy juice. However, the healthy choice label is
proved to trigger purchase intention of healthy juice directly. The image evoke positive affective,
cognitive and behavioural dimensions of customer experience. The healthy choice label decrease the
cognitive effort of consumers, and thus has negative influence on the cognitive dimension of
customer experience. Furthermore, sensory, social and behavioural dimensions of customer
experience trigger the purchase intention of healthy juice.
Keywords: Packaging; Customer experience; Purchase intention; Healthy choice
III
Table of Contents
1 Introduction ......................................................................................................................... 1
2 Theoretical framework ........................................................................................................... 3
2.1 Customer experience .......................................................................................................... 3
2.1.1 Definition .................................................................................................................... 3
2.1.2 Dimension ................................................................................................................... 4
2.2 Packaging ......................................................................................................................... 5
2.2.1 Role of packaging ......................................................................................................... 5
2.2.2 Packaging elements ...................................................................................................... 5
2.3 Hypotheses ....................................................................................................................... 6
2.3.1 FOP nutrition label ....................................................................................................... 6
2.3.2 Nutrition and health claims ........................................................................................... 7
2.3.3 Images ...................................................................................................................... 9
2.3.4 Moderators ............................................................................................................... 10
2.4 Conceptual model ........................................................................................................... 11
3 Methods ............................................................................................................................ 12
3.1 Sample .......................................................................................................................... 12
3.2 Design ........................................................................................................................... 12
3.3 Procedure ....................................................................................................................... 12
3.4 Measurements ................................................................................................................. 13
3.5 Data analysis .................................................................................................................. 14
4 Results ............................................................................................................................. 16
4.1 Suitability of dataset .................................................................................................. 16
4.2 Preliminary analysis ................................................................................................... 16
4.2.1 Description of dataset ................................................................................................. 16
4.2.2 Constructs ................................................................................................................. 17
4.3 Results of hypotheses ................................................................................................. 19
4.4 Other results ............................................................................................................. 26
5 Discussion ......................................................................................................................... 27
5.1 Discussion concerning main results ..................................................................................... 27
5.2 Discussion concerning unexpected effects ............................................................................ 30
5.3 Implication ..................................................................................................................... 31
6 Further recommendation ..................................................................................................... 31
7 Conclusion ......................................................................................................................... 32
Reference ............................................................................................................................... 33
Appendices ............................................................................................................................. 37
Appendix I: Results of the PCA ................................................................................................ 37
Appendix II: Model Summary of Mediation Analysis .................................................................... 40
Appendix III: Packaging profiles .............................................................................................. 46
IV
List of Figures
Figure 1 FOP Label.....................................................................................................................7
Figure 2 Conceptual Model.........................................................................................................11
Figure 3 Interaction Effect of SOP×Label on Sensory and Affective Dimensions of CE........................23
Figure 4 Product No.1 (Image)...................................................................................................45
Figure 5 Product No.2 (Label).....................................................................................................45
Figure 6 Product No.3 (Claim)....................................................................................................45
Figure 7 Product No.4 (Image, Label and Claim)...........................................................................45
Figure 8 Product No.5 (Image and Claim)....................................................................................46
Figure 9 Product No.6 (Label and Claim)......................................................................................46
Figure 10 Product No.7 (Image and Label)...................................................................................46
Figure 11 Product No.8 (No manipulation)....................................................................................46
V
List of Tables
Table 1 Dimensions of Customer Experience .................................................................................. 5 Table 2 Nutrition and Health (NH) Claim ........................................................................................ 8 Table 3 Packaging profiles ......................................................................................................... 12 Table 4 Participants Per Condition............................................................................................... 16 Table 5 ANOVA's of Items Measuring Customer Experience, Perceived Healthiness and Purchase Intention
of Healthy Juice ....................................................................................................................... 17 Table 6 Cronbach’s Alpha of Constructs ....................................................................................... 18 Table 7 Pearson Correlations between Measures of Dimensions of CE and with Purchase Intention of
Healthy Juice ........................................................................................................................... 19 Table 8 Partial Correlation Between Dimensions of CE and PI .......................................................... 20 Table 9 Standardized Regression Coefficients, P-values and Model Summary Information for the CE
Influence PI Model and Packaging Elements Influence CE Models .................................................... 21 Table 10 Model Summary of Mediation Analysis with Healthy Choice Label as Independent Variable,
Cognitive Dimension of CE as Mediator ........................................................................................ 23 Table 11 Standardized Regression Coefficients, P-values and Model Summary Information for the CE
Influence PI Model and Packaging Elements Influence PH and PI Models ........................................... 25 Table 12 Exploratory Factor Analysis: CE Dimensions, PH and PI uses Varimax Rotation ..................... 37 Table 13 Exploratory Factor Analysis: CE Dimensions, PH and PI uses Oblimin Rotation ...................... 38 Table 14 Exploratory Factor Analysis: Psychographic Characteristics uses Varimax Rotation ................ 39 Table 15 Exploratory Factor Analysis: Psychographic Characteristics uses Oblimin Rotation ................. 39 Table 16 Model Summary of Mediation Analysis with Image as Independent Variable, Controlling for
Covariates .............................................................................................................................. 40 Table 17 Model Summary of Mediation Analysis with Image as Independent Variable, Controlling for
Covariates (cont.) .................................................................................................................... 41 Table 18 Model Summary of Mediation Analysis with Label as Independent Variable, Controlling for
Covariates .............................................................................................................................. 42 Table 19 Model Summary of Mediation Analysis with Label as Independent Variable, Controlling for
Covariates (cont.) .................................................................................................................... 43 Table 20 Model Summary of Mediation Analysis with Claim as Independent Variable, Controlling for
Covariates .............................................................................................................................. 44 Table 21 Model Summary of Mediation Analysis with Claim as Independent Variable, Controlling for
Covariates (cont.) .................................................................................................................... 45
1
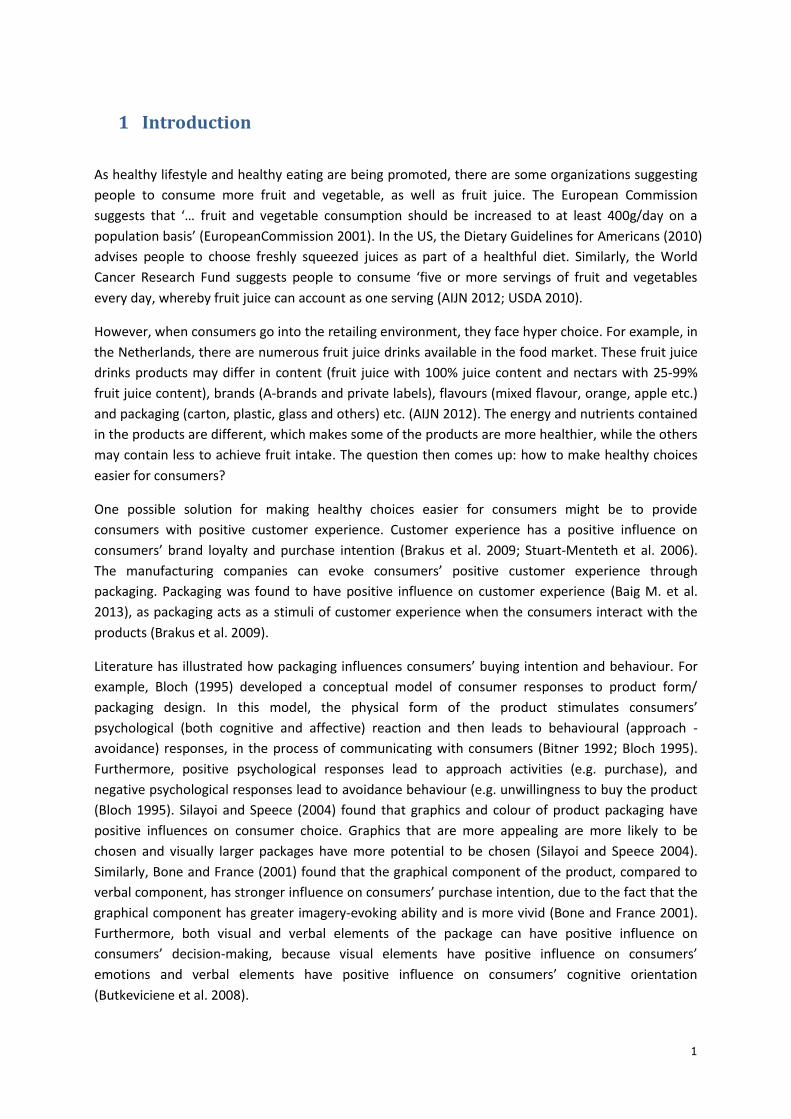
1 Introduction
As healthy lifestyle and healthy eating are being promoted, there are some organizations suggesting
people to consume more fruit and vegetable, as well as fruit juice. The European Commission
suggests that ‘… fruit and vegetable consumption should be increased to at least 400g/day on a
population basis’ (EuropeanCommission 2001). In the US, the Dietary Guidelines for Americans (2010)
advises people to choose freshly squeezed juices as part of a healthful diet. Similarly, the World
Cancer Research Fund suggests people to consume ‘five or more servings of fruit and vegetables
every day, whereby fruit juice can account as one serving (AIJN 2012; USDA 2010).
However, when consumers go into the retailing environment, they face hyper choice. For example, in
the Netherlands, there are numerous fruit juice drinks available in the food market. These fruit juice
drinks products may differ in content (fruit juice with 100% juice content and nectars with 25-99%
fruit juice content), brands (A-brands and private labels), flavours (mixed flavour, orange, apple etc.)
and packaging (carton, plastic, glass and others) etc. (AIJN 2012). The energy and nutrients contained
in the products are different, which makes some of the products are more healthier, while the others
may contain less to achieve fruit intake. The question then comes up: how to make healthy choices
easier for consumers?
One possible solution for making healthy choices easier for consumers might be to provide
consumers with positive customer experience. Customer experience has a positive influence on
consumers’ brand loyalty and purchase intention (Brakus et al. 2009; Stuart-Menteth et al. 2006).
The manufacturing companies can evoke consumers’ positive customer experience through
packaging. Packaging was found to have positive influence on customer experience (Baig M. et al.
2013), as packaging acts as a stimuli of customer experience when the consumers interact with the
products (Brakus et al. 2009).
Literature has illustrated how packaging influences consumers’ buying intention and behaviour. For
example, Bloch (1995) developed a conceptual model of consumer responses to product form/
packaging design. In this model, the physical form of the product stimulates consumers’
psychological (both cognitive and affective) reaction and then leads to behavioural (approach -
avoidance) responses, in the process of communicating with consumers (Bitner 1992; Bloch 1995).
Furthermore, positive psychological responses lead to approach activities (e.g. purchase), and
negative psychological responses lead to avoidance behaviour (e.g. unwillingness to buy the product
(Bloch 1995). Silayoi and Speece (2004) found that graphics and colour of product packaging have
positive influences on consumer choice. Graphics that are more appealing are more likely to be
chosen and visually larger packages have more potential to be chosen (Silayoi and Speece 2004).
Similarly, Bone and France (2001) found that the graphical component of the product, compared to
verbal component, has stronger influence on consumers’ purchase intention, due to the fact that the
graphical component has greater imagery-evoking ability and is more vivid (Bone and France 2001).
Furthermore, both visual and verbal elements of the package can have positive influence on
consumers’ decision-making, because visual elements have positive influence on consumers’
emotions and verbal elements have positive influence on consumers’ cognitive orientation
(Butkeviciene et al. 2008).
2
Literature that investigates the underlying psychological mechanism in this process is limited. Vilnai-
Yavetz and Koren (2013) concluded that the perceived aesthetics and symbolism mediate this
process (Vilnai-Yavetz and Koren 2013). But there are no researches illustrating whether and how
customer experience mediates this process of packaging influencing the purchase intention.
This study aims at filling in this knowledge gap, by answering how packaging elements stimulate
customer experience, as a mediator in influencing consumers’ purchase intention. This thesis is
focused on the purchase intention for healthy juice products, as the main problem is to make healthy
choice easier for the consumers.
So the research question would be:
RQ: Whether and how does customer experience act as mediator between packaging and consumers’
purchase intention at the point-of-sale for healthy juice.
In order to answer this question, five sub research questions are formulated:
SRQ 1: What is customer experience?
SRQ 2: How does customer experience stimulate purchase intention of healthy juice?
SRQ3: How do packaging elements stimulate customer experience?
SRQ4: How do packaging elements evoke the purchase intention of healthy juice?
SRQ5: How do packaging elements stimulate customer experience, which in turn influence the
consumers’ purchase intention of healthy juice at the point-of-sale?
In the subsequent sections, this thesis starts with a literature review of customer experience and its
dimensions, followed by a literature review about the role and elements of packaging. Then
continues with the hypotheses and conceptual model, the methodology, results, discussion, further
recommendation and conclusion respectively.
3
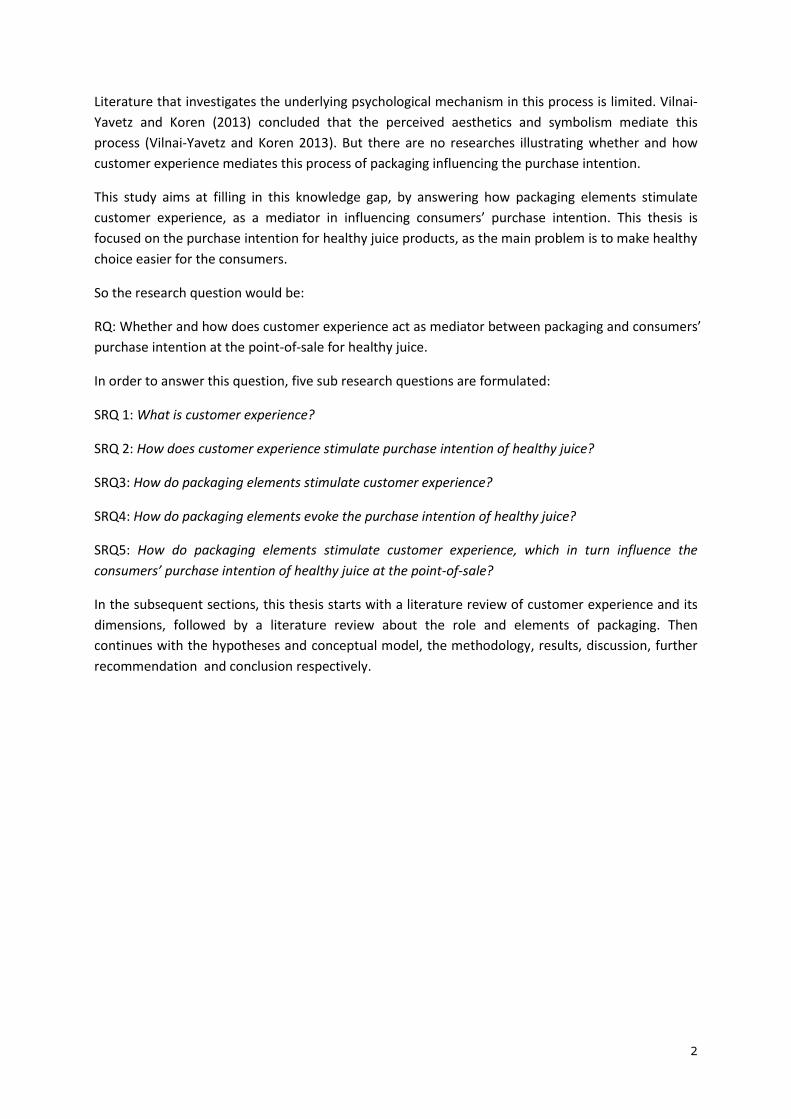
2 Theoretical framework In order to answer the main research question and the sub-questions, a literature review of the
concept and dimensions of customer experience and a review about the role and elements of
packaging were presented. Followed by several hypotheses developed concerning the research
questions.
2.1 Customer experience Since the publication of Pine and Gilmore’s ‘Welcome to the experience economy’ (1998), creating
customer experience became a new way to create value for both companies and consumers (Neher
et al. 2012; Pine and Gilmore 1998; Skard et al. 2011). Pine and Gilmore (1998) claimed that ‘as
goods and services becomes commoditized, the customer experiences that companies create will
matter most’ (p.97) (Pine and Gilmore 1998) (Skard et al. 2011). However, this concept is not
completely new. Holbrook and Hirschman (1982) already introduced the basic idea of customer
experience in marketing (Holbrook and Hirschman 1982). This perspective means a shift from a
cognitive perspective of consumers as rational economic decision maker, to a more holistic
perspective of both rational and emotional decision making (Skard et al. 2011). Consumers are not
merely rational information seekers; their decision-making process is also influenced by their feelings
and emotions. Creating memorable/positive customer experience underlies the creation of customer
value, which in turn increase consumers’ purchase intention or positive attitude to
products/organizations (Holbrook 2006; Neher et al. 2012).
2.1.1 Definition
The notion of customer experience has been widely used in the applied and scientific literature of
experiential marketing. But it was framed in different words and thus did not have a unified
definition. Different definitions share the idea that experiences stem from interactions or activities
between a person and physical objects or services (Neher et al. 2012). Several researchers used the
concept customer experience. Gentile et al. (2007) indicated that the customer experience originates
from interactions between a customer and a product, a company, or part of its organization, which
provoke a reaction (Gentile et al. 2007). Biedenbach and Marell (2010) defined customer experience
as the result of the customer’s interpretation of his or her total interaction with the brand and
perceived value of this encounter (Biedenbach and Marell 2010). The concept of brand experience is
also commonly used in literature. For example, Brakus et al. (2009) defined brand experience as
subjective, internal consumer responses (sensations, feelings, and cognitions) and behavioural
responses evoked by brand-related stimuli that are part of a brand’s design and identity, packaging,
communications, and environments (Brakus et al. 2009). To strengthen the interaction between
customer and salespeople within the retailing environment, some researchers used the concept
service experience. For example, Hui and Bateson (1991) defined service experience as the
consumer’s emotional feelings during the service encounter (Hui and Bateson 1991). Mascarenhas et
al. (2006) used the term total customer experience (TCE), which is defined as a totally positive,
engaging, enduring, and socially fulfilling physical and emotional customer experience across all
major levels of one’s consumption chain and one that is brought about by distinct market offering
that calls for active interaction between consumers and providers (Mascarenhas et al. 2006).
4
In this thesis, we will use the term customer experience, using the following definition: Customer
experience can be defined as the internal and behavioural reaction of consumers evoked by the
interaction of them with a product, a brand, the service, the company, or part of its organization
(Brakus et al. 2009; Gentile et al. 2007; Verhoef et al. 2009).
2.1.2 Dimension
Researchers divided customer experience into different dimensions (Brakus et al. 2009; Gentile et al.
2007; Holbrook 2006; Schmitt 1999; Sheth et al. 1991). Generally speaking, there are six dimensions
of customer experience: sensory dimension, affective dimension, cognitive dimension, social
dimension, behavioural dimension and functional dimension (Table 1).
The Sensory dimension of customer experience is related to the sensory pleasure that is derived from
stimulation through sensory cues. The sensory pleasure is derived from human senses through sight,
sound, taste, smell and touch (Gentile et al. 2007; Neher et al. 2012). A product that is beautiful,
makes favourable sounds, tastes great, smells nice, or feels comfortable to touch provides people
with a positive sensory dimension of customer experience.
The Affective dimension of customer experience is related to the arousal of emotional states (Neher
et al. 2012; Sheth et al. 1991). The affective dimension of customer experience includes feelings,
moods and emotions such as passion or joy. For example, a product that has the ability to stimulate
consumers’ associations with affective content would trigger consumers’ perception of the affective
dimension of customer experience.
The Cognitive dimension of customer experience relates to the activation of the cognitive process,
such as activation of knowledge, thinking and imagination. This can be stimulated while consumers
are processing the information related to the products, such as the content and the technology
information.
The Behavioural dimension of customer experience is created through the affirmation of one’s values
and beliefs. This is mostly expressed through the adaptation of certain lifestyle or behaviour (Gentile
et al. 2007; Neher et al. 2012). The behavioural dimension of customer experience is stimulated
when consuming certain products that fit into one’s favourable lifestyle. For example, this dimension
of customer experience is stimulated for an environmental friendly people to consume organic food
products.
The Social dimension of customer experience comes from the confirmation of one’s social identity
(Gentile et al. 2007; Neher et al. 2012). To be accepted and be perceived positively by the members
in one’s social group is the source of this dimension. The consumption of products can stimulate
one’s social dimension of customer experience when the consumption acts as a means to be
perceived positively by a social group (Holbrook 2006).
The Functional dimension of customer experience is related to the functional element or pragmatic
factor of doing things (Gentile et al. 2007; Neher et al. 2012). Concepts that are related to this
dimension are usability (e.g. handling of the packaging), price, convenience (e.g. easy to cook) or
functionality (e.g. satisfaction of thirst).
5
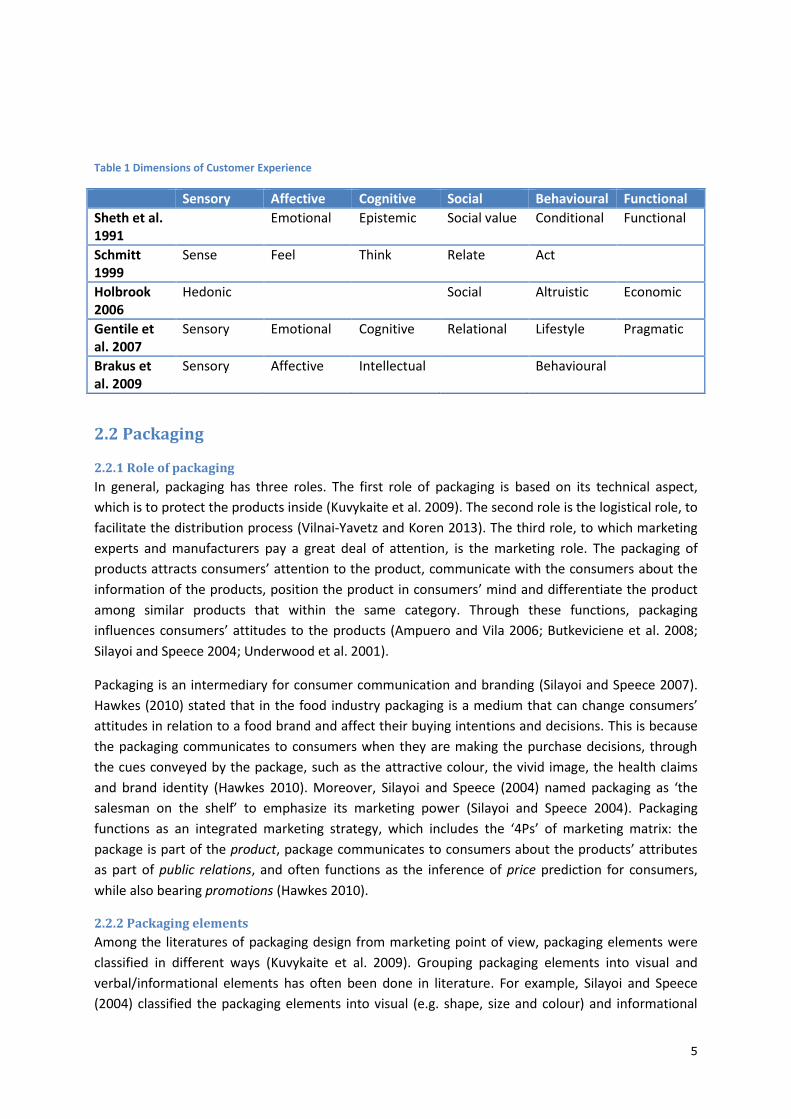
Table 1 Dimensions of Customer Experience
Sensory Affective Cognitive Social Behavioural Functional
Sheth et al. 1991
Emotional Epistemic Social value Conditional Functional
Schmitt 1999
Sense Feel Think Relate Act
Holbrook 2006
Hedonic Social Altruistic Economic
Gentile et al. 2007
Sensory Emotional Cognitive Relational Lifestyle Pragmatic
Brakus et al. 2009
Sensory Affective Intellectual Behavioural
2.2 Packaging
2.2.1 Role of packaging
In general, packaging has three roles. The first role of packaging is based on its technical aspect,
which is to protect the products inside (Kuvykaite et al. 2009). The second role is the logistical role, to
facilitate the distribution process (Vilnai-Yavetz and Koren 2013). The third role, to which marketing
experts and manufacturers pay a great deal of attention, is the marketing role. The packaging of
products attracts consumers’ attention to the product, communicate with the consumers about the
information of the products, position the product in consumers’ mind and differentiate the product
among similar products that within the same category. Through these functions, packaging
influences consumers’ attitudes to the products (Ampuero and Vila 2006; Butkeviciene et al. 2008;
Silayoi and Speece 2004; Underwood et al. 2001).
Packaging is an intermediary for consumer communication and branding (Silayoi and Speece 2007).
Hawkes (2010) stated that in the food industry packaging is a medium that can change consumers’
attitudes in relation to a food brand and affect their buying intentions and decisions. This is because
the packaging communicates to consumers when they are making the purchase decisions, through
the cues conveyed by the package, such as the attractive colour, the vivid image, the health claims
and brand identity (Hawkes 2010). Moreover, Silayoi and Speece (2004) named packaging as ‘the
salesman on the shelf’ to emphasize its marketing power (Silayoi and Speece 2004). Packaging
functions as an integrated marketing strategy, which includes the ‘4Ps’ of marketing matrix: the
package is part of the product, package communicates to consumers about the products’ attributes
as part of public relations, and often functions as the inference of price prediction for consumers,
while also bearing promotions (Hawkes 2010).
2.2.2 Packaging elements
Among the literatures of packaging design from marketing point of view, packaging elements were
classified in different ways (Kuvykaite et al. 2009). Grouping packaging elements into visual and
verbal/informational elements has often been done in literature. For example, Silayoi and Speece
(2004) classified the packaging elements into visual (e.g. shape, size and colour) and informational
6
elements (e.g. nutrition labels and brand information)(Silayoi and Speece 2004). Butkeviciene,
Stravinskiene and Rutelione (2008) categorized packaging elements into nonverbal components (e.g.
colour, form, size, imageries, graphics, materials and smell), verbal components (e.g. name, brand,
producer/country of origin and instructions of consumption) and packaging features (such as
simplicity and innovativeness) (Butkeviciene et al. 2008). Kuvykaite, Dovaliene and Navickiene (2009)
also divided packaging elements into two categories: visual (e.g. graphic, colour, size, form) and
verbal (e.g. product information, producer, country-of-origin, brand) elements (Kuvykaite et al. 2009).
In this thesis, the packaging elements of fruit juice product was divided into informational and visual
elements according to Silayoi and Speece (Silayoi and Speece 2004). Moreover, as the desired
outcome is the purchase intention for healthy fruit juice, the packaging elements we take into
consideration were meant to have influence on people to make healthy choice and can be
manipulated to achieve a better customer experience (Murphy et al. 2000).
In the following section, we develop specific hypotheses for three types of packaging elements,
namely front-of-pack (FOP) label, nutrition and health claims, and image, concerning their influence
on the dimensions of customer experience and consumers’ purchase intention.
2.3 Hypotheses
2.3.1 FOP nutrition label
Nutrition label of food products provides consumers with information about nutrient content of the
products. Mainly there are four kinds of nutrition labels: nutrition tables, labels based on Guideline
Daily Amounts (GDA’s), multiple traffic light (MTL) labels and signpost logos (e.g. Healthy Choice Tick)
(van Herpen and Trijp 2011).
These types of nutrition labels differ in two aspects: the position on the pack and the ‘directiveness’
level to provide information of healthiness (Hodgkins et al. 2009). Nutrition tables have already been
widely used in food markets around the world. This type of nutrition label provides consumers with
complete nutritional content information of the product and is normally on the back of the pack. But
it does not provide consumers with an overall interpretation about the healthiness of the product,
namely non-directive information. Different from nutrition tables, the other three kinds of labels are
front-of-pack (FOP) labels. Specifically, GDA’s labels show the amount of certain nutrients the
product contains, and shows the portion of daily need of the nutrients, based on guideline daily
amount. Multiple traffic light labels also contain nutrients in a fixed portion, filled with red (means
high), amber (means medium) and green (means low) colour, indicating the healthiness level of the
food product in each nutrient category. These two kinds of labels are semi-directive. They provide
the consumers with information about the underlying nutrients based on specific standards, whilst
leaving the consumers to make the overall evaluation of the healthiness. Besides, signpost
logos/health logos are only given to food products that are authorized as a ‘healthy choice’. This kind
of label tells consumers directly if the product is healthy or not, so this is a directive label (Hodgkins
et al. 2009).
Consumers generally state they like the FOP label and are likely to use it in their decision-making
process (van Herpen and Trijp 2011). However, according to Feunekes et al (2008), simpler FOP
labels (e.g. healthy choice tick) are more suitable than more complicated FOP labelling (e.g. MTL) in a
shopping environment, as they require less time for information processing. The complex detailed
7
labels provide consumers with information on key nutrients, whilst the simple labels provide
consumers with an evaluation of the overall healthiness of the product, thus reducing consumers’
cognitive effort (Feunekes et al. 2008; Scott and Worsley 1994).
According to the research results from the pan-European project FLABEL (Food Labelling to Advance
Better Education for Life), consumers’ attention to the nutrition labels on the food package on
average is between 25 and 100 milliseconds. Such a short period is not enough for consumers to
interpret the nutrient information thoroughly. Among all the nutrition labels, the health logo label
can increase consumers’ attention and use of the nutrition label (FLABEL 2012).
In this research, ‘healthy choice’ logo was chosen as one element of packaging. Because it is efficient
in increasing consumers’ attention and it directly relate the product to healthiness (Figure 1).
Figure 1 FOP label
The healthy choice label provides consumers with the certification of healthiness of the product, so it
leads to the association of healthy lifestyle. According to Gentile et al (2007), the behavioural
dimension of customer experience stems from the confirmation of the values and beliefs of the
person through the acceptance of a lifestyle or behaviours. The behavioural component is provided
when the consumption of the product becomes a mean to adhesion to the values the product/brand
bear (Gentile et al. 2007).
H1: The package with healthy choice logo will trigger higher behavioural dimension of customer
experience than package without the healthy choice logo.
Social dimension of customer experience emphasizes the relationship between the person and
his/her social context, and his/her relationship with other people or also the ideal self (Gentile et al.
2007). This dimension comes from the confirmation of one’s social identity (Smith and Colgate 2007).
The consumption of products which bear the healthy choice label would remind the consumers with
a healthy self-image, which would potentially be supported by his/her social group.
H2: The package with healthy choice logo will trigger higher social dimension of customer experience
than package without the healthy choice logo.
2.3.2 Nutrition and health claims
Nutrition and health (NH) claims, as part of packaging, act as tools for consumer communication
about information on food products (Leathwood et al. 2007). Consumers state that they use health
claims when making purchase decisions (Williams 2005). Categorised by the European Commission
(Regulation (EC) No 1924/2006), mainly there are three types of NH claims: 1) Nutrition claims, which
state, suggest or imply that a food has particular beneficial properties due to its composition
(regarding energy or a particular nutrient). For example, ‘This product is enriched with calcium’;2)
Health claims, which state, suggest or imply that a relationship exists between a food or one of its
8
components and health. For example, ‘Calcium can help build strong bones’; 3) ‘Reduction of disease
risk’ claims are any claim that states or implies that the consumption of a food or of its constituents
reduces a risk factor in the development of a human disease. For example, ‘This product is enriched
with calcium, so it can reduce risk in the development of osteoporosis’ (EU-Lex 2007; Verbeke et al.
2009; Wills et al. 2012).
The claims influence consumers’ choices for healthy products, so the claims are under regulation of
European Commission. The claims need to be approved by the European Food Safety Authority
(EFSA). The claims can only be permitted if they are based on scientific evidence and can be easily
understood by average consumers (EU-Lex 2007).
In the search for NH claims concerning vitamin C, there are several approved health claims and no
approved reduction of disease risk claims (EU-Lex 2012; EU-Lex 2011). So in this thesis, we are going
to investigate the presence of health claim on product packaging (Table 2).
Table 2 Nutrition and Health (NH) Claim
Product concept Health claim
Orange juice Vitamin C contributes to the normal function of the immune system
NH claims can be seen as an educational tool that would have positive impact on consumers’
behaviour and nutrition awareness (Williams 2005). Consumers need cognitive effort to process the
information provided by the NH claims. The cognitive component of customer experience is
connected with thinking or conscious mental processes, which include activities such as imagination
and knowledge building. So NH claims have positive influence on purchase intention through
cognitive dimension of customer experience.
H3: The package with health claim will trigger higher cognitive dimension of customer experience
than package without the health claim.
The health claim and reduction of disease risk claim can also be framed as promotion claim and
prevention claim. The promotion claim focuses on ‘the desirable end states that would result from
benefits gained’ and the prevention claim focuses on ‘the undesirable end states that would result
from benefits lost’ (Lee and Aaker 2004). Correspondingly, the health claim can be seen as a gain-
framed promotion claim, because it focuses on the pursuit of gains; while reduction of disease risk
claim can be seen as a loss-framed prevention claim, as it focuses on avoidance of losses.
The promotion and prevention claim differ in the emotional reaction of people. According to Lee and
Aaker (2004), a gain-framed promotion would stimulate higher eagerness (positive emotional
reaction) of people; while a loss-framed prevention claim would result in higher vigilance (negative
emotional reaction, e.g. fear) of people (Lee and Aaker 2004).
H4: The package with health claim will trigger higher affective dimension of customer experience
than package without the health claim.
9
2.3.3 Images
The research from Silayoi and Speece (2004; 2007) showed that graphics is an important packaging
element for consumers in their decision-making process, especially for consumers with high time
pressure or low involvement. This is because graphical components have greater imagery-evoking
ability and are more vivid (Bone and France 2001; Silayoi and Speece 2007; Silayoi and Speece 2004).
What Silayoi and Speece (2004) referred to as graphics is the combination of layout, colour,
typography, and photography (Silayoi and Speece 2004). In this thesis, we want to focus on how
product photography influences customer experience.
In the research of Ampuero and Vila (2006), they named product photography as image. They
classified image into two categories: image nature (the product is represented by photography or
cartoon picture) and image motive (the image of material of the product or a picture of happy people)
(Ampuero and Vila 2006). However, consumers prefer realistic images to abstract images
(Underwood et al. 2001), so we are not going to investigate the difference between the photography
and cartoon picture. Moreover, as all the juice products available in the market have the
photography of material (e.g. orange) on the package, we will only focus on whether adding a picture
of people would influences the purchase intention or not. And the image of fruit would be part of the
background.
Consumers are likely to imagine how a product ‘looks, tastes, feels, smells, or sounds’ when they
process the visual picture on products (Underwood et al. 2001). For example, in the research of
Hollywood et al. (2013), they found that the image of pouring milk into a glass made the milk product
looks appetising to the participants (Hollywood et al. 2013).
The sensory pleasure achieved from the images on the package is the source of the sensory
dimension of customer experience (Gentile et al. 2007). Consumers can use the image as a cue to
predict the taste of the product and achieve aesthetic pleasure from the image.
Affective dimension of customer experience is related to the arousal of one’s affective states, which
includes moods, feelings or emotions such as joy and passion (Gentile et al. 2007). An image of
people that can evoke people’s affective reaction would lead to the generation of affective
dimension of customer experience. Furthermore, as the packaging elements in this case are expected
to trigger the healthy choice, we will choose an image of healthy people as the image variable.
H5: The package with image of healthy people will trigger higher sensory dimension of customer
experience than package without the image of healthy people.
H6: The package with image of healthy people will trigger higher affective dimension of customer
experience than package without the image of healthy people.
The functional dimension of customer experience stems from the practical act of doing things
(Gentile et al. 2007). This dimension depends on the performance of the product, such as usability
(e.g. easy to handle or open), convenience (e.g. easy to prepare) and price (e.g. money value). These
are mostly expressed by the volume, shape, the instruction of use, and the producing technology etc.
However, we are not interested in these attributes in this research, so we are going to leave out the
investigation of functional dimension of customer experience.
10
Silayoi and Speece (2004) stated that the graphics and colour on the package have impact on
consumers’ purchase intention. Poor images can lead to the decreasing sale for many consumers,
while attractive images will increase the sales (Silayoi and Speece 2004). And according to Hollywood
et al. (2013), the package should signal its relevance to the needs of the consumers, so that the
consumers would lower their psychological ‘defences’ and be more willing to buy the product. The
packaging elements, namely healthy choice logo, health claim and the image of healthy people, are
all relevant to the purchase intention of healthy juice. So these elements will all have positive
influence on the purchase intention of healthy juice.
H7: The package with healthy choice logo will evoke higher purchase intention of healthy juice than
package without the healthy choice logo.
H8: The package with health claim will evoke higher purchase intention of healthy juice than package
without the health claim.
H9: The package with image of healthy people will evoke higher purchase intention of healthy juice
than package without the image of healthy people.
H10: The perceived sensory dimension, affective dimension, cognitive dimension, behavioural
dimension and social dimension of customer experience, mediate the impact of packaging elements
on the purchase intention of healthy juice.
2.3.4 Moderators
The interpretation of both visual and informational elements on package is likely to be influenced by
their way of processing information. Individuals differ in their information acquisition, their
information processing strategies and the utilization of information when making decisions (Childers
et al. 1985). Childers et al. (1985) named the information processing style as the style of proccessing
(SOP). SOP was divided into three types: visual-oriented processing style, no preference in processing
style, and verbal-oriented processing style (Childers et al. 1985). Similarly, Silayoi and Speece (2007)
indicated that people value and use different packaging elements and this depends on whether they
are image-seeking or information-seeking (Silayoi and Speece 2007). Image-seeking consumers value
the visual elements of packaging, whilst information-seeking consumers value the verbal elements
when making their decisions.
H11a: For people with visual-oriented processing style, they would perceive higher customer
experience when they see the image of healthy people.
H11b: For people with verbal-oriented processing style, they would perceive higher customer
experience when they see the healthy choice logo and the health claim.
Further, consumers’ attitudes and purchase intention are likely to be influenced by the personal
relevance to the product. Consumers who think health is important are more likely to use the healthy
logo label than others (van Herpen and Trijp 2011). Consumers value health claims which are more
personally relevant, and they have higher purchase intention for products bearing this kind of claim
(van Kleef et al. 2005). Factors such as attitudes and familiarity with the product may also account for
the interpretation of the information and the purchase intention (Verbeke et al. 2009).
11
H12: People with higher importance of orange juice would perceive higher purchase intention when
they see the packaging elements.
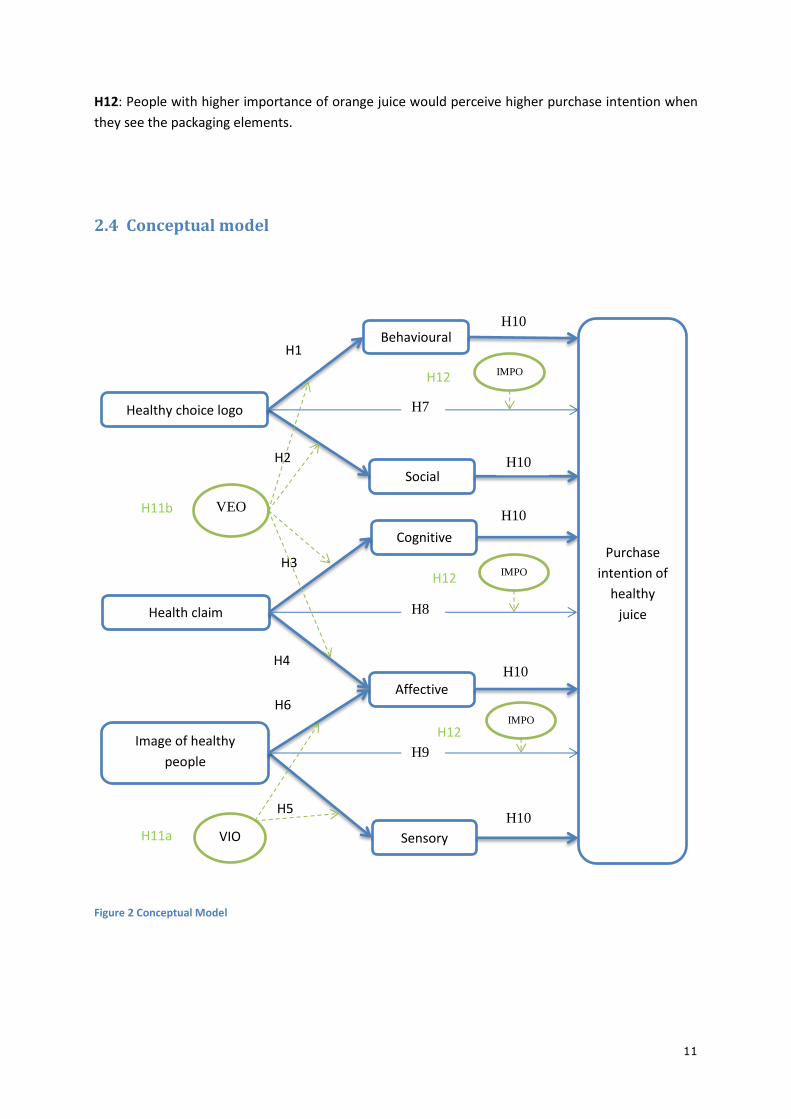
2.4 Conceptual model
Figure 2 Conceptual Model
Healthy choice logo
Social
Behavioural
Health claim
Cognitive
Affective
Sensory
Image of healthy
people
Purchase
intention of
healthy
juice
H3
H4
H6
H5
H1
H2
H7
H8
H9
H10
H10
H10
H10
H10
VIO H11a
VEO H11b
IMPO
IMPO
IMPO H12
H12
H12
12
3 Methods
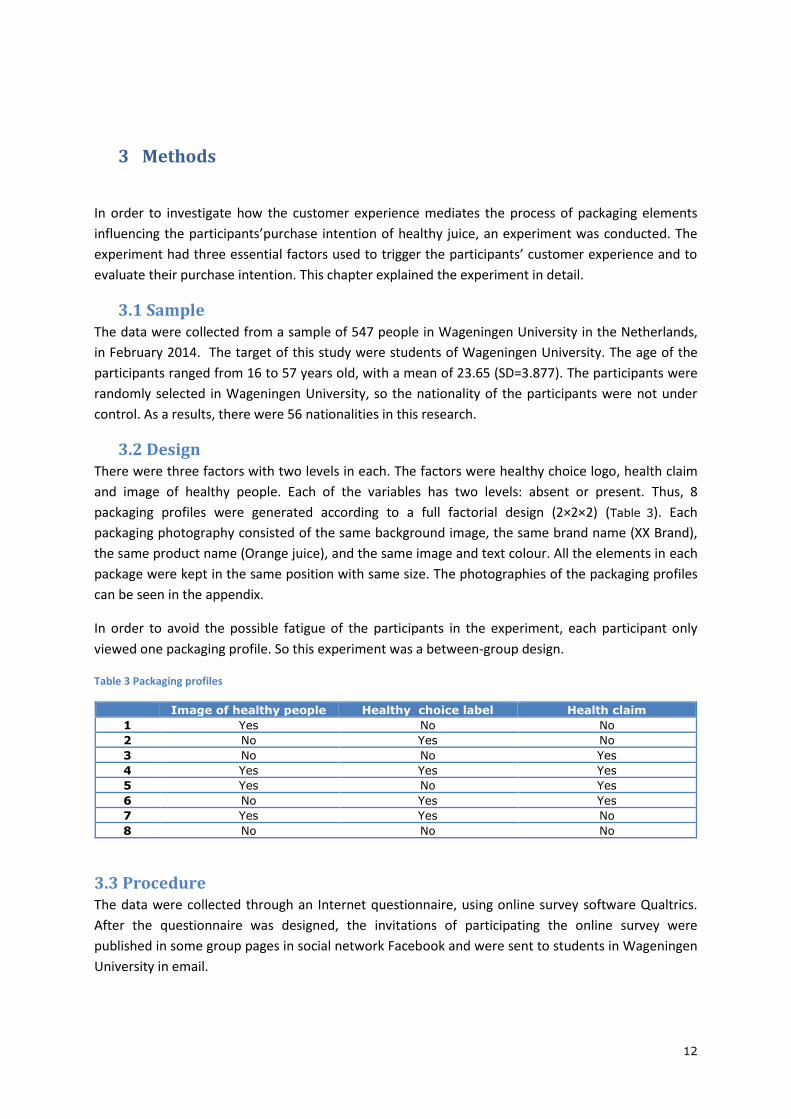
In order to investigate how the customer experience mediates the process of packaging elements
influencing the participants’purchase intention of healthy juice, an experiment was conducted. The
experiment had three essential factors used to trigger the participants’ customer experience and to
evaluate their purchase intention. This chapter explained the experiment in detail.
3.1 Sample The data were collected from a sample of 547 people in Wageningen University in the Netherlands,
in February 2014. The target of this study were students of Wageningen University. The age of the
participants ranged from 16 to 57 years old, with a mean of 23.65 (SD=3.877). The participants were
randomly selected in Wageningen University, so the nationality of the participants were not under
control. As a results, there were 56 nationalities in this research.
3.2 Design There were three factors with two levels in each. The factors were healthy choice logo, health claim
and image of healthy people. Each of the variables has two levels: absent or present. Thus, 8
packaging profiles were generated according to a full factorial design (2×2×2) (Table 3). Each
packaging photography consisted of the same background image, the same brand name (XX Brand),
the same product name (Orange juice), and the same image and text colour. All the elements in each
package were kept in the same position with same size. The photographies of the packaging profiles
can be seen in the appendix.
In order to avoid the possible fatigue of the participants in the experiment, each participant only
viewed one packaging profile. So this experiment was a between-group design.
Table 3 Packaging profiles
Image of healthy people Healthy choice label Health claim
1 Yes No No
2 No Yes No
3 No No Yes
4 Yes Yes Yes
5 Yes No Yes
6 No Yes Yes
7 Yes Yes No
8 No No No
3.3 Procedure The data were collected through an Internet questionnaire, using online survey software Qualtrics.
After the questionnaire was designed, the invitations of participating the online survey were
published in some group pages in social network Facebook and were sent to students in Wageningen
University in email.
13
The respondents who were willing to participate in the research clicked the link of the survey and
started filling in the online questionnaire. They needed to complete two sections of the
questionnaire: in the first section, the respondents needed to view one product photography showed
to them and answer questions connected to the theoretical framework. They needed to indicate
their perceived customer experience, perceived healthiness and purchase intention of healthy juice.
The eight product packaging phographies were randomly assigned to each respondent. In the second
part of the questionnaire, the respondents needed to answer questions concerning their
psychographic characteristics (information processing style and personal relevance to healthy orange
juice) and demographic information, without the product photography. This section was intended to
measure the individual differences among the respondents.
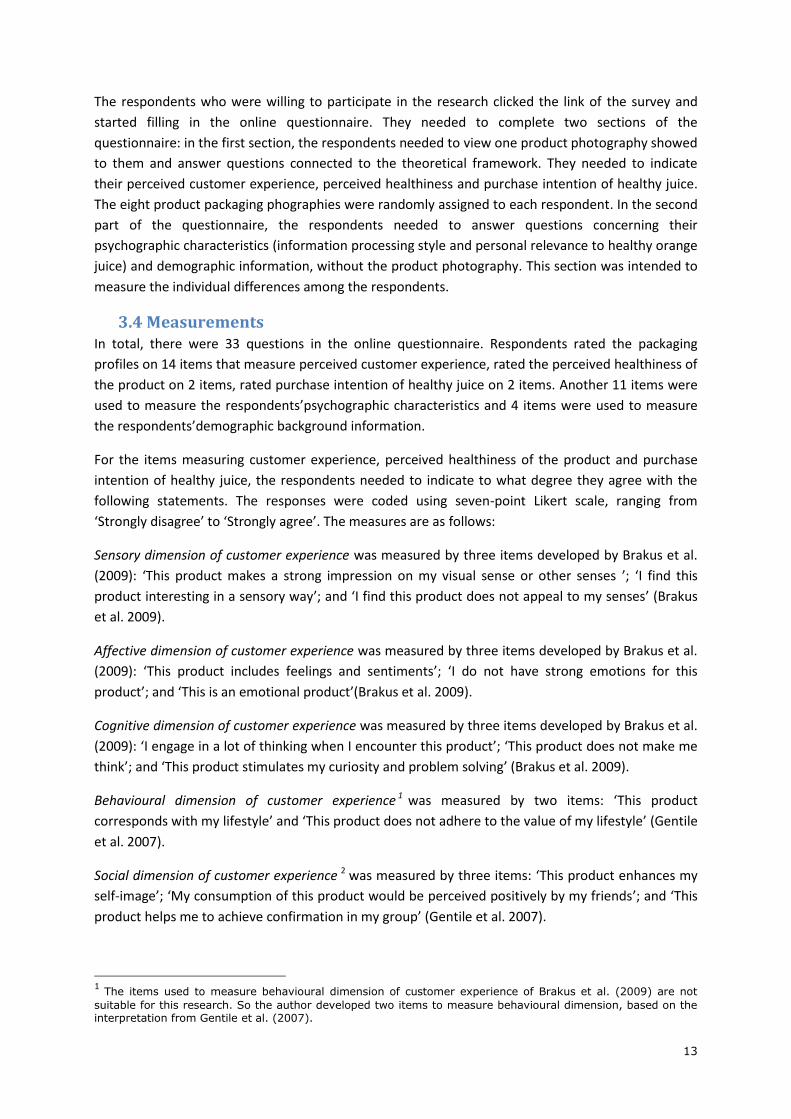
3.4 Measurements In total, there were 33 questions in the online questionnaire. Respondents rated the packaging
profiles on 14 items that measure perceived customer experience, rated the perceived healthiness of
the product on 2 items, rated purchase intention of healthy juice on 2 items. Another 11 items were
used to measure the respondents’psychographic characteristics and 4 items were used to measure
the respondents’demographic background information.
For the items measuring customer experience, perceived healthiness of the product and purchase
intention of healthy juice, the respondents needed to indicate to what degree they agree with the
following statements. The responses were coded using seven-point Likert scale, ranging from
‘Strongly disagree’ to ‘Strongly agree’. The measures are as follows:
Sensory dimension of customer experience was measured by three items developed by Brakus et al.
(2009): ‘This product makes a strong impression on my visual sense or other senses ’; ‘I find this
product interesting in a sensory way’; and ‘I find this product does not appeal to my senses’ (Brakus
et al. 2009).
Affective dimension of customer experience was measured by three items developed by Brakus et al.
(2009): ‘This product includes feelings and sentiments’; ‘I do not have strong emotions for this
product’; and ‘This is an emotional product’(Brakus et al. 2009).
Cognitive dimension of customer experience was measured by three items developed by Brakus et al.
(2009): ‘I engage in a lot of thinking when I encounter this product’; ‘This product does not make me
think’; and ‘This product stimulates my curiosity and problem solving’ (Brakus et al. 2009).
Behavioural dimension of customer experience 1 was measured by two items: ‘This product
corresponds with my lifestyle’ and ‘This product does not adhere to the value of my lifestyle’ (Gentile
et al. 2007).
Social dimension of customer experience 2 was measured by three items: ‘This product enhances my
self-image’; ‘My consumption of this product would be perceived positively by my friends’; and ‘This
product helps me to achieve confirmation in my group’ (Gentile et al. 2007).
1 The items used to measure behavioural dimension of customer experience of Brakus et al. (2009) are not
suitable for this research. So the author developed two items to measure behavioural dimension, based on the interpretation from Gentile et al. (2007).
14
Perceived healthiness was measured by two items: ‘This product is healthy’ and ‘This product is good
for my health’.
Purchase intention of healthy juice was measured by two items derived froma study of Vilnai-Yavetz
and Koren (2013): ‘I believe that most people would like to buy this product’ and ‘I would purchase
this product’ (Vilnai-Yavetz and Koren 2013).
The items measuring psychographic characteristics of the respondents consisted of two main parts:
items measuring their information processing style and items measuring their personal relevance to
the orange juice (importance of orange juice and their health status).
Style of processing (SOP) 3was measured by six items developed by Childers et al. (1985): ‘I enjoy
doing work that requires the use of words’; ‘I enjoy learning new words’; ‘I find it helps to think in
terms of mental pictures when doing many things’; ‘When I have forgotten something I frequently try
to form a mental ‘picture’ to remember it’; ‘I prefer activities that don’t require a lot of reading’; and
‘My thinking often consists of mental ‘pictures’ or images’ (Childers et al. 1985). The response
variables for SOP are four-point scale with end poles from ‘Always true (1)’ to ‘Always false (4)’.
Importance of orange juice (IMPO) was measured by three items: ‘How often do you drink orange
juice’; ‘How important orange juice is for you’; and ‘How important healthy consumption is for you’
(van Trijp and van der Lans 2007). One item used five-point Likert scale with end poles from ‘never’
to ‘always’, and the other two items used seven-point Likert scale with end poles from ‘Not al all
important’ to ‘Extremely important’.
Health status was measured by two items: ‘How would you best describe your overall health’ 4(van
Trijp and van der Lans 2007) and ‘How often do you get sick’5, answered on a five-point Likert scale.
The section of demographic background information comprised four items: gender, age, nationality
and if they are students in Wageningen University.
3.5 Data analysis The data analysis was carried out with IBM SPSS version 20.0 (IBM 2011) statistical software.
Significance was assessed at α=0.05.
To find out the relative importance of packaging elements on dimensions of CE, perceived
healthiness of the product and the purchase intention of healthy juice, and the relative importance
of dimensions of CE on the purchase intention of healthy juice, standard multiple regression analyses
were conducted. Moderator analysis was conducted using an add-on Macro PROCESS developed by
Hayes in SPSS (Hayes 2013).
Moreover, in order to examine the mediating function of customer experience, mediation analysis
was executed by using the causal steps approach (Baron and Kenny 1986; Judd and Kenny 1981).
2 There is no existing scale measuring social dimension of customer experience. The items used here were
developed by the author, based on the interpretation of social dimension of customer experience of Gentile et al.
(2007). 3 Childers et al. 1985 developed a 22-item scale measuring the information processing style, which is called
Style of Processing (SOP) scale. The items used to measure the information processing style in this research were selected from the 22 items, in order to avoid the fatigue of the respondents. 4 Item measuring health status of the respondents using five-point Likert scale ranging from ‘Poor’ to ‘Excellent’. 5 Item measuring health status of the respondents using five-point scale ranging from ‘Never’ to ‘Always’.
15
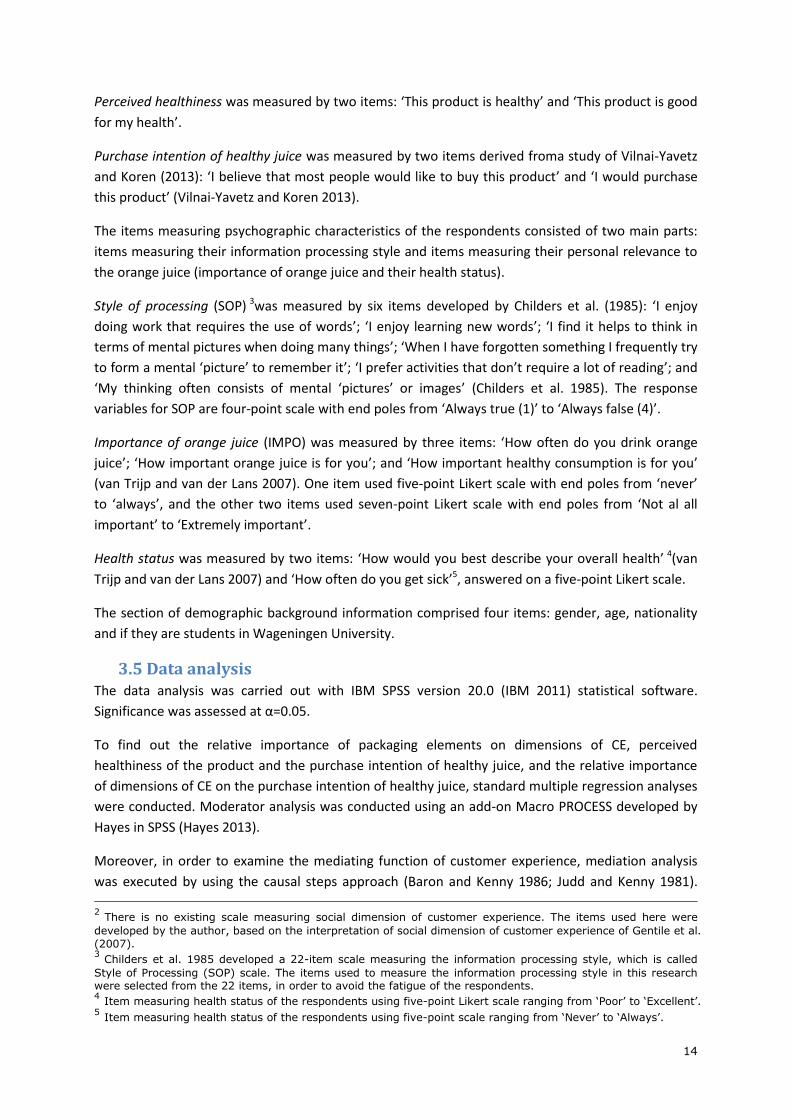
There are four steps in this approach: in the first step, a significant relation of the independent
variable to the dependent variable should exist in equation 1. In the second step, a significant
relation of the independent variable to the mediating variable should exist in equation 2. In the third
step, the coefficient of the mediating variable should be significant, controlling for the independent
variable in equation 3. In the fourth step, controlling for the mediating variable, the coefficient of the
independent variable should be insignificant in equation 3 (MacKinnon et al. 2007; Vilnai-Yavetz and
Koren 2013). When one or more of these relationships are not significant, it is concluded that
mediation does not hold (MacKinnon et al. 2007).
(1)
(2)
(3)
Within the equations (1-3), , , are intercepts, is the dependent variable, is the mediating
variable, is the independent variable. And is the coefficient relating the independent variable to
the dependent variable, is the coefficient relating the independent variable to the mediating
variable, is the coefficient relating the independent variable to the dependent variable adjusted
for the mediating variable, and is the coefficient relating the mediating variable to the dependent
variable adjusted for the independent variable (MacKinnon et al. 2007).
The coefficient values and the P-values were calculated using an add-on Macro PROCESS developed
by Hayes in SPSS (Hayes 2013). PROCESS uses an ordinary least squares path analytical framework to
estimate the direct and indirect effects in mediator models.
16
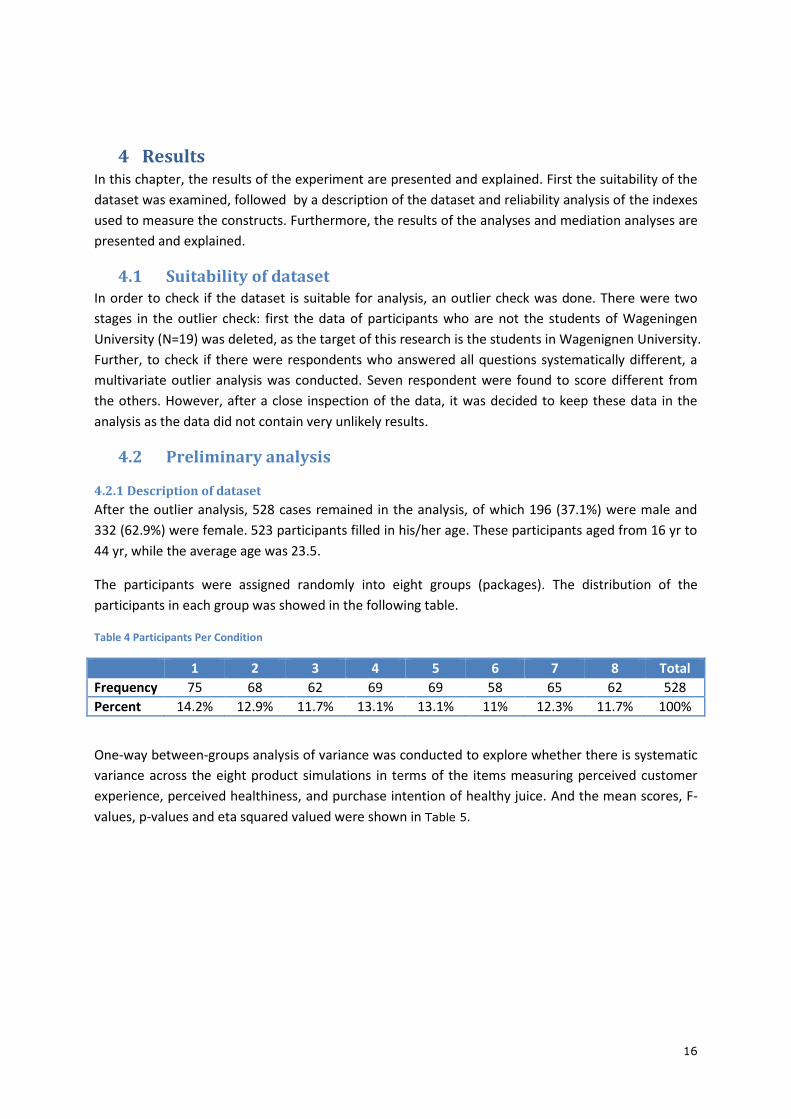
4 Results In this chapter, the results of the experiment are presented and explained. First the suitability of the
dataset was examined, followed by a description of the dataset and reliability analysis of the indexes
used to measure the constructs. Furthermore, the results of the analyses and mediation analyses are
presented and explained.
4.1 Suitability of dataset In order to check if the dataset is suitable for analysis, an outlier check was done. There were two
stages in the outlier check: first the data of participants who are not the students of Wageningen
University (N=19) was deleted, as the target of this research is the students in Wagenignen University.
Further, to check if there were respondents who answered all questions systematically different, a
multivariate outlier analysis was conducted. Seven respondent were found to score different from
the others. However, after a close inspection of the data, it was decided to keep these data in the
analysis as the data did not contain very unlikely results.
4.2 Preliminary analysis
4.2.1 Description of dataset
After the outlier analysis, 528 cases remained in the analysis, of which 196 (37.1%) were male and
332 (62.9%) were female. 523 participants filled in his/her age. These participants aged from 16 yr to
44 yr, while the average age was 23.5.
The participants were assigned randomly into eight groups (packages). The distribution of the
participants in each group was showed in the following table.
Table 4 Participants Per Condition
1 2 3 4 5 6 7 8 Total
Frequency 75 68 62 69 69 58 65 62 528
Percent 14.2% 12.9% 11.7% 13.1% 13.1% 11% 12.3% 11.7% 100%
One-way between-groups analysis of variance was conducted to explore whether there is systematic
variance across the eight product simulations in terms of the items measuring perceived customer
experience, perceived healthiness, and purchase intention of healthy juice. And the mean scores, F-
values, p-values and eta squared valued were shown in Table 5.
17
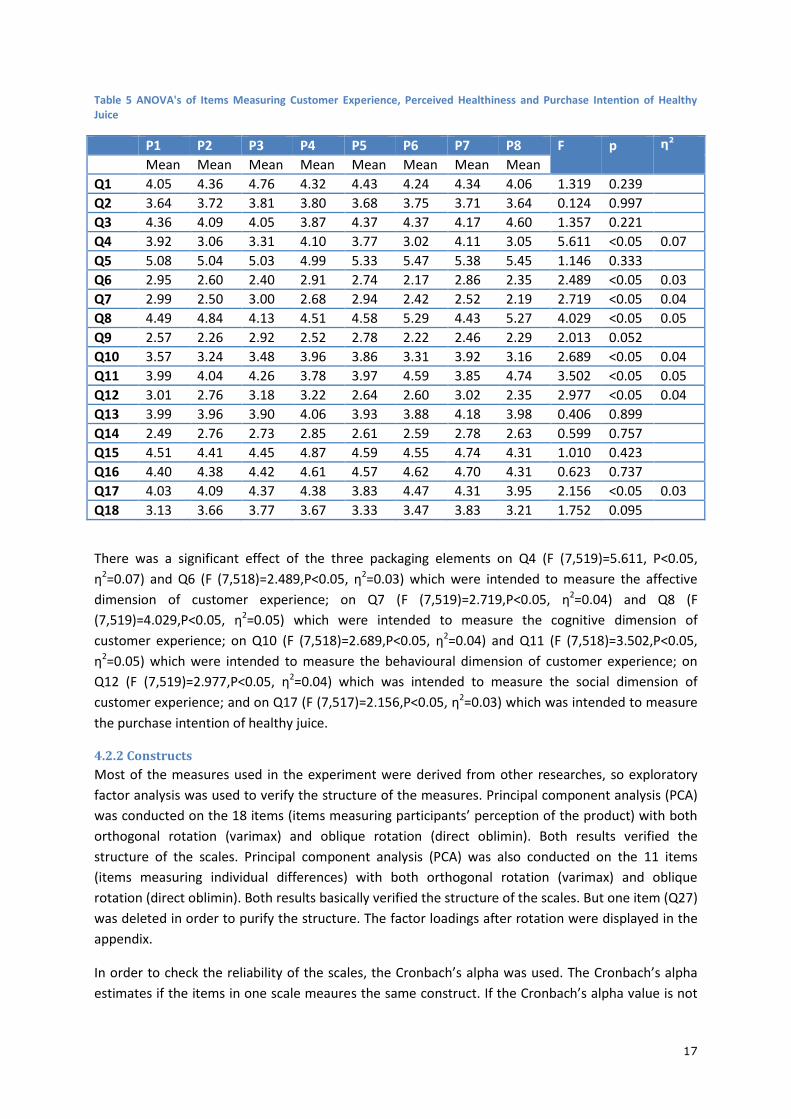
Table 5 ANOVA's of Items Measuring Customer Experience, Perceived Healthiness and Purchase Intention of Healthy Juice
P1 P2 P3 P4 P5 P6 P7 P8 F p η2
Mean Mean Mean Mean Mean Mean Mean Mean
Q1 4.05 4.36 4.76 4.32 4.43 4.24 4.34 4.06 1.319 0.239
Q2 3.64 3.72 3.81 3.80 3.68 3.75 3.71 3.64 0.124 0.997
Q3 4.36 4.09 4.05 3.87 4.37 4.37 4.17 4.60 1.357 0.221
Q4 3.92 3.06 3.31 4.10 3.77 3.02 4.11 3.05 5.611 <0.05 0.07
Q5 5.08 5.04 5.03 4.99 5.33 5.47 5.38 5.45 1.146 0.333
Q6 2.95 2.60 2.40 2.91 2.74 2.17 2.86 2.35 2.489 <0.05 0.03
Q7 2.99 2.50 3.00 2.68 2.94 2.42 2.52 2.19 2.719 <0.05 0.04
Q8 4.49 4.84 4.13 4.51 4.58 5.29 4.43 5.27 4.029 <0.05 0.05
Q9 2.57 2.26 2.92 2.52 2.78 2.22 2.46 2.29 2.013 0.052
Q10 3.57 3.24 3.48 3.96 3.86 3.31 3.92 3.16 2.689 <0.05 0.04
Q11 3.99 4.04 4.26 3.78 3.97 4.59 3.85 4.74 3.502 <0.05 0.05
Q12 3.01 2.76 3.18 3.22 2.64 2.60 3.02 2.35 2.977 <0.05 0.04
Q13 3.99 3.96 3.90 4.06 3.93 3.88 4.18 3.98 0.406 0.899
Q14 2.49 2.76 2.73 2.85 2.61 2.59 2.78 2.63 0.599 0.757
Q15 4.51 4.41 4.45 4.87 4.59 4.55 4.74 4.31 1.010 0.423
Q16 4.40 4.38 4.42 4.61 4.57 4.62 4.70 4.31 0.623 0.737
Q17 4.03 4.09 4.37 4.38 3.83 4.47 4.31 3.95 2.156 <0.05 0.03
Q18 3.13 3.66 3.77 3.67 3.33 3.47 3.83 3.21 1.752 0.095
There was a significant effect of the three packaging elements on Q4 (F (7,519)=5.611, P<0.05,
η2=0.07) and Q6 (F (7,518)=2.489,P<0.05, η2=0.03) which were intended to measure the affective
dimension of customer experience; on Q7 (F (7,519)=2.719,P<0.05, η2=0.04) and Q8 (F
(7,519)=4.029,P<0.05, η2=0.05) which were intended to measure the cognitive dimension of
customer experience; on Q10 (F (7,518)=2.689,P<0.05, η2=0.04) and Q11 (F (7,518)=3.502,P<0.05,
η2=0.05) which were intended to measure the behavioural dimension of customer experience; on
Q12 (F (7,519)=2.977,P<0.05, η2=0.04) which was intended to measure the social dimension of
customer experience; and on Q17 (F (7,517)=2.156,P<0.05, η2=0.03) which was intended to measure
the purchase intention of healthy juice.
4.2.2 Constructs
Most of the measures used in the experiment were derived from other researches, so exploratory
factor analysis was used to verify the structure of the measures. Principal component analysis (PCA)
was conducted on the 18 items (items measuring participants’ perception of the product) with both
orthogonal rotation (varimax) and oblique rotation (direct oblimin). Both results verified the
structure of the scales. Principal component analysis (PCA) was also conducted on the 11 items
(items measuring individual differences) with both orthogonal rotation (varimax) and oblique
rotation (direct oblimin). Both results basically verified the structure of the scales. But one item (Q27)
was deleted in order to purify the structure. The factor loadings after rotation were displayed in the
appendix.
In order to check the reliability of the scales, the Cronbach’s alpha was used. The Cronbach’s alpha
estimates if the items in one scale meaures the same construct. If the Cronbach’s alpha value is not
18
acceptable (<0.7), items can be deleted in order to get a higher Cronbach’s alpha, thus a higher
reliability of the scale.
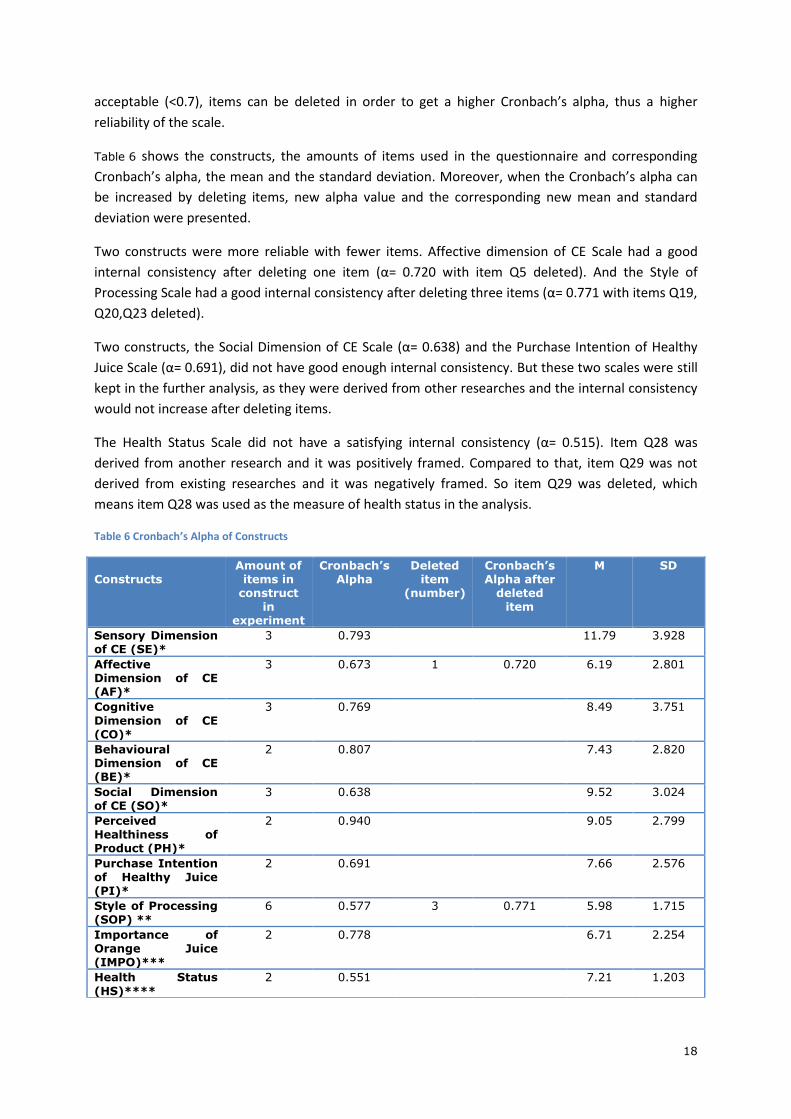
Table 6 shows the constructs, the amounts of items used in the questionnaire and corresponding
Cronbach’s alpha, the mean and the standard deviation. Moreover, when the Cronbach’s alpha can
be increased by deleting items, new alpha value and the corresponding new mean and standard
deviation were presented.
Two constructs were more reliable with fewer items. Affective dimension of CE Scale had a good
internal consistency after deleting one item (α= 0.720 with item Q5 deleted). And the Style of
Processing Scale had a good internal consistency after deleting three items (α= 0.771 with items Q19,
Q20,Q23 deleted).
Two constructs, the Social Dimension of CE Scale (α= 0.638) and the Purchase Intention of Healthy
Juice Scale (α= 0.691), did not have good enough internal consistency. But these two scales were still
kept in the further analysis, as they were derived from other researches and the internal consistency
would not increase after deleting items.
The Health Status Scale did not have a satisfying internal consistency (α= 0.515). Item Q28 was
derived from another research and it was positively framed. Compared to that, item Q29 was not
derived from existing researches and it was negatively framed. So item Q29 was deleted, which
means item Q28 was used as the measure of health status in the analysis.
Table 6 Cronbach’s Alpha of Constructs
Constructs
Amount of items in
construct in
experiment
Cronbach’s Alpha
Deleted item
(number)
Cronbach’s Alpha after
deleted item
M SD
Sensory Dimension of CE (SE)*
3 0.793 11.79 3.928
Affective Dimension of CE (AF)*
3 0.673 1 0.720 6.19 2.801
Cognitive
Dimension of CE (CO)*
3 0.769 8.49 3.751
Behavioural Dimension of CE (BE)*
2 0.807 7.43 2.820
Social Dimension of CE (SO)*
3 0.638 9.52 3.024
Perceived Healthiness of Product (PH)*
2 0.940 9.05 2.799
Purchase Intention of Healthy Juice (PI)*
2 0.691 7.66 2.576
Style of Processing (SOP) **
6 0.577 3 0.771 5.98 1.715
Importance of Orange Juice (IMPO)***
2 0.778 6.71 2.254
Health Status
(HS)****
2 0.551 7.21 1.203

19
* Using seven-point Likert scale
** Using four-point scale *** Two items in this scale use five-point Likert scale and seven-point Likert scale separately **** Using five-point Likert scale
4.3 Results of hypotheses
In order to analyse whether purchase intention of healthy juice is influenced by customer experience
(CE), a bivariate analysis between dimensions of CE and with purchase intention was conducted. The
following table indicated that there were positive relationship among the dimensions of CE and there
was a positive relationship between the dimensions of CE and the purchase intention of healthy juice,
with high levels of purchase intention of healthy juice associated with higher dimensions of CE.
Table 7 Pearson Correlations between Measures of Dimensions of CE and with Purchase Intention of Healthy Juice
Scale 1 2 3 4 5 6
1 Sensory dimension of CE -
2 Affective dimension of CE 0.340** -
3 Cognitive dimension of CE 0.358** 0.439** -
4 Behavioural dimension of CE
0.357** 0.165** 0.234** -
5 Social dimension of CE 0.361** 0.271** 0.326** 0.476** -
6 Purchase intention of healthy juice
0.583** 0.199** 0.325** 0.426** 0.480** -
**p<0.001 (2-tailed).
Then, in order to analyse how purchase intention of healthy juice is influenced by customer
experience (CE), a standard multiple regression analysis was conducted using purchase intention of
healthy juice (PI) as dependent variable, and using dimensions of CE (SE,AF,CO,BE,SO) as
independent variables. The results were presented in Table 9.
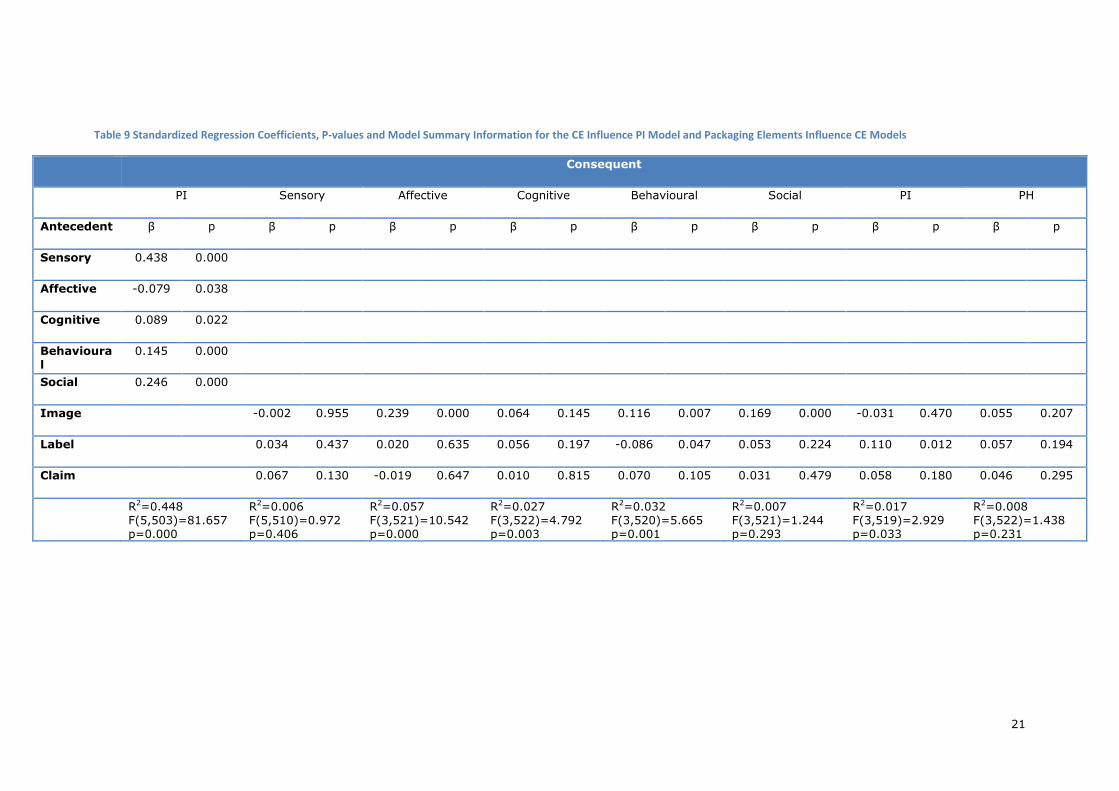
The results again verified that all five dimensions of CE had influence on purchase intention of
healthy juice. The sensory dimension, social dimension, behavioural dimension and cognitive
dimension of CE had positive influence on purchase intention of healthy juice, whereas affective
dimension of CE had negative influence on purchase intention of healthy juice.
As the relation between affective dimension of CE and purchase intention of healthy juice is different in two circumstances (positive in bivariate context and negative in multivariate analysis), the possibility of multicollinearity among the predictors were detected. However, no multicollinearity was found. Then the partial correlation values were checked, and this value of affective dimension of CE was found to be negative (Table 8). It was possible that the affective dimension of CE get affected by other dimensions of CE in influencing PI. Specifically, the affective dimension individually has negative influence on PI. But it has positive influence on PI via the effects of other dimensions. In the context of multivariate analysis, the partial correlation values which control for the effects of othe variables are more suitable. So the relation of affective dimension of CE between PI was negative.

20
Table 8 Partial Correlation Between Dimensions of CE and PI
Sensory Affective Cognitive Behavioural Social
PI 0.453 -0.092 0.102 0.164 0.266
In order to find out how the packaging elements (image of healthy people, healthy choice logo and
health claim) influence each dimension of CE, perceived healthiness and purchase intention of
healthy juice, several standard multiple regression analyses were carried out. The results were
presented in Table 9.
The results indicated that the sensory dimension, social dimension of CE and perceived healthiness of
the product cannot be explained by the packaging elements. Though the other three dimensions of
CE and purchase intention of healthy juice can be explained by the packaging elements, the
explanatory power was weak. This weak power may resulted from the nature of the between-group
experiment. Thus, in order to correct the effects of the psychographic characteristics (style of
processing, importance of orange juice and health status) and demographic information, and to
examine the hypotheses of the style of processing and importance of orange juice, these variables
would be included in the next stage of analysis.
21
Table 9 Standardized Regression Coefficients, P-values and Model Summary Information for the CE Influence PI Model and Packaging Elements Influence CE Models
Consequent
PI Sensory Affective Cognitive Behavioural Social PI PH
Antecedent β p β p β p β p β p β p β p β p
Sensory 0.438 0.000
Affective -0.079 0.038
Cognitive 0.089 0.022
Behavioural
0.145 0.000
Social 0.246 0.000
Image -0.002 0.955 0.239 0.000 0.064 0.145 0.116 0.007 0.169 0.000 -0.031 0.470 0.055 0.207
Label 0.034 0.437 0.020 0.635 0.056 0.197 -0.086 0.047 0.053 0.224 0.110 0.012 0.057 0.194
Claim 0.067 0.130 -0.019 0.647 0.010 0.815 0.070 0.105 0.031 0.479 0.058 0.180 0.046 0.295
R2=0.448 F(5,503)=81.657 p=0.000
R2=0.006 F(5,510)=0.972 p=0.406
R2=0.057 F(3,521)=10.542 p=0.000
R2=0.027 F(3,522)=4.792 p=0.003
R2=0.032 F(3,520)=5.665 p=0.001
R2=0.007 F(3,521)=1.244 p=0.293
R2=0.017 F(3,519)=2.929 p=0.033
R2=0.008 F(3,522)=1.438 p=0.231
22
The influence of packaging elements on dimensions of customer experience
In this part, the influence of packaging elements on dimensions of customer experience are
explained. The standardized regression coefficients, P-values and R square values from the multiple
regression analyses of packaging elements (image of healthy people, healthy choice logo and health
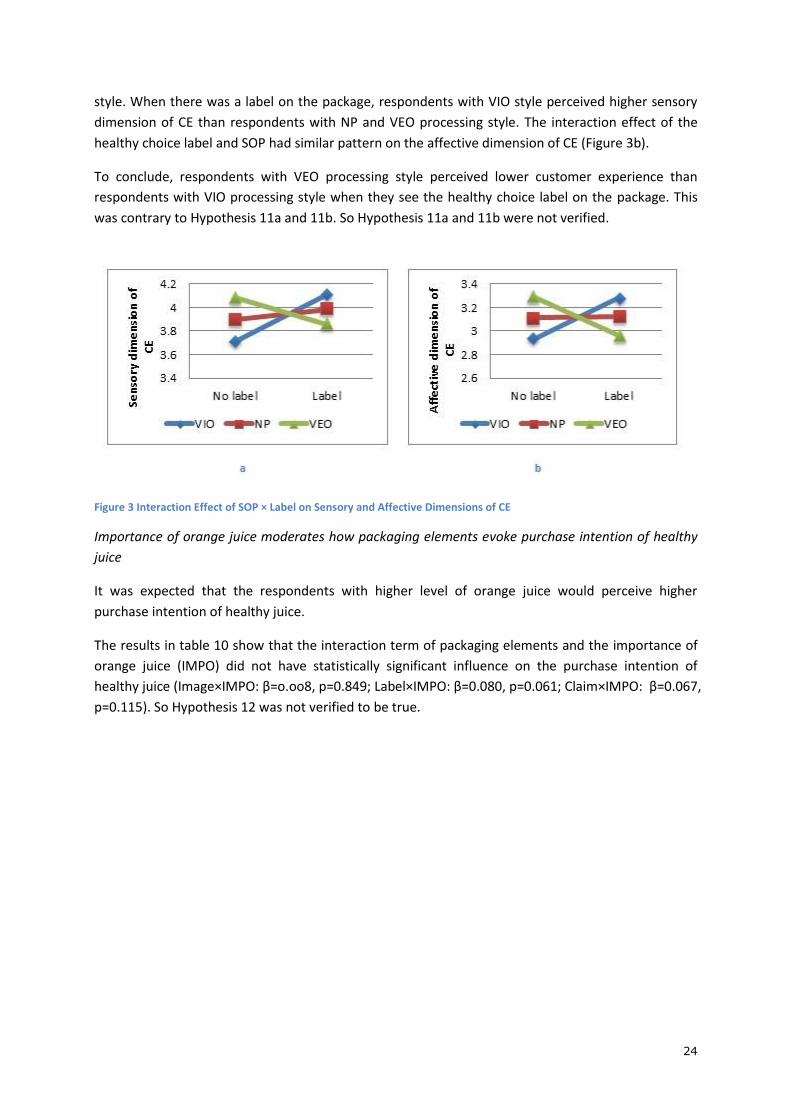
claim) influencing dimensions of customer experience were displayed in Table 11.
It was expected that healthy choice logo has positive influence on behavioural and social dimensions
of customer experience. However, this was not verified by the results of the multiple regression
analysis (Behavioural: β=0.051, p=0.230; Social: β=0.054, p=0.216). So Hypothesis 1 and Hypothesis 2
were not verified to be true.
It was expected that health claim has positive influence on cognitive and affective dimensions of
customer experience. However, this was also not verified by the results of the multiple regression
analysis (Cognitive: β=0.073,p=0.095; Affective: β= -0.002, p=0.963). To conclude, Hypothesis 3 and
Hypothesis 4 were not verified to be true.
It was expected that image of healthy people has positive influence on the affective and sensory
dimensions of customer experience. Image of healthy people was not found to have positive
influence on the sensory dimension of customer experience (β=0.000, p=0.998). Thus, Hypothesis 5
was not verified to be true.The results of the multiple regression analysis indicated that image of
healthy people has positive influence on the affective dimension of customer experience (β=0.245,
p<0.05). So Hypothesis 6 holds.
The influence of packaging elements on purchase intention of healthy juice
The results from the multiple regression analyses of packaging elements influencing dimensions of
customer experience was displayed in Table 11. It was expected that the three packaging elements
have positive influence on purchase intention of healthy juice. However, positive influence was not
found in health claim and image of healthy people influencing purchase intention of healthy juice
(Health claim: β=0.059, p=0.170; Image of healthy people: β=-0.027, p=0.529). Only healthy choice
label was found to have positive influence on purchase intention of healthy juice (β= 0.108, p<0.05).
So Hypothesis 7 holds, but Hypothesis 8 and Hypothesis 9 were not verified to be true.
CE as mediator in the process of packaging elements influencing purchase intention of healthy juice
In this part, the results of the mediation analysis were explained. Results of the mediation analysis
were shown in the appendix.
According to the causal steps approach, the mediation analysis was only applicable when there was
effect of the independent variable on the dependent variable, and effect of the independent variable
on the mediator. So the mediation analysis was carried out on three variables (independent variable:
healthy choice label, mediator: cognitive dimension of CE, dependent variable: purchase intention of
healthy juice). The results were displayed in Table 10.
In step 1 of mediation analysis, the regression of healthy choice logo on purchase intention of
healthy juice, ignoring the mediators (dimensions of CE), was significant (B=0.1780, p < 0.05). In step
2, the regression of healthy choice logo on cognitive dimension of CE was significant (B= -0.2511, p
23
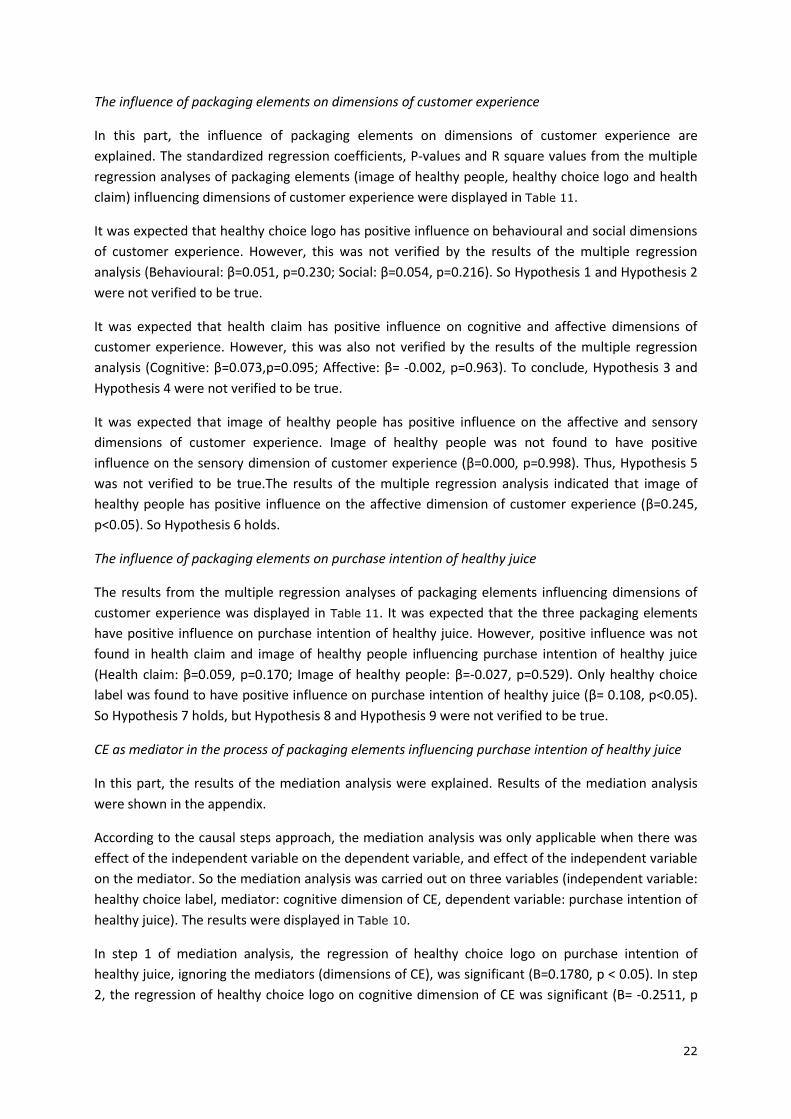
<0.05). In step 3, the cognitive dimension of CE, controlling for the effects of healthy choice logo, was
not significant (B=0.0691, p=0.0944). Thus, the cognitive dimension of CE was not found to mediate
the relationship between healthy choice logo and the purchase intention of healthy juice. So
Hypothesis 10 was not verified to be true.
Table 10 Model Summary of Mediation Analysis with Healthy Choice Label as Independent Variable, Cognitive Dimension of CE as Mediator
Consequent
M (Cognitive) Y (PI)
Antecedent Coeff. SE p Coeff. SE p
X (Label) -0.2511 0.1129 0.0266 0.1780 0.0874 0.0422
M
(Cognitive)
0.0691 0.0412 0.0944
C1 (Age) 0.0075 0.0154 0.6249 -0.0194 0.0119 0.1030
C2 (Gender) -0.0853 0.1176 0.4688 -0.0099 0.0899 0.9125
C3 (SOP) -0.1729 0.0989 0.0811 -0.0974 0.0761 0.2013
C4 (IMPO) 0.1627 0.0509 0.0015 0.1197 0.0401 0.0030
C5 (HS) -0.0084 0.0718 0.9068 -0.0766 0.0553 0.1669
Constant 2.7503 0.5617 0.0000 1.1345 0.4538 0.0128
R2 = 0.0424
F (6,479)= 3.5330 P=0.0020
R2 = 0.4748
F (11,474)= 38.9585 P=0.0000
Style of processing moderates how packaging elements trigger dimensions of CE
It was expected that respondents with visual-oriented processing style would perceive higher
customer experience when they see the image of healthy people. It was also expected that
respondents with verbal-oriented processing style would perceive higher customer experience when
they see the healthy choice logo and the health claim.
The results of the multiple regression of packaging elements influencing dimensions of customer
experience show that the interaction term of healthy choice logo and style of processing (SOP) had
statistically significant influence on the sensory dimension and affective dimension of CE (Sensory
dimension: β = -0.133, p< 0.05; affective dimension: β = -0.126, p< 0.05). SOP was a continuous
variable. According to Childers (1985), the lower level of SOP represented visual-oriented processing
style (VIO), the medium level of SOP represented no preference of processing style (NP), and the
higher level of SOP represented verbal-oriented processing style (VEO) (Childers et al. 1985). The
interaction effect of SOP and healthy choice logo was plotted in Figure 3.
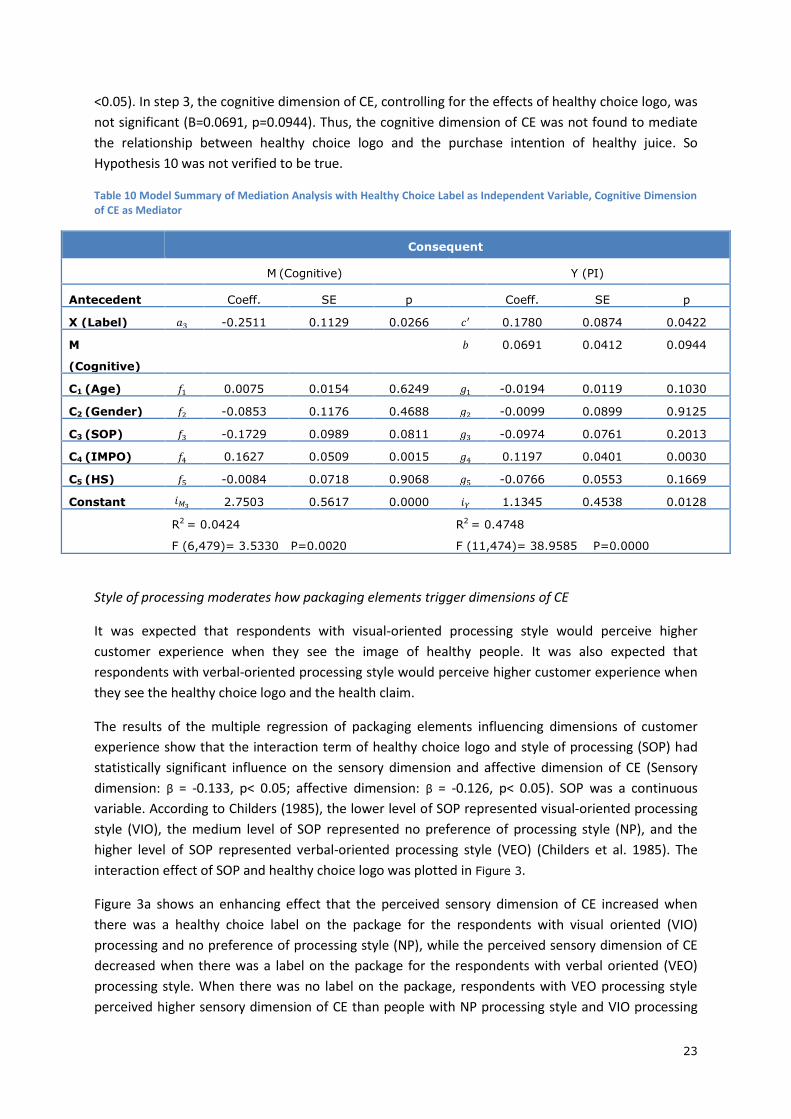
Figure 3a shows an enhancing effect that the perceived sensory dimension of CE increased when
there was a healthy choice label on the package for the respondents with visual oriented (VIO)
processing and no preference of processing style (NP), while the perceived sensory dimension of CE
decreased when there was a label on the package for the respondents with verbal oriented (VEO)
processing style. When there was no label on the package, respondents with VEO processing style
perceived higher sensory dimension of CE than people with NP processing style and VIO processing
24
style. When there was a label on the package, respondents with VIO style perceived higher sensory
dimension of CE than respondents with NP and VEO processing style. The interaction effect of the
healthy choice label and SOP had similar pattern on the affective dimension of CE (Figure 3b).
To conclude, respondents with VEO processing style perceived lower customer experience than
respondents with VIO processing style when they see the healthy choice label on the package. This
was contrary to Hypothesis 11a and 11b. So Hypothesis 11a and 11b were not verified.
Figure 3 Interaction Effect of SOP × Label on Sensory and Affective Dimensions of CE
Importance of orange juice moderates how packaging elements evoke purchase intention of healthy
juice
It was expected that the respondents with higher level of orange juice would perceive higher
purchase intention of healthy juice.
The results in table 10 show that the interaction term of packaging elements and the importance of
orange juice (IMPO) did not have statistically significant influence on the purchase intention of
healthy juice (Image×IMPO: β=o.oo8, p=0.849; Label×IMPO: β=0.080, p=0.061; Claim×IMPO: β=0.067,
p=0.115). So Hypothesis 12 was not verified to be true.
25
Table 11 Standardized Regression Coefficients, P-values and Model Summary Information for the CE Influence PI Model and Packaging Elements Influence PH and PI Models
Consequent
Sensory Affective Cognitive Behavioural Social PI PH PI
Antecedent β p β p β p β p β p β p β p β p
Image 0.000 0.998 0.245 0.000 0.128 0.003 0.171 0.000 0.068 0.119 -0.027 0.529 0.066 0.115
Label 0.032 0.467 0.019 0.649 -0.085 0.048 0.051 0.230 0.054 0.216 0.108 0.011 0.050 0.232
Claim 0.071 0.111 -0.002 0.963 0.073 0.095 0.029 0.505 0.017 0.703 0.059 0.170 0.029 0.491
Image×SOP -0.050 0.263 0.002 0.967 -0.036 0.405 -0.081 0.059 0.039 0.367
Label×SOP -0.133 0.003 -0.126 0.003 -0.030 0.486 -0.014 0.745 -0.073 0.094
Claim×SOP 0.009 0.836 0.035 0.423 0.022 0.616 0.006 0.894 -0.002 0.963
Image×IMPO 0.008 0.849
Label×IMPO 0.080 0.061
Claim×IMPO 0.067 0.115
Sensory 0.434 0.000
Affective -0.069 0.073
Cognitive 0.073 0.062
Behavioural 0.135 0.001
Social 0.231 0.000
SOP 0.026 0.555 -0.005 0.904 -0.094 0.031 -0.035 0.420 -0.002 0.961 -0.050 0.244 -0.015 0.718 -0.042 0.204
Importance of orange juice
0.157 0.000 0.053 0.217 0.154 0.000 0.204 0.000 0.218 0.000 0.262 0.000 0.312 0.000 0.113 0.001
Health status 0.033 0.460 -0.022 0.607 -0.012 0.785 0.091 0.035 0.047 0.282 0.002 0.966 -0.050 0.231 -0.036 0.275
Age -0.006 0.886 0.124 0.004 0.030 0.490 -0.047 0.283 -0.035 0.423 -0.054 0.216 -0.132 0.002 -0.034 0.319
Gender -0.027 0.545 -0.029 0.492 -0.038 0.380 0.004 0.930 -0.023 0.592 -0.009 0.831 -0.043 0.304 0.006 0.849
R2=0.049 F(11,495)=2.296 p=0.010
R2=0.095 F(11,504)=4.836 p=0.000
R2=0.068 F(11,504)=3.348 p=0.000
R2=0.087 F(11,504)=4.383 p=0.000
R2=0.063 F(11,504)=3.081 p=0.001
R2=0.097 F(11,504)=4.926 p=0.000
R2= 0.117 F (8,507)= 8.436 p=0.000
R2= 0.463 F (10,496)=42.83 p=0.000
26
4.4 Other results When analysing the results, other potential relations came up. In this part, these results were
displayed.
The influence of dimensions of CE on the purchase intention of healthy juice
The results of the regression of dimensions of CE on the purchase intention of healthy juice were
displayed in Table 11. It was found that the sensory dimension (β= 0.434, p< 0.05), social dimension
(β= 0.231, p< 0.05), and behavioural dimension (β=0.135, p< 0.05) of customer experience had
positive influence on the purchase intention.
The influence of packaging elements on the perceived healthiness
In Table 11, the results of the regression of packaging elements on the perceived healthiness
revealed that the healthy choice label, health claim and the image of healthy people had no influence
on the perceived healthiness of the product.
Not predicted influence of the packaging elements on dimensions of CE
Besides the predicted effects of packaging elements on dimensions of CE, there were some other
effects. In Table 11, the image of healthy people was found to have positive influence on the
cognitive dimension of CE (β= 0.128, p< 0.05) and the behavioural dimension of CE (β= 0.171, p<
0.05). The healthy choice label was found to have negative influence on the cognitive dimension of
CE (β= -0.085, p< 0.05).
The main effects of the psychographic characterictics and demographic information
The importance of orange juice (IMPO) was found to have positive influence on the sensory
dimension of CE (β= 0.157, p< 0.05), on the cognitive dimension of CE (β= 0.154, p< 0.05), on the
behavioural dimension of CE (β= 0.204, p< 0.05), and on the social dimension of CE (β= 0.218, p<
0.05). IMPO was also found to have positive influence on the perceived healthiness of the product
(β= 0.312, p< 0.05) and the purchase intention of orange juice (Packaging elements influencing PI: β=
0.262, p< 0.05; Dimensions of CE influencing PI:β= 0.113, p< 0.05).
SOP was found to have negative influence on the cognitive dimension of CE (β= -0.094, p< 0.05).
Health status was found to have positive effect on the behavioural dimension of CE (β= 0.091, p<
0.05).
Age was found to have positive effect on the affective dimension of CE (β=0.124, p< 0.05) and
negative effect on the perceived healthiness of the product (β= -0.132, p< 0.05).
27
5 Discussion In this chapter, the answers to the following questions were given and explained: ‘How does
customer experience influence purchase intention of healthy juice?’, ‘How do packaging elements
stimulate customer experience?’, ‘How do packaging elements evoke the purchase intention of
healthy juice’, and ‘How do packaging elements stimulate customer experience, which in turn
influence consumers’ purchase intention of healthy?’. Followed by some other findings and several
implications.
5.1 Discussion concerning main results CE influencing purchase intention of healthy juice
Ignoring the effects of individual differences, all five dimensions of customer experience were found
to have significant influence on the purchase intention of healthy juice, which corresponds to the
findings of Stuart-Menteth et al. (2006). However, after controlling for the effects of individual
differences, only three dimensions (sensory dimension, behavioural dimension and social dimension)
of customer experience were found to have positive influence on purchase intention of healthy juice.
The finding that the affective dimension of customer experience did not have influence on the
purcahase intention of healthy juice conflicts with the findings of Nasermoadeli et al. (2013).
Nasermoadeli et al. (2013) investigated how dimensions of customer experience influence purchase
intention, and they found that affective dimension of customer experience had positive influence on
purchase intention (Nasermoadeli et al. 2013). In their research, the affective dimension was
measured using descriptions of specific emotions (e.g. happy, pleased, contended and satisfied). The
measures of affective dimension of customer experience were derived from the research of Brakus
et al. (2009). However, they used the scale to measure perceived affective component in wellknown
brands. Compared to those brands, the same measures might not have fitted that well for the
simulation in our research. The measures may sounds general and vague for the respondents. So
modifying the measures to fit our simulation may give us the expected result that the affective
dimension of customer experience influencing purchase intention of healthy juice.
In the research of Brakus et al. (2009), the cognitive dimension was expected to predict creative
usages of the brand. The higher the cognitive dimension of customer experience was evoked, the
higher brand loyalty of the brand would be (Brakus et al. 2009). However, in this thesis, the
consequence of customer experience is purchase intention of healthy juice. Although modern
consumers are paying more attention to the label information as they are more concerned about
health and nutrition, they prefer more simplified information to form their purchase decisions
(Silayoi and Speece 2004). This indicated that consumers prefer to spend lower cognitive effort at-
the-point-of-sale. So cognitive dimension of customer experience was not found to have significant
influence on purchase intention of healthy juice in our research.
Packaging elements stimulating CE
It was expected that the packaging elements would trigger different dimensions of customer
experience. Hypotheses 1 to 6 stated that the healthy choice label would trigger behavioural and

28
social dimensions of customer experience; the health claim would trigger cognitive and affective
dimensions of customer experience and the image of healthy people would trigger affective and
sensory dimensions of customer experience. However, the only hypothesis that holds is that the
presence of image of healthy people stimulate trigger higher affective dimension of customer
experience than without the image. The reasons are discussed below.
Healthy choice label was expected to remind the respondents of the healthy lifestyle, and thus lead
to higher perceived behavioural dimension of customer experience. However, this was not verified
by the results. The reason of this might be that the presence of this label did not increase the
perceived healthiness of the product, thus did not remind the respondents of the healthy lifestyle.
Healthy choice label was also expected to evoke social dimension of customer experience, as the
concumption of orange juice with healthy choice label was expected to be a mean to be positively
perceived by the respondents’ social group and to confirm the respondents’ social identity. However,
according to Gentile (2007), the social dimension of customer experience is not salient for products
with low customer involvement and customer commitment (Gentile et al. 2007). Customer
commitment is the effort the customer makes to use the product, especially in terms of resources.
Customer involvement is the level of importance an object means to the customer (Gentile et al.
2007). Fast moving consumer goods, such as orange juice and potato chips are products with low
customer involvement and commitment. So it makes sense that the presence of healthy choice label
was not found to increase the perceived social dimension of customer expereince. Thus this
hypothesis was wrong.
Health claim was expected to trigger higher cognitive dimension of customer experience, as
processing the verbal information would increase the respondents’ cognitive effort. However, this
was not verified. According to Silayoi and Speece (2004), compared to informational packaging
elements, visual package elements play a major role in consumers’ information-procesing and
decision-making process (Silayoi and Speece 2004). The respondents possibly did not carefully
examine the verbal information provided by the health claim. So the presence of health claim did not
increase the respondents’ cognitive effort, thus no higher cognitive dimension of customer
expeirence was triggered.
Health claim was also expected to trigger higher affective dimension of customer experience, as a
gain-framed promotion would stimulate more positive emotional reaction of people than a loss-
framed prevention claim (Lee and Aaker 2004). This hypothesis was not verified. In this experiment,
there were two levels of the variable health claim: absence or presence of the health claim. It is
possible that the perceived affective dimension of customer experience did not differ that much
between these two levels. According to Lee and Aaker (2004), the perceived affective dimension of
customer experience differs between a gain-framed promotion claim and a loss-framed prevention
claim. However, a loss-framed prevention claim such as a reduction of disease risk claim was not
allowed to be used as health claim, so the comparison between these two kinds of claims has no
practical meaning.
Image of healthy people had positive influence on the affective dimension of customer experience
just as expected, as it reminds the respondents of positive emotions such as joy and happiness.
29
The presence of image of healthy people was also expected to trigger higher sensory dimension of
customer experience. This was not verified. It is possible that the package background was already
sensory appealing to the respondents. The presence of the chosen healthy people image was not
more sensory appealing to them.
In addition, one major reason for all the hypotheses which were not significant was the nature of the
between-group design. Each individual may differ in several aspects, for example, the different
starting point and scoring pattern would lead to this result.
Packaging elements evoking PI
The three packaging elements were expected to evoke purchase intention of healthy juice, as they
provide information that relevant to healthy (juice). However, only healthy choice label was found to
have positve influence on purchase intention of healthy juice.
The main reason of why the other two hypotheses did not hold might be out of the nature of the
between-group experimental design. At first the author planned to execute a within-subject design.
Instead, a between-group experiment was deisgned to avoid the fatigue and impatience of the
respondents in anwering the questionnaire. However, each respondent differed in several aspects,
such as the measured pscyhographic characteristics (importance of orange juice, style of processing
and health status) and demographic information (gender and age), different pattern in scoring,
preference of colour and image and so on. All these factors may affect our investigation of analysing
how packaging elements influencing purchase intention.
Adding a ranking task in the end of the experiment may resolve this problem. After the respondents
answered the questions concerning that product shown to them, they would be invited to rank eight
packagings in terms of purchase intention of healthy juice. Then the results of this task would be
used to conduct a conjoint analysis using SPSS (IBM 2011), so we would know the relative
importance of these three elements in deciding the purchase intention. However, respondents could
potentially notice the aim of this task, and give the ‘right’ answer, thus leading to fake conclusions.
CE as a mediator in packaging elements influencing PI
The healthy choice label was found to have positive influence on the purchase intention of healthy
juice. The label was found to have negative influence on the cognitive dimension of customer
experience, but there was no evidence that the cognitive dimension of customer experience has
influence on the purchase intention of healthy juice. Thus CE was not verified to be the mediator in
the influence of label on purchase intention of healthy juice, and also not in the influence of other
two packaging elements on purchase intention of healthy juice.
It is possible that the customer experience is not the mediator between packaging elements and the
purchase intention of healthy juice, so the hypothesis 10 concerning the mediation function of
customer experience is wrong.
Interaction effects
It was expected that people with visual-oriented processing style would perceive higher customer
experience when they see the image of healthy people (visual packaging element). Subsequently,
30
people with verbal-oriented processing style would perceive higher customer experience then they
see the healthy choice logo and the health claim (informational packaging elements). However, there
was no finding for the interaction effect of visual-oriented processing style and image. The results
show that the respondents with visual-oriented processing style perceived higher sensory dimension
of customer experience than respondents with verbal-oriented processing style when the label was
on the package. The same can be concluded for the perceived affective dimension of customer
experience, which is contrary to the hypotheses.
The healthy choice label was not found to have influence on the purchase intention of healthy juice.
So the interaction effect of the label and visual-oriented processing style did not exist accordingly.
The reason for this contradictory finding might be that the healthy choice logo was perceived by the
respondents as an visual element on the package, not as other FOP labels which might be perceived
as informational element. So the respondents with visual-oriented processing style were triggered
higher sensory and affective dimension of customer when there was a healthy choice label on the
package.
It was also expected that people with higher importance of orange juice would perceive higher
purchase intention. The results indicated that the level of importance of orange juice did not
moderate how packaging elements influence the respondents’ purchase intention of healthy juice.
However, the importance of orange juice was found to have a main effect on the purchase intention
of healthy juice, which means consumers who consider the orange juice as more important are more
likely to buy the healthy orange juice, no matter what kind of packaging the product has.
5.2 Discussion concerning unexpected effects Besides the predicted effects of packaging elements on dimensions of customer experience, some
unexpected effects were found. The image of healthy people was found to have positive influence on
the cognitive dimension and behavioural dimension of customer experience. The healthy choice label
was found to have negative influence on the cognitive dimension of customer experience.
The image of healthy people was found to have positive influence on the cognitive dimension of
customer experience might be that the image activated the respondents’ memory and activated
their thinking and association of the value and lifestyle represented by this image. This process
increased their cognitive effort, thus the image of healthy people evokes higher cognitive dimension
of customer experience.
The image of healthy people was also found to have positive influence on the behavioural dimension
of customer experience. This makes sense as this image represented the healthy lifestyle, which
affirmed their value and beliefs about living healthy (Gentile et al. 2007). Consequently, the
respondents who have seen this image perceived higher behavioural dimension of customer
experience.
The reason for the healthy choice label triggering lower cognitive dimension of customer experience
might be that the healthy choice label is the simplest form of FOP label, which provides the
consumers with an evaluative interpretation of the products’ healthiness (Feunekes et al. 2008). Thus
the presence of this label decreased the respondents’ cognitive effort to interpret it. As a result, the
31
respondents perceived lower cognitive dimension of customer when there was a healthy choice logo
on the package.
5.3 Implication In this part, several theoretical implications and managerial implications were forwarded base on the
interpretation of the results above.
Theoretical implication Two of the three packaging elements (image of healthy people and health
claim) were not found to have positive influence on the purchase intention of healthy juice as
expected. The effects of individual differences resulted from the between-group experimental design
may accounts for this failure. The cognitive dimension of customer experience was not found to have
positive influence on the purchase intention of healthy juice. This is because the cognitive dimension
of customer experience was not necessary for having purchase intention for products with low
customer commitment and involvment, such as orange juice.
Managerial implication There are several tips that might be helpful to make healthy choice easier
for consumers. The healthy choice logo was found to have positive influence on the purchase
intention of healthy juice. Thus the healthy choice logo should be widely used on the package of
healthy food and drink products by the manufactuers. Besides, the importance of orange juice was
found to have positive influence on the purchase intention of healthy juice, no matter what types of
packaging elements there are. Organizations that are dedicated to increase the healthy consumption
of the consumers should pay attention to educate the consumers to value the importance of
healthy consumption. The more people value healthy consumption, the easier it is for them to make
healthy food ( and drinks) choices.
6 Further recommendation
It is encouraged to develop specific scales measuring customer experience for products. Existing
measures for dimensions of customer experience were mostly used for measuring perceived
experience with brands (Brakus et al. 2009), or perceived experience of service (e.g. employee
service and servicescape) in the circumstances of retailing (Stuart-Menteth et al. 2006). The scales of
customer experience used in this experiment were partially derived from the research of Brakus et al.
(2009) and partially developed based on the concepts of the dimensions of customer experience in
the research of Gentile et al. (2007). So some of the measures did not fit in the circumstance of
specific products. For example, the scale of affective dimension of customer experience would be
more suitable if it was framed more clear and specific. To include, it is engouranged to develop more
specific scales used to measure customer experience for products.
32
7 Conclusion
In the circumstances of hyper choice in the market, providing positive customer experience was seen
as a way to help people to make healthy choices easier. Packaging elements of the products were
found to have positive influence on the customer experience and the purchase intention. Accordingly,
the aim of this thesis has been to investigate whether and how customer experience acts as mediator
between packaging and consumers’ purchase intention of healthy juice. Thus a between-group
experiment has been carried out in the form of an online questionnaire.
The results of the experiment verified that the healthy choice label had positive influence on the
purchase intention of healthy juice. Moreover, two packaging elements were found to have influence
on customer experience: presence of a healthy choice label had negative influence on the cognitive
dimension of customer experience and presenting an image of healthy people was found to have
positive influence on affective dimension, cognitive dimension and behavioural dimension of
customer experience. However, only sensory dimension, social dimension and behavioural
dimension of customer experience were found to have positive influence on the purchase intention
of healthy juice. A mediation analysis examined that customer experience was not the mediator
between packaging elements and consumers’ purchase intention of healthy juice. In addition, the
level of importance of orange juice was found to have positive influence on purchase intention of
healthy juice.
One major limitation in this research came from the between-group experimental design. It proved
difficult to control for all the effects of individual differences in the data analysis. It was also expected
to have better results if there were more specific scales of customer experience dimensions for
products.
Although not all the hypotheses were verified, the results we achived can still serve our aim to make
healthy choices easier for people. The manufactuers should use the healthy choice logo on the
package as this label directly increase consumers’ purchase intention of healthy juice. Organizations
dedicated to increasing healthy consumption of the consumers should invest more in educating
consumers about the importance of healthy consumption. As healthy consumption gains in
importance for consumers, they will be more likely to make healthier choices.
33
Reference
AIJN (2012), "AIJN 2012 Liquid Fruit Market Report," (accessed 17, November, 2013), [available at http://www.aijn.org/pages/main/file.handler?f=AIJNMarketReport2012.pdf].
Ampuero, Olga and Natalia Vila (2006), "Consumer perceptions of product packaging," Journal of Consumer Marketing, 23 (2), 100-12.
Baig M., Iqbal S., Naheed N., Noreen S., and Irshad A. (2013), "Impact of Packaging on Brand Experience (A study on Food industry in Mianwali Pakistan)," International Journal of Business and Management Invention, 2 (8), 26-30.
Baron, Reuben M. and David A. Kenny (1986), "The moderator–mediator variable distinction in social psychological research: Conceptual, strategic, and statistical considerations," Journal of Personality and Social Psychology, 51 (6), 1173-82.
Biedenbach, Galina and Agneta Marell (2010), "The impact of customer experience on brand equity in a business-to-business services setting," Journal of Brand Management, 17 (6).
Bitner, Mary Jo (1992), "Servicescapes: The Impact of Physical Surroundings on Customers and Employees," Journal of Marketing, 56 (2), 57-71.
Bloch, Peter H. (1995), "Seeking the Ideal Form: Product Design and Consumer Response," Journal of Marketing, 59 (3), 16-29.
Bone, PaulaFitzgerald and KarenRusso France (2001), "Package Graphics and Consumer Product Beliefs," Journal of Business and Psychology, 15 (3), 467-89.
Brakus, J. Joško, Bernd H. Schmitt, and Lia Zarantonello (2009), "Brand Experience: What Is It? How Is It Measured? Does It Affect Loyalty?," Journal of Marketing, 73 (3), 52-68.
Butkeviciene, V., J. Stravinskiene, and A. Rutelione (2008), "Impact of consumer package communication on consumer decision making process," Inzinerine Ekonomika-Engineering Economics, 1, 57-65.
Childers, Terry L., Michael J. Houston, and Susan E. Heckler (1985), "Measurement of Individual Differences in Visual versus Verbal Information Processing," Journal of Consumer Research, 12 (2), 125-34.
EU-Lex (2012), "Commission regulation (EU) No 432/2012 of 16 May 2012 establishing a list of permitted health claims made on foods, other than those referring to the reduction of disease risk and to children's development and health," in Official Journal of the European Union.
---- (2011), "Permitted EU Claims Article 14 (1) a: Disease Risk Reduction."
---- (2007), "Regulation (EC) no. 1924/2006 of 20 December 2006 on nutrition and health claims made on foods."
EuropeanCommission (2001), "EURODIET Reports and Proceedings," Public Health Nutrition, 4 (2).
Feunekes, G. I., I. A. Gortemaker, A. A. Willems, R. Lion, and M. van den Kommer (2008), "Front-of-pack nutrition labelling: testing effectiveness of different nutrition labelling formats front-of-pack in four European countries," Appetite, 50 (1), 57-70.
34
FLABEL (2012), "the FLABEL Final Leaflet with the Main Project Results," (accessed 27 March, 2014), [available at http://flabel.org/en/upload/EUFIC_FLABEL_ResultsFlyer.pdf].
Gentile, Chiara, Nicola Spiller, and Giuliano Noci (2007), "How to Sustain the Customer Experience:: An Overview of Experience Components that Co-create Value With the Customer," European Management Journal, 25 (5), 395-410.
Hawkes, C. (2010), "Food packaging: the medium is the message," Public Health Nutr, 13 (2), 297-9.
Hayes, Andrew F. (2013), Introduction to Mediation, Moderation, and Conditional Process Analysis: A Regression-Based Approach. New York: The Guilford Press.
Hodgkins, C., M. Raats, J. Barnett, G. Wasowicz-Kirylo, M. Stysko-Kunkowska, Y. Gulcan, Y. Kustepeli, S. Akgungor, B. Brebion, G. Chryssochoidis, Fernandez L., and Sortcksdieck S. (2009), "Derivation of a typology for nutritional labelling," in Report prepared for the EC. Brussels: EUFIC.
Holbrook, Morris B. (2006), "Consumption experience, customer value, and subjective personal introspection: An illustrative photographic essay," Journal of Business Research, 59 (6), 714-25.
Holbrook, Morris B. and Elizabeth C. Hirschman (1982), "The Experiential Aspects of Consumption: Consumer Fantasies, Feelings, and Fun," Journal of Consumer Research, 9 (2), 132-40.
Hollywood, Lynsey, Laura Wells, Gillian Armstrong, and Heather Farley (2013), "Thinking outside the carton: attitudes towards milk packaging," British Food Journal, 115 (6), 899-912.
Hui, Michael K. and John E. G. Bateson (1991), "Perceived Control and the Effects of Crowding and Consumer Choice on the Service Experience," Journal of Consumer Research, 18 (2), 174-84.
IBM (2011), "IBM SPSS Statistics for Windows." 20.0 ed. Armonk, NY: IBM Corp.
Judd, Charles M. and David A. Kenny (1981), "Process analysis: Estimating mediation in treatment evaluations," Evaluation Review, 5 (5), 602-19.
Kuvykaite, R., A. Dovaliene, and L. Navickiene (2009), "Impact of package elements on consumer's purchase decision," Economics & Management, 18 (2), 441-47.
Leathwood, P. D., D. P. Richardson, P. Strater, P. M. Todd, and H. C. van Trijp (2007), "Consumer understanding of nutrition and health claims: sources of evidence," Br J Nutr, 98 (3), 474-84.
Lee, Angela Y. and Jennifer L. Aaker (2004), "Bringing the Frame Into Focus: The Influence of Regulatory Fit on Processing Fluency and Persuasion," Journal of Personality and Social Psychology, 86 (2), 205-18.
MacKinnon, David P., Amanda J. Fairchild, and Matthew S. Fritz (2007), "Mediation Analysis," Annual Review of Psychology, 58 (1), 593-614.
Mascarenhas, Oswald A., Ram Kesavan, and Michael Bernacchi (2006), "Lasting customer loyalty: a total customer experience approach," Journal of Consumer Marketing, 23 (7).
Murphy, M., C. Cowan, M. Henchion, and S. O’Reilly (2000), "Irish consumer preferences for honey: a conjoint approach," British Food Journal, 102 (8), 585-98.
Nasermoadeli, Amir, Kwek Choon Ling, and Farshad Maghnati (2013), "Evaluating the Impacts of Customer Experience on Purchase Intention," International Journal of Business and Management 8(6).

35
Neher, Felix, Florian Schleicher, and Christine Vogt (2012), "Reinforcement Values of Customer Experience."
Pine, J.B.II and J.H. Gilmore (1998), "Welcome to the Experience Economy," Harvard Business Review, 76 (4).
Schmitt, Bernd (1999), "Experiential Marketing," Journal of Marketing Management, 15 (1-3), 53-67.
Scott, V. and A. F. Worsley (1994), "TICKS, CLAIMS, TABLES AND FOOD GROUPS - A COMPARISON FOR NUTRITION LABELING," Health Promotion International, 9 (1), 27-37.
Sheth, Jagdish N., Bruce I. Newman, and Barbara L. Gross (1991), "Why we buy what we buy: A theory of consumption values," Journal of Business Research, 22 (2), 159-70.
Silayoi, Pinya and Mark Speece (2007), "The importance of packaging attributes: a conjoint analysis approach," European Journal of Marketing, 41 (11/12), 1495-517.
---- (2004), "Packaging and purchase decisions: An exploratory study on the impact of involvement level and time pressure," British Food Journal, 106 (8), 607-28.
Skard, Siv, Herbjorn Nysveen, and Per Egil Pedersen (2011), "Brand and Customer Experience in Service Organizations: Literature Review and Brand Experience Construct Validation," in SNF Working Paper No.09/11. Bergen: Institute for Research in Economics and Business Administration.
Smith, J. B. and M. Colgate (2007), "Customer value creation: A practical framework," Journal of Marketing Theory and Practice, 15 (1), 7-23.
Stuart-Menteth, H., H. Wilson, and S. Baker (2006), "Escaping the channel silo - Researching the new consumer," International Journal of Market Research, 48 (4), 415-37.
Underwood, Robert L., Noreen M. Klein, and Raymond R. Burke (2001), "Packaging communication: attentional effects of product imagery," Journal of Product & Brand Management, 10 (7), 403-22.
USDA (2010), "The Dietary Guidelines for Americans 2010," (accessed 17 Nov, 2013), [available at http://www.cnpp.usda.gov/DGAs2010-PolicyDocument.htm].
van Herpen, E. and H. C. Trijp (2011), "Front-of-pack nutrition labels. Their effect on attention and choices when consumers have varying goals and time constraints," Appetite, 57 (1), 148-60.
van Kleef, E., H. C. van Trijp, and P. Luning (2005), "Functional foods: health claim-food product compatibility and the impact of health claim framing on consumer evaluation," Appetite, 44 (3), 299-308.
van Trijp, H. C. and I. A. van der Lans (2007), "Consumer perceptions of nutrition and health claims," Appetite, 48 (3), 305-24.
Verbeke, W., J. Scholderer, and L. Lahteenmaki (2009), "Consumer appeal of nutrition and health claims in three existing product concepts," Appetite, 52 (3), 684-92.
Verhoef, Peter C., Katherine N. Lemon, A. Parasuraman, Anne Roggeveen, Michael Tsiros, and Leonard A. Schlesinger (2009), "Customer Experience Creation: Determinants, Dynamics and Management Strategies," Journal of Retailing, 85 (1), 31-41.
Vilnai-Yavetz, Iris and Ran Koren (2013), "Cutting through the clutter: purchase intentions as a function of packaging instrumentality, aesthetics, and symbolism," The International Review of Retail, Distribution and Consumer Research, 23 (4), 394-417.

36
Williams, Peter (2005), "Consumer Understanding and Use of Health Claims for Foods," Nutrition Reviews, 63 (7), 256-64.
Wills, J. M., S. Storcksdieck genannt Bonsmann, M. Kolka, and K. G. Grunert (2012), "European consumers and health claims: attitudes, understanding and purchasing behaviour," Proc Nutr Soc, 71 (2), 229-36.
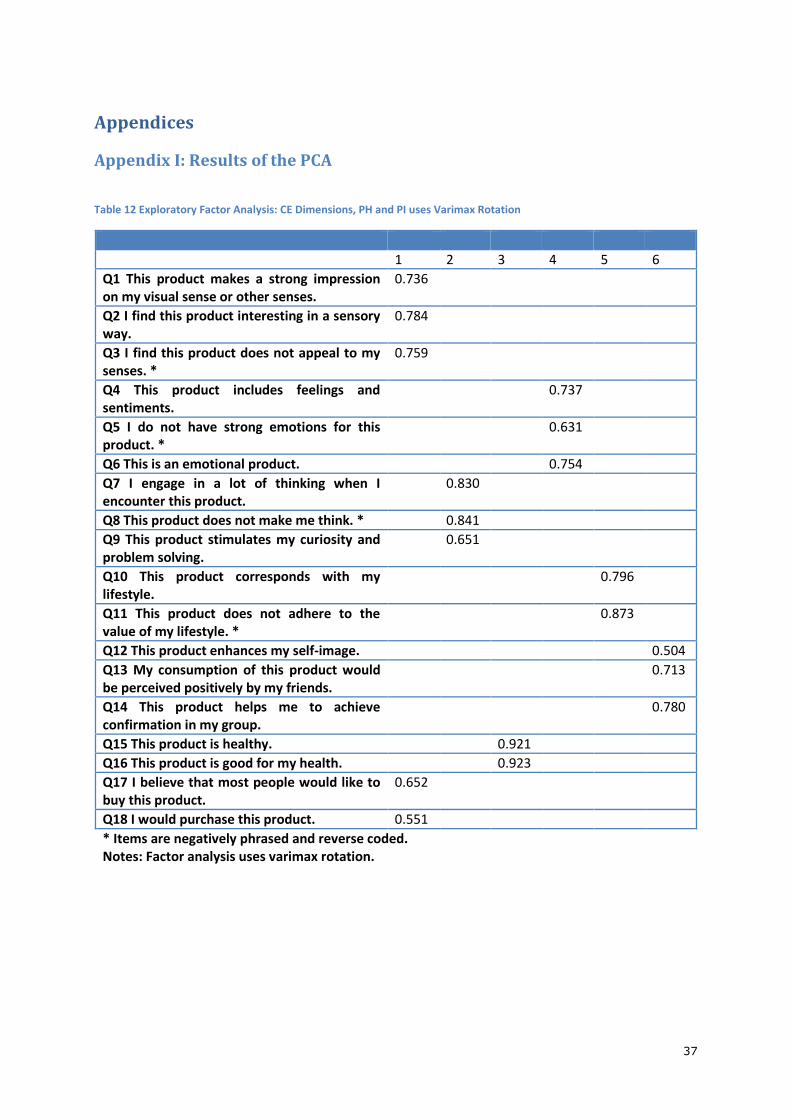
37
Appendices
Appendix I: Results of the PCA
Table 12 Exploratory Factor Analysis: CE Dimensions, PH and PI uses Varimax Rotation
1 2 3 4 5 6
Q1 This product makes a strong impression on my visual sense or other senses.
0.736
Q2 I find this product interesting in a sensory way.
0.784
Q3 I find this product does not appeal to my senses. *
0.759
Q4 This product includes feelings and sentiments.
0.737
Q5 I do not have strong emotions for this product. *
0.631
Q6 This is an emotional product. 0.754
Q7 I engage in a lot of thinking when I encounter this product.
0.830
Q8 This product does not make me think. * 0.841
Q9 This product stimulates my curiosity and problem solving.
0.651
Q10 This product corresponds with my lifestyle.
0.796
Q11 This product does not adhere to the value of my lifestyle. *
0.873
Q12 This product enhances my self-image. 0.504
Q13 My consumption of this product would be perceived positively by my friends.
0.713
Q14 This product helps me to achieve confirmation in my group.
0.780
Q15 This product is healthy. 0.921
Q16 This product is good for my health. 0.923
Q17 I believe that most people would like to buy this product.
0.652
Q18 I would purchase this product. 0.551
* Items are negatively phrased and reverse coded. Notes: Factor analysis uses varimax rotation.
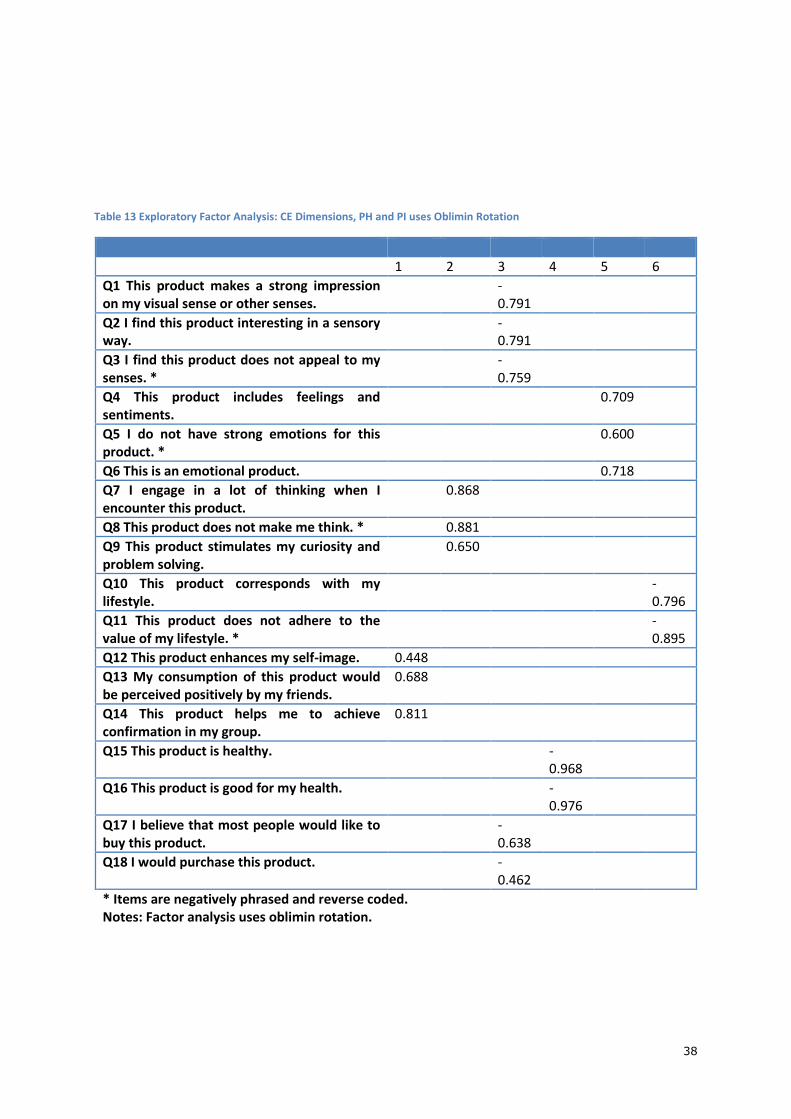
38
Table 13 Exploratory Factor Analysis: CE Dimensions, PH and PI uses Oblimin Rotation
1 2 3 4 5 6
Q1 This product makes a strong impression on my visual sense or other senses.
-0.791
Q2 I find this product interesting in a sensory way.
-0.791
Q3 I find this product does not appeal to my senses. *
-0.759
Q4 This product includes feelings and sentiments.
0.709
Q5 I do not have strong emotions for this product. *
0.600
Q6 This is an emotional product. 0.718
Q7 I engage in a lot of thinking when I encounter this product.
0.868
Q8 This product does not make me think. * 0.881
Q9 This product stimulates my curiosity and problem solving.
0.650
Q10 This product corresponds with my lifestyle.
-0.796
Q11 This product does not adhere to the value of my lifestyle. *
-0.895
Q12 This product enhances my self-image. 0.448
Q13 My consumption of this product would be perceived positively by my friends.
0.688
Q14 This product helps me to achieve confirmation in my group.
0.811
Q15 This product is healthy. -0.968
Q16 This product is good for my health. -0.976
Q17 I believe that most people would like to buy this product.
-0.638
Q18 I would purchase this product. -0.462
* Items are negatively phrased and reverse coded. Notes: Factor analysis uses oblimin rotation.

39
Table 14 Exploratory Factor Analysis: Psychographic Characteristics uses Varimax Rotation
1 2 3 4
Q19 I enjoy doing work that requires the use of words. * 0.794
Q20 I enjoy learning new words. * 0.746
Q21 I find it helps to think in terms of mental pictures when doing many things.
0.822
Q22 When I have forgotten something I frequently try to form a mental ‘picture’ to remember it.
0.792
Q23 I prefer activities that don't require a lot of reading. 0.656
Q24 My thinking often consists of mental ‘pictures’ or images.
0.859
Q25 How often do you drink orange juice? 0.906
Q26 How important orange juice is for you? 0.921
Q27 How important healthy consumption is for you? 0.556
Q28 How would you best describe your overall health? 0.860
Q29 How often do you get sick? * 0.698
* Items are negatively phrased and reverse coded. Notes: Factor analysis uses varimax rotation.
Table 15 Exploratory Factor Analysis: Psychographic Characteristics uses Oblimin Rotation
1 2 3 4
Q19 I enjoy doing work that requires the use of words. * 0.800
Q20 I enjoy learning new words. * 0.743
Q21 I find it helps to think in terms of mental pictures when doing many things.
0.826
Q22 When I have forgotten something I frequently try to form a mental ‘picture’ to remember it.
0.793
Q23 I prefer activities that don't require a lot of reading. 0.665
Q24 My thinking often consists of mental ‘pictures’ or images.
0.858
Q25 How often do you drink orange juice? -0.917
Q26 How important orange juice is for you? -0.926
Q27 How important healthy consumption is for you? 0.542
Q28 How would you best describe your overall health? 0.860
Q29 How often do you get sick? * 0.708
* Items are negatively phrased and reverse coded. Notes: Factor analysis uses oblimin rotation.

40
Appendix II: Model Summary of Mediation Analysis
Table 16 Model Summary of Mediation Analysis with Image as Independent Variable, Controlling for Covariates
Consequent
M1 (Sensory) M2 (Affective) M3 (Cognitive)
Antecedent Coeff. SE p Coeff. SE p Coeff. SE p
X (Image) 0.0184 0.1185 0.8768 0.7141 0.1224 0.0000 0.3408 0.1125 0.0026
M1 (Sensory)
M2 (Affective)
M3 (Cognitive)
M4
(Behavioural)
M5 (Social)
C1 (Age) -0.0036 0.0161 0.8239 0.0443 0.0166 0.0081 0.0067 0.0153 0.6601
C2 (Gender) -0.0334 0.1232 0.7863 -0.0689 0.1272 0.5886 -0.1172 0.1170 0.3168
C3 (SOP) 0.0428 0.1038 0.6807 0.0045 0.1073 0.9666 -0.2020 0.0986 0.0410
C4 (IMPO) 0.1621 0.0534 0.0025 0.0576 0.0551 0.2964 0.1629 0.0507 0.0014
C5 (HS) 0.0077 0.0753 0.9183 -0.1134 0.0778 0.1456 -0.0126 0.0715 0.8607
Constant 3.4115 0.5880 0.0000
1.9883 0.6073 0.0011 2.5936 0.5583 0.0000
R2 = 0.0194
F (6,479)= 1.5832 p=0.1500
R2 = 0.0862
F (6,479)= 7.5276 p=0.0000
R2 = 0.0507
F (6,479)= 4.2617 P=0.0003

41
Table 17 Model Summary of Mediation Analysis with Image as Independent Variable, Controlling for Covariates (cont.)
Consequent
M4 (Behavioural) M5 (Social) Y (PI)
Antecedent Coeff. SE p Coeff. SE p Coeff. SE p
X (Image) 0.5116 0.1237 0.0000 0.1422 0.0900 0.1121 -0.1149 0.0917 0.2105
M1 (Sensory) - - - 0.4391 0.0384 0.0000
M2 (Affective) - - - -0.0579 0.0370 0.1177
M3 (Cognitive) - - - 0.0589 0.0409 0.1511
M4 (Behavioural) - - - 0.1261 0.0369 0.0007
M5 (Social) - - - 0.3119 0.0517 0.0000
C1 (Age) -0.0217 0.0168 0.1986 -0.0109 0.0122 0.3740 -0.0196 0.0119 0.0999
C2 (Gender) 0.0102 0.1286 0.9366 -0.0075 0.0936 0.9360 0.0061 0.0901 0.9458
C3 (SOP) -0.1258 0.1084 0.2462 -0.0112 0.0789 0.8874 -0.0855 0.0765 0.2645
C4 (IMPO) 0.2455 0.0557 0.0000 0.1836 0.0406 0.0000 0.1193 0.0403 0.0032
C5 (HS) 0.1670 0.0786 0.0342 0.0456 0.0573 0.4267 -0.0777 0.0555 0.1622
Constant 2.7888 0.6137 0.0000
2.6282 0.4468 0.0000 1.1901 0.4543 0.0091
R2 = 0.0808
F (6,479)= 7.0217 P=0.0000
R2 = 0.0467
F (6,479)= 3.9149 P=0.0008
R2 = 0.4720
F (11,474)= 38.5160 P=0.0000
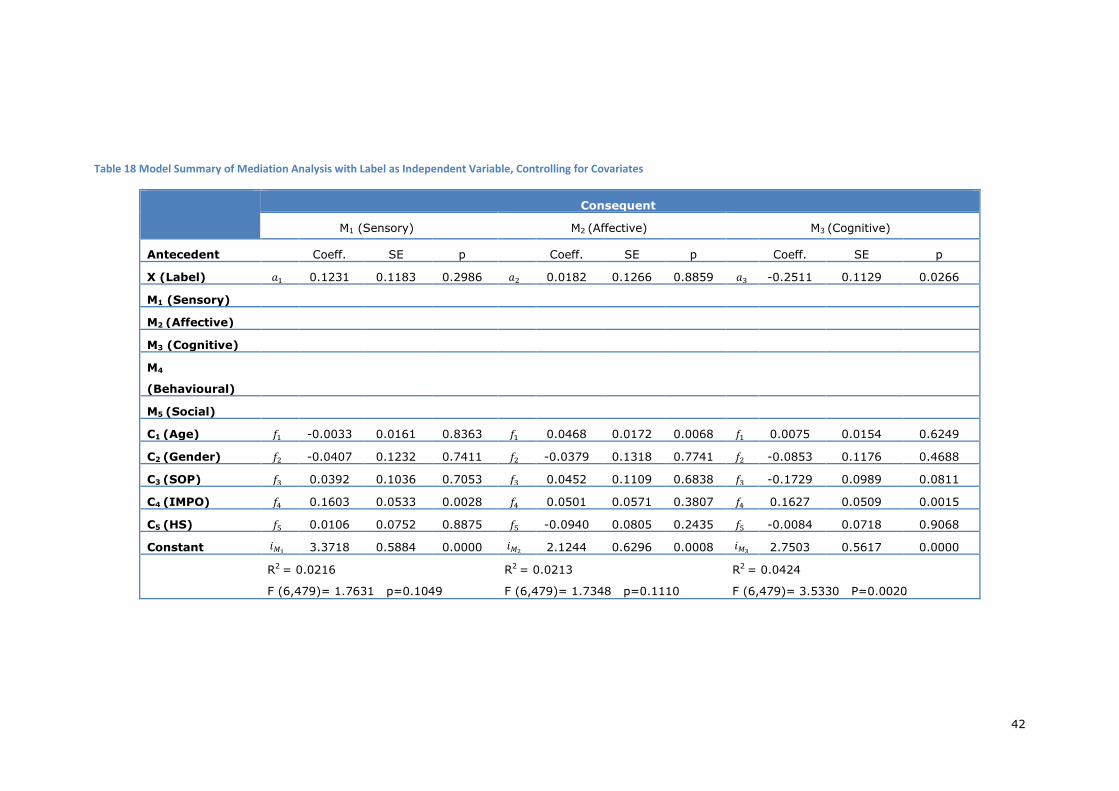
42
Table 18 Model Summary of Mediation Analysis with Label as Independent Variable, Controlling for Covariates
Consequent
M1 (Sensory) M2 (Affective) M3 (Cognitive)
Antecedent Coeff. SE p Coeff. SE p Coeff. SE p
X (Label) 0.1231 0.1183 0.2986 0.0182 0.1266 0.8859 -0.2511 0.1129 0.0266
M1 (Sensory)
M2 (Affective)
M3 (Cognitive)
M4
(Behavioural)
M5 (Social)
C1 (Age) -0.0033 0.0161 0.8363 0.0468 0.0172 0.0068 0.0075 0.0154 0.6249
C2 (Gender) -0.0407 0.1232 0.7411 -0.0379 0.1318 0.7741 -0.0853 0.1176 0.4688
C3 (SOP) 0.0392 0.1036 0.7053 0.0452 0.1109 0.6838 -0.1729 0.0989 0.0811
C4 (IMPO) 0.1603 0.0533 0.0028 0.0501 0.0571 0.3807 0.1627 0.0509 0.0015
C5 (HS) 0.0106 0.0752 0.8875 -0.0940 0.0805 0.2435 -0.0084 0.0718 0.9068
Constant 3.3718 0.5884 0.0000
2.1244 0.6296 0.0008 2.7503 0.5617 0.0000
R2 = 0.0216
F (6,479)= 1.7631 p=0.1049
R2 = 0.0213
F (6,479)= 1.7348 p=0.1110
R2 = 0.0424
F (6,479)= 3.5330 P=0.0020

43
Table 19 Model Summary of Mediation Analysis with Label as Independent Variable, Controlling for Covariates (cont.)
Consequent
M4 (Behavioural) M5 (Social) Y (PI)
Antecedent Coeff. SE p Coeff. SE p Coeff. SE p
X (Label) 0.1042 0.1257 0.4074 0.1012 0.0901 0.2619 0.1780 0.0874 0.0422
M1 (Sensory) 0.4408 0.0381 0.0000
M2 (Affective) -0.0716 0.0358 0.0461
M3 (Cognitive) 0.0691 0.0412 0.0944
M4 (Behavioural) 0.1162 0.0362 0.0014
M5 (Social) 0.3098 0.0515 0.0000
C1 (Age) -0.0197 0.0171 0.2497 -0.0102 0.0123 0.4041 -0.0194 0.0119 0.1030
C2 (Gender) 0.0264 0.1309 0.8401 -0.0077 0.0938 0.9343 -0.0099 0.0899 0.9125
C3 (SOP) -0.1001 0.1101 0.3635 -0.0067 0.0789 0.9326 -0.0974 0.0761 0.2013
C4 (IMPO) 0.2389 0.0567 0.0000 0.1809 0.0406 0.0000 0.1197 0.0401 0.0030
C5 (HS) 0.1827 0.0799 0.0227 0.0514 0.0573 0.3705 -0.0766 0.0553 0.1669
Constant 2.8541 0.6252 0.0000
2.6210 0.4482 0.0000 1.1345 0.4538 0.0128
R2 = 0.0494
F (6,479)= 4.1468 P=0.0004
R2 = 0.0442
F (6,479)= 3.6937 P=0.0013
R2 = 0.4748
F (11,474)= 38.9585 P=0.0000

44
Table 20 Model Summary of Mediation Analysis with Claim as Independent Variable, Controlling for Covariates
Consequent
M1 (Sensory) M2 (Affective) M3 (Cognitive)
Antecedent Coeff. SE p Coeff. SE p Coeff. SE p
X (Claim) 0.1786 0.1186 0.1330 -0.0311 0.1271 0.8069 0.1887 0.1137 0.0976
M1 (Sensory)
M2 (Affective)
M3 (Cognitive)
M4
(Behavioural)
M5 (Social)
C1 (Age) -0.0007 0.0162 0.9664 0.0463 0.0173 0.0079 0.0109 0.0155 0.4815
C2 (Gender) -0.0274 0.1228 0.8238 -0.0376 0.1316 0.7754 -0.0963 0.1177 0.4135
C3 (SOP) 0.0439 0.1034 0.6709 0.0458 0.1107 0.6792 -0.1822 0.0990 0.0664
C4 (IMPO) 0.1608 0.0533 0.0027 0.0505 0.0570 0.3765 0.1583 0.0510 0.0020
C5 (HS) 0.0154 0.0753 0.8375 -0.0956 0.0806 0.2362 0.0042 0.0721 0.9540
Constant 3.2304 0.5989 0.0000
2.1630 0.6416 0.0008 2.4664 0.5737 0.0000
R2 = 0.0240
F (6,479)= 1.9641 p=0.0692
R2 = 0.0213
F (6,479)= 1.7415 p=0.1096
R2 = 0.0380
F (6,479)= 3.1560 P=0.0048
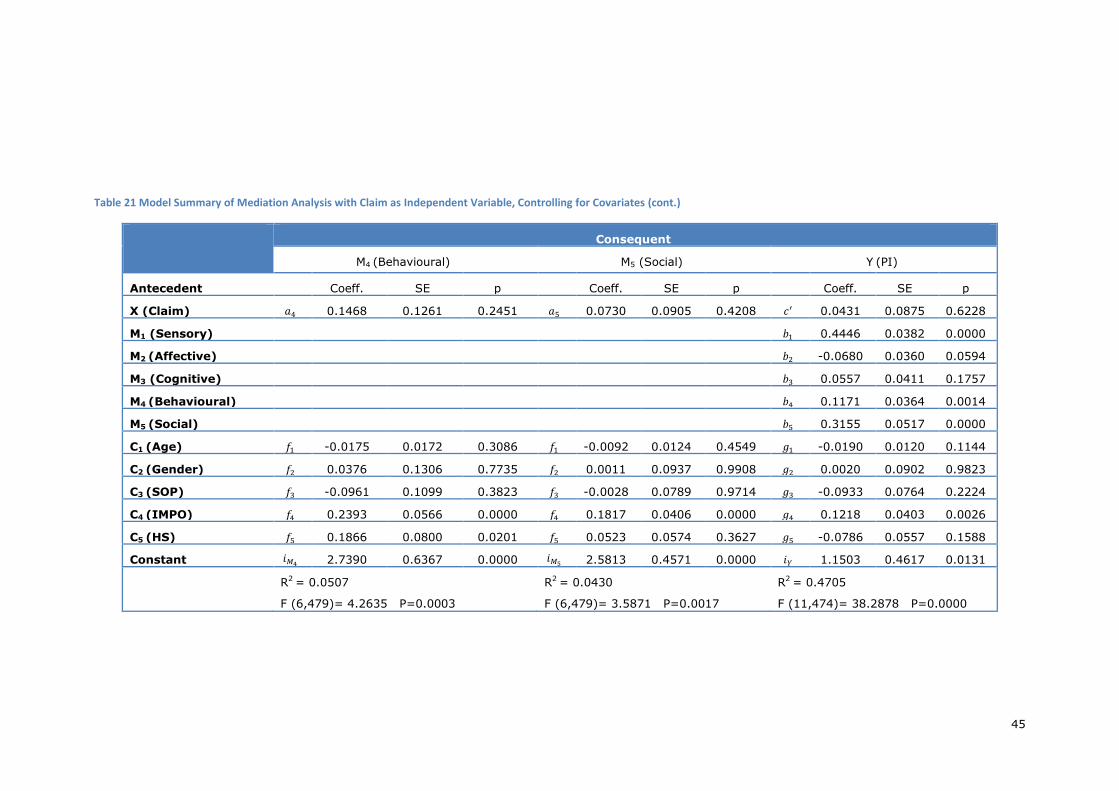
45
Table 21 Model Summary of Mediation Analysis with Claim as Independent Variable, Controlling for Covariates (cont.)
Consequent
M4 (Behavioural) M5 (Social) Y (PI)
Antecedent Coeff. SE p Coeff. SE p Coeff. SE p
X (Claim) 0.1468 0.1261 0.2451 0.0730 0.0905 0.4208 0.0431 0.0875 0.6228
M1 (Sensory) 0.4446 0.0382 0.0000
M2 (Affective) -0.0680 0.0360 0.0594
M3 (Cognitive) 0.0557 0.0411 0.1757
M4 (Behavioural) 0.1171 0.0364 0.0014
M5 (Social) 0.3155 0.0517 0.0000
C1 (Age) -0.0175 0.0172 0.3086 -0.0092 0.0124 0.4549 -0.0190 0.0120 0.1144
C2 (Gender) 0.0376 0.1306 0.7735 0.0011 0.0937 0.9908 0.0020 0.0902 0.9823
C3 (SOP) -0.0961 0.1099 0.3823 -0.0028 0.0789 0.9714 -0.0933 0.0764 0.2224
C4 (IMPO) 0.2393 0.0566 0.0000 0.1817 0.0406 0.0000 0.1218 0.0403 0.0026
C5 (HS) 0.1866 0.0800 0.0201 0.0523 0.0574 0.3627 -0.0786 0.0557 0.1588
Constant 2.7390 0.6367 0.0000
2.5813 0.4571 0.0000 1.1503 0.4617 0.0131
R2 = 0.0507
F (6,479)= 4.2635 P=0.0003
R2 = 0.0430
F (6,479)= 3.5871 P=0.0017
R2 = 0.4705
F (11,474)= 38.2878 P=0.0000
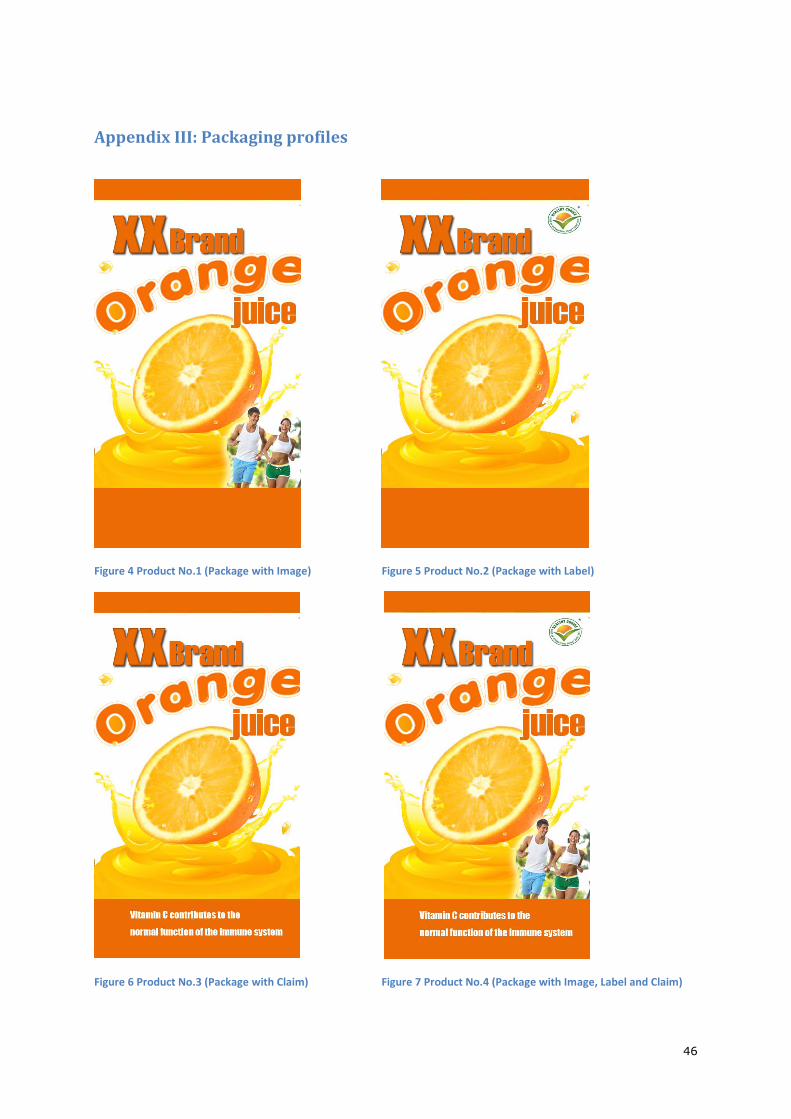
46
Appendix III: Packaging profiles
Figure 4 Product No.1 (Package with Image) Figure 5 Product No.2 (Package with Label)
Figure 6 Product No.3 (Package with Claim) Figure 7 Product No.4 (Package with Image, Label and Claim)
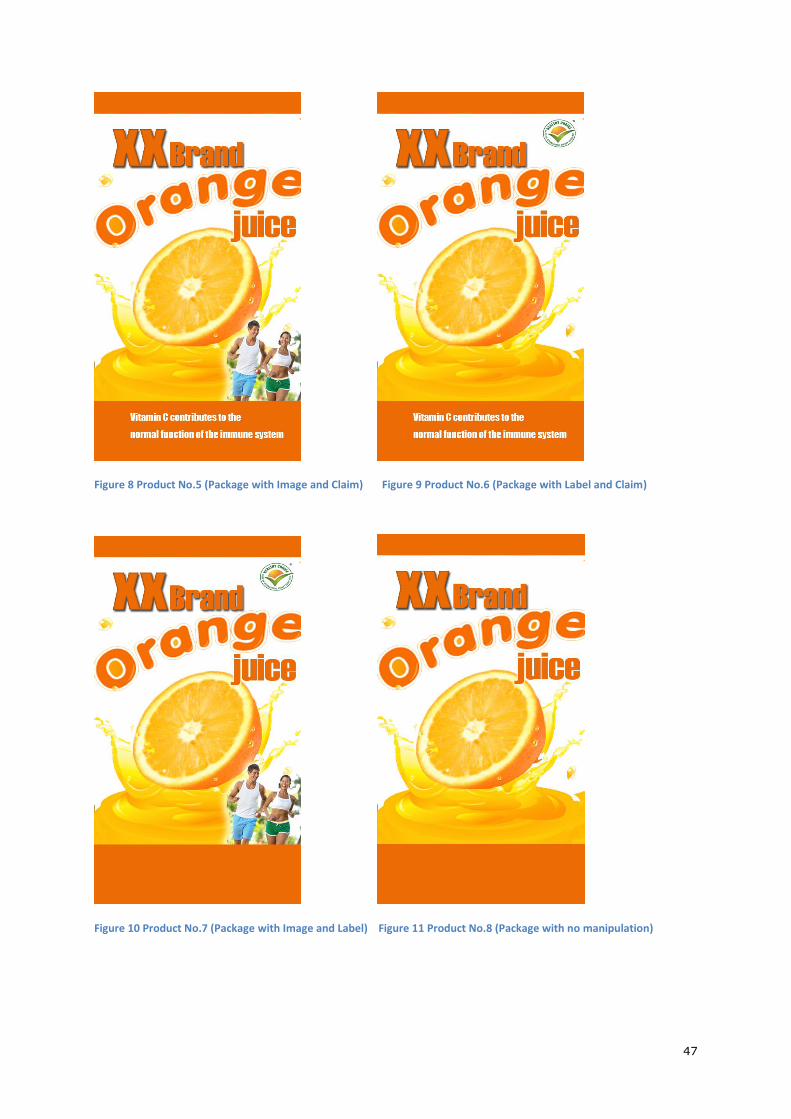
47
Figure 8 Product No.5 (Package with Image and Claim) Figure 9 Product No.6 (Package with Label and Claim)
Figure 10 Product No.7 (Package with Image and Label) Figure 11 Product No.8 (Package with no manipulation)