hurricane bud · baja california sur near san jose del cabo at 0200 utc 15 junewith an intensity of...
TRANSCRIPT
NATIONAL HURRICANE CENTER TROPICAL CYCLONE REPORT
HURRICANE BUD (EP032018) 9–15 June 2018
Eric S. Blake National Hurricane Center
24 October 2018
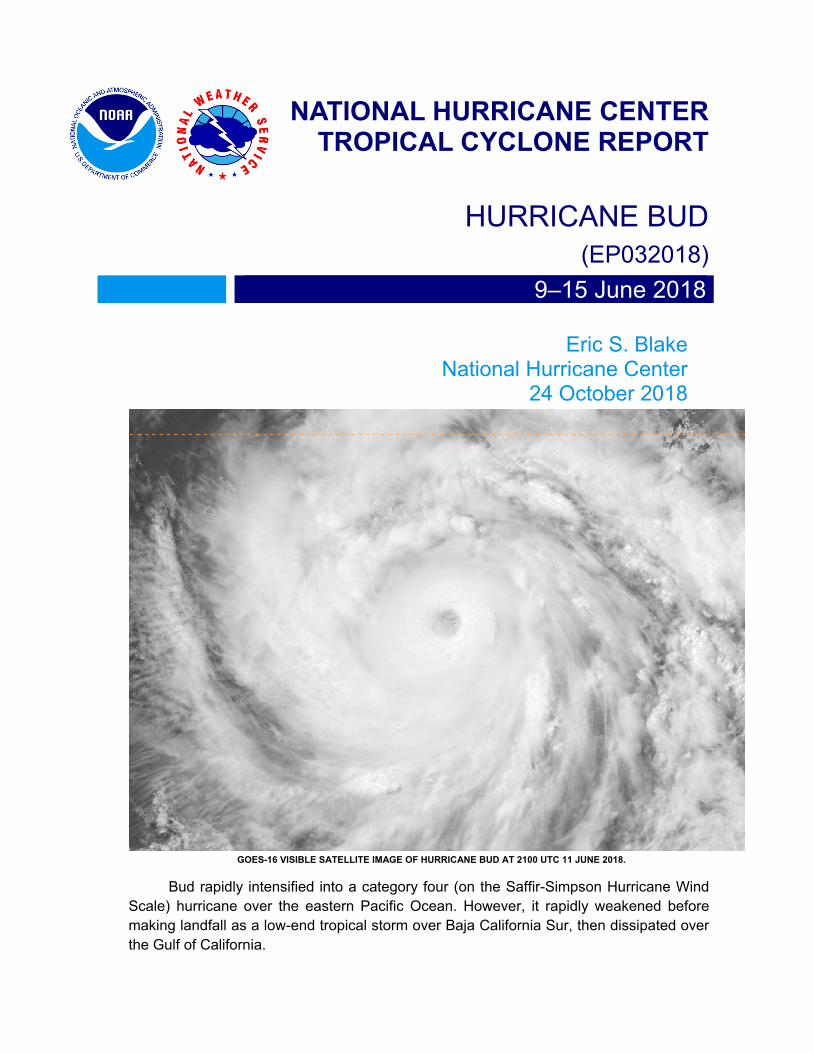
GOES-16 VISIBLE SATELLITE IMAGE OF HURRICANE BUD AT 2100 UTC 11 JUNE 2018.
Bud rapidly intensified into a category four (on the Saffir-Simpson Hurricane Wind Scale) hurricane over the eastern Pacific Ocean. However, it rapidly weakened before making landfall as a low-end tropical storm over Baja California Sur, then dissipated over the Gulf of California.

Hurricane Bud 2
Hurricane Bud 9–15 JUNE 2018
SYNOPTIC HISTORY The precursor to Bud was a tropical wave that emerged off the west coast of Africa on 29 May and moved quickly westward. The wave had little convection as it headed westward across the low-latitude Atlantic Ocean for the next several days. After moving over northern South America, the wave entered the far eastern North Pacific Ocean late on 6 June. Convection increased somewhat the next day, but the cloud pattern had little structure, with only a small amount of curvature noted on satellite images. On 8 June, thunderstorm activity notably increased a few hundred miles south-southwest of the Gulf of Tehuantepec, likely due to the passage of a convectively coupled Kelvin wave, and a broad low pressure area formed early the next day. Satellite and microwave data indicate that a well-defined low pressure area formed by 1800 UTC 9 June with ample deep convection, marking the formation of a tropical depression about 285 n mi south of Acapulco, Mexico. The depression became a tropical storm 6 h after genesis, moving to the northwest and west-northwest around a mid-level ridge over Mexico. The “best track” chart of Bud’s path is given in Fig. 1, with the wind and pressure histories shown in Figs. 2 and 3, respectively. The best track positions and intensities are listed in Table 11.
Bud began to rapidly intensify shortly after genesis in an environment of low shear, high mid-level moisture and very warm sea-surface temperatures (SSTs). Bud reached hurricane strength only 24 h after formation and became a major hurricane 18 h later. The hurricane reached a peak intensity of 120 kt around 0000 UTC 13 June, about 175 n mi southwest of Manzanillo, Mexico. Bud turned toward the north-northwest and began to rapidly weaken as it moved across cooler waters. The cyclone quickly dropped below hurricane strength on the morning of 13 June, but its intensity levelled off for the next few days while it moved over marginally warm SSTs. Although there was little change in the maximum winds, the structure of Bud changed during that time, with inner-core convection decreasing and convection only remaining in bands roughly 75–90 n mi from the large circulation center. Bud made landfall over Baja California Sur near San Jose del Cabo at 0200 UTC 15 June with an intensity of 40 kt and a central pressure of 999 mb. The cyclone moved across Baja California Sur for about 9 hours, then emerged over the Gulf of California. While the SSTs increased markedly, the storm’s circulation had become disrupted by the terrain of the Baja California peninsula, and the vertical wind shear was higher. Consequently, deep convection faded, and Bud degenerated into a convection-free post-tropical cyclone by 1200 UTC 15 June, about 120 n mi south-southwest of Huatabampito, Mexico. The low continued to weaken and opened up into a trough a little over 12 h later, still offshore about 30 n mi southwest of Huatabampito.
1 A digital record of the complete best track, including wind radii, can be found on line at ftp://ftp.nhc.noaa.gov/atcf. Data for the current year’s storms are located in the btk directory, while previous years’ data are located in the archive directory.

Hurricane Bud 3
METEOROLOGICAL STATISTICS Observations in Bud (Figs. 2 and 3) include subjective satellite-based Dvorak technique intensity estimates from the Tropical Analysis and Forecast Branch (TAFB), the Satellite Analysis Branch (SAB), and the objective Advanced Dvorak Technique (ADT) estimates and Satellite Consensus (SATCON) estimates from CIMSS at the University of Wisconsin. Data and imagery from NOAA polar-orbiting satellites including the Advanced Microwave Sounding Unit (AMSU), the NASA Global Precipitation Mission (GPM), the European Space Agency’s Advanced Scatterometer (ASCAT), and Defense Meteorological Satellite Program (DMSP) satellites, among others, were also useful in constructing the best track of Bud.
The estimated peak intensity of 120 kt at 0000 UTC 12 June is based on a blend of lower TAFB/SAB subjective Dvorak estimates and higher ADT/SATCON estimates from UW-CIMSS.
The estimated landfall intensity of Bud is 40 kt, but this is fairly uncertain. In downtown Cabo San Lucas, an automated weather observation (SEMAR Capitania de Puerto) recorded sustained winds of 51 kt with a gust to 67 kt on 14 June. However, it is unknown what the height of the anemometer was, as these winds were significantly higher than another nearby station downtown, which only recorded sustained winds of 34 kt. Since the satellite-based estimates were also 35 kt or less, the operational landfall intensity of 40 kt is retained. The minimum pressure recorded was 1000.7 mb with 10 kt of wind at San Jose del Cabo Airport, which is the basis for the 999 mb estimate. This value also is uncertain, because observations were only available at most every 3 hours from that station.
No rainfall amounts are available from Mexico.
CASUALTY AND DAMAGE STATISTICS
No damage or deaths occurred in association with Bud. Only minor impacts were noted in Baja California Sur and northwestern Mexico, generally due to locally heavy rain and flooding.
FORECAST AND WARNING CRITIQUE
The genesis forecasts for Bud (Table 2) had longer lead times than average. The system was introduced into the Tropical Weather Outlook (TWO) 120 h before genesis occurred with a low (< 40% chance) of genesis within 5 days, and reached the high (>60%) category 78 h before genesis occurred. For the 2-day genesis predictions, the system was given a medium (40–60% chance) 54 h before it formed, and was given a high probability 36 h before formation. Bud formed from a relatively large system and almost all the model guidance, and the NHC forecast, had a good prediction for the genesis of this system.
A verification of NHC official track forecasts for Bud is given in Table 3a. Official forecast track errors were lower than the mean official errors for the previous 5-yr period at all time periods.

Hurricane Bud 4
A homogeneous comparison of the official track errors with selected guidance models is given in Table 3b. The official forecast (OFCL) beat the bulk of the model guidance, with the dynamical track model consensus aids (TVCN, TVCE and TVCX) occasionally slightly outperforming the NHC forecast. Among the other aids, the GFS-ensemble mean (AEMI) did well for Bud, while the HWRF had a poorer performance than average for this cyclone.
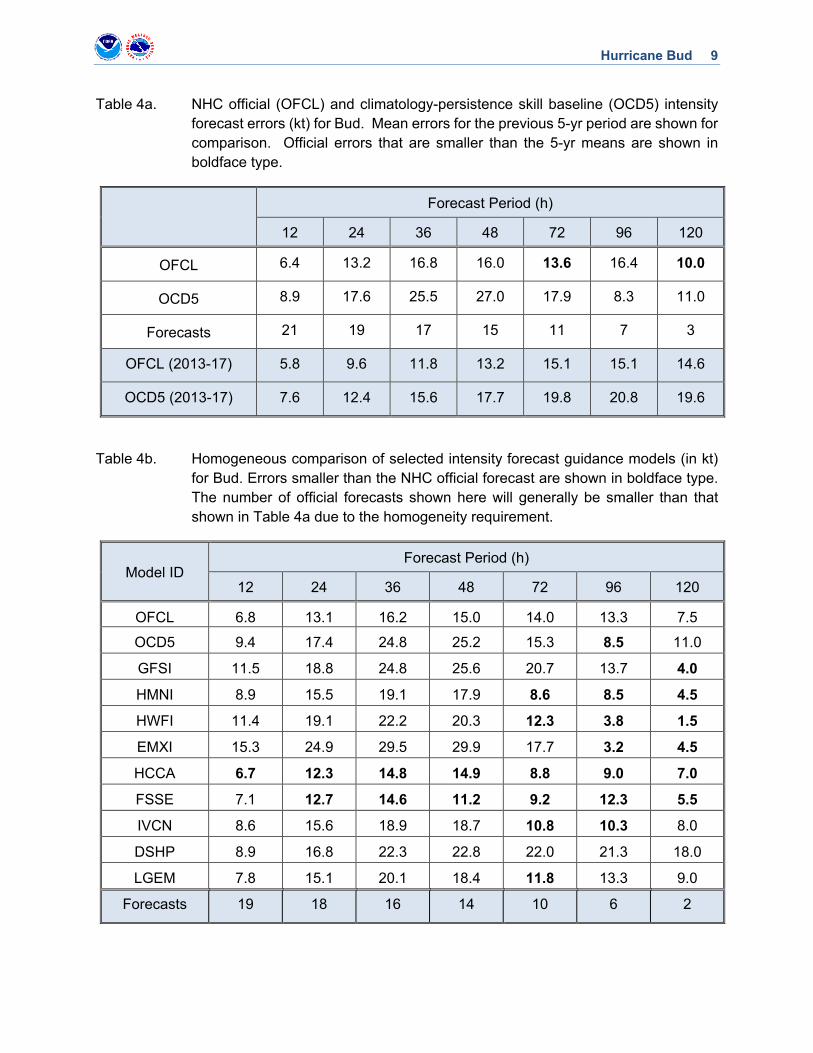
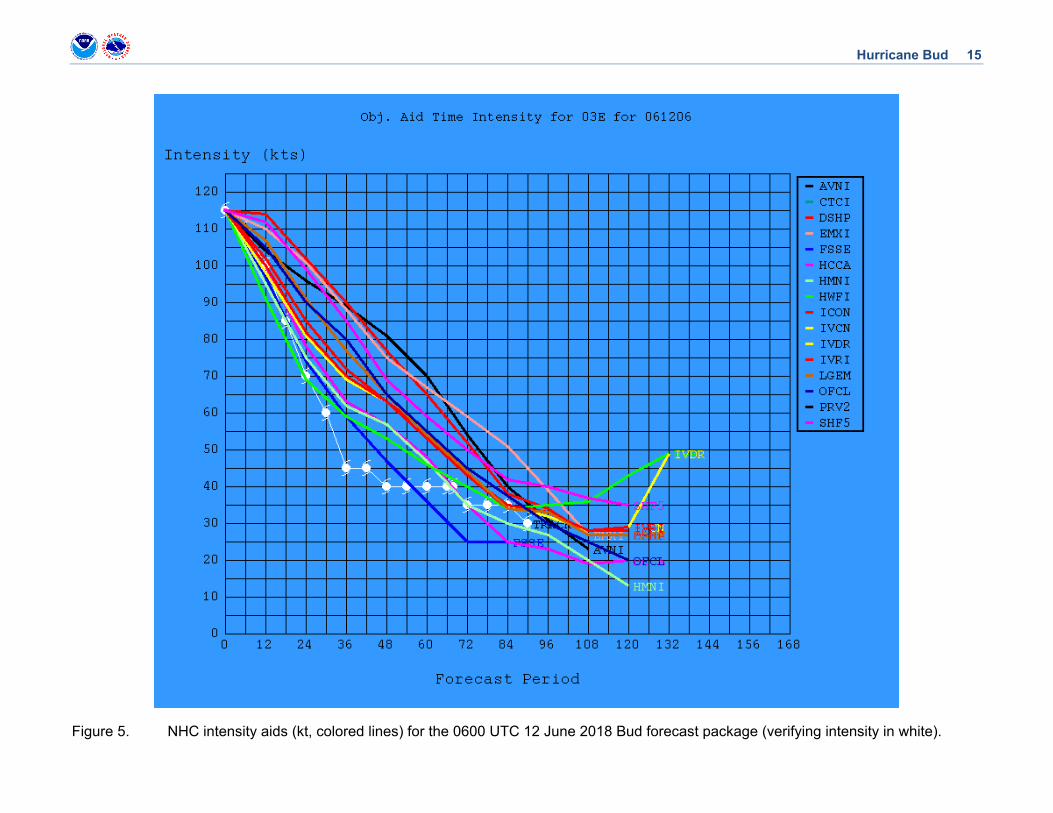
A verification of NHC official intensity forecasts for Bud is given in Table 4a. Official forecast intensity errors were generally above the mean official errors for the previous 5-yr period through 48 h, then close to or below the 5-yr average thereafter. Bud’s rapid intensification and subsequent weakening on 10–12 June were not well forecast, featuring the typical model and NHC biases of not forecasting a rapid enough strengthening and then keeping the intensity too high for too long after peak intensity (Figs. 4,5). A homogeneous comparison of the official intensity errors with selected guidance models is given in Table 4b. The NHC intensity forecast had a high bias at long range, leading to much of the guidance besting the official forecast at that time frame. The corrected-consensus models for intensity (HCCA and FSSE) were the best overall performers, while the SHIPS (DSHP) model had particularly high errors for this hurricane.
A summary of land-based watches and warnings issued for Bud are in Table 5.

Hurricane Bud 5
Table 1. Best track for Hurricane Bud, 9–15 June 2018.
Date/Time (UTC)
Latitude (°N)
Longitude (°W)
Pressure (mb)
Wind Speed
(kt) Stage
09 / 1800 12.1 100.5 1006 30 tropical depression
10 / 0000 12.7 101.3 1003 35 tropical storm
10 / 0600 13.5 102.1 1000 45 "
10 / 1200 14.4 102.9 996 55 "
10 / 1800 15.1 103.8 990 65 hurricane
11 / 0000 15.7 104.6 981 75 "
11 / 0600 16.1 105.6 970 90 "
11 / 1200 16.4 106.4 960 100 "
11 / 1800 16.8 106.9 952 110 "
12 / 0000 17.3 107.4 943 120 "
12 / 0600 17.7 107.8 947 115 "
12 / 1200 18.0 108.1 951 110 "
12 / 1800 18.3 108.3 960 100 "
13 / 0000 18.6 108.5 970 85 "
13 / 0600 18.9 108.6 983 70 "
13 / 1200 19.2 108.7 990 60 tropical storm
13 / 1800 19.7 108.9 995 45 "
14 / 0000 20.3 109.1 998 45 "
14 / 0600 20.8 109.3 999 40 "
14 / 1200 21.3 109.5 999 40 "
14 / 1800 21.9 109.6 999 40 "
15 / 0000 22.7 109.7 999 40 "
15 / 0200 23.0 109.7 999 40 "
15 / 0600 23.8 109.9 1001 35 "
15 / 1200 24.7 110.1 1002 35 low
15 / 1800 25.5 110.2 1002 35 "

Hurricane Bud 6
16 / 0000 26.4 110.1 1002 30 "
16 / 0600 dissipated
12 / 0000 17.3 107.4 943 120 minimum pressure and maximum winds
15 / 0200 23.0 109.7 999 40 landfall near San Jose del Cabo, Mexico
Table 2. Number of hours in advance of the formation of Bud associated with the first NHC Tropical Weather Outlook forecast in the indicated likelihood category. Note that the timings for the “Low” category do not include forecasts of a 0% chance of genesis.
Hours Before Genesis
48-Hour Outlook 120-Hour Outlook
Low (<40%) 90 120
Medium (40%-60%) 54 102
High (>60%) 36 78

Hurricane Bud 7
Table 3a. NHC official (OFCL) and climatology-persistence skill baseline (OCD5) track forecast errors (n mi) for Bud. Mean errors for the previous 5-yr period are shown for comparison. Official errors that are smaller than the 5-yr means are shown in boldface type.
Forecast Period (h)
12 24 36 48 72 96 120
OFCL 19.4 24.1 26.8 30.3 37.5 56.1 106.7
OCD5 39 71.1 112.8 156 265.4 341.1 494.9
Forecasts 21 19 17 15 11 7 3
OFCL (2013-17) 21.8 33.2 43.0 53.9 80.7 111.1 150.5
OCD5 (2013-17) 34.9 70.7 109.1 146.1 213.8 269.0 339.7

Hurricane Bud 8
Table 3b. Homogeneous comparison of selected track forecast guidance models (in n mi) for Bud. Errors smaller than the NHC official forecast are shown in boldface type. The number of official forecasts shown here will generally be smaller than that shown in Table 3a due to the homogeneity requirement.
Model ID Forecast Period (h)
12 24 36 48 72 96 120
OFCL 18.0 22.3 25.8 29.9 35.6 52.2 98.8
OCD5 36.2 68.5 111.3 157.1 269.5 338.8 483.2
GFSI 20.8 30.0 35.2 41.0 41.6 78.3 116.0
HMNI 26.4 36.6 47.7 56.9 77.5 97.5 198.7
HWFI 20.0 31.7 48.7 67.1 100.5 147.2 191.5
EMXI 21.4 26.3 29.2 40.4 65.4 107.9 135.2
CMCI 27.4 39.2 53.6 71.2 79.5 121.5 212.7
NVGI 28.2 41.2 50.9 51.7 94.4 174.6 151.9
AEMI 19.2 24.9 30.9 38.3 48.1 63.9 112.1
HCCA 18.0 19.5 22.3 28.8 37.0 51.8 79.8
FSSE 19.8 24.7 31.2 41.4 61.3 93.1 117.7
TVCN 17.3 21.5 26.1 30.5 36.7 49.7 70.6
TVCE 18.4 22.1 27.1 33.1 41.8 52.0 72.1
TVCX 18.3 20.6 24.1 31.7 39.6 57.8 80.5
GFEX 20.1 24.9 28.3 36.6 48.1 83.4 106.2
TABD 26.9 47.4 68.1 73.3 47.4 129.2 125.6
TABM 26.3 55.0 77.8 82.3 66.7 122.5 117.4
TABS 30.1 52.7 71.5 80.6 70.2 108.8 137.2
Forecasts 19 18 16 14 10 6 2
Hurricane Bud 9
Table 4a. NHC official (OFCL) and climatology-persistence skill baseline (OCD5) intensity forecast errors (kt) for Bud. Mean errors for the previous 5-yr period are shown for comparison. Official errors that are smaller than the 5-yr means are shown in boldface type.
Forecast Period (h)
12 24 36 48 72 96 120
OFCL 6.4 13.2 16.8 16.0 13.6 16.4 10.0
OCD5 8.9 17.6 25.5 27.0 17.9 8.3 11.0
Forecasts 21 19 17 15 11 7 3
OFCL (2013-17) 5.8 9.6 11.8 13.2 15.1 15.1 14.6
OCD5 (2013-17) 7.6 12.4 15.6 17.7 19.8 20.8 19.6
Table 4b. Homogeneous comparison of selected intensity forecast guidance models (in kt) for Bud. Errors smaller than the NHC official forecast are shown in boldface type. The number of official forecasts shown here will generally be smaller than that shown in Table 4a due to the homogeneity requirement.
Model ID Forecast Period (h)
12 24 36 48 72 96 120
OFCL 6.8 13.1 16.2 15.0 14.0 13.3 7.5
OCD5 9.4 17.4 24.8 25.2 15.3 8.5 11.0
GFSI 11.5 18.8 24.8 25.6 20.7 13.7 4.0
HMNI 8.9 15.5 19.1 17.9 8.6 8.5 4.5
HWFI 11.4 19.1 22.2 20.3 12.3 3.8 1.5
EMXI 15.3 24.9 29.5 29.9 17.7 3.2 4.5
HCCA 6.7 12.3 14.8 14.9 8.8 9.0 7.0
FSSE 7.1 12.7 14.6 11.2 9.2 12.3 5.5
IVCN 8.6 15.6 18.9 18.7 10.8 10.3 8.0
DSHP 8.9 16.8 22.3 22.8 22.0 21.3 18.0
LGEM 7.8 15.1 20.1 18.4 11.8 13.3 9.0
Forecasts 19 18 16 14 10 6 2

Hurricane Bud 10
Table 5. Watch and warning summary for Hurricane Bud, 9–15 June 2018.
Date/Time (UTC) Action Location
10 / 2100 Tropical Storm Watch issued Manzanillo to Cabo Corrientes, Mexico
11 / 2100 Tropical Storm Watch discontinued All
13 / 0300 Tropical Storm Watch issued Santa Fe to La Paz
13 / 1500 Tropical Storm Watch changed to Tropical Storm Warning
Santa Fe to La Paz
14 / 2100 Tropical Storm Watch issued La Paz to San Evaristo
14 / 2100 Tropical Storm Watch issued Altata to Huatabampito
15 / 0900 Tropical Storm Watch discontinued La Paz to San Evaristo
15 / 0900 Tropical Storm Warning discontinued All
15 / 1500 Tropical Storm Watch discontinued All

Hurricane Bud 11
Figure 1. Best track positions for Hurricane Bud, 9–15 June 2018.
Hurricane Bud 12
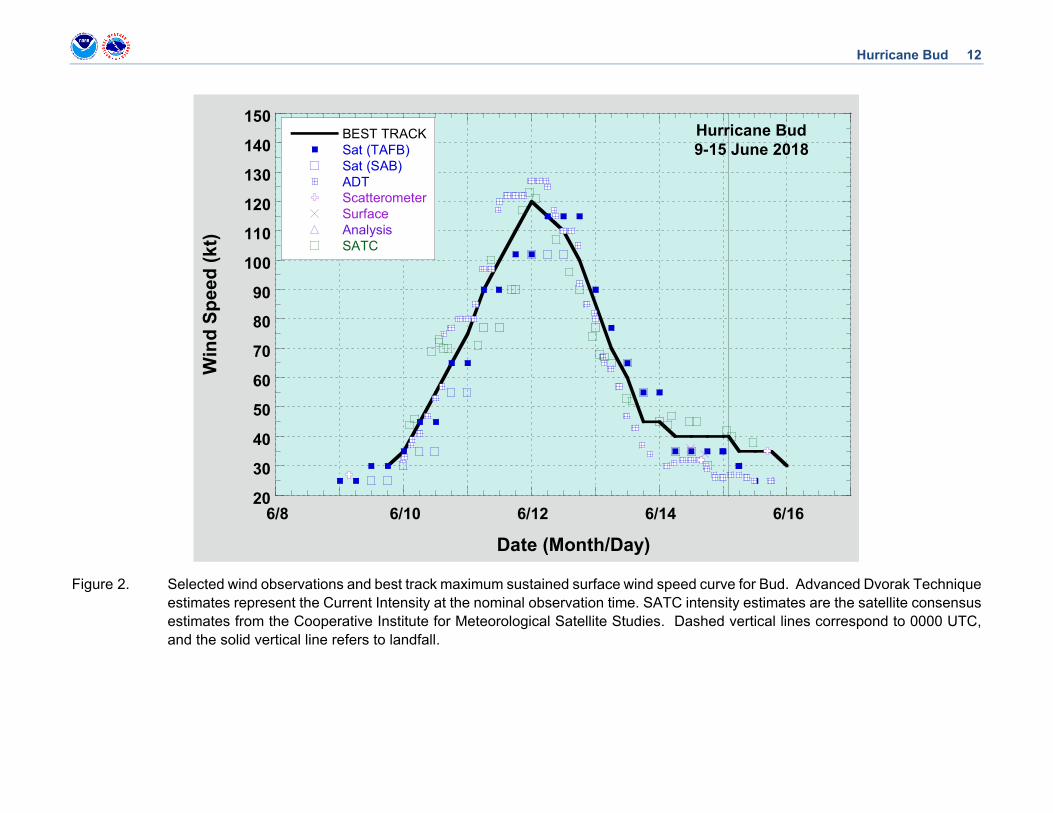
Figure 2. Selected wind observations and best track maximum sustained surface wind speed curve for Bud. Advanced Dvorak Technique estimates represent the Current Intensity at the nominal observation time. SATC intensity estimates are the satellite consensus estimates from the Cooperative Institute for Meteorological Satellite Studies. Dashed vertical lines correspond to 0000 UTC, and the solid vertical line refers to landfall.
20
30
40
50
60
70
80
90
100
110
120
130
140
150
6/8 6/10 6/12 6/14 6/16
BEST TRACKSat (TAFB)Sat (SAB)ADTScatterometerSurfaceAnalysisSATC
Win
d Sp
eed
(kt)
Date (Month/Day)
Hurricane Bud9-15 June 2018

Hurricane Bud 13
Figure 3. Selected pressure observations and best track minimum central pressure curve for Bud. Advanced Dvorak Technique estimates represent the pressure from the Current Intensity at the nominal observation time. SATC pressures estimates are the satellite consensus estimates from the Cooperative Institute for Meteorological Satellite Studies. KZC P-W refers to pressure estimates derived using the Knaff-Zehr-Courtney pressure-wind relationship. Dashed vertical lines correspond to 0000 UTC, and the solid vertical line refers to landfall.
930
940
950
960
970
980
990
1000
1010
6/9 6/10 6/11 6/12 6/13 6/14 6/15 6/16 6/17
BEST TRACKKZC P-WSat (TAFB)Sat (SAB)ADTSurfaceAnalysisSATC
Pres
sure
(mb)
Date (Month/Day)
Hurricane Bud9-15 June 2018

Hurricane Bud 14
Figure 4. NHC intensity aids (kt, colored lines) for the 0600 UTC 10 June 2018 Bud forecast package (verifying intensity in white).
Hurricane Bud 15
Figure 5. NHC intensity aids (kt, colored lines) for the 0600 UTC 12 June 2018 Bud forecast package (verifying intensity in white).