implementation of isge/isemic model on faculty of technical sciences novi sad aleksandar...
TRANSCRIPT
Implementation of ISGE/ISEMIC model on Faculty of Technical Sciences Novi Sad
ALEKSANDAR ANĐELKOVIĆ, FACULTY OF TECHNICAL SCIENCES, NOVI SAD
IntroductionIntroduction
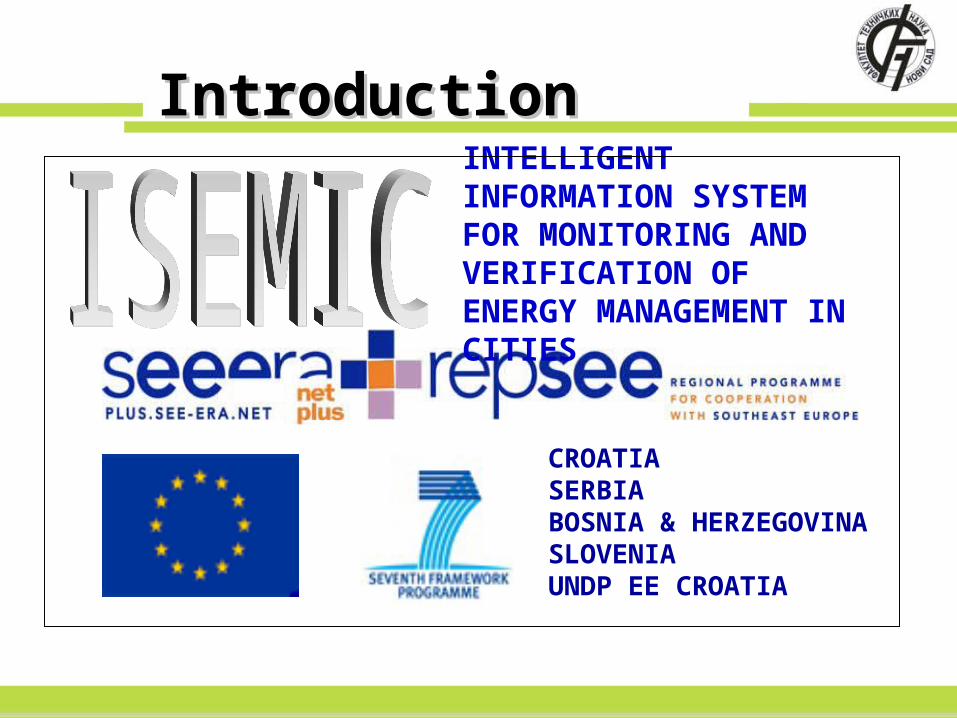
INTELLIGENT INFORMATION SYSTEM FOR MONITORING AND VERIFICATION OF ENERGY MANAGEMENT IN CITIES
CROATIASERBIABOSNIA & HERZEGOVINASLOVENIAUNDP EE CROATIA
IntroductionIntroduction
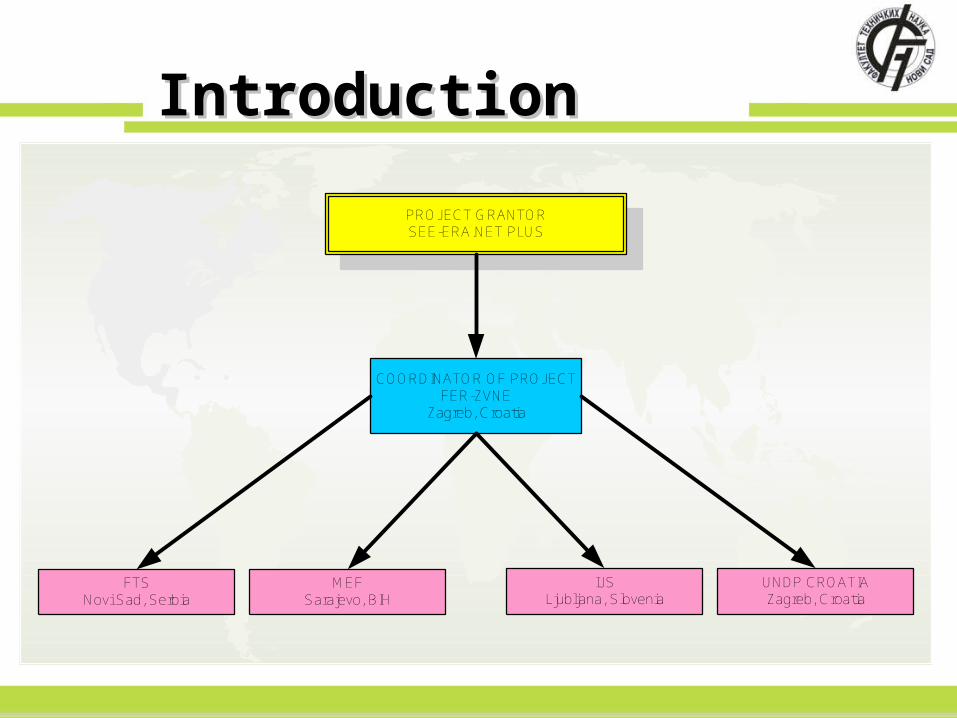
PROJECT GRANTORSEE-ERA.NET PLUS
COORDINATOR OF PROJECTFER-ZVNE
Zagreb, Croatia
FTSNovi Sad, Serbia
MEFSarajevo, BIH
IJSLjubljana, Slovenia
UNDP CROATIAZagreb, Croatia
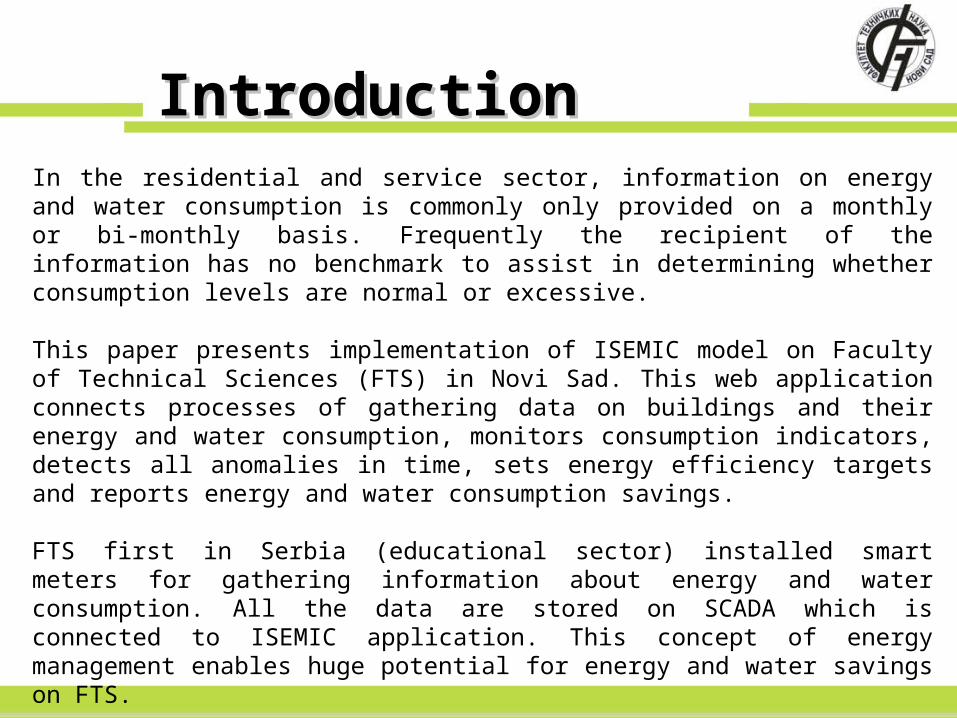
IntroductionIntroduction In the residential and service sector, information on energy and water consumption is commonly only provided on a monthly or bi-monthly basis. Frequently the recipient of the information has no benchmark to assist in determining whether consumption levels are normal or excessive.
This paper presents implementation of ISEMIC model on Faculty of Technical Sciences (FTS) in Novi Sad. This web application connects processes of gathering data on buildings and their energy and water consumption, monitors consumption indicators, detects all anomalies in time, sets energy efficiency targets and reports energy and water consumption savings.
FTS first in Serbia (educational sector) installed smart meters for gathering information about energy and water consumption. All the data are stored on SCADA which is connected to ISEMIC application. This concept of energy management enables huge potential for energy and water savings on FTS.
Scope of ResearchImproving the efficiency of energy consumption is a central theme of any energy policy. Improved energy efficiency meets three energy policy goals:
1. security of supply, 2. competitiveness and 3. protection of the environment.
Systematic energy management is a body of knowledge and skills based on an organizational structure that links people with assigned responsibilities, efficiency monitoring procedures and continuous measurement and improvement of energy efficiency. This body of knowledge must be supported by appropriate ICT for gathering, processing and disseminating data on energy consumption, energy efficiency targets and information.
Intelligent Information System for Monitoring and Verification of Energy Management in Cities (ISEMIC) will be a software tool that connects processes of gathering data on buildings and their energy consumption, monitoring consumption indicators, setting energy efficiency targets and reporting energy consumption savings.
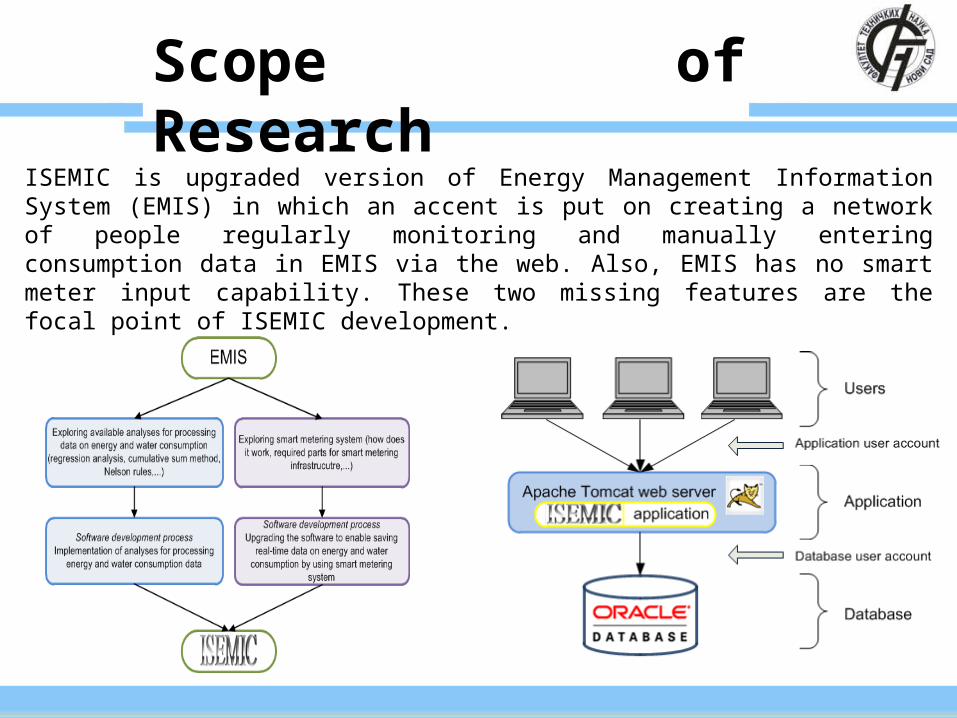
Scope of ResearchISEMIC is upgraded version of Energy Management Information System (EMIS) in which an accent is put on creating a network of people regularly monitoring and manually entering consumption data in EMIS via the web. Also, EMIS has no smart meter input capability. These two missing features are the focal point of ISEMIC development.
Description of ISEMIC web application
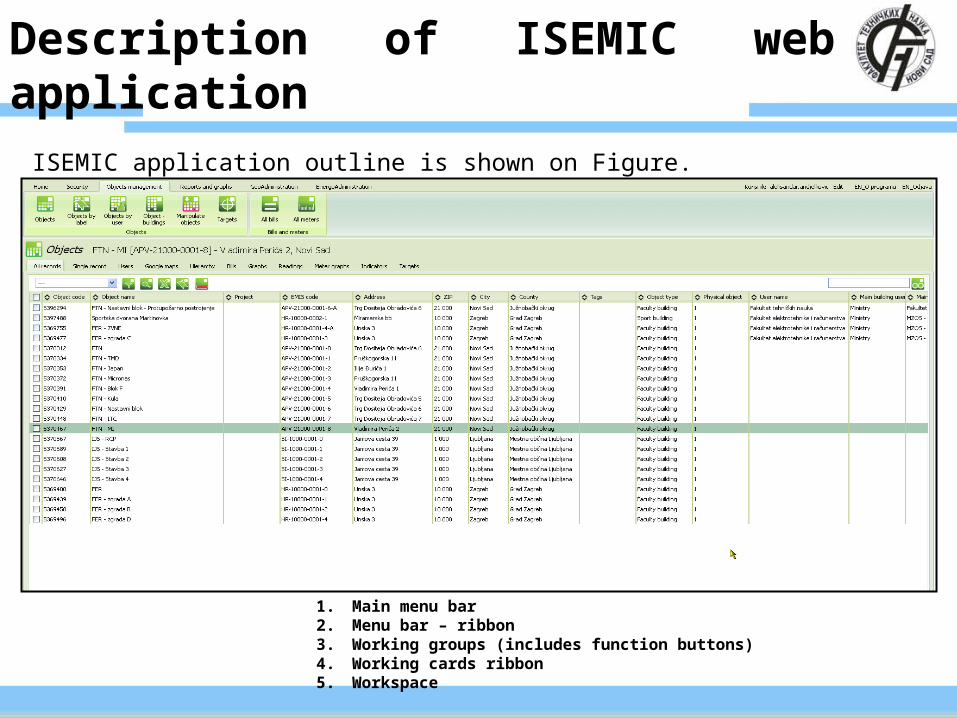
ISEMIC application outline is shown on Figure.
1. Main menu bar2. Menu bar – ribbon3. Working groups (includes function buttons)4. Working cards ribbon5. Workspace
Description of ISEMIC web application
ISEMIC is developed in Croatia.
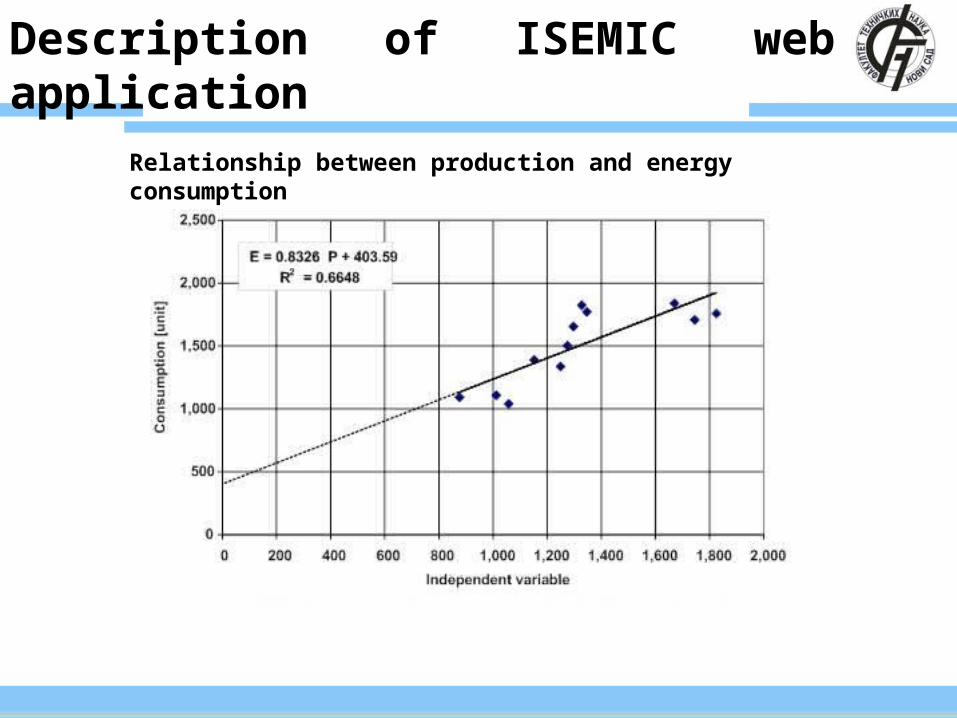
ISEMIC further implements a newly developed methodology for past energy consumption data analysis using regression analysis, least square method, best-fit lines, scatter trending, as well as setting and cascading targets using correlation analysis and risk analysis using probability distribution for planning improvement measures.
Regression analysis shows how a dependent variable – energy consumption – is related to the independent one – for example (production, temperature…), by providing an equation that allows estimating energy consumption for the given temperature. The relationship between production and energy consumption in most cases is in linear form which means that the relationship between the points in the graph can be approximated by a straight line and expressed by a linear equation (y=a·x+b).
If constant values (a and b) are calculated by the least square method the resulting line will go through the center of data scatter and therefore is called a best-fit line.
Description of ISEMIC web application
Relationship between production and energy consumption
Description of ISEMIC web application
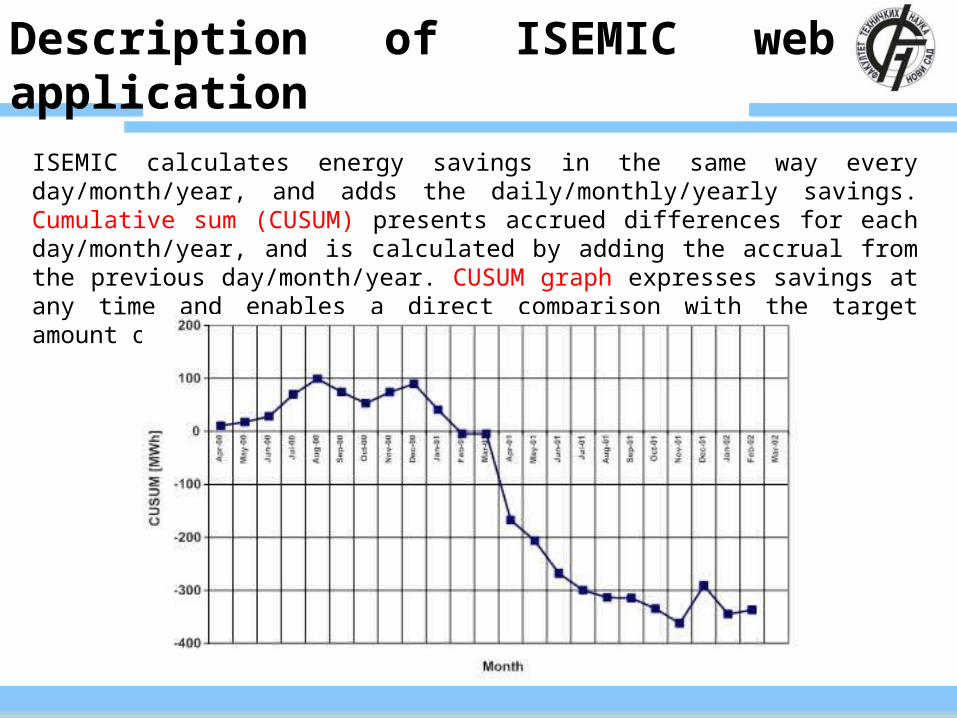
ISEMIC calculates energy savings in the same way every day/month/year, and adds the daily/monthly/yearly savings. Cumulative sum (CUSUM) presents accrued differences for each day/month/year, and is calculated by adding the accrual from the previous day/month/year. CUSUM graph expresses savings at any time and enables a direct comparison with the target amount of energy that should be saved.
Description of ISEMIC model on FTS Novi Sad
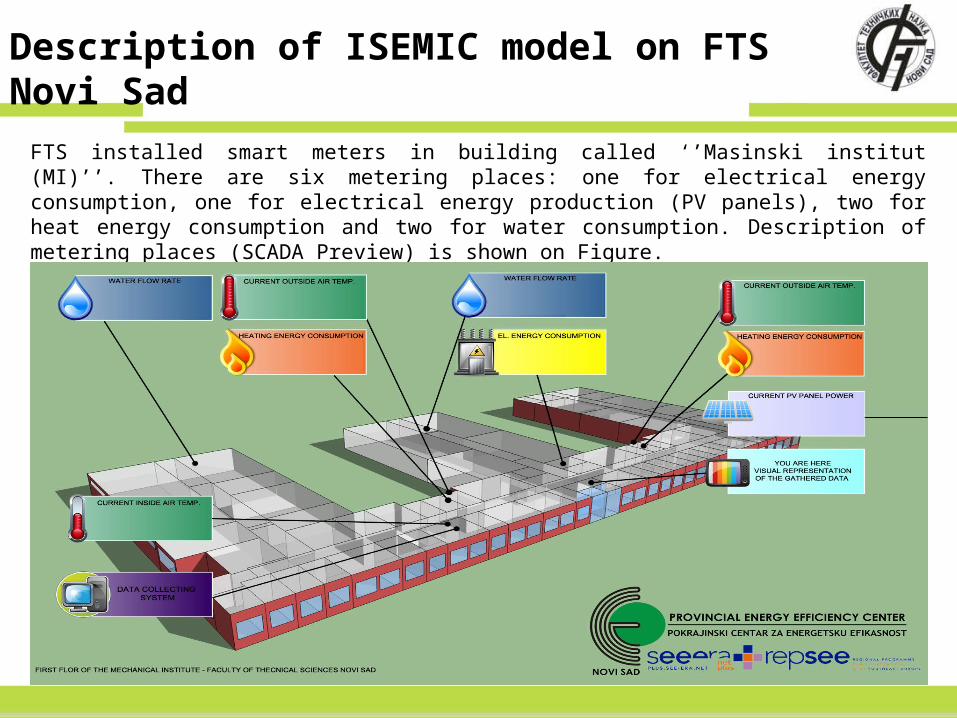
FTS installed smart meters in building called ‘’Masinski institut (MI)’’. There are six metering places: one for electrical energy consumption, one for electrical energy production (PV panels), two for heat energy consumption and two for water consumption. Description of metering places (SCADA Preview) is shown on Figure.
Description of ISEMIC model on FTS Novi Sad
In summary measure works as follows:
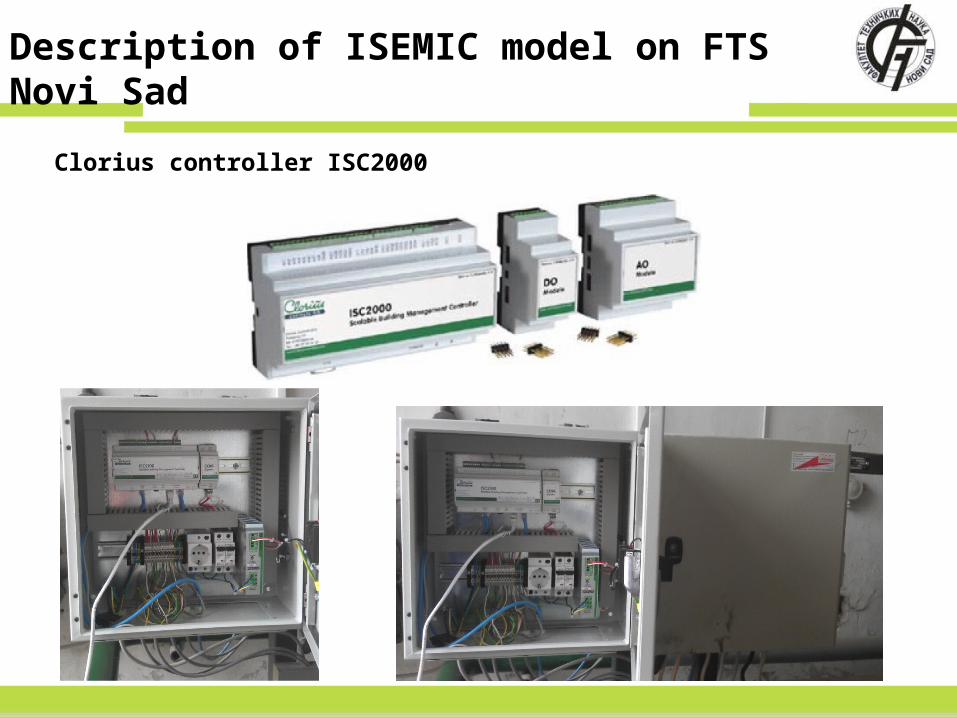
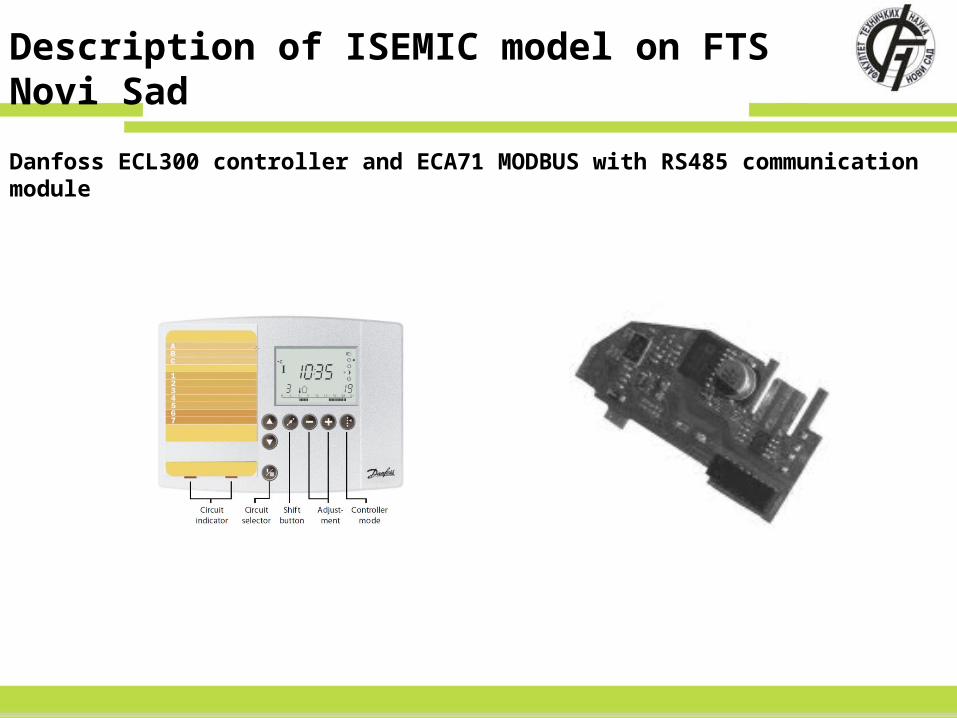
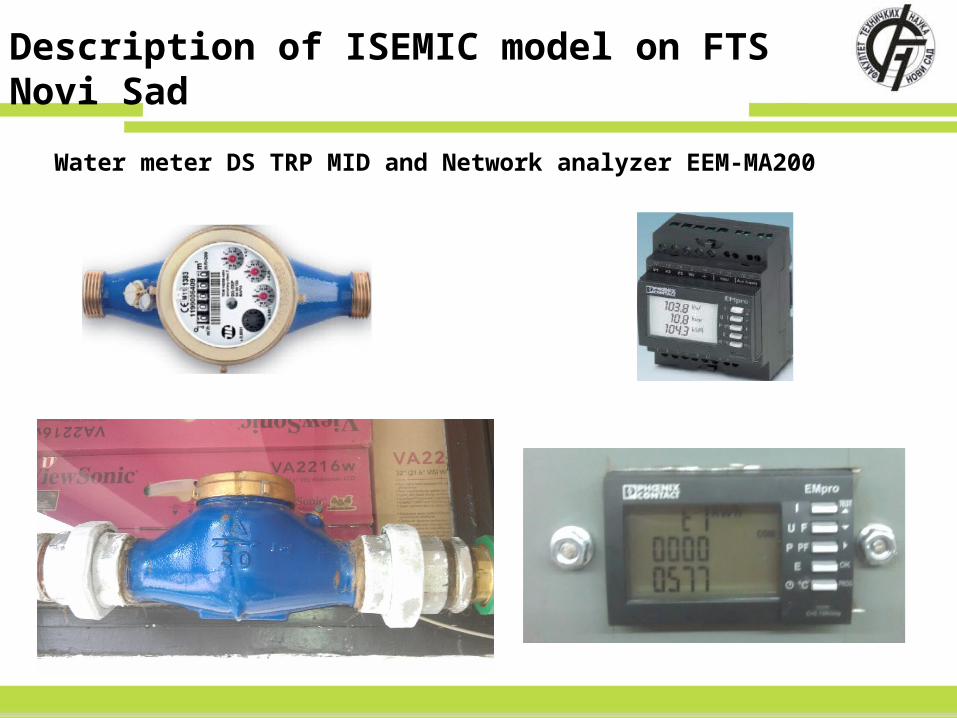
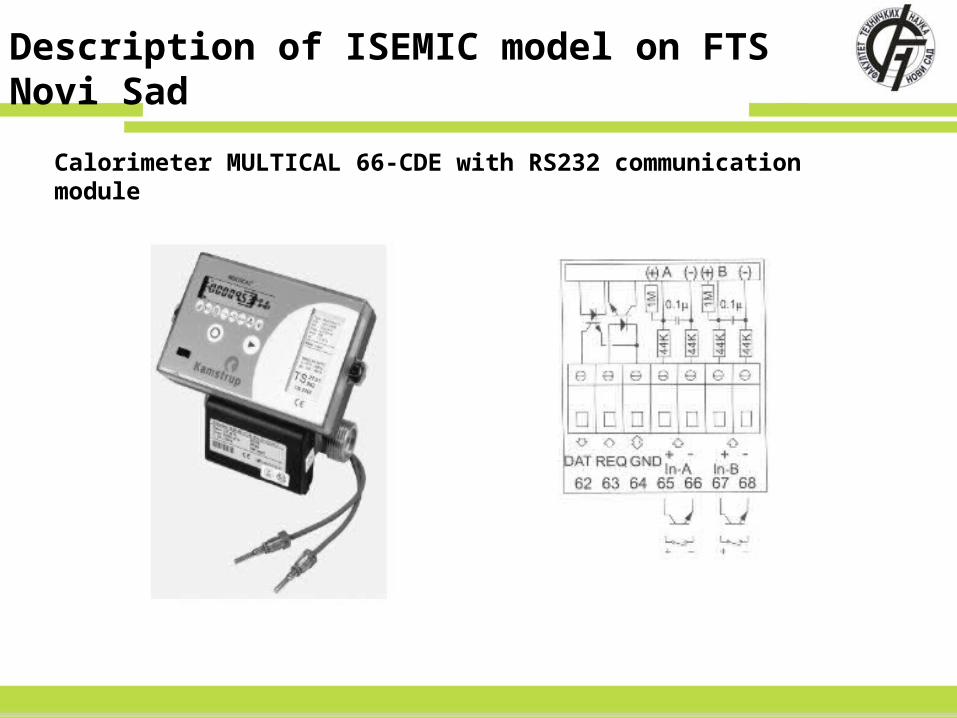
Clorius controller ISC2100 is the basis of everything. ISC 2100 belongs to a family of freely programmable controllers designed to be scalable from the small to the very large installations. ISC 2100 is well suited to control meters for heat, electrical and water consumption and can function as a PLC. It communicates with the Danfoss ECL300 controller placed in two heat substations (allows reading and setting the parameters of the controller). Inside of Danfoss controller is ECA 71 MODBUS communication module which makes it possible to establish a RS485 communications with Clorius controller ISC2100. Reading values from the calorimeter MULTICAL 66-CDE is achieved via RS232 communication (built-in communication modules), and value from the water meter DS TRP MID via pulse input. Clorius controller ISC2100 also communicates via RS485 communication with the network analyzer in the transformer station EEM-MA200. Inside of network analyzer EEM-MA200 is built RS485 communication module. Temperature sensor ESM-10 is installed in reference room and it measures current inside temperature. Clorius controller ISC2100 is connected to our Ethernet (LAN) network and communicates with the computer that is running SCADA applications (Wonderware In Touch 2012 SCADA system). It can be accessed to each controller by IP address from any computer in local network via a web browser, or from remote location if it is allowed to access the network from outside. The computer sends required reports (readings from metering devices) to the server in Zagreb. Data processing software (ISEMIC) is installed on that server.
FTS from its resources and donor funds managed to make the first solar power plant (PV) to produce electricity. Photovoltaic filed makes two strings of 20 panels, connected in series, with individual nominal power of 240 Wp. PV inverter nominal output power is 8kW. Production information of electricity, as well as meteorological data conditions that prevailed during the electricity production are recorded, processed and stored on the SCADA system.
Description of ISEMIC model on FTS Novi Sad
Clorius controller ISC2000
Description of ISEMIC model on FTS Novi Sad
Danfoss ECL300 controller and ECA71 MODBUS with RS485 communication module
Description of ISEMIC model on FTS Novi Sad
Water meter DS TRP MID and Network analyzer EEM-MA200
Description of ISEMIC model on FTS Novi Sad
Calorimeter MULTICAL 66-CDE with RS232 communication module
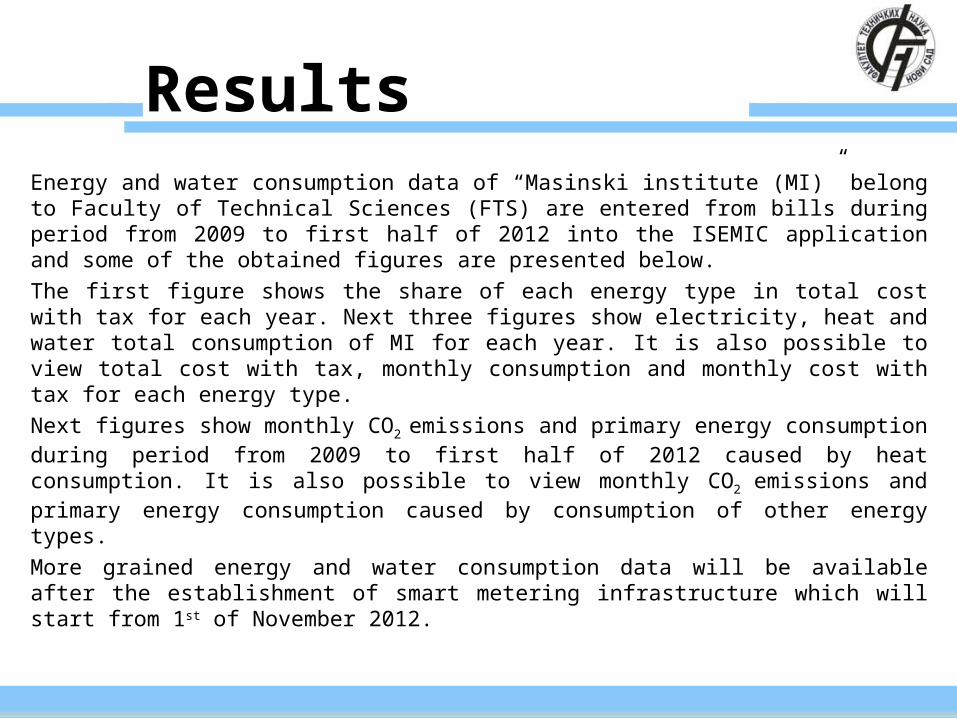
Energy and water consumption data of “Masinski institute (MI)” belong to Faculty of Technical Sciences (FTS) are entered from bills during period from 2009 to first half of 2012 into the ISEMIC application and some of the obtained figures are presented below.
The first figure shows the share of each energy type in total cost with tax for each year. Next three figures show electricity, heat and water total consumption of MI for each year. It is also possible to view total cost with tax, monthly consumption and monthly cost with tax for each energy type.
Next figures show monthly CO2 emissions and primary energy consumption during period from 2009 to first half of 2012 caused by heat consumption. It is also possible to view monthly CO2 emissions and primary energy consumption caused by consumption of other energy types.
More grained energy and water consumption data will be available after the establishment of smart metering infrastructure which will start from 1st of November 2012.
Results
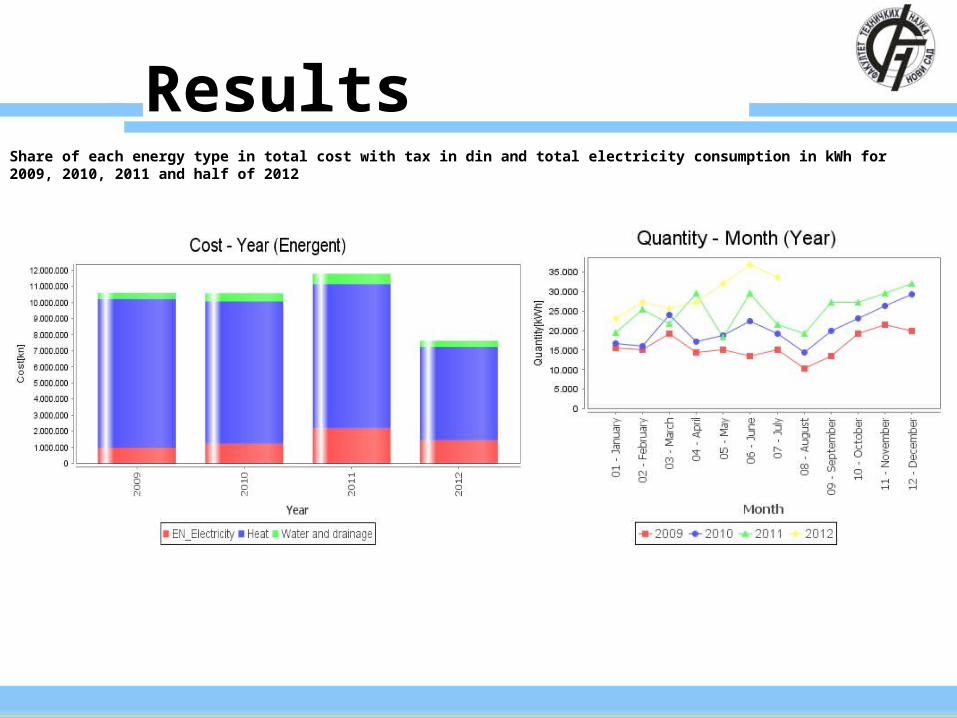
ResultsShare of each energy type in total cost with tax in din and total electricity consumption in kWh for 2009, 2010, 2011 and half of 2012
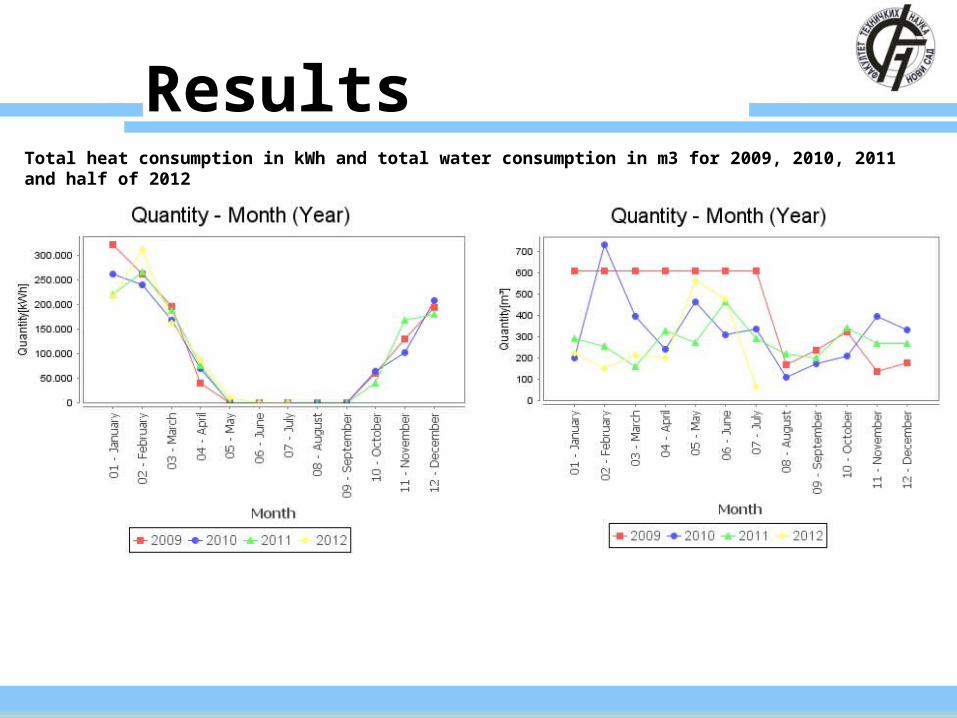
ResultsTotal heat consumption in kWh and total water consumption in m3 for 2009, 2010, 2011 and half of 2012
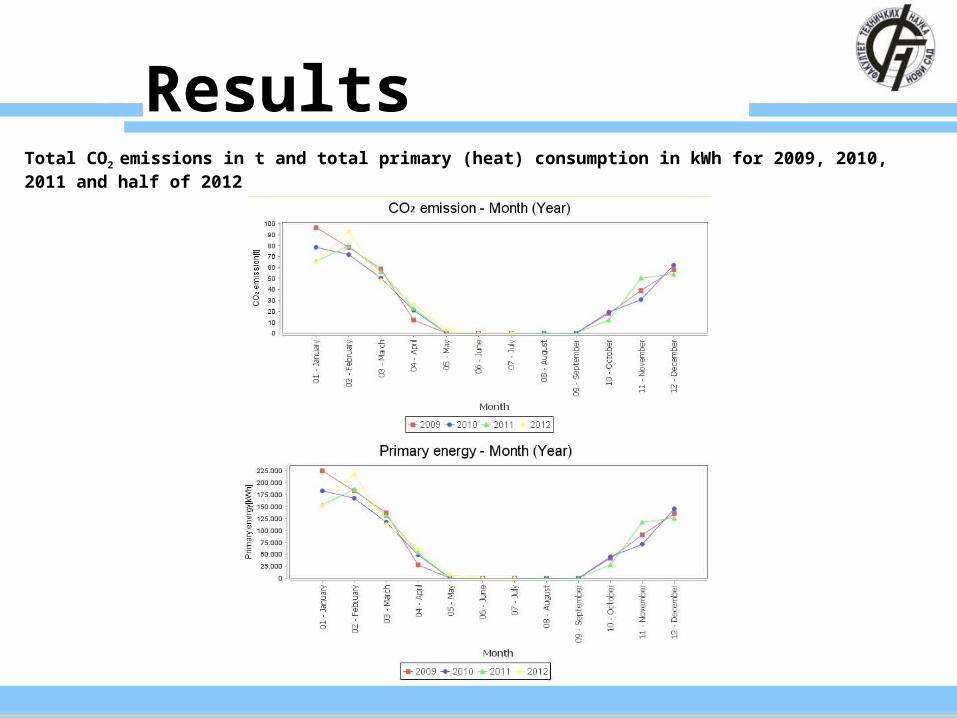
ResultsTotal CO2 emissions in t and total primary (heat) consumption in kWh for 2009, 2010, 2011 and half of 2012
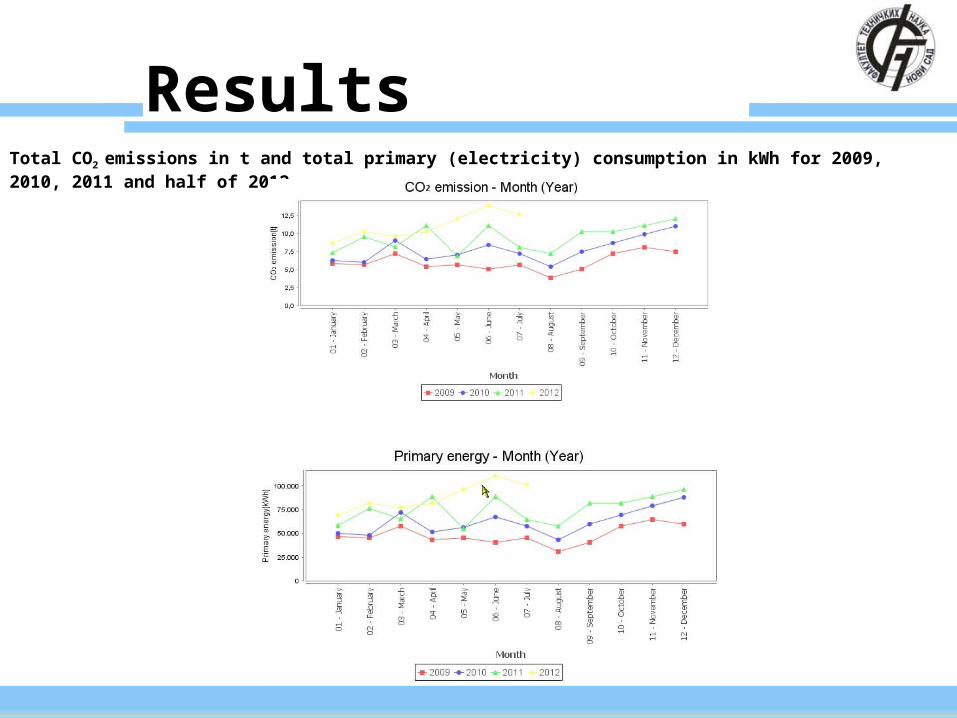
ResultsTotal CO2 emissions in t and total primary (electricity) consumption in kWh for 2009, 2010, 2011 and half of 2012
Conclusions It is expected that ISEMIC will improve energy efficiency in buildings, raise building users' awareness of energy consumption and utilize measurements from smart meters. Examples from praxis show that introducing an energy consumption monitoring system raises employee awareness on energy expenditure, which leads to 5% of energy and water savings without any additional investments in energy efficiency measures. After full ISEMIC implementation and implementation of some simple energy efficiency measures it is expected that energy and water savings will reach at least 10% of current consumption expenses of all project partners. The potential impact of this project is very large and it would be a great example how significant savings can be achieved by systematic energy monitoring and management provided by the use of ISEMIC. After successful project finish it is expected that city, county or ministry will show higher interest to connect public buildings in their ownership with the ISEMIC web application and start systematic energy monitoring and management. Connection of private buildings with ISEMIC is expected in further future.

Thank you for your attention
Questions???