information technology payoff in the health-care … technology payoff in the health-care industry:...
TRANSCRIPT

Information Technology Payoffin the Health-Care Industry:A Longitudinal Study '
SARV DEVARAJ AND RAHV KOHLI
SARV DEVARAJ is Assistant Professor ofManagement at the University of Notre Dame.He received his Ph.D. from the University of Minnesota. He has worked on severalprojects for companies examining the impact ofthe technological environment, just-in-time manufacturing, work teams, and perfonnance evaluation systems on manu-facturing performance. He has also studied the impact of technology investments andtechnology usage in the health-care industry. In the field of service quality, Dr. Devarajconducts research on consumers' perception of service and product quality in theautomotive industry. He teaches courses in management of technology, operationsmanagement, and business statistics.
RAJIV KOHLI is the Project Leader, Decision Support Services, at the corporate officeof Trinity Health. He is also an adjunct Assistant Professor at the University of NotreDame and has taught at the University of Maryland, University College, where hewas a recipient of a Teaching Recognition Award. Dr. Kohli received his Ph.D. fromthe University of Maryland. His research has been published in Decision SupportSystems, Information Processing and Management, Intemational Transactions inOperational Research, Journal of Decision Systems, and Health Care InformationManagement, among other joumals. Dr. Kohli's research interests include organiza-tional impacts of information systems, process innovation, and enhanced decisionsupport systems.
ABSTRACT: With the enormous investments in Information Technology (IT), thequestion of payoffs from IT has become increasingly important. Organizations con-tinue to question the benefits from IT investments especially in conjunction withcorporate initiatives such as business process reengineering (BPR). Furthermore, theimpact of technology on nonfmancial outcomes such as customer satisfaction andquality is gaining interest.
However, studies examining the IT-^erformance relationship have been far fromconclusive. The difficulty in identifying impacts from technology has been the iso-lation of benefits of IT from other factors that may also contribute to organizationalperformance. Furthermore, benefits from technology investments may be realizedover an extended period of time. Finally, IT benefits may accrue when they are donein concert with other organizational initiatives such as business process reengineering.This calls for studies that take into account control variables as well as data that spantime periods.In this study, we examine monthly data collected from eight hospitals over a recent
three-year time period. We specify propositions that relate investments in IT to per-formance, and the combined effect of technology and BPR on performance. We draw
Journal of Management Informalion Systems I Spring 2000, Vol. 16. No. 4. pp. A1-67.
©2000 M.ESha(pe, Inc.vi/a-xm 12000 $9.56 + 0.00.
42 DEVARAJ AND KOHLI
upon the literature in health-care management to incorporate appropriate controlvariables in the analyses. Our results provide support for the IT-^erfonnance rela-tionship that is observed after certain time lags. Such a relationship may not beevident in cross-sectional or snapshot data analyses. Also, results indicate support forthe impact of technology contingent on BPR practiced by hospitals.
KEY WORDS AND PHRASES: business process reengheering, health-care infonnationsystems, infonnation technology payoff, information technology productivity.
CHANGES IN THE HEALTH-CARE BUSINESS RESULTING FROM CAPITATION and de-
clining reimbursement have led to cost-cutting measures through improved opera-tions. In some cases, failure to cut costs threatens the fmancial viability of health-care organizations. While on the one hand investment in IT is seen as an enabler ofefficiency and competitiveness, it is also a significant fmancial investment that, if notlinked to improved organizational performance, can hasten the decline of an organi-zation. Given this scenario, the issue of IT payoff has come under close scmtiny.
While IT payoff has long been a subject of research and intense discussion, theresults have been far from conclusive [1,63]. Payoffs from IT have been and continueto be open to debate in the literature, where it is called the "IT productivity paradox"[9, 12, 14, 74]. An issue that has led to the ongoing debate is inadequate methodol-ogy applied in researching the IT payoff. Perhaps the most serious issue in measuringorganizational performance resulting from IT has been that IT payoff is considered inisolation and separate from other organizational practices.
To some extent, the success of IT implementation is contingent on the organization'senvironment, such as quality indicators resulting from process redesign initiatives, inaddition to financial indicators. To this effect we will demonstrate this contingencyperspective using the nature and extent of process-redesign initiatives within health-care organizations. This study aims to synthesize the literature from IT effectiveness andprocess redesign by developing a set of propositions. Through a rigorous analysis, wewill test these propositions using empirical data collected for the purpose from a set oforganizations. This study proposes to contribute to the literature by investigating pay-offs from IT investments over time, impact of IT investments on quality indicators, andimpact of process redesign and IT investment on both profitability and quality.
Literature and Research Propositions
THIS SECTION PRESENTS AN OVERVIEW OF THE RELEVANT LITERATURE to frame ourpropositions linking technology and process reengineering with profitabilityand quality. We also draw on contingency theory to support the combined effectof technology and process reengineering on organizational performance. Based onthe literature review and the empirical data collected, we test our data against fourpropositions.
IT PAYOFF IN THE HEALTH-CARE INDUSTRY 43
Technology-Profitability Connection—^The "IT Paradox"
Table 1 lists selected studies that have measured the impact of IT on profitability. Thestudies differed in the level at which data were collected for analysis—that is, the economylevel, industry level, or firm level. At the economy level, Baily [4] found that productiv-ity declined in the 1970s, while it grew in the prior two decades. Interestingly, thedecline took place during a period that incurred a significant investment in IT. A similarpattem of decline was observed during the 1970s through 1992. Roach [55] con-firmed this decline in productivity by measiuing the productivity of informationworkers against that of production workers. While the output of production workersincreased by 16.9 percent during the 1970s through the mid-1980s, the output ofinformation workers dropped by 6.6 percent during the same period. In terms ofinvestment, this trend is discouraging because of the high cost of information work-ers and the steady growth in their ranks over production workers. In the manufactur-ing segment of the economy, it was determined that for every dollar invested in IT, a$0.80 margin was realized [48]. A later study at the industry level also foimd that ITinvestment does not lead to greater productivity than other types of investment [48].
Two studies from Asian countries show some positive results in productivity re-sulting from IT investment. Tam found that from 1983 to 1991, one of the threeresearched countries' economies had positive and excess retums resulting from in-vestment in IT. However, productivity was measured by increase in computer capitalstock [65]. The results of a study of 12 Asian-Pacific countries found significantpayoff resulting fi-om IT investment and challenge the "IT paradox." This study,conducted during 1984—90, indicates significant positive correlation between growthin IT investment and growth in both GDP and productivity. It finds that those coun-tries with higher growth rates in IT investment achieved consistently higher growthrates of GDP and productivity [40].
It should be noted that, although several studies are listed as industry-level, theywere conducted across several industries, thus encompassing a significant part of theeconomy. The industry-level studies have also found mixed results of payofiFfrom ITinvestments. While some studies found that IT investment, productivity, and growthwere positively correlated [35,39,42], others found no significant relationship [8,39].
The results of the firm-level studies generally show a positive IT-productivityrelationship. As at the economy and industry-level studies, some firm-level studiesalso show no evidence of IT payoff. In two such studies Strassman foimd no correla-tion between IT investment and productivity or profitability [63, 64]. Sometimes,even when IT spending is shown to improve intermediate variables of organizationalproductivity such as improved communication leading to the need for reduced in-ventories [20], it does not necessarily lead to improvements in productivity [7].However, in a firm-level study Brynjolfsson found that firms that reengineered weresignificantly more productive than their competitors [10].
In a study of U.S. retail banking, IT capital investment was found to have no realbenefits. However, this study concluded that there were high retums from investmentin IT labor [52]. A recent study has found that investments in IT capital are a net

44 DEVARAJ AND KOHLI
Table 1. A Summary of Selected Studies at the Economy, Industry, and Firm Level,and Key Findings
Study
Baiiy [4]Roach [55]
Morrison and Bemdt [48]Kraemer and Dedrick[40]
Jorgenson and Stiroh[33]
Tam [65]
Siegel and Griliches [60]
Brendt and Morrison [8]
Kelley [35]
Lehr and Uchtenberg[42]Koski [39]
Strassmann [64]
Dudley and Lasserre[20]
Strassmann [63]
Banja, Kriebel andMukhopadhyay [7]
Diowert and Smith [19]Hitt and Brynjolfsson[30]Brynjolfsson [9]
Prasad and Harker [52]
Dewan and Min [17]
Mukhopadhyay, Rajivand Srinivasan [49]
Levelof study
EconomyEconomy
EconomyEconomy
Economy
Economy
Industry
Industry
Industry
Industry
Industry/fimi
Firm
Firm
Firm
Firm
FirmFirm
Firm
Firm
Firm
Firm/appiication
Result
i
4.t
i ^
4.4.T
t 1̂
t
t
<-»
<->
«->
«-»
tt
t
t
r
Key fmdings
Productivity growth declined in the 1970sOutput of the information work dropped whilethat of the production work increased during the
odiiit? pmiuuIT does not lead to improved profitabiiityIT investnnent in 12 Asia Pacific countries had asignificant positive correlation with growth inboth GDP and productivity between 1984 and1990.Productivity growth dropped from 1.7% per yearfor the 1947-73 period to about 0.5% for the1Q71_jQ9 rmrinriI9/O—9£ pBriouIT investment in firms led to positive and excessreturns (1983-91) in one of the threeeconomies (Hong Kong, Singapore, andMalaysia)IT investment and productivity growth have apositive correlationIT investment does not lead to any greaterproductivity then other types of investmentIT investment (in programmable automationtechnology) leads to significant efficiency
dU Vdi 1 lay oIT intensity and productivity growth during theperiod 1987-82 are strongly correlatedIT investment by firm's use of advancedcommunications technologies and its outputand productivity have no positive relationshipNo correlation between IT and return oninvestmentIT spending to improve communication andinformation reduce the need for inventories.Profitability link was not mentioned.No relation between IT spending, profits, andproductivityIT was positively related to some intermediatemeasures of profitability, but that the effect wasgenerally too small to measurably affect finaloiitniituuipui.IT led to large productivity gainsIT led to increased productivity and consumersurplus, but not higher profitabilityFirms that had reengineered were significantlymore productive than their competitorsAdditional capital investment in IT may not havereal benefitsIT capital is a net substitute for ordinary capitaland labor, i.e., IT investment leads to higherreturnsIT investment leads to higher productivity andquaiity
substitute for ordinary capital and labor capital, that is, IT investments lead to greaterreturns as compared to same level of investment in other forms of capital [17]. An-other recent study at the application level of a firm in the U.S. Postal Service foundthat investments and use of IT led to higher output of mail-sorting facilities [49]. This
IT PAYOFF IN THE HEALTH-CARE INDUSTRY 45
points to a key nuance that investments in IT have to be coupled with the actual useof IT. It is usually assumed, perhaps erroneously, that increased investments in IT leadto increased usage of IT.
The literature on the subject of the IT paradox and why IT has not shown signifi-cant value is comprehensive and provides a basis for explaining some of the incon-sistency and also offers valuable guidance for future research. Research designs havevaried from a cross-section of performance variables to longitudinal data. The dura-tion of data collected and the design of studies also vary significantly. Some researchdesigns gathered data at a point in time for research relationships between productiv-ity and IT investment [53] or three to five annual data points [7, 17,30, 52]. Withoutsufficient control variables, annual aggregation of data may fail to account for otherinfluences or factors that can affect the firm. Furthermore, three or five data pointsmay not be sufficient to establish a trend for IT payoff, especially when there are lageffects resulting from IT investment and noticeable payoffs. A data set that includesquarter-level data for three to five years, combined with the corresponding controlvariables, would flimish sufficient data points and provide meaningful results [49].
Although the variety in variables for IT payoff adds diversity to the question of ITpayoff, it is also likely to lead to inconsistent research designs, thus hampering thedevelopment of a research tradition in this growing field. Table 2 provides a sam-pling of recent firm-level studies, variables studied, the duration of the study, and thekey findings.
Based on the literature presented above, the connection between IT investmentsand payoff is not very conclusive. This may be due to factors related to level of study,variables selected, and research design. We attempt to address some of these con-cems, beginning with our first proposition:
Proposition 1: Investment in information technology leads to increased profit-ability of the organization.
Technology-Quality Relationship
One potential explanation for the mixed results of IT payoff is that the variablescollected have varied among the published studies. Financial variables such as re-tum on assets (ROA) [30] and retum on investment (ROI) have generally been themainstay for dependent variables, while capital, labor, operating expenses, and rev-enues have been widely used as independent variables for investigating IT payoffwithin organizations [17, 30, 52]. For the control or independent variables, somestudies have gathered operational measures such as inventory tumover [7] and asso-ciated costs [19] to study the impact of IT.
Other studies have gathered organizational variables such as absenteeism, degreeof supervision [49], employee composition [24], and number of years the CIO hasbeen in the position with the organization [53] to study the IT payoff for the firm.Even the issue of whether uniformity of variables is preferred has been debated in theIT effectiveness literature [58]. Health-care profitability studies have gathered inde-pendent variables that represent ownership type before and after the prospective

46 DEVARAI AND KOHLI VTable 2. A Summary of Firm-level Studies, Variables Used, Duration of the Study,and Key Findings
Study
Barua, Kriebel, andMukhopadhyay \7]
Diewert and Smith [19]
Hitt and Brynjolfsson[30]
Prasad and Harker [52]
Dewan and Min [17]
Mukhopadhyay, Rajivand Srinivasan [49]
Prattipati and Mensah[53]
Francalanci and Galal[24]
Variables used
Capacity utilization.inventory tumover.quality, relative price.and new productintroductionInventory holding costs.growth rate, purchases,sales, inventory levelsValue added, IT stock.noncomputer capital.ROA, labor expense.ROE, shareholderreturn, ITstock/employee, capitalinvestment, salesgrowth, market share.debt, R&D stock firmIT capital, non-IT capital.IS labor expense, non-IS
lauor expenseIT capital, non-IT capital.labor expense, valueadded, sales, number ofemployeesTotal output, on-timeoutput, labor hours.machine hours, level ofautomation.absenteeism rate.
uegruo 01 supBrvisionNumber of years CIO inthe position, proportionof software resourcesspent on client serverapplications, percentageof software budget spenton new development.IT investments, clerical.managerial, andprofessionalcomposition, income peremployee, totaloperating expense
* Variable names changed to generic.
Duration
Annual over 3years
Ouarterlyover sixquartersAnnual over5 years
Annual over 3years
Annual over 5years
39 accountingperiods over3 years
One year
10-yearperiod
Key findings
IT was positively related to someintermediate measures ofprofitability, but that the effect wasgenerally too small to measurablyaffect final output.IT leads to large productivity gains
IT leads to increased productivityand consumer surplus, but nothigher profitability
Additional capital investment in ITmay not have real benefits
IT capital is a net substitute forordinaiy capital and labor, i.e., ITinvestment leads to higher retums
IT investment leads to higherproductivity and quality
Highly productive firms spent moreon client-server and less on in-house application development
Increases in IT expenses areassociated with productivitybenefits when accompanied bychanges in worker composition)
payment system (PPS) [25], and not-for-profit status [16]. Past studies in health carehave used a niunber of hospital-related variables in addition to fmancial measures todetermine those factors that affect the profitability of hospitals. Such measures in-clude patient mix, average length of stay (ALOS) of patients, and Herfindahl index ofmarket concentration [71]. Table 3 summarizes studies that have used organizationalvariables to measure IT payoffs.
The topic of quality has gained renewed importance as a management concept andis often supported by significant investments in IT. There is evidence that firms thathave won quality awards outperform similar firms in operating-income-basedmeasures. Furthermore, high-quality firms also are better at controlling costs [29].Therefore, quality variables are often considered in research on IT payoff [50, 73].

IT PAYOFF IN THE HEALTH-CARE INDUSTRY 47
Table 3. A Summary of Studies Utilizing Oiganizational Variables to Meastire ITPayoff, and Key Findings
StudyOrgatiizational
variables Key findings
Willcocks and Lester [73]
Anderson, Fomell and Rust [2]
Antonelli [3]
HendricksandSinghal[29]
Myers, Kappelman, and Prybutok150)
Francalanci and Galai [24]
Measurement and evaluation ofquality Improvement
Customer satisfaction andproductivity
Diffusion of IT, effects on tfietradability, divisibility andtransportability of infonnation, andinteraction between receptivity eindconnectivity of leaming agents
Operating income, assets, sales,costs, quality award
Quality—service, system,information; Impact—individual,work group, organizational; Usage,user satisfaction
Worker compensation, ITexpenditure
Grover, Teng, Segars, and Fiedler[28] ^
Pinsonneault and Rivard [51]
Teo and Wong [67]
fvlature and magnitude ofrelationships between IT diffusionand process redesign
IT investment andmanagerial work
Information quality and workenvironment
Elements in the uncertainty aboutthe IT payoff relate to deficienciesin measurement at the macroeco-nomic level and weaknesses Inorganizational evaluation practice
Changes in customer satisfactionand cnanges in productivity ispositive for goods, but negative forservices(1) strong conflation between thelevels and rates of growth in theuse of communication andbusiness services, (2)Theproductivity enhetncing effects ofthe co-evolution in the use ofbusiness and communication.
Firms that have won qualityawards outperform other similarfirms in operating-income basedmeasures. Quality award winningfirms also control costs better.
A comprehensive contingencymodel for eissessing the ISfunction should include environ-mental varieibles such as industry,competition, economy; andorganizational variables such asIS budget, size of IS function,maturity of IS function, topmanagement support.
Increases In IT expenses areassociated with productivitybenefits when accompanied bychanges in worker compositionProcess redesign and IT have acomplex relationship withproductivity, and that these can berepresented by a mediating ormoderating nwdel for differenttechnologies
Heavy IT users paid greaterattention to and spent more timeon the infonnation relatedImprovement in work environmentis positively related to ITorganizational impact but not tomanagerial satisfaction.
Business process redesign or reengineering (BPR), related to the quality principles, hasalso been examined in relation to IT spending and productivity of organizations [28].
With increased competition and the focus on satisfying customer needs, customersatisfaction is also being researched in IT payoff studies. Health-care and other ser-vice organizations do not have the luxury of traditional quality control to ensureproduct quality prior to delivery, as in manufacturing organizations [21]. Therefore,patients' satisfaction is surveyed to assess the quality of services. Patient satisfactiondata have become more important and are now considered one of the outcomes ofcare. Results of patient satisfaction are also used to identify protocols of care that
48 DEVARAJ AND KOHLI
result in prefened clinical outcomes, lower costs, and the highest level of patientsatisfaction [26,38].
Thus, there is reason to believe that, in addition to the impact of technology onprofitability ofthe organization, the impact of technology on the quality of servicesrendered is of equal importance. Thus, our second proposition outlines the technol-ogy-quality connection:
Proposition 2: Investment in information technology leads to improved qualityof products or services as assessed by measures of customer satisfaction andservice or product quality.
Process Reengineering
While IT payoff continues to be investigated, there have been attempts to createstrategies and frameworks that reinterpret or explain contradictory results from pastresearch. Robey [56] presents a number of strategies that suggest scrutinizing thedata from past studies and correlating similar studies to examine commonaltiesamong research sites and samples. Another suggestion is to "widen the lens" andexamine the results of IT payoff in the context of political theory, organizationalculture, institutional theory, and organizational leaming theory. Each theory exam-ines organizational change as a process. A process theory view of IT and businessvalue is also proposed by Soh and Markus [62], who suggest that IT use and know-how are intermediate outcomes and require further research. The process theorymodel suggests that investment in IT projects, applications, and skill base representcreation of IT assets in an organization. Successful deployment of IT assets leads toIT impacts such as redesigned processes, improved decision making, and improvedcoordination [22, 37]. It is only when IT impacts are at strategic places in the orga-nizational structure that we will see enhanced organizational effectiveness. It is thisorganizational effectiveness that most studies have examined through the selectionof fmancial and productivity variables. Soh and Markus argue that, between the ITassets and organizational effectiveness, there can be many "losses" that prevent theorganizations from realizing a payoff [62]. The process view of IT payoff is alsoechoed by Mooney, Gurbaxani, and Kraemer in their fi-amework proposing thatfirms derive business value from intermediate operational and management pro-cesses. They classify these processes along automational, informational, and trans-formational dimensions. As IT continues to permeate the organization, it has a greaterimpact on the processes and eventually on the organization [47].
Although most BPR is done with the customer in mind, organizations have real-ized benefits from BPR ranging from financial benefits to customer satisfaction andgrowth sustenance. CIGNA Corporation, a multinational, leading provider of insur-ance and fmancial services, successfully completed a number of BPR projects andrealized savings of $100 million. For every $1 invested in BPR, it got back $2 to $3in benefits. CIGNA accomplished these savings while achieving improvements in cus-tomer satisfaction and quality of services. In investigating how CIGNA achieved theseresults, the case study found that the success in BPR was accomplished by affecting

IT PAYOFF IN THE HEALTH-CARE INDUSTRY 49
changes in the organizational structure and its business practices. The organizationredesigned and created self-focused teams and trained generalists to handle customerservice. Business practices such as enterprise-wide metrics, application of skills whereadded value was achieved, and a common view of the customer were implemented [15].
Charles Schwab and Co., an investment broker, reengineered the "cashiering" pro-cess to standardize the flow of incoming and outgoing funds across multiple invest-ment lines [44]. Similarly, Florida Power and Light (FPL) was awarded the Demingprize for its quality initiatives and reaped significant savings by developing value-added processes [57].
Our third proposition, thus, is:
Proposition 3: Organizational factors, such as business process redesign (BPR),have a positive impact on measures of organizational profitability and quality.
Fit Between Technology and Process Reengineering
The imderlying premise in "contingency theory" is the proposition that organizationalperformance is the result of a "match" or 'Tit" between factors [69, 70]. Better perfor-mance is realized when there is a good fit, or congruency, between these factors, and nototherwise. In the context of technology investments, contingency theory would suggestthat, while technology and organizational practices (such as BPR) may have separateimpacts on performance, the two together may also affect performance significantly.In other words, the impact of technology on performance is contingent on whetherother organizational processes, such as BPR, were also implemented.
Van de Ven and Drazin stated that one approach to capture the fit between factors incontingency theory is through "interaction" terms [69]. According to Venkatraman,such an interpretation of fit would be consistent with "fit as moderation" [70]. From thisperspective, the impact of a predictor variable on performance depends on the level of athird variable. In our context, we posit that the impact of technology on performancedepends also on the level or degree of BPR implementation in the organization.
Contingency theory and the notion of "fit" received substantial analytical rigorwith Milgrom and Roberts's detailed and analytical examination of fit using themathematics of complementarity [45]. In terms of complementarity theory, activitiesare complements if doing (more of) any one of them increases the retums to doing(more of) the others. Specifically, we contend that doing more of BPR increases theretums of investing in technology.
Also drawing upon notions of complementarity, Barua et al. presented a theorycalled business value complementarity. One of the arguments based on this theorywas that investments in IT and reengineering cannot succeed in isolation [5]. Sincetechnology and business processes were viewed as complementary factors, they mustbe changed in a coordinated marmer to improve performance.
The operationalization of the fit between technology and process redesign is aninteresting question. The literature offers various forms or perspectives of fit and theanalytical operationalization varies according to the form of fit proposed. The per-

50 DEVARAJ AND KOHLI
spective that best fits our characterization of the concert between technology andBPR is that of "fit as interaction," since we hypothesize that environments that havesignificant technology investments if coupled with significant BPR initiatives willrestilt in improved organizational perfonnance. According to this approach, the fitbetween technology and BPR is tested using the cross-product or interaction be-tween the variables for technology and BPR. If the interaction term is statisticallysignificant, after the main effect of technology and BPR is taken into account, thereis evidence that the fit between these two factors matters.
Based on contingency and complementarity theory prescriptions, otu- fotuth andfinal proposition is:
Proposition 4: The interaction between technology investment and BPR initia-tives undertaken by the organizations will have a positive impact on perfor-mance. In other words, the impact of technology on performance is higher inorganizations where there is a high degree of BPR implementation and lower inorganizations where there is lesser BPR implementation.
Research Design
THE HOSPITALS INCLUDED IN THIS STUDY ARE MEMBERS OF A HEALTH SYSTEM. The
health system is a national organization with member hospitals in various marketsacross the United States. Each hospital is an independent legal entity, each with itsown board and financial statements. The member organizations ofthe health systemhave combined beds of over 4,000, employ about 20,000 people, and have a totaloperating revenue of approximately $1.5 billion. Most of the hospitals have beenproviding health care for over a hundred years. The hospitals provide a range of servicesincluding acute-care hospitals, extended-care facilities, residential facilities for the dis-abled and elderly, occupational medicine, and community service organizations.
Our research design, called panel data, consists of data across hospitals as well asover time. As a meastire of investment in IT, we collected data for 36 monthly periodsfVom eight hospitals of the health system that had recently implemented a decisionsupport system (DSS) to help evaluate contracts. These contracts estimate costs ofexpected services and compare them with expected payments. The DSS also helpsidentify areas of cost-cutting and operational improvements necessary for the hospital'sfmancial viability.
The cross-sectional set of hospitals combined with time-series data is ideal forexamining the effect ofthe usage of IT on measures of profitability and quality, whileat the same time controlling for various other factors.
Decision Support Systems (DSS)
Decision support systems (DSS) are computer systems designed to help improve theeffectiveness and productivity of managers [34]. DSS deliver models that can be usedsystematically to evaluate policies and alternatives [22]. Conventional hospital in-

IT PAYOFF IN THE HEALTH-CARE INDUSTRY 51
formation systems help meet the challenge by providing data necessary for policyfonnation and outcome measurement. However, integrating those systems with DSScan help managers gain insight into the operations, consider alternatives, and de-velop business strategies.
Combined with cost information, DSS can be used for operational, managerial, andstrategic decision-making. Operational decision-making includes resource alloca-tion, activity-based costing, and such decisions that improve the operations at thepatient-care level. Managerial decision making includes cost containment, overallprofitability of the department, and integration of departmental services with thoseof other departments. Strategic uses of a DSS can involve contracting decisions,pricing decisions, and merger/ acquisitions planning [38].
In the organizations included in our study, the DSS plays a critical role in theanalysis of data and the identification of areas for BPR. The DSS serves as a reposi-tory for the financial, clinical, and quality outcomes for each patient admitted to anyof the hospitals for the past several years. Each patient record contains as many as 400fields describing the status of the patient from the time of admission to discharge.Furthermore, the DSS database is designed to store day-of-stay data; for example, theDSS database can supply infonnation that a certain number of aspirin tablets weregiven to a cardiac patient on the third day of stay. The DSS data are analyzed toidentify "best practices" to be emulated by other hospitals. Benchmarking data arepurchased from commercial organization and stored in the DSS, so decision makerscan measure their performance with national and regional health care organizations.
With this level of information, the managers are able to conduct analysis of theimpact of fmancial and clinical changes to the patient population. The DSS is also acompetitive tool in conducting "what-if' analysis to assess the profitability of con-tracts for a given patient population.
Dependent Variables
Measures of Profitability and Quality
Following previous studies in hospital profitability [27, 41, 59, 68], we chose rev-enues as a measure of profitability. Traditionally, profitability measures call for sub-tracting costs from revenue. However, in health care this task is made difficult for thefollowing reasons: (1) most hospitals lack accurate cost accounting systems andoften use a constant ratio of cost to charges (RCC) to determine the cost of services.Thus, RCC does not facilitate the analysis of IT payoff as it is a direct transformationof revenue. (2) Costs are also affected by varying contractual agreements—that is,discounts offered by hospitals to insurers, and write-offs toward charity care. Each ofthese deductions can convolute the traditional profitability measures. (3) With theincrease in managed health care, premium revenues are considered as profits andexpenses are treated as a charge against such profits. On the other hand, revenues arenot aifected by contractual agreement with insurers, patients' ability to pay, or withmanaged health care.
52 DEVARAJ AND KOHLI
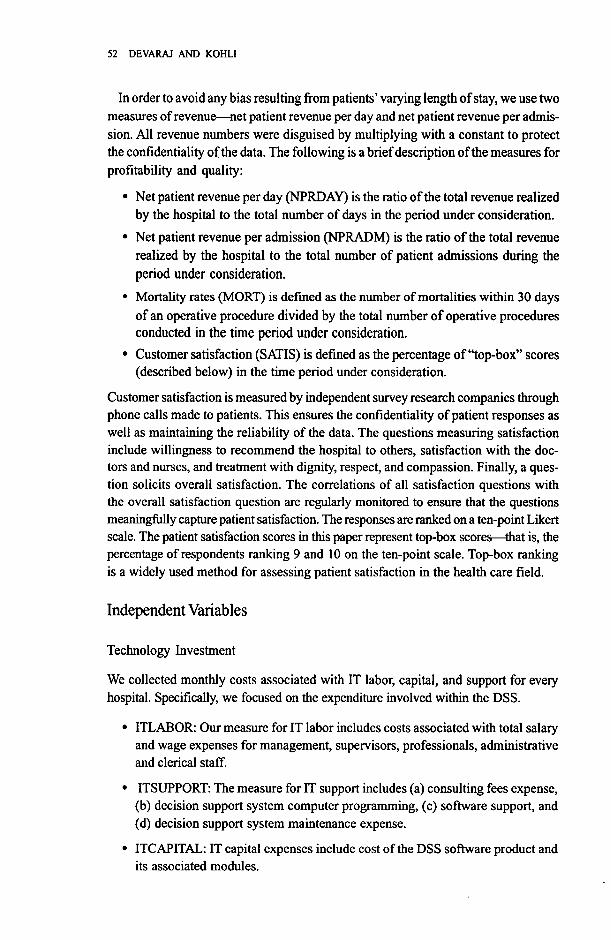
In order to avoid any bias resulting from patients' varying length of stay, we use twomeasures of revenue—net patient revenue per day and net patient revenue per admis-sion. All revenue numbers were disguised by multiplying with a constant to protectthe confidentiality ofthe data. The following is a brief description ofthe measures forprofitability and quality:
• Net patient revenue per day (NPRDAY) is the ratio ofthe total revenue realizedby the hospital to the total number of days in the period under consideration.
• Net patient revenue per admission (NPRADM) is the ratio ofthe total revenuerealized by the hospital to the total number of patient admissions during theperiod tinder consideration.
• Mortality rates (MORT) is defmed as the number of mortalities within 30 daysof an operative procedure divided by the total number of operative proceduresconducted in the time period under consideration.
• Customer satisfaction (SATIS) is defmed as the percentage of "top-box" scores(described below) in the time period under consideration.
Customer satisfaction is measured by independent survey research companies throughphone calls made to patients. This ensures the confidentiality of patient responses aswell as maintaining the reliability ofthe data. The questions measuring satisfactioninclude willingness to recommend the hospital to others, satisfaction with the doc-tors and nurses, and treatment with dignity, respect, and compassion. Finally, a ques-tion solicits overall satisfaction. The correlations of all satisfaction questions withthe overall satisfaction question are regularly monitored to ensure that the questionsmeaningfully capture patient satisfaction. The responses are ranked on a ten-point Likertscale. The patient satisfaction scores in this paper represent top-box scores—that is, thepercentage of respondents ranking 9 and 10 on the ten-point scale. Top-box rankingis a widely used method for assessing patient satisfaction in the health care field.
Independent Variables
Technology Investment
We collected monthly costs associated with IT labor, capital, and support for everyhospital. Specifically, we focused on the expenditure involved within the DSS.
• ITLABOR: Our measure for IT labor includes costs associated with total salaryand wage expenses for management, supervisors, professionals, administrativeand clerical staff.
• ITSUPPORT: The measure for IT support includes (a) consulting fees expense,(b) decision support system computer programming, (c) software support, and(d) decision support system maintenance expense.
• ITCAPITAL: IT capital expenses include cost ofthe DSS software product andits associated modules.

IT PAYOFF IN THE HEALTH-CARE INDUSTRY 53
Nature of BPR Initiatives
rII III ii
Category of BPR
Figure 1. The Nature of BPR Initiatives
Implementation of Business Process Redesign (BPR)
In health care, the application of BPR has generally focused on cost reduction ofclinical and administrative processes [66]. BPR can assist in reengineering patientcare by identifying practice pattems that lead to reduced costs, improved qualityoutcomes, and higher patient satisfaction. These practice pattems, also called treat-ment pathways, in tum lead to reengineered patient care.
The BPR projects in the organization were focused in a number of areas. These canbe categorized in five major areas indicated in the histogram in figure 1. Most initia-tives were for improving the quality of outcomes of hospital care. With increased costcutting, the quality of outcomes such as the length of stay, infection rates and ex-pected versus actual mortality rates are being carefully examined. The second largestnumber of BPR projects were applied to improve decision-making. An example ofimproved decision-making is developing a treatment regimen for heart attack pa-tients that leads to the highest survival and rehabilitation rate. Cost containmentinitiatives include administrative as well as clinical scenarios. The best-quality andlowest-cost physicians for the expensive procedures, such as heart bypass surgery, areidentified. The treatment protocols of such physicians are compared with those ofother physicians. The breakdown of costs of drugs, prosthetics, and lab tests is thenshared with the physician committees. Similarly, patient wait times in the emergencyroom were studied, and a BPR initiative to install an information system to commu-nicate lab results efficiently to the physician was undertaken.
Process improvement projects were applied in various administrative areas. Giventhat the reimbursement for patient services is dependent on the accurate coding ofdiseases and procedures, the process of coding was examined and improved for fairreimbursement from payers. A few BPR projects were initiated to explore and supportnew services being provided to physicians and patients, some of which had beenoutsourced in the past.
Over the period of study for the hospitals in our sample the maximum number of

54 DEVARAJ AND KOHLI
BPR initiatives under way was 18, the minimum was 4, and the average was 12.8.Given that our study encompassed 77 BPR projects, space considerations prevent usfrom providing greater detail. Additional detail on the BPR projects is available fromthe authors.
The following is a detailed example for establishing standards and expected costsavings for knee and hip procedures classified as a Diagnostically Related Group(DRG) 209. From the historical data, we compare actual verstis expected costs (frombenchmarking) for severity-adjusted DRG 209. Then, a breakdown ofthe total costsat the departmental level with a focus on high-cost departments is presented to theprocess engineer. This information is fiirther broken down into individual chargeitem groups such as supplies, room charges, and other high-cost items. In addition,median cost by departments serving DRG 209 are also calculated. Costs above themedian are identified by department and by physician(s). Finally, savings opportuni-ties are identified by bringing the practice pattems to median and benchmark levels,and patient care is reengineered. Other clinical applications of BPR have been inareas of reducing the length of stay [22] and the turnaround time of test orders be-tween the pathology laboratory and the Emergency Department [36]. Similarly, BPRhas led to improvements in the billing process by reducing the number of days inAccounts Receivable and thereby improving the cash flow [23].
The empirical literature in BPR has employed various sets of measures, many ofwhich are subjective assessments of managers obtained through surveys. Neverthe-less, a common theme among BPR studies is cost reduction and process-timereduction. Because ofthe diversity of physician practice pattems, process stepsor process times in health-care organizations are studied in the light of potentialcost reductions.
We conducted in-depth interviews with managers to get their assessment of anappropriate measure of BPR effectiveness. The managers' assessment indicated that,while there were various areas where improvement could be measured, the mostimportant measure of any BPR initiative would be its "impact on the bottom line"—in other words, the anticipated cost savings to the hospital. Therefore, we obtained anestimate ofthe potential cost savings to the organization as a result of implementinga particular BPR initiative. The BPR variable used in this study for a particularhospital for a given time period is the anticipated total cost savings of all the BPRprojects under way.
We test the proposition that the greater the extent of BPR, the greater the possibil-ity for improved performance in concert with technology usage (propositions 3 and4). This measure has the advantage that it is objective and does not rely on thesubjective judgment of any individual.
Lag Effects
In a longitudinal study the effects ofthe independent variables on performance maybe realized after a period of time. Brynjolfsson and Hitt (1998) suggest that "if thereis some lag or adjustment time required to match organizational factors and IT invest-

IT PAYOFF IN THE HEALTH-CARE INDUSTRY 55
Capital investmentin hardware& software
Ubor&Support
r
Reportsprograms
Dataanalysis
Changes inpatient
care
Financial &quality
outcomes
Figure 2. Timeline of IT Investment Impact
ments, we would expect to see more benefits over longer time periods" [11]. Simi-larly, Mahmood and Maim (1997) state, "Attempts should be made to use a time-lagged regression analysis to allow for the fact that benefits derived in a given yearmay be due to IT investments made in previous years" [44].
Specific lags vary based on the nature of the industry and the processes beingconsidered. While in manufacturing and engineering applications lag effects can bemeasured in years, the health care industry is likely to experience shorter lags due tothe nature of its business. Furthermore, the maturity of the IT infrastmcture within theorganizations can also affect the duration of lags.
Our discussions with managers at the research site suggested that investments in ITfollow a particular chronological sequence in the hospital setting. This is shown infigure 2. The first step is typically an investment in IT capital. This is followed byprocurement of software and hardware. The new infrastmcture is then used to createand mn programs and reports. This stage involves IT labor and IT support as inputs.This is followed by member organizations (hospitals) making changes based on theresults of the earlier step. This leads to changes in patient care that eventually lead tobetter performance on financial and quality outcomes.
Managers were also of the opinion that "investments in IT labor may yield resultsin terms of improved performance about 2—3 months later due to lead times involvedwith the technology being in place prior to the programming staff developing theapplications." Thus, we chose to incorporate a time lag of three time periods for ITlabor and support in our analyses. Since capital enters the equation earlier along thetime line (figure 2), we included a four-period lag for IT capital.
Our measure for BPR initiatives captures the anticipated cost savings resultingfrom BPR implementation. The infrastmcture to support such an initiative is alreadyin place, and months of careful plarming have already taken place. This is in contrastto startup organizations where the infrastmcture deployment can take several monthsor even years. Thus, in our case it seems reasonable to expect that retums from BPRmay be realized without much delay. This was also supported by managers who wereresponsible for implementing these initiatives. One manager stated that "the im-pact resulting from the change in practice pattems will appear shortly, approxi-mately 2 months in most cases, because revenue is booked right after the patientis treated. Therefore the lags are primarily due to the physicians incorporatingthe new process into practice and the time involved in compiling medical andbilling records." Therefore, we employed a two-pwiod lag on the BPR variable.

56 DEVARAJ AND KOHLI
BPR Studies in clinical settings suggest lag effects of four to six months. Shorterlead times in clinical settings can be ascribed to the implementation of "evidence-based practice" that promotes making immediate process changes based on pub-lished clinical evidence [61]. For example, process changes in the emergency depart-ment resulted in a reduction of laboratory utilization with a lag of six months [18]. Inan intensive care tmit (ICU), respiratory itifections were reduced significantly after alag of four months of a BPR initiative [31]. Implementation of practice guidelines toreduce lab tests. X-rays, and EKG exams resulted in improved process and outcomesin less than six months [72].
Control Variables
Conceivably, the perfonnance of hospitals can be affected by a number of variablesother than the investment in IT and process redesign. Therefore, we conducted anextensive literature siurey of projects on determinants of health care productivityand profitability. The list and labeling of control variables that we employ in ourstudy reflect the extant literamre in health care management [27, 41, 59, 68].
• Service index (CASEMIX): The service index or the casemix index is a meastu-eof the range of services offered by the hospital. The higher this measure, themore complex the services rendered by the hospital.
• Labor intensity (FTE): The number of full-time employees per patient day pro-vides a measure of labor intensity. The relationship between personnel effi-ciency and profit margins has been of interest to health-care-management re-searchers and thus should be controlled for.
The next two variables assess the extent to which services offered by the hospitalwere provided to Medicare and Medicaid patients. The reasons for controlling forthese effects were: (1) Medicare and Medicaid payments are typically less than pay-ments from other payers for similar services, and (2) Medicaid and Medicare patientsare more costly to treat than other patients [27].
• Medicare (MEDICARE): Percentage of admissions that are Medicare patientscompared to total admissions;
• Medicaid (MEDICAID): Percentage of admissions that are Medicaid patientscompared to total admissions;
• Outpatient mix (OUTPATNT): There is a general belief in health care manage-ment that outpatient services are more profitable than inpatient services. Tocontrol for the existence of any such effect on profitability, we include the ratioof outpatient revenue to total revenue as a control variable.'
• Per-capita income (INCOME): It is conceivable that with higher patient in-comes, hospitals may be able to charge more for their services as well as lose lessdue to bad debts. For this reason, we included the per-capita income of region/market for each ofthe hospitals in the analyses.
A summary of all the variables employed in this study is shown in Table 4.

IT PAYOFF IN THE HEALTH-CARE INDUSTRY 57
Table 4. Definition of Variables
Variable name Definition
NPRDAY, Net patient revenue per day for hospital /during time period tNPRADM^ Net patient revenue per patient admission for hospital /during
period tMORT,, Patient mortality for hospital /during period tSATIS, Customer satisfaction performance for hospital /during period tITLABOR, IT labor expenses for hospital /during period fITSUPPORT, IT support expenses for hospital /during period /ITCAPj IT capital expenses for hospital /during period tBPR, Measure of fhe extent of anticipated BPR impact for hospital /
during time period tCASEMIX, Case mix for hospital /during time period tFTE,, Number of f ull-f ime employees at hospital /during time period tMEDICARE, Percent of Medicare admissions at hospital /during time period tMEDICAID, Percenf of Medicaid admissions at hospital /during time period tINCOME, Per-capita income of the region/market for hospital /during time
period/OUTPATNT, Ratio of outpatient revenue to total revenue for hospital / during
time period f
Estimation
W E EMPLOY TIME-SERIES MODELS TO ESTIMATE THE EFFECT of technology andBPR implementation and their combined effect on various measures of performance.These time-series models account for longitudinal correlation or correlations overtime. Equations (1) through (4) were estimated to examine the relationship betweentechnology and performance while at the same time controlling for various extrane-ous factors through the use of control variables:
(1)NPRADM = po + p 1 ITLAB0R(3) + P2 ITSUPP0RT(3) + p3 ITCAPITAL(4)
+ p4 BPR(2) + p5 ITLAB0R(3) * BPR(2) + p6 ITSUPP0RT(3) * BPR(2)+ P7 ITCAPITAL(4) * BPR(2) + p8 CASEMX + p9 FTE + p 10 MEDICARE
+ P11 MEDIC AID + p 12 OUTPATNT + P13 INCOME.
(2)NPRDAY=po + p 1 ITLAB0R(3) + p2 ITSUPP0RT(3) + p3 ITCAPITAL(4)
+ P4 BPR(2) + P5 n'LAB0R(3) * BPR(2) + P6 ITSUPP0RT(3) * BPR(2)+ P7 ITCAPITAL(4) • BPR(2) +p8 CASEMDC + p9 FTE + p 10 MEDICARE
+ pi 1 MEDICAID + pi2 OUTPATNT + pl3 INCOME.
(3)MORT = po + p 1 ITLAB0R(3) + P2 ITSUPP0RT(3) + P3 ITCAPITAL(4)+ P4 BPR(2) + P5 ITLAB0R(3) * BPR(2) + p6 ITSUPP0RT(3) * BPR(2)

58 DEVARAJ AND KOHLI
+ p7 ITCAPITAL(4) * BPR(2) + p8 CASEMIX + p9 FTE + plO MEDICARE-H pi 1 MEDICAID + p 12 OUTPATNT -H pi3 INCOME.
(4)SATISF = pO + pi rrLAB0R(3) + p2 ITSUPP0RT(3) + P3 ITCAPITAL(4)+ P4 BPR(2) + P5 rrLAB0R(3) * BPR(2) + P6 ITSUPP0RT(3) • BPR(2)
+ p7 ITCAPITAL(4) * BPR(2) + p8 CASEMIX + P9 FTE + p 10 MEDICARE+ pi 1 MEDICAID + p 12 OUTPATNT + pl3 INCOME.
Net patient revenue per day (NPRDAY) and net patient revenue per admission(NPRADM) are widely used measures of hospital profitability, while in-patient mor-tality (MORT) and customer satisfaction (SATISF) are measures of quality perfor-mance. The direct impact of investments in labor, support, and capital can be esti-mated by examining the coefficients (P1H33) associated with these terms. The impactof BPR on perfonnance is indicated by coefficient P4. Finally, the fit between ITinvestments in labor, support, and capital and BPR is indicated by the sign andsignificance of the coefficients associated with the interaction terms in the model(P5-p7). The numbers in parentheses indicate the number of time lags considered forthe respective independent variables.
Diagnostic Checks
We performed several diagnostic checks to ensure that assumptions of the analyseswere not violated. First, we captured the residuals from the analyses and tested whetherthey followed a normal distribution using the Kolmogorov-Smimov test. The/) val-ues that we obtained did not indicate a violation of the nomiality assumption. Thesecond check we performed was to test for nonconstant variance or heteroscedasticityusing White's test. The results did not suggest any issues. We also ensured thatautocorrelation or serial correlation was not a problem in the estimation by lookingat the Durbin-Watson statistic. Our final check was to test for the presence ofmulticollinearity. None of the variance inflation factors (VIF) was greater than thethreshold value of 10, suggesting that multicollinearity was not an issue.
Results
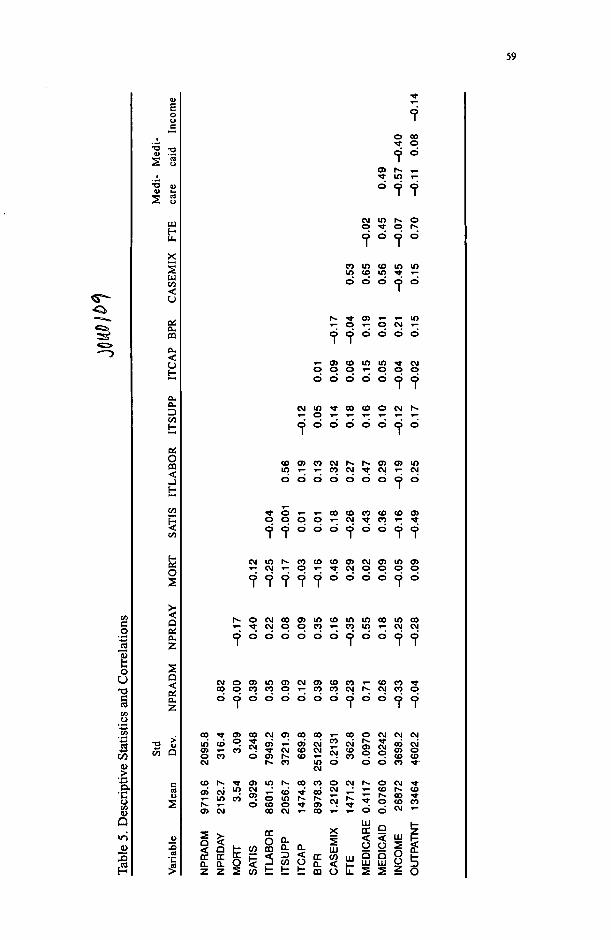
We present descriptive statistics and pairwise correlations between variables em-ployed in this study in Table 5. We observe several sigtiificant correlations betweenvariables. We limit our discussion of these correlations only to key relationshipsbecause correlations hint at relationships between variables without accounting forthe impact of the other variables. The measures for profitability are positively andsignificantly correlated with each other and also correlated with customer satisfac-tion. Investments in labor are positively correlated with support and capital, whereassupport and capital are not significantly related with each other.
The relationship between IT investments (in labor, support, and capital) and profit-ability is the subject of proposition 1. An examination of model 1 (presented in Table6) suggests that labor investment at any time period has a significant effect on net
59
I
S 0
o**—j
jrre
l
o
DA
Y
BiCL
z
cCL
o CO•* 9
cj in t̂ oo •* o h~
o d o d
n in CO min <o IO •*
h- ^ 05 »- »- inT^ O T- C3 CM ^
d d d d d dT- 05 CO in in 9 CMO O C3 T- C3 C> O
d d d d d C3 C3
O O O O O O C D O
c o o 5 c o c M h - h - o 5 a 5 i n
d d d d d d d d d
O O C 3 O O O O O O ( 3 O
h - o c M c o o 5 i n c o i n i n c o m c o
C 3 d d d d d d c 3 d d c 3 c 3
C O O C O C O O r ; C O C O C M r ^ C M C O O
dddddddddoddd
00 O) 00 O 5 c q c 0 T - c 0 p C M C M C MCO CMi n c o " - ; S c n i - O 5 C M l J c M f , , .„ _ , .
c n T - c o - t C M c o c M r j c o S S c n oO C O 0 0 5 t ^ C O » - ' T C O . . C O C OCM r * . c o m o o o c o
CM
oCM
CM
il
. o i no (O o
CO CM
(0 m a
CO t : t :
: ! ^ o
o
o
LU
oaUJ
oCO
odQ<OQlU
CM
COCOCM
UJ
Ooz
CO
CO
TNT
<
5o

60 DEVARAJ AND KOHLI
Table 6. Estimation Results for Profitability
Reference
Proposition 1
Proposition 3
Proposition 4
Control variabies
Variable
ITLAB0R(3)
ITSUPP(3)TCAP(4)
BPR(2)
ITLABOR(3)*BPR(2)ITSUPP(3)*BPR(2)ITCAP(4)*BPR(2)
FTECASEMIXMEDICAREMEDICAIDINCOMEOUTPATNT
Model R-square
Model 1Dependent
variableNPRDAY
0.005*
0.003
o.oor*0.001
-0.0010.001**0.001 *
-0.429***233.29619.75*
1978.00*-0.001
0.001
0.485
Model 2Dependent
variableNPRADM
0.027**
0.010
0.031**
-0.006
0.0090.031**0.006*
-2.16***2686.48
12973***11080**
0.263***-0.015
0.795
a. The numbers in the table represent coefficients of independent variables.b. The number in parentheses indicates the number of lags in months of the independentvariable.c. All performance data have been disguised by multiplying with a constant.*** indicates significance at the 1% level; ** indicates significance at the 5% level; * indicatessignificance at the 10% level.
patient revenue per day and net patient revenue per admission three periods later (atthe 10 percent and 5 percent levels, respectively). Also, investments in IT capitalhave an effect on both net patient revenue per day and net patient revenue peradmission four periods later (at the 5 percent level). However, we found no evidenceofthe relationship between IT support activities and profitability.
An examination ofthe coefficients associated with IT labor, support, and capital onmeasures of quality is presented in models 3 and 4 (presented in Table 7). IT laborinvestments in any given period significantly (at the 1 percent level) affect patientmortality three periods later. There was no relationship between IT capital and ITsupport investments and patient mortality. When the dependent variable is patientsatisfaction, the only significant IT component is IT capital (at the 10 percent level)with a four-period lag.
In proposition 3, we articulated the relationship between BPR and organizationalperformance. Our data analyses suggest that BPR implementations affected bothinpatient mortality and patient satisfaction as indicated by models 3 and 4. This isnot to suggest that BPR does not have an impact on fmancial measures of hospitalperformance but that the combination of BPR and IT is what really affects fmancialperformance.

IT PAYOFF IN THE HEALTH-CARE INDUSTRY 61
Table 7. Estimation Results for Quality IndicatorsMOD)
Reference
Proposition 2
Proposition 3
Proposition 4
Control variables
Variable
ITLAB0R(3)TSUPP(3)ITCAP(4)
BPR(2)
ITLABOR(3)*BPR(2)ITSUPP(3)*BPR(2)rrCAP(4)*BPR(2)
FTECASEMIXMEDICAREMEDICAID
INCOMEOUTPATNT
Model R-square
Model 3Dependent
variableMORT
-0.158***0.001
-0.004
-^ .439*
0.0060.0010.001
-4.040*19468***
-21714***1559
0.163*0.157
0.537
Model 4Dependent
variableSAns
-0.0060.0010.003*
0.047**
0.022*0.042*0.001
0.001-288.17*1488.88***2720.78***
-0.0010.011 *
0.513
a. The numbers in the table represent coefficients of independent variables.b. The number in parentheses indicates the number of lags in months of the independentvariable.c. All performance data have been disguised by multiplying with a constant.*• • indicates significance at the 1% level; *• indicates significance at the 5% level; * indicatessignificance at the 10% level.
The combined effect of BPR and investment in IT can be examined by studying thesign and significance of the interaction terms for BPR and each of the IT componentsincluded in this study. Models 1 and 2 indicate strong support for the notion of fitbetween BPR and IT support, and BPR and IT capital. We found a positive andstatistically significant relationship between these interaction terms and net patientrevenue per day and net patient revenue per admission. When the dependent vari-ables are indicators of quality performance, the interaction terms that are statisticallysignificant (at the 10 percent level) are the interaction between BPR and IT supportand IT labor on patient satisfaction.
In the estimated models for measures of profitability, the nimiber of full-time em-ployees is significantly negatively associated with performance. Medicare and Med-icaid is positively associated with performance, and income is positively related tonet patient revenue per admission. In the models for measures of quality, significantindependent variables include case mix. Medicare, Medicaid, patient income, andoutpatients. These independent variables are included in the study primarily as con-trol variables and are not the focus of our study. Therefore, for the sake of brevity, wedo not discuss detailed implications of these findings.
Given the paucity of a priori theory on time lags in IT-performance studies, we

62 DEVARAJ AND KOHLI
conducted a "holdout" sample analysis to test the robustness of our results; the dataset was split in two: a "holdouf sample and a test sample. Estimation analysesperformed on these two sample groups indicated similar qualitative results (in termsof sign and significance of coefficients). Although our analyses employed the antici-pated cost savings from the various BPR projects as a measure of BPR implementa-tion, the results were similar to models that used a count of BPR initiatives. Therobustness of the results to the various estimation methods is reassuring and lendscredibility to our fmdings.
Conclusions
Significance of Investing in IT
THE RESULTS OF OUR STUDY INDICATE THAT INVESTING IN IT does lead to organiza-tional profitability. Because of our longitudinal research design, we were able to seethe lag effects of such investment. We found that the profitability impact is seen inthree months or more. We found a stronger IT-profitability link when the patient/customer's overall profitability was considered, as opposed to per day of stay. This isprobably due to the sporadic nature of treatment regimens provided during the pa-tients' stay. We found varying support for investment in IT labor and capital. How-ever, IT investment in constilting and other support services does not appear to havea direct impact on the profitability ofthe organizations. These fmdings are similar tothe firm-level findings, as in Table 2, in other industries.
We also found support for IT investment's impact on quality initiatives within theorganization. We, therefore, found support for propositions 1 and 2 that, in duecourse, IT investment leads to increased profitability and improved quality of prod-ucts and services.
Significance of BPR
The effectiveness of BPR initiatives has been a subject of discussion and controversywithin organizations. We fmd that BPR initiatives lead to reduced mortality andincreased patient satisfaction within organizations. As is intuitive, improvementsresulting from BPR initiatives do not manifest immediately. Along these lines, wefound that improvements in mortality and satisfaction resulting from BPR initiativesin organizations were realized after a period of two months. We did not fmd anyevidence that BPR alone leads to improvement in profitability.
Significance of BPR with IT Investment
BPR often leads to turmoil within organizations because it demands modifications inhow individuals and work processes operate. Therefore, the management and support

IT PAYOFF IN THE HEALTH-CARE INDUSTRY 63
of such change are critical to the success of BPR. In examining the combined effectof BPR and IT investment, we found strong support that it leads to improved profit-ability for the organization. Specifically, we found that IT support and BPR com-bined have the strongest impact on the two profitability measures. While no impactwas found with BPR and IT labor investment, we did find evidence that IT capitalinvestment combined with BPR affects profitability. These may represent using ITas an enabler for BPR such as a new information system to provide patient informa-tion at bedside. Such technologies have shown improved efficiency and effective-ness of patient care. These fmdings support the recent calls in the literature to studyBPR effects in conjunction with the support environment within which BPR isimplemented [5,47,62]. This may also explain the limited support found for propo-sition 3 (as above).
Limitations
This study employs data from hospitals belonging to a health system over a recentthree-year period. Thus, a principal limitation of the study is the generalizability ofthe findings reported. Field studies, such as the one reported here, have the advantageof providing a richer operationalization of reality and the ability to track detaileddata over time; however their generalizability to the larger population is limited. Wedo not mean to suggest that fmdings can be generalized to the larger population ofhospitals, even though that may be a possibility. Neither can the fmdings be general-ized to other industries or other organizations.
Future Directions and Research
Large-sample, cross-sectional studies in conjunction with longitudinal studies arecalled for to examine the IT payoff issue in detail and to be able to make generaliza-tions across industries, firms, and the like. The random selection of companies througha survey-based approach would allow generalizations across the population of in-dustries or firms under consideration.
The literature in BPR implementation is rife with anecdotal evidence and short onrigorous empirical evidence of performance impacts of BPR. There is a defmite needto better measure BPR implementations through objective measures and to relateBPR to organizational performance in the context of other variables that also affectperformance.
A more specific area for future research in health care is the impact of IT invest-ments in labor, support, and capital on the continuum of health care. This study is afirst step in that direction, but it only examined the impact of IT on acute-care ser-vices. Other areas that represent the continuum are ancillary units, freestanding labo-ratories, outpatient services, and so on.
Finally, an implicit assumption in this study, and in most IT payoff studies, is thatinvestments in IT translate into more usage of the IT, and that this usage results inbetter organizational performance. The IT usage component is often assumed but is

64 DEVARAJ AND KOHLI
empirically untested. This may be an interesting and challenging question for futureresearch endeavors.
NOTES
Acknowledgments: The authors would like to thank Hank Groot for his continued support oftheproject, Frank Piontek for sharing his experiences and providing suggestions for clinical re-search, and Don Irmiger, Linda Martin, Doug Anthony, and Diana Utterback for their assistancein obtaining the data.
1. We also computed a measure of competition in the maricet This measure, called Herfmdahl 'sindex in the health care literature, is computed as a function of tbe beds in the market and beds ina specific hospital. However, due to minimal variation across the various time periods, theinclusion of this variable presented estimation problems. Hence, we chose to drop this variablefrom further consideration.
REFERENCES
1. Ahituv, N., and Giladi, R. Business success and information technology: are they reallyrelated? Proceedings ofthe Seventh Annual Conference ofManagement IS, Tel Aviv University,Israel, 1993.
2. Anderson E.W.; Fomell, C ; Rust R.T. Customer satisfaction, productivity, and profitabil-ity: differences between goods and services. Marketing Science, 16,2 (1997), 129-145.
3. Antonelli, C. New information technology and the knowledge-based economy: the Italianevidence. Review of Industrial Organization. 12,4(\ 997), 593-607.
4. Baily, M.N. What has happened to productivity growth? Science, 234 (1986) 443-451.5. Barua, A.;Lee, B.;and Whinston, A. The calculus of reengineering. Information Systems
Research, 7,4 (1996), 409-428.6. Barua, A., and Lee B. The information technology productivity paradox revisited: a theo-
retical and empirical investigation in the manufacturing sector. InternationalJoumal of FlexibleManufacturing Systems, 9,2 (1997), 145-166.
7. Barua, A.; Kriebel, C ; and Mukhopadhyay, T. Information technologies and busi-ness value—an analytic and empirical investigation. Information Systems Research, 6,1(1995), 3-23.
8. Bemdt, E.R., and Morrison, C.J. High-tech capital formation and economic performancein U.S. manufacturing industries: an exploratory analysis. Journal of Econometrics, 65, 1(1995), 5M3.
9. Brynjolfsson, E. The productivity paradox of information technology. Communications ofthe ACM, 35 (December 1993), 66-77.
10. Brynjolfsson, E. Technology's true payoff. InformationWeek(Octoher 10,1994), 34-36.11. Brynjolfsson, E., and Hitt, L.M. Beyond the productivity paradox. Communications ofthe
ACM, 41, 8 (August 1998), 49-55.12. Brynjolfsson, E., and Yang, S. Infonnation technology and productivity: a review of
literature. Advances in Computers, .^i (1996), 179-214.13. Butters, S., and Eom, S. Decision support systems in the health care industry. Journal of
Systems Management (June 1992), 28-31.14. Cameron, K.S., and Quinn, R.E. Organizational paradox and transformation. In R.E Quinn
and K.S. Cameron (eds.), Paradox and Transformation: Toward a Theory of Change in Orga-nization and Management. Cambridge, MA: Ballinger, 1988, pp. 1-18.
15. Caron, J.; Jarvenpaa, S.; and Stoddard, D. Business reengineering at CIGNA Corporation:experiences and lessons learned from the first five years. MIS Quarterly, 18,3 {\ 994), 233-250.
16. Chang, C , and Tuckman, H. The profits of not-for-profit hospitals. Journal of HealthPolitics, Policy, and Law, 13 (Fall 1988), 547-564.
17. Dewan, S., and Min, C. The substitution of information technology for other factors ofproduction: a firm level analysis. Management Science, -^J, 12 (1997), 1660-1675.
IT PAYOFF IN THE HEALTH-CARE INDUSTRY 65
18. Dickinson, J.C. (1987). From process to policy: a generic prescription for test over-Utilization in the emergency department. Family Practice Research Journal, 7, 1 (Fall1987), 12-21.
19. Diewert, W.E., and Smith, A.M. Productivity measurement for a distribution firm. NationalBureau of Economic Research Working Paper no. 4812,1994.
20. Dudley, L., and Lasserre, P. Infonnation as a substitute for inventories. European Eco-nomic Review, 31 (1989), 1-21.
21. Ford, R.; Bach, S.; and Fottler, M. Methods of measuring patient satisfaction in health careorganizations. Health Care Management Review, 22,2 (1997), 74-89.
22. Forgionne, G., and Kohli, R. HMSS: a management support system for concurrent hospitaldecision making. Decision Support Systems, 16,3 (1996), 209-229.
23. Forgionne, G.; Gangopadhyay, A.; Klein, J.; and Eckhardt, R. Using electronic commerceto improve health care management. Proceedings of the 1998 Association oflnformation Systems,Baltimore, 1998, pp. 293-295.
24. Francalanci, C , and Galal, H. Infonnation technology and worker composition:determinants of productivity in the life insurance industry. MIS Quarterly, 22, 2 (1998),227-241.
25. Friedman, B., and Shortell, S. The fmancial performance of selected investor-owned andnot-for-profit hospitals before and after Medicare Prospective Payment. Health Services Re-search, 23 (\9m), 237-267.
26. Furse, D.; Burcham, M.; Rose, R.; and Oliver, R. Leveraging the value of customersatisfaction information. Journal of Health Care Marketing, 14,3 (1994), 16-20.
27. Gapenski, L.; Vogel, B.; and Langland-Orban, B. The determinants of'hospital profitability.Health and Hospital Administration, 38, 1 (1993), 63-80.
28. Grover, V.; Teng, J.; Segars, A.; and Fiedler, K. The influence of infonnation technologydiffusion and business process change on perceived productivity: the IS executive's perspective.Information and Management, 34,3 (1998), 141-159.
29. Hendricks, K., and Singhal, V. Does implementing an effective TQM program actuallyimprove operating performance? empirical evidence fVom firms that have won quality awards.Management Science, 43,9 {1997), 1258-1274.
30. Hitt, L., and Brynjolfsson, E. Productivity, business profitability, and consumer surplus:three different measures of infonnation technology value. MIS Quarterly, 20,2 (1995), 121-142.
31. Joiner, G.A.; Salisbury, D.; and Bollin, G.E. Utilizing quality assurance as a tool forreducing the risk of nosocomial ventilator-associated pneumonia. American Joumal of MedicalQuality, 11,2 (Summer 1996), 100-103.
32. Jonscher, C. An economic study of the infonnation technology revolution. InT.J. Allen andM.S. Scott Morton (eds.). Information Technology and the Corporation of the 1990s: ResearchStudies. Oxford: Oxford University Press, 1994, pp. 5-42.
33. Jorgenson, D.W., and Stiroh, K. Computers and growth. Economics of Innovation andNew Technology, 3 (1995), 295-316.
34. Keen, P. Value analysis: justifying decision support systems. MIS Quarterly, J, 1 (1981),1-15.
35. Kelly, M. Productivity and information technology: the elusive connection. ManagementScience. 40,11 (1994), 1406-1425.
36. Kohli, R.; Kerns, B.; and Forgionne, G. The application of TQM in a hospital's casualtyand pathology departments. International Joumal of Quality and Reliability Management, 12,9(1995), 57-75.
37. Kohli, R., and Forgionne, G. A model to measure DSS effectiveness: theory and empiricalanalysis. Revue des Systemes de Decision, 7 (1) (1998), 87-110.
38. Kohli, R.; Tan, J.; Ziege, D.; Piontek, F; and Groot, H. Integrating cost infonnation withhealth care decision support systems. Topics in Health Care Information Management, 20, 1(1999), 80-95.
39. Koski, H. The implications of network use, production network extemalities and publicnetworking programmes for firm's productivity. Research Policy, 28,4 (1999), 423-439.
40. Kraemer, K., and Dedrick, J. Payoffs from investment in information technology—lessonsfrom the Asia-Pacific region. World Development, 22,12(1994), 1921-1931.
41. Langland-Orban, B.; Gapenski, L.C.; and Vogel, W.B. Differences in characteristics of

66 DEVARAJ AND KOHLI
hospitals with sustained high and sustained low profitability. Hospital and Health ServicesAdministration, 41,3 (Fall 1996), 385-399.
42. Lehr, W., and Lichtenberg, F. Computer use and productivity growth in U.S. federalgovernment agencies, 1987-92. Joumai of Industrial Economics, 46,2(1998), 257-279.
43. Mahmood, M., and Soon S. A comprehensive model for measuring the potential impact ofinformation technology on organizational strategic variables. Decision Sciences, 22,4 (1991),869-897.
44. Mahmood, M., and Mann, G.J. How information technology investments affect organiza-tional productivity and performance: a longitudinal study. Proceedings ofthe 1997 InformationResources Management Association Intemational Conference, 1997,187—191.
45. Milgrom, P., and Roberts, J. Complementarities and fit: strategy, structure, and organiza-tional change in manufacturing. Joumai of Accounting and Economics, 7P (1995), 179-208.
46. Moad, J. Reengineering report from the trenches. Datamation, 41,5 (1994), 36-40.47. Mooney, J.; Gurbaxani, V.; and Kraemer, K. A process oriented framework for assessing
the business value of infonnation technology. Database Advances in Information Systems, 27,2(1996), 68-81.
48. Morrison, C , and Bemdt, E. Assessing the productivity of information technology equip-ment in U.S. manufacturing industries. National Bureau of Economic Research Working Paperno. 3582,1991.
49. Mukhopadhyay, T.; Rajiv, S.; and Srinivasan, K. Information technology impact on processoutpnt and quality. Management Science. 43,12(1997), 1645-1659.
50. Myers, B.; Kappelman, L.; and Prybutok, V. A comprehensive model for assessing thequality and productivity ofthe information system function: toward a contingency theory forinfonnation systems assessment University of North Texas, Working paper, ISRC-WP-19970101,1997.
51. Pinsonneault, A., and Rivard, S. Information technology and the nature of managerialwork: from the productivity paradox to the Icarus paradox? MIS Quarterly, 22, 3 (1998),287-311.
52. Prasad, B., and Harker, P. Examining the contribution of information technology towardproductivity and profitability in U.S. retail banking. Working paper no. 97-09, Financial Institu-tions Center, The Wharton School. 1997.
53. Prattipati, S., and Mensah, M. Information systems variables and management productiv-ity. Information and Management, 33,1 (1997), 33-43.
54. Quinn, J. The productivity paradox is false: information technology improves servicesperformance. Advances in Services Marketing and Management, 5 (1996), 71—84.
55. Roach, S. America's Technology Dilemma: A Profile ofthe Information Economy. SpecialEconomic Study, Morgan Stanley, 1987.
56. Robey, D. Theories that explain contradiction: accounting for the contradictory organiza-tional consequences of infonnation technology. Proceedings ofthe Sixteenth Intemational Con-ference on Information Systems, Amsterdam, December 1995, pp. 55—63.
57. Rutledge, R. Life after the Deming Prize. Business and Economic Review, 40, 3(1994)26-31.
58. Seddon, P. A respecification and extension of the DeLone and McLean model of ISsuccess. Information Systems Research, 8,3 (1997), 240-253.
59. Shi, L. Patient and hospital characteristics associated with average length of stay. HealthCare Management Review, 21,2 (1996), 46-61.
60. Siegel, D., and Griliches, Z. Purchased services, outsourcing, computers, and productivityin manufacturing. In Z. Griliches et al. (eds.). Output Measurement in the Service Sectors.Chicago: University of Chicago Press. 1992.
61. Silagy, C , and Lancaster, T. The Cochrane Collaboration in Primary Care: an intemationalresource for evidence-based practice of family medicine. Family Medicine, 27,5 (May 1995),302-305.
62. Soh, C , and Markus, M. How IT creates business value: a process theory synthesis.Proceedings ofthe Sixteenth International Conference on Information Systems, Amsterdam,December 1995, pp. 29-41.
63. Strassman, P.A. The Business Value of Computers. New Canaan, CT: Information Eco-nomics Press, 1990.

IT PAYOFF IN THE HEALTH-CARE INDUSTRY 67
64. Strassmann, PA. Information Payoff: The Transformation of Work in the Electronic Age.New York: Free Press, 1985.
65. Tam, K. Analysis of firm-level computer investments: a comparative study of three Pacific-Rim economies. IEEE Transactions on Engineering Management, 45,3 (1998), 276-286.
66. Teisberg, E.; Porter, M.; and Brown, G. Making competition in health care work. HarvardBusiness Review, 72,4 (1994), 131-141.
67. Teo, T, and Wong, P. An empirical study of the performance impact of computerization inthe retail industry. Omega: Intemational Joumal of Management Science, 26, 5 (1998), 611-621.
68. Teplensky, J.D.; Pauly, M.V.; Kimberly, J.R.; Hillman, A.L.; and Schwartz, J.S. Hospitaladoption of medical technology: an empirical test of altemative models. Health Services Re-search, 30, 3 (1995), 437-465.
69. Van de Ven, A.H., and Drazin, R. The concept of fit in contingency theory. Research inOrganizational Behavior, 7(1985), 333-365.
70. Venkatraman, N. The concept of fit in strategy research: toward verbal and statisticalcorrespondence. Academy of Management Review, 14,3 (1989), 423-444.
71. Vogel, W.; Langland-Orban, B.; and Gapenski, L.C. Factors influencing high and lowprofitability among hospitals. Health Care Management Review, 18,2 (1993). 15-26.
72. Wachtel, T.J., and O'Sullivan, P. Practice guidelines to reduce testing in the hospital.Journal of General Internal Medicine, 5,4 (July-August 1990), 335-341.
73. Wilcocks, L., and Lester, S. In search of information technology productivity: assessment\s&\ii%. Journal of the Operational Research Society, 48,11 (1997), 1082-1094.
74. Wilson, D. Assessing the impact of information technology on organizational perfomiance.In R. Banker, R. Kauffhian, and M.A. Mahmood (eds.). Strategic Information TechnologyManagement. Harrisburg, PA: Idea Group, 1993.
