infrastructure security and energy restoration division of long-term drought on... · energy...
TRANSCRIPT

Impacts of Long-term Drought on Power Systems in the U.S. Southwest
Prepared for:
U.S. Department of Energy Office of Electric Delivery and Energy Reliability
Infrastructure Security and Energy Restoration
Division

OFFICIAL USE ONLY
Outline of Presentation
2
1. Background, Objectives, and Assumptions
2. Methodology and Data
3. Analysis and Results

OFFICIAL USE ONLY
DOE-OE has a responsibility to promote a resilient energy infrastructure in which continuity of business and services are maintained through secure and reliable information sharing, coordinated response capabilities, and trusted relationships between public and private partners at all levels of industry and government. This analysis is intended to provide an
opportunity for utilities to receive information from subject matter experts in industry and government. Argonne was engaged by DOE-OE in May 2012 to
develop a drought scenario to elicit discussion with sector partners.
Study Background
3

OFFICIAL USE ONLY
Purposes of the Study Develop a hypothetical but plausible drought
scenario involving the U.S. Southwest Assess the impacts of the drought scenario on
the power systems comprising the U.S. Southwest: − supply-demand balance − thermal and hydro capacity losses − reserve margin reductions − overall system reliability and vulnerability
Analysis results presented at two levels: Regional and Per-State Analysis is high-level and is more of a
screening analysis representing a first-cut attempt based on limited time Provide pertinent drought and power–related
information for educational purposes
4

OFFICIAL USE ONLY
General Impacts of Drought and High Temperatures on Power Systems
Reductions in Power Generation and Transmission: −Thermo-electric plants:
* Use surface water for cooling, fuel processing, and emission control * Low water level limits the amount of water that can be withdrawn (Min water elevation limits) * Intake structures could be exposed (above water level) * Higher water temperature at intake may lead to violation of water discharge regulations * High temperatures lowers plant heat rate (efficiency) − Hydro-electric plants:
* Lower inflows means low power output (run-of-river) * Lower reservoir levels mean less water available for power generation and degraded water-to energy conversion factors − Gas-fired plants:
* High ambient temperatures limit cooling ability of air-cooled systems * High temperatures decrease efficiency and capacity − Photovoltaic Cells: * High temperatures reduce efficiency and outputs of PV units − Transmission lines:
* High temperatures lower the thermal limits of transmission lines and circuit breakers * High temperatures increase transmission loss and operational cost * High ambient temperatures lower throughputs of transformers
Increased Production Cost of Electric Power and Increased Emissions: − Purchased power from spot market tend to cost more − More expensive natural gas is used as less-efficient gas turbine output is increased − Output from low-risk thermal plants is increased leading to elevated CO2 emissions
5

OFFICIAL USE ONLY
General Impacts of Drought and High Temperatures on Power Systems (Contd.)
System reliability: − High deterioration rates of system components − Lower reserve margins − Increased susceptibility to faults and cascading
failures − High probability of longer and more wide-
spread blackouts
Recent examples of reduced power production from drought:
− Southeast U.S. in 2007 – nuclear and coal-fired plants in TVA system were forced to shutdown or curtail operations. Intake water exceeded 90 F for 24 hours.
− Mississippi River in 2006 – affected nuclear plants in Illinois and Minnesota. Drought and heat wave warmed intake water.
− France in 2003 – loss of 7% to 15% of nuclear capacity for 5 weeks; loss of 20% of hydro generation capacity.
Southeast Drought - 2007
Drought Brings Low Water to Mississippi River
Drought in France - 2003
6

OFFICIAL USE ONLY
General Response Strategies Pertaining to Drought
Electric Supply Alternatives - Spot market Purchases - Option or Firm Purchases - Power Exchanges (“credit line”) - Subject to transmission constraints
Electricity Demand Response - Interruptible-load Contracts - Demand Exchange or Management - Energy Efficiency and Conservation
Alternative Water Supplies - Water Banks - Water Supply Contracts - Groundwater Wells - Processed waste water for cooling
Water Demand Response - Education and Conservation Campaigns - Water Use Restrictions - Rate Surcharges
SOURCE: Harto, C.B and E. Yan, “Analysis of Drought Impacts on Electricity Production in the Western and Texas Interconnection”, Environmental Science Division, Argonne National Laboratory, Dec 2011
7

OFFICIAL USE ONLY
Reservoir Management as a Strategic Response
Reservoirs allow for storage of water which is crucial for managing impacts of drought. Reservoirs permit the controlled release of water to maximize benefits.
Reservoirs are traditionally managed through heuristic regulation policies based on historical system response.
Reservoir operation faces many constraints including: − Minimum flow requirements − Limits on ramp rates − Environmental consideration such as fish life
and support of ecosystems − Irrigation and domestic water use − Industrial use and plant cooling − Recreational and navigational use
At times, power generation is lowest priority; environmental is top priority.
Computer models are employed to optimally manage reservoirs to maximize usage and minimize risk.
8

OFFICIAL USE ONLY
Depth of Intake Below Surface of Power Plants in the U.S.
Distribution of Power Plant Intakes by Depth from Surface
020406080
100120140
0 1 to 5 6 to10
11 to15
16 to20
21 to25
26 to30
31 to35
36 to40
41 to45
46 to50
51 to100
> 100
Depth from Surface (ft)
No. o
f Int
akes
in D
epth
Ra
nge
*
* SOURCE: Kimmel, T. and J. Veil, “Impact of Drought on U.S. Steam Electric Power Plant Cooling Water Intakes and Related Water Resource Management Issues” Argonne National Laboratory, April 2009.
9

OFFICIAL USE ONLY
Location of Thermal Plants with Depth of Intake Information
SOURCE: EIA Form
860
10

OFFICIAL USE ONLY
Recent Incidents Affecting Power Plant Operation
11
■ Power plant operations have historically been affected by both drought and heat wave conditions.
■ Low water levels affect coal-fired and nuclear power plants’ operations: − The Millstone nuclear plant in Waterford, CT had
to shut down one of its reactors in mid-August 2012 because the water it drew from the Long Island Sound was too warm to cool critical equipment outside the core.
− A twin-unit nuclear plant in Braidwood, IL needed to get special permission to continue operating this summer because the temperature in its cooling-water pond rose to 102 degrees, four degrees above its normal limit.
− Another Midwestern plant stopped operating temporarily because its water-intake pipes ended up on dry ground from the prolonged drought.
− Another power plant in Illinois had to shut down because it was overheating due to its cooling water intake pipe being blocked with dead fish killed by low water levels.
− In July 2012, US nuclear-power production hit its lowest seasonal levels in nine years as drought and heat forced nuclear power plants from Ohio to Vermont to slow output.
Source: U.S. Energy Information Administration forms EIA-923, Power Plant Operations Report, and EIA-860, Annual Electric Generator Report.
■ Low water levels impede the passage of coal barges along the Mississippi River: − This summer’s drought disrupted
the transport of coal delivered by barges on the Mississippi, and the U.S. Army Corps of Engineers had to use dredges to deepen the navigation channel.

OFFICIAL USE ONLY
Major Assumptions for Scenario Development
12
■ The Southwest Region (SW) is defined as the U.S. western area encompassing the states of CA, AZ, NM, TX, NV, UT and CO
■ A five-year drought period is assumed with stream flow level variations following conditions experienced during 1930 to 1934 (Dust Bowl years):
■ Drought conditions would occur in areas within the SW region
■ Analysis considers impacts to surface water ■ The reference normal average year would be 2010 ■ Wind capacity assumed available during peak periods ■ No plant maintenance during peak summer months
Arizona
Texas
New Mexico
Colorado Utah
Nevada
California
Oklahoma
Kansas Missouri
Iowa
Oregon Idaho Wyoming
Nebraska
Arkansas
Louisiana
Highlighted States in Southwest Region

OFFICIAL USE ONLY
Dust Bowl Years of 1930 to 1934
13
■ The 1930s are remembered as the driest and warmest decade for the U.S.: − The drought events of the 1930s are widely
considered to be the “drought of record” for the Nation ■ During the Dust Bowl years of 1930 to 1934, severe
drought struck the Great Plains region: − In the summer of 1931, the rain stopped coming and
a drought that would last for most of the decade descended on the region
− Drought conditions during 1934 covered 79.9 percent of U.S. land area
■ Dust Bowl drought of the 1930s was arguably one of the worst environmental disasters of the 20th century: − The Dust Bowl affected 100,000,000 acres, centered
on the panhandles of Texas and Oklahoma, and adjacent parts of New Mexico, Colorado, and Kansas
− Lack of precipitation affected wildlife and plant life, and created water shortages for domestic needs
■ Many proactive measures taken after the 1930s drought reduced rural and urban vulnerability to drought, including new or enlarged reservoirs and improved domestic water systems

OFFICIAL USE ONLY
Comparison: Normal versus Assumed Drought Scenario
14
Normal Reference Year (2010) Assumed Drought Scenario (5-years)
Current Conditions

OFFICIAL USE ONLY
Drought Index Translation Across Selected Severity Indices
15
Increasing Drought Severity
SOURCE: National Drought Mitigation Center
OFFICIAL USE ONLY
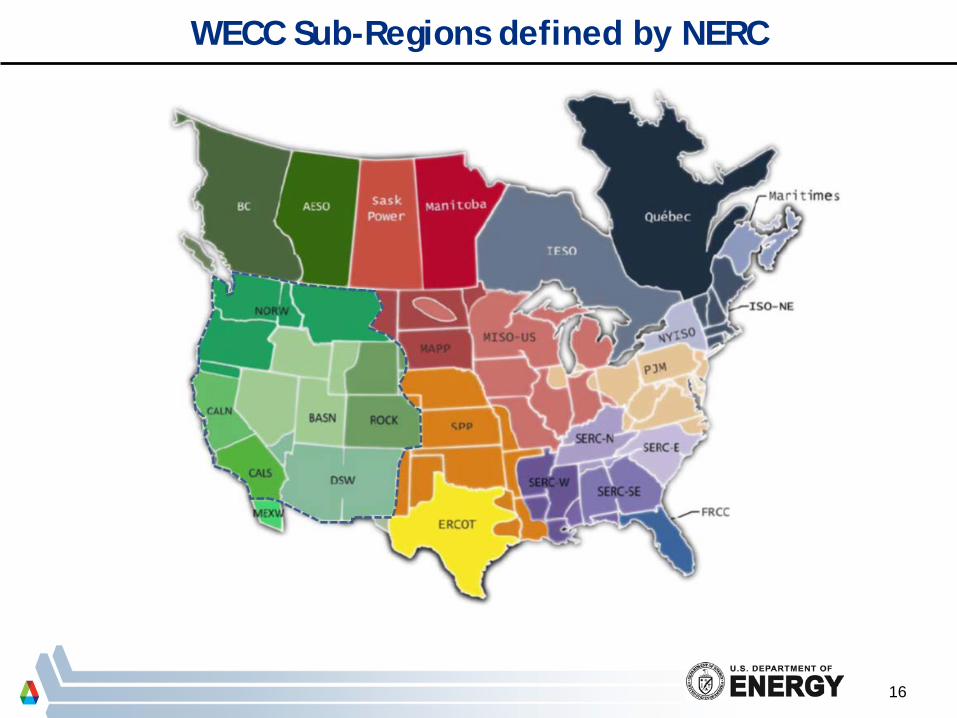
WECC Sub-Regions defined by NERC
16

OFFICIAL USE ONLY
Typical Demand Levels and Reserve Margins for Normal Year in the SW (Peak Summer Case)
17
*TRE = Texas Reliability Entity (now Electric Reliability Council of Texas [ERCOT]). ERCOT is more vulnerable system relative to WECC because ERCOT is an isolated system while WECC is more interconnected.
*

OFFICIAL USE ONLY
Methodology
18
■ Define scope of U.S. SW affected by drought ■ Establish base case power system to represent normal year: - Supply-demand balance summer case - WECC-sub-regions and exchange capabilities - Energy and capacity mix - Reserve margins and reliability status - Critical transmission corridors ■ Define extent and severity of drought: - Based on 1930 to 1934 historic stream flows levels - Derive corresponding hydro-thermal capacity loss factors using HUC-2 and HUC-4 water basin flows ■ Identify low- and high-risk thermal and hydro plants: - Low risk: renewables and groundwater- or seawater- dependent - High-risk: surface water-dependent and hydro plants ■ Calculate amount of reduction in capacity: - Use Harto and Yan’s 1st order formula for capacity loss calculation - Depict reduction regionally and per-state - Examine impact on inter-state transfer capability ■ Consider transmission line failures and assess further effects
on reliability.
Note: “X”s indicate possible line failures due to wild fires
OFFICIAL USE ONLY
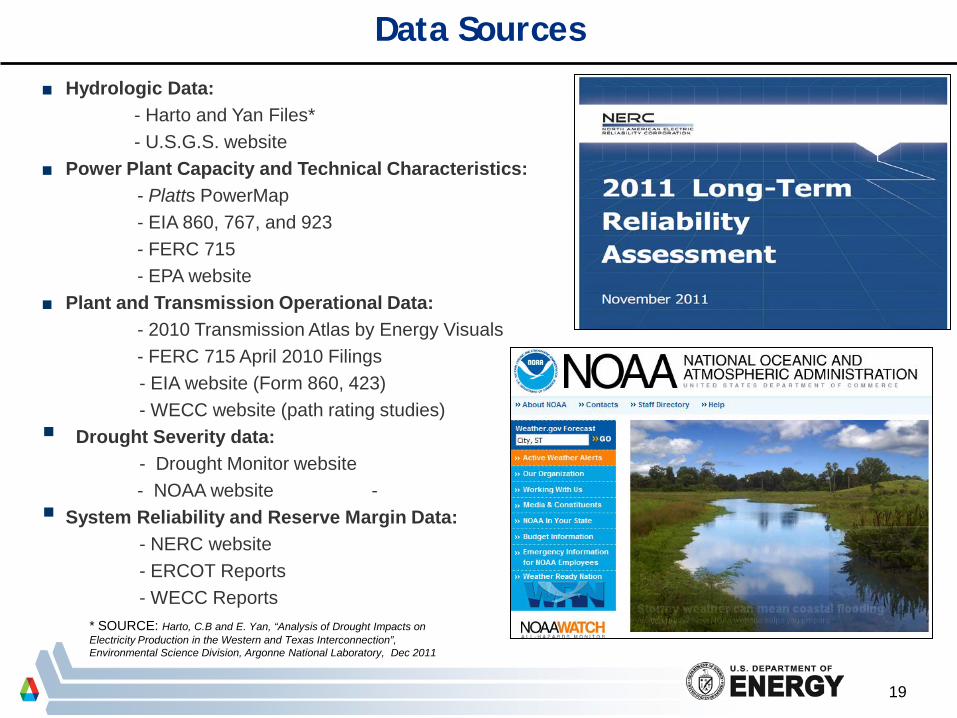
Data Sources
19
■ Hydrologic Data: - Harto and Yan Files* - U.S.G.S. website ■ Power Plant Capacity and Technical Characteristics: - Platts PowerMap - EIA 860, 767, and 923 - FERC 715 - EPA website ■ Plant and Transmission Operational Data: - 2010 Transmission Atlas by Energy Visuals - FERC 715 April 2010 Filings - EIA website (Form 860, 423) - WECC website (path rating studies) Drought Severity data: - Drought Monitor website - NOAA website - System Reliability and Reserve Margin Data: - NERC website - ERCOT Reports - WECC Reports * SOURCE: Harto, C.B and E. Yan, “Analysis of Drought Impacts on
Electricity Production in the Western and Texas Interconnection”, Environmental Science Division, Argonne National Laboratory, Dec 2011

OFFICIAL USE ONLY
Harto and Yan* 1st Order Formula for Hydro Capacity Loss Factor Calculation
20
Loss of Hydro Gen (MWH) = Ave Annual Hydro Gen (MWH)x (1-HGF)
Where:
HGF (Fraction) = Hydro Gen Factor = Drought Flow/Average Flow
* SOURCE: Harto, C.B and E. Yan, “Analysis of Drought Impacts on Electricity Production in the Western and Texas Interconnection”, Environmental Science Division, Argonne National Laboratory, Dec 2011

OFFICIAL USE ONLY
Loss of Thermal Gen (MWH) = At Risk Thermal Gen (MWH) x (1-TGF)
Harto and Yan* 1st Order Formula for Thermal Capacity Loss Factor Calculation
21
Where:
TGF(Fraction) = Thermal Gen Factor = Drought Flow/(Min [Ave Flow: 2010 Water Demand])
* SOURCE: Harto, C.B and E. Yan, “Analysis of Drought Impacts on Electricity Production in the Western and Texas Interconnection”, Environmental Science Division, Argonne National Laboratory, Dec 2011

OFFICIAL USE ONLY
Comparison of NERC Sub-Regions and HUC Water Basins
22
NERC Sub-Regions HUC-2 Water Basins

OFFICIAL USE ONLY
Analysis Results: Characteristics of the
Southwest Region
23

OFFICIAL USE ONLY
Installed Capacity Mix by Fuel Type in the “SW” (including ERCOT)
24
Total Installed Capacity : 265,555 MW
Note: The high dependence of the region on natural gas presents a unique vulnerability to natural gas disturbance. A long-term disruption of a major gas pipeline serving the region could spell disaster especially during drought season.

OFFICIAL USE ONLY
Share of High-Risk Capacity in the Southwest (SW)
25

OFFICIAL USE ONLY
Dispersal Pattern of High-Risk Hydro Plants within WECC and ERCOT
26

OFFICIAL USE ONLY 27
Dispersal Pattern of High-Risk Thermal Plants within WECC and ERCOT

OFFICIAL USE ONLY
Supply Demand Balance in the Southwest (2010 Summer Peak FERC 715 )
28
Internal Demand: 112,807 MW (100%) Internal Generation: 106,785 MW (95%) Imported Power: 6,022 MW (5%)
Internal Demand: 73,000 MW (100%) Internal Generation: 73,000 MW (100%) Imported Power: 0 MW (0%)
Texas
Southwestern States
6,022 MW

OFFICIAL USE ONLY
Assumed Transmission Transfer Capability Between WECC Sub-Regions
29

OFFICIAL USE ONLY
Major 500-kV and DC Transmission Lines Serving the SW
30
Round Mountain 500 kV
Sylmar

OFFICIAL USE ONLY
Water Consumption for Electric Generation
31
Water withdrawn is the total volume removed from a water source such as a lake or river. Often, a portion of this water is returned to the source and is available to be used again
Electric power plants account for more than 40 percent of water withdrawal in the U.S., but consume only a fraction of that amount
Electric generation in the Southwest States consumes less than 2-percent of the total amount of water withdrawn:

OFFICIAL USE ONLY
Analysis Results: Hydrological Data and Drought-
Driven Capacity Loss Factors
32

OFFICIAL USE ONLY 33
Stream Flow Levels During Drought

OFFICIAL USE ONLY 34
Hydrological Data and Drought-Driven Capacity Loss Factors
OFFICIAL USE ONLY
Analysis Results: Impacts on Region-Wide
Power Supply Capability and Reserve Margins
35

OFFICIAL USE ONLY
Regional Reserve Margins as Affected by Drought Conditions (Plant Maintenance not considered)
36
NERC’s Reference Reserve Margin of
14%
NERC’s Reference Reserve Margin of
14%

OFFICIAL USE ONLY
Percent Capacity Reduction in Hydro, Thermal and Other Capacity as Affected by Drought Conditions in the Southwest
37

OFFICIAL USE ONLY 38
Impact on Regional Reserve Margins over Five-Year Drought Scenario
NERC’s Reference Reserve Margin of 14%

OFFICIAL USE ONLY 39
Impact on Regional Supply Capability over Five-Year Drought Scenario

OFFICIAL USE ONLY 40
The five year drought sequence will result in a region-wide capacity loss and new reserve margin levels (without imported power) as follows:
Regional-wide reliability indices (with 6,000 MW imports) are as
follows:
Summary of Impacts: Regional Level

OFFICIAL USE ONLY
Analysis Results: Impacts on Per-State Reserve
Margins
41

OFFICIAL USE ONLY 42
Supply-Demand Conditions and Reserve Margin Levels in Year 1 (based on 1930 stream flow) of Drought Scenario in the Southwest
YEAR 1
Transmission Lines Operational
Peak Load = 57,994 Capacity = 60,377 RM = 4% Normal RM = 15%
Peak Load = 8,210 Capacity = 11,716 RM = 43% Normal RM = 39%
Peak Load = 18,721 Capacity = 26,816 RM = 43% Normal RM = 41%
Peak Load = 3,451 Capacity = 8,381 RM = 104% Normal RM = 136%
Peak Load = 6,238 Capacity = 7,545 RM = 21% Normal RM = 20%
Peak Load = 10,960 Capacity = 14,096 RM = 29% Normal RM = 26%
Peak Load = 74,338 Capacity = 84,705 RM = 14% Normal RM = 34-48%

OFFICIAL USE ONLY 43
Supply-Demand Conditions and Reserve Margin Levels in Year 2 (based on 1931 stream flow) of Drought Scenario in the Southwest
YEAR 2
Transmission Lines Operational
Peak Load = 64,016 Capacity = 53,297 RM = -8% Normal RM = 15%
Peak Load = 8,210 Capacity = 10,894 RM = 33% Normal RM = 39%
Peak Load = 18,721 Capacity = 24,917 RM = 33% Normal RM = 41%
Peak Load = 3,451 Capacity = 8,368 RM = 142% Normal RM = 136%
Peak Load = 6,238 Capacity = 7,143 RM = 15% Normal RM = 20%
Peak Load = 10,960 Capacity = 13,971 RM = 27% Normal RM = 26%
Peak Load = 73,127 Capacity = 91,405 RM = 23% Normal RM = 34-48%

OFFICIAL USE ONLY 44
Supply-Demand Conditions and Reserve Margin Levels in Year 3 (based on 1932 stream flow) of Drought Scenario in the Southwest
YEAR 3
Transmission Lines Operational
Peak Load = 64,015 Capacity = 61,958 RM = 7% Normal RM = 15%
Peak Load = 9,210 Capacity = 10,029 RM = 22% Normal RM = 39%
Peak Load = 18,721 Capacity = 28,517 RM = 52% Normal RM = 41%
Peak Load = 3,451 Capacity = 8,382 RM = 143% Normal RM = 136%
Peak Load = 6,238 Capacity = 7,558 RM = 21% Normal RM = 20%
Peak Load = 10,960 Capacity = 14,105 RM = 29% Normal RM = 26%
Peak Load = 73,127 Capacity = 101,024 RM = 36% Normal RM = 34-48%

OFFICIAL USE ONLY 45
Supply-Demand Conditions and Reserve Margin Levels in Year 4 (based on 1933 stream flow) of Drought Scenario in the Southwest
YEAR 4
Transmission Lines Operational
Peak Load = 64,015 Capacity = 59,940 RM = 3% Normal RM = 15%
Peak Load = 8,210 Capacity = 10,954 RM = 33% Normal RM = 39%
Peak Load = 18,721 Capacity = 25,186 RM = 35% Normal RM = 41%
Peak Load = 3,451 Capacity = 8,376 RM = 143% Normal RM = 136%
Peak Load = 6,238 Capacity = 7,520 RM = 21% Normal RM = 20%
Peak Load = 10,960 Capacity = 14,033 RM = 28% Normal RM = 26%
Peak Load = 73,127 Capacity = 65,103 RM = 4% Normal RM = 34-48%
OFFICIAL USE ONLY 46
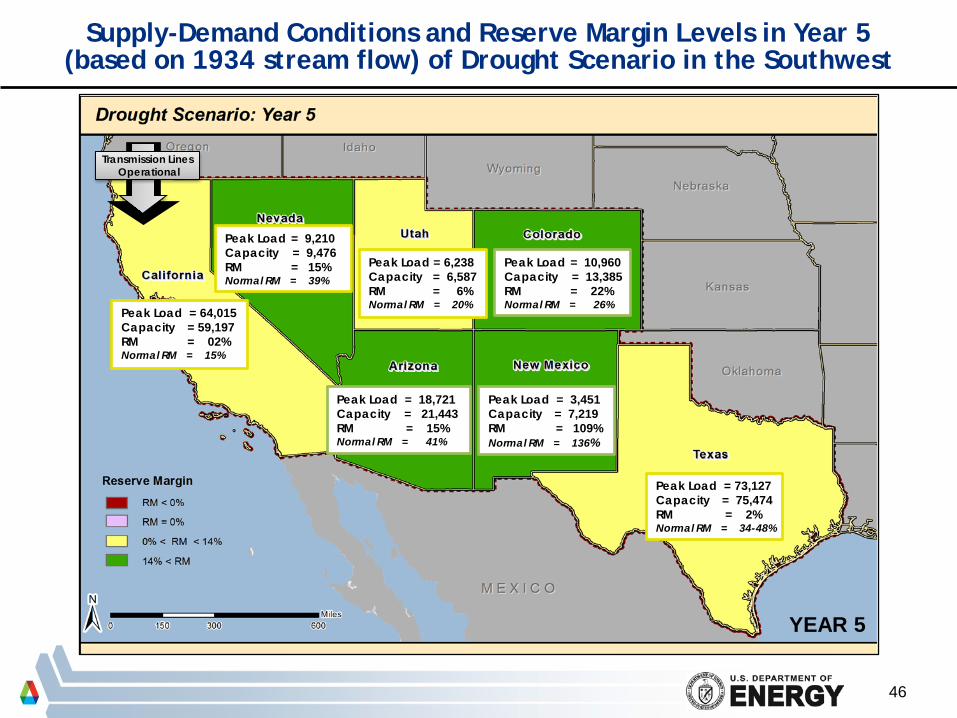
Supply-Demand Conditions and Reserve Margin Levels in Year 5 (based on 1934 stream flow) of Drought Scenario in the Southwest
YEAR 5
Peak Load = 64,015 Capacity = 59,197 RM = 02% Normal RM = 15%
Peak Load = 9,210 Capacity = 9,476 RM = 15% Normal RM = 39%
Peak Load = 18,721 Capacity = 21,443 RM = 15% Normal RM = 41%
Peak Load = 3,451 Capacity = 7,219 RM = 109% Normal RM = 136%
Peak Load = 6,238 Capacity = 6,587 RM = 6% Normal RM = 20%
Peak Load = 10,960 Capacity = 13,385 RM = 22% Normal RM = 26%
Peak Load = 73,127 Capacity = 75,474 RM = 2% Normal RM = 34-48%
Transmission Lines Operational

OFFICIAL USE ONLY 47
Summary of Impacts: State Level
The five-year drought would have a range of impacts on the power system reliability of the various states as follows:
Note: RM calculation assumes no units under maintenance or forced outage. It further assumes limited availability of wind power during peak.
CA exhibited highest vulnerability to drought in terms of MW due
to its water-dependent thermal units. TX showed the largest capacity reduction among the states in the
region with capacity loss of up to 30% during the last year (based on 1934 conditions) when stream flows were very low.
However, TX exhibited reserve margins for years 2 and 3 (1931 and 1934) higher than the NERC reference level of 14%.

OFFICIAL USE ONLY 48
Without imported power, CA was found to be most susceptible to capacity shortfall with RM raging from -3 % to -17% over all years.
Even with imported power from the northwest, CA was still susceptible to
serious capacity shortfall with RM ranging from -8% to 7% in all drought years of the scenario. It needs additional import power from AZ.
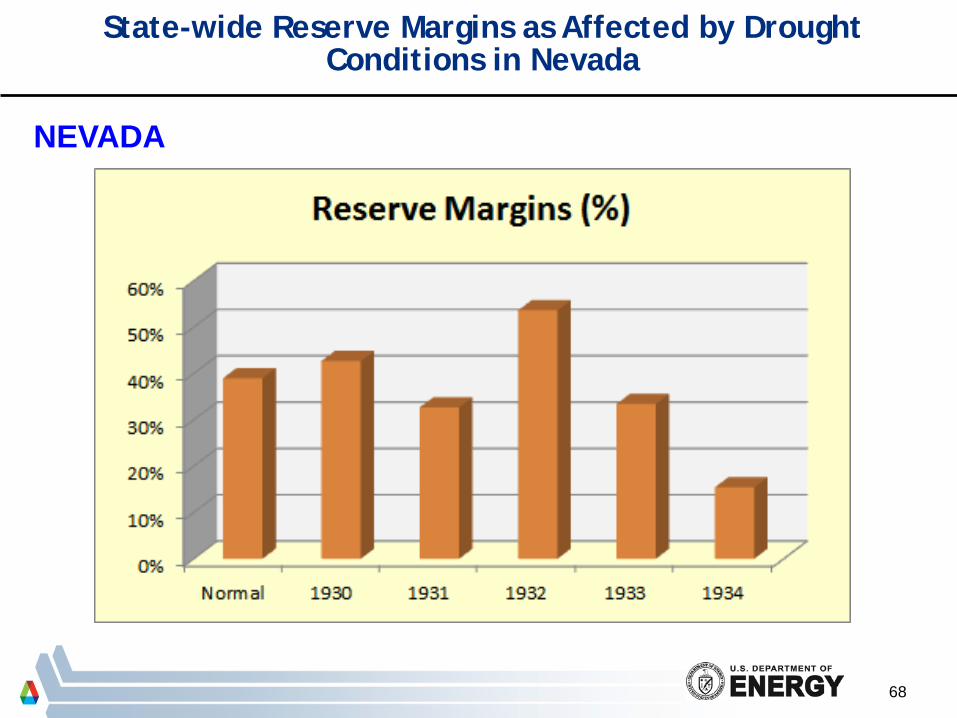
CO, NV, AZ, and NM appear impervious to all drought events even with
1930 and 1934 stream conditions. These four states maintain positive reserve margins during all drought years.
CO, NV, AZ, and NM, in particular, exhibited RM consistently above or equal to NERC’s reference RM of 14% throughout the drought period. As such, CO, NV, AZ and NM are the only states within SW region that could export power (although at reduced levels) to more supply-deficient states even during 1930 and 1934 stream flow drought conditions.
Summary of Impacts: State Level

OFFICIAL USE ONLY 49
During summer months, heat index through out most of the region hover at 100 degrees Fahrenheit or greater.
High temperatures cause power system stress in many respects:
- Lowers power-carrying capability of system elements such as transmission lines, transformers, circuit breakers, etc.
- Accelerate deterioration of dielectric materials, operating mechanism, supporting structures, and cooling/insulating liquids used in power apparatus
- Induces greater overall wear and tear impacts on apparatus which leads to increased vulnerability to faults and cascading failures.
- Shortens life of batteries that are crucial in supporting UPS and emergency response systems.
- Significantly reduces the efficiency of PV solar panels - Reduces capacity and efficiency of gas and combustion turbines
Drought (affected by climate change) combined with possible
exhaustion of aquifers could lead to population and power use shifts that could change electrical load patterns.
Summary of Impacts: Other Effects

OFFICIAL USE ONLY 50
Contact Information
Matthew Light Infrastructure Systems Analyst
Stewart Cedres Director, Infrastructure Reliability

OFFICIAL USE ONLY
Supplemental Slides
51

OFFICIAL USE ONLY
Potentially-Relevant Technical Papers
52
Milazi, Dominic and L Pratson, 2009, The Impact of Drought on Electric Supply in North Carolina, Master’s Thesis, Nicholas School of Environment, Duke University 2009. Benenson, Peter, et al,1977, Effects of Drought on California Electricity Supply and Demand, Lawrence Berkeley Laboratory, University of California Berkeley, June 1977. Harto, C.B., and Y.E. Yan 2011, Analysis of Drought Impacts on Electricity Production in Western and Texas Interconnections of the U.S., Environmental Science Division, Argonne National Laboratory, December 2011. GoldStein, R, 2006, Framework to Evaluate Water Demands and Availability for Electrical Power Production Within Watersheds Across the United States: Development and Applications, Electric Power Research Institute (EPRI), Palo Alto, CA, December 2005. GoldStein, R, 2003, A Survey of Water Use and Sustainability in the United States With a Focus on Power Generation , Electric Power Research Institute (EPRI), Palo Alto CA , November 2003. Poch, Les, et al, 2009, Analysis of the Effects of Drought Conditions on Electric Power Generation in the Western United States, Argonne National Laboratory, Sponsored by National Energy Technology Laboratory (NETL-DOE), April 2009. Kimmell, Todd, and Jophn Veil, 2009, Impact of Drought on U.S. Steam Electric Power Plant Cooling Water Intakes and Related Water Resource Management Issues, Argonne National Laboratory, Sponsored by National Energy Technology Laboratory (NETL-DOE), April 2009.
OFFICIAL USE ONLY
Potentially-Relevant Technical Papers (contd.)
53
Alvarado, AL, and Karen Griffin 2006, Revised Methodology To Estimate Generation Resource Mix of California Electricity Imports, Electricity Analysis Office, California Energy Commission, San Francisco California, April 12, 2007. Smith Paul, 2008, Regional Capacity and New Projects, Generation Market Analysis and Planning, Western Electricity Coordinating Council (WECC), March 2008. Feldman, David, 2008, Freshwater Availability and Constraints on Thermoelectric Power Generation in the Southeast U.S., The Southern States Energy Board, Norcross, GA, June 2008. Tarboton, David, 1994, The Source Hydrology of Severe Sustained Drought in the Southwestern U.S., Utah State University, January 1994. GoldStein, R and W. Smith, 2002, Water & Sustainability (Volume 3): U.S. Water Consumption for Power Production - The Next Half Century, Electric Power Research Institute (EPRI) Technical Report, March 2002. NERC 2011, 2011 Long-Term Reliability Assessment, North American Electric Reliability Corporation, Atlanta GA (www.nerc.com,) November 2011. NERC 2012, Summer Reliability Assessment 20102, North American Electric Reliability Corporation, Atlanta GA (www.nerc.com,) November 2011. WECC 2011, Path Rating Studies 2011

OFFICIAL USE ONLY
Operational Water Consumption Factors for Electricity Generating Technologies
54

OFFICIAL USE ONLY
Normal Year Depiction of Drought Index
55

OFFICIAL USE ONLY
Spatial Extent of Assumed Drought Scenario
56
OFFICIAL USE ONLY
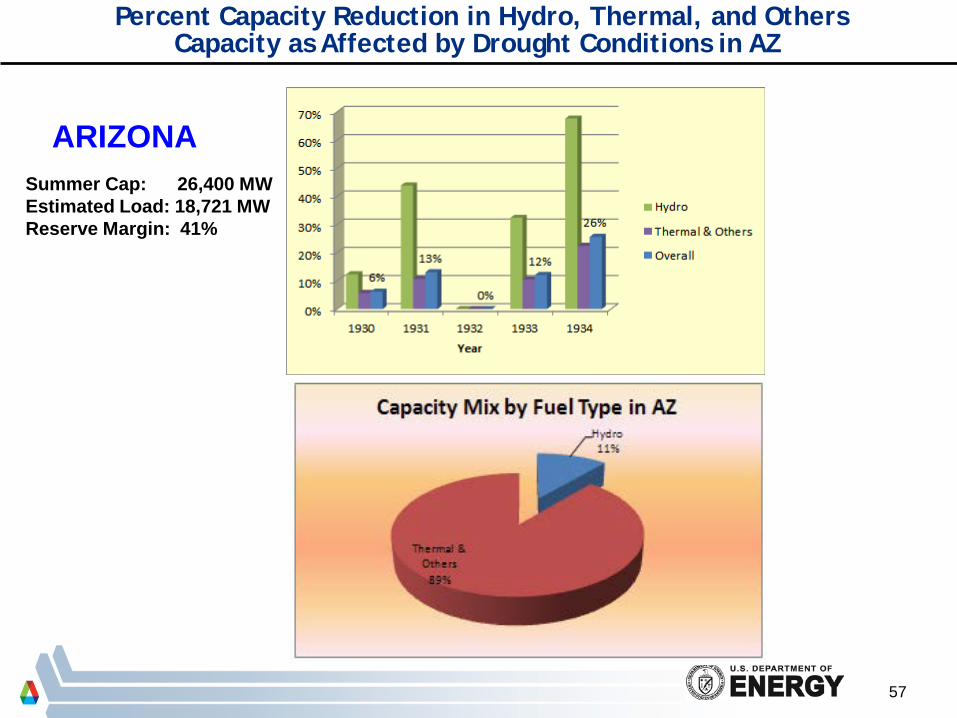
Percent Capacity Reduction in Hydro, Thermal, and Others Capacity as Affected by Drought Conditions in AZ
57
Summer Capability = 23,755 MW
ARIZONA Summer Cap: 26,400 MW Estimated Load: 18,721 MW Reserve Margin: 41%
OFFICIAL USE ONLY
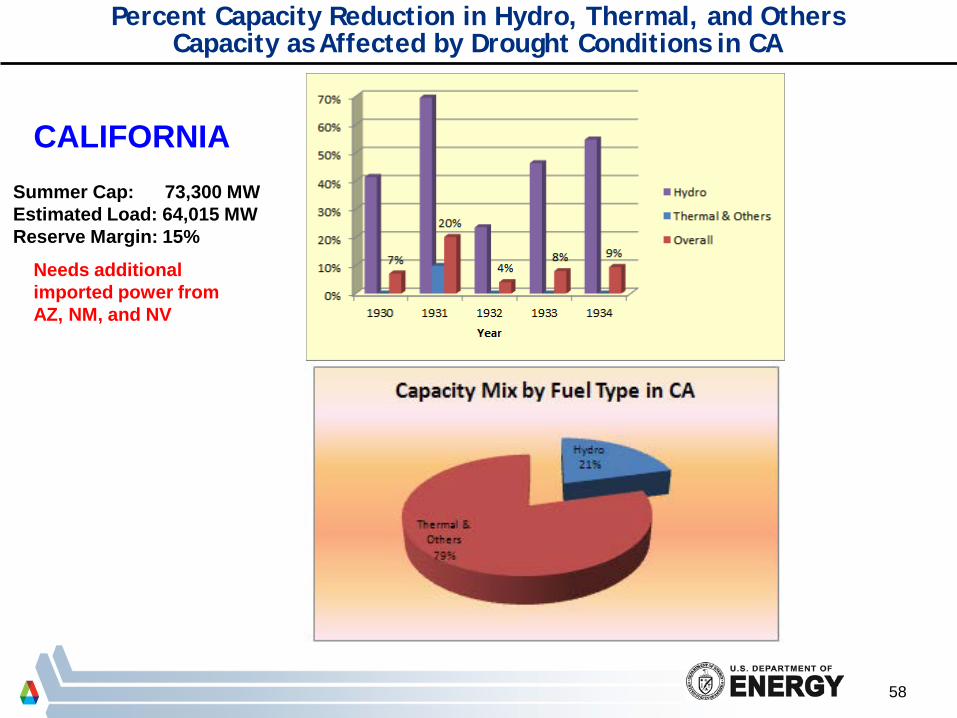
Percent Capacity Reduction in Hydro, Thermal, and Others Capacity as Affected by Drought Conditions in CA
58
CALIFORNIA Summer Cap: 73,300 MW Estimated Load: 64,015 MW Reserve Margin: 15%
Needs additional imported power from AZ, NM, and NV

OFFICIAL USE ONLY
Percent Capacity Reduction in Hydro, Thermal, and Others Capacity as Affected by Drought Conditions in CO
59
COLORADO Summer Cap: 13,800 MW Estimated Load: 11,000 MW Reserve Margin: 26%

OFFICIAL USE ONLY
Percent Capacity Reduction in Hydro, Thermal, and Others Capacity as Affected by Drought Conditions in NM
60
NEW MEXICO
Summer Cap: 8,100 MW Estimated Load: 3,450 MW Reserve Margin: 136%

OFFICIAL USE ONLY
Percent Capacity Reduction in Hydro, Thermal, and Others Capacity as Affected by Drought Conditions in NV
61
NEVADA
Summer Cap: 11,420 MW Estimated Load: 8,200 MW Reserve Margin: 39%

OFFICIAL USE ONLY
Percent Capacity Reduction in Hydro, Thermal, and Others Capacity as Affected by Drought Conditions in TX
62
TEXAS
Summer Cap: 108,300 MW Estimated Load: 73,000 MW Reserve Margin: 48%
Note: Reserve Margin (RM) calculation assumes that wind power capacity of about 9,000 MW is available. If wind capacity is assumed unavailable RM drops to about 34 %.

OFFICIAL USE ONLY
Percent Capacity Reduction in Hydro, Thermal, and Others Capacity as Affected by Drought Conditions in UT
63
UTAH
Summer Cap: 7,500 MW Estimated Load: 6,200 MW Reserve Margin: 20%
OFFICIAL USE ONLY 64
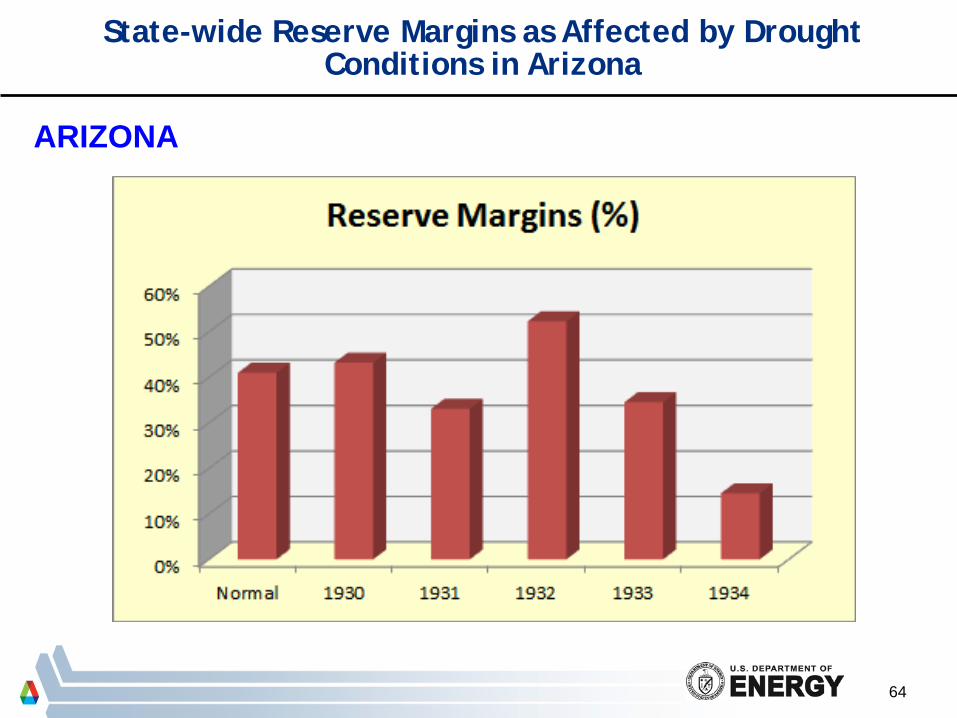
State-wide Reserve Margins as Affected by Drought Conditions in Arizona
ARIZONA

OFFICIAL USE ONLY 65
State-wide Reserve Margins as Affected by Drought Conditions in California (with Imports from NW only)
CALIFORNIA

OFFICIAL USE ONLY 66
State-wide Reserve Margins as Affected by Drought Conditions in Colorado
COLORADO

OFFICIAL USE ONLY 67
State-wide Reserve Margins as Affected by Drought Conditions in New Mexico
NEW MEXICO
OFFICIAL USE ONLY 68
State-wide Reserve Margins as Affected by Drought Conditions in Nevada
NEVADA

OFFICIAL USE ONLY 69
State-wide Reserve Margins as Affected by Drought Conditions in Texas
TEXAS

OFFICIAL USE ONLY 70
State-wide Reserve Margins as Affected by Drought Conditions in Utah
UTAH
OFFICIAL USE ONLY
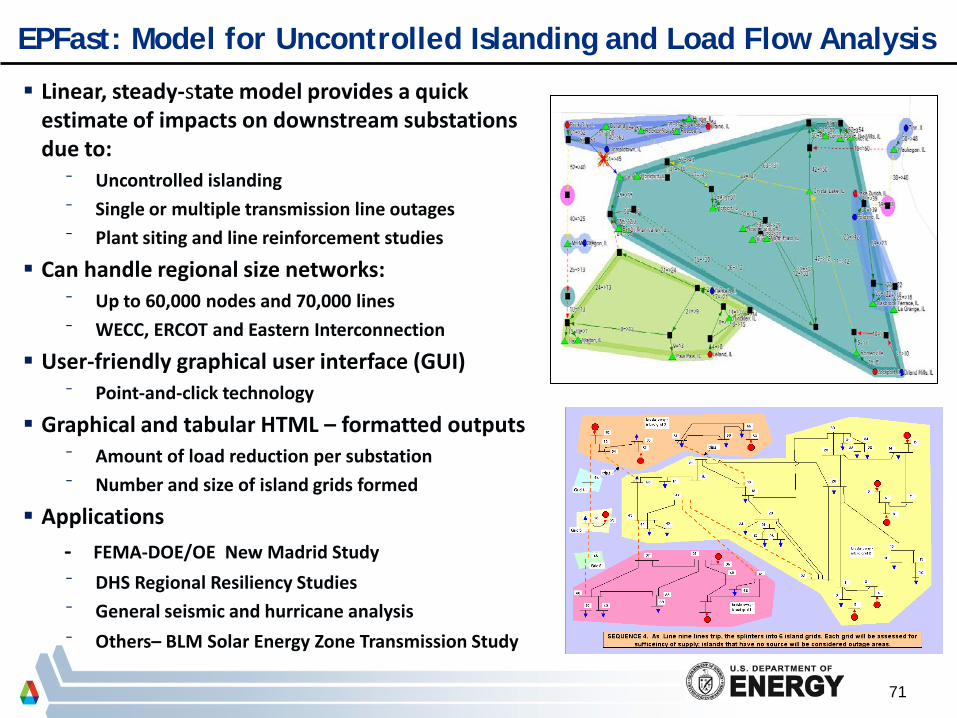
EPFast: Model for Uncontrolled Islanding and Load Flow Analysis
71
Linear, steady-state model provides a quick estimate of impacts on downstream substations due to:
⁻ Uncontrolled islanding
⁻ Single or multiple transmission line outages
⁻ Plant siting and line reinforcement studies
Can handle regional size networks: ⁻ Up to 60,000 nodes and 70,000 lines
⁻ WECC, ERCOT and Eastern Interconnection
User-friendly graphical user interface (GUI) ⁻ Point-and-click technology
Graphical and tabular HTML – formatted outputs ⁻ Amount of load reduction per substation
⁻ Number and size of island grids formed
Applications
- FEMA-DOE/OE New Madrid Study
⁻ DHS Regional Resiliency Studies
⁻ General seismic and hurricane analysis
⁻ Others– BLM Solar Energy Zone Transmission Study