inpatient glycemic management: glucose control
TRANSCRIPT

University of San Diego University of San Diego
Digital USD Digital USD
Dissertations Theses and Dissertations
2012-05-01
Inpatient Glycemic Management: Glucose Control Relationship Inpatient Glycemic Management: Glucose Control Relationship
with Hospital Variables, Discharge Planning and Education with Hospital Variables, Discharge Planning and Education
Crisamar Javellana-Anunciado PhD, FNP-BC, RN University of San Diego
Follow this and additional works at: https://digital.sandiego.edu/dissertations
Part of the Nursing Commons
Digital USD Citation Digital USD Citation Javellana-Anunciado, Crisamar PhD, FNP-BC, RN, "Inpatient Glycemic Management: Glucose Control Relationship with Hospital Variables, Discharge Planning and Education" (2012). Dissertations. 421. https://digital.sandiego.edu/dissertations/421
This Dissertation: Open Access is brought to you for free and open access by the Theses and Dissertations at Digital USD. It has been accepted for inclusion in Dissertations by an authorized administrator of Digital USD. For more information, please contact [email protected].

UNIVERSITY OF SAN DIEGO
Hahn School of Nursing and Health Science
Inpatient Glycemic Management: Glucose Control Relationship with Hospital Variables,
Discharge Planning and Education
By
Crisamar Javellana-Anunciado, PhD, RN, FNP-BC
A dissertation presented to the
FACULTY OF THE HAHN SCHOOL OF NURSING AND HEALTH SCIENCE
UNIVERSITY OF SAN DIEGO
In partial fulfillment of the requirements for the degree
DOCTOR OF PHILOSOPHY IN NURSING
May 2012
Dissertation Committee
Cynthia D. Connelly, PhD, RN, FAAN, Chairperson
Kathy S. James, DNSc, APRN
Pablo Velez, PhD, RN

Abstract
This dissertation study examined the relationship of glucose control with clinical
outcomes, costs, discharge planning and education. Extant studies showed that
hyperglycemia, in the presence or absence of a diabetes diagnosis, is prevalent in
hospitalized patients. Hyperglycemia is found in one-third of all hospital admissions and is
linked to poor clinical outcomes and increased healthcare costs. Furthermore, clinical
evidence suggests that lack of discharge coordination associated with medical errors and
readmission. This entire body of work contains three distinct sections: Two manuscripts
and a grant proposal. The two manuscripts in this study were based on more current
retrospective data at the time of the study. The first manuscript "Inpatient glycemic
management: relationship among glucose control, clinical outcomes and costs" discussed the
results on glucose control, clinical outcomes and costs by provider groups. The second
manuscript "Inpatientglycemic management: team approach in diabetes education and
discharge planning" discussed the outcomes of improved discharge planning and
coordination with the intervention of the glycemic management team. The grant proposal
"Inpatient glycemic management: clinical and economic impact of changing from sliding scale
insulin to basal-bolus" was awarded $105,000 funding by a private pharmaceutical
company. The study associated with the grant funding was a completely separate study
done in collaboration with the grantor.

Dedication
This work is dedicated to my patients and many of my family members who battle
with diabetes management everyday. Their daily struggles, including momentary lapses or
dedicated resolve in diabetes care, minor or catastrophic health failures, and every small or
transformational accomplishments inspire and motivate me in my work to strive for the
best diabetes care possible for each and every one of them. Diabetes is a disease of the most
human and humbling kind. Its complications are devastating to the people and their loved
ones affected by the disease. Despite its grim outcomes, hope exists when individuals
decide to take steps in healthy lifestyle changes and when we as healthcare providers
deliver the right guidance and care. With continued collaboration of patients and
healthcare providers, we can overcome the negative effects of this disease and improve our
patients' chances in living longer, healthier, and more fulfilled lives.
ii
Acknowledgements
I would like to acknowledge Dr. Cynthia Connelly for her invaluable support through
this dissertation process; Dr. Pablo Velez for his guidance and dedication in seeing this
project through; Dr. Georges M. Argoud for his clinical insights throughout the research
process and for being my endocrinology mentor; Dr. Patricia Roth, Dr. Mary Jo Clark, Dr.
Jane Georges, Dr. Kathy James and Dr. Karen Wikoff who have been my inspiration and
mentors for many years; Dr. Dale Glaser, this study's statistician, who spent countless
hours on this project; my family, whose support and love has been unconditional; and my
husband, Doug, who has been by my side through it all.
Special thanks to the Sharp Healthcare team who have been instrumental in this
project: Jacqui Thompson, Brett Maclaren, Josh Fluty, Josie Nonog, Melinda Nylund, Marc
Reyes, Sue Ressmeyer, Kara Yu and the Medical Records team, Angela Norton, and David
Gehlken.
iii
Table of Contents
Chapter 1: PROBLEM Page
Introduction 1
Research Aims 4
Conceptual Framework 5
Chapter 2: REVIEW OF LITERATURE
Introduction 8
Critical Care Setting 9
Surgical Care Setting 12
General Hospital Ward Setting 14
Hypoglycemia 15
Glycohemoglobin A1C 18
Discharge Plan 19
Role of the Advanced Practice Nurse 21
Conceptual Framework 25
Summary 27
iv

Chapter 3: METHODOLOGY
Significance of the Study 28
Research Aims 29
Research Design 30
Sample and Sampling 30
Procedures 32
Data Analysis 33
Protection of Human Rights Subjects 35
References 36
Tables 43
Chapter 4: MANUSCRIPTS
Manuscript 1:
Inpatient glycemic management: relationship among glucose control, clinical outcomes and costs.
Manuscript 1: Abstract 52
Manuscript 1: Background 55
Manuscript 1: Research Design and Methods 57
v

Manuscript 1: Measures 58
Manuscript 1: Statistical Analysis 62
Manuscript 1: Results 63
Manuscript 1: Discussion 68
Manuscript 1: References 71
Manuscript 2:
Inpatient glycemic management: team approach in improved diabetes education and discharge planning
Manuscript 2: Abstract 79
Manuscript 2: Background 81
Manuscript 2: Research Design and Methods 84
Manuscript 2: Measures 85
Manuscript 2: Statistical Analysis 86
Manuscript 2: Results 87
Manuscript 2: Discussion 91
Manuscript 2: References 95
vi

Manuscript 3: Grant Proposal
Inpatient glycemic management: clinical and economic impact of changing from sliding scale insulin to basal-bolus
Manuscript 3: Introduction 101
Manuscript 3: Research Aims 102
Manuscript 3: Research Questions 102
Manuscript 3: Research Design and Methods 103
Manuscript 3: Limitations 106
Manuscript 3: Risks to Patients 109
Manuscript 3: Deliverables 109
Manuscript 3: Capability and Competency Description 110
Manuscript 3: Proposed Budget Ill
Manuscript 3: Payment Schedule 112
Manuscript 3: References 113
Manuscript 3: Email Notification of Award 115
Manuscript 3: Appendices 116
vii

CHAPTER 1:PROBLEM
Introduction
Diabetes is not just a U.S. national health crisis but also a worldwide epidemic. In
2010, there were 285 million people worldwide affected by diabetes. The North American
Continent (NAC) has 37 million people with diabetes. This is roughly 10% of the population
of NAC with a death toll of 16%. Diabetes is the leading cause of neuropathy, nephropathy,
retinopathy, and coronary artery diseases (IDF, 2009, 2010). Diabetes puts a heavy toll on
the American people. In the U.S. alone, there are 25.8 million people with diabetes. This is
8.3% of the total U.S. population and the 6th leading cause of death (CDC, 2011). The overall
annual cost for care is a staggering $174 billion. Hospital costs of care accounts for $87
billion or half of the annual cost. Hospital admissions for people with diabetes is prevalent,
accounting for 7.7 million hospital admissions or one out of every five hospital admissions.
Patients with diabetes also trigger more emergency department visits, have longer lengths
of stay, and higher cost of care than patients without diabetes (ADA, 2008).
Poor glycemic control in the hospital setting can lead to deleterious clinical
outcomes and increased economic costs. That is why glycemic control is widely recognized
as an integral part of inpatient care. Glycemic management of hospitalized patients,
however, is complex and requires considerable hospital resources. Wide glucose variability,
persistent hyperglycemia, recurrent, and severe hypoglycemia are implicated in poor
outcomes (Krinsley, 2003, 2008; Krinsley & Grover, 2007). Evidence suggests that
hyperglycemia during acute illness is a marker of poor clinical outcomes that lead to
increased morbidity, mortality, and length of stay (Krinsley, 2004; Umpierrez et al., 2002).
1

When blood glucose (BG) is intensively controlled to near normal BG levels of
approximately less than 140 mg/dl, it reduces the risks of multi-organ failure, sepsis,
morbidity, mortality, and length of stay (Krinsley & Grissler, 2005; Van den Berghe et al.,
2001).
Patients with diabetes occupy approximately 12% to 25% of all hospital beds (Cook,
et al., 2009; Moghissi, 2004). This rate will continue to rise as the incidence of diabetes
increases nationwide. Hospital organizations and healthcare agencies recognize that
optimum glycemic control not only improves patient outcomes, it also reduces hospital
costs. In an effort to improve outcomes, hospital institutions nationwide implemented
programs to improve inpatient glycemic control. Glycemic targets for critical care units are
mean BG levels of 140 - 180 mg/dl and less than 140 mg/dl for acute care. The American
Diabetes Association (ADA) and the American College of Clinical Endocrinologists (AACE)
recommended these targets with a caveat - achieve euglycemia, control hyperglycemia but
limit the possible deleterious consequences of severe hypoglycemia (ADA, 2010; Moghissi,
et al., 2009).
Inpatient glycemic management is complicated because there are many factors that
affect blood glucose control (Smith et al., 2005). Hospital organizations nationwide were
quick to adopt various forms of insulin protocols with mixed successes and failures. The
increased use of insulin in the hospital setting brought new challenges for clinicians and
healthcare providers regarding patient safety issues. Insulin is the number one drug
implicated in medication errors causing harm, according to the MEDMARX® data report (a
national reporting program for medication errors and adverse drug reactions submitted by
2

participating hospital facilities) published by the United States Pharmacopoeia (Hicks,
Becker, & Cousins, 2008). The AACE and ADA recognized that hospital systems might
require administrative support and inpatient glycemic expert providers to successfully
monitor patient safety and manage care (Moghissi, 2004; Moghissi, et al., 2009). Some
studies demonstrated that a diabetes team approach to hospital glycemic management and
transition to ambulatory care were effective in controlling inpatient blood glucose,
improving post discharge A1C levels, and decreasing length of stay (Flanagan et al., 2008;
Jakoby et al., 2008)
Additionally, hospital organizations recognize that in the current healthcare
environment, physicians do not have the time or the perceived expertise to manage the
intricate daily issues related to glycemic care (Smith et al., 2005). Many hospitals turned to
specialized glycemic management teams (GMT) to address inpatient glucose management.
Many of these GMTs are staffed with a team of healthcare professionals, which include, but
are not limited to, any or all of these team members: physicians, advanced practice nurses,
diabetes nurse educators, pharmacists, and/or dietitians (Jakoby et al., 2008; Flanagan, et
al., 2008).
The current national economic situation and lack of access to physicians in rural
areas are some of the reasons for the increased presence of nurse practitioners (NPs) in
various outpatient and inpatient settings. Although there are some practice differences
between physicians and NPs, in a study conducted by Mundinger and associates (2000),
NPs performing at the same authority and responsibility as physicians, had comparable
patient outcomes.
3
In the last decade, various approaches to achieving glycemic control have been
established at several institutions in the U.S. and abroad. Despite these efforts, glycemic
control remains suboptimal (Boord et al., 2009). While there is empirical support for the
benefits of intensive inpatient glucose management, there is limited research on its
economic costs or savings in relation to clinical outcomes. Moreover, there is less scientific
evidence on the impact of GMTs in the care of patients with BG abnormalities who have
complex and extensive healthcare needs.
Research Aims
Hospitals have allocated considerable resources for inpatient glycemic management
with the use of a dedicated GMT. This retrospective research study is designed to
determine if there are significant differences in the characteristics of a sample of patients
receiving traditional care under a physician alone versus GMT (Also see Table 7). Study
aims include:
1. Characterize the study population (i.e., age, gender, ethnicity, admission diagnosis,
admission BG, A1C level, BMI, co-morbid conditions) by type of care delivery.
2. Examine the differences in glycemic control: mean BG, good glucose control (BG 71
- 180 mg/dl), incidences of mild to moderate hyperglycemia (BG 181-299 mg/dl),
severe hyperglycemia BG >300 mg/dl), mild to moderate hypoglycemia (BG 41-<60
mg/dl), and severe hypoglycemia (<40 mg/dl), by type of care delivery.
3. Examine which glycemic control variables predict rates of clinical outcomes
(hospital complications, LOS, inpatient mortality, and 30-day readmission).
4

4. Assess the relationship of glycemic control variables with economic costs (overall
hospital costs and direct costs).
5. Examine the differences in inpatient diabetes services provided by type of care
delivery.
Conceptual Framework
The conceptual framework for this study is based upon concepts derived from the
literature. See figure 1. Inpatient glycemic management has been traditionally the
attending physician's responsibility. Healthcare practices changed over the last few
decades resulting in more complex inpatient management and increased healthcare
provider responsibility. The mounting evidence of the benefits of improved glycemic
control added another layer of responsibility to an already demanding physician schedule.
Hence, GMT was implemented to provide assistance to physicians in improving glycemic
control for hospitalized patients with diabetes or hyperglycemia.
The main assumption of this study is that the GMT-managed patients, despite having
more co-morbid conditions, will have improved glycemic control, decreased in-hospital
complications, and decreased costs compared to patients managed alone by the physician.
Hence, this study will focus on the differences in the clinical outcomes and economic costs
between the two provider groups, as well as determine if there is a relationship between
the ranges of glucose control predictor variables with various clinical and economic
outcomes (See Figure 1).
5
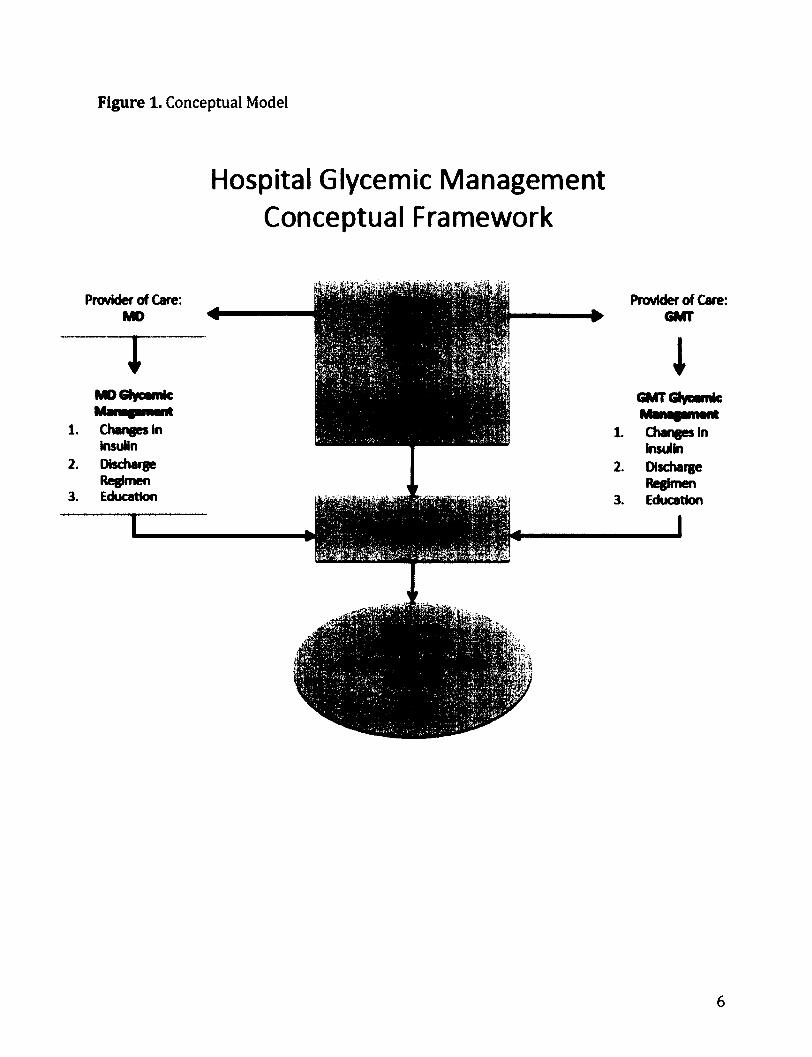
Figure 1. Conceptual Model
Hospital Glycemic Management Conceptual Framework
Provider of Care: MD
T MOGtycamk
1.
2.
3.
Changes in insulin Discharge Regimen Education
ii
Provider of Care: GMT
J GMT Gtycamk
1. Changes In insulin
2. Discharge Regimen
3. Education
6

CHAPTER 2: REVIEW OF LITERATURE
There are countless research studies in inpatient hyperglycemia, hypoglycemia, and
glucose management, especially in the first decade of the 21st century. Scientific research
interest in inpatient glycemic control has been escalating across the globe. Since the
general topic of hospital glycemic control is extensive, a methodical effort was made to
present only a synopsis of the most pertinent diabetes care research studies in relation to
this research study. The contents of this chapter are organized into ten sections.
1. Introduction: provides a brief overview and statistical facts about inpatient diabetes.
2. Critical care setting: reviews landmark studies that may have broadened research in
inpatient hyperglycemia and its management.
3. Surgical care setting: discusses the role of hyperglycemia in surgical patients.
4. General hospital ward setting: elaborates on hyperglycemia and patient outcomes in
this population.
5. Hypoglycemia: discusses its role in inpatient clinical outcomes.
6. A1C: states the role and clinical utility of obtaining the laboratory diagnostic
measure in the hospital setting.
7. Discharge plan: reviews the outcomes of effective discharge planning for patients
with chronic care needs.
7

8. Role of the advanced practice nurse: discusses the important role of the nurse
practitioner in various settings, especially in chronic care management of the
hospitalized patient with diabetes.
9. Conceptual framework: depicts the relationship of the provider BG management on
the patient outcomes
10. Summary: recaps the all the important points in this chapter leading to the methods
and statistics chapter.
Introduction
Diabetes is the most common co-morbid condition for patients admitted in the
hospital setting. In over a period of 18 years, there was a remarkable increase in hospital
stays of patient with diabetes from 2.8 million in 1990 to 7.7 million in 2008 (Fraze, Jiang,
& Burgess, 2010). Prior to the turn of the 21st century, inpatient hyperglycemia was poorly
managed or ignored. The use of sliding scale insulin (SSI) was prevalent despite severe
criticisms by diabetologists against its use. There is insufficient evidence on its benefits of
SSI therapy in the inpatient setting (Queale, Seidler, & Bracanti, 1997). There were only a
small number of studies focusing on inpatient glycemic management prior to the release of
the Leuven I study in 2001 (Van Den Berghe et al., 2001). This landmark study changed the
course of inpatient glycemic management heading into the 21st century.
8

Critical Care Setting
The Leuven I was a prospective, randomized, controlled study conducted in Belgium.
The investigators examined 1,548 cardiovascular post-operative patients in the surgical
intensive care setting. The patients were given insulin therapy to manage their BGs. A total
of 783 patients were assigned to conventional therapy with a mean BG goal of 180 mg/dl to
200 mg/dl. The other group of 765 patients was intensively controlled to a mean BG goal of
80 mg/dl to 110 mg/dl. Results were favorable in the intensively treated group with
decreased intensive care unit (ICU) mortality by 34%, sepsis by 46%, dialysis by 41%,
blood transfusion by 50%, and polyneuropathy by 44% (Van Den Berghe et al., 2001).
Following the tremendous success of the Leuven I study, Van den Berghe and
colleagues (2006) conducted the Leuven II study. This prospective, randomized, controlled
study of 1,200 medical intensive care (MICU) patients investigated the reduction of
morbidity and mortality with intensive insulin therapy. The findings suggested that there
was no overall decrease in mortality in the intensively treated group versus the control
group. Mortality rate slightly increased in patients who received intensive insulin therapy
who stayed in the ICU less than 3 days. However, for those intensively treated patients who
stayed in the ICU greater than 3 days, the mortality rate decreased. Morbidity was reduced
in the intensively treated group. Furthermore, intensive glucose control prevented new
kidney injury, reduced the duration of mechanical ventilation, and shortened ICU stay (Van
den Berghe et al., 2006).
Two years after the publication of the Leuven I study, Krinsley (2003) examined
glucose control outcomes in a mixed medical and surgical ICU in Stamford Hospital,
9

Stamford, Connecticut. Retrospective data was collected from 1,826 consecutive patients
between October 1999 and April 2002. Patients with mean BG values between 80 mg/dl
and 99 mg/dl had the lowest ICU mortality of 9.6%. Mortality rate progressively worsened
with the increase in mean BG values reaching 42.5% on patients with mean BG values
greater than 300 mg/dl (Krinsley, 2003).
Following his 2003 publication, Krinsley (2004) assessed the effects of intensive
glucose management using a protocol in the same heterogeneous ICU setting. A total of 800
well-matched participants were enrolled in the study. The use of the protocol significantly
improved mean BG levels from pre-intervention baseline to post-intervention (baseline
group= 152.3 mg/dl to 130.7 mg/dl vs. treatment= 130.7 mg/dl to 119 mg/dl) without
significantly increasing the risk for severe hypoglycemia less than 40 mg/dl (0.35% to
0.34%). The number of patients with new kidney dysfunction and the need for blood
transfusion decreased after protocol implementation. The number of hospital-acquired
infections did not significantly change. Mortality rate decreased from 29.3% to 20.9%, and
mean length of stay (LOS) decreased from a baseline 3.58 days to 3.19 days with treatment
(Krinsley, 2004).
In 2008, Krinsley presented his results on the role of glycemic variability (GV) in
hospital mortality. This study was a retrospective review of 3,250 prospectively evaluated
patients from October 1999 to October 2007. BG ranges were grouped into four standard
deviation (SD) quartiles with quartile 1 having the lowest SD and quartile 4 with the
highest SD. The study showed that GV is a strong independent predictor of mortality. The
10

lower SD quartile was associated with a lower mortality rate. As the SD quartile increased,
mortality rate also correspondingly increased (Krinsley, 2008).
The most current study to date was a large international multicenter study
conducted by the NICE SUGAR study investigators in 2009. A sample size of 6,104 non-
eating patients with hyperglycemia [with or without history of diabetes) was examined.
This is a parallel group, randomized, controlled study looking at MICU and S1CU patients in
42 hospitals (38 academic and 4 community hospitals) in the United States, Australia, and
New Zealand. The intensively controlled (IC) group of 3,054 patients had a mean BG goal of
81-108 mg/dl while the control group (CG) of 3,050 patients had a mean BG goal of less
than or equal to 180 mg/dl. The primary endpoint was death within 90 days of study
enrollment. The secondary endpoints were survival after 90 days, cause of death, duration
of mechanical ventilation, renal failure, 1CU stay, and hospital stay. Tertiary endpoints are
death from any cause within 28 days, place of death (ICU or another level of care),
incidence of new organ failure, positive blood cultures, and need for blood transfusions.
The results were significant for intensively controlled group versus the control group as
follows: mean BG of 107 mg/dl vs. 142 mg/dl, increased insulin use with 97.2% vs. 69%,
increased mortality with 27.5% vs. 24.9%, 1CU mortality of 62.9% vs. 66.3%, and increased
risk of severe hypoglycemia <40 mg/dl with 6.8% vs. 0.5%, respectively. It is important to
note that a major limitation of this study is that a substantial portion of the intensively
treated patients in the study did not achieve target BG goal (NICE SUGAR Investigators,
2009).
11

Surgical Care Setting
In Portland, Oregon, Furnary and his colleagues (2003) evaluated 3,554 post
coronary artery bypass surgery (CABG) patients from 1987 to 2001. Patients where placed
on subcutaneous insulin and patients from 1992 to 2001 were on continuous insulin
infusion (CII) for aggressive hyperglycemia management. The results from this
observational study indicated that mortality rate was lower for insulin infusion (2.5%)
compared to subcutaneous insulin (5.3%). Furthermore, perioperative glycemic control
using continuous insulin infusion on the day of surgery through post-operative day two
showed an absolute mortality rate of 57% in the diabetes population.
Furnary and Wu (2006) released findings on coronary artery bypass graft (CABG)
patients - an ongoing prospective, nonrandomized, interventional study of 5,534 patients
with diabetes who were placed on CII for 3 days (on the day of surgery through post
operative day two). Associations of various outcomes to levels of hyperglycemia were
found including: (1) inpatient mortality rate increased corresponding to increases in BG
levels with a marked increase at BGs > 250 mg/dl; (2) deep sternal wound infection (DSWl)
rates sharply increased at BG levels > 175 mg/dl; (3) length of stay (LOS) gradually
increased corresponding to incremental increases in BG levels: and, (4) inpatient
complications, i.e., blood transfusions, new onset atrial fibrillation, any type of infection,
low cardiac output syndrome, prolonged ventilation, pneumonia, and cerebrovascular
accidents correlated to increases in BG levels. Tight glycemic control for the first 3 days
post-surgery effectively reduced BGs to near normal levels, reduced mortality rate by 65%,
DSWl by 63%, and LOS by 2 days. Based on the results of this study, Furnary and his
12

associates advocated tightening BG control on the first 3 days post-CABG, also known as 3-
BG (Furnary & Wu, 2006).
Some studies were also conducted on noncardiac surgical patients to evaluate
glucose control outcomes for this population. Umpierrez and his colleagues (2011)
examined 211 patients who were randomly assigned to two treatment groups: basal-bolus
insulin regimen (n=104), and sliding scale regimen (n=107). The purpose of the study was
to evaluate optimal treatment of hyperglycemia for this population to prevent poor
outcomes. Since these patients did not require an ICU stay, subcutaneous insulin regimen
was the treatment of choice. The study showed that the patients who were placed on basal-
bolus insulin regimen had improved glycemic control and reduced complications compared
to the patients on sliding scale insulin regimen.
Frisch and colleagues (2010) conducted a retrospective study at Emory University
Hospital in Atlanta, GA on 3,184 patient medical records. The patients in the sample had
any of the following surgeries: general, neurosurgery, oncology, orthopedic, vascular,
thoracic, urology, otolaryngology, and gynecology. The objective of the study was to
determine the impact of perioperative hyperglycemia on clinical outcomes such as, LOS,
complications, and mortality. Overall 30-day mortality was 2.3% significantly higher in
patients with higher BG levels before and after surgery, than patients with lower BG levels.
Perioperative hyperglycemia was associated with longer hospital and ICU LOS, with higher
incidences of postoperative pneumonia, systemic blood infections, urinary tract infections,
and acute myocardial infections. In a multivariate analysis adjusted for age, gender,
13

ethnicity, and severity of surgery, mortality risk increased in proportion to perioperative
BG levels in patients with no prior history of diabetes.
General Hospital Ward Setting
Hyperglycemia is not unique in the 1CU setting yet majority of the earlier studies
conducted since Leuven I in 2001 and other studies through 2004 were primarily on
critical care patients. In 2002, Umpierrez and his associates published their retrospective
study on hyperglycemia as a marker for inpatient mortality in the general inpatient (ICU
and non-ICU) population. They evaluated 2,030 consecutive adult patients with
hyperglycemia (with or without prior history of diabetes) in Georgia Baptist Medical
Center in Atlanta, Georgia. The study period was from July 1,1998 to October 20,1998. The
primary endpoint was death. The secondary endpoints were treatment of hyperglycemia,
LOS, and disposition at discharge. Hyperglycemia was defined as a fasting BG >126 mg/dl
or a random BG > 200 mg/dl twice during the hospital stay. Results showed that
hyperglycemia was present in 38% of the total hospital population (26% with history of
diabetes and 12% with no prior history of diabetes). New hyperglycemia was associated
with increase in mortality rate of 16% vs. 3% on patients with history of diabetes. New
hyperglycemia was also associated with increased LOS and admission to the ICU.
Furthermore, hyperglycemia was also associated with decreased likelihood of patients
being discharged to home and increased transfer to transitional care units or long-term
care facilities.
Umpierrez and associates (2002) showed that new hyperglycemia caused poor
outcomes in the acute care population. The effects of admission hyperglycemia in the acute
14

care setting on patients with type 2 diabetes who were admitted into the hospital for the
first time with pneumonia was investigated by a group of researches in Denmark in 2007.
They retrospectively examined whether patients with type 2 diabetes had increased
mortality and complications after pneumonia. They also wanted to know if there was any
value of admission hyperglycemia in this cohort. 29,900 patients were admitted for the
first time into the hospital for pneumonia between 1997 and 2004 in North Jutland and
Aarhus counties. A total of 2,931 pneumonia patients with type 2 diabetes met study
criteria. A regression model was applied to assess for relative risk of pneumonia,
bacteremia, and mortality rates. The results showed that there were increased mortality
rates among the patients with diabetes than patients with no diabetes, 19.9% vs. 15.1%
after 30 days, and 27% vs. 21.6% after 90 days. The presence of type 2 diabetes was not
predictive of pulmonary complications and bacteremia. This study showed that type 2
diabetes and admission hyperglycemia are associated with pneumonia-related deaths.
Hypoglycemia
Hypoglycemia is not an uncommon problem in hospitals nationwide. The first
national and emergency department-based epidemiological study reported approximately
5 million emergency department (ED) visits over 12 years (1993-2005) that was related to
hypoglycemia. 25% of these visits resulted in a hospital admission. This is approximately
34 per 1000 patients who have diabetes. The rate of hypoglycemia-related visits in the ED
did not increase over time despite increase emphasis on tight glucose control (TGC) (Ginde
etal., 2008).
15

Tightening control of BGs can increase the risk of acute hypoglycemia. Many of the
inpatient studies related to TGC reported incidences acute hypoglycemia. Whether acute
hypoglycemia is a marker of poor prognosis or an independent cause of mortality is still
inconclusive. Nevertheless, hypoglycemia management requires increased hospital
resources; it is an unpleasant and dangerous adverse reaction from severe illness or insulin
therapy; and, both acute and chronic hypoglycemia has been associated with increased
mortality.
Most notable randomized controlled trials (RCTs) and other observational studies
reported incidences of severe hypoglycemia with BGs <40 mg/dl. The RCTs that reported
acute hypoglycemia are the Leuven I, Leuven II, and VISEP studies. Observational studies
targeting the ICU population were reported in the Krinsley (Stamford, CT) and Vriesendorp
(Belgium) studies. Turchin and colleagues also published a study on hypoglycemia in
hospitalized patients with diabetes in the general acute care setting.
In the Leuven I study with 1,548 patients in the surgical intensive care unit, severe
hypoglycemia with BG <40 mg/dl occurred in 5.1% (39/765) of the intensively treated
group versus 0.8% (6/783) of the controlled group (Van den Berghe et al., 2001). In the
Leuven II study with 1,200 patients in the medical intensive care unit, 18.7% (111/595)
patients in the intensively treated group had severe hypoglycemia compared to 3.1%
(19/605) of the control group (Van den Berghe et al., 2006). When the data for the Leuven I
and II were pooled together, severe hypoglycemia occurred in 11.3% (154/1360) of
patients in the intensively treated group and 1.8% (25/1388) of patients in the control
group (Van den Berghe et al., 2001; 2006).
16

The Efficacy of Volume Substitution and Insulin Therapy in Severe Sepsis study
(VISEP) was study conducted in Germany with 537 severe sepsis patients. It was widely
publicized because the study was abruptly terminated due to the high incidence of
hypoglycemia 17% (42/247) in the intensively treated group compared to 4.1% (12/290)
in the control group (Brunkhorst et al., 2008).
In the study done by Krinsley (2005) with 1600 patients (800 patient pre- and 800
post glucose management protocol institution), the incidences of hypoglycemia with BG
<40 mg/dl were 0.35% and 0.34% respectively. The findings were not significant between
the two groups. In a subsequent retrospective study by Krinsley and Grover (2007) with
5365 patients (2666 pre and 2699 post implementation of TGC), the incidences of severe
hypoglycemia were 1.5% and 1.3%, respectively.
Vriesendorp and colleagues (2006) examined the short-term consequences of
hypoglycemia (coma, seizures and death) in the ICU. They examined 245 occurrences of
BGs <45 mg/dl with 156 patients over a period of 2 years. The researchers found that
seizures and coma occurred infrequently with their study population. Furthermore, they
found no relationship between incidental hypoglycemia and mortality. However, with a
small data set and lack of randomization, they could not fully exclude hypoglycemia having
a causative role in mortality in patients admitted to the ICU.
Turchin and colleagues (2009) published a retrospective study on the relationship
of hypoglycemia with BG <50 mg/dl and clinical outcomes on patients with diabetes
admitted to the general ward. They studied a cohort 4,368 admissions of 2,582 patients
between January 2003 and August 2004. Hypoglycemia was observed in 7.7% of the
17

admissions. The results showed that hypoglycemia was associated with increased mortality
during the hospital stay and 1-year from discharge. Each additional day of hypoglycemia
was associated with an increase of 85.3% odds of death and three-fold increase odds of
death for every lOmg/dl decrease in the lowest BG during hospitalization. LOS also
increased by 2.5 days for each additional day with hypoglycemia. This means that inpatient
mortality and LOS increased gradually as the number of hypoglycemic events rose.
Glycosylated Hemoglobin A1C
AiC assays are traditionally used in the outpatient setting to measure average blood
glucose during the previous two to three months. AiC assays are expressed as the
percentage of hemoglobin that is glycated. AiC assays are becoming a routine part of
laboratory testing for patients with diabetes (Nathan, et al. 2008). Normal AiC level is 4-6%.
An AiC of >6.5% is predictive of diabetes. Good glucose control is an AiC of <7% (ADA,
2011). Both patients and practitioners generally have to find a conversion chart to find the
average glucose corresponding to the AiC. Nathan and his associates (2008) examined 507
participants with type 1 diabetes (n=268), type 2 diabetes (n=159), and patients with no
diabetes (n=80) to determine if AiC can be accurately expressed as an average glucose
(eAG). The linear regression equations did not differ significantly across the study sample.
In 2009, the Internal Expert Committee on the role of the AiC assay in the diagnosis of
diabetes recommended the routine use of AiC in the diagnosis of diabetes (The
International Expert Committee, 2009).
The use of AiC assay was uncommon in the inpatient setting until the last decade of
the 20th century. AiC assays are increasingly being utilized in the inpatient setting due to
18

the increasing prevalence of hospitalized patients with diabetes and hyperglycemia with no
prior history of diabetes. Wexler and associates (2008] examined the prevalence of
unrecognized diabetes in 695 hospitalized adults with no history of diabetes using AiC
assays. The study results showed that 18%, or 1 in every 5 patients admitted to the
hospital with no history of diabetes, had an elevated AiC >6.1% (Wexler et al. 2008).
There is ample evidence that AiC has great clinical utility in the hospital setting,
especially in the day-to-day management of glucose control and subsequent diabetes
discharge planning.
Discharge Plan
Inpatient to outpatient transfer of care is an important part of good glycemic care.
Patients enrolled in established and well-structured outpatient diabetes care follow-up
have better outcomes. Although the outpatient outcomes of diabetes follow-up are well
recognized, there is little known about the transfer of care from inpatient to outpatient.
When managing inpatients with complex diabetes care needs, it is important to link these
patients back to outpatient care.
Wheeler and associates (2004) reported a retrospective study of 658 inpatients of a
municipal hospital in the heart of downtown Atlanta. A hospital-based certified diabetes
nurse educator (CDE) saw most of the patients as an inpatient. The follow-up care was
stratified into outpatient follow-up (69%), acute care follow-up (15%), and no follow-up
(16%). The odds for coming to the Diabetes Clinic increased if patients were discharged
with insulin, had new onset diabetes, or had a direct referral from the CDE.
19

Four years after the publication of Wheeler and associates' (2004) study, Cook and
colleagues (2009) released a review article on Endocrine Practice about effective planning
for inpatient to outpatient transfer of diabetes care. Their web search for studies related to
diabetes discharge planning (between 1998 and 2007) yielded very few and inadequate
results. This means there were limited studies available on diabetes discharge planning
before Wheeler's study and thereafter.
Discharge planning has become a national patient safety goal and priority addressed
by the National Patient Safety Goals and the Centers for Medicare and Medicaid Services
(Cook et al., 2009). The Joint Commission made it a national priority by setting guidelines
and offering hospitals an option to become certified in inpatient diabetes (Joint
Commission, 2011). Cook and associates (2009) defines effective diabetes discharge as one
where the patient received necessary skill training while in the hospital, and provided a
clear and understandable post-discharge plan.
Discharge planning with diabetes nurse follow-up has been shown to improve
patient adherence to treatment regimen and improve AiC. Wong and associates (2005) did
a randomized prospective study in the medical department of a regional hospital in Hong
Kong. A total of 101 patients were included in the study, 49 in the control group and 52 in
the study group. The outcome measures were AiC, self-care adherence, health care
utilization, and patient satisfaction. The results showed that patients in the study group had
better AiC, higher blood glucose monitoring, higher exercise adherence, lower LOS, and
lower overall cost. There was no difference in patient satisfaction.
20

Since inpatient glycemic management is multidimensional, a thorough glycemic
management should include addressing both inpatient glucose control and effectively
planning diabetes self-management for discharge.
Advanced Nursing Practice Role in Diabetes Management
The increased demands on both the physicians and nurses leave little time to
address the patients' insulin requirements based on glucose variability and rapidly
changing needs. Some of the challenges to effective inpatient glycemic management and
discharge planning were identified from a physician's perspective and the nursing
perspective (Cook, et al., 2009).
From the physician's perspective, patients with preexisting diabetes may be difficult
to manage because: (1) majority of the focus of care is on the co-morbid conditions that
triggered the hospital admission; (2) fear of hypoglycemia causing deleterious effects; (3)
insulin administration is only initiated at BG levels of greater than 180 mg/dl to 200 mg/dl;
(4) inadequate adjustment of diabetes medications due to alteration in nutritional support
and medical illness, (5) unpredictability of hospital-related procedures; and (6)
medications can affect glucose metabolism (Cook et al., 2009; Lansang & Umpierrez, 2008).
The nurses also face challenges similar to those faced by physicians. This includes finding
little to no time for comprehensive diabetes education and discharge planning, in addition
to juggling an ever increasing patient care tasks (Cook et al., 2009).
The physician or a nurse individually, or both, may be inadequately equipped to
handle the challenges of a comprehensive inpatient glycemic management. It requires a
multidisciplinary team to sufficiently tackle complex disease management. Disease
21

management is a patient care service that is coordinated and comprehensive, addressing
care across the health care delivery continuum. A review of 102 research studies showed
that disease management programs were associated with improved outcomes such as
patient satisfaction, patient adherence, disease control, patient knowledge, morbidity, and
mortality (Ofman et al., 2004). Many of these disease management programs are staffed
with registered nurses (RNs), advanced practice nurses (APNs), and other healthcare
professionals who have specialized training or expertise in their particular field of disease
management. It is not uncommon to find nurses in disease management teams because
nurses have a unique insight in the patient's care needs.
Although nursing has been around for centuries, advanced nursing practice first
emerged in the later part of the 20th century. Despite being only half a century old, the
nurse practitioner (NP) practice has undergone many professional, academic, and role
changes over the last five decades. The NP role is now an integral part of the mainstream
health care delivery system. NPs traditionally practiced in the outpatient care setting but
the emerging demands of complex disease management and the increasing role of disease
management teams have shifted the NPs' practice towards the inpatient setting.
NP practice has been extensively researched in terms of the quality of care and
patient outcomes compared to physicians. Mundinger and colleagues (2000) conducted a
randomized controlled trial to compare the outcomes of patients assigned to NPs or
physicians for a primary care follow-up and ongoing care after an emergency room visit. A
total of 1316 patients were enrolled in the study; 806 randomized to NPs and 510
randomized to physicians. No significant differences were found in patient's health status
22
at six months between the two groups. Physiologic tests results for both diabetes and
asthma were also not different. Patients with hypertension showed lower diastolic value
for the NP group versus the physician group. No difference was found in healthy services
utilization and patient satisfaction at initial visit. Interestingly, physicians had higher
patient satisfaction scores at six months. Where the NP practice is held at the same
authority, responsibilities, productivity and administrative requirements, and have the
same patient population as the primary care physicians, patient outcomes appear equal in
all but one domain (Mundinger et al., 2000).
Another study comparing patient care delivery between NPs and physicians was
conducted in a large teaching hospital in Iowa (Pioro et al, 2001). They randomly assigned
318 patients admitted to a general medical ward to either NPs or housestaff. The NP group
had 193 patients and the housestaff group had 188 patients. Patient demographics were
similar for both groups. Outcomes at discharge and six weeks thereafter were similar in
both groups including LOS, charges, costs, consultations, complications, transfers to ICU,
30-day mortality, patient assessments of care, changes in activities of daily living, SF-36
scores, and symptom severity. However, 90 of the 193 patients under the NP group were
transferred to the care of the housestaff by NP or housestaff request. Despite the change in
sample population distribution, the care between the two groups was similar.
NPs have also expanded their role in diabetes case management. Mullen and Kelly
(2006) reviewed 57 patient cases that were followed by NPs who performed the diabetes
case manager roles. The study evaluated AiC, total cholesterol (TC), and low-density
lipoprotein (LDL), six months after discharge. Significant reductions in AiC and TC were
23

observed but no reduction in LDL was noted. This study showed that for this patient
population, patients followed by APNs as diabetes nurse case managers had improved
outcomes.
NPs who are providers and case managers of diabetes care are often part of
multidisciplinary teams. Jakoby and colleagues (2008) conducted a prospective, nine-
month study on 308 admissions, to determine the impact of a glycemic management team's
intervention on both hospital and outpatient glycemic control. The team consisted of an
endocrinologist, a nurse practitioner, diabetes nurse educators, and registered dietitian. As
a team, they provided a coordinated glycemic management during the patient's hospital
stay. BG levels improved significantly with the team's intervention (195 ± 72 mg/dl to 162
± 41 mg/dl). AiC measures also improved with 8.2% ± 2.1% prior to admission versus
three months after discharge with 7.3% ± 1.6%. Approximately 80% of patients agreed to
basal-bolus therapy after discharge compared to 56.8% prior to admission. Approximately
82.6% of patients discharged on basal-bolus insulin regimen were still on the regimen
three months after discharge. The study supports that a team approach to patient care
improves diabetes self-management and improve both inpatient and outpatient glycemic
control (Jakoby et al., 2008).
Other than NPs, clinical nurse specialists (CNS) have also taken a role in inpatient
glycemic management teams. In an article that appeared in Clinical Nurse Specialist, Custer
(2010) described the role of a CNS in improving glucose management in an ICU setting. The
study evaluated glucose control of 124 patients. 64.5% (80/124) did not receive any
treatment. 22.6% received sliding scale insulin injections other than the standardized
24
orders. 12.9% received either the standardized basal-bolus subcutaneous insulin orders
(4% or 5/124) or insulin infusion (8.9% or 11/124). When the standardized orders were
used correctly, the mean BG level was 175 mg/dl with a median of 149 mg/dl. When the
standardized orders were not used correctly, the mean BG level was 206 mg/dl with a
median of 190 mg/dl. The CNS encountered many challenges in implementing the program
including provider's persistence with using sliding scale insulin, lack of basal insulin use,
and inconsistent use of standardized orders. The author also noted that the CNS role was
limited due to the lack of prescribing privileges to initiate glycemic management orders.
Conceptual Framework
Inpatient glycemic management has been traditionally the responsibility of the
attending physician caring for the patient. Healthcare practices changed over the last few
decades resulting in more complex inpatient management and increased healthcare
provider responsibility. The mounting evidence of the benefits of improved glycemic
control added another layer of responsibility to an already demanding physician schedule.
Hence, GMT was implemented to provide assistance to physicians in improving glycemic
control for hospitalized patients with diabetes or hyperglycemia.
The main assumption of this study is that the GMT-managed patients, despite having
more co-morbid conditions, will have improved glycemic control, decreased in-hospital
complications, and decreased costs compared to patients managed alone by the physician.
Hence, this study will focus on the differences in the clinical outcomes and economic costs
between the two provider groups, as well as determine if there is a relationship between
25

the a ranges of glucose control predictor variables with various clinical and economic
outcomes (See Figure 1).
Figure 1. Conceptual Model
Hospital Glycemic Management Conceptual Framework
Provider of Care: MD
T MOQycmlc
1. Changes In insulin
2. Discharge Regimen
3. Education
sr'-r
Provider of Care: GMT
1 GMT Gtycamk
1. Changes in insuttn
2. Discharge Regimen
3. Education
26
Summary
Successful implementation of a glycemic control program in the hospital setting may
depend on effectively addressing the barriers or obstacles to success. These obstacles are
(1) physicians are inadequately equipped to deliver diabetes care alone; (2) tightening
glucose control to improve patient outcomes while minimizing or avoiding severe
hypoglycemia; and, (3) providing clear discharge plan and instructions.
The institution of GMTs in the hospital setting hopes to address these challenges.
The GMT provides additional resources for physicians and staff in managing patients'
glycemic control. (2) As the resident glycemic control experts, control patients' BGs to
glycemic targets while minimizing or avoiding severe hypoglycemia. (3) Address the
patients' discharge needs by providing a comprehensive discharge plan.
The GMT in this study consists of NPs and diabetes nurse educators (CDE) who are
under the supervision of the diabetes medical director. Together, and in collaboration with
attending physicians, pharmacists, dietitians, and nurses, they provide care for patients
referred to the GMT. Once the patient is referred to the GMT, the NPs will assume
responsibility in managing the patient's glucose control and diabetes discharge treatment
modification during the hospital stay. The NPs keep similar hours as the attending
physicians, providing coverage 24-hours a day. The diabetes nurse educators function as
diabetes case managers along with the NPs. The diabetes nurse educators are available
Monday through Friday to provide patients with diabetes survival skills, education,
supplies, resources and referral to outpatient diabetes education or case management.
27

CHAPTER 3: METHODOLOGY
Significance of the Study
In the last decade, a plethora of the research studies showed that improved blood
glucose control resulted in better clinical outcomes. Economic cost savings have not been
as thoroughly investigated, but have been largely assumed. The ADA, AACE, and other
medical organizations recommended the use of a chronic disease management team like
the GMT; however, its use has not been thoroughly evaluated in relation to clinical
outcomes and economic costs.
In this era of economic downturn and increased healthcare costs amidst the new
healthcare reform environment, limiting costs while improving outcomes are a priority.
The results of this study can inform and guide healthcare agencies, policy makers, clinicians,
researchers, educators, and healthcare consumers about the effects of glycemic control on
clinical outcomes and economic costs.
Despite the increased use of NPs in the outpatient setting, NP practice is still
relatively uncommon in the inpatient setting. Outcomes related to inpatient glucose
management by the GMT, where NPs primarily manage glucose control, can promote
advanced practice nursing, direct nursing education, and stimulate further research in
nursing science.
The purpose of this study is to examine the key clinical outcomes and economic cost
differences between two service delivery groups, the GMT versus traditional solo physician
management. The main assumption of this study is that the GMT-managed patients, despite
28

having more co-morbid conditions, will have improved glycemic control, decreased in-
hospital complications, and decreased costs compared to patients managed alone by the
physician.
This chapter presents a review of the study aims and questions, and a description of
the research methodology including study aims, study design, sample and sampling,
instrumentation, data collection procedures, data analysis, and the protection of human
subjects.
Research Aims
Aim 1. Characterize the study population (i.e., age, gender, ethnicity, admission
diagnosis, admission BG, A1C level, BMI, co-morbid conditions) by type of
care delivery.
Aim 2. Examine the differences in glycemic control: mean BG, good glucose control
(BG 71 - 180 mg/dl), incidences of mild to moderate hyperglycemia (BG 180
- 299 mg/dl), severe hyperglycemia BG >300 mg/dl), mild to moderate
hypoglycemia (BG 41-<60 mg/dl), and sever hypoglycemia (<40 mg/dl), by
type of care delivery.
Aim 3. Examine which glycemic control variables predict rates of clinical outcomes
(hospital complications, LOS, inpatient mortality, and 30-day readmission).
Aim 4. Assess the relationship of glycemic control variables with economic costs
(overall hospital costs and direct costs).
29
Aim 5. Examine the differences in inpatient diabetes services provided by type of
care delivery.
Research Design
This is a cross-sectional, retrospective, quasi-experimental research study that will
be conducted in a 343-bed, nonprofit, urban community hospital in Southern California.
Sample and Sampling
The hospital admitted 3,961 and 3,953 patients with diabetes in 2008 and 2009,
respectively. This does not include patients with hyperglycemia diagnosed during the
hospital stay. 1,000 patient cases per year (2,000 cases for the two years) between January
1, 2008 and December 31, 2009, will be selected randomly from the electronic database for
manual paper chart review. A final sample size of 800 patient cases that meet all study
criteria (see Table 1) will be reviewed. The sample will be equally distributed between the
two groups: 400 for the GMT group and 400 for the physician group.
Inclusion Criteria
• Diabetes/Hyperglvcemia Diagnosis: A diagnosis of diabetes or hyperglycemia
as a secondary diagnosis will be obtained based on descriptions by diagnosis
related group (DRG).
• Age: All pediatric patients, once stabilized in the emergency department
(ED), are sent to the closest children's hospital. The hospital does not offer
inpatient pediatric services. Hence, the sample population for this study will
include adult patients who are 18 year old and older.
30
• Complete patient characteristics and baseline information: all patient cases
should have complete information on age, gender, ethnicity, admission
diagnosis, admission BG, glycosylated hemoglobin AiC (or just called, AiC),
body mass index (BMI), and type of practitioner managing the BG (see Table
2 for listing).
• Length of Stay (LOS): LOS has a specific definition and parameters in terms of
billing. Admit day starts as soon as the physician writes the order and it is
entered into the IDX hospital system software. If the patient is admitted as an
inpatient through the ED, admission Day 1 begins regardless of when the
patient is transferred to the ward/unit. Cut off is at midnight for discharge.
Discharge day is not counted as part of the admission day. For example, if
the patient was admitted in the ED on 01.01.11 and discharged on 01.05.11,
that would be a four-day LOS. For the purpose of this study, patient cases
with LOS of three days or more are included. LOS less than three days will
not provide adequate blood glucose values for analysis of the primary
endpoints; hence, they are excluded from the data.
• BG Values: Two or more glucose values per patient day from point-of-care
(POC) blood glucose fingerstick and laboratory serum glucose are included to
ensure that there is an adequate number of BGs included in the analysis.
31

Exclusion Criteria
• LOS > 14 days: Preliminary analysis of patients with diabetes and
hyperglycemia showed that a cut-off of 14 days includes 85% of the total
patients. The team determined that LOS > 14 days may skew the data
negatively. Patients with LOS >14 days stay for several reasons: they could
have placement issues, hence they stayed in the hospital longer; they have no
insurance, hence they stay so their treatment can be completed before
discharge; or, they are sicker or terminally ill but their level of care requires
hospitalization.
• DKA/HHS Patients: Patients admitted for the primary diagnosis of diabetes
ketoacidosis (DKA) or hyperosmolar hyperglycemic state (HHS) are excluded
from the study. These patients' BGs are intentionally kept outside of the
hospital glycemic targets and at high levels for the first 24-48 hours to allow
for BGs to return to normal or near normal levels gradually.
• Location: only patients admitted to all units in the acute care setting and
critical care setting are included in the study. Patients who are in the long-
term care facilities attached to the main hospital are excluded from the study.
Procedures
Patient cases will be randomly sampled from the pool of patients with the use of the
hospital patient database for the periods described. Patient cases will be selected through
electronic query based on this study's inclusion criteria i.e., a diagnosis of either diabetes or
hyperglycemia (BG > 180 mg/dL during the hospital stay), 18 years of age or older, stayed
32

in the hospital for 3 or more days, have available demographic & baseline data (see Table
2), and recorded BG values of two or more in a 24-hour period. Patient cases that do not
meet all the inclusion criteria or if admitted in diabetes crises will be eliminated from the
analysis (see Table 1).
Data will be obtained through electronic medical records (EMR), electronic financial
records (EFR), and paper chart reviews (PCR). Although the hospital system uses EMR for
some of it's patient information, documentation of clinical information is still largely
entered on paper charts. The basal-bolus order set was implemented on February 14, 2010,
along with the implementation of the GMT to assist in the daily management of BG control.
The GMT only intervened with patients referred by the physician for GMT consult. The
physicians continued to see majority of the patients with diabetes or hyperglycemia
without the assistance of the GMT. It is therefore appropriate to evaluate the impact of GMT
on clinical outcomes and economic costs compared to physicians on measures described on
Table 2.
Data Analysis
Data will be analyzed using the SPSS 18.0.2 and Stata 11.0 programs. Descriptive
and multivariable statistics will be used for data analysis. Descriptive statistics will be
reported on all dependent and independent variables.
Question 1. Is there a difference in patient characteristics between provider
groups (GMT versus physician)? Comparison of patient characteristics
(i.e., age, gender, ethnicity, admission diagnosis, admission BG, A1C
level, BMI, co-morbid conditions) by practitioner types will be
33

analyzed. One-way ANOVA will be used for continuous variables to
determine whether group means differ from each other. Categorical
variables will be analyzed using chi-square to test for fit.
Question 2. Is there a difference in the range of glucose control between the two
provider groups? A Mann-Whitney U will be used to analyze glycemic
control ordinal data between the two provider groups. Glycemic
control predictor variables include mean BG, good glucose control (BG
71 - 180 mg/dl), incidences of mild to moderate hyperglycemia (BG
180 - 299 mg/dl), severe hyperglycemia BG >300 mg/dl), mild to
moderate hypoglycemia (BG 41-<60 mg/dl), and severe hypoglycemia
(<40 mg/dl).
Question 3. Does level of glucose control predict rates of hospital complications,
LOS, inpatient mortality, and 30-day readmission? Logistic regression
will be used to determine odds ratio and describe the relationship
between glycemic control predictor variables and rates of clinical
outcomes (hospital complications, LOS, inpatient mortality, and 30-
day readmission). However, noting that the dependent variables are
count data and the event occurs in a particular event or time frame,
i.e., during the hospitalization, Poisson logistic regression or log-linear
regression modeling may be used.
Question 4. Which predictors account for the variance in cost of hospitalization?
Multiple regression analysis will be employed to determine the
34

relationship of glycemic control variables with economic costs of
overall hospital costs and direct costs.
Question 5. Is there a difference in inpatient diabetic services (glucose
management, diabetes education, and changes in diabetes regimen
upon discharge by type of care delivery? These categorical variables
will be analyzed using chi-square to test for the difference between
the two provider groups in inpatient diabetes services provided such
as glucose management, diabetes education and changes in diabetes
regimen upon discharge.
Table 6 summarizes the research aims, study questions and types of statistics
corresponding to each research inquiry.
Protection of Human Subjects
Institutional Review Board approval will be obtained from the University of San Diego and
associated health care facility. Since the data will be collected retrospectively, there will be no
actual patient contact involving any risk. Precautions will be taken to protect patient privacy in
accordance with the Health Insurance Portability and Accountability Act (HIPAA). Access to
patient identifiers will be limited to data collectors (including the primary investigator, data
analysts, accounting department personnel, and research assistants). Data will be de-identified
prior to transferring the information to the statistician for analysis.
35
References
American Diabetes Association (ADA) (2008). Economic Costs of Diabetes in the U.S. in
2007. Diabetes Care, 321(3), 596-615. doi: 10.2337/dc08-9017
American Diabetes Association (ADA) (2010). Position Statement: Standards of Medical
Care in Diabetes - 2010. Diabetes Care, 33(S1), S11-S61. doi: 10.2337/dcl0-S011
American Diabetes Association (ADA) (2011). Standards of medical care in diabetes.
Diabetes Care, 34(S1), S11-S61. doi: 10.2337/dcll-S011
Boord, ]. B., Greevey, R.A., Braithwaite, S., Arnold, P.C., Selig, P.M., Brake, H., Cuny, J., &
Baldwin, D. (2009). Evaluation of Hospital Glycemic Control at US Academic Medical
Centers. Society of Hospital Medicine, 4(1), 35-44. doi: 10.1002/jhm.390
Brunkhorst, F. M., Engel, C., Bloos, F., Meier-Hellmann, A., Ragaller, M., Weiler, N., et al.
(2008). Intensive insulin therapy and pentastarch resuscitation in severe sepsis.
New England Journal of Medicine, 358(2), 125-139. doi: 358/2/125 [pii]
10.1056/NEJMoa070716
Center for Disease Control and Prevention (CDC) (2011). National diabetes fact sheet:
national estimates and general information on diabetes and prediabetes in the
United States, 2011 (pp. 12). Atlanta, GA: Center for Disease Control and Prevention.
Cook, C. B., Seifert, K. M., Hull, B. P., Hovan, M. J., Charles, J. C., Miller-Cage, V., et al. (2009).
Inpatient to outpatient transfer of diabetes care: Planning for an effective hospital
discharge. Endocrine Practice, 15(3), 263-269.
36

Custer, M. L. (2010). Outcomes of clinical nurse specialist-initiated system-level
standardized glucose management. Clinical Nurse Specialist, 24(3), 132-139. doi:
10.1097/NUR.0b013e3181d82a31 00002800-201005000-00006 [pii]
Ehrlich, S. F., Quesenberry, C. P., Jr., Van Den Eeden, S. K., Shan, J., & Ferrara, A. (2010).
Patients diagnosed with diabetes are at increased risk for asthma, chronic
obstructive pulmonary disease, pulmonary fibrosis, and pneumonia but not lung
cancer. Diabetes Care, 33(1), 55-60. doi: 10.2337/dc09-0880
Flanagan, D., Moore, E., Baker, S., Wright, D., and Linch, P. (2008). Diabetes care in the
hospital-the impact of a dedicated inpatient care team. Diabetic Medicine, 25,147-
151. Doi:10.1111/j. 1464-5491.2007.02326
Frisch, A., Chandra, P., Smiley, D., Peng, L., Rizzo, M., Gatcliffe, C., et al. (2010). Prevalence
and clinical outcome of hyperglycemia in the perioperative period in noncardiac
surgery. Diabetes Care, 33(8), 1783-1788. Doi: dcl0-0304 [pii] 10.2337/dcl0-0304
Ginde, A. A., Espinola, J. A., & Camargo, C. A., Jr. (2008). Trends and disparities in U.S.
emergency department visits for hypoglycemia, 1993-2005. Diabetes Care, 31(3),
511-513. doi: dc07-1790 [pii] 10.2337/dc07-1790
International Diabetes Foundation (IDF) (2009). The world at a glance. Retrieved from at a
glance website:
http://www.diabetesatlas.org/sites/default/files/At%20a%20Glance_
37
International Diabetes Foundation (IDF) (2010). Morbidity and Mortality. Retrieved from
IDF Diabetes Atlas website: http://www.diabetesatlas.org/content/diabetes-
mortality
Jakoby, M. G., Garey, A., Hall, M., Morris, L., Erikson, D., Wardwell, L., et al. (2008).
Management of hospitalized diabetic patients by a hospital diabetes care team
improves both inpatient and ambulatory glycemic control. Abstract. Carle Foundation
Hospital. Urbana, IL.
Joint Commission (2011). Advanced Certification in Inpatient Diabetes Retrieved February
1,2011, from
http://www.jointcommission.org/certification/inpatient_diabetes.aspx
Kornum, J. B., Thomsen, R. W., Riis, A., Lervang, H. H., Schonheyder, H. C., & Sorensen, H. T.
(2007). Type 2 diabetes and pneumonia outcomes: a population-based cohort study.
Diabetes Care, 30(9), 2251-2257. doi: 10.2337/dc06-2417.
Krinsley, J. S. (2003). Association between hyperglycemia and Increased hospital mortality
in a heterogeneous population of critically ill patients. Mayo Clinic Proceedings, 78,
1471-1478.
Krinsley, J. S. (2004). Effect of an intensive glucose management protocol on the mortality
of critically ill adult patients. Mayo Clinic Proceedings, 79(8), 992-1000.
Krinsley, J. S. (2008). Glycemic variability: a strong independent predictor of mortality in
critically ill patients. Critical Care Medicine, 36(11), 3008-3013. doi:
10.1097/CCM.0b013e31818b38d2
38
Krinsley, J. S., & Grissler, B. (2005). Intensive glycemic management in critically ill patients.
Joint Commission Journal on Quality and Patient Safety, 32(6), 308-312.
Krinsley, J. S., & Grover, A. (2007). Severe hypoglycemia in critically ill patients: risk factors
and outcomes. Critical Care Medicine, 35(10), 2262-2267. doi:
10.1097/01.CCM.0000282073.98414.4B
Krinsley, J. S., & Preiser, J. C. (2008). Moving beyond tight glucose control to safe effective
glucose control. Critical Care, 12(3), 149. doi: 10.1186/cc6889
MEDMARX Data Report: A report on the relationship of drug names and medication errors
in response to the institute of medicine's call for action. (2008). In R. W. Hicks,
Becker, S. C., and Cousins, D. D. (Ed.), (pp. 1-406). Rockville, MD: Center for the
Advancement of Patient Safety, US Pharmacopeia.
Mertler, C. A., and Vannatta, R. A. (2010). Advanced and multivariate statistical methods (4th
Ed.). Glendale, CA: Pyrczak Publishing.
Moghissi, E. (2004). Hospital management of diabetes: Beyond the sliding scale. Cleveland
Clinical Journal of Medicine, 71(10), 801-808.
Moghissi, E. S., Korytkoski, M. T., DiNardo, M., et al. (2009). American Association of Clinical
Endocrinologists and American Diabetes Association consensus statement on
inpatient glycemic control. Endocrine Practice, 15(4), 1-17.
Mullen, B., & Kelley, P. A. W. (2006). Diabetes nurse case management: An effective tool.
Journal of the American Academy of Nurse Practitioners, 18, 22-30.
39

Mundinger, M. 0., Kane, R. L., Lenz, E. R., Totten, A. M., Tsai, W.-Y., Cleary, P. D., et al. (2000).
Primary care outcomes in patients treated by nurse practitioners or physicians.
Journal of the American Medical Association, 283(1), 59-68.
Munro, B. H. (2005). Statistical methods for health care research (5th ed.). Philadelphia:
Lippincott Williams & Wilkins.
Nathan, D. ML, Kuenen, J., Borg, R., Zheng, H., Schoenfeld, D., Heine, R. (2008). Translating
the A1C assay into estimated average glucose values. Diabetes Care, 31 (8), 1473-
1478. doi: 10.2337/dc08-0545
Ofman, J. J., Badamgarav, E., Henning, J. M., Knight, K., Gano, A. D., Jr., Levan, R. K., et al.
(2004). Does disease management improve clinical and economic outcomes in
patients with chronic diseases? A systematic review. American Journal of Medicine,
117(3), 182-192.
Pioro, M. H., Landefeld, C. S., Brennan, P. F., Daly, B., Fortinsky, R. H., Kim, U., et al. (2001).
Outcomes-based trial of an inpatient nurse practitioner service for general medical
patients. Journal of Evaluation in Clinical Practice, 7(1), 21-33. doi: jep276 [pii]
Smith, W. D., Winterstein, A. G., Johns, T., Rosenberg, E. and Sauer, B. C. (2005). Causes of
hyperglycemia and hypoglycemia in adult inpatients. American Journal of Health-
System Pharmacy, 62, 714-719.
The International Expert Committee (2009). International Expert Committee report on the
role of the A1C assay in the diagnosis of diabetes. Diabetes Care, 32(7), 1-8. doi:
10.2337/dc09-9033
40
Turchin, A., Matheny, M. E.( Shubina, M., Scanlon, J. V., Greenwood, B., & Pendergrass, M. L.
(2009). Hypoglycemia and clinical outcomes in patients with diabetes hospitalized
in the general ward. Diabetes Care, 32(7), 1153-1157. doi: 32/7/1153 [pii]
10.2337/dc08-2127
Umpierrez, G. E., Isaacs, S. D, Bazargan, N., You, X., Thaler, L. M., Kitabchi, A. E. (2002).
Hyperglycemia: an independent marker of in-hospital mortality in patients with
undiagnosed diabetes. The Journal of Clinical Endocrinology & Metabolism, 87(3),
978-982.
Umpierrez, G. E., Smiley, D., Jacobs, S., Peng, L., Temponi, A., Mulligan, P., et al. (2011).
Randomized study of basal-bolus insulin therapy in the inpatient management of
patients with type 2 diabetes undergoing general surgery (RABBIT 2 Surgery).
Diabetes Care, 34(2), 256-261. doi: 10.2337/dcl0-1407
Van den Berghe, G., Wouters, P., Weekers, F., Verweast, C., et al. (2001). Intensive insulin
therapy in critically ill patients. New England Journal of Medicine, 345(19), 1359-
1369.
Vriesendorp, T. M., DeVries, J. H., van Santen, S., Moeniralam, H. S., de Jonge, E., Roos, Y. B., et
al. (2006). Evaluation of short-term consequences of hypoglycemia in an intensive
care unit. Critical Care Medicine, 34(11), 2714-2718. doi:
10.1097/01.CCM.0000241155.36689.91
Wexler, D. J., Nathan, D. M., Grant, R. W., Regan, S., Leuvan, A. L. V., & Cagliero, E. (2008).
Prevalence of elevated hemoglobin Ale among patients admitted to the hospital
41

without a diagnosis of diabetes. Journal of Clinical Endocrinology and Metabolism,
93(11), 4238-4244.
Wheeler, K., Crawford, R., McAdams, D., Benel, S., Dunbar, V. G., Caudle, J. M., et al. (2004).
Inpatient to Outpatient Transfer of Care in Urban Patients With Diabetes. Archive of
Internal Medicine, 164,447-453.
Wong, F. K., Mok, M. P., Chan, T., & Tsang, M. W. (2005). Nurse follow-up of patients with
diabetes: randomized controlled trial .Journal of Advanced Nursing, 50(4), 391-402.
doi: JAN3404 [pii] 10.1111/j.l365-2648.2005.03404.x
42
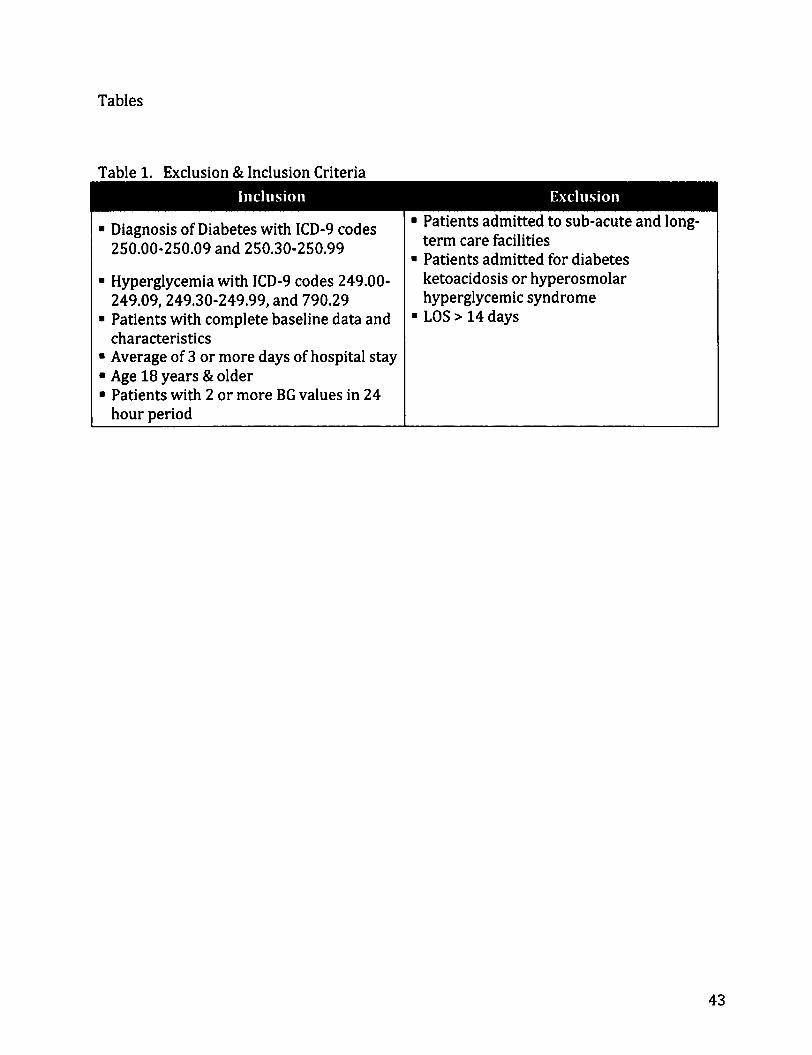
Tables
Table 1. Exclusion & Inclusion Criteria
• Diagnosis of Diabetes with ICD-9 codes 250.00-250.09 and 250.30-250.99
• Hyperglycemia with ICD-9 codes 249.00-249.09, 249.30-249.99, and 790.29
• Patients with complete baseline data and characteristics
• Average of 3 or more days of hospital stay • Age 18 years & older • Patients with 2 or more BG values in 24
hour period
• Patients admitted to sub-acute and long-term care facilities
• Patients admitted for diabetes ketoacidosis or hyperosmolar hyperglycemic syndrome
• LOS > 14 days
43

Table 2. Measures
Characteristics/ • Age EMR Baseline data • Gender EMR
• Ethnicity EMR • Admission Diagnosis EMR • Admission BG EMR • AiC EMR • BMI PCR • Practitioner managing blood glucose PCR
Clinical • Mean BG level per patient day EMR Outcomes • BG w/in good control (BG 71-180 mg/dL) EMR
• Hyperglycemia (BG > 180 mg/dL) EMR • Severe hyperglycemia (BG >300 mg/dL) EMR • Hypoglycemia (BG 41-60 mg/dL) EMR • Severe hypoglycemia (BG <40 mg/dL) EMR • Transfer to ICU EMR • Clinical complications (post-op wound EMR/PCR
infections, pneumonia, respiratory failure, acute renal failure, and bacteremia)
• Glucose management EMR/PCR • Modification of home treatment regimen based PCR
on hospital treatment response • Diabetes Education PCR • Length of stay (LOS) EMR • In-hospital mortality EMR • 30-day readmission EMR
Economic Costs • Overall hospital costs EFR • Direct costs (nursing, laboratory, & pharmacy) EFR
1 Legend: EMR = electronic medical record; EFR = electronic financial records; PCR = paper 1 | chart review
44
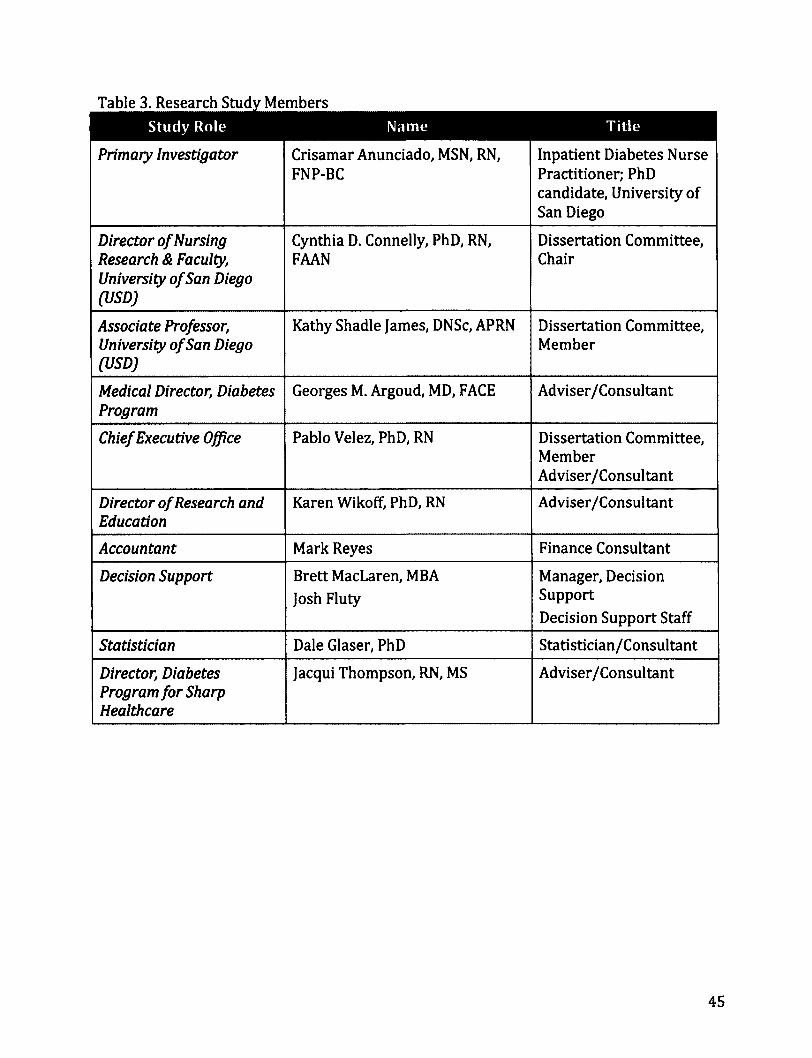
Table 3. Research Study Members
Primary Investigator Crisamar Anunciado, MSN, RN, FNP-BC
Inpatient Diabetes Nurse Practitioner; PhD candidate, University of San Diego
Director of Nursing Research & Faculty, University of San Diego (USD)
Cynthia D. Connelly, PhD, RN, FAAN
Dissertation Committee, Chair
Associate Professor, University of San Diego (USD)
Kathy Shadle James, DNSc, APRN Dissertation Committee, Member
Medical Director, Diabetes Program
Georges M. Argoud, MD, FACE Adviser/Consultant
Chief Executive Office Pablo Velez, PhD, RN Dissertation Committee, Member Adviser/Consultant
Director of Research and Education
Karen Wikoff, PhD, RN Adviser/Consultant
Accountant Mark Reyes Finance Consultant
Decision Support Brett MacLaren, MBA
Josh Fluty
Manager, Decision Support
Decision Support Staff
Statistician Dale Glaser, PhD Statistician/Consultant
Director, Diabetes Program for Sharp Healthcare
Jacqui Thompson, RN, MS Adviser/Consultant
45

Table 4. Statistics and Definitions Term Variable Type Defini t ion
& Sta t i s t ics
30-day readmission rate
Continuous
ANOVA
Rate of 30-day readmission
AiC Continuous
ANOVA
A glycosylated hemoglobin AiC level is an average BG level over 3 months. This laboratory test is obtained once on admission to the hospital. It is a useful diagnostic test in managing the patient as an inpatient and when deciding what diabetes regimen to send the patient home with upon discharge
Admission BG Continuous
ANOVA
The first BG, serum glucose or POC fingerstick, obtained upon admission to the hospital
Admission Diagnosis
Categorical
ANOVA
Admission diagnosis is the primary diagnosis listed for the patient's hospital stay
Age Continuous
ANOVA
Age during the hospital stay
BMI Continuous
ANOVA
Body mass index (BMI) is a measure of the patient's weight in relation to his/her height This measurement is taken once for each hospital admission
Clinical Complications
Categorical
ANOVA
Complications are limited the ICD-9 Codes below. For the purpose of this study, this variable will be identified to describe the sample population. Postoperative wound infection - ICD-9 codes:
• 998.59 - other post operative infection Pneumonia - ICD-9 codes:
• 480. * - Viral pneumonia • 481. * - Pneumococcal pneumonia [streptococcus
pneumoniae pneumonia] • 482. * - Other bacterial pneumonia • 483. * - Pneumonia due to other specified organism • 484. * - Pneumonia in infectious disease classified elsewhere • 485. * - Bronchopneumonia organism unspecified • 486. * - Pneumonia organism unspecified • 997.39 - Pneumonia (aspiration) resulting from a procedure
Respiratory failure - ICD-9 codes: • 518.5 - Pulmonary insufficiency following trauma and
surgery • 518.81 - Acute respiratory failure • 518.84 - Acute and chronic respiratory failure
Acute renal failure - ICD-9 codes: • 584. * - Acute kidney failure • 586 - Renal failure unspecified • 997.5 - Renal failure (acute) specified as due to a procedure
Bacteremia - ICD-9 codes: • 790.7 - Bacteremia AND one of the following 3: • 038.0/*-038.9 - Septicemia • 599.0 - Urinary tract infection site not specified • 999.3* - Other infection due to medical care not elsewhere
classified
46

Term Variable Type
& Sta t i s t ics
Def in i t ion
Comorbid Conditions
Categorical
ANOVA
Comorbid conditions are all other diagnoses listed after the primary admission diagnosis specifically, end-stage renal disease or chronic renal failure, congestive heart failure, depression, hypertension, and hyperlipidemia. These will be identified to help describe the study population
Diabetes Education
Categorical
ANOVA
This data will be collected and documented on the spreadsheet as a (0) yes or (1) no. The diabetes nurse educator who is a member of the GMT usually provides diabetes education.
Direct Costs Continuous
ANOVA
As estimated direct cost of care will be labeled on the spreadsheet as:
(0) Total direct cost
(1) Laboratory POC BG
(2) Nursing
(3) Pharmacy
Ethnicity Categorical
Chi Square
Ethnicity will be describe based on what is entered on the electronic file upon admission
Gender Categorical
Chi Square
Gender will be described as:
(0) Male
(1) Female
Glucose Control Categorical
Poisson Regression Modeling
It has several categories as listed:
(0) BG <40 mg/dl (1) BG 41-60 mg/dl
(2) BG 71-180 mg/dl
(3) BG 180-299 mg/dl
(4) BG £300 mg/dl
(5) Mean BG
Glucose Management
Categorical
ANOVA
Type of treatment used:
(0) Subcutaneous prandial only
(1) Basal-bolus
(2) Insulin infusion
(3) Oral antidiabetes drugs (OADs) only
(4) Combination of insulin and OADs
(5) None
Good BG Control Categorical
Poisson Regression Modeling
This is a category of the "Glucose Control" variable. BGs 71-180 are considered within good control will be measured per patient per patient day
Home treatment modification
Categorical
Chi Square
This data will be collected and documented on the spreadsheet as a (0) Yes or (1) No. Modification to home treatment regimen will be collected and analyzed to observe if there is a relationship between home treatment regimen modification and AiC level
47
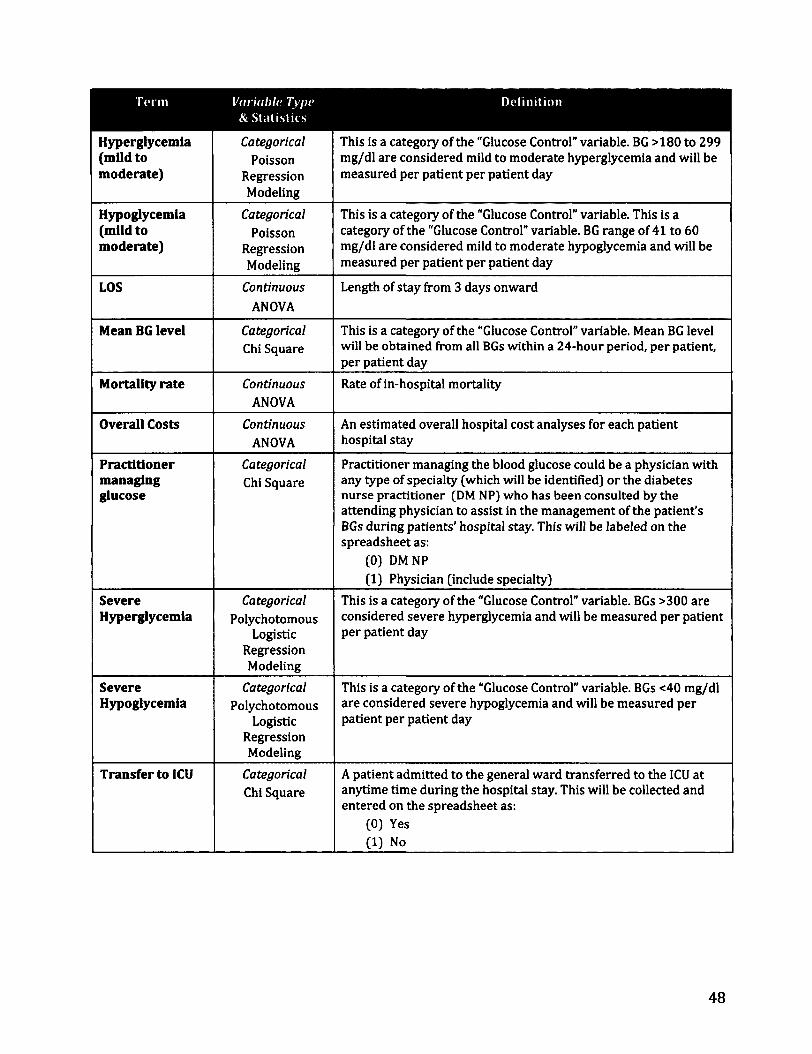
Hyperglycemia (mild to moderate)
Categorical
Poisson Regression Modeling
This is a category of the "Glucose Control" variable. BG >180 to 299 mg/dl are considered mild to moderate hyperglycemia and will be measured per patient per patient day
Hypoglycemia (mild to moderate)
Categorical
Poisson Regression Modeling
This is a category of the "Glucose Control" variable. This is a category of the "Glucose Control" variable. BG range of 41 to 60 mg/dl are considered mild to moderate hypoglycemia and will be measured per patient per patient day
LOS Continuous
ANOVA
Length of stay from 3 days onward
Mean BG level Categorical
Chi Square This is a category of the "Glucose Control" variable. Mean BG level will be obtained from all BGs within a 24-hour period, per patient, per patient day
Mortality rate Continuous
ANOVA
Rate of in-hospital mortality
Overall Costs Continuous
ANOVA
An estimated overall hospital cost analyses for each patient hospital stay
Practitioner managing glucose
Categorical
Chi Square Practitioner managing the blood glucose could be a physician with any type of specialty (which will be identified) or the diabetes nurse practitioner (DM NP) who has been consulted by the attending physician to assist in the management of the patient's BGs during patients' hospital stay. This will be labeled on the spreadsheet as:
(0) DM NP
(1) Physician (include specialty)
Severe Hyperglycemia
Categorical
Polychotomous Logistic
Regression Modeling
This is a category of the "Glucose Control" variable. BGs >300 are considered severe hyperglycemia and will be measured per patient per patient day
Severe Hypoglycemia
Categorical
Polychotomous Logistic
Regression Modeling
This is a category of the "Glucose Control" variable. BGs <40 mg/dl are considered severe hypoglycemia and will be measured per patient per patient day
Transfer to ICU Categorical
Chi Square A patient admitted to the general ward transferred to the ICU at anytime time during the hospital stay. This will be collected and entered on the spreadsheet as:
(0) Yes (1) No
48
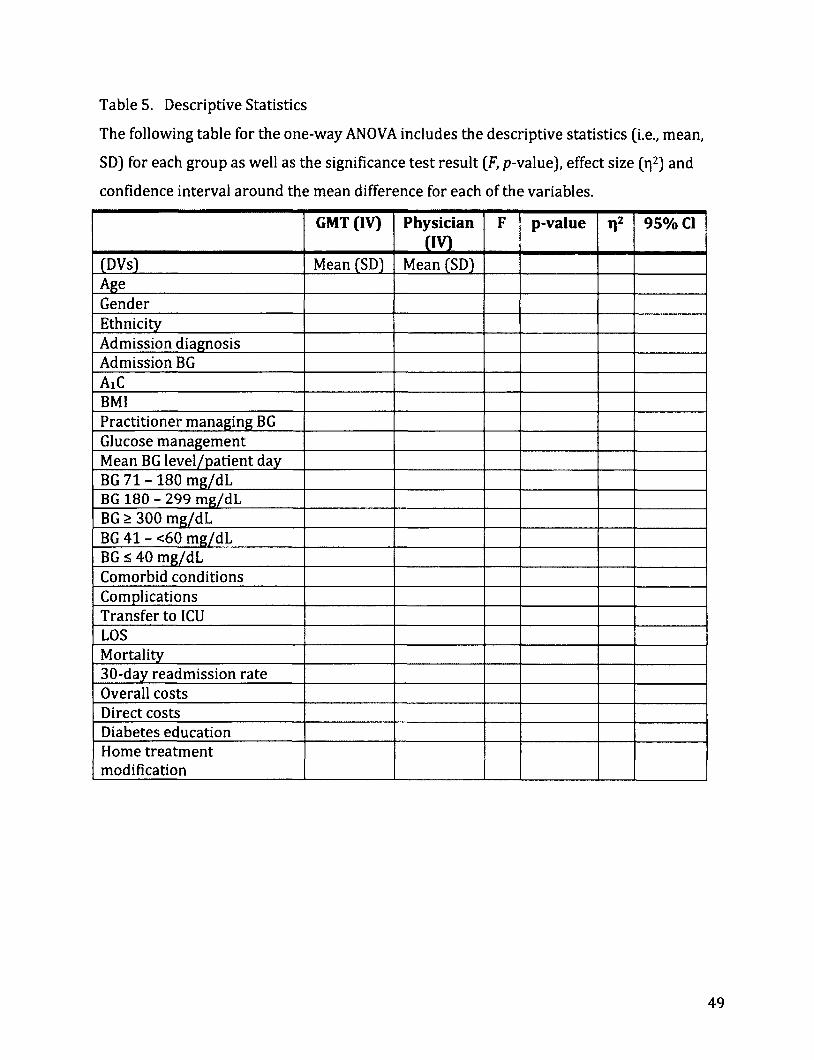
Table 5. Descriptive Statistics
The following table for the one-way ANOVA includes the descriptive statistics (i.e., mean,
SD) for each group as well as the significance test result (F, p-value), effect size (r|2) and
confidence interval around the mean difference for each of the variables.
GMT (IV) Physician cm
F p-value Tl2 95% CI
(DVs) Mean (SD) Mean (SD) Age Gender Ethnicity Admission diagnosis Admission BG AiC BMI Practitioner managing BG Glucose management Mean BG level/patient day BG 71 - 180 mg/dL BG 180 - 299 mg/dL BG > 300 mg/dL BG 41 - <60 mg/dL BG £ 40 mg/dL Comorbid conditions Complications Transfer to 1CU LOS Mortality 30-day readmission rate Overall costs Direct costs Diabetes education Home treatment modification
49

Table 6. Research Aims, Questions, & Statistics
Aims
Characterize the study population (i.e., age, gender, ethnicity, admission diagnosis, admission BG, A1C level, BMI, co-morbid conditions) by type of care delivery.
Examine the differences in glycemic control: mean BG, good glucose control (BG 71 - 180 mg/dl), incidences of mild to moderate hyperglycemia (BG 181-299 mg/dl), severe hyperglycemia BG 2300 mg/dl), mild to moderate hypoglycemia (BG 41-<60 mg/dl), and severe hypoglycemia (s40 mg/dl), by type if care delivery.
Examine which glycemic control variables predict rates of clinical outcomes (hospital complications, LOS,
inpatient mortality, and 30-day readmission).
Assess the relationship of glycemic control variables with economic costs (overall hospital costs and direct costs).
Examine the differences in inpatient diabetes services provided by type of care delivery
*Mertler& Vannatta, 2010; Munro, 2005
Research Question
1. Is there a difference in patient characteristics between provider groups (GMT versus physician)?
2. Is there a difference in the range of glucose control between the two provider groups?
Statistics
Between group differences* One-way ANOVA
Chi-square
Between group differences* Mann-Whitney
3. Does the level of glucose control predict the rates hospital complications, LOS, inpatient mortality, and 30-day readmission?
4. Which predictors account for the variance cost of hospitalization?
Group membership* Logistic Regression, i.e., Poisson regression modeling
Degree of relationship* Multiple Regression
5. Is there a difference in inpatient diabetes services Between group provided (glucose management, diabetes education differences* and changes in diabetes regimen upon discharge) Logistic regression by type of care delivery?
50

Chapter 4: MANUSCRIPTS
MANUSCRIPT 1
UNIVERSITY OF SAN DIEGO
Hahn School of Nursing and Health Sciences
Inpatient Glycemic Management: Relationship Among Glucose Control, Clinical
Outcomes and Costs
Crisamar Javellana-Anunciado, PhD, RN, FNP-BC

Abstract
TITLE: Inpatient Glycemic Management: Relationship Among Glucose Control, Clinical
Outcomes and Costs
AUTHORS: Crisamar J. Anunciado, PhD, RN, FNP-BC
OBJECTIVE: The aim of this study is to examine the relationship between glycemic
control (GC), hospital acquired complications (HAC), Charlson Comorbidity Index (CCI),
ICU stay, length of stay (LOS), 30-day readmission (30DRA), care provider, and total
estimated costs (TEC).
RESEARCH DESIGN AND METHODS: A retrospective cohort study of 800 patients (n =
400 GMT and n = 400 MD) with diabetes or hyperglycemia admitted to a large urban
community medical center located in Southern California was conducted. Descriptive
statistics was used for demographic and baseline data. Mann-Whitney was used to
examine the differences in Sharp BG measures by type of care delivery. Logistic
regression was used to estimate the likelihood of 30DRA with covariates CCI, GC, ICU
stay, HAC, and LOS. Multiple regression analysis was used to determine the accuracy of
the independent variables LOS, provider group, CCI, HAC, and GC in predicting TEC.
RESULTS: GMT patients had significant higher mean BG 190 mg/dL (SD = 41) F (1, 799)
= 4.8, p = .03, r\2= .006; and BG count 3.9 (SD = .44) F (1, 799) = 108, p = .001, y]2= .12,
than MD patients with 183 mg/dL (SD = 43); 3.5 (SD = .44). GMT patients had higher
A1C: 8.2, (SD = 2) F (1, 799) = 3.62, p = .057, ri2= .005 and longer LOS 5.8 days (SD = 2.5)
F (1, 799) = 3.8, p = .053, r\2= .005 than MD patients with 7.9 SD = 2.1, 5.5 days (SD =
52

2.4]. MD patients had a statistically significant higher CCI, 1.52 (SD = 1.3) compared to
GMT patients with 1.35 (SD = 1.2), F (1, 799) = 3.9, p = .048, r|2= .005. GMT patients had
statistically significant higher mean days with BGs 180 - 299 mg/dL (4.8 vs. 4.2 days, p
= .001) and BGs >300 mg/dL (1.5 vs. 1.1 days, p = .000). Comparison of BG trending per
day over 14 days was comparable between groups except for days 1-4 when GMT
started with higher mean BGs and days 13 and 14 of hospitalization where MD group
trended up and GMT continued to trend down. The likelihood of 30DRA with covariates:
CCI, GC, ICU stay, HAC, and LOS did not show significant results. Increase in LOS, GMT
services and having 1 or more HAC were related to increase in TEC whereas increase in
GC (>180 mg/dL) was related to decrease in TEC.
CONCLUSIONS: GMT patients were younger; slightly more male, had higher AlC levels,
higher mean BGs, lower CCI, higher LOS, higher TEC, and more BG count or BG checks.
Sharp BG Measures: good glucose control (BG 70 - 180 mg/dl), hypoglycemia (BG 41-
<60 mg/dl), and severe hypoglycemia (<40 mg/dl) were comparable between groups
except for hyperglycemia (BG 181-299 mg/dl) and severe hyperglycemia BG >300
mg/dl), which were slightly higher for the GMT patients. Factors that might increase the
likelihood of 30DRA such as higher CCI, GC, ICU stay, presence of HAC, and longer LOS
were examined for association with 30DRA but showed no association. Higher
TEC/costs were associated with longer LOS, GMT patients and presence of HAC. Higher
in GC (>180 mg/dL) was related to decrease in costs. CCI had no significant association
with TEC whereas LOS and HAC had significant impact on increasing TEC. Further
studies should examine the factors e.g. inadequate discharge planning, poor patient
compliance, lack of follow-up care, poor family/caregiver support, deterioration of
53

patient condition and medical errors increasing the LOS, 30DRA rates, and costs for
patients with diabetes.
54

Background
Diabetes is one of the leading comorbid conditions for hospitalized patients.
Notably, over the past two decades, hospital stays of patient with diabetes rose from 2.8
million in 1990 to 7.7 million in 2008 (Fraze, Jiang, & Burgess 2010). One in every five
hospital beds is occupied by a patient with diabetes (Cook et al. 2009). The estimated
cost of care for these inpatients is $87 billion, about half of the annual overall health
care expenditure for diabetes (ADA 2008). Patients with diabetes, with or without
diabetes-related comorbidity, have complex needs requiring extensive and costly
healthcare resources (Struijs et al 2006).
Extant studies, both observational and randomized controlled trials, indicate
inpatient hyperglycemia, with or without a history of diabetes, results in poor patient
outcomes (ADA 2012). An estimated one-third of patients will experience significant
hyperglycemia during hospitalization (Levetan et al 1998). Hyperglycemia in critical
care increases morbidity, mortality, and length of stay (LOS) and was associated with
increased mortality and complications in the general medical/surgical units (Kornum et
al 2007; Krinsley 2004; Umpierrez et al 2002). Intensive glucose control in surgical care
was related with decreased mortality, sepsis, low cardiac output syndrome, blood
transfusion, pneumonia, stroke and LOS (Frisch et al 2010; Furnary et al 2003; Furnary
& Wu, 2006; Umpierrez et al., 2011) and decreased mortality, morbidity, sepsis, dialysis
blood transfusion, polyneuropathy, LOS in the critical care (Krinsley 2004; Van den
Berghe et al., 2001, 2006).
55
On the opposite end of the spectrum, 34 per 1000 hospital admissions are
related to hypoglycemia (Ginde et al 2008). Severe hypoglycemia of BG < 40 mg/dL is
defined in many studies although this is lower than the threshold wherein cognitive
impairment occurs in normal individuals at BG < 50 mg/dL (ADA 2012; Schnipper et all
2008; Umpierrez et al 2012). Hypoglycemia resulting from illness, alterations in
nutrition, medications, and aggressive glucose control (Brunkhorst et al 2008; Moghissi
et al., 2009; Van den Berghe et al., 2001, 2006; Vriesendorp et al., 2006) increases the
risk for deleterious effects (e.g. seizures, coma, increased LOS) and likelihood of death
(Turchin et al., 2009).
Wide glucose variability (GV) including hyperglycemia and hypoglycemia are
extremely unsafe for inpatients and are strong predictors of mortality (ADA, 2012;
Krinsley, 2008; Moghissi et al 2009). Controlling GV can be challenging due to acute
illness, inconsistent nutrition intake, medication changes, and timing of BG monitoring
with insulin administration. It is important to avoid GV (BG <70 mg/dL and BG > 180
mg /dL) by making inpatient glycemic management (IGM) an integral part of inpatient
care (ADA 2012; Moghissi et al., 2009; Umpierrez et al., 2012).
In the last decade, various approaches to achieving inpatient glucose control
(IGC) were implemented at several institutions in the U.S. and abroad. However, despite
all these efforts, IGC remains suboptimal (Boord et al., 2009). One major reason
deterring success of IGC is its' complexity - requiring considerable effort in training and
coordination staff and hospital resources (ADA 2012; Umpierrez et al., 2012).
Implementation of a coordinated team approach such as a glycemic management teams
(GMT) showed improved IGC, decreased length of stay, and improved post discharge
56

A1C levels (Flanagan et al., 2008; Jakoby et al., 2008). Agencies such as the American
Diabetes Association (ADA), American Association of Clinical Endocrinologists (AACE),
and the Society of Hospital Medicine (SHM) endorsed the use of team approach to IGM.
While there is empirical support for the benefits of intensive IGM using a team
approach, there is limited research on clinical outcomes comparing a team approach
such as a GMT to current traditional management by physicians (MD) alone.
The aim of this study is to examine the relationship between glycemic control
(GC), hospital acquired complications (HAC), Charlson Comorbidity Index (CCI), ICU
stay, length of stay (LOS), 30-day readmission (30DRA), care provider, and total
estimated costs (TEC).
Research Design and Methods
A retrospective cohort design was used for this study. Participants were selected
from patients with diabetes or hyperglycemia (N = 7914) receiving services from large
urban community medical center located in Southern California and admitted between
January 2008 and December 2009 to the acute and critical care settings; of these, 1000
were randomly selected per year. Eight hundred patients met inclusion criteria:
diagnosis of diabetes with ICD-9 codes 250.00-250.09 and 250.30-250.99;
hyperglycemia with ICD-9 codes 249.00-249.09, 249.30-249.99, and 790.29; average of
3 or more days of hospital stay; age 18 years & older; patients with 2 or more BG values
in 24 hour period, and identified care provider group. Exclusion criteria were:
admission to sub-acute and long-term care facilities; diagnoses of diabetes ketoacidosis
or hyperosmolar hyperglycemic syndrome; and LOS > 14 days. Data for the analyses
57
were abstracted from electronic medical records and paper charts. Precautions were
taken to protect patient privacy in accordance with the Health Insurance Portability and
Accountability Act (HIPAA). All study procedures were reviewed and approved by
appropriate institutional review boards and administrators. No actual patient contact
involving any risk occurred since data was collected retrospectively.
Measures
The GMT and MD performed inpatient glucose management (1GM) using the
intravenous insulin order set (IOS) in critical care (Figure 1) or the basal-bolus
subcutaneous insulin order set (SIOS) in critical care and general medical/surgical units
(Figure 2). Diabetes care was individualized based on the patient's unique needs
(nutrition status, medications affecting glucose metabolism, corticosteroid use, and
individual insulin requirements). The BG goal for SIOS was <110 mg/dL to a maximum
of 180 mg/dL, whereas IOS goal was 80 mg/dL to 150 mg/dL. For the purpose of this
study, Sharp BG measures were defined as severe hypoglycemia <40 mg/dL,
hypoglycemia <60 mg/dL, good control 71 mg/dL to 180mg/dL, hyperglycemia 180
mg/dL, and severe hyperglycemia >300 mg/dL. Glucose control (GC) was categorized
into two levels: mean BG that achieved goal of <180mg/dL and those that did not
achieve goal >180 mg/dL during the hospital stay.
58

Figure 1. IOS
q T\TJT> Qiula Vbu Intravenous Insulin Order Set (IOS) ol ill\r Mcdkal Center Apprmtatrio*i>m*)CUStmgOn#
AcctfbWr Blood Glucos* (BG) Range is 90-150 mgtdL (Goal si 110 mgML »i cribcafly I pis per ACE GuaMines) T FnfMqmB6lMMif
CHMK BG Mwy Mwr r « 80 or > ISO mgML and «ncn WNrtng awn WMopNHan CMot BG «try 2 ran *60 -150 mgML and «twn bc^tenl la* obangat no wigtr ncocwaty NtcMctBGVi i MMrVdecaaasMby moKtun* toomgMLatanyime
3 itwart Pr» Wjwnr <m*m W*j wan 100 umi too iw 09% Mag [ t iawiM)rta a safety cysamHUeian pump 4 Start poBant m teak 1 (or) CD lcala2(lbraBbalcptspiwt«>MMyiicjeMrig»<0uHifcinaMtoMay)
1 iMrinr • BG* 70 fflg |ML or * 360 mgML • BG m maM * tSOmgMLbir 4 hot** an tea* 4. eaa MO tbr • BGdacnai latbya in mgML and p abertonics del MM aawinMBontatei t»a>iaHnfct»o>aw»a»pia6on
7. *8C<76a0aL: a. HoMMMttnnr*iMt«MhaNr b. m^uiori upouMWi pMuou <noay *«> »• ootan oroar 10 raatart OS), mm orow aaam to mtati tos, iiaun mp at km 1
6. WlMPllMtMfMUh|: a. owa>—c(im«cMb«ii>yg»HD45ywiwta>aMwiBaaa—upanyontycttaatddWBidar b. cac —c^ttnaoMt Atpm (NomLaf) wtian m aaowb iv wiiw. (amuemiwcfotai «ab».gNt wayanpoat mtai) SwMWr
MMbflNMMMl MMU6dl MM Aapvt(atanaU^2or iMfcaatcaL Mpan (Mo*oLof) 2 or un» mm* Aapart (Utowtag") 2 or in* tuba*
pa* baa page) • ISO MML18IH <MP lb 40 IW «* IMMd«l pO*CABG pB) or BG I
rMfSOSt r B aart (SiOS) a> pmMa baaa twMin. GiaMgirw pi*-ptandw navan. Aipan Kagman.
i»»Gaittn»C4Wtiw>WM^«yacrtaMcwB»«2aooor2Wsbafc>taBaiia>o>tfWrtmwto»on (ON) ForTypelDM: Pfca« IgiOJiMfe- inkGta^neMttn*2300 IMWI BG >ap a—a aWer >—11 wMJnn • —ml— a m mOiii BG baa lamanaa o—1 goal range QM Acforl Mdn (HBoutanboaHy par SIOS.
59

Figure 2. SIOS
Of tADD OaU«y»u Subcutaneous Insulin Orders (SIOS) ul JTlK^i* Mcdkal Center Pfeu* ner id sk>sgmmminor vie tact orMiiMer Am
Target Blood Gluoose (BG) Range: S 11# m«ML (Pre^neaQ; < 1M mgfdL (maximum) tmmt MI AOMOf CMMHidMlpwrtCMtoMi/MwMBiM JMf
Slap 1 * Di« continue a> Pfmxn insulin. sutornAweas /GMmMM. Gtetane. Santmiur liWWIt.« Weoaflewtie). and BG chtdit • llimoalobin AiC l»wl in am if not already done (obtam text once nor hoifftataatwn)
Step 2 OgAlS upon atbnission and If Eating by mouth: Check BG rnPim 30 minutes betel* meals and at 2200 • Check BG at «3M
If HPO: check BG •wry 4 hrs. Foflow Step 6 gudaknes below.
Tube Feeding (TF): check BG eeery 4 tes. Gwe M dose Aspart (NowjLog*) IrmAn per regwnen i TF at goal rate If TF ps less than 90^ rait. to§ow Step C guidthmi btfcjiv.
K E*miL 4o not covr 2JIH U9$ BG* wih Asoart/HovoLotft hot** urtess wtcikd brkm n
Stop 3 Older Dirt: Diabetic w4hspoc*coalones.Shrat CHO to 4S ahhArnI, m addibon to iptouind dttt oitfif. Owe MS smoIl Enterair—dina: * pt is on Gbigra (LmIw) 4 continuous 24-hr TF s wtenupUd * 2 hrv st«1 IV10% Dextrose at 40mMv~. stop IV infawon when tube teediig m isitarted (GanmA UPpnor k> ilmHii) 10% Drikuti ilew SodMwtw—<130)
11(114 Diabetes Education: Myreete bean teaching <»e patent */or famiMsianiteant other about Oiabetei I ktsulin Self afrmrwstabon.
Step 5 Administer T|||) l lllTII IIIII AfPART Wwgjgg*! REQWH6H it MWOl *>* •* 11 HI KiPHtbwurt—ii—raeaww»^m.teemoor wim—» mii»ei—a>
D HLO Q MODERATE AMMeracVM
Q AGCmSMVE Dc—. a6«g».
D HLO Q MODERATE AMMeracVM
Q AGCmSMVE Dc—. BGmglML
&70 fllfHMMr rtjp0^f09999m rruMXI i v*oP Ml/ 470
71-00 0 Unit QUrat 0UM Units 71-00
01-120 OUrats 3Umb 4 IMs Urate 01-120
121-150 3 Units 5Umte 0 Urals Units 121-150
1S1-200 4 Units 0 Unite 8 Unts Units 151-200
201-250 5 Units 7 Urate 10 Units Units 201-250
251-300 OUnits B Unite 12 Units Urate 251-300
301-350 7 Units 0 Unite 14 Units Urate 301-360
351-400 SUMts 10 Units 10 Units Urate 351-400
step 6 VKtfmntWMTIHvrirLaah 1 NPO. dear bquid dtet or peer appetite <<50% intake), use % dose Aspart fNovoLog^ any if BGkl SI lagML 2 Do wot administer Aspart (NovoLop-) msukn when BG s 15SmgML if any orfthe sduabons about applies
*•*» 7 ADJUST ASPART /Ho*oLom-l REG—EM • If 2 ccnsecutwe ac BG resufc > US meNL. increase Asoart (HaroLoo-t reomtti to ne«t acorocnate lew* • If 2 comscutew ac BG wdfc « St —XL decrease Asoart (NbwU»l teoimew to m«l aacrccnale teeel
Step • BASAL MSUUII ORDER
G Adnmte Gtewme ft »wm t insulin subcutaneous* da* at 2200 (ntccmmiwdaeowa Intal G>argm> fl M*n I dose: 10 unite Lower dose may be needed torCRFpte) Pbw i see hac* hfiwA on daswf and dady
Step 9 WOTffYMD • I pt becomes HPO or has pet m>twd|[ poor appetite because Glargwe (t'edHi J dose may need to be adjusted • * steroid do— changes because Gta^ne fl mtm) dose may need to be adjusted • •MEMATa.YifBGOimgMLorlrJMmgML • bi AM or next MO Rounds if BG i 71 mgML or ortNl mgML or • If BG temam > HI mgML lor 12 tow on ^ywie legmen. or if BG dwtaaw to < 3> mgML on MM regmen
60
The MDs represented a variety of specialties: internists (55%, n = 220),
hospitalists (15%, n = 60), pulmonologists (11.5%, n = 46), nephrologists (10%, n = 40),
cardiologists (4%, n = 15), endocrinologists (1.5%, n = 6), and other (3%, n = 13).
Although the attending MDs retained responsibility for BG management for most
patients with hyperglycemia, they referred patients with complex insulin needs and
difficult to control BGs to GMT for IGC.
GMT was comprised of nurse practitioners (NP) and diabetes nurse educators
under the supervision of the diabetes medical director and with the collaboration of
attending physicians. Once the attending physician referred a patient to the GMT, the
NPs assume 24-hour responsibility for IGM, which entails not only IGC but also
assessing the need for inpatient diabetes education, reconciling diabetes medication list
to ensure accuracy, referring to outpatient diabetes education or endocrinology follow-
up, and providing clear written instructions on diabetes treatment regimen
modifications as needed. The diabetes nurse educator provides patients with diabetes
survival skills, basic education, supplies (i.e. log books, handouts, glucose meter),
resources (i.e., outpatient free clinics, support groups, classes), and referral to
outpatient diabetes education/case management. Other measures are defined in Table
1.
61
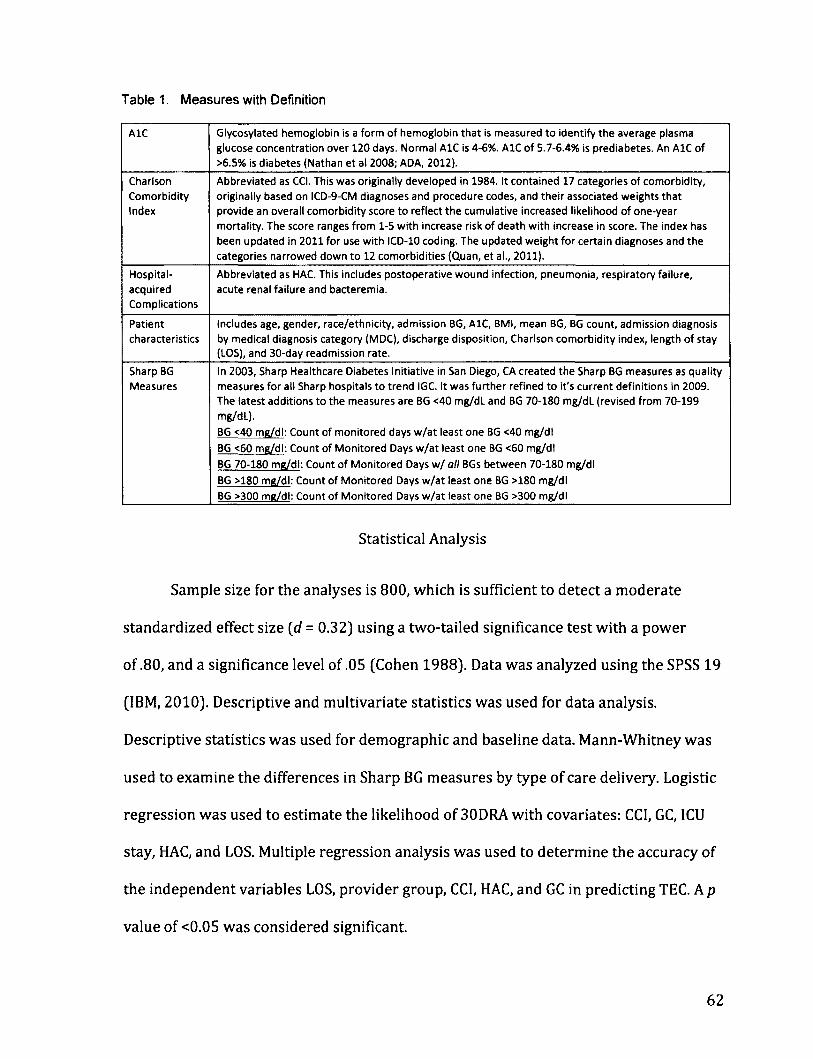
Table 1. Measures with Definition
AlC Glycosylated hemoglobin is a form of hemoglobin that is measured to identify the average plasma
glucose concentration over 120 days. Normal AlC is 4-6%. AlC of 5.7-6.4% is prediabetes. An AlC of
>6.5% is diabetes (Nathan et al 2008; ADA, 2012).
Charlson
Comorbidity Index
Abbreviated as CCI. This was originally developed in 1984. It contained 17 categories of comorbidity,
originally based on ICD-9-CM diagnoses and procedure codes, and their associated weights that provide an overall comorbidity score to reflect the cumulative increased likelihood of one-year
mortality. The score ranges from 1-5 with increase risk of death with increase in score. The index has
been updated in 2011 for use with ICD-10 coding. The updated weight for certain diagnoses and the
categories narrowed down to 12 comorbidities (Quan, et al., 2011).
Hospital-
acquired
Complications
Abbreviated as HAC. This includes postoperative wound infection, pneumonia, respiratoryfailure,
acute renal failure and bacteremia.
Patient
characteristics
Includes age, gender, race/ethnicity, admission BG, AlC, BMI, mean BG, BG count, admission diagnosis
by medical diagnosis category (MDC), discharge disposition, Charlson comorbidity index, length of stay (LOS), and 30-day readmission rate.
Sharp BG Measures
In 2003, Sharp Healthcare Diabetes Initiative in San Diego, CA created the Sharp BG measures as quality measures for all Sharp hospitals to trend IGC. It was further refined to it's current definitions in 2009.
The latest additions to the measures are BG <40 mg/dL and BG 70-180 mg/dL (revised from 70-199 mg/dL).
BG <40 mg/dl: Count of monitored days w/at least one BG <40 mg/dl
BG <60 me/dl: Count of Monitored Days w/at least one BG <60 me/dl
BG 70-180 mg/dl: Count of Monitored Days w/ all BGs between 70-180 mg/dl
BG >180 me/dl: Count of Monitored Days w/at least one BG >180 mg/dl
BG >300 mg/dl: Count of Monitored Days w/at least one BG >300 mg/dl
Statistical Analysis
Sample size for the analyses is 800, which is sufficient to detect a moderate
standardized effect size (d = 0.32) using a two-tailed significance test with a power
of .80, and a significance level of .05 (Cohen 1988). Data was analyzed using the SPSS 19
(IBM, 2010). Descriptive and multivariate statistics was used for data analysis.
Descriptive statistics was used for demographic and baseline data. Mann-Whitney was
used to examine the differences in Sharp BG measures by type of care delivery. Logistic
regression was used to estimate the likelihood of 30DRA with covariates: CC1, GC, ICU
stay, HAC, and LOS. Multiple regression analysis was used to determine the accuracy of
the independent variables LOS, provider group, CCI, HAC, and GC in predicting TEC. A p
value of <0.05 was considered significant.
62

Results
The sample was fairly evenly distributed by gender with slightly more females
(53%, n = 422) than males. The sample was diverse with almost half Latino (48%, n =
382), White (18%, n = 146), Asian (8%, n = 64), Black (6%, n = 44), and other (21%, n =
164), and is representative of the city's racial breakdown as reported in the 2010
census (US Census, 2010). Age ranged from 20 to 99 (M = 66, sd = 14.8; median = 69).
Average body mass index (BMI) was 30.6 (sd = 8.2; median = 29), with most patients
either overweight or obese. The most frequent diagnoses for admission were
circulatory 26% (n = 209); respiratory system 11% (n = 89), kidney/urinary tract
system 10.4% (n = 83), nervous system 8.5% (n = 68), and musculoskeletal/connective
tissue 7.8% (n = 62). Patients were admitted with BG ranged from 32 mg/dL to 789
mg/dL (M = 221, sd = 111; median = 198). Service providers were equally distributed
(400= GMT, 400 = MD) See Table 2 for details.
63

Table 2. Patient Profile Overall GMT MD F(df) X'(df) P n = 800 n = 400 n = 400
Age - Mean (SD) 66 (14.8) 64.5 (14.7) 67.7(14.6) 9.36 (1,798) .002
Gender - Percent (Count) .01 Female 53% (422) 46% (194) 53% (228) 5.79(1)
Male 47% (388) 54.5% (206) 46% (172)
Ethnicity - Percent (Count) 4.3 (4) .36
Asian 8% (64) 6% (26) 9% (38)
Black 6% (44) 5% (19) 6% (25)
Hispanic 48% (382) 48% (192) 48% (190)
White 18% (146) 19% (74) 18% (72)
Other 20% (164) 22% (89) 19% (75)
AiC - Mean (SD) 8% (2.08) 8.2% (2) 7.9% (2.1). 3.62 (1, 798) .057
BMI - Mean (SD) 30.6 (8.3) 30.9 (8.3) 30.2 (8.3) 1.46 (1, 798) .228
Admission BG - Mean (SD) 221 (110.8) 226 (118.4) 216(102.5) 1.77 .184 Mean BG level (mg/dL) - Mean (SD) 186 (42) 190 (41) 183 (43) 4.8 (1, 798) .03 Last Day BG (mg/dL) - Mean (SD) 164 (48.6) 164 (46.8) 164 (50.4) .034 (1, 798) .854
BG Count (Lab/POC) 3.7 (.47) 3.9 (.44) 3.5 (.44) 108.6 (1,798) .000 Medical Diagnostic Groups (MDC) - 16.37 .693 Percent (Count)
Circulatory System 26.1% (209) 28.8% (115) 23.5% (94)
Respiratory System 11.1% (89) 11.5% (46) 10.8% (43)
Kidney/Urinary tract 10.4% (83) 8.8% (35) 12% (48)
Nervous System 8.5% (68) 9.3% (37) 7.8% (31)
Musculoskeletal/ 7.8% (62) 7.5% (30) 8% (32) Connective Tissue Digestive System 6.9% (55) 7% (28) 6.8% (27)
Infectious and Parasitic 6.1% (49) 5% (20) 7.3% (29)
Endocrine, Nutritional, & 5.9% (47) 5.5% (22) 6.3% (25)
Metabolic System
Hepatobiliary System & Pancreas 5.6% (45) 6.5% (26) 4.8% (19)
Skin, Subcutaneous Tissue & 5.3% (42) 3.8% (15) 6.8% (27) Breast
Other 6.3% (51) 6.5% (26) 6.25% (25)
One-way ANOVA showed GMT providers provided care to patients with a
statistically significant higher mean BG 190 mg/dL (SD = 41) F (1,799) = 4.8, p = .03,
r]2= .006; and BG count 3.9 (SD = .44) F (1, 799) = 108, p = .001, r\2= .12, than patients
followed by the MD 183 mg/dL (SD = 43); 3.5 (SD = .44), respectively. There was a
trend for GMT patients to have higher admission A1C: 8.2, (SD = 2) F (1, 799) = 3.62, p
= .057, r|2= .005 and stay longer in the hospital at 5.8 days (SD = 2.5) F (1, 799) = 3.8, p
= .053, ri2= .005 than those followed by MDs with 7.9 SD = 2.1, 5.5 days (SD = 2.4). MD
64

patients had a statistically significant higher CCI,1.52 (SD = 1.3) compared to GMT
patients with 1.35 (SD = 1.2), F (1, 799) = 3.9, p = .048, r)2= .005.
The institution used Sharp BG Measures to report hospital-wide BG control
(Refer to Table 1 for details). GMT patients had statistically significant higher mean
days with BGs 180 - 299 mg/dL (4.8 vs. 4.2 days, p = .001) and BGs £ 300 mg/dL (1.5 vs.
1.1 days, p = .000). See Table 3 for comparison.
Table 3. Sharp BG Measures: Glucose Control By Count of Days
Measure Overall GMT MD F(df) n2 p value n = 800 n = 400 n = 400
Good Control 71 - 180 mg/dL (SD) 1.5(2) 1.4(2) 1.6(2) 1.4 (1, 798) .002 .237
Hyperglycemia 180 - 299 mg/dL (SD) 4.51 (2.25) 4.8 (2.3) 4.2 (2.2) 11.2 (1, 798) .014 .001
Severe Hyperglycemia i 300 mg/dL (SD) 1.29 (1.58) 1.5(1.7) 1.1(1.4) 12.7 (1, 798) .016 .000
Hypoglycemia 41 - 60 mg/dL (SD) .21 (0.56) .23 (0.56) .19 (.55) 1.03 (1, 798) .001 .310
Severe Hypoglycemia S 40 mg/dL (SD) .05 (0.26) .06 (0.31) .04 (0.20) 2.28 (1, 798) .003 .131
Comparison of BG trending per day over 14 days was almost comparable
between groups (Figure 3) except for days 1-4 where GMT patients started with higher
mean BGs and days 13 and 14 of hospitalization where MD patients trended up and
GMT continued to trend down.
Figure 3. 14-Day BG Graph Comparison
14-Day BG Graph Comparison
225
200
175 MD
150
125
100
Day 01 02 D3 04 D5 06 07 D8 09 010 Oil D12 D13 D14
MD 208 192 186 177 173 171 164 160 160 162 160 142 126 146
GMT 218 206 200 185 175 166 162 160 163 159 160 146 146 117
65
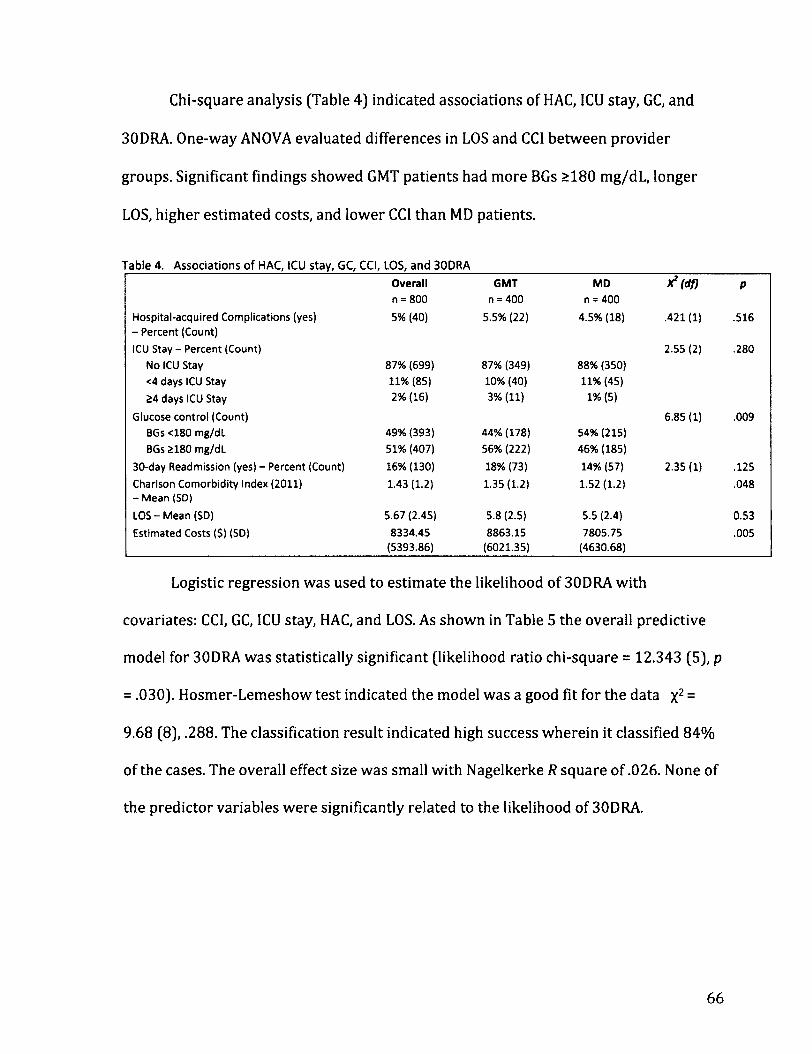
Chi-square analysis (Table 4) indicated associations of HAC, ICU stay, GC, and
30DRA. One-way ANOVA evaluated differences in LOS and CCI between provider
groups. Significant findings showed GMT patients had more BGs >180 mg/dL, longer
LOS, higher estimated costs, and lower CCI than MD patients.
Table 4. Associations of HAC, ICU stay, GC, CCI, LOS, and 30DRA
Overall GMT MD X*(df) P n = 800 n = 400 n = 400
Hospital-acquired Complications (yes) 5% (40) 5.5% (22) 4.5% (18) .421(1) .516 -Percent (Count)
ICU Stay - Percent (Count) 2.55 (2) .280
No ICU Stay 87% (699) 87% (349) 88% (350)
<4 days ICU Stay 11% (85) 10% (40) 11% (45)
24 days ICU Stay 2% (16) 3% (11) 1% (5)
Glucose control (Count) 6.85 (1) .009
BGs <180 mg/dL 49% (393) 44% (178) 54% (215)
BGs 2180 mg/dL 51% (407) 56% (222) 46% (185)
30-day Readmission (yes) - Percent (Count) 16% (130) 18% (73) 14% (57) 2.35(1) .125
Charlson Comorbidity Index (2011) 1.43 (1.2) 1.35(1.2) 1.52(1.2) .048 - Mean (SD)
LOS - Mean (SD) 5.67 (2.45) 5.8(2.5) 5.5 (2.4) 0.53
Estimated Costs ($) (SD) 8334.45 8863.15 7805.75 .005 (5393.86) (6021.35) (4630.68)
Logistic regression was used to estimate the likelihood of 30DRA with
covariates: CCI, GC, ICU stay, HAC, and LOS. As shown in Table 5 the overall predictive
model for 30DRA was statistically significant (likelihood ratio chi-square = 12.343 (5), p
= .030). Hosmer-Lemeshow test indicated the model was a good fit for the data x2 =
9.68 (8), .288. The classification result indicated high success wherein it classified 84%
of the cases. The overall effect size was small with Nagelkerke R square of .026. None of
the predictor variables were significantly related to the likelihood of 30DRA.
66

Table 5. Logistic Regression Results Predicting the Probability of 30-day Readmission (n = 800)
Predictor B Wald df Odds Ratio
95% Confidence Interval P Predictor B Wald df Odds Ratio Lower Upper
P
Charlson Comorbidity Index .126 2.98 1 1.14 .98 1.31 .085
Glucose Control .133 .46 1 1.14 .78 1.68 .497
ICU Stay .254 1.34 1 1.29 .84 1.98 .248
Hospital-acquired Complication -.287 .52 1 .75 .34 1.64 .472
Length of Stay .069 2.99 1 1.07 .99 1.16 .084
Percent correctly classified = 84%
Nagelkerke R2 = .026
Simultaneous multiple regression was used to determine the accuracy of the
independent variables LOS, provider group, CCI, HAC, and GC in predicting TEC. This
standard multiple regression strategy was appropriate because all independent
variables are viewed as having equal importance, there were no apriori hypotheses, and
regression diagnostic procedures did not detect problems with multicollinearity among
the predictor variables. All tolerance values were < 0.99. Regression results indicate
the overall model accounts for 53% of the variance and significantly predicts TEC: R2 =
.529, R2adj = -527, F (5,794) =178.69, p = .000. A summary of the regression coefficients
in Table 6 indicates four of the five variables significantly contributed to the model.
Increase in LOS, GMT services and having 1 or more HAC were related to increase in
TEC whereas increase in GC (>180 mg/dL) was related to decrease in TEC.
Table 6. Results of LOS, Provider Group, CCI, HAC, GC, and 30DRA in Predicting TEC (n = 800)
Variable B B t p-value
LOS .066 .694 27.43 .000
GC -.024 -.053 -2.14 .032
CCI .002 .013 .509 .611
Provider Group .024 .052 2.11 .035
HAC .086 .081 3.28 .001
67

Discussion
This study examined the relationship between GC, HAC, CCI, 1CU stay, LOS,
30DRA, care provider, and TEC. The findings indicate that for this study population, the
patients seen by GMT were younger; slightly more male, higher A1C levels, higher mean
BGs, lower CCI, higher LOS, higher TEC, and more BG count or BG checks. Sharp BG
Measures: good glucose control (BG 70 - 180 mg/dl), hypoglycemia (BG 41-<60 mg/dl),
and severe hypoglycemia (<40 mg/dl) were comparable between groups except for
hyperglycemia (BG 181-299 mg/dl) and severe hyperglycemia BG >300 mg/dl), which
were slightly higher for the GMT patients.
Patients referred to GMT services had slightly higher admission BGs and were
considered to have more difficult to manage BGs; hence, there were increased BG
checks for patients under the GMT services. BG improvement was noted on both
provider groups over 14 days (Figure 3). GMT patients started with higher BGs on days
1-4 of admission, had similar BG improvement with MD patients on days 5-12, and
better improvement on days 13 and 14. The graph showed that longer LOS was
associated with lower mean BG. Longer LOS allowed the providers time to adjust
treatment to improve BGs to goal. Interestingly, mean BG goal of <180 mg/dL was
achieved in almost half of the overall sample. However, the graph showed this was
achieved on day 4 by the MD group and day 5 by the GMT. By the last day of
hospitalization, BG average for both provider groups was the same (BG = 164 mg/dL).
GMT services referral of more difficult to manage BGs for IGC showed improved overall
BG control during the hospital stay as shown in this study and the study by Jakoby and
68

associates (2008). GMT services also provided diabetes discharge planning, treatment
modification, and education, which consequently allowed more time for MDs to focus
their efforts in managing the patients overall care.
30DRA rates are particularly important to most hospital institutions due to
Medicare/Medical reimbursement guidelines that limit payment to hospitals with
higher 30DRA rates. In 2005, it was estimated that 17.6% of hospital admissions
resulted in a 30DRA. Older patients with chronic illnesses such as diabetes and heart
disease tend to get readmitted to the hospital more often, however, much is still
unknown about that factors that increase the probability of readmissions (Stone and
Hoffman 2010). The overall 30DRA rate for this study was 16% with no significant
difference between groups. Factors that may increase the likelihood of 30DRA such as
higher CCI, GC, ICU stay, presence of HAC, and longer LOS were examined for
association with 30DRA. Surprisingly, none of these variables were associated with
30DRA. Other risk factors not evaluated in this study may have increased the likelihood
of hospital readmissions such as inadequate discharge planning, poor patient
compliance, lack of follow-up care, poor family/caregiver support, deterioration of
patient condition and medical errors as a few of the reasons for readmissions (Stone
and Hoffman 2010).
Improved IGC was associated with decrease LOS, HAC, and costs (Frisch et al
2010; Furnary et al 2003; Furnary & Wu, 2006; Umpierrez et al., 2011; Krinsley 2004;
Van den Berghe et al., 2001, 2006). This study population had higher TEC/costs that
were associated with longer LOS, GMT patients and presence of HAC; whereas higher in
69

GC (>180 mg/dL) was related to decrease in costs. CCI had no significant association
with TEC whereas LOS and HAC had significant impact on increasing TEC. Patients in
this study with higher LOS were managed by the GMT. Analyses from this study did not
show association of GC (<180 mg/dL) to shorter LOS and decrease costs.
What remains inadequately answered in this study was despite the GMT patients
being younger and had lower CCI - both factors that were supposedly associated with
shorter LOS, they were instead associated with longer LOS and increase TEC. However,
we have to take this study in the context that it was a retrospective design; the effect
sizes and correlations were small, population of patients were restricted in Southern
California region with higher Hispanic population than national average, and many
other factors not explored in this study. Decreasing LOS, 30DRA rates and costs are of
particular importance in the care of diabetes patients. Further studies should examine
the factors e.g. inadequate discharge planning, poor patient compliance, lack of follow-
up care, poor family/caregiver support, deterioration of patient condition and medical
errors increasing the LOS, 30DRA rates, and costs for patients with diabetes.
70

References
American Diabetes Association (ADA) (2008). Economic Costs of Diabetes in the U.S. in
2007. Diabetes Care, 311(3), 596-615. doi: 10.2337/dc08-9017
American Diabetes Association (ADA) (2010). Position Statement: Standards of Medical
Care in Diabetes - 2010. Diabetes Care, 33(S1), S11-S61. doi: 10.2337/dcl0-S011
American Diabetes Association (2012). Standards of medical care in diabetes-2012.
Diabetes Care, 35 Supplement 1, Sll-63. doi: 10.2337/dcl2-s011
Boord, J. B., Greevey, R.A., Braithwaite, S., Arnold, P.C., Selig, P.M., Brake, H., Cuny, J., &
Baldwin, D. (2009). Evaluation of Hospital Glycemic Control at US Academic
Medical Centers. Society of Hospital Medicine, 4(1), 35-44. doi: 10.1002/jhm.390
Brunkhorst, F. M., Engel, C., Bloos, F., Meier-Hellmann, A., Ragaller, M., Weiler, N., et al.
(2008). Intensive insulin therapy and pentastarch resuscitation in severe sepsis.
New England Journal of Medicine, 358(2), 125-139. doi: 358/2/125 [pii]
10.1056/NEJMoa070716
Center for Disease Control and Prevention (CDC) (2011). National diabetes fact sheet:
national estimates and general information on diabetes and prediabetes in the
United States, 2011 (pp. 12). Atlanta, GA: Center for Disease Control and
Prevention.
Cook, C. B., Seifert, K. M., Hull, B. P., Hovan, M. J., Charles, J. C., Miller-Cage, V., et al.
(2009). Inpatient to outpatient transfer of diabetes care: Planning for an
effective hospital discharge. Endocrine Practice, 25(3), 263-269.
71
Custer, M. L. (2010). Outcomes of clinical nurse specialist-initiated system-level
standardized glucose management. Clinical Nurse Specialist, 24(3), 132-139. doi:
10.1097/NUR.0b013e3181d82a31 00002800-201005000-00006 [pii]
Ehrlich, S. F., Quesenberry, C. P., Jr., Van Den Eeden, S. K., Shan, J., & Ferrara, A. (2010).
Patients diagnosed with diabetes are at increased risk for asthma, chronic
obstructive pulmonary disease, pulmonary fibrosis, and pneumonia but not lung
cancer. Diabetes Care, 33(1), 55-60. doi: 10.2337/dc09-0880
Flanagan, D., Moore, E., Baker, S., Wright, D., and Linch, P. (2008). Diabetes care in the
hospital-the impact of a dedicated inpatient care team. Diabetic Medicine, 25,
147-151. doi:10.1111/j.l464-5491.2007.02326
Frisch, A., Chandra, P., Smiley, D., Peng, L., Rizzo, M., Gatcliffe, C., et al. (2010).
Prevalence and clinical outcome of hyperglycemia in the perioperative period in
noncardiac surgery. Diabetes Care, 33(8), 1783-1788. doi: dcl0-0304 [pii]
10.2337/dcl0-0304
Ginde, A. A., Espinola, J. A., & Camargo, C. A., Jr. (2008). Trends and disparities in U.S.
emergency department visits for hypoglycemia, 1993-2005. Diabetes Care, 31 (3),
511-513. doi: dc07-1790 [pii] 10.2337/dc07-1790
International Business Machines, Inc. (IBM). (2010). IBM SPSS Statistics (Version 19).
United States: International Business Machines, Inc.
Jakoby, M. G., Garey, A., Hall, M., Morris, L., Erikson, D., Wardwell, L., et al. (2008).
Management of hospitalized diabetic patients by a hospital diabetes care team
7 2
improves both inpatient and ambulatory glycemic control. Abstract. Carle
Foundation Hospital. Urbana, IL.
Joint Commission (2011]. Advanced Certification in Inpatient Diabetes Retrieved
February 1, 2011, from
http://www.jointcommission.org/certification/inpatient_diabetes.aspx
Kornum, J. B., Thomsen, R. W., Riis, A., Lervang, H. H., Schonheyder, H. C., & Sorensen, H.
T. (2007). Type 2 diabetes and pneumonia outcomes: a population-based cohort
study. Diabetes Care, 30(9), 2251-2257. doi: 10.2337/dc06-2417.
Krinsley, J. S. (2003). Association between hyperglycemia and Increased hospital
mortality in a heterogeneous population of critically ill patients. Mayo Clinic
Proceedings, 78,1471-1478.
Krinsley, J. S. (2004). Effect of an intensive glucose management protocol on the
mortality of critically ill adult patients. Mayo Clinic Proceedings, 79(8), 992-1000.
Krinsley, J. S. (2008). Glycemic variability: a strong independent predictor of mortality
in critically ill patients. Critical Care Medicine, 36(11), 3008-3013. doi:
10.1097/CCM.0b013e31818b38d2
Krinsley, J. S., & Grissler, B. (2005). Intensive glycemic management in critically ill
patients. Joint Commission Journal on Quality and Patient Safety, 31(6), 308-312.
Krinsley, J. S., & Grover, A. (2007). Severe hypoglycemia in critically ill patients: risk
factors and outcomes. Critical Care Medicine, 35(10), 2262-2267. doi:
10.1097/01.CCM.0000282073.98414.4B

Krinsley, J. S., & Preiser, J. C. (2008). Moving beyond tight glucose control to safe
effective glucose control. Critical Care, 12(3), 149. Doi: 10.1186/cc6889
Lang, T. A., & Secic, M. (2006). How to report statistics in medicine: annotated guidelines
for authors, editors, and reviewers (2nd ed.). New York: American College of
Physicians.
Levetan, C., Passaro, M., Jablonski, K., Kass, M., & Ratner, R. (1998). Unrecognized
diabetes among hospitalized patients. Diabetes Care, 21(2), 246-249.
MEDMARX Data Report: A report on the relationship of drug names and medication
errors in response to the institute of medicine's call for action. (2008). In R. W.
Hicks, Becker, S. C., and Cousins, D. D. (Ed.), (pp. 1-406). Rockville, MD: Center for
the Advancement of Patient Safety, US Pharmacopeia.
Mertler, C. A., and Vannatta, R. A. (2010). Advanced and multivariate statistical methods
(4th Ed.). Glendale, CA: Pyrczak Publishing.
Moghissi, E. (2004). Hospital management of diabetes: Beyond the sliding scale.
Cleveland Clinical Journal of Medicine, 71(10), 801-808.
Moghissi, E. S., Korytkoski, M. T., DiNardo, M., et al. (2009). American Association of
Clinical Endocrinologists and American Diabetes Association consensus
statement on inpatient glycemic control. Endocrine Practice, 15(4), 1-17.
Mullen, B., & Kelley, P. A. W. (2006). Diabetes nurse case management: An effective tool.
Journal of the American Academy of Nurse Practitioners, 18, 22-30.
74

Mundinger, M. 0., Kane, R. L., Lenz, E. R., Totten, A. M., Tsai, W.-Y., Cleary, P. D., et al.
(2000). Primary care outcomes in patients treated by nurse practitioners or
physicians. Journal of the American Medical Association, 283(1), 59-68.
Munro, B. H. (2005). Statistical methods for health care research (5th ed.). Philadelphia:
Lippincott Williams & Wilkins.
Nathan, D. M., Kuenen, J., Borg, R., Zheng, H., Schoenfeld, D., Heine, R. (2008). Translating
the A1C assay into estimated average glucose values. Diabetes Care, 31 (8), 1473-
1478. doi: 10.2337/dc08-0545
Ofman, J. J., Badamgarav, E., Henning, J. M., Knight, K., Gano, A. D., Jr., Levan, R. K., et al.
(2004). Does disease management improve clinical and economic outcomes in
patients with chronic diseases? A systematic review. American Journal of
Medicine, 127(3), 182-192.
Pioro, M. H., Landefeld, C. S., Brennan, P. F., Daly, B., Fortinsky, R. H., Kim, U., et al. (2001).
Outcomes-based trial of an inpatient nurse practitioner service for general
medical patients. Journal of Evaluation in Clinical Practice, 7(1), 21-33. doi:
jep276 [pii]
Smith, W. D., Winterstein, A. G., Johns, T., Rosenberg, E. and Sauer, B. C. (2005). Causes
of hyperglycemia and hypoglycemia in adult inpatients. American Journal of
Health-System Pharmacy, 62, 714-719.
75

Stone, J., & Hoffman, G. J. (2010). Medicare Hospital Readmissions: Issues, Policy Options
and PPACA. (R40972). Washington, D.C.: Congressional Research Service
Retrieved from www.crs.gov.
Struijs, J. N., Baan, C. A., Schellevis, F. G., Westert, G. P., & Van den Bos, G. A. (2006).
Comorbidity in patients with diabetes mellitus: impact on medical health care
utilization. BMC Health Services Research, 6,84. doi: 10.1186/1472-6963-6-84
The International Expert Committee (2009). International Expert Committee report on
the role of the A1C assay in the diagnosis of diabetes. Diabetes Care, 32(7), 1-8.
doi: 10.2337/dc09-9033
Turchin, A., Matheny, M. E., Shubina, M., Scanlon, J. V., Greenwood, B., & Pendergrass, M.
L. (2009). Hypoglycemia and clinical outcomes in patients with diabetes
hospitalized in the general ward. Diabetes Care, 32(7), 1153-1157. doi:
32/7/1153 [pii] 10.2337/dc08-2127
Umpierrez, G. E., Isaacs, S. D, Bazargan, N., You, X., Thaler, L. M., Kitabchi, A. E. (2002).
Hyperglycemia: an independent marker of in-hospital mortality in patients with
undiagnosed diabetes. The Journal of Clinical Endocrinology & Metabolism, 87(3),
978-982.
Umpierrez, G. E., Smiley, D., Jacobs, S., Peng, L., Temponi, A., Mulligan, P., et al. (2011).
Randomized study of basal-bolus insulin therapy in the inpatient management of
patients with type 2 diabetes undergoing general surgery (RABBIT 2 Surgery).
Diabetes Care, 34(2), 256-261. doi: 10.2337/dcl0-1407
76
Van den Berghe, G., Wouters, P., Weekers, F., Verweast, C., et al. (2001). Intensive insulin
therapy in critically ill patients. New England Journal of Medicine, 345(19), 1359-
1369.
Vriesendorp, T. M., DeVries, J. H., van Santen, S., Moeniralam, H. S., de Jonge, E., Roos, Y.
B., et al. (2006). Evaluation of short-term consequences of hypoglycemia in an
intensive care unit. Critical Care Medicine, 34(11), 2714-2718. doi:
10.1097/01.CCM.0000241155.36689.91
Wexler, D. J., Nathan, D. M., Grant, R. W., Regan, S., Leuvan, A. L. V., & Cagliero, E. (2008).
Prevalence of elevated hemoglobin Ale among patients admitted to the hospital
without a diagnosis of diabetes .Journal of Clinical Endocrinology and Metabolism,
93(11), 4238-4244.
Wheeler, K., Crawford, R., McAdams, D., Benel, S., Dunbar, V. G., Caudle, J. ML, et al.
(2004). Inpatient to Outpatient Transfer of Care in Urban Patients With Diabetes.
Archive of Internal Medicine, 164, 447-453.
77

Chapter 4: MANUSCRIPTS
MANUSCRIPT 2
UNIVERSITY OF SAN DIEGO
Hahn School of Nursing and Health Sciences
Inpatient Glycemic Management: Team Approach in Diabetes Education and Discharge
Planning
Crisamar Javellana-Anunciado, PhD, RN, FNP-BC
78

Abstract
TITLE: Inpatient Glycemic Management: Team Approach in Diabetes Education and
Discharge Planning
AUTHORS: Crisamar J. Anunciado, PhDc, FNP-BC
OBJECTIVE: The aim of this study was to assess the association between discharge
planning (education, treatment modification) and care coordination by the glycemic
management team (GMT) and physician (MD) for hospitalized diabetics.
RESEARCH DESIGN AND METHODS: A retrospective cohort study of 800 patients (n =
400 GMT and n = 400 MD) with diabetes or hyperglycemia admitted to a large urban
community medical center located in Southern California was conducted. Chi-square
analyses (categorical variables) and ANOVA (continuous variables) were used to test
for associations in patient characteristics, inpatient diabetic services (diabetes
education and discharge treatment modification) and provider group. For the logistic
regression analyses, models were fit to identify factors associated with the probability
of receiving inpatient education, treatment modification, and having a 30-day
readmission.
RESULTS: The sample was slightly more females 53% than males. Average age was
66±14.8. The most frequent admission diagnoses were circulatory 26%, respiratory
system 11%, kidney/urinary tract system 10.4%, nervous system 8.5%, and
musculoskeletal/connective tissue 7.8%. The sample was 48% Latino, 18% White, 8%
Asian, 6% Black and 21% other. Patient education was given to 61.6% of GMT patients
79

versus 38.4% MD patients. Diabetes treatment modification was made for 53.2% of
GMT patients compared to 46.8% of MD patients. For patients admitted with AiC levels
^ 8.1%, 54.9% of GMT patients received services compared to 45.1% MD patients.
Patients who had a high admission AIC, treatment modification, and care coordinated
by GMT were more likely to receive education. Patients who had a high admission AIC
and received discharge education were more likely to have treatment modification.
Patients who had a longer hospital stay were more likely to be readmitted in 30 days.
CONCLUSIONS: Diabetes care coordinated by GMT received more patient education
and discharge treatment modification than their MD counterparts. The GMT also
provided more services to patients with admission AIC a 8.1%. There was no difference
in care coordination for patients who were readmitted in 30 days. Study findings
provide additional data for health care and policy agencies considering the use of GMTs
in the inpatient setting to improve overall discharge planning and care coordination for
hospitalized patients. Further research is needed to explore definitive inpatient glucose
control, economic costs, and post discharge outcome differences between the two
service provider groups.
80
Background
Diabetes is the most common co-morbid diagnosis for hospitalized patients. It
accounts for increased emergency department visits, longer lengths of stay, and higher
cost of care than patients without diabetes (ADA, 2008; Fraze, Jiang, & Burgess, 2010).
Notably, patients with diabetes occupy one in every five hospital beds at a staggering
cost of $87 billion annually (Cook, et al., 2009; Moghissi, 2004). Inpatient glycemic
management (IGM), glucose control, and establishing an appropriate discharge plan, are
widely recognized as integral parts of inpatient care; however, wide glucose variability,
persistent hyperglycemia, and recurrent and severe hypoglycemia are noted in many
inpatient settings (Krinsley, 2003, 2004, 2008; Krinsley & Grover, 2007; Umpierrez et
al., 2002).
IGM has traditionally been the responsibility of the patient's attending physician;
however, changes in healthcare practices over the past decade have resulted in more
complex inpatient management. Previous research identified barriers to effective care
for patients with preexisting diabetes: (1) care focused primarily on acute illness that
triggered hospital admission; (2) fear of hypoglycemia causing deleterious effects; (3)
insulin administration initiated at blood glucose (BG) levels greater than 180 mg/dL to
200 mg/dL; (4) inadequate adjustment of insulin in response to changes in nutrition
status and medical illness; (5) unpredictability of hospital-related procedures; (6)
medication affects on glucose metabolism; and (7) time constraints (Cook et al., 2009;
Lansang & Umpierrez, 2008). Successful implementation of IGM depends on effectively
addressing these barriers.
81

Healthcare administrators implemented programs targeting inpatient glycemic
control based upon the American Diabetes Association (ADA) and the American College
of Clinical Endocrinologists (AACE) recommended inpatient glycemic control targets:
BG levels of 140 - 180 mg/dL in critical care and less than 140 mg/dL premeal with no
random BG more than 180 mg/dL for acute care. Based upon the extant research on
intensive glucose control (BG <140 mg/dL), risks for multi-organ failure, sepsis,
morbidity, mortality, and length of stay are significantly reduced (Krinsley & Grissler,
2005; Van den Berghe et al., 2001). These targets come with a caveat in achieving
euglycemia - control hyperglycemia, but limit the possible deleterious consequences of
severe hypoglycemia (ADA, 2010; Moghissi, et al., 2009).
In response, healthcare organizations were quick to adopt various forms of
insulin protocols with mixed successes and failures. The increased use of insulin in the
hospital setting brought new challenges for clinicians regarding patient safety issues.
Indeed, insulin is the number one drug implicated in medication errors causing harm
(Hicks et al., 2008). The AACE and ADA recognized a physician or nurse singularly
might be inadequately equipped to handle the challenges of a comprehensive IGM. In
fact, administrative support and inpatient glycemic expert providers are needed to
successfully monitor patient safety and manage care (Moghissi, 2004; Moghissi et al.,
2009).
IGM is further complicated by many factors affecting inpatient glycemic control
(IGC) (Smith et al., 2005) requiring a multidisciplinary team to sufficiently tackle
disease management in today's complex healthcare environment. Ofman et al (2004)
82
seminal review identified disease management as a coordinated and comprehensive
patient care service addressing care across the health care delivery continuum. Disease
management is associated with improvement in patient satisfaction, patient adherence,
disease control, patient knowledge and decreased morbidity and mortality. Many of
these programs are staffed with advanced practice nurses (APNs) and other healthcare
professionals with specialized training or expertise in their particular field of disease
management (Custer, 2010; Wheeler et al., 2004; Wong et al., 2005). The specialized
glycemic management team (GMT) is one team model developed to address IGM. GMTs
are staffed with a team of healthcare professionals, which include any or all of these
team members: physicians, APNs, diabetes nurse educators, pharmacists, and/or
dietitians (Flanagan et al., 2008; Jakoby et al., 2008). The GMT can provide focused care
on patients admitted with persistent hyperglycemia. These patients with high
glycohemoglobin A1C are particularly at risk for poor short-term and long-term
outcomes. Lack of coordinated patient care at the time of discharge to home or other
facilities is associated with medical errors and readmission (ADA, 2012; Krinsley, 2003;
Umpierrez et al., 2012).
Discharge planning is designated by National Patient Safety Goals and the
Centers for Medicare and Medicaid Services as a national patient safety priority (Cook
et al., 2009) resulting in Joint Commission guidelines with an option for healthcare
agencies to become certified in inpatient diabetes (Joint Commission, 2011). Effective
diabetes discharge is one where the patient receives necessary skill training while in
the hospital, and is provided clear and understandable post-discharge plan (Cook et al.,
2009). Previous research has found a diabetes team approach to IGM including
83

transition to ambulatory care to be effective in controlling inpatient blood glucose,
improving post discharge A1C levels, and decreasing length of stay (Flanagan et al.,
2008; Jakoby et al., 2008)
Although the need for IGC is well established, it is important to assess whether
GMT's improve IGC outcomes. The aim of this study was to assess the association
between discharge planning (education and treatment modification) and care
coordination (GMT or MD) for hospitalized diabetics.
Research Design and Methods
A retrospective cohort study of patients with diabetes or hyperglycemia
admitted to a large urban community medical center located in Southern California was
conducted. Participants were selected from all patients with diabetes and
hyperglycemia (N = 7914) admitted from January 1, 2008 through December 30,2009;
of these 1000, were randomly selected per year. Eight hundred (400 GMT; 400 MD)
met inclusion criteria (Table 1). Data for the analyses reported here were abstracted
from electronic medical records and paper charts. All study procedures were reviewed
and approved by appropriate institutional review boards and administrators. Since the
data were collected retrospectively, there was no actual patient contact that involved
any risk. Precautions were taken to protect patient privacy in accordance with the
Health Insurance Portability and Accountability Act (HIPAA); data were de-identified
prior to transferring the information to the statistician for analysis.
84

Table 1. Exclusion & Inclusion Criteria
Inclusion Exclusion
• Diagnosis of Diabetes with ICD-9 codes « Patients admitted to sub-acute and long-term 250.00-250.09 and 250.30-250.99 care facilities
• Hyperglycemia with ICD-9 codes 249.00- • Patients admitted for diabetes ketoacidosis or
249.09, 249.30-249.99, and 790.29 hyperosmolar hyperglycemic syndrome
• Patients with complete baseline data and • LOS >14 days
characteristics • Average of 3 or more days of hospital stay • Age 18 years & older • Patients with 2 or more BG values in 24 hour
period
Measures
Care coordination was measured by whether attending physician (MD) or GMT
coordinated diabetes care management. The MDs represented a variety of specialties:
internists (55%, n = 220), hospitalists (15%, n = 60), pulmonologists (11.5%, n = 46),
nephrologists (10%, n = 40), cardiologists (4%, n = 15), endocrinologists (1.5%, n = 6),
and other (3%, n = 13). GMT was comprised of nurse practitioners (NP), diabetic nurse
educator, diabetes medical director, and attending physician. Once the attending
physician referred a patient to the GMT, the NPs assume 24-hour responsibility for IGM
that entails not only IGC, but also assessing the need for inpatient diabetes education,
reconciling diabetes medication list to ensure accuracy, referring to outpatient diabetes
education or endocrinology follow-up, and providing clear written instructions on
diabetes treatment regimen modifications as needed. The diabetes nurse educator
provides patients with diabetes survival skills, basic education, supplies (i.e. log books,
handouts, glucose meter), resources (i.e., outpatient free clinics, support groups,
classes), and referral to outpatient diabetes education/case management. For
definitions of other measures, see Table 2.
85
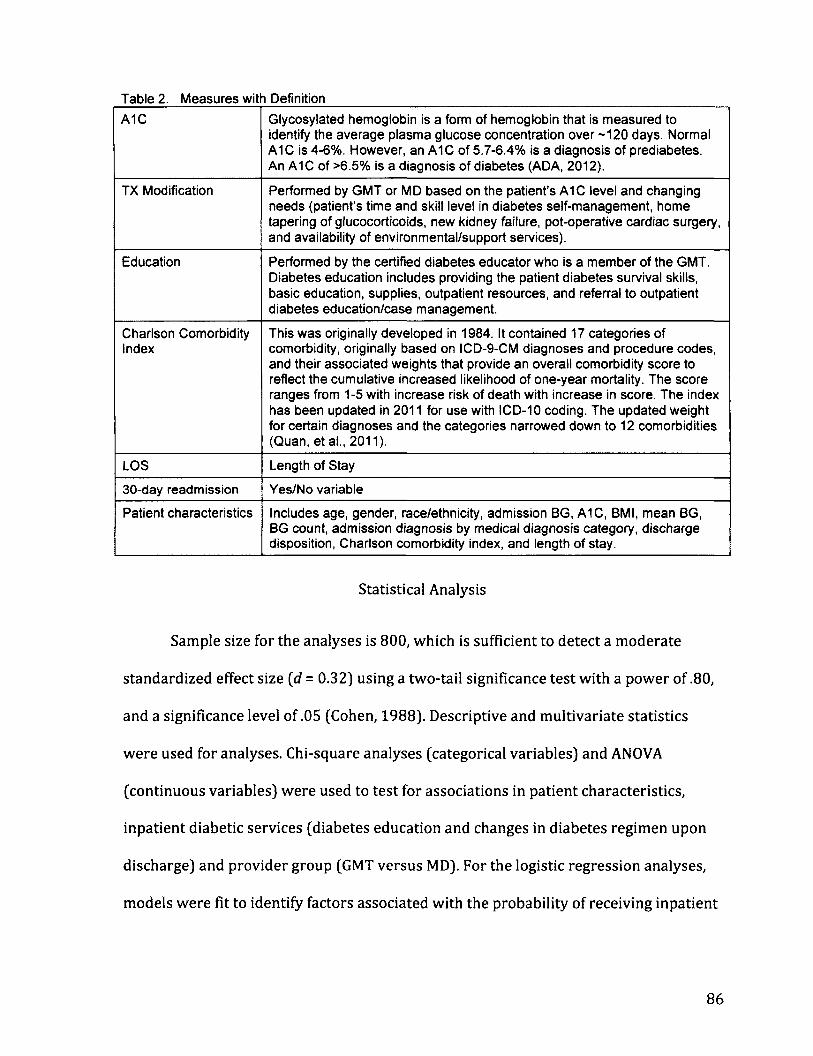
Table 2. Measures wit n Definition
A1C Glycosylated hemoglobin is a form of hemoglobin that is measured to identify the average plasma glucose concentration over -120 days. Normal A1C is 4-6%. However, an A1C of 5.7-6.4% is a diagnosis of prediabetes. An A1C of >6.5% is a diagnosis of diabetes (ADA, 2012).
TX Modification Performed by GMT or MD based on the patient's A1C level and changing needs (patient's time and skill level in diabetes self-management, home tapering of glucocorticoids, new kidney failure, pot-operative cardiac surgery, and availability of environmental/support services).
Education Performed by the certified diabetes educator who is a member of the GMT. Diabetes education includes providing the patient diabetes survival skills, basic education, supplies, outpatient resources, and referral to outpatient diabetes education/case management.
Charlson Comorbidity Index
This was originally developed in 1984. It contained 17 categories of comorbidity, originally based on ICD-9-CM diagnoses and procedure codes, and their associated weights that provide an overall comorbidity score to reflect the cumulative increased likelihood of one-year mortality. The score ranges from 1-5 with increase risk of death with increase in score. The index has been updated in 2011 for use with ICD-10 coding. The updated weight for certain diagnoses and the categories narrowed down to 12 comorbidities (Quan, et al., 2011).
LOS Length of Stay
30-day readmission Yes/No variable
Patient characteristics Includes age, gender, race/ethnicity, admission BG, A1C, BMI, mean BG, BG count, admission diagnosis by medical diagnosis category, discharge disposition, Charlson comorbidity index, and length of stay.
Statistical Analysis
Sample size for the analyses is 800, which is sufficient to detect a moderate
standardized effect size (d = 0.32) using a two-tail significance test with a power of .80,
and a significance level of .05 (Cohen, 1988). Descriptive and multivariate statistics
were used for analyses. Chi-square analyses (categorical variables) and ANOVA
(continuous variables) were used to test for associations in patient characteristics,
inpatient diabetic services (diabetes education and changes in diabetes regimen upon
discharge) and provider group (GMT versus MD). For the logistic regression analyses,
models were fit to identify factors associated with the probability of receiving inpatient
86

education, treatment modification, and having a 30-day readmission. Statistical
analyses were performed using SPSS 19 (IBM, 2010).
Results
The sample was fairly evenly distributed by gender with slightly more females
(53%, n = 422) than males. Age ranged from 20 to 99 (M = 66, SD = 14.8; median = 69).
Patients were admitted for a variety of reasons. The most frequent medical diagnoses
were circulatory 26% (n = 209), respiratory system 11% (n = 89), kidney/urinary tract
system 10.4% (n = 83), nervous system 8.5% (n = 68), and musculoskeletal/connective
tissue 7.8% (n = 62). The sample was diverse with almost half Latino (48%, n = 382),
White (18%, n = 146), Asian (8%, n = 64), Black (6%, n = 44), and other (21%, n = 164),
and is representative of the city's racial breakdown as reported in the 2010 census (US
Census, 2010). See Table 3 for details.
87
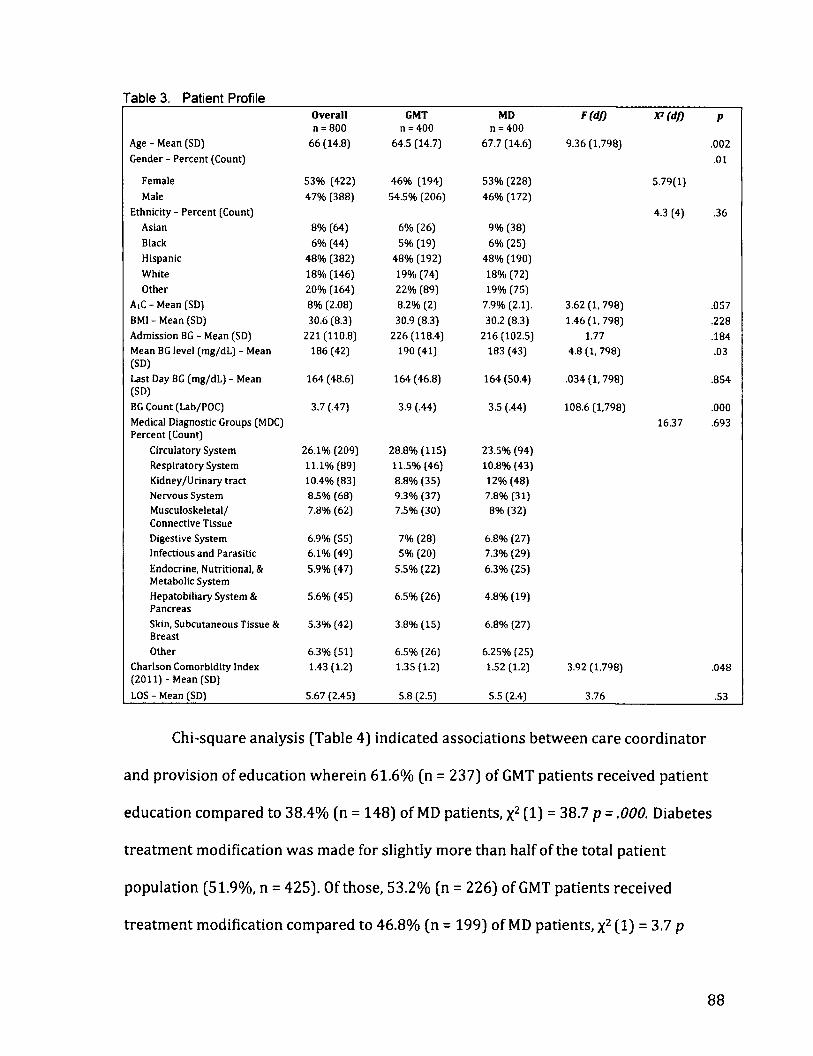
Table 3. Patient Profile Overall GMT MD F(df) )P(df) P n = 800 n = 400 n = 400
Age - Mean (SD) 66 (14.8) 64.5 (14.7) 67.7 (14.6) 9.36 (1,798) .002 Gender - Percent (Count) .01
Female 53% (422) 46% (194) 53% (228) 5.79(1)
Male 47% (388) 54.5% (206) 46% (172)
Ethnicity - Percent (Count) 4.3 (4) .36 Asian 8% (64) 6% (26) 9% (38)
Black 6% (44) 5% (19) 6% (25)
Hispanic 48% (382) 48% (192) 48% (190)
White 18% (146) 19% (74) 18% (72)
Other 20% (164) 22% (89) 19% (75)
AiC - Mean (SD) 8% (2.08) 8.2% (2) 7.9% (2.1). 3.62 (1,798) .057 BM1 - Mean (SD) 30.6 (8.3) 30.9 (8.3) 30.2 (8.3) 1.46 (1,798) .228 Admission BG - Mean (SD) 221 (110.8) 226(118.4) 216(102.5) 1.77 .184 Mean BG level (mg/dL) - Mean 186 (42) 190 (41) 183 (43) 4.8 (1, 798) .03 (SD)
Last Day BG (mg/dL) - Mean 164 (48.6) 164 (46.8) 164 (50.4) .034 (1, 798) .854 (SD)
BG Count (Lab/POC) 3.7 (.47) 3.9 (.44) 3.5 (.44) 108.6 (1,798) .000 Medical Diagnostic Groups (MDC) 16.37 .693 Percent (Count)
Circulatory System 26.1% (209) 28.8% (115) 23.5% (94)
Respiratory System 11.1% (89) 11.5% (46) 10.8% (43)
Kidney/Urinary tract 10.4% (83) 8.8% (35) 12% (48) Nervous System 8.5% (68) 9.3% (37) 7.8% (31) Musculoskeletal/ 7.8% (62) 7.5% (30) 8% (32) Connective Tissue
Digestive System 6.9% (55) 7% (28) 6.8% (27)
Infectious and Parasitic 6.1% (49) 5% (20) 7.3% (29)
Endocrine, Nutritional, & 5.9% (47) 5.5% (22) 6.3% (25) Metabolic System
Hepatobiliary System & 5.6% (45) 6.5% (26) 4.8% (19) Pancreas
Skin, Subcutaneous Tissue & 5.3% (42) 3.8% (15) 6.8% (27) Breast
Other 6.3% (51) 6.5% (26) 6.25% (25) Charlson Comorbidity Index 1.43 (1.2) 1.35 (1.2) 1.52(1.2) 3.92 (1,798) .048 (2011) - Mean (SD)
LOS - Mean (SD) 5.67 (2.45) 5.8 (2.5) 5.5 (2.4) 3.76 .53
Chi-square analysis (Table 4) indicated associations between care coordinator
and provision of education wherein 61.6% (n = 237) of GMT patients received patient
education compared to 38.4% (n = 148) of MD patients, x2 (1) = 38.7 p = .000. Diabetes
treatment modification was made for slightly more than half of the total patient
population (51.9%, n = 425). Of those, 53.2% (n = 226) of GMT patients received
treatment modification compared to 46.8% (n = 199) of MD patients, x2 (1) = 3.7 p
88

= .056. For patients admitted with AiC levels a 8.1%, slightly more than half (54.9%, n =
174) received GMT services, and 45.1% (n = 143) received MD services, x2 (1) = 5.02 p
= .025. Of the 130 patients readmitted within 30 days, slightly more than half, 56.2 %(n
= 73) received GMT services, 43.8% (n = 53) received MD services, x2 (1) = 2.35 p = .125
Table 4. Patient Education, Treatment Modification, Discharge Disposition, 30-day Readmission and Inpatient Care Coordination
Overall GMT MD X*(df) P
N = 800 n = 400 n = 400
Treatment Modification (yes) 53% (424) 53% (225) 47% (199) 3.39(1) .006
Education (yes) 48% (384) 61.5% (236) 38.5% (142) 38.78(1) .000
Discharge Disposition -Percent (Count)
4.2 (4) .377
Mortality 1% (8) .7% (3) 1.2% (5)
Home 75.8% (606) 77.5% (310) 74% (296)
Nursing home 19.8% (158) 17.5% (70) 22% (88)
Rehab facility 1.4% (11) 1.75% (7) 1 % (4)
Other 2% (17) 2.5% (10) 1.75% (7)
30 day Readmission (yes) 16% (130) 18% (73) 14% (57) 2.35(1) .125
Logistic regression was used to estimate the probability of having had discharge
education, treatment modification, and a 30-day readmission. Predictor variables: LOS,
care coordination, AIC, treatment modification, and education were used in the analysis
with simultaneous entry of predictors.
As shown in Table 5, the overall predictive model for discharge education was
statistically significant with a likelihood ratio chi-square = 66.15 (5), p = .000. Hosmer-
Lemeshow test indicated the model was a good fit to the data x2 = 9.07 (8), .33.
Although the overall model and 5 predictors were statistically significant, the
classification result indicated moderate success as it only classified 62.1% of the cases.
89

The overall effect size was also modest with Nagelkerke R square .103. Three predictor
variables were significantly related to the likelihood of receiving discharge education.
Wald statistics indicated admission AlC, treatment modification, and care coordination
was significant in predicting the likelihood of discharge education. Patients who had a
high admission AlC, treatment modification, and care coordinated by GMT were more
likely to receive education.
Table 5. Logistic Regression Results Predicting t he pro bability o Receiving Education (N = 800) Predictor B Wald df Odds 95% Confidence Interval P
Ratio Lower Upper Length of Stay .018 .355 1 1.01 .959 1.08 .551 Charlson-2011 .020 .108 1 1.02 .907 1.14 .743 A1C - admission .132 12.48 1 1.14 1.06 1.22 .000 Provider 0 = MD; 1 = GMT) .856 33.31 1 2.35 1.76 3.14 .000 Treatment Modification (1= yes) .475 10.15 1 1.60 1.20 2.15 .001 Model (likelihood ratio) chi-square = 66.15 (5), p = .000 Percent correctly classified = 62.1% Nagelkerke R2 =106
The overall predictive model for treatment modification (Table 6) was
statistically significant with a likelihood ratio chi-square = 32.93 (5), p = .000. Hosmer-
Lemeshow test indicated the model was a good fit to the data x2 = 10.15 (8), .25.
Although the overall model and 5 predictors were statistically significant, the
classification result indicated moderate success as it only classified 59.3% of the cases.
The overall effect size was also modest with Nagelkerke R square .05. Two predictor
variables were significantly related to the likelihood of treatment modification. Wald
statistics indicated admission AlC and discharge education were significant in
predicting the likelihood of treatment modification. Patients who had a high admission
AlC and received discharge education were more likely to have treatment modification.
90
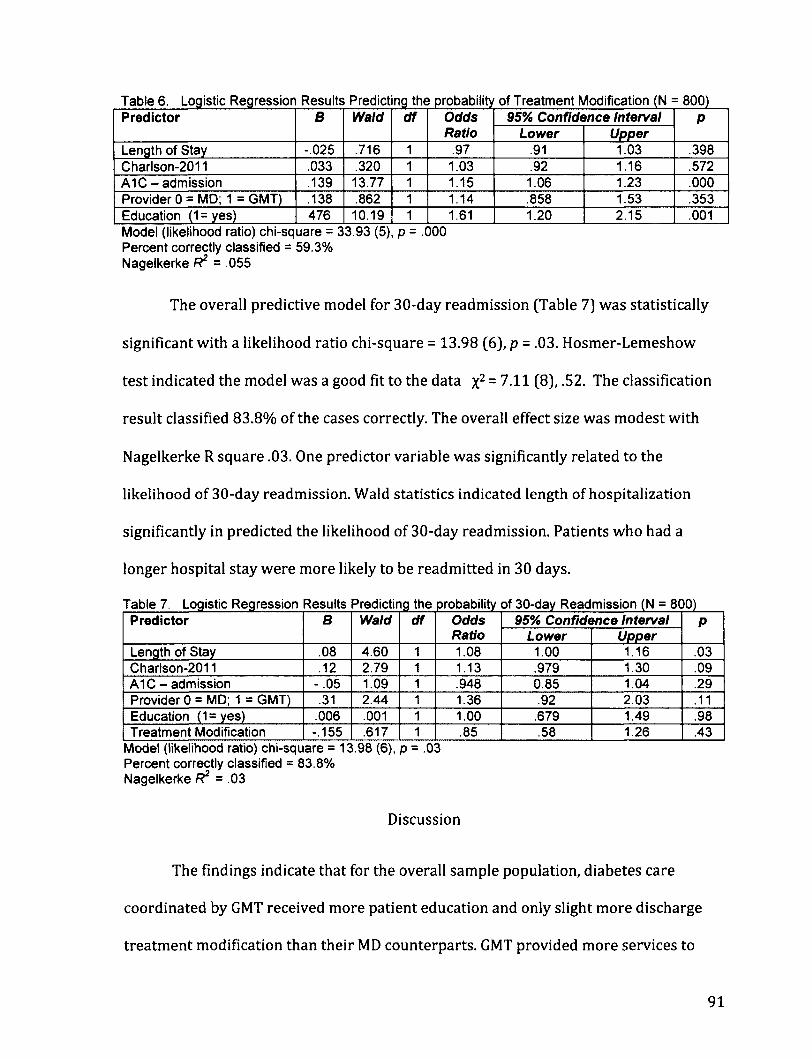
Table 6. Logistic Regression Results Predicting the probability of Treatment Modification (N = 800) Predictor B Wald df Odds
Ratio 95% Confidence Interval P Predictor B Wald df Odds
Ratio Lower Upper P
Length of Stay -.025 .716 1 .97 .91 1.03 .398 Charlson-2011 .033 .320 1 1.03 .92 1.16 .572 A1C - admission .139 13.77 1 1.15 1.06 1.23 .000 Provider 0 = MD; 1 = GMT) .138 .862 1 1.14 .858 1.53 .353 Education (1=yes) 476 10.19 1 1.61 1.20 2.15 .001 Model (likelihood ratio) chi-square = 33.93 (5), p = .000 Percent correctly classified = 59.3% Nagelkerke R2 = .055
The overall predictive model for 30-day readmission (Table 7] was statistically
significant with a likelihood ratio chi-square = 13.98 (6), p = .03. Hosmer-Lemeshow
test indicated the model was a good fit to the data x2 = 7.11 (8), .52. The classification
result classified 83.8% of the cases correctly. The overall effect size was modest with
Nagelkerke R square .03. One predictor variable was significantly related to the
likelihood of 30-day readmission. Wald statistics indicated length of hospitalization
significantly in predicted the likelihood of 30-day readmission. Patients who had a
longer hospital stay were more likely to be readmitted in 30 days.
Table 7. Logistic Regression Results Predicting the probability of 30-day Readmission (N = 800) Predictor B Wald df Odds
Ratio 95% Confidence Interval P Predictor B Wald df Odds
Ratio Lower Upper P
Length of Stay .08 4.60 1 1.08 1.00 1.16 .03 Charlson-2011 .12 2.79 1 1.13 .979 1.30 .09 A1C - admission - .05 1.09 1 .948 0.85 1.04 .29 Provider 0 = MD; 1 = GMT) .31 2.44 1 1.36 .92 2.03 .11 Education (1=yes) .006 .001 1 1.00 .679 1.49 .98 Treatment Modification -.155 .617 1 .85 .58 1.26 .43
Model (likelihood ratio) chi-square = 13.98 (6), p = .03 Percent correctly classified = 83.8% Nagelkerke R2 = .03
Discussion
The findings indicate that for the overall sample population, diabetes care
coordinated by GMT received more patient education and only slight more discharge
treatment modification than their MD counterparts. GMT provided more services to
91

patients with admission AlC ;> 8.1%. However, there was no difference in care
coordination for patients who were readmitted within 30 days. Characteristics of
patients referred for GMT services are: higher AlC, history of poor compliance with
diabetes regimen, complex diabetes regimen (multi-dose insulin injections, insulin
pumps, pregnant diabetics, steroid taper, major life changes due to acute illness), and
have complex social and environmental issues (lack of family support, placement issues,
homelessness).
The GMT coordinates the complex care needs of these patients by working
closely with the diabetes educator in providing specific/advanced education. They also
collaborate with patient/family and other healthcare professionals (i.e., attending MD,
primary care MD, diabetologists, case management, pharmacy, nutrition, social, and
other services) in providing safe and effective discharge plan and treatment
modification. Care coordination takes time and effort so when the patient is readmitted
within 30 days, it is evident further targeted interventions are needed. Behavior change
is difficult in learning new habits and thus discharge follow-up using telemedicine in
concert with home visitation may be indicated.
Significant findings were noted on the increased probability of having discharge
education, treatment modification, and a 30-day readmission. There was an increased
likelihood of patients receiving diabetes education when they had high AlC, treatment
modification, and care coordinated by GMT. Interestingly, the likelihood of patients
receiving treatment modification was higher when they had high AlC and received
diabetes education regardless of care coordination. These findings may be related to
92

GMT daily routine and responsibilities. Everyday, the GMT (NPs and diabetes
educators) reviews the list of all inpatients with glycemic issues (hyperglycemia or
hypoglycemia) and high A1C results, and briefly meets to address needs of patients
with complex needs. Previous studies found improvement in A1C and discharge
planning process that indicated similar roles for the NPs and diabetes educators
(Jakoby et al., 2008; Mullen & Kelly, 2006).
Although diabetes education is not exclusive to the patients under the care of the
NPs, they have easy access to diabetes educators (housed in the same office) when the
need arise. Otherwise, MDs and nurses access diabetes educators by telephone. Unlike
NPs, diabetes educator intervention does not require MD orders, hence, any patient
with high A1C or is being discharged will be prioritized for education intervention.
Diabetes educators may trigger a call to the MD if they judge the patient needs care
coordination by the NPs for IGC or discharge treatment modification.
Lastly, findings indicate that there is increased likelihood of readmission within
30-days when the patient had longer LOS. This may be associated with several factors,
i.e., more comorbid conditions, higher Charlson scores, compliance issues, living
situations, and other social/environmental factors.
These findings must be interpreted in the light there are several limitations to
this study: the retrospective design, largely Hispanic population (not representative of
the national ethnicity population distribution), and lack of outcomes post discharge.
Regardless, taken in this context, study findings are encouraging and provide additional
data for health care and policy agencies considering the use of GMTs in the inpatient
93

setting to improve overall discharge planning and care coordination for hospitalized
patients. Further research is needed to explore definitive IGC, economic costs, and post
discharge outcome differences between the two service provider groups.
94

References
American Diabetes Association (ADA) (2008). Economic Costs of Diabetes in the U.S. in
2007. Diabetes Care, 321(3), 596-615. Doi: 10.2337/dc08-9017
American Diabetes Association (ADA) (2010). Position Statement: Standards of Medical
Care in Diabetes - 2010. Diabetes Care, 33(S1), S11-S61. Doi: 10.2337/dcl0-S011
American Diabetes Association (ADA) (2012). Standards of medical care in diabetes--
2012. Diabetes Care, 35 Supplement 1, Sll-63. doi: 10.2337/dcl2-s011
Cohen, J. (1988). Statistical power analysis for the behavioral sciences (2nd ed.). Hillsdale,
N.J.: L. Erlbaum Associates.
Cook, C. B., Seifert, K. M., Hull, B. P., Hovan, M. J., Charles, J. C., Miller-Cage, V., et al.
(2009). Inpatient to outpatient transfer of diabetes care: Planning for an
effective hospital discharge. Endocrine Practice, 15(3), 263-269.
Custer, M. L. (2010). Outcomes of clinical nurse specialist-initiated system-level
standardized glucose management. Clinical Nurse Specialist, 24(3), 132-139. doi:
10.1097/NUR.0b013e3181d82a31 00002800-201005000-00006 [pii]
Flanagan, D., Moore, E., Baker, S., Wright, D., and Linch, P. (2008). Diabetes care in the
hospital-the impact of a dedicated inpatient care team. Diabetic Medicine, 25,
147-151. Doi: 10.1111/j.l464-5491.2007.02326
Fraze, T., Jiang, J., and Burgess, J. "Hospital Stays for Patients with Diabetes, 2008." 1-11:
Agency for Healthcare Research and Quality, 2010.
Hicks, R. W., Sikirica, V., Nelson, W., Schein, J. R., & Cousins, D. D. (2008). Medication
95

errors involving patient-controlled analgesia. [Research Support, Non-U.S. Gov't].
American Journal of Health-System Pharmacy, 65(5), 429-440. doi:
10.2146/ajhp070194
International Business Machines, Inc. (IBM). (2010). IBM SPSS Statistics (Version 19).
United States: International Business Machines, Inc.
Jakoby, M. G., Garey, A., Hall, M., Morris, L., Erikson, D., Wardwell, L., et al. (2008).
Management of hospitalized diabetic patients by a hospital diabetes care team
improves both inpatient and ambulatory glycemic control. Abstract. Carle
Foundation Hospital. Urbana, IL.
Joint Commission (2011). Advanced Certification in Inpatient Diabetes. Retrieved
February 1,2011, from
http://www.jointcommission.org/certification/inpatient_diabetes.aspx
Krinsley, J. S. (2003). Association between hyperglycemia and Increased hospital
mortality in a heterogeneous population of critically ill patients. Mayo Clinic
Proceedings, 78,1471-1478.
Krinsley, J. S. (2004). Effect of an intensive glucose management protocol on the
mortality of critically ill adult patients. Mayo Clinic Proceedings, 79(8), 992-1000.
Krinsley, J. S. (2008). Glycemic variability: a strong independent predictor of mortality
in critically ill patients. Critical Care Medicine, 56(11), 3008-3013. Doi:
10.1097/CCM.0b013e31818b38d2
Krinsley, J. S., & Grissler, B. (2005). Intensive glycemic management in critically ill
patients. Joint Commission Journal on Quality and Patient Safety, 31[6), 308-312.

Krinsley, J. S., & Grover, A. (2007). Severe hypoglycemia in critically ill patients: risk
factors and outcomes. Critical Care Medicine, 35(10), 2262-2267. Doi:
10.1097/01.CCM.0000282073.98414.4B
Lansang, M. C., and Umpierrez, G. E. "Management of Inpatient Hyperglycemia in
Noncritically 111 Patients." Diabetes Spectrum 21, no. 4 (2008): 248-55.
Moghissi, E. (2004). Hospital management of diabetes: Beyond the sliding scale.
Cleveland Clinical Journal of Medicine, 71(10), 801-808.
Moghissi, E. S., Korytkoski, M. T., DiNardo, M., et al. (2009). American Association of
Clinical Endocrinologists and American Diabetes Association consensus
statement on inpatient glycemic control. Endocrine Practice, 15(4), 1-17.
Mullen, B., & Kelley, P. A. W. (2006). Diabetes nurse case management: An effective tool.
Journal of the American Academy of Nurse Practitioners, 18, 22-30.
Ofman, J. ]., Badamgarav, E., Henning, J. M., Knight, K., Gano, A. D., Jr., Levan, R. K., et al.
(2004). Does disease management improve clinical and economic outcomes in
patients with chronic diseases? A systematic review. American Journal of
Medicine, 117(3), 182-192.
Quan, H., B. Li, C. M. Couris, K. Fushimi, P. Graham, P. Hider, J. M. Januel, and V.
Sundararajan. "Updating and Validating the Charlson Comorbidity Index and
Score for Risk Adjustment in Hospital Discharge Abstracts Using Data from 6
Countries." [In English]. American Journal of Epidemiology 173, no. 6 (Mar 15
2011): 676-82.
97

Smith, W. D., Winterstein, A. G., Johns, T., Rosenberg, E. and Sauer, B. C. (2005). Causes
of hyperglycemia and hypoglycemia in adult inpatients. American Journal of
Health-System Pharmacy, 62,714-719.
Umpierrez, G. E., Hellman, R., Korytkowski, M. T., Kosiborod, M., Maynard, G. A., Montori,
V. M., et al. (2012). Management of hyperglycemia in hospitalized patients in
non-critical care setting: an endocrine society clinical practice guideline.
[Practice Guideline]. Journal of Clinical Endocrinology and Metabolism, 97(1), 16-
38. doi: 10.1210/jc.2011-2098
Umpierrez, G. E., Isaacs, S. D, Bazargan, N., You, X., Thaler, L. M., Kitabchi, A. E. (2002).
Hyperglycemia: an independent marker of in-hospital mortality in patients with
undiagnosed diabetes. The Journal of Clinical Endocrinology & Metabolism, 87(3),
978-982.
US Census Bureau (2010). "State and County Quick Facts: Chula Vista, California."
http://quickfacts.census.gov/qfd/states/06/0613392.html
Van den Berghe, G., Wouters, P., Weekers, F., Verweast, C., et al. (2001). Intensive insulin
therapy in critically ill patients. New England Journal of Medicine, 345(19), 1359-
1369.
Wheeler, K., Crawford, R., McAdams, D., Benel, S., Dunbar, V. G., Caudle, J. M., et al.
(2004). Inpatient to Outpatient Transfer of Care in Urban Patients With Diabetes.
Archive of Internal Medicine, 164,447-453.
98

Wong, F. K., M. P. Mok, T. Chan, and M. W. Tsang. "Nurse Follow-up of Patients with
Diabetes: Randomized Controlled Trial." [In eng]. Journal of Advanced Nursing 50,
no. 4 (May 2005): 391-402.
99
Chapter 4: MANUSCRIPTS
Grant Proposal
UNIVERSITY OF SAN DIEGO
Hahn School of Nursing and Health Sciences
Inpatient Glycemic Management:
Clinical and economic impact of changing from sliding scale insulin to basal-bolus
Crisamar Javellana-Anunciado, PhD, RN, FNP-BC
100

Introduction
Glycemic control is recognized as an important part of inpatient care due to the
common, serious, and costly complications of poor glycemic control. Hyperglycemia,
severe hyperglycemia, mild hypoglycemia, severe hypoglycemia, and wide glucose
variability are implicated in poor outcomes (Krinsley 2003, 2008; Krinsley & Grover
2007). As the incidence of diabetes continuous to become more prevalent nationwide,
the number of hospital discharges with diabetes also increased. Hospital care costs for
patients with diabetes are staggering - accounting for approximately $87 billion
annually (American Diabetes Association 2008). Evidence suggests that hyperglycemia
during acute medical or surgical illness is a marker of poor clinical outcomes with
increased morbidity, mortality, and length of stay (Krinsley 2004; Umpierrez 2002).
When blood glucose is intensively controlled to near normal levels, it reduces the risks
of multi-organ failure, sepsis, morbidity, mortality, and length of stay (Krinsley &
Grissler 2005; Van den Berghe 2001). Optimum glycemic control reduces hospital costs
and is important to patients with acute and critical illness. Despite controversy over
specific glycemic targets, an understanding of glycemic control is widely understood to
be at least under a blood glucose level of 180 mg/dl (American Diabetes Association
2010; Moghissi 2009; NICE-SUGAR 2009). Over the last decade, various approaches to
achieving glycemic control have been implemented at several institutions nationwide
but glycemic control remains suboptimal (Boord, 2009). There is still a considerable
gap in research on the relationship between clinical outcomes and economic costs of
good glycemic control.
101

Research Aims
This retrospective research study is designed to evaluate the clinical outcomes
and economic costs of implementing an inpatient glycemic management program
intended to eliminate the use of the traditional sliding scale insulin (SSI] therapy in
favor of the use of a more physiologic approach to hyperglycemia using basal-bolus
insulin (BBI) therapy. This study will evaluate the clinical outcomes and economic costs
of SSI vs. BBI therapy.
The primary outcomes are to evaluate the differences in glycemic control i.e.,
mean blood glucose (BG) control, incidences of hyperglycemia (BG >180 mg/dL), severe
hyperglycemia (BG >300 mg/dL), hypoglycemia (BG <60 mg/dL), and severe
hypoglycemia (BG <40 mg/dL) between treatment groups (SSI vs. BBI therapy).
Secondary outcomes include differences between treatment groups in length of stay,
inpatient mortality, 30-day readmission rates, and economic costs, i.e., inpatient
diabetes-related pharmacy and medical costs.
Research Questions
1. What are the clinical outcome differences (i.e. mean blood control, incidence of
hyperglycemia and hypoglycemia, length of stay, inpatient mortality, and 30-day
readmission rates) in converting from SSI therapy to BBI therapy?
2. What are the economic cost differences (i.e. inpatient diabetes-related pharmacy
and medical costs) in converting from SSI therapy to BBI therapy?
102
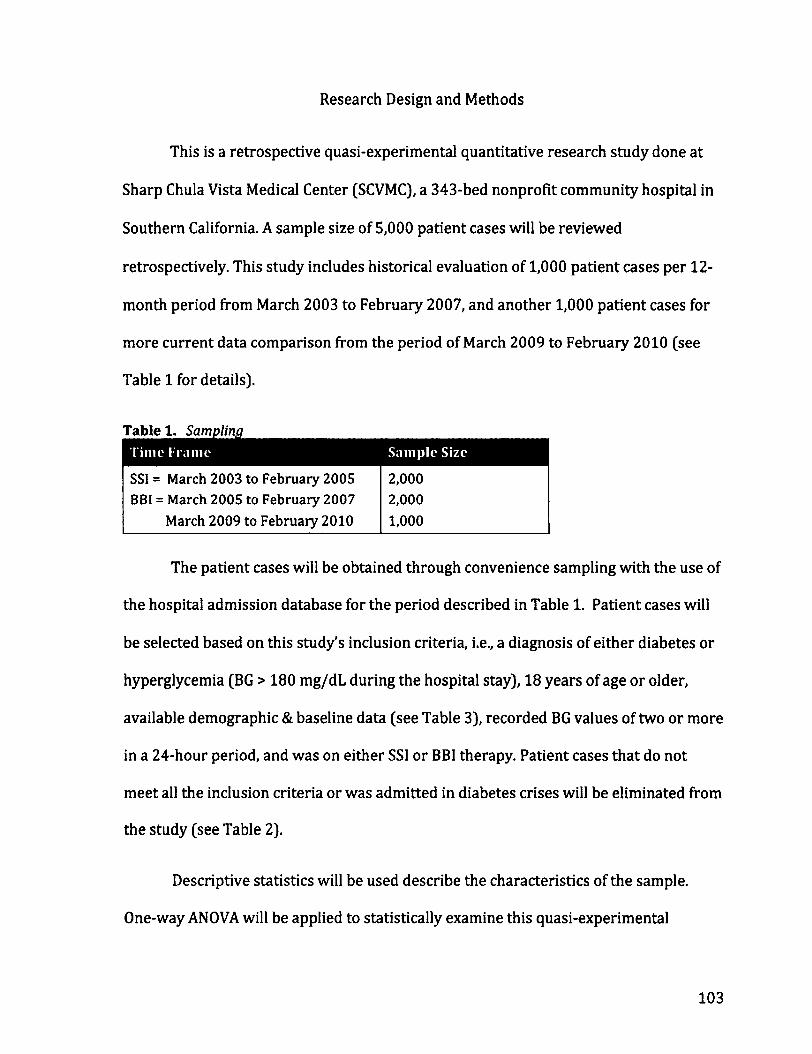
Research Design and Methods
This is a retrospective quasi-experimental quantitative research study done at
Sharp Chula Vista Medical Center (SCVMC), a 343-bed nonprofit community hospital in
Southern California. A sample size of 5,000 patient cases will be reviewed
retrospectively. This study includes historical evaluation of 1,000 patient cases per 12-
month period from March 2003 to February 2007, and another 1,000 patient cases for
more current data comparison from the period of March 2009 to February 2010 (see
Table 1 for details).
Table 1. Sampling
SSI = March 2003 to February 2005 2,000 BBI = March 2005 to February 2007 2,000
March 2009 to February 2010 1,000
The patient cases will be obtained through convenience sampling with the use of
the hospital admission database for the period described in Table 1. Patient cases will
be selected based on this study's inclusion criteria, i.e., a diagnosis of either diabetes or
hyperglycemia (BG > 180 mg/dL during the hospital stay), 18 years of age or older,
available demographic & baseline data (see Table 3), recorded BG values of two or more
in a 24-hour period, and was on either SSI or BBI therapy. Patient cases that do not
meet all the inclusion criteria or was admitted in diabetes crises will be eliminated from
the study (see Table 2).
Descriptive statistics will be used describe the characteristics of the sample.
One-way ANOVA will be applied to statistically examine this quasi-experimental
103

research study for (g = 2 groups) between-group comparisons on key outcomes (e.g.,
LOS, Mean BG, etc.). If the outcomes are logically/statistically clustered, multivariate
approaches, such as MANOVA, will be performed. Moreover, given a host of
demographic/baseline data and clinically relevant drivers, a predictive approach will
also be employed. A multiple regression approach will also be utilized to ascertain
which variables are the strongest predictors of key outcomes.
Table 2. Exclusion & Inclusion Criteria
Diagnosis of Diabetes or hyperglycemia Patients on sulfonylureas with insulin and/or oral antidiabetic medications only
Age 18 years & older < 18 year old
Average of 3 or more days of hospital stay < 3 day hospital stay
Patients with all required demographic & baseline data
Patient with incomplete demographic/baseline data
Patients with 2 or more BG values in 24 hour period
Patients with < 2 BG values in 24 hour period
Patients on subcutaneous insulin SSI or BBI Treatment of basal insulin without short-acting insulin
Patients admitted for DKA or HHS
Legend: DKA = diabetes ketoacidosis; HHS = hyperosmolar hyperglycemic syndrome
Data will be obtained through electronic medical records (EMR) and electronic
financial records (EFR). Hospital data from consecutive months of March 2003 to
February 2007 will provide two years of sufficient data for SSI therapy and two years of
BBI therapy. Additionally, hospital data from consecutive months of March 2009 to
February 2010 will provide outcomes of the most recent year post-BBI implementation.
Table 3 lists the three categories of measures, which were collected for statistical
analyses: (a) demographic or baseline data (i.e., age, gender, ethnicity, admission
diagnosis, and admission BG); (b) clinical outcome measures (i.e., mean BG level per
104

patient day, BG in good control, mild hyperglycemia, severe hyperglycemia, mild
hypoglycemia, severe hypoglycemia, discharge diagnosis, transfer to ICU, length of stay,
and 30-day readmission rate; and, (c) economic costs (i.e., overall hospital costs,
inpatient pharmacy costs, and medical costs).
Table 3. Measures Dimension
Demographics/ Baseline data
Variable
Age Gender Ethnicity Admission Diagnosis Admission BG
Data Source
EMR EMR EMR EMR EMR
Clinical Outcomes for SSI versus BBI
Mean BG level per patient day BG w/in good control (BG 71-180 mg/dL) Hyperglycemia (BG >180 mg/dL) Severe hyperglycemia (BG >300 mg/dL) Hypoglycemia (BG < 60 mg/dL) Severe hypoglycemia (BG <40 mg/dL) Hospital Discharge diagnosis Transfer to ICU Length of stay In-hospital mortality 30-day readmission
EMR EMR EMR EMR EMR EMR EMR EMR EMR EMR EMR
Economic Costs for SSI versus BBI
Overall hospital costs Inpatient pharmacy costs Medical costs
EFR EFR EFR
Legend: EMR = electronic medical record; EFR = electronic financial records
In 2002, Sharp Healthcare system started collecting all BG results from both
laboratory and point-of-care fingerstick BGs using the Roche Inform® meter from all
five Sharp Healthcare facilities. SCVMC has more than 250 diabetes patient cases and
more than 10,000 BG results monthly, which is the highest among the five hospitals. All
BG results are uploaded into the system database. Upon initial review of the BG data, we
discovered that the data became more consistent at the end of the first quarter of 2003.
The basal-bolus protocol, called Subcutaneous Insulin Order Set (SIOS) (shown in
105

Figure 1) as well as a glycemic management team (GMT), was implemented on
February 14, 2005. The use of SIOS increased beginning March 2005, and reached more
than 80% use by June 2005. For the purpose of this study, hospital BG data for the
consecutive months of March 2003 to February 2005 provides two years of data for SSI
therapy, and the consecutive months from March 2005 to February 2007 provides the
initial two years of BBI therapy. Hospital data for the consecutive months of March
2009 to February 2010 provides outcomes for the most recent year post-BBI
implementation.
Limitations
It is important to note that the GMT was implemented at the same time the use
of the SIOS was implemented. The GMT is a group of nurse practitioners and diabetes
educators under the general supervision of the diabetes medical director. When the
patient's attending physician refers a patient to the GMT, the GMT takes over the
diabetes care of the patient during the hospital stay. The GMT makes daily insulin
adjustments, provides diabetes education, refers the patient to outpatient diabetes
education program, and makes changes on diabetes regimen for home based on each
individual patient's needs. The 3,000 patient cases on BBI therapy in this study were
managed either by the physician alone or with the assistance of the GMT. The full
impact of the GMT intervention will not be addressed in this study.
106

Figure 1. Subcutaneous Insulin Order Set (SIOS)
Printed 7:05 «n. 11/1/06
SERE0"* J PRINT RESET Patient Name:
Medical Center Subcutaneous Insulin Orders (SIOS)
PIMM rtftr to SK>S GUMHOM on #» tec* of Ms ontor km
Target Blood Glucose (BG) Range: i 110 mgML (Prt iraal); < 1S0 mg/dL (maximum)
Step 1 • Dltcontlnue al previous ln«l«n suOQnvtureas (GMuridu G*otart» Glrrmahdm hlmMniti 1 Raomc*nd»l and BG checks • Hemoglobin A.C level in am If not already done (obtain level once per hospitalization).
If Eating by mouth: Check BG wtthin 30 mkHtet betore meals and at 2200.
• Check BG at 0300
If NPO: check BG every 4 hrt. Follow Step 6 guidellnee below.
Tube Feedhtg (TF): check BG every 4 hrt Give M dote Atpart (WovoLog*) Inauln per regimen if TF at goal rale. If TF It lew than goal rale, toaow Step • guidelines below.
K failing, do not cover 2200 ( 0300 SGs w*h Atpart (NovoLof) Inautn unless specHfed bakm. •
Step 3 Order Met Dtatoebc with soeoftc caiones. ft Urn* CHO to 45 grams/meal w addition to speaakzed c*rt order Give HS snack. Enteral Feeding If pt it on Gtargine flantua*) ft contimwut 24-tir TF It intenupted * 2 hrt, start IV 10% Dextrose at 40mVhr, slop IV Mutton «rtien lube feeding it restarted. (Consut MD poor to starting 10% Dextrose if serum Sodium level is <130)
Step 4 Wabetee Education: Afarae to begin leaching the patient mr ftwtMtignWcant other about Diabetes & Intuin SeW-admmtstrakorv
Step 6 Administer Subcutaneous Ay ART (Hovoloo*) RECMCN as follows: Nott: AtmeaMmm, Atpml(MOYOLO )Imutlii mf beghmtba/orm. durinoarlmmedlmflr atttr Otem—L
BG MGML • MLD
kai*i SaaSn
• MOOERATE »—ili
• AGGRESSIVE kMtoRHMMkMM
• Custom BG mgML
s70 Implement Hypo&ycema Protocol 4 Car MD *70
71-90 oumt OUrat OUrat Units 71-90
91-120 0 Units 3 Units 4 Units Umtt 91-120
121-150 3 Urals 5 Units 6 Urals Units 121-150
151-200 4 Units 6 Units 8 Units Units 151-200
201-250 5 Unas 7 Units 10 Units units 201-250
251-300 6 Units 8 Units 12 Units units 251-300
301-350 7 units 9 Units 14 Units Units 301-350
351-400 8 Units 10 Units 16 Units Unas 351-400
Step • use of % do— ASP ART (HovoLoa*)
1. NPO. deer tquM diet, or poor appetite (<50% intake), use Vldoee Aspart (Novotog") onfyfBG SI 51 mgttL. 2. Do not sdmlnlitet Atpart (NanLog0) instin when BG 51SOmoftIC > any of the situations above appkee.
step 7 mvit *m»art <wowoLnn*> mini • » 2 cansecukve BG raeuti > m moML. tocreeee Aaoaft (NfraLafl coalman to mxt acorocnate level • V 2 consecutive BG leeukt < 90 mgML, decmsf_ASPart (NovoLoff) regimen to next appropriate level
Step S BASAL MSUUN0WP6R • Administer GtanHwe ft anna*) inauln sufacutaneouslv dakv at 2200 (Wscommentftkons. toikal Gamine (Lentus*)
doee 10 unb. Low
Step s
doee; 10 unb. Lower dose may be needed tor CRF pts) Meese see beck tar details on dbsing and dMfy adjustments. HOTFYMD • Wpt becomes HPO or has pertinently poor appotte because Gttrgne (lanfta*) doee may need to be adjusted • If steroid doee cImmqm became GOrgtrie (Lantm *) Ocae may need to be ac us*ed • IMMEDIATELY « BG 5 SO mgML or 2 400 i»g/dL • to AM or next MO Rounds f BG < 70 mgML or or >301 n«ML or • a BG remains >250 mgML tor12 lioure on AgpeesA* regimen, or* BG decreases to <90 mgML on MM regimen
_VOnOREM>WCK
MOSigratura
RN Signature
poosei-cvfw> ms)
Detsfflna
Nosing
PRINT ][ RESET
107
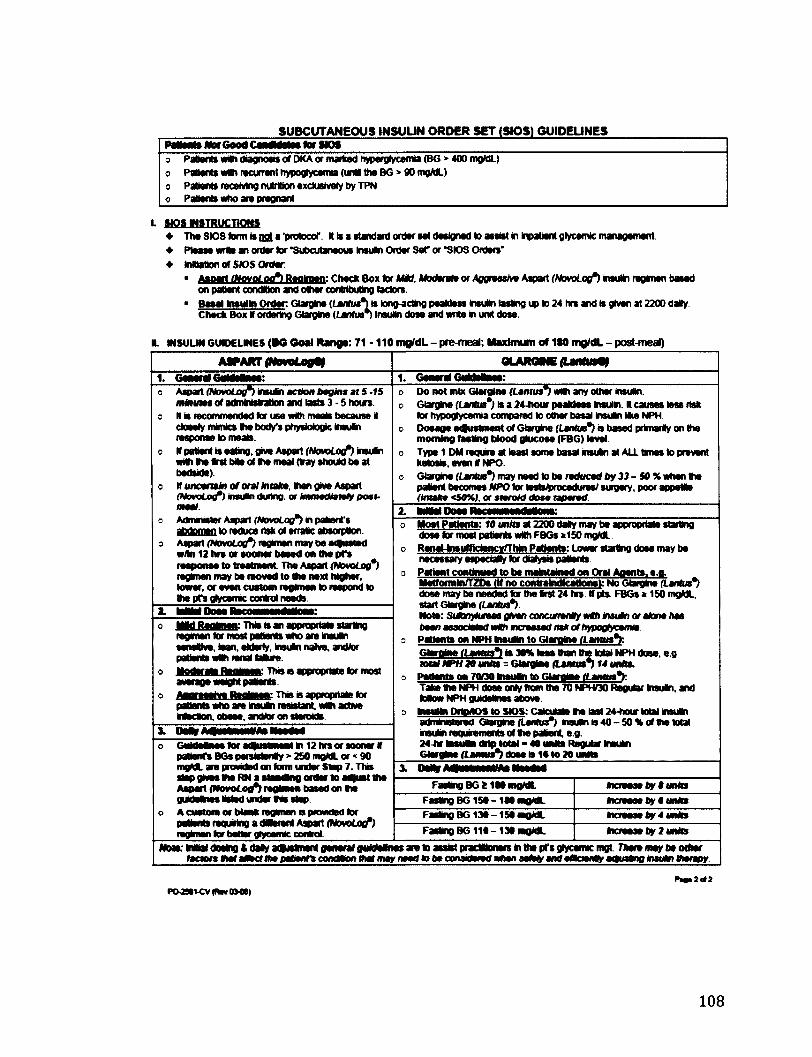
SUBCUTANEOUS INSUUN ORDER SET (SIPS) GUIDEUNES Pettmts Wot Good CendMatee tot HO* o Patient* wilh diagnosis or DKA or marked hyperglycemia (BG > 400 mgML) o Patients vrtth recurrent hypoglycemia (una the BG> 90 mgML) o Patient* receiving nutrition exclusively by TPN o Patient* who ate pregnant
L MPflf mtiKVcnotw • The SIQ9 farm l« not a 'protocol'. It Is a standard order set designed to assist In Inpatient gtycemic management • Pteaee wrtt an order lor "Subcutaneous Insum Order Set" or *SiOS Orders" • mutation of S»5 Order
• Aanatt tNovoLotft Reolmen: Check Box tor MM. Moderate or Aggnashm Aipart (NovoLoifi Insulin regimen based on patient condition and other contributing (actors.
• Besel Insulin Order. Giargine (Lantua*)* tong-acttog peaktoss Insuln lasting up to 24 hrs and is given at 2200 daily Check Box If ordering Giargine {Lantwn Insulin dote and write in unit dose.
I. MSULM GUDELMES (BO Ooai Range: 71-110 mQ/dL - prMneal; Maximum of 1«0 mjj/dL - post-meal)
ASPART (NCVOLogtt QLAROME (LMfttrty
1. Goaoral6«MolMo: 1. General GKdHnii: o Aspart (NovoLoif) insutn action begin* ai S -f5
ntftuies of adminMation and lasts 3 - 5 hours, o It is recommended tor use with meats because it
ctoMfy mimics thi body's physiologic insuNn response to nwsls.
o If patient Is eabng. grve Aspart (NamLo(f) insuln with Vie Srst bile of Ihe meal (tray should be at bedside)
o If uncertain of oral miaka then gree Aspart (Novobof) nsuin doing, or Immwdiatmly post-meal.
s Adnwuster Aipart (NovoLog*) in patient's abdomen to reduce risk of erratic absorption
o Aipart (NovoLoff) regimen may be adlusted w/ln 12 hrs or sooner beeed on Ihe pfs response to treatment The Aspart (NovoLog*) regimen may be moved to the next higher, lower, or even custom regimen to respond to the pfs glycemc control needs.
o Do not mix Giargine (Lamus*) unth any other insulin. o Giargine (Lanlm*) is a 24-hour peakleet Insulin. It causes less risk
tor hypoglycemia compared to other basal insulin Ike NPH o Dosage etfustment of Giargine (Lantua*) a based primarily on the
morning testing blood glucose (FBG) level o Type 1 DM require at least some basal insuln at ALL times to prevent
ketosa, even If NPO c Giargine {tartus") may need to be reduced by 33-50% when the
patent becomes NPO tor tostsfrrocodures/surgery. poor appetite (tmaka <SO%), or steroM dose taparad
o Aspart (NovoLoif) insutn action begin* ai S -f5 ntftuies of adminMation and lasts 3 - 5 hours,
o It is recommended tor use with meats because it ctoMfy mimics thi body's physiologic insuNn response to nwsls.
o If patient Is eabng. grve Aspart (NamLo(f) insuln with Vie Srst bile of Ihe meal (tray should be at bedside)
o If uncertain of oral miaka then gree Aspart (Novobof) nsuin doing, or Immwdiatmly post-meal.
s Adnwuster Aipart (NovoLog*) in patient's abdomen to reduce risk of erratic absorption
o Aipart (NovoLoff) regimen may be adlusted w/ln 12 hrs or sooner beeed on Ihe pfs response to treatment The Aspart (NovoLog*) regimen may be moved to the next higher, lower, or even custom regimen to respond to the pfs glycemc control needs.
3 Most Patients: 10 unlu at 2200 daly may be anorocrtato starting dose tor most patients with FBGs >150 mgML
o RenaMnsumdencynrhin Patients: Lmvar startina dose mav be necessary espedaHy tor dialysis patients
o Patient continued to be mafcitaMed on Oral Aoents. e.o. Metformln/TZDe (If no contraindications): No Gtarolne (Lantut*) dose may be needed tor the tost 24 hre. If pts. FBGs * 150 mgML. start Giaigine (Lantus*) Noto: SiArq4uroas gAw> concunen«)r Mill ir»u*n or atone/las been assoaatsdwCh increased As* of/>H»gfyeemia-
a Patients on NPH hteufci to Giargine (Lantus** Glatntoi (Lamus*l is 30% lees than the total NPH dose. e.o. total NPH 20 unfts = Giargine (Lantut*) 14 unit*.
o Petlents on 7<V30 taeuOn to Giarnine (Laiuu*mY. Take the NPH dose only from the 70 NPHQ0 Regular tosuln, and toMow NPH guidelines above.
a ineulin DrtoAOS to SK>S:CalcuM» toe last 24-hour total insuln administered Giaigine {Lenfta") insuln is 40-50* of the total insulin requirements of tie patent, e.g. 24-hr toiutoi <Mp total - 40 units Regular toeukn Giargine (Lamua*) dose is 16 to 20 units
2. kMHOowRecaMMMlNi:
3 Most Patients: 10 unlu at 2200 daly may be anorocrtato starting dose tor most patients with FBGs >150 mgML
o RenaMnsumdencynrhin Patients: Lmvar startina dose mav be necessary espedaHy tor dialysis patients
o Patient continued to be mafcitaMed on Oral Aoents. e.o. Metformln/TZDe (If no contraindications): No Gtarolne (Lantut*) dose may be needed tor the tost 24 hre. If pts. FBGs * 150 mgML. start Giaigine (Lantus*) Noto: SiArq4uroas gAw> concunen«)r Mill ir»u*n or atone/las been assoaatsdwCh increased As* of/>H»gfyeemia-
a Patients on NPH hteufci to Giargine (Lantus** Glatntoi (Lamus*l is 30% lees than the total NPH dose. e.o. total NPH 20 unfts = Giargine (Lantut*) 14 unit*.
o Petlents on 7<V30 taeuOn to Giarnine (Laiuu*mY. Take the NPH dose only from the 70 NPHQ0 Regular tosuln, and toMow NPH guidelines above.
a ineulin DrtoAOS to SK>S:CalcuM» toe last 24-hour total insuln administered Giaigine {Lenfta") insuln is 40-50* of the total insulin requirements of tie patent, e.g. 24-hr toiutoi <Mp total - 40 units Regular toeukn Giargine (Lamua*) dose is 16 to 20 units
o IMd Renlmsti. Thie is an acoroortalB staritw regimen tor most patwnts who ate Ineuln sensitive, lean, elderly. insuln naive, andtor PSBVRS VN rani BUV.
o Hyairn Psnjaan: Thn a appropriate tor most average weight paOonts.
o lUoimen: This is apptopnale tor patients who ate insufci leaisbnt. with active
Muiinv IVKnv QDMA, mmmm QVi SMNIMQB.
3 Most Patients: 10 unlu at 2200 daly may be anorocrtato starting dose tor most patients with FBGs >150 mgML
o RenaMnsumdencynrhin Patients: Lmvar startina dose mav be necessary espedaHy tor dialysis patients
o Patient continued to be mafcitaMed on Oral Aoents. e.o. Metformln/TZDe (If no contraindications): No Gtarolne (Lantut*) dose may be needed tor the tost 24 hre. If pts. FBGs * 150 mgML. start Giaigine (Lantus*) Noto: SiArq4uroas gAw> concunen«)r Mill ir»u*n or atone/las been assoaatsdwCh increased As* of/>H»gfyeemia-
a Patients on NPH hteufci to Giargine (Lantus** Glatntoi (Lamus*l is 30% lees than the total NPH dose. e.o. total NPH 20 unfts = Giargine (Lantut*) 14 unit*.
o Petlents on 7<V30 taeuOn to Giarnine (Laiuu*mY. Take the NPH dose only from the 70 NPHQ0 Regular tosuln, and toMow NPH guidelines above.
a ineulin DrtoAOS to SK>S:CalcuM» toe last 24-hour total insuln administered Giaigine {Lenfta") insuln is 40-50* of the total insulin requirements of tie patent, e.g. 24-hr toiutoi <Mp total - 40 units Regular toeukn Giargine (Lamua*) dose is 16 to 20 units
i
| !
A
3 Most Patients: 10 unlu at 2200 daly may be anorocrtato starting dose tor most patients with FBGs >150 mgML
o RenaMnsumdencynrhin Patients: Lmvar startina dose mav be necessary espedaHy tor dialysis patients
o Patient continued to be mafcitaMed on Oral Aoents. e.o. Metformln/TZDe (If no contraindications): No Gtarolne (Lantut*) dose may be needed tor the tost 24 hre. If pts. FBGs * 150 mgML. start Giaigine (Lantus*) Noto: SiArq4uroas gAw> concunen«)r Mill ir»u*n or atone/las been assoaatsdwCh increased As* of/>H»gfyeemia-
a Patients on NPH hteufci to Giargine (Lantus** Glatntoi (Lamus*l is 30% lees than the total NPH dose. e.o. total NPH 20 unfts = Giargine (Lantut*) 14 unit*.
o Petlents on 7<V30 taeuOn to Giarnine (Laiuu*mY. Take the NPH dose only from the 70 NPHQ0 Regular tosuln, and toMow NPH guidelines above.
a ineulin DrtoAOS to SK>S:CalcuM» toe last 24-hour total insuln administered Giaigine {Lenfta") insuln is 40-50* of the total insulin requirements of tie patent, e.g. 24-hr toiutoi <Mp total - 40 units Regular toeukn Giargine (Lamua*) dose is 16 to 20 units
o GwMsMnee*oraHusiwsiln12hreorsoonerlf pattenTs BGs paraistonty » 250 mgML or < 90 mgML are provided on tone under Stop 7. This slap gives *w RN a atamans order to a ust the Aipart (Wovotooft tegkaon based on the guideim i istod under Ms step.
o A custom or blank regimen is provided tor patterns requiring a JMtosU Aspart (HowLofl ) regimen tot bettor glycemc control
x Dm mimiiwn Heeded
o GwMsMnee*oraHusiwsiln12hreorsoonerlf pattenTs BGs paraistonty » 250 mgML or < 90 mgML are provided on tone under Stop 7. This slap gives *w RN a atamans order to a ust the Aipart (Wovotooft tegkaon based on the guideim i istod under Ms step.
o A custom or blank regimen is provided tor patterns requiring a JMtosU Aspart (HowLofl ) regimen tot bettor glycemc control
Fasting BG fc 1M mgML Incnmaa by $ units
o GwMsMnee*oraHusiwsiln12hreorsoonerlf pattenTs BGs paraistonty » 250 mgML or < 90 mgML are provided on tone under Stop 7. This slap gives *w RN a atamans order to a ust the Aipart (Wovotooft tegkaon based on the guideim i istod under Ms step.
o A custom or blank regimen is provided tor patterns requiring a JMtosU Aspart (HowLofl ) regimen tot bettor glycemc control
Faskng BG150 -180 mgML Incnmaa by o unto
o GwMsMnee*oraHusiwsiln12hreorsoonerlf pattenTs BGs paraistonty » 250 mgML or < 90 mgML are provided on tone under Stop 7. This slap gives *w RN a atamans order to a ust the Aipart (Wovotooft tegkaon based on the guideim i istod under Ms step.
o A custom or blank regimen is provided tor patterns requiring a JMtosU Aspart (HowLofl ) regimen tot bettor glycemc control
Fasting BG 130 -150 moML mcrarnsa by 4 units
o GwMsMnee*oraHusiwsiln12hreorsoonerlf pattenTs BGs paraistonty » 250 mgML or < 90 mgML are provided on tone under Stop 7. This slap gives *w RN a atamans order to a ust the Aipart (Wovotooft tegkaon based on the guideim i istod under Ms step.
o A custom or blank regimen is provided tor patterns requiring a JMtosU Aspart (HowLofl ) regimen tot bettor glycemc control Faskng BG 110 -130 mgML tocraase by 2 units
Woie: Wtdl dosing tttatyaHuttoiert general guWelines are to assist pfaOBonetsm the prsglycemicmgt Tfteremay be orter taaon tml a0»ct lha p*mnn cona*on m* may naad lo ba conantand wttan salaty anl ancmoOy at)u*m>u nautn Bmrapy
Pao>2<#2
PO»VCV(RwOHIS)
108

Risks to Patients
There are no direct patient risks involved. All data are collected retrospectively;
hence, there will be no actual patient contact. Precautions to protect patient privacy in
accordance to HIPAA regulations will be taken. Access to patient information will be
limited to data collectors (i.e., primary investigator, data analysts, accounting
department personnel, and research assistants). Data will be de-identified prior to
transferring the information to the statistician and the study's funding agency.
Deliverables
Statistical analysis plan (SAP): Data collected will be entered in an excel spreadsheet to
include all variables listed on Table 3. Data will be transferred to SPSS PASW version
17.0 for analysis or other statistical software preferred.
Feasibility of study: The members of this study as listed on Table 5, discussed the
feasibility of this study. The principal investigator of this study will be primarily
responsible for ensuring the timeliness, integrity, accuracy all data collection, analysis,
and final report. Other members will either assist in some capacity with the data
collection or as consultants for the study. Table 4 outlines the milestones and timelines
for study completion.
109

Table 4. Milestones and Timelines
Complete data collection and statistical analysis (EMR and EFR data) for: SSI (March 2003 to February 2005) and BBI = March 2005 to February 2007, and March 2009 to February 2010
90 days
Executive Summary 120 days
Final Report 150 days
*Note: study days begin post contract consummation
Capability & Competency Description
Sharp Chula Vista Medical Center (SCVMC) has been collecting and analyzing
data on blood glucose measures since 2002. We have dedicated resources to our
Diabetes Program to improve the care of our patients with diabetes. In 2005, SCVMC
instituted a glycemic management team exclusively dedicated in managing inpatient
hyperglycemia and subsequently setting up patients' discharge plans. Table 5 lists the
people involved in various capacities in this research project.
Table 5. Research Study Members
Primary Investigator Crisamar Anunciado, MSN, RN, FNP-BC
Inpatient Diabetes Nurse Practitioner
Medical Director, Diabetes Program
Georges M. Argoud, MD, FACE Adviser/Consultant
Chief Executive Office Pablo Velez, RN, PhD Adviser/Consultant
Director of Research and Education
Karen Wikoff, RN, PhD Adviser/Consultant
Accountant Mark Reyes Finance Consultant
Decision Support Brett MacLaren, MBA
Josh Fluty
Manager
Staff
Statistician Dale Glaser, PhD Statistician/Consultant
Director, Diabetes Program for Sharp Healthcare
Jacqui Thompson, RN, MS Adviser/Consultant
110
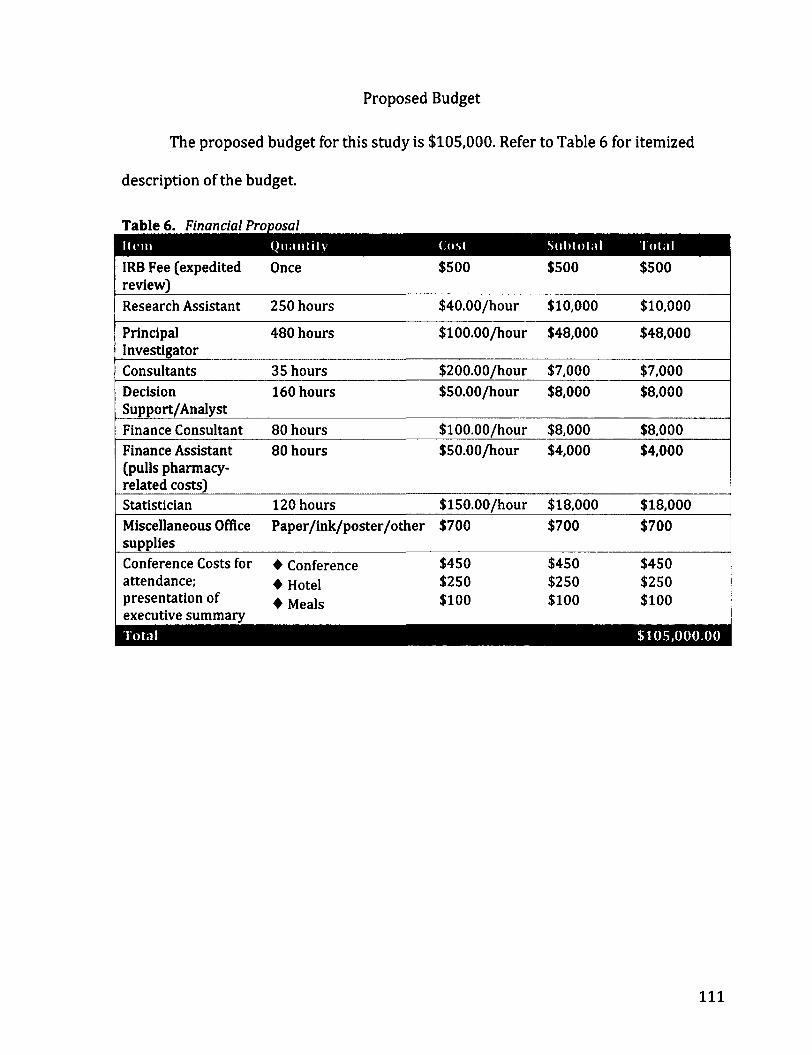
Proposed Budget
The proposed budget for this study is $105,000. Refer to Table 6 for itemized
description of the budget.
Table 6. Financial Proposal
IRB Fee (expedited review)
Once $500 $500 $500
Research Assistant 250 hours $40.00/hour $10,000 $10,000
Principal Investigator
480 hours $100.00/hour $48,000 $48,000
Consultants 35 hours $200.00/hour $7,000 $7,000 Decision 160 hours $50.00/hour $8,000 $8,000 Support/Analyst Finance Consultant 80 hours $100.00/hour $8,000 $8,000 Finance Assistant 80 hours $50.00/hour $4,000 $4,000 (pulls pharmacy-related costs) Statistician 120 hours $150.00/hour $18,000 $18,000 Miscellaneous Office supplies
Paper/ink/poster/other $700 $700 $700
Conference Costs for • Conference $450 $450 $450 attendance; • Hotel $250 $250 $250 presentation of executive summary
• Meals $100 $100 $100
•HI ••••
111

Payment Schedule
The study will be completed within 150 days from the consummation of the
contract with funding agency. Refer to Table 7 for details on proposed payment
schedule.
Table 7. Milestones and Payment Schedule
Contract execution 10% $10,500 Need check cut within net 5 days from date of invoice
Completion of data collection and statistical analysis (raw data)
40% $42,000 Standard Payment Schedule
Executive Summary 40% $42,000 Standard Payment Schedule Final Report 10% $10,500 Standard Payment Schedule
112

References
American Diabetes Association (2008). Economic Costs of Diabetes in the U.S. in 2007.
Diabetes Care, 311(3), 596-615. doi: DOI: 10.2337/dc08-9017
American Diabetes Association (2010). Position Statement: Standards of Medical Care
in Diabetes - 2010. Diabetes Care, 33(Supllement 1), S11-S61. doi: 10.2337/dcl0-
S011
Boord, J. B., Greevey, R.A., Braithwaite, S., Arnold, P.C., Selig, P.M., Brake, H., Cuny, J., &
Baldwin, D. (2009). Evaluation of Hospital Glycemic Control at US Academic
Medical Centers. Society of Hospital Medicine, 4(1), 35-44. doi: DOI
10.1002/jhm.390
Krinsley, J. S. (2003). Association between hyperglycemia and Increased hospital
mortality in a heterogeneous population of critically ill patients. Mayo Clinic
Proceedinngs, 78,1471-1478.
Krinsley, J. S. (2004). Effect of an intensive glucose management protocol on the
mortality of critically ill adult patients. Mayo Clinic Proceedings, 79(8), 992-1000.
Krinsley, J. S. (2008). Glycemic variability: a strong independent predictor of mortality
in critically ill patients. Critical Care Medecine, 36(11), 3008-3013. doi:
10.1097/CCM.0b013e31818b38d2
Krinsley, J. S., & Grissler, B. (2005). Intensive glycemic management in critically ill
patients. Joint Commission Journal on Quality and Patient Safety, 31(6), 308-312.
113
Krinsley, ]. S., & Grover, A. (2007). Severe hypoglycemia in critically ill patients: risk
factors and outcomes. Critical Care Medecine, 35(10), 2262-2267. doi:
10.1097/01.CCM.0000282073.98414.4B
Moghissi, E. S., Korytkoski, M. T., DiNardo, M., et al. (2009). American Association of
Clinical Endocrinologists and American Diabetes Association consensus
statement on inpatient glycemic control. Endocrine Practice, 15(4), 1-17.
NICE-SUGAR. (2009). Intensive versus conventional glucose control in critically ill
patients. The New England Journal of Medicine, 360(13), 1283-1297.
Umpierrez, G. E., Isaacs, S. D, Bazargan, N., You, X., Thaler, L. M., Kitabchi, A. E. (2002).
Hyperglycemia: an independent marker of in-hospital mortality in patients with
undiagnosed diabetes. The Journal of Clinical Endocrinology & Metabolism, 87(3),
978-982.
Van den Berghe, G., Wouters, P., Weekers, F., Verweast, C., et al. (2001). Intensive insulin
therapy in critically ill patients. New England Journal of Medicine, 345(19), 1359-
1369.
114
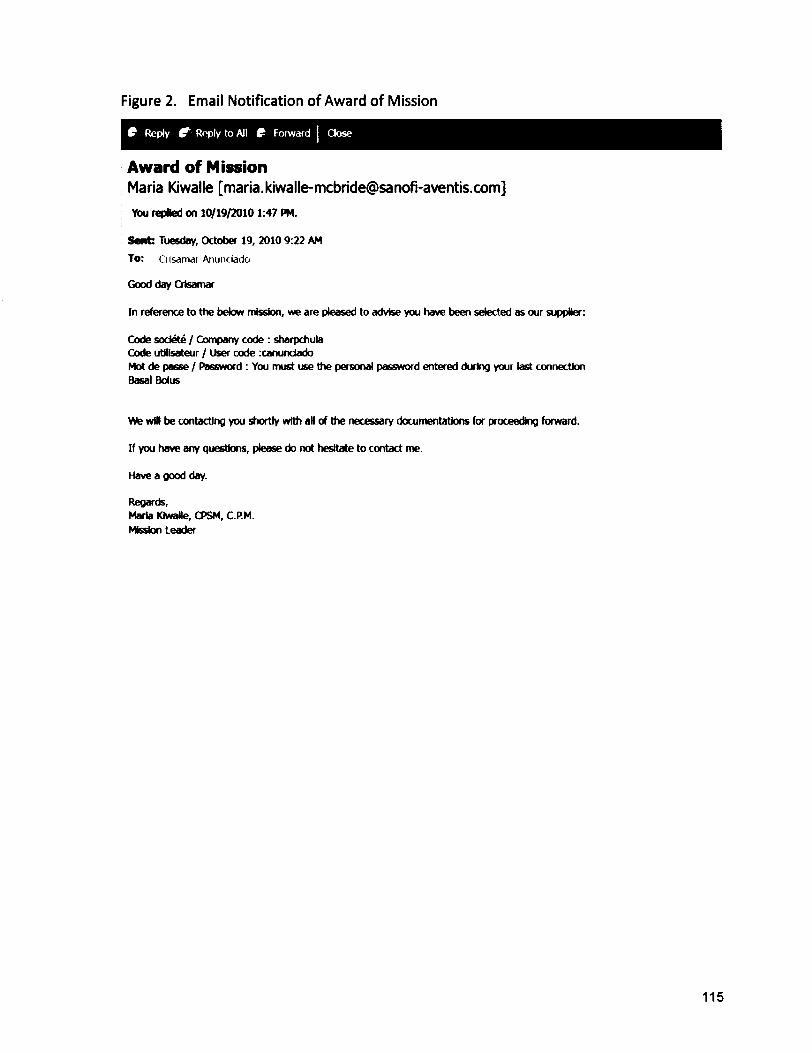
Figure 2. Email Notification of Award of Mission
£ Reply & Reply to All Forward Close
Award of Mission Maria Kiwalle [[email protected]]
You repled on 10/19/2010 1:47 PM.
Sent: Tuesday, October 19, 2010 9:22 AM
To: Gisamai Anunciado
Good day Crisamar
In reference to the below mission, we are pleased to advise you have been selected as our supplier:
Code sodete / Company code : sharpchula
Code utillsateur / User code :canundado
Mot de passe / Password : You must use the personal password entered during your last connection
Basal Bolus
We will be contacting you shortly with all of the necessary documentations for proceeding forward.
If you have any questions, please do not hesitate to contact me.
Have a good day.
Regards,
Maria KhwaHe, CPSM, C.P.M.
Mission Leader

Appendices
116
SHARP October 29,2010
Crisamar Anunciado, RN, MSN, FNP-BC
Sharp Chula Vista Mcdical Center
751 Medical Center Court
Chula Vista, CA 91950
RE: IRB #101084 / Sanofi-Aventis Inpatient Glycemic Management; Clinical and Economic Impact of Changing from Sliding Scale Insulin to Basal-Bolus
Dear Mr. Anunciado:
The Sharp Healthcare Institutional Review Board (IRB00000920; FWA00000084) has reviewed and expeditiously approved your application for the above-rcferenced research activity in accordance with 45 CFR 46.110(bXl), Category
5. Waiver of authorization is allowed in accordancc with 45 CFR 164.512(1X2). Waiver of informed conscnt is allowed
in accordancc with 45 CFR 46.116(d)( 1-4) and 21 CFR 56.109(cXI)> This approval includes:
• Protocol (15Sep2010)
This action will be reported to all committee members at the October 20, 2010 meeting.
The following site and investigators) are approved:
Site: Chula Vista
Principal Investigator: Crisamar Anunciado, RN, MSN, FNP-BC
Study Coordinator: None
Sub-investigator and Other Study Personnel: Dale G laser, PhD
The IRB approval reference number is 101084. Please includc this reference number in all future correspondence relative
to this research activity.
As a reminder, it is the responsibility of the Principal Investigator to submit periodic status reports to the IRB. Periodic review of this research activity may be conducted via an expedited process and is scheduled for inclusion on the September 21,2011 IRB meeting agenda. Approval for this research activity will expire if periodic review is not conducted on or before October 5,2011. Please provide a completed research status report to the IRB Office no later than September 6,2011 to assure timely review and continuation of this research activity.
Changes or amendments to the research activity protocol, informed consent documents, and to other research activity-related documents, as well as new documents, tools or advertisements to be utilized as part of this research activity, must be reviewed and approved by the IRB before changes are implemented.
It is the policy of Sharp Healthcare IRB that the Principal Investigators) submit a copy of their reports, findings, or manuscripts to the IRB prior to publication. Sharp HcalthCare would expect that if the results of the research project
came to publication, their role would be properly rccognized in the research.
SHARP ORGANIZATIONS Sharp I IralthCare Sharp Memorial Hospital Grossmont Hospital Corporation Sharp Chula Vista Mcdical Center Sharp Coronado Hospital and Healthcare Center Sharp Mesa Vista Hospital Sharp Mary Birch Hospital For Women
Sharp Vista l*acifica Hospital Sharp Mission Park Medical Centers, Sharp Rees-Steaty Medical Centers Sharp Health Clan Sharp Health Care Foundation • Grossmont Hospital Foundation
Mdcoka National
Quality Award
2007 Award Recipient
101084
10/20/2010 Anunciado
8-4
W)'jr> Spectrum Gentei Boulevard San Diego, California 92123-148<>
Thank you and please feel free to contact Caryn Burgess, IRB Administrator, at (858) 499-4836 if you have any questions.
Sincerely,
David Bodkin, M.D. Chair, Institutional Review Board Sharp HealthCare
/elb
Enc.
101084 10/20/2010 Page 2 of 2