invasive populations of senecio pterophorus are neither ... · 16" 2univ. autònoma barcelona,...
TRANSCRIPT

Invasive populations of Senecio pterophorus are neither more
productive nor more plastic than the native populations
Ferran Colomer Ventura
Màster d’Ecologia Terrestre i Gestió de la Biodiversitat
Especialitat Ecologia Terrestre
Tutors:
Eva Castells, Unitat de Toxicologia, Departament de Farmacologia, Terapèutica i Toxicologia, Facultat
de Veterinària i Jordi Martínez Vilalta, CREAF i Unitat d’Ecologia, Departament de Biologia Animal, Biologia
Vegetal i Ecologia, Facultat de BioCiències, Universitat Autònoma de Barcelona
Bellaterra 13/09//2013

!

La!realització!d’aquest!treball!va!començar!a!finals!de!Desembre!de!2012!amb!la!introducció!de!l’alumne!al!context!
de!l’estudi,!la!presentació!l’equip!de!treball!de!la!Unitat!de!Toxicologia!(Facultat!de!Veterinària)!i!una!visita!als!camps!
experimentals! on! es! va! dur! a! terme!el! common%garden! de! l’estudi.! L’alumne! també! va! realitzar! una! visita! a! títol!
personal! per! la! zona! del! riu! Ripoll! on! es! poden! trobar! algunes! poblacions! de! Senecio% pterophorus% introduïdes! a!
Europa.!A!partir!del!gener!de!2013!l’alumne!es!va!dedicar!a!realitzar!el!treball!de!laboratori,!processant!les!mostres!
de!fulles!que!s’enviarien!a!l’estranger!per!a!l’anàlisi!de!la!composició!isotòpica!de!carboni!i!contingut!total!de!carboni!
i!nitrogen.!Una!vegada!realitzades!les!tasques!de!laboratori!es!va!continuar!amb!el!tractament!de!les!bases!de!dades!
prePexistents,! l’anàlisi! estadístic! d’aquestes,! la! interpretació! dels! resultats! i! la! redacció! progressiva! del!manuscrit!
presentat.! El! format! de! l’article! elaborat! ha! estat! elaborat! seguint! les! instruccions! de! publicació! de! la! revista!
Biological!Invasions!(Springer)!
Contribució!de!l’alumne!a!les!diferents!parts!del!treball!realitzat:!
P Preparació)del)common%garden/mostreigs)de)camp:))
Realitzat!per!altres!membres!de!l’equip.!La!realització!del!common%garden,!l’obtenció!de!dades!de!camp!i!la!
presa!de!mostres!es!va!realitzar!al!llarg!dels!anys!2011P2012.!
!
P Anàlisis)de)laboratori:))
Parcialment!realitzat!per!part!de!l’alumne.!Les!tasques!d’obtenció!de!les!mesures!de!biomassa!i!altres!
variables!de!l’experiment!es!van!realitzar!al!llarg!dels!anys!2011P2012!per!altres!membres!de!l’equip.!Les!
tasques!de!laboratori!referents!a!la!preparació!de!les!mostres!de!fulles!per!a!les!anàlisis!isotòpiques!es!van!
realitzar!per!part!de!l’alumne.!
!
P Recopilació)de)bases)de)dades:))
Parcialment!realitzat!per!part!de!l’alumne.!L’alumne!va!completar!les!bases!de!dades!elaborades!durant!
2011P2012!amb!la!informació!dels!resultats!de!les!anàlisis!isotòpiques!realitzats.!
!
P Tractaments)estadístics:))
Totalment!realitzat!per!part!de!l’alumne!i!supervisat!pels!directors!del!treball!
!
P Elaboració)de)models:))
Totalment!realitzat!per!part!de!l’alumne!i!supervisat!pels!directors!del!treball!
P Redacció)del)manuscrit,)taules)i)figures:))
Totalment!realitzat!per!part!de!l’alumne!!i!supervisat!pels!directors!del!treball!
!

!

1"""
Invasive populations of Senecio pterophorus are neither more productive nor more 1"
plastic than the native populations. 2"
3"
4"
5"
6"
7" 8"
9"
10"
Ferran Colomer-Ventura1,2, Jordi Martínez-Vilalta1,2, Eva Castells3* 11"
12"
13"
14"1CREAF, Cerdanyola del Vallès, Barcelona, 08193, Spain; 15"2Univ. Autònoma Barcelona, Cerdanyola del Vallès, Barcelona, 08193, Spain; 16"3Unitat de Toxicologia, Departament de Farmacologia, Terapèutica i Toxicologia,
Facultat de Veterinària, Universitat Autònoma de Barcelona, 08193 Bellaterra,
Catalonia (Spain)
*Corresponding author: [email protected] Phone +34 935813833 Fax +34
935812959

2"""
Abstract 17"
18"
Successful plant invaders may have specific morphological and physiological 19"
traits that promote invasion in a new habitat. The Evolution of Increased Competitive 20"
Ability (EICA) hypothesis predicts that plants released from natural enemies in the 21"
introduced habitats are more competitive and perform better than plants from the native 22"
populations. An increased phenotypic plasticity may also favour invasion because it 23"
allows plants to function under a wider range of environments. In this study we used 24"
Senecio pterophorus (Asteraceae) to test whether introduced plant populations are 1) 25"
more competitive and 2) more plastic compared with the native populations. We 26"
conducted a common garden experiment using plants from the native range (South 27"
Africa, Eastern Cape), an expanded range (South Africa, Western Cape) and two 28"
introduced ranges (Australia and Europe) under different conditions of water 29"
availability. Contrary to the EICA and the increased plasticity hypotheses, plants from 30"
the invasive and expanded populations grew less and responded less to watering than 31"
those from their native range. These results may be caused by a depleted competition as 32"
well as the presence of genetic bottlenecks in the newly invaded areas. 33"
34"
35"
Keywords: biological invasions, alien species, EICA hypothesis, phenotypic plasticity, 36"
Senecio pterophorus. 37"

3"""
Introduction 38"
39"
The introduction of novel plant species can alter the structure, function and 40"
dynamics of an ecosystem, endangering the survival of native species (Mack et al. 2000; 41"
Pimentel et al. 2001). The number of introductions of exotic plant species has risen 42"
dramatically during the last decades (Rejmánek et al. 2005). However, only few of the 43"
introduced species get established and spread into the new habitat becoming successful 44"
invaders (Williamson 1996; Kolar and Lodge 2001). Determining what traits are related 45"
to a higher invasive potential provides useful information to improve management and 46"
predict the outcomes of future invasions (Van Wilgen et al. 2001; Sol et al. 2012). The 47"
characterization of the invasive species, however, has proved difficult in part because 48"
successful strategies may vary among ecosystem types (Sakai et al. 2001; Pyšek and 49"
Richardson 2007). 50"
One mechanism increasingly explored during the last decade as an important 51"
determinant of invasion success is the rapid adaptation of exotic plants to the new 52"
environmental conditions (Thompson 1998, Mooney and Cleland 2001; Sakai et al. 53"
2001; Reznick and Ghalambor 2001). Plant genotypes with morphological and 54"
physiological traits that promote invasion, such as a higher RGR, biomass, reproductive 55"
capacity, competitive ability and overall fitness, may increase their frequency in the 56"
newly established populations as a result of natural selection (Crawley 1987; Lachmuth 57"
et al. 2010; Richards et al. 2006). The increase in plant performance in alien populations 58"
could be driven by the release of natural herbivores from the habitat of origin (Keane 59"
and Crawley 2002). The Evolution of Increased Competitive Ability hypothesis (EICA) 60"
(Blossey and Notzold 1995) predicts that, in the absence of herbivores, genotypes 61"
allocating more resources to growth and reproduction and less to chemical defences 62"

4"""
would be favoured over less competitive and more defended plants, increasing their 63"
frequency in the population . 64"
To date, the EICA hypothesis has only been supported by some experimental 65"
studies, as plants with a greater competitive ability have been observed in some invasive 66"
areas (Blossey and Notzold 1995; Jakobs et al. 2004; Willis and Blossey 1999), but not 67"
by others (Van Kleunen and Schmid 2003; Vilà et al. 2003; Willis et al. 2000). This 68"
diversity of results may occur, at least in part, because tests of the EICA hypothesis 69"
normally use relatively low sample sizes not covering the whole distributional area of 70"
the plant species in their native and invasive ranges. Common garden experiments 71"
comparing genetic differences between native and exotic plants across a low number of 72"
populations may not use the appropriate controls, particularly when plant introduction 73"
pathways are unknown (Bossdorf et al. 2005). An optimal test to the EICA should 74"
evaluate differences in plant traits between the introduced populations and their founder 75"
populations at the native area or, alternatively, cover a substantial part of the plant 76"
biogeographical distribution to incorporate large amounts of genetic variation. To our 77"
knowledge, no study has been performed to date testing the EICA hypothesis across the 78"
entire known geographical distribution of a species. 79"
Invasion success may also be determined by changes in the plastic response of 80"
traits related to plant performance (Richards et al. 2006). Phenotypic plasticity, which is 81"
the ability of an organism to express distinct phenotypes depending on the 82"
environmental conditions, expands the ecological niche of a species facilitating 83"
colonization of novel habitats (Bradshaw 1965, Richards et al. 2006). Plants with high 84"
phenotypic plasticity could better adapt to a variety of environments compared with 85"
plants with low plasticity (Berg and Ellers 2010, Richards et al. 2006). Accordingly, 86"
since phenotypic plasticity is a genetically-based subject to selection, invasive plants 87"
5"""
may evolve an elevated plasticity in comparison to plants from the habitat of origin 88"
(Kaufman and Smouse 2001; Bossdorf et al. 2005). The hypothesis of the evolution of 89"
increased phenotypic plasticity after invasion, however, has been scarcely explored 90"
(Bossdorf et al. 2005; Vanderhoeven et al. 2010; Godoy et al. 2011; Godoy et al. 2012). 91"
Senecio pterophorus (Asteraceae) is a perennial shrub native to the Eastern Cape 92"
and KwaZulu-Natal Provinces in South Africa that expanded its distribution to the 93"
Western Cape a century ago (Levyns 1950). S. pterophorus was introduced to Australia 94"
(> 70-100 years ago) and Europe (> 30 years ago), probably by wool commerce 95"
(Castells et al. 2013). An analysis of the insect seed predation in S. pterophorus across 96"
the native, the expanded and the two invasive ranges, showed that plants from the 97"
introduced areas were released from herbivores in comparison to the native range, and 98"
this release was more intense in Europe, the region with a shorter introduction time 99"
(Castells et al. 2013). 100"
Here we used Senecio pterophorus as a model species to determine whether 101"
introduced plants released from natural enemies have evolved after invasion to a higher 102"
performance, as predicted by the EICA hypothesis, and to a higher plasticity, as 103"
predicted by the increased plasticity hypothesis. We conducted a common garden 104"
experiment using 47 populations of S. pterophorus from the native, expanded and two 105"
introduced ranges spanning the entire known distributional area of this species (Castells 106"
et al. 2013). According to the EICA hypothesis, S. pterophorus from the introduced 107"
populations (Australia, Europe) should have a higher performance in comparison to the 108"
native populations, and this increase should be stronger in Europe, where the decrease 109"
in herbivory has been more intense. We also expect a higher phenotypic plasticity in the 110"
introduced populations in response to environmental stress compared with the native 111"
populations. 112"

6"""
113"
Materials and methods 114"
115"
Model species and field sampling 116"
117"
Senecio pterophorus (Asteraceae) is a perennial shrub of 0.4 to 2 m in height. 118"
Leaves are lanceolate to linear with serrated margins 5 to 14 cm long and 0.5 to 2.5 cm 119"
wide. Each individual plant produces annually up to 1200 capitula (Morante et al. 120"
unpublished). The capitula are grouped into terminal corymbose inflorescences with 8-121"
13 ray deep yellow florets of 2-4 mm in its periphery (Hilliard 1977; Pino et al. 2000). 122"
S. pterophorus is native to the Natal province in Eastern Cape, South Africa 123"
(Hilliard 1977) and was introduced into the Western Cape Province circa 1918 (Levyns 124"
1950). The first reference of S. pterophorus in Australia is since 1908, but it became 125"
invasive in 1930 along the southern coast of Australia (Parsons and Cuthbertson 1992). 126"
Both South African and Australian S. pterophorus populations colonize disturbed 127"
environments, such as roads and forest margins and grasslands (Parsons and 128"
Cuthbertson 1992). In 1994, S. pterophorus was classified as a Declared Noxious Weed 129"
subject to eradication by the Department of Environment and Primary Industries, 130"
Victoria (Australia). 131"
In Europe, S. pterophorus was first found in 1913 in the United Kingdom as an 132"
adventitious and rare species in field margins (Stace 1997; Preston et al. 2002), but its 133"
presence was erratic and infrequent and it is now considered extinct in that country 134"
(Castells et al. 2013). In continental Europe S. pterophorus was first found near 135"
Barcelona, in the north-eastern Iberian Peninsula, in 1982 (Casasayas 1989) and on the 136"
ligurian coast in north western Italy in 1990 (Barberis et al. 1998). Due to the ability to 137"

7"""
colonize river beds of the Besòs and Tordera river basins near Barcelona (Casasayas 138"
1989; Pino et al. 2000; Chamorro et al. 2006) S. pterophorus has been recently 139"
catalogued as an invasive species (Andreu et al. 2012). 140"
Seeds of Senecio pterophorus were sampled in 2009 and 2010 in the native 141"
range (Eastern Cape in South Africa), the expanded range (Western Cape in South 142"
Africa) and two invasive ranges (Australia and Europe). This sampling was part of a 143"
larger project to test the Enemy Release hypothesis (Castells et al. 2013). Populations 144"
were chosen at least 30 km apart in South Africa and Australia, and at least 5 km apart 145"
in Europe, where the plant is more localized. More details on the sampling procedure 146"
can be found in Castells et al. (2013). Four additional populations not included in 147"
Castells et al. (2013) were sampled in January 2010 to increase the number of 148"
populations in central parts of the Eastern Cape Province. On the contrary, populations 149"
from Liguria (Italy) could not be included in the present study. A total of 47 populations 150"
(18 from the native range in South Africa, 5 from the extended range in South Africa, 151"
12 from Australia and 12 from Europe) throughout the species’ known distributional 152"
area were used for this study (Fig. 1, Table S1). 153"
154"
Common garden experiment 155"
156"
In November 2010, seeds from 6 individuals from each sampled population (47 157"
populations x 6 individuals = 282 individuals, hereafter referred as mother plants) were 158"
germinated separately in a mixture of Sphagnum, perlite and vermiculite (2:1:1) 159"
neutralized at pH = 6 under standard conditions of temperature and humidity at the 160"
greenhouse facilities of the Faculty of Biology, University of Barcelona (Spain). Soil 161"
was watered regularly with a Hoagland nutrient solution. In February 2011, when the 162"
8"""
seedlings had 4-5 true leaves (100 days old approximately), two seedlings from each 163"
mother plant were transplanted to an experimental field at the Autonomous University 164"
of Barcelona (41°29'53.3’’N, 02°06'9.6’’E). The experimental field is located in an old 165"
cultivated area surrounded by a Pinus halepensis forest. The soil is a typic calcixerept 166"
following the classification by the Natural Resources Conservation Service, U.S. 167"
Department of Agriculture (Josep M. Alcañiz, personal comment). The mean annual 168"
temperature in the area is 14.9 ºC and the mean annual precipitation 562.8 mm (Digital 169"
Climatic Atlas of Catalonia, Ninyerola et al. 2003). The weather in 2011, when the 170"
experiment was performed, was hotter and wetter than average with a mean annual 171"
temperature of 15.6 ºC and 853.1 mm of annual rainfall (535.1 mm during the 172"
experiment) (Meteorological Service of Catalonia, observatory code VT). Seedlings 173"
from the same mother plant were full or half-sibs, but for the sake of simplicity we 174"
referred them as half-sibs along this study. 175"
The field was divided in six blocks of 58 m2. Three blocks were assigned to a 176"
drip irrigation treatment (Watered, W) set at 4.5 L/day/plant and three blocks were left 177"
without irrigation but receiving rainfall (Not Watered, NW). Drought was selected as 178"
the stress treatment to measure plasticity, as growth and survival of S. pterophorus is 179"
strongly limited by water availability (Caño et al. 2007). Each treatment (W and NW) 180"
contained one half-sib per mother plant, with a total of 282 individuals per treatment (47 181"
populations x 6 mother plants/population) distributed randomly across blocks within a 182"
treatment. Thus, a total of 564 individuals were planted. Individual plants within blocks 183"
were separated by 75 cm and blocks were separated by 1.5 m. After transplanting, the 184"
field was covered with straw to minimize the impact of cold conditions during winter, 185"
prevent weed growth and minimize the effects of extreme drought during the summer 186"
months. 187"

9"""
Plants from all treatments were watered during the first 7 weeks to minimize 188"
mortality and dead plants were replaced as necessary. The experiment was run from 189"
April to October 2011. Plants from the W treatment received approximately 2212 L/m2 190"
from drip irrigation throughout the experiment. Precipitation during the course of the 191"
experiment was 535 L/m2 and thus plants from the W treatment received 413% more 192"
water than plants from the NW treatment. 193"
194"
Measurements 195"
196"
Plants were monitored for mortality once a week. To estimate relative growth 197"
rate (RGR) plant height was measured at the beginning of the experiment (week 0) and 198"
after 10, 16 and 23 weeks. RGR was calculated as the difference in plant height between 199"
two consecutive periods (first period: 0-10 weeks, second period: 10-16 weeks, and 200"
third period: 16-23 weeks). Shoot biomass was determined at the end of the experiment 201"
(September/October 2011) for all surviving individuals. Individuals were cut at ground 202"
level and leaves were separated from the stems. Both fractions were oven-dried at 65ºC 203"
for 2-3 days and weighed. 204"
In September-October 2011, three leaves per plant were collected to estimate 205"
Specific leaf area (SLA) and leaf sphericity. We collected one leaf per individual from 206"
the primary branch (at approximately half of plant height) and one leaves from two 207"
secondary branches. Leaves were healthy, green and without necroses whenever 208"
possible. Leaves were immediately scanned to avoid desiccation and images were 209"
analyzed using the software ImageJ ® to determine foliar area and sphericity. Leaves 210"
were oven-dried for 72 h at 65 °C and weighed. 211"

10""
The SLA was calculated by dividing leaf area by dry weight. A high SLA is 212"
normally associated with an increased productivity and invasiveness (Reich et al. 1998; 213"
Evans and Poorter 2001; Lake and Leishman 2004; Hamilton et al. 2005; Pyšek and 214"
Richardson 2007), but also with shorter life-spans and vulnerability to herbivores 215"
(Coley et al. 1985; Grime et al. 1996). Leaf sphericity is a measure of leaf shape, 216"
estimated as 4·p· (leaf area/leaf perimetre2), sphericity = 1 for a perfect circle. Leaf 217"
margins are associated with strong gradients, particularly where the surface area/volume 218"
ratio is high (e.g., serrated leaf margins) (Royer and Wilf 2006), maximizing 219"
evaporation and assimilation rates (Schuepp 1993; Baker-Brosh and Peet 1997). Total 220"
leaf area was calculated multiplying dried leaf weight and specific leaf area (SLA). 221"
A subset of individual plants was used to determine C and N content and C 222"
isotopic composition in their leaves. The isotopic composition of carbon (δ13C) was 223"
used as a proxy of water-use efficiency (Farquhar et al. 1989), whereas N concentration 224"
in leaves was used as a surrogate for maximum photosynthetic capacity and, hence, 225"
potential growth (Reich et al. 1998). We selected 6 populations per region in Eastern 226"
South Africa, Australia and Europe that were widely spread into the territory, covering 227"
the plant distribution limits (Table S1). All 5 populations available from the Western 228"
Cape in South Africa were used. Between 4 and 6 individuals per population were 229"
randomly selected, with a total of 116 individuals per treatment. Leaf samples were 230"
homogenized on a bead-beater and weighed in a microscale (Metter Toledo MX5) at 231"
Servei d’Anàlisis Químiques (SAQ), Autonomous University of Barcelona. Analyses of 232"
δ13C, and total amount of C and N were carried out at UC Davis Stable Isotope Facility 233"
using IRMS (PDZ Europa ANCA-GSL elemental analyser interfaced to a PDZ Europa 234"
20-20 isotope ratio mass spectrometer). The relationship between carbon stable isotopes 235"

11""
was expressed in relation to a Pee-Dee Belemnite (PDB) standard. The accuracy of the 236"
measurements was 0.015‰. 237"
238"
Statistical analyses 239"
240"
Data analysis was performed using linear mixed effects models. Such models 241"
can incorporate the imbalance between groups of observations and random effects 242"
associated to the experimental design (hierarchical, nested effects). For response 243"
variables that were measured only once (biomass, SLA, leaf sphericity, total leaf area, 244"
carbon isotopic composition, N amount, C/N and survival) the structure of the model 245"
included Region, Treatment and their interaction as fixed effects; and Block, Population 246"
and Individual as random effects (on the intercept of the model). For response variables 247"
that were measured repeatedly (RGR) the model included time as a fixed factor. General 248"
linear mixed effects models were used in all cases, except in the case of survival 249"
because the response variable was binary, in which case a generalized binomial mixed 250"
model (logit transformation) was used. Specific leaf area, leaf sphericity, total leaf area, 251"
nitrogen amount (as percentage) and carbon/nitrogen ratio variables were normalized by 252"
using a logarithmic transformation. 253"
254"
The residuals of the mixed-effects models described above showed no pattern. 255"
The fixed effects β (model coefficients) are given together with their standard errors 256"
(SE) and significance. Variance components analysis was used to split the variance at 257"
the Region, Bloc, Population and Individual levels. Significance for all statistical 258"
analyses was accepted at P<0.05. All models were fitted using the R software (v3.0.0, 259"
The R Foundation for Statistical Computing). 260"
12""
261"
Results 262"
263"
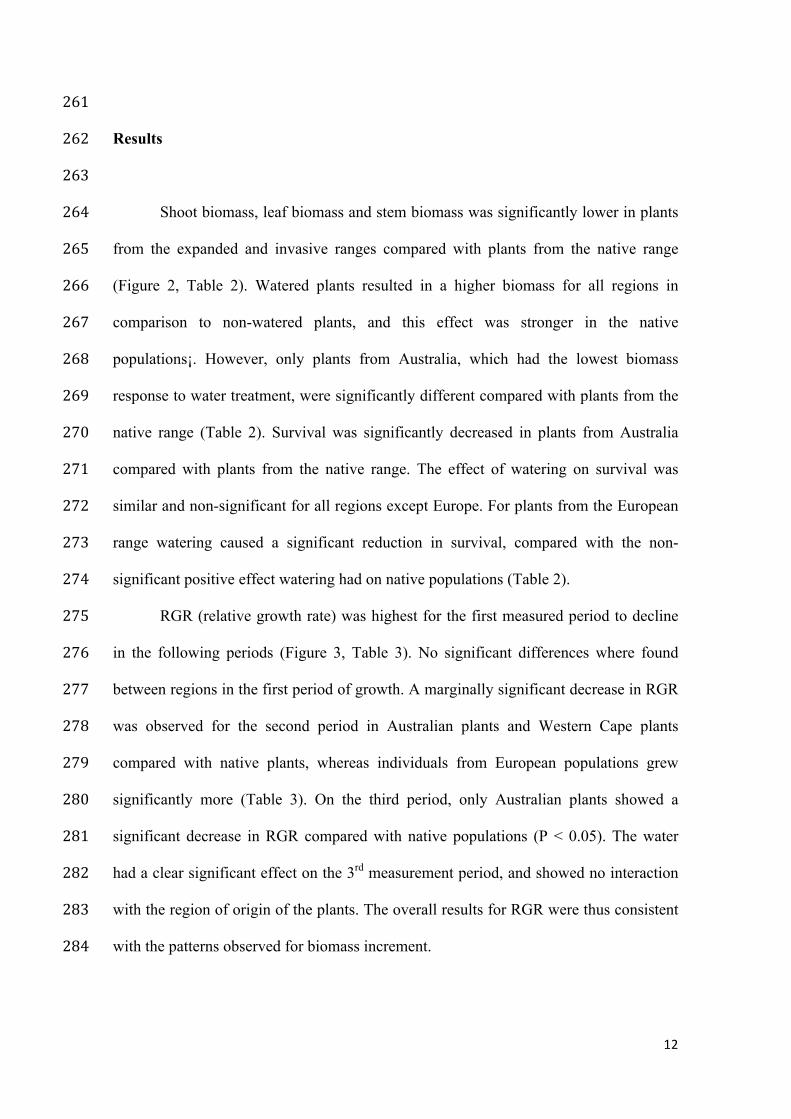
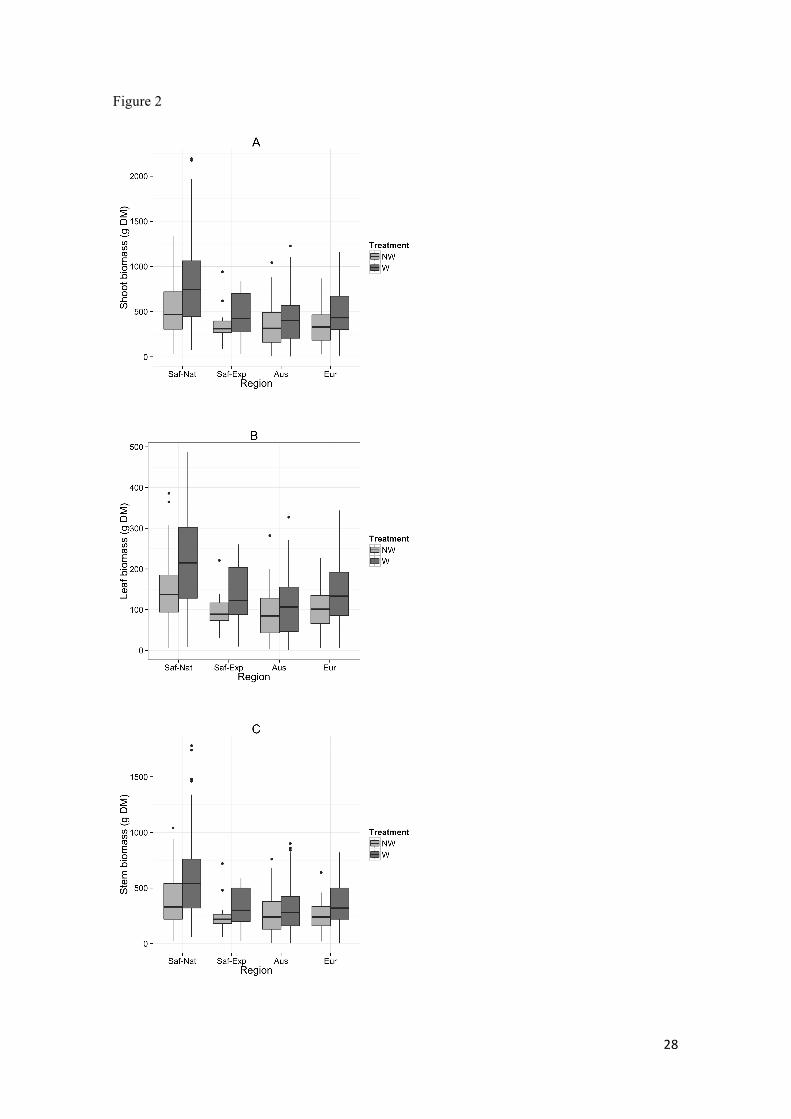
Shoot biomass, leaf biomass and stem biomass was significantly lower in plants 264"
from the expanded and invasive ranges compared with plants from the native range 265"
(Figure 2, Table 2). Watered plants resulted in a higher biomass for all regions in 266"
comparison to non-watered plants, and this effect was stronger in the native 267"
populations¡. However, only plants from Australia, which had the lowest biomass 268"
response to water treatment, were significantly different compared with plants from the 269"
native range (Table 2). Survival was significantly decreased in plants from Australia 270"
compared with plants from the native range. The effect of watering on survival was 271"
similar and non-significant for all regions except Europe. For plants from the European 272"
range watering caused a significant reduction in survival, compared with the non-273"
significant positive effect watering had on native populations (Table 2). 274"
RGR (relative growth rate) was highest for the first measured period to decline 275"
in the following periods (Figure 3, Table 3). No significant differences where found 276"
between regions in the first period of growth. A marginally significant decrease in RGR 277"
was observed for the second period in Australian plants and Western Cape plants 278"
compared with native plants, whereas individuals from European populations grew 279"
significantly more (Table 3). On the third period, only Australian plants showed a 280"
significant decrease in RGR compared with native populations (P < 0.05). The water 281"
had a clear significant effect on the 3rd measurement period, and showed no interaction 282"
with the region of origin of the plants. The overall results for RGR were thus consistent 283"
with the patterns observed for biomass increment. 284"

13""
Significant differences among regions were found in SLA, leaf area and leaf 285"
sphericity, whereas no differences were observed for δ13C, N concentration and the C/N 286"
ratio (Table 4, Fig. 4). SLA was higher in plants from the European range compared 287"
with the native individuals. Leaf area was lower in all non-native regions, whereas leaf 288"
sphericity was lower in European plants and higher in Australian and expanded South 289"
African individuals. The watering treatment increased SLA and leaf area, and reduced 290"
δ13C and the C/N ratio (the latter effect being only marginally significant). Water 291"
treatment effects were similar among all regions, except in the case of N concentration 292"
and the C/N ratio. For these two variables Australian plants responded by reducing their 293"
N concentration (and thus increasing their C/N ratio), and this effect was significantly 294"
different to the effect of watering on native plants. 295"
The variance components analysis indicates that most of the variability in the 296"
measured variables was observed across individuals within populations (48-86 %). 297"
Variability among populations and regions ranged between <0.01-29 % and 0.01-21% 298"
for the region and population levels (Table S2). The variance associated to the bloc 299"
factor was low (< 12%) in most cases, except for SLA, total leaf area and δ13C (Table 300"
S2). 301"
302"
Discussion 303"
304"
The Evolution of Increased Competitive Ability (EICA) hypothesis predicts that 305"
plants released from herbivores in a novel environment perform better than plants from 306"
native range (Blossey and Notzold 1995). Additionally, the increased plasticity 307"
hypothesis predicts that plants from invasive populations are more plastic than plants 308"
from the native populations. Contrary to these hypotheses, S.pterophorus from the 309"

14""
invasive (Australia and Europe) and expanded ranges (South Africa, Western Cape) 310"
grew less and responded less to watering than those from their native range. Individuals 311"
from the invasive populations were released from herbivory compared to plants from 312"
the native range (Castells et al. 2013), which is the first premise of the EICA hypothesis. 313"
However, this decrease in herbivory pressure was not translated into a higher plant 314"
performance as predicted by EICA. 315"
Our study shows strong genetically-based differences in plant performance and 316"
plasticity between the native and invasive populations of S.pterophorus. These 317"
genotypic differences could result from adaptation to the novel environmental 318"
conditions or from neutral events, such as demographic bottlenecks or genetic drift. 319"
However, the contribution of neutral events to invasion success is frequently low in 320"
comparison to natural selection (Lee 2002). In our case, climatic conditions are similar 321"
across the compared regions (Table 1) (Castells et al. 2013) and it is thus unlikely that 322"
climate has played a major role in shaping the different responses observed across 323"
regions. In addition, we have found similar responses for all non-native regions which 324"
suggest that the same directional processes have occurred at least in two occasions. 325"
Preliminary results on neutral molecular markers (Vilatersana et al., unpublished) show 326"
that European S. pterophorus are more closely related to the plants from South Africa 327"
than to those from Australia, suggesting the occurrence of two independent invasive 328"
processes. 329"
A possible explanation of the lower growth rates of S.pterophorus in the 330"
invasive range could be a weaker pressure from other plant competitors during the first 331"
stages of colonization. It is known that resource competition has a cost. Under a low 332"
competitive pressure" in the invasive range there might be a reduction in biomass, as 333"

15""
suggested by the Evolutionary Reduced Competitive Ability (ERCA) hypothesis 334"
(Bossdorf et al. 2004). 335"
The reduction of plasticity and overall fitness in South African expanded range 336"
populations (Western Cape) may be is caused by the initial low number of populations 337"
during colonization, which suffered a demographic bottleneck and, in consequence, the 338"
reduced genetic variation might result in inbreeding, fixation of deleterious mutations 339"
and, finally, in a reduced fitness (Sakai et al. 2001). 340"
It is unclear to what extent the contradictory results obtained by studies testing 341"
the EICA hypothesis (cf. Introduction) could be a result of including only a small part of 342"
the overall genetic variation of the target species (Caño et al. 2008; Caño et al. 2009). 343"
Since we covered most of the known distributional range of the study species, our 344"
results are not expected to be driven by sampling size or representativeness. However, 345"
our study is not free of limitations. Perhaps the most important one is that we only 346"
measured aboveground biomass, so we have no way to assess changes in allocation 347"
between stems and roots nor can we discard that root growth might have been higher in 348"
invasive than in native populations, potentially compensating for the lower aboveground 349"
biomass increment in the former. The same could be said for reproductive biomass. 350"
Finally, another important aspect that could affect our results is the effect of 351"
competition. In our common garden experiment plants from different populations were 352"
competing with each other for resources and our design does not allow disentangling 353"
competition effects from differences in growth potential across populations. 354"
In conclusion, our results show that populations of S. pterophorus of invasive 355"
and expanded ranges did not have better performance or plasticity than native 356"
populations of South Africa. Therefore, the success of alien species is not explained by 357"
post-invasive evolution after being released from herbivory, as suggested by the EICA 358"
16""
hypothesis. Our results are consistent with other reports showing that growth is not 359"
higher in invasive compared to native populations of a given species (Thébaud and 360"
Simberloff 2001; Leger and Rice 2003; Vilà et al. 2003; Bossdorf et al. 2004). 361"
362"
Acknowledgements 363"
364"
We thank Paolo Zuccarini, Anna Escolà, Miriam Cabezas, Laura Armengot, Maria 365"
Morante, Pere Losada, Xavier Sans and Jose Manuel Blanco-Moreno for technical 366"
assistance. This research was conducted thanks to the financial support provided to EC 367"
by Ministerio de Ciencia e Innovación (Spain) (GCL2008-02421/BOS) and Ministerio 368"
de Economía y Competitividad (Spain) (GCL2011-29205). 369"
370"
References 371"
Andreu J, Pino J, Basnou C, et al. (2012) Les espècies exòtiques de Catalunya. Resum del 372"Projecte EXOCAT 2012. 373"
Baker-Brosh KF, Peet RK (1997) The ecological significance of lobed and toothed leaves in 374"temperate forest trees. Ecology 78:1250–1255. doi: 10.1890/0012-375"9658(1997)078[1250:TESOLA]2.0.CO;2 376"
Barberis G, Minuto L, Peccenini S (1998) Senecio grisebachii Baker (Compositae), new to the 377"Italian flora. Webbia 52:201–206. doi: 10.1080/00837792.1998.10670641 378"
Berg MP, Ellers J (2010) Trait plasticity in species interactions: a driving force of community 379"dynamics. Evolutionary Ecology 24:617–629. doi: 10.1007/s10682-009-9347-8 380"
Blossey B, Notzold R (1995) Evolution of Increased Competitive Ability in Invasive 381"Nonindigenous Plants: A Hypothesis. The Journal of Ecology 83:887. doi: 382"10.2307/2261425 383"
Bossdorf O, Auge H, Lafuma L, et al. (2005) Phenotypic and genetic differentiation between 384"native and introduced plant populations. Oecologia 144:1–11. doi: 10.1007/s00442-005-385"0070-z 386"
Bossdorf O, Prati D, Auge H, Schmid B (2004) Reduced competitive ability in an invasive 387"plant. Ecology Letters 7:346–353. doi: 10.1111/j.1461-0248.2004.00583.x 388"

17""
Bradshaw AD (1965) Evolutionary significance of phenotypic plasticity in plants. Advances in 389"genetics 13:115–155. 390"
Caño L, Escarré J, Fleck I, et al. (2008) Increased fitness and plasticity of an invasive species in 391"its introduced range: a study using Senecio pterophorus. Journal of Ecology 96:468–476. 392"doi: 10.1111/j.1365-2745.2008.01363.x 393"
Caño L, Escarré J, Sans FX (2007) Factors affecting the invasion success of Senecio 394"inaequidens and S . pterophorus in Mediterranean plant communities. Journal of 395"Vegetation Science 18:279–286. 396"
Caño L, Escarré J, Vrieling K, Sans FX (2009) Palatability to a generalist herbivore, defence 397"and growth of invasive and native Senecio species: testing the evolution of increased 398"competitive ability hypothesis. Oecologia 159:95–106. doi: 10.1007/s00442-008-1182-z 399"
Casasayas T (1989) La flora al.lòctona de Catalunya. Catàleg raonat de les plantes vasculars 400"exòtiques que creixen sense cultiu al NE de la Península Ibèrica. Universitat de Barcelona 401"
Castells E, Morante M, Blanco-Moreno JM, et al. (2013) Reduced seed predation after invasion 402"supports enemy release in a broad biogeographical survey. Oecologia. doi: 403"10.1007/s00442-013-2718-4 404"
Chamorro L, Caballero B, Blanco-Moreno JM, et al. (2006) Ecología y distribución de Senecio 405"pterophorus (Compositae) en la Península Ibérica. Anales del Jardín Botánico de Madrid 406"63:55–62. 407"
Colautti RI, Ricciardi A, Grigorovich IA, MacIsaac HJ (2004) Is invasion success explained by 408"the enemy release hypothesis? Ecology Letters 7:721–733. doi: 10.1111/j.1461-409"0248.2004.00616.x 410"
Coley PD, Bryant JP, Chapin FS (1985) Resource availability and plant antiherbivore defense. 411"Science 230:895–899. 412"
Evans JR, Poorter H (2001) Photosynthetic acclimation of plants to growth irradiance$: the 413"relative importance of specific leaf area and nitrogen partitioning in maximizing carbon 414"gain. 755–767. 415"
Farquhar GD, Ehleringer JR, Hubick KT (1989) Carbon isotope discrimination and 416"photosynthesis. Annual Reviews os Plant Physiology and Plant Molecular Biology 417"40:503–537. 418"
Fine PVA, Miller ZJ, Mesones I, et al. (2006) The growth-defense trade-off and habitat 419"specialization by plants in Amazonian forests. Ecology 87:S150–62. 420"
Godoy O, Valladares F, Castro-Díez P (2011) Multispecies comparison reveals that invasive 421"and native plants differ in their traits but not in their plasticity. Functional Ecology 422"25:1248–1259. doi: 10.1111/j.1365-2435.2011.01886.x 423"
Godoy O, Valladares F, Castro-Díez P (2012) The relative importance for plant invasiveness of 424"trait means, and their plasticity and integration in a multivariate framework. The New 425"phytologist 195:912–22. doi: 10.1111/j.1469-8137.2012.04205.x 426"

18""
Grime JP, Cornelissen JHC, Thompson K, Hodgson JG (1996) Evidence of a causal connection 427"between anti-herbivore defence and the decomposition rate of leaves. Oikos 77:489–494. 428"
Hamilton JG, Arthur R, Delucia EH, Berenbaum MR (2001) The carbon-nutrient balance 429"hypothesis$: its rise and fall. Ecology Letters 4:86–95. 430"
Hamilton MA, Murray BR, Cadotte MW, et al. (2005) Life-history correlates of plant 431"invasiveness at regional and continental scales. Ecology Letters 8:1066–1074. doi: 432"10.1111/j.1461-0248.2005.00809.x 433"
Hijmans RJ, Cameron SE, Parra JL, et al. (2005) Very high resolution interpolated climate 434"surfaces for global land areas. International Journal of Climatology 25:1965–1978. doi: 435"10.1002/joc.1276 436"
Hilliard OM (1977) Compositae in Natal. Pietermaritzburg: University of Natal Press XII 5: 437"
Jakobs G, Weber E, Edwards PJ (2004) Introduced plants of the invasive Solidago gigantea 438"(Asteraceae) are larger and grow denser than conspecifics in the native range. Diversity 439"and Distributions 10:11–19. doi: 10.1111/j.1472-4642.2004.00052.x 440"
Kaufman SR, Smouse PE (2001) Comparing indigenous and introduced populations of 441"Melaleuca quinquenervia (Cav.) Blake: response of seedlings to water and pH levels. 442"Oecologia 127:487–494. 443"
Keane RM, Crawley MJ (2002) Exotic plant invasions and the enemy release hypothesis. 444"Trends in Ecology & Evolution 17:164–170. doi: 10.1016/S0169-5347(02)02499-0 445"
Van Kleunen M, Schmid B (2003) No evidence for an evolutionary increased competitive 446"ability in an invasive plant. Ecology 84:2816–2823. 447"
Kolar CS, Lodge DM (2001) Progress in invasion biology: predicting invaders. Trends in 448"ecology & evolution 16:199–204. 449"
Lachmuth S, Durka W, Schurr FM (2010) The making of a rapid plant invader: genetic diversity 450"and differentiation in the native and invaded range of Senecio inaequidens. Molecular 451"ecology 19:3952–67. doi: 10.1111/j.1365-294X.2010.04797.x 452"
Lake JC, Leishman MR (2004) Invasion success of exotic plants in natural ecosystems: the role 453"of disturbance, plant attributes and freedom from herbivores. Biological Conservation 454"117:215–226. doi: 10.1016/S0006-3207(03)00294-5 455"
Lee CE (2002) Evolutionary genetics of invasive species. Trends in Ecology & Evolution 456"17:386–391. doi: 10.1016/S0169-5347(02)02554-5 457"
Leger EA, Rice KJ (2003) Invasive California poppies (Eschscholzia californica Cham.) grow 458"larger than native individuals under reduced competition. Ecology Letters 6:257–264. doi: 459"10.1046/j.1461-0248.2003.00423.x 460"
Levyns MR (1950) Compositae. Flora of the Cape Peninsula. Juta & Co., Ltd., Cape Town 461"
Mack RN, Simberloff D, Lonsdale WM, et al. (2000) Biotic invasions: causes, epidemiology, 462"global consequences, and control. Ecological Applications 10:689–710. 463"

19""
Mooney HA, Cleland EE (2001) The evolutionary impact of invasive species. Proceedings of 464"the National Academy of Sciences of the United States of America 98:5446–5451. 465"
Ninyerola M, Pons X, Roure JM, et al. (2003) Atles Climàtic Digital de Catalunya. Servei 466"Meteorològic de Catalunya and Departament de Medi Ambient, Generalitat de Catalunya 467"
Parsons WT, Cuthbertson EG (1992) Noxious weeds of Australia. Csiro Pub. 468"
Pimentel D, McNair S, Janecka J, et al. (2001) Economic and environmental threats of alien 469"plant, animal, and microbe invasions. Agriculture, Ecosystems & Environment 84:1–20. 470"doi: 10.1016/S0167-8809(00)00178-X 471"
Pino J, Afán I, Sans FX, Gutiérrez-Perarnau C (2000) Senecio pterophorus D.C., a new alien 472"species in the european mainland. Anales del Jardín Botánico de Madrid 58:188–189. 473"
Preston CD, Pearman DA, Dines TD (2002) New atlas of the British and Irish flora. An atlas of 474"the vascular plants of Britain, Ireland, the Isle of Man and the Channel Islands. Oxford 475"University Press 476"
Pyšek P, Richardson DM (2007) Traits Associated with Invasiveness in Alien Plants$: Where 477"Do we Stand$? Ecological Studies 193: 478"
Reich PB, Ellsworth DS, Walters MB (1998) Leaf structure (specific leaf area) modulates 479"photosynthesis-nitrogen relations: evidence from within and across species and functional 480"groups. Functional Ecology 12:948–958. doi: 10.1046/j.1365-2435.1998.00274.x 481"
Rejmánek M, Richardson DM, Pyšek P (2005) Plant invasions and invasibility of plant 482"communities. In: Maarel E van der (ed) Vegetation Ecology. Oxford, pp 332–355 483"
Reznick DN, Ghalambor CK (2001) The population ecology of contemporary adaptations: what 484"empirical studies reveal about the conditions that promote adaptive evolution. Genetica 485"112-113:183–98. 486"
Richards CL, Bossdorf O, Muth NZ, et al. (2006) Jack of all trades, master of some? On the role 487"of phenotypic plasticity in plant invasions. Ecology letters 9:981–93. doi: 10.1111/j.1461-488"0248.2006.00950.x 489"
Royer DL, Wilf P (2006) Why do toothed leaves correlate with cold climates? gas exchange at 490"leaf margins provides new insights into classic paleotemperature proxy. International 491"Journal of Plant Sciences 167:11–18. 492"
Sakai AK, Allendorf FW, Holt JS, et al. (2001) The population biology of invasive species. 493"Annual Reviews of Ecology and Systematics 32:305–332. 494"
Schuepp PH (1993) Tansley Review No. 59 Leaf boundary layers. New Phytologist 125:477–495"507. doi: 10.1111/j.1469-8137.1993.tb03898.x 496"
Soil Survey Staff (1999) Soil Taxonomy: A basic system of soil classification for making and 497"interpreting soil surveys, 2nd ed. Natural Resources Conservation Service. U.S. 498"Department of Agriculture 499"
Sol D, Maspons J, Vall-llosera M, et al. (2012) Unraveling the Life History of Succesful 500"Invaders. Science 337:580–583. 501"

20""
Stace C (1997) New flora of the British Isles. New flora of the British Isles. 502"
Thébaud C, Simberloff D (2001) Are plants really larger in their introduced ranges? The 503"American naturalist 157:231–6. doi: 10.1086/318635 504"
Valladares F, Wright SJ, Lasso E, et al. (2000) Plastic phenotypic response to light of 16 505"congeneric shrubs from a panamanian rainforest. Ecology 81:1925. doi: 10.2307/177282 506"
Vanderhoeven S, Brown CS, Tepolt CK, et al. (2010) Perspective: Linking concepts in the 507"ecology and evolution of invasive plants: network analysis shows what has been most 508"studied and identifies knowledge gaps. Evolutionary Applications 3:193–202. doi: 509"10.1111/j.1752-4571.2009.00116.x 510"
Vilà M, Gómez A, Maron JL (2003) Are alien plants more competitive than their native 511"conspecifics? A test using Hypericum perforatum L. Oecologia 137:211–5. doi: 512"10.1007/s00442-003-1342-0 513"
Van Wilgen BW, Richardson DM, Le Maitre DC, et al. (2001) The economic consequences of 514"alien plant invasions: examples of impacts and approaches to sustainable management in 515"South Africa. Environment, Development and Sustainability 3:145–168. 516"
Williamson M (1996) Biological invasions. Chapman & Hall 517"
Willis AJ, Blossey B (1999) Benign environments do not explain the increased vigour of non-518"indigenous plants: a cross-continental transplant experiment. Biocontrol Science and 519"Technology 9:567–577. 520"
Willis AJ, Lawton JH (1999) Is the increased vigour of invasive weeds explained by a trade-off 521"between growth and herbivore resistance$? Oecologia 120:632–640. 522"
Willis AJ, Memmott J, Forrester RI (2000) Is there evidence for the post-invasion evolution of 523"increased size among invasive plant species$? Ecology letters 3:275–283. 524"
525"
526"

21#
#Tabl
e 1.
Geo
grap
hica
l and
clim
atic
cha
ract
eris
tics
of th
e di
strib
utio
n ar
eas
of S
enec
io p
tero
phor
us in
the
nativ
e, e
xpan
ded
and
intro
duce
d ra
nges
. Mea
n ±
SE
(n =
5-1
8 po
pula
tions
per
regi
on)
Reg
ion
Plan
t Sta
tus
Cod
e Po
pula
tions
and
in
divi
dual
s A
ltitu
de
(m)
Mea
n an
nual
te
mpe
ratu
re
(ºC
)1
Min
. Ann
ual
tem
pera
ture
(º
C)1
Max
. Ann
ual
tem
pera
ture
(º
C)1
Ann
ual
Rai
nfal
l (m
m)1
Sout
h A
fric
a N
ativ
e Sa
f-N
at
18 p
op, 1
07 in
d 79
2.72
± 9
6.30
16
.64
± 0.
24
10.4
0 ±
1.15
23
.50
± 0.
70
746.
17 ±
31.
82
Sout
h A
fric
a Ex
pand
ed
Saf-
Exp
5 po
p, 2
9 in
d 13
3.00
± 5
6.13
16
.14
± 0.
38
9.08
± 0
.79
19.4
6 ±
1.12
85
6.40
± 8
6.50
Aus
tralia
In
vasi
ve
Aus
12
pop
, 70
ind
140.
77 ±
46.
91
15.1
4 ±
0.45
7.
84 ±
0.7
0 18
.28
± 1.
30
754.
38 ±
62.
97
Euro
pe
Inva
sive
Eu
r 12
pop
, 72
ind
244.
58 ±
46.
94
15.2
7 ±
0.24
11
.39
± 1.
54
18.5
8 ±
1.71
66
7.00
± 1
9.87

22#
#Tabl
e 2.
Sum
mar
y of
the
sta
tistic
al m
odel
s te
stin
g th
e ef
fect
s of
reg
ion
(Sou
th A
fric
a-na
tive,
Saf
-Nat
; So
uth
Afr
ica
Expa
nded
Saf
-Exp
; A
ustra
lia,
Aus
;
Euro
pe, E
ur) a
nd w
ater
trea
tmen
t (no
n-w
ater
ed N
W, a
nd w
ater
ed W
) on
shoo
t, le
af a
nd s
tem
bio
mas
s an
d pl
ant s
urvi
val o
f Sen
ecio
pte
roph
orus
at t
he e
nd o
f
the
com
mon
gar
den
expe
rimen
t. Th
e fix
ed e
ffec
ts (β
mod
el c
oeff
icie
nts)
are
giv
en to
geth
er w
ith th
eir
stan
dard
err
ors
(SE)
. Int
erce
pt c
orre
spon
ds to
reg
ion
Saf-
Nat
and
NW
trea
tmen
t. A
ster
isks
den
ote
sign
ifica
nt e
ffec
ts: +
P <
0.1
, * P
< 0
.05,
**
P< 0
.01
and
***
P <
0.00
1.
Sh
oot b
iom
ass
(g D
M)
(n =
526
) Le
af b
iom
ass
(g D
M)
(n =
519
) St
em b
iom
ass
(g D
M)
(n =
520
) Su
rviv
al
(n =
558
)
Fixe
d ef
fect
s β±
SE
Int
erce
pt
537.
25
± 54
.86*
**
146.
38 ±
15.1
6***
39
7.33
±
37.6
6***
3.
34 ±
0.57
***
Reg
ion
Saf-
Exp
-207
.10
± 74
.68*
* -5
1.17
±
19.5
0**
-159
.24
± 57
.18*
* 0.
50 ±
1.30
Reg
ion
Aus
-1
84.8
0 ±
57.0
9**
-57.
58 ±
14.8
1***
-1
32.0
8 ±
43.7
3**
-1.7
9 ±
0.64
**
Reg
ion
Eur
-206
.79
± 54
.92*
**
-45.
72 ±
14.2
7**
-157
.95
± 42
.36*
**
1.48
±
1.27
Tre
atm
ent W
25
5.43
±
77.3
5*
71.5
9 ±
21.3
5*
183.
48 ±
53.0
5*
1.18
±
1.01
Reg
ion
Saf-
Exp
: Tre
atm
ent W
-1
07.6
4 ±
105.
66
-31.
96 ±
27.4
1 -8
0.07
±
80.9
2 -1
.88
± 1.
68
Reg
ion
Aus
: Tr
eatm
ent W
-1
85.5
1 ±
80.8
2*
-53.
79 ±
20.9
0*
-132
.81
± 61
.91*
-1
.28
± 1.
03
Reg
ion
Eur :
Tre
atm
ent W
-1
13.7
1 ±
78.1
7 -3
2.19
±
20.2
3 -8
4.45
±
60.3
0 -3
.46
± 1.
53*

23##
Table 3. Summary of the effects of region (South Africa-native, Saf-Nat; South Africa
Expanded Saf-Exp; Australia, Aus; Europe, Eur) and water treatment (non-watered NW, and
watered W) on Relative Growth Rate for Senecio pterophorus plants calculated for three time
periods during the course of the common garden experiment (1rst period, 2nd period and 3rd
period). See materials and methods for additional details. The fixed effects (β model
coefficients) are given together with their standard errors (SE). Intercept corresponds to South
Africa native range (Saf-Nat), NW treatment and 1rst Period. Asterisks denote significant
effects: +P < 0.1, * P < 0.05, ** P< 0.01 and *** P < 0.001.
Relative Growth Rate (cm/day)
Fixed effects β± SE
Intercept 0.02290 ± 0.00049*** Region Saf-Exp 0.00101 ± 0.00062 Region Aus 0.00055 ± 0.00048 Region Eur -0.00034 ± 0.00045 Treatment W 0.00012 ± 0.00065 2nd Period -0.01892 ± 0.00041*** 3rd Period -0.02052 ± 0.00041*** Region Saf-Exp : Treatment W -0.00089 ± 0.00062 Region Aus : Treatment W 0.00007 ± 0.00048 Region Eur : Treatment W 0.00064 ± 0.00045 Treatment W : 2nd period 0.00068 ± 0.00044 Treatment W : 3rd period 0.00160 ± 0.00044*** Region Saf-Exp : 2nd period -0.00145 ± 0.00075+ Region Aus : 2nd period -0.00109 ± 0.00058+ Region Eur : 2nd period 0.00204 ± 0.00055*** Region Saf-Exp : 3rd period 0.00022 ± 0.00076 Region Aus : 3rd period -0.00134 ± 0.00059* Region Eur: 3rd period -0.00057 ± 0.00055

24#
#Tabl
e 4.
Sum
mar
y of
the
effe
cts
of r
egio
n (S
outh
Afr
ica-
nativ
e, S
af-N
at; S
outh
Afr
ica
Expa
nded
Saf
-Exp
; Aus
tralia
, Aus
; Eur
ope,
Eur
) an
d w
ater
trea
tmen
t
(non
-wat
ered
NW
, and
wat
ered
W)
on S
peci
fic L
eaf
Are
a, to
tal l
eaf
area
, lea
f sp
heric
ity, c
arbo
n is
otop
ic c
ompo
sitio
n, n
itrog
en c
once
ntra
tion
and
C/N
rat
io
on S
enec
io p
tero
phor
us g
row
ing
at th
e co
mm
on g
arde
n ex
perim
ent.
The
fixed
eff
ects
(β m
odel
coe
ffic
ient
s) a
re g
iven
toge
ther
with
thei
r sta
ndar
d er
rors
(SE)
.
Inte
rcep
t reg
ion
Sout
h A
fric
a (n
ativ
e ra
nge)
(Sa
f-N
at)
and
NW
trea
tmen
t. A
ster
isks
den
ote
sign
ifica
nt e
ffec
ts: +
P <
0.1,
* P
< 0
.05,
**
P< 0
.01
and
***
P <
0.00
1.
Lo
g[Sp
ecifi
c Le
af A
rea
(cm
2 /g)]
(n =
482
) Lo
g[To
tal L
eaf A
rea
(cm
2 )] (n
= 4
75)
Log[
Leaf
Sph
eric
ity]
(n =
482
) δ13
C
(n =
232
) Lo
g[N
] (%
) (n
= 23
2)
Log[
C/N
ratio
] (n
= 2
32)
Fixe
d ef
fect
s β±
SE
Inte
rcep
t 4.
736
± 0.
023*
**
9.60
6 ±
0.10
7***
-2
.959
±
0.03
8***
-2
9.79
1 ±
0.16
6***
0.
774
± 0.
042*
**
2.98
5 ±
0.03
8***
Reg
ion
Saf-
Exp
0.06
5 ±
0.04
5 -0
.351
±
0.14
1*
0.28
4 ±
0.07
4***
-0
.159
±
0.24
1 0.
037
± 0.
043
-0.0
41
± 0.
041
Reg
ion
Aus
-0
.025
±
0.03
6 -0
.553
±
0.11
1***
0.
205
± 0.
057*
**
-0.0
11
± 0.
229
-0.0
28
± 0.
041
0.02
9 ±
0.03
9
Reg
ion
Eur
-0.0
57
± 0.
034+
-0.3
28
± 0.
107*
* -0
.170
±
0.05
5**
-0.2
58
± 0.
226
-0.0
31
± 0.
041
0.02
8 ±
0.03
9
Trea
tmen
t W
0.20
7 ±
0.03
2***
0.
623
± 0.
152*
-0
.016
±
0.05
4 -1
.276
±
0.23
5**
0.07
2 ±
0.06
0 -0
.120
±
0.05
3+
Reg
ion
Saf-
Exp
: Tre
atm
ent W
0.
004
± 0.
065
-0.0
11
± 0.
202
-0.0
20
± 0.
106
0.13
5 ±
0.34
1 0.
009
± 0.
061
0.01
9 ±
0.05
8
Reg
ion
Aus
: Tr
eatm
ent W
0.
006
± 0.
051
-0.0
29
± 0.
159
-0.0
56
± 0.
082
0.16
9 ±
0.32
3 -0
.129
±
0.05
8*
0.11
7 ±
0.05
5*
Reg
ion
Eur :
Tre
atm
ent W
0.
044
± 0.
048
-0.1
43
± 0.
151
0.01
2 ±
0.07
9 0.
071
± 0.
321
-0.0
21
± 0.
058
0.02
0 ±
0.05
5

25##
Figure captions
Fig. 1
Populations of S. pterophorus surveyed at the native range (South Africa, populations 6 to 19),
the expanded range (South Africa, populations 1 to 5), and the two invasive ranges (Australia
and Europe). Abbreviations for regions or states: in South Africa ECP = Eastern Cape, WCP =
Western Cape, KZN = KwaZulu-Natal; in Australia NSW = New South Whales, SA = South
Australia, VIC = Victoria; in Europe CAT = Catalonia (Spain). The shaded area indicates S.
pterophorus distribution based on herbaria databases and literature. Population numbers
correspond to the code from Table S1. Adapted from Castells et al. 2013. Populations S20 to
S23 were not originally included in the study by Castells et al. 2013.
Fig. 2
Biomass in terms of: a) total weight, b) leaf weight, c) stem weight for plants from the South
Africa-native (Saf-Nat), South Africa Expanded (Saf-Exp) and introduced regions Australia
(Aus) Europe (Eur) for both treatments (W, watered; NW, non watered) grown under common
garden conditions in Europe. The horizontal line inside the boxes indicates the median, the box
limits indicate 25th and 75th percentiles, whiskers denote 1.5 x interquartile range (IQR), and
additional data points indicate outliers. Percentage survival at the end of the experiment by
Region and Treatment is shown in panel d).
Fig. 3
Height growth of plants from the South Africa-native region (Saf-Nat) compared to: a) South
Africa Expanded region (Saf-Exp), b) introduced region Australia (Aus) and c) introduced
region Europe (Eur). Each data point (linked by segments showing the overall trajectory)
indicates the mean and SE for the corresponding treatment (W, watered; NW, not watered) for
the four studied periods.

26##
Fig. 4
Leaf attributes of plants from the South Africa-native (Saf-Nat), South Africa Expanded (Saf-
Exp) and introduced regions Australia (Aus) Europe (Eur) for both treatments (W, watered;
NW, non watered) grown under common garden conditions in Europe: a) Specific Leaf Area, b)
Total leaf area, c) Leaf sphericity, d) Carbon isotopic composition, e) Percentage of nitrogen
and f) Carbon/nitrogen ratio. The horizontal line inside the boxes indicates the median, the box
limits indicate 25th and 75th percentiles, whiskers denote 1.5 x interquartile range (IQR) and
additional data points indicate outliers.

27##
Figure 1
28##
Figure 2

29##

30##
Figure 3

31##
Figure 4

32#
#Supp
lem
enta
ry m
ater
ial
Tabl
e S1
. Pop
ulat
ions
of S
enec
io p
tero
phor
us u
sed
in a
com
mon
gar
den
expe
rimen
t fro
m th
e na
tive
rang
e (S
outh
Afr
ica)
, the
exp
ande
d ra
nge
(Wes
tern
Cap
e,
Sout
h A
fric
a) a
nd tw
o in
trodu
ced
rang
es (A
ustra
lia a
nd E
urop
e).
Loca
tion1
Popu
latio
n C
ode2,
3 O
rigin
4 C
oord
inat
es
Alt.
(m)5
Tem
p. (º
C)5
Rai
nfal
l (m
m)5
SOU
TH A
FRIC
A
EC
P C
olch
este
r S0
6*
Nat
33
º41'
S 25
º49'
E 6
16.4
44
0 EC
P G
raha
mst
own
S07
Nat
33
º19'
S 26
º32'
E 66
8 18
.5
741
ECP
Ale
xand
ria
S08
Nat
33
º36'
S 26
º24'
E 12
4 16
.1
548
ECP
Port
Alfr
ed
S09*
N
at
33º3
6'S
26º5
2'E
61
18.2
59
5 EC
P Fo
rt H
are
S10*
N
at
32º4
7'S
26º5
2'E
535
18.2
59
3 EC
P C
ourtl
ands
S1
1*
Nat
32
º40'
S 28
º00'
E 47
1 17
.9
802
ECP
Um
tent
u S1
2*
Nat
31
º51'
S 28
º30'
E 71
6 17
.4
713
ECP
Flar
gsta
ff
S13
Nat
31
º11'
S 29
º26'
E 88
4 16
.0
912
ECP
Mt.
Ayl
iff
S14*
N
at
30º5
0'S
29º1
5'E
1116
15
.9
827
ECP
Biz
ana
S15
Nat
30
º50'
S 29
º35'
E 10
76
15.6
90
7 EC
P M
ount
Frer
e S1
8 N
at
30º5
7'S
28º5
7'E
1242
15
.6
856
ECP
Ant
ioch
S1
9 N
at
30º4
2'S
28º5
1'E
1261
16
.0
787
ECP
Sidw
adw
enii
S20
Nat
31
º23’
S 28
º50'
E 10
02
16.0
80
1 EC
P M
qand
uli
S21
Nat
31
º49'
S 28
º45'
E 78
5 16
.8
748
ECP
Gw
adan
a S2
2 N
at
32º1
2'S
28º1
7'E
709
16.9
75
0 EC
P N
obok
we
S23
Nat
31
º54'
S 27
º50'
E 96
3 16
.9
650
KZN
St
affo
rd's
Post
S1
6 N
at
30º3
1'S
29º4
6'E
1141
15
.6
927
KZN
Fr
ankl
in
S17
Nat
30
º23'
S 29
º38'
E 12
00
15.5
83
4

33#
#
WC
P G
roen
font
eink
op
S01*
Ex
p 33
º47'
S 18
º52'
E 17
6 16
.9
786
WC
P C
apeT
own
S02*
Ex
p 34
º07'
S 18
º23'
E 26
16
.4
825
WC
P El
gin
S03*
Ex
p 34
º09'
S 19
º01'
E 32
6 14
.7
996
WC
P H
erm
anus
S0
4*
Exp
34º2
4'S
19º1
1'E
23
16.2
58
9 W
CP
Cap
eTow
n S0
5*
Exp
33º5
6'S
18º2
6'E
114
16.5
10
86
AU
STR
ALI
A
N
SW
Doo
nsid
e A
01
Int
33º4
5'S
150º
52'E
48
17
.2
873
NSW
N
ewca
stle
A
02*
Int
32º5
2'S
151º
41'E
13
17
.9
1092
SA
Po
rt Li
ncol
n A
03
Int
34º3
3'S
135º
49'E
13
16
.0
509
SA
Wan
gary
A
04*
Int
34º3
0'S
135º
25'E
15
16
.2
531
SA
Linc
oln
NP
A05
* In
t 34
º48'
S 13
5º46
'E
6 16
.2
516
SA
Hin
cks N
P A
06
Int
33º5
5'S
136º
14'E
84
16
.4
399
SA
Mt.
Com
pass
A
07
Int
35º2
0'S
138º
36'E
26
2 14
.6
801
SA
Cle
land
NP
A08
* In
t 34
º57'
S 13
8º42
'E
602
13.0
11
01
SA
War
ren
CP
A09
* In
t 34
º40'
S 13
8º51
'E
257
14.9
61
6 SA
M
t. B
urr
A10
* In
t 37
º35'
S 14
0º28
'E
171
13.3
86
7 V
IC
Mt.
Nap
ier N
P A
11
Int
37º5
5'S
142º
02'E
22
3 12
.9
757
VIC
H
astin
gs
A12
In
t 38
º17'
S 14
5º11
'E
15
14.5
78
5 EU
RO
PE
C
AT
Cam
brils
C
01*
Int
41º0
4'N
1º0
4'E
20
16.3
54
9 C
AT
Pala
folls
C
02*
Int
41º3
9'N
2º4
2'E
66
15.6
72
2 C
AT
Cal
ella
C
03
Int
41º3
7'N
2º3
9'E
144
15.6
71
7 C
AT
Cas
tellb
isba
l C
04*
Int
41º2
7'N
1º5
9'E
51
16.3
58
9 C
AT
Cas
tella
r V.
C05
* In
t 41
º36'
N 2
º04'
E 28
8 15
.3
631
CA
T B
igue
s i R
iells
C
06
Int
41º4
1'N
2º1
2'E
295
15.1
66
7 C
AT
Saba
dell
C07
In
t 41
º31'
N 2
º07'
E 12
4 16
.1
594
CA
T R
ipol
let
C08
* In
t 41
º29'
N 2
º10'
E 61
16
.3
599

34#
#
CA
T M
atad
eper
a C
09
Int
41º3
5'N
2º0
1'E
413
14.5
66
2 C
AT
Sant
Llo
renç
NP
C10
In
t 41
º36'
N 2
º05'
E 33
2 14
.9
654
CA
T C
ampi
ns
C11
* In
t 41
º43'
N 2
º28'
E 51
9 14
.2
798
CA
T M
onts
eny
NP
C12
In
t 41
º43'
N 2
º24'
E 62
2 13
.0
822
1 Abb
revi
atio
n fo
r reg
ions
and
Sta
tes.
In S
outh
Afr
ica:
EC
P =
East
ern
Cap
e, W
CP
= W
este
rn C
ape,
KZN
= K
waZ
ulu-
Nat
al; i
n A
ustra
lia: N
SW =
New
Sou
th
Wha
les,
SA =
Sou
th A
ustra
lia, V
IC =
Vic
toria
; in
Euro
pe: C
AT
= C
atal
onia
(Spa
in),
2 Cod
e as
sign
ed to
eac
h po
pula
tion.
Pop
ulat
ion
num
ber c
orre
spon
ds to
Fig
. 1
3 Ast
eris
ks d
enot
e po
pula
tions
use
d fo
r iso
tope
ana
lyse
s
4 Orig
in: N
at =
nat
ive,
Exp
= e
xpan
ded,
Int =
intro
duce
d
5 Alti
tude
, mea
n an
nual
tem
pera
ture
and
mea
n an
nual
rain
fall.
Wor
ldC
lim D
atab
ase
(Hijm
ans e
t al.
2005
)

35#
#Tabl
e S2
. Var
ianc
e co
mpo
nent
s an
alys
is s
how
ing
the
perc
enta
ge o
f var
ianc
e ex
plai
ned
at d
iffer
ent h
iera
rchi
cal l
evel
s (B
lock
, Reg
ion,
Pop
ulat
ion,
Indi
vidu
al,
With
in-in
divi
dual
or t
reat
men
t) fo
r all
the
varia
bles
mea
sure
d in
the
stud
y.
B
lock
R
egio
n Po
pula
tion
Indi
vidu
als
With
in
Shoo
t Bio
mas
s 5.
49%
15
.10%
18
.25%
53
.71%
7.
45%
Leaf
Bio
mas
s 6.
18%
18
.05%
16
.76%
51
.86%
7.
15%
Stem
Bio
mas
s 4.
02%
14
.22%
19
.58%
54
.53%
7.
65%
Spec
ific
leaf
are
a 23
.88%
1.
86%
<
0.01
%
74.2
0%
0.06
%
Tota
l lea
f are
a 20
.40%
12
.15%
13
.07%
48
.19%
6.
19%
Leaf
sph
eric
ity
0.01
%
21.3
0%
29.0
0%
49.2
7%
0.43
%
δ13C
34
.35%
0.
01%
<
0.01
%
65.6
5%
< 0.
01%
N
7.38
%
6.97
%
< 0.
01%
85
.52%
0.
13%
C/N
11
.59%
4.
98%
<
0.01
%
83.2
9%
0.14
%