investing guide | january 2019 to march 2019
TRANSCRIPT
INVESTONOMICSADVICE SENSE PRESENTS
INVESTING GUIDE | JANUARY 2019 to MARCH 2019
ADVICE SENSE BRINGS ITS FIFTH EDITION OF QUARTERLY INVESTMENT GUIDE INVESTONOMICS
EDITION January to March
dviceSense WEALTH MANAGEMENT SIMPLY ETHICAL
WHAT'S INSIDE
5TH
NIFTY 50 FUNDAMENTALS
BEST MUTUAL FUNDS
VIPASSANA MEDITATION EXPERIENCE
BEST PORTFOLIO MANAGEMENT SCHEMES
2019 vs 2018 : OUR PERSPECTIVE
INDIAN CORPORATE EARNINGS
dviceSense WEALTH MANAGEMENT SIMPLY ETHICAL
2018
After emerging from demonetization in 2016 and the implementation of GST in mid - 2017, the economy
was seen to be returning to its growth trajectory towards the end of calendar year 2017 but 2018 brought
with it, a series of events that could easily have derailed growth once again.
o The rupee dollar exchange rate deteriorated during the year, largely due to rising crude oil prices,
supported by fears of a trade war between the US and China and expectations of rising interest rates in
the US.
o Sharp rise in crude oil price for 3 quarters of calendar year 2018.
o India was constantly haunted by the spectre of rising inflation (although it never really rose above its
January 2018 peak of 5.07%) and prompted the RBI to raise its benchmark interest rate in two
tranches of 25 basis points each as a pre-emptive measure leading to yields going up in 2018.
o IL & FS defaulted in Sep, 18 leading to increase in perceived risk and coupled with rising interest rate
expectations, caused systematic liquidity to dry up substantially.
Despite all these headwinds, the economy posted growth of above 7% in all three quarters (March, June
and September 2018), peaking at 8.2% in the June quarter.
What gave the economy this inherent strength to bear domestic and international shocks and keep
plodding on its growth path?
Firstly, financial inclusion has set in motion a great juggernaut, driven by MSME activities and
consumption in small towns and rural areas. Looking ahead, it is this large base of consumers and
producers that will drive India’s growth story forward in the short to medium term, at least. Secondly, as
2018 ended, domestic and international macro-economic factors turned favourable for India, as rise in
crude prices and fall in exchange rate got reversed, and scenario on these fronts became again positive
for our country with global events that prompted adversities mellowing down. Thirdly, domestically,
inflation has fallen to an all-time low of 2.33%. Fourthly, liquidity is fast returning to the financial sector
due to a series of measures adopted by the RBI and the support of other apex bodies.
What is missing is that corporate earnings have not shown decent improvements, only a few signs of
recovery.
2019 vs 2018 : Our Perspective
Everyone believes that year 2019 is going to be influenced by the general elections and its outcome,
which is not entirely incorrect, however, if the recent state elections are referred, it highlights the
market is not a slave to politics in long term. What matters more is - macro and micro economic
fundamentals along with valuations and corporate earnings.
dviceSense WEALTH MANAGEMENT SIMPLY ETHICAL
2019
According to the Bank of America Merrill Lynch (BofA-ML) survey of fund managers for Dec, 53% of global
fund managers expect global economic growth to weaken over the next 12 months. While the US - China
trade war tops the list of biggest tail risks cited by investors, quantitative tightening and a slowdown in
China are the other concerns. In fact, concerns about the US - China trade war have led the International
Monetary Fund to cut its global growth forecast in Oct to 3.7% for both 2018 and 2019, down from 3.9%
projected in July. Hence, apart from US markets which fell more than 20% in calendar year 2018, other big
markets also witnessed a decent fall in 2018 like - China(- 25.5%), Japan(-14.9%) and the Philippines(-
14.4%).
At the same time, India remains ahead of China to retain the tag of the world’s fastest growing major
economy. Industrial output remains resilient, consumption continues to be strong, and inflation is at
multi year low. Though corporate earnings have not shown significant improvement, however, what
makes scenario optimistic on this front(as well) is that growth drivers are changing from private
consumption to investment in Q2FY2018 -19; gross fixed capital formation (GFCF) increased by 12.5%
YoY recording the third consecutive quarter of double digit growth. This has implications as corporate
earnings are more dependent on growth in capex. Large - cap heavy weight companies are thus
witnessing support from improving growth cycle, macro stability and rising domestic appetite for
equities, (reflected by DII flows).
Our Views
We agree that while there is a pessimism in the markets globally and this may continue into the first
quarter until better data emerges and hence we believe that markets could be volatile for the time being,
but despite weaker global outlook, it is unlikely that world will go into a recession. So, uncertainty in the
first half of the year presents opportunity to invest keeping in perspective the recovery in the second half
of 2019. All the more because besides a few large cap companies, equity markets across sectors and
markets caps has already seen price correction in 2018. So, more price and/or time correction in first half
of 2019, would make markets look attractive on valuations. Thus, in our view, elections are mere
“interruptions” that won’t disrupt the nation’s economic structure or business cycle, and markets would
settle over time, until which one has to ride the volatility, and any fall is an investment opportunity for
long-term. One must not forget, that when going gets tough, tough gets going.
Consumption as a theme (stocks like ITC, HUL, Havells, Godej Consumer products ) for example looks
promising for 2019, as demand from rural and urban areas starts to pick up based on the various
programs undertaken by the govt. At the same time, after price correction in auto (stocks like Maruti, M &
M, Eicher Motors, Tata Motors), it also present an opportunity to invest from a medium - to long - term
perspective. Private sector banks is the third sector ( stocks like ICICI bank, Axis bank, Kotak, Yes bank )
that present an investment opportunity.
Elections in 2019 seem to be different than elections of 2014, 2009 or 2004, as this year outcome seems
unclear and uncertain; but is that really only the case in 2019? Elections outcomes have always been
uncertain, but, in long term markets have followed macro - economic fundamentals and corporate
earnings and not elections. While, patience and not investing in a hurry is extremely important, waiting to
catch the bottom is dangerous. Sticking to one’s asset allocation; maintaining the optimum balance of
debt and equity and chasing asset valuations on forward earnings basis is a better approach than trying
to time the market.
Kamal Manocha
Chief Strategist and Advisor
dviceSense WEALTH MANAGEMENT SIMPLY ETHICAL
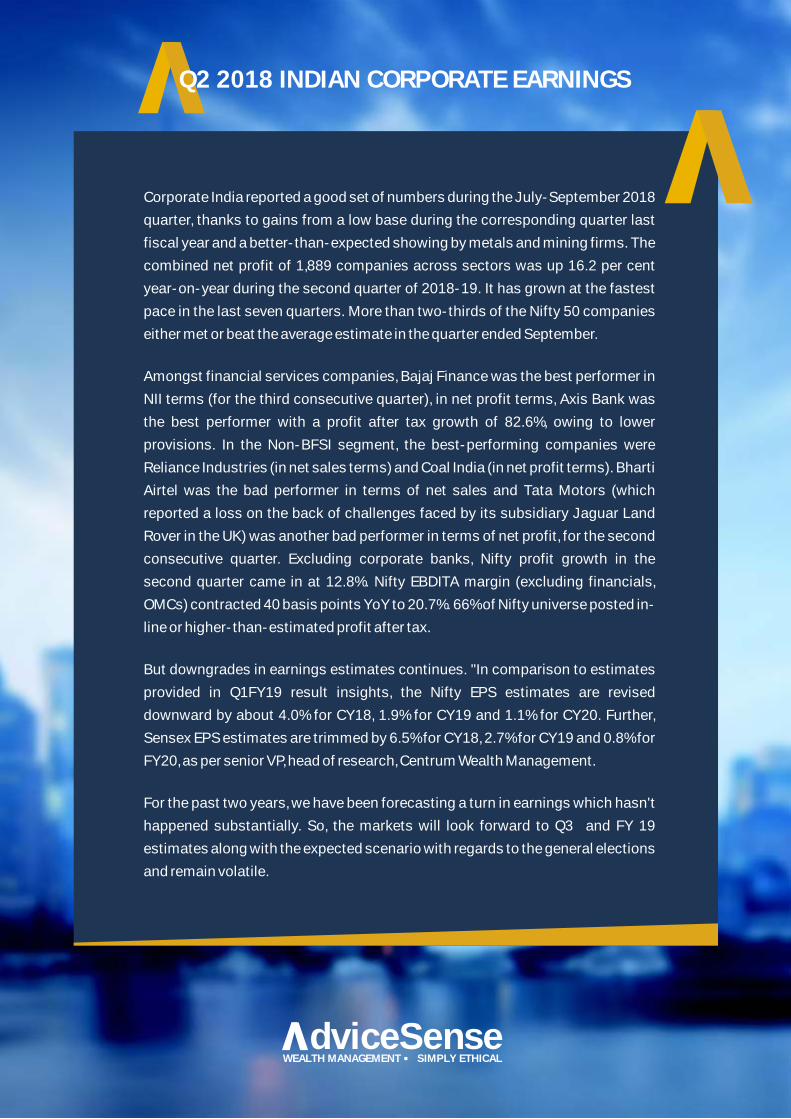
Corporate India reported a good set of numbers during the July-September 2018
quarter, thanks to gains from a low base during the corresponding quarter last
fiscal year and a better-than-expected showing by metals and mining firms. The
combined net profit of 1,889 companies across sectors was up 16.2 per cent
year-on-year during the second quarter of 2018-19. It has grown at the fastest
pace in the last seven quarters. More than two-thirds of the Nifty 50 companies
either met or beat the average estimate in the quarter ended September.
Amongst financial services companies, Bajaj Finance was the best performer in
NII terms (for the third consecutive quarter), in net profit terms, Axis Bank was
the best performer with a profit after tax growth of 82.6%, owing to lower
provisions. In the Non-BFSI segment, the best-performing companies were
Reliance Industries (in net sales terms) and Coal India (in net profit terms). Bharti
Airtel was the bad performer in terms of net sales and Tata Motors (which
reported a loss on the back of challenges faced by its subsidiary Jaguar Land
Rover in the UK) was another bad performer in terms of net profit, for the second
consecutive quarter. Excluding corporate banks, Nifty profit growth in the
second quarter came in at 12.8%. Nifty EBDITA margin (excluding financials,
OMCs) contracted 40 basis points YoY to 20.7%. 66% of Nifty universe posted in-
line or higher-than-estimated profit after tax.
But downgrades in earnings estimates continues. "In comparison to estimates
provided in Q1FY19 result insights, the Nifty EPS estimates are revised
downward by about 4.0% for CY18, 1.9% for CY19 and 1.1% for CY20. Further,
Sensex EPS estimates are trimmed by 6.5% for CY18, 2.7% for CY19 and 0.8% for
FY20, as per senior VP, head of research, Centrum Wealth Management.
For the past two years, we have been forecasting a turn in earnings which hasn't
happened substantially. So, the markets will look forward to Q3 and FY 19
estimates along with the expected scenario with regards to the general elections
and remain volatile.
Q2 2018 INDIAN CORPORATE EARNINGS
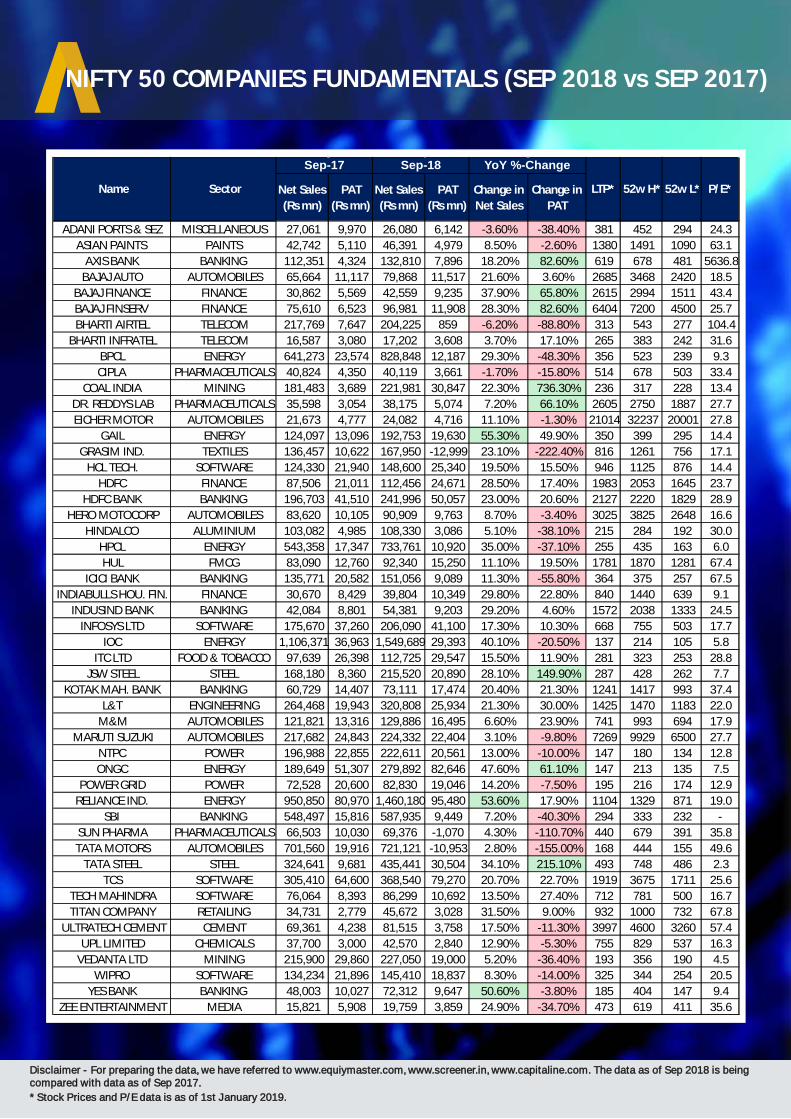
NIFTY 50 COMPANIES FUNDAMENTALS (SEP 2018 vs SEP 2017)
Disclaimer - For preparing the data, we have referred to www.equiymaster.com, www.screener.in, www.capitaline.com. The data as of Sep 2018 is being compared with data as of Sep 2017.
* Stock Prices and P/E data is as of 1st January 2019.
Net Sales
(Rs mn)
PAT
(Rs mn)
Net Sales
(Rs mn)
PAT
(Rs mn)
Change in
Net Sales
Change in
PAT
ADANI PORTS & SEZ MISCELLANEOUS 27,061 9,970 26,080 6,142 -3.60% -38.40% 381 452 294 24.3
ASIAN PAINTS PAINTS 42,742 5,110 46,391 4,979 8.50% -2.60% 1380 1491 1090 63.1
AXIS BANK BANKING 112,351 4,324 132,810 7,896 18.20% 82.60% 619 678 481 5636.8
BAJAJ AUTO AUTOMOBILES 65,664 11,117 79,868 11,517 21.60% 3.60% 2685 3468 2420 18.5
BAJAJ FINANCE FINANCE 30,862 5,569 42,559 9,235 37.90% 65.80% 2615 2994 1511 43.4
BAJAJ FINSERV FINANCE 75,610 6,523 96,981 11,908 28.30% 82.60% 6404 7200 4500 25.7
BHARTI AIRTEL TELECOM 217,769 7,647 204,225 859 -6.20% -88.80% 313 543 277 104.4
BHARTI INFRATEL TELECOM 16,587 3,080 17,202 3,608 3.70% 17.10% 265 383 242 31.6
BPCL ENERGY 641,273 23,574 828,848 12,187 29.30% -48.30% 356 523 239 9.3
CIPLA PHARMACEUTICALS 40,824 4,350 40,119 3,661 -1.70% -15.80% 514 678 503 33.4
COAL INDIA MINING 181,483 3,689 221,981 30,847 22.30% 736.30% 236 317 228 13.4
DR. REDDYS LAB PHARMACEUTICALS 35,598 3,054 38,175 5,074 7.20% 66.10% 2605 2750 1887 27.7
EICHER MOTOR AUTOMOBILES 21,673 4,777 24,082 4,716 11.10% -1.30% 21014 32237 20001 27.8
GAIL ENERGY 124,097 13,096 192,753 19,630 55.30% 49.90% 350 399 295 14.4
GRASIM IND. TEXTILES 136,457 10,622 167,950 -12,999 23.10% -222.40% 816 1261 756 17.1
HCL TECH. SOFTWARE 124,330 21,940 148,600 25,340 19.50% 15.50% 946 1125 876 14.4
HDFC FINANCE 87,506 21,011 112,456 24,671 28.50% 17.40% 1983 2053 1645 23.7
HDFC BANK BANKING 196,703 41,510 241,996 50,057 23.00% 20.60% 2127 2220 1829 28.9
HERO MOTOCORP AUTOMOBILES 83,620 10,105 90,909 9,763 8.70% -3.40% 3025 3825 2648 16.6
HINDALCO ALUMINIUM 103,082 4,985 108,330 3,086 5.10% -38.10% 215 284 192 30.0
HPCL ENERGY 543,358 17,347 733,761 10,920 35.00% -37.10% 255 435 163 6.0
HUL FMCG 83,090 12,760 92,340 15,250 11.10% 19.50% 1781 1870 1281 67.4
ICICI BANK BANKING 135,771 20,582 151,056 9,089 11.30% -55.80% 364 375 257 67.5
INDIABULLS HOU. FIN. FINANCE 30,670 8,429 39,804 10,349 29.80% 22.80% 840 1440 639 9.1
INDUSIND BANK BANKING 42,084 8,801 54,381 9,203 29.20% 4.60% 1572 2038 1333 24.5
INFOSYS LTD SOFTWARE 175,670 37,260 206,090 41,100 17.30% 10.30% 668 755 503 17.7
IOC ENERGY 1,106,371 36,963 1,549,689 29,393 40.10% -20.50% 137 214 105 5.8
ITC LTD FOOD & TOBACCO 97,639 26,398 112,725 29,547 15.50% 11.90% 281 323 253 28.8
JSW STEEL STEEL 168,180 8,360 215,520 20,890 28.10% 149.90% 287 428 262 7.7
KOTAK MAH. BANK BANKING 60,729 14,407 73,111 17,474 20.40% 21.30% 1241 1417 993 37.4
L&T ENGINEERING 264,468 19,943 320,808 25,934 21.30% 30.00% 1425 1470 1183 22.0
M&M AUTOMOBILES 121,821 13,316 129,886 16,495 6.60% 23.90% 741 993 694 17.9
MARUTI SUZUKI AUTOMOBILES 217,682 24,843 224,332 22,404 3.10% -9.80% 7269 9929 6500 27.7
NTPC POWER 196,988 22,855 222,611 20,561 13.00% -10.00% 147 180 134 12.8
ONGC ENERGY 189,649 51,307 279,892 82,646 47.60% 61.10% 147 213 135 7.5
POWER GRID POWER 72,528 20,600 82,830 19,046 14.20% -7.50% 195 216 174 12.9
RELIANCE IND. ENERGY 950,850 80,970 1,460,180 95,480 53.60% 17.90% 1104 1329 871 19.0
SBI BANKING 548,497 15,816 587,935 9,449 7.20% -40.30% 294 333 232 -
SUN PHARMA PHARMACEUTICALS 66,503 10,030 69,376 -1,070 4.30% -110.70% 440 679 391 35.8
TATA MOTORS AUTOMOBILES 701,560 19,916 721,121 -10,953 2.80% -155.00% 168 444 155 49.6
TATA STEEL STEEL 324,641 9,681 435,441 30,504 34.10% 215.10% 493 748 486 2.3
TCS SOFTWARE 305,410 64,600 368,540 79,270 20.70% 22.70% 1919 3675 1711 25.6
TECH MAHINDRA SOFTWARE 76,064 8,393 86,299 10,692 13.50% 27.40% 712 781 500 16.7
TITAN COMPANY RETAILING 34,731 2,779 45,672 3,028 31.50% 9.00% 932 1000 732 67.8
ULTRATECH CEMENT CEMENT 69,361 4,238 81,515 3,758 17.50% -11.30% 3997 4600 3260 57.4
UPL LIMITED CHEMICALS 37,700 3,000 42,570 2,840 12.90% -5.30% 755 829 537 16.3
VEDANTA LTD MINING 215,900 29,860 227,050 19,000 5.20% -36.40% 193 356 190 4.5
WIPRO SOFTWARE 134,234 21,896 145,410 18,837 8.30% -14.00% 325 344 254 20.5
YES BANK BANKING 48,003 10,027 72,312 9,647 50.60% -3.80% 185 404 147 9.4
ZEE ENTERTAINMENT MEDIA 15,821 5,908 19,759 3,859 24.90% -34.70% 473 619 411 35.6
P/E*
Sep-17 Sep-18 YoY %-Change
Name Sector LTP* 52w H* 52w L*
dviceSense WEALTH MANAGEMENT SIMPLY ETHICAL
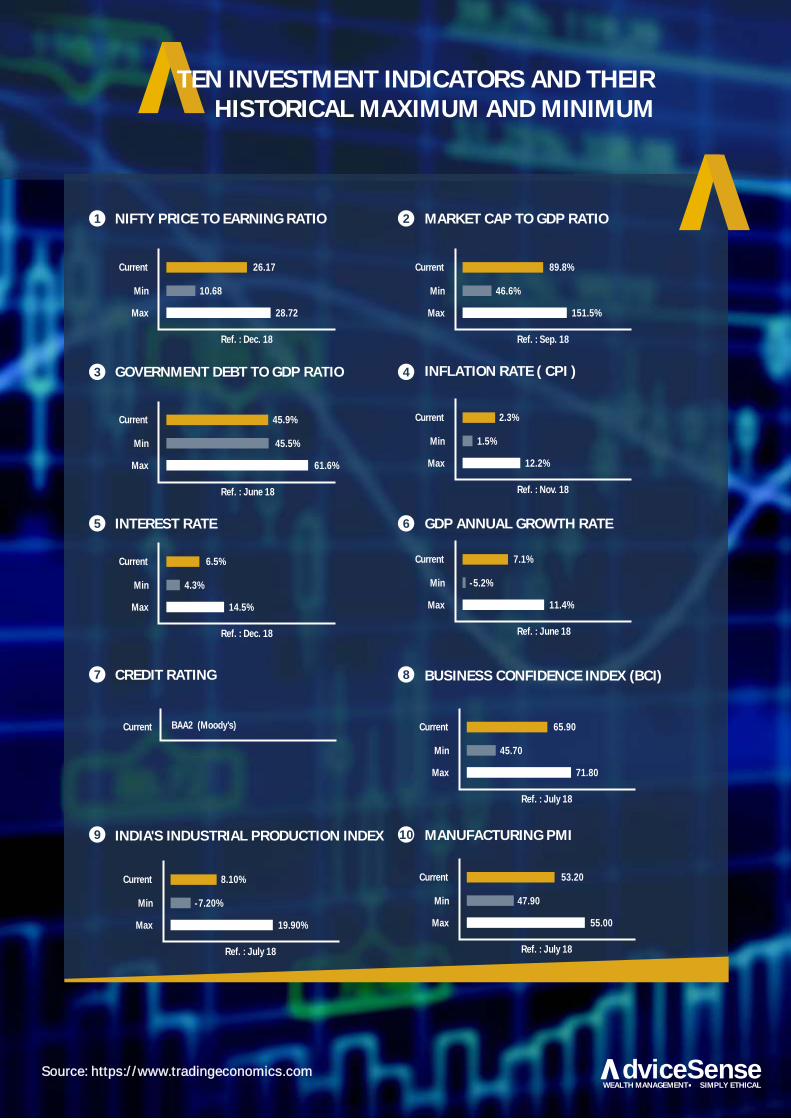
Source: https://www.tradingeconomics.com
TEN INVESTMENT INDICATORS AND THEIR HISTORICAL MAXIMUM AND MINIMUM
NIFTY PRICE TO EARNING RATIO
26.17
10.68
28.72
Current
Min
Max
Ref. : Dec. 18
MARKET CAP TO GDP RATIO
45.9%
45.5%
61.6%
Current
Min
Max
Ref. : June 18
GOVERNMENT DEBT TO GDP RATIO
2.3%
1.5%
12.2%
Current
Min
Max
Ref. : Nov. 18
INFLATION RATE ( CPI )
6.5%
4.3%
14.5%
Current
Min
Max
Ref. : Dec. 18
INTEREST RATE
7.1%
-5.2%
11.4%
Current
Min
Max
Ref. : June 18
GDP ANNUAL GROWTH RATE
CREDIT RATING
65.90
45.70
71.80
Current
Min
Max
Ref. : July 18
BAA2 (Moody's)Current
BUSINESS CONFIDENCE INDEX (BCI)
8.10%
-7.20%
19.90%
Current
Min
Max
Ref. : July 18
INDIA'S INDUSTRIAL PRODUCTION INDEX
53.20
47.90
55.00
Current
Min
Max
Ref. : July 18
MANUFACTURING PMI
21
43
65
87
109
89.8%
46.6%
151.5%
Current
Min
Max
Ref. : Sep. 18

dviceSense WEALTH MANAGEMENT SIMPLY ETHICAL
It all sounds very sophisticated,because it is.
But for you, we make it seamless.
ADVICE SENSE IS SIMPLY ETHICAL
We make countless smart decisions. You just need to make one.
The financial industry isn’t designed to be fair
dviceSense WEALTH MANAGEMENT SIMPLY ETHICAL
Indian stock market has seen four decades of remarkable history since 1979, where Sensex, the oldest index witnessed its journey from a level of 100, to now a level of 35000 during this period. Direct equity investing cult has thus taken deeper roots, and today there are a large number of investors who own equity portfolios in their demat accounts that they manage on their own basis inputs from broking companies, equity advisors and own views & analysis.
Because equity is highly volatile asset class, it requires an extensive research, as well as right investment temperament. Hence a self-managed equity portfolio seldom out-performs a professionally managed portfolio. And, over a longer period of time, the difference compounds and self-managed portfolios in general highly underperforms in comparison to the professionally managed portfolios.
Simply put, people who manage their own portfolios, on an average buy less of a quality as quality appears to be expensive and the investors' focus is on price, rather than value. Similarly, at the time of booking profit, stocks that are exited first are the ones that have undergone decent run up, as focus is on the price and gains rather than value and company's business. Eventually, because of this, quality keeps moving out of the portfolio and what remains is equity stocks that look cheap.
In a self-managed portfolio no-one is answerable to the investor, and it is generally very difficult for investor to evaluate his own decisions.
Professional management comes through two core investment products – Mutual Funds and PMS.
Mutual Funds are good, but are too much diversified and do not offer potential out - performance of a focussed and a concentrated approach that PMS brings in.
Here we present two major benefits of PMS vs Self-managed equity portfolio as well as MFs.
1. PMS Holdings are isolated and hence one investors portfolio is not impacted by other investors behaviour. Mutual funds being a retail product, follows a common pool approach, and investors are in general the public and thus is exposed to the vagaries of the behaviour of lacs of investors. Investors tend to invest in rising markets and there could be times of panic in rapidly falling markets. So, mutual fund gets more investment flows in the rising markets and it may happen at times that mutual funds are forced to buy more at higher levels, and sell in the falling markets on account of investors' panic selling. In case of a PMS, every investor has individual holdings in the demat account, so one investor's behaviour doesn't impact the other investors investment, and hence perform better in long term.
WHY INVEST IN EQUITY MARKETS THROUGH PORTFOLIO MANAGEMENT SERVICE

2. PMS creates a more concentrated portfolio and follows largely buy and hold strategy, so has a potential to generate superior long-term performance. Mutual Funds being products for mass retail investors tend to be regulated strictly; for instance, there are regulatory norms for benchmarking, scrip level exposure, investment patterns etc. More specifically in Mutual Funds, no stock can be over 10% of portfolio exposure. In PMS for instance; if a stock has 8% exposure and all things being static, this stock appreciates to become 12% of the portfolio, there is no compulsion to sell. There are times when a stock classified as mid cap appreciates over time and comes within the large cap basket. In a Mutual Fund scheme depending on investment universe defined the portfolio manager might be forced to sell. In a PMS, a portfolio manager may choose to have higher exposure as well as hold on to concentrated positions as long as they are delivering growth.
As often it is said that nothing comes easy, PMS requires more careful selection, slightly more documentation and a minimum investment commitment of Rs 25 lakhs.
Strategy Category Return (Absolute)
AMBIT Coffee Can Multi Cap Oriented 20.40%
INVESCO Large Cap Large Cap Oriented 8.67%
ALCHEMY Select Stock Multi Cap Oriented 2.80%
ICICI Largecap Large Cap Oriented 2.62%
AXIS Brand Equity Multi Cap Oriented 2.00%
Strategy Category Return (CAGR)
MOTILAL NTDOP Multi Cap Oriented 26.72%
INVESCO India Caterpillar Mid Cap Oriented 25.50%
KOTAK SSV I Multi Cap Oriented 25.36%
ALFAccurate AAA PMS Multi Cap Oriented 25.36%
SUNDARAM Midcap Mid Cap Oriented 23.20%
Strategy Category 5Y Return (CAGR)
Invesco Large Cap Large Cap Oriented 16.80%
ALFAcurrate AAA PMS Multi Cap Oriented 25.36%
Sundaram Midcap Mid Cap Oriented 23.20%
Top 5 Strategies as per 1Y Return
Top 5 Strategies as per 5Y Return
Our Recommened Strategies
Investments are subject to market risks, please read the disclosure document carefully before investing. Past performance may or may not be sustained in future and should not be used as a basis for comparison with other investments. Portfolio Management Services are market linked and do not offer any guaranteed /assured returns.
Disclaimer - The returns have been collected from the respective PMS provider website and their monthly factsheets. Data provided is as of Nov'18.
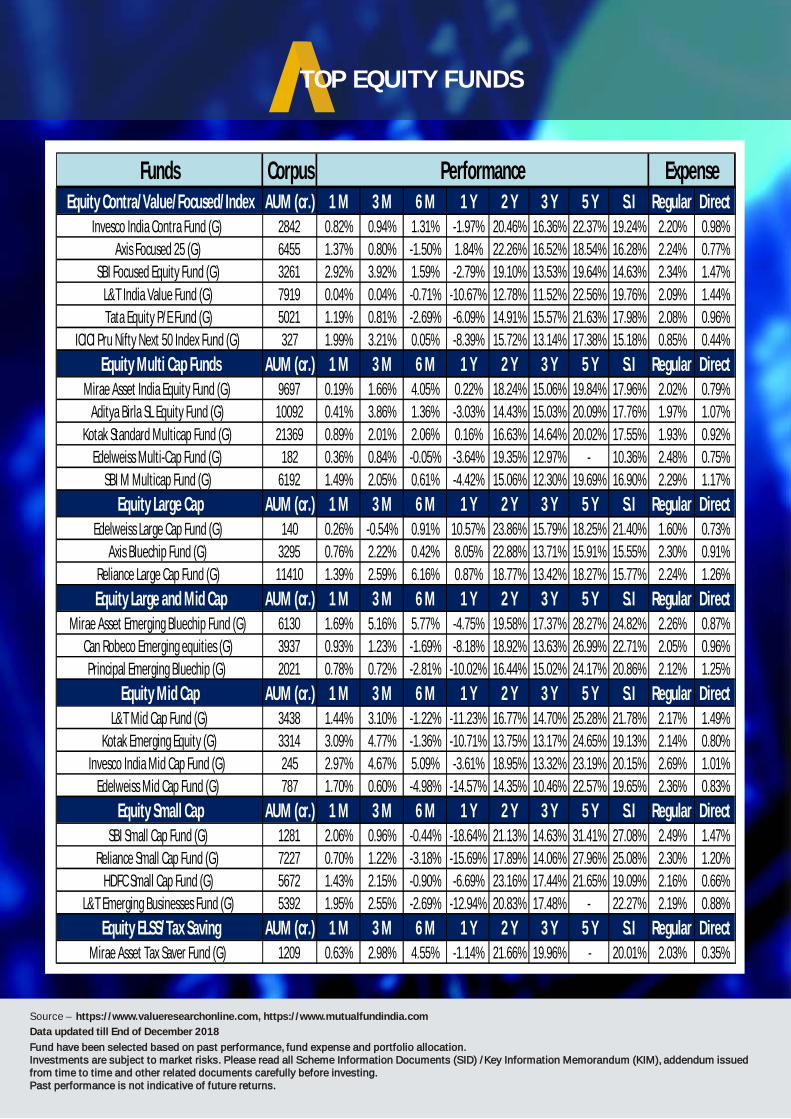
TOP EQUITY FUNDS
Fund have been selected based on past performance, fund expense and portfolio allocation.Investments are subject to market risks. Please read all Scheme Information Documents (SID) /Key Information Memorandum (KIM), addendum issued from time to time and other related documents carefully before investing. Past performance is not indicative of future returns.
Source – https://www.valueresearchonline.com, https://www.mutualfundindia.com
Data updated till End of December 2018
Funds CorpusEquity Contra/Value/Focused/Index AUM (cr.) 1 M 3 M 6 M 1 Y 2 Y 3 Y 5 Y S.I Regular Direct
Invesco India Contra Fund (G) 2842 0.82% 0.94% 1.31% -1.97% 20.46% 16.36% 22.37% 19.24% 2.20% 0.98%
Axis Focused 25 (G) 6455 1.37% 0.80% -1.50% 1.84% 22.26% 16.52% 18.54% 16.28% 2.24% 0.77%
SBI Focused Equity Fund (G) 3261 2.92% 3.92% 1.59% -2.79% 19.10% 13.53% 19.64% 14.63% 2.34% 1.47%
L&T India Value Fund (G) 7919 0.04% 0.04% -0.71% -10.67% 12.78% 11.52% 22.56% 19.76% 2.09% 1.44%
Tata Equity P/E Fund (G) 5021 1.19% 0.81% -2.69% -6.09% 14.91% 15.57% 21.63% 17.98% 2.08% 0.96%
ICICI Pru Nifty Next 50 Index Fund (G) 327 1.99% 3.21% 0.05% -8.39% 15.72% 13.14% 17.38% 15.18% 0.85% 0.44%
Equity Multi Cap Funds AUM (cr.) 1 M 3 M 6 M 1 Y 2 Y 3 Y 5 Y S.I Regular DirectMirae Asset India Equity Fund (G) 9697 0.19% 1.66% 4.05% 0.22% 18.24% 15.06% 19.84% 17.96% 2.02% 0.79%
Aditya Birla SL Equity Fund (G) 10092 0.41% 3.86% 1.36% -3.03% 14.43% 15.03% 20.09% 17.76% 1.97% 1.07%
Kotak Standard Multicap Fund (G) 21369 0.89% 2.01% 2.06% 0.16% 16.63% 14.64% 20.02% 17.55% 1.93% 0.92%
Edelweiss Multi-Cap Fund (G) 182 0.36% 0.84% -0.05% -3.64% 19.35% 12.97% - 10.36% 2.48% 0.75%
SBI M Multicap Fund (G) 6192 1.49% 2.05% 0.61% -4.42% 15.06% 12.30% 19.69% 16.90% 2.29% 1.17%
Equity Large Cap AUM (cr.) 1 M 3 M 6 M 1 Y 2 Y 3 Y 5 Y S.I Regular DirectEdelweiss Large Cap Fund (G) 140 0.26% -0.54% 0.91% 10.57% 23.86% 15.79% 18.25% 21.40% 1.60% 0.73%
Axis Bluechip Fund (G) 3295 0.76% 2.22% 0.42% 8.05% 22.88% 13.71% 15.91% 15.55% 2.30% 0.91%
Reliance Large Cap Fund (G) 11410 1.39% 2.59% 6.16% 0.87% 18.77% 13.42% 18.27% 15.77% 2.24% 1.26%
Equity Large and Mid Cap AUM (cr.) 1 M 3 M 6 M 1 Y 2 Y 3 Y 5 Y S.I Regular DirectMirae Asset Emerging Bluechip Fund (G) 6130 1.69% 5.16% 5.77% -4.75% 19.58% 17.37% 28.27% 24.82% 2.26% 0.87%
Can Robeco Emerging equities (G) 3937 0.93% 1.23% -1.69% -8.18% 18.92% 13.63% 26.99% 22.71% 2.05% 0.96%
Principal Emerging Bluechip (G) 2021 0.78% 0.72% -2.81% -10.02% 16.44% 15.02% 24.17% 20.86% 2.12% 1.25%
Equity Mid Cap AUM (cr.) 1 M 3 M 6 M 1 Y 2 Y 3 Y 5 Y S.I Regular DirectL&T Mid Cap Fund (G) 3438 1.44% 3.10% -1.22% -11.23% 16.77% 14.70% 25.28% 21.78% 2.17% 1.49%
Kotak Emerging Equity (G) 3314 3.09% 4.77% -1.36% -10.71% 13.75% 13.17% 24.65% 19.13% 2.14% 0.80%
Invesco India Mid Cap Fund (G) 245 2.97% 4.67% 5.09% -3.61% 18.95% 13.32% 23.19% 20.15% 2.69% 1.01%
Edelweiss Mid Cap Fund (G) 787 1.70% 0.60% -4.98% -14.57% 14.35% 10.46% 22.57% 19.65% 2.36% 0.83%
Equity Small Cap AUM (cr.) 1 M 3 M 6 M 1 Y 2 Y 3 Y 5 Y S.I Regular DirectSBI Small Cap Fund (G) 1281 2.06% 0.96% -0.44% -18.64% 21.13% 14.63% 31.41% 27.08% 2.49% 1.47%
Reliance Small Cap Fund (G) 7227 0.70% 1.22% -3.18% -15.69% 17.89% 14.06% 27.96% 25.08% 2.30% 1.20%
HDFC Small Cap Fund (G) 5672 1.43% 2.15% -0.90% -6.69% 23.16% 17.44% 21.65% 19.09% 2.16% 0.66%
L&T Emerging Businesses Fund (G) 5392 1.95% 2.55% -2.69% -12.94% 20.83% 17.48% - 22.27% 2.19% 0.88%
Equity ELSS/Tax Saving AUM (cr.) 1 M 3 M 6 M 1 Y 2 Y 3 Y 5 Y S.I Regular DirectMirae Asset Tax Saver Fund (G) 1209 0.63% 2.98% 4.55% -1.14% 21.66% 19.96% - 20.01% 2.03% 0.35%
ExpensePerformance
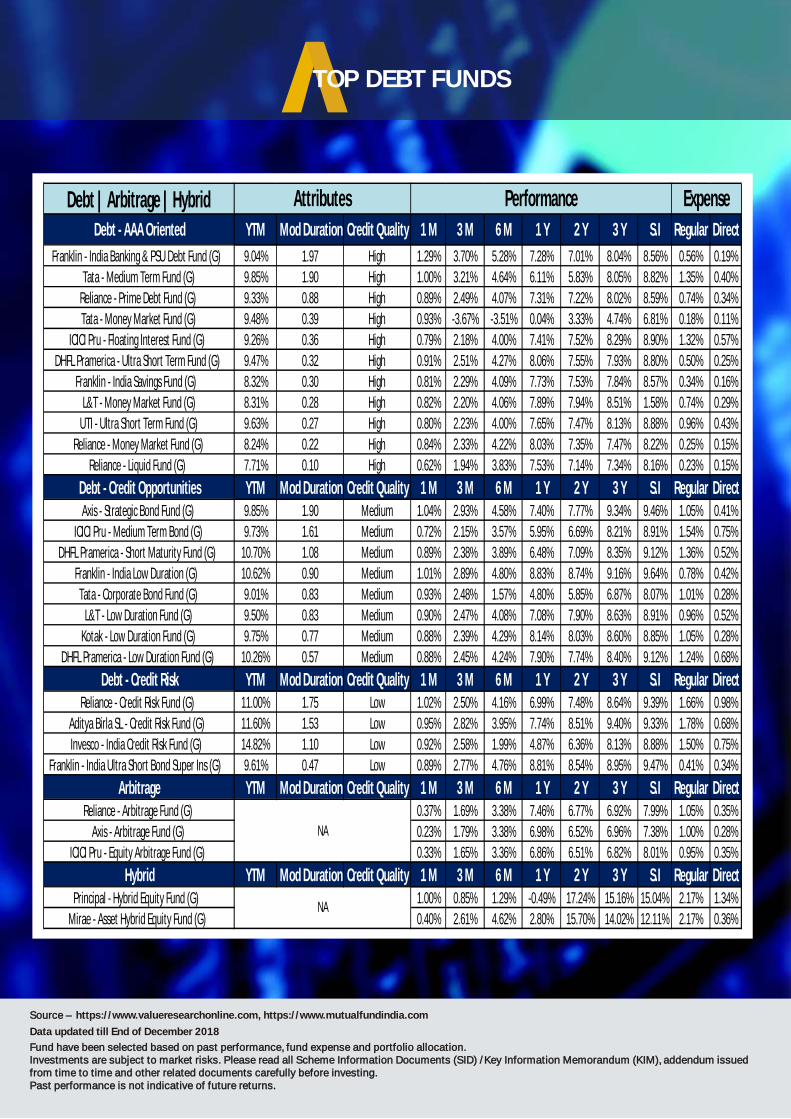
TOP DEBT FUNDS
Source – https://www.valueresearchonline.com, https://www.mutualfundindia.com
Fund have been selected based on past performance, fund expense and portfolio allocation.Investments are subject to market risks. Please read all Scheme Information Documents (SID) /Key Information Memorandum (KIM), addendum issued from time to time and other related documents carefully before investing. Past performance is not indicative of future returns.
Data updated till End of December 2018
Debt | Arbitrage | HybridDebt - AAA Oriented YTM Mod Duration Credit Quality 1 M 3 M 6 M 1 Y 2 Y 3 Y S.I Regular Direct
Franklin - India Banking & PSU Debt Fund (G) 9.04% 1.97 High 1.29% 3.70% 5.28% 7.28% 7.01% 8.04% 8.56% 0.56% 0.19%
Tata - Medium Term Fund (G) 9.85% 1.90 High 1.00% 3.21% 4.64% 6.11% 5.83% 8.05% 8.82% 1.35% 0.40%
Reliance - Prime Debt Fund (G) 9.33% 0.88 High 0.89% 2.49% 4.07% 7.31% 7.22% 8.02% 8.59% 0.74% 0.34%
Tata - Money Market Fund (G) 9.48% 0.39 High 0.93% -3.67% -3.51% 0.04% 3.33% 4.74% 6.81% 0.18% 0.11%
ICICI Pru - Floating Interest Fund (G) 9.26% 0.36 High 0.79% 2.18% 4.00% 7.41% 7.52% 8.29% 8.90% 1.32% 0.57%
DHFL Pramerica - Ultra Short Term Fund (G) 9.47% 0.32 High 0.91% 2.51% 4.27% 8.06% 7.55% 7.93% 8.80% 0.50% 0.25%
Franklin - India Savings Fund (G) 8.32% 0.30 High 0.81% 2.29% 4.09% 7.73% 7.53% 7.84% 8.57% 0.34% 0.16%
L&T - Money Market Fund (G) 8.31% 0.28 High 0.82% 2.20% 4.06% 7.89% 7.94% 8.51% 1.58% 0.74% 0.29%
UTI - Ultra Short Term Fund (G) 9.63% 0.27 High 0.80% 2.23% 4.00% 7.65% 7.47% 8.13% 8.88% 0.96% 0.43%
Reliance - Money Market Fund (G) 8.24% 0.22 High 0.84% 2.33% 4.22% 8.03% 7.35% 7.47% 8.22% 0.25% 0.15%
Reliance - Liquid Fund (G) 7.71% 0.10 High 0.62% 1.94% 3.83% 7.53% 7.14% 7.34% 8.16% 0.23% 0.15%
Debt - Credit Opportunities YTM Mod Duration Credit Quality 1 M 3 M 6 M 1 Y 2 Y 3 Y S.I Regular DirectAxis - Strategic Bond Fund (G) 9.85% 1.90 Medium 1.04% 2.93% 4.58% 7.40% 7.77% 9.34% 9.46% 1.05% 0.41%
ICICI Pru - Medium Term Bond (G) 9.73% 1.61 Medium 0.72% 2.15% 3.57% 5.95% 6.69% 8.21% 8.91% 1.54% 0.75%
DHFL Pramerica - Short Maturity Fund (G) 10.70% 1.08 Medium 0.89% 2.38% 3.89% 6.48% 7.09% 8.35% 9.12% 1.36% 0.52%
Franklin - India Low Duration (G) 10.62% 0.90 Medium 1.01% 2.89% 4.80% 8.83% 8.74% 9.16% 9.64% 0.78% 0.42%
Tata - Corporate Bond Fund (G) 9.01% 0.83 Medium 0.93% 2.48% 1.57% 4.80% 5.85% 6.87% 8.07% 1.01% 0.28%
L&T - Low Duration Fund (G) 9.50% 0.83 Medium 0.90% 2.47% 4.08% 7.08% 7.90% 8.63% 8.91% 0.96% 0.52%
Kotak - Low Duration Fund (G) 9.75% 0.77 Medium 0.88% 2.39% 4.29% 8.14% 8.03% 8.60% 8.85% 1.05% 0.28%
DHFL Pramerica - Low Duration Fund (G) 10.26% 0.57 Medium 0.88% 2.45% 4.24% 7.90% 7.74% 8.40% 9.12% 1.24% 0.68%
Debt - Credit Risk YTM Mod Duration Credit Quality 1 M 3 M 6 M 1 Y 2 Y 3 Y S.I Regular DirectReliance - Credit Risk Fund (G) 11.00% 1.75 Low 1.02% 2.50% 4.16% 6.99% 7.48% 8.64% 9.39% 1.66% 0.98%
Aditya Birla SL - Credit Risk Fund (G) 11.60% 1.53 Low 0.95% 2.82% 3.95% 7.74% 8.51% 9.40% 9.33% 1.78% 0.68%
Invesco - India Credit Risk Fund (G) 14.82% 1.10 Low 0.92% 2.58% 1.99% 4.87% 6.36% 8.13% 8.88% 1.50% 0.75%
Franklin - India Ultra Short Bond Super Ins (G) 9.61% 0.47 Low 0.89% 2.77% 4.76% 8.81% 8.54% 8.95% 9.47% 0.41% 0.34%
Arbitrage YTM Mod Duration Credit Quality 1 M 3 M 6 M 1 Y 2 Y 3 Y S.I Regular DirectReliance - Arbitrage Fund (G) 0.37% 1.69% 3.38% 7.46% 6.77% 6.92% 7.99% 1.05% 0.35%
Axis - Arbitrage Fund (G) 0.23% 1.79% 3.38% 6.98% 6.52% 6.96% 7.38% 1.00% 0.28%
ICICI Pru - Equity Arbitrage Fund (G) 0.33% 1.65% 3.36% 6.86% 6.51% 6.82% 8.01% 0.95% 0.35%
Hybrid YTM Mod Duration Credit Quality 1 M 3 M 6 M 1 Y 2 Y 3 Y S.I Regular DirectPrincipal - Hybrid Equity Fund (G) 1.00% 0.85% 1.29% -0.49% 17.24% 15.16% 15.04% 2.17% 1.34%
Mirae - Asset Hybrid Equity Fund (G) 0.40% 2.61% 4.62% 2.80% 15.70% 14.02% 12.11% 2.17% 0.36%NA
Attributes Expense
NA
Performance
dviceSense WEALTH MANAGEMENT SIMPLY ETHICAL
Vipassana Experience
Vipassana is a meditation technique that was discovered by the Rishis of ancient India when human
civilization began. Over thousands of years, it has undergone many iterations to conform to various
ideologies and lead to emergence of various religions and practices. Some 2500 years ago, Sidharth
Gautam ( The Buddha ) famously rediscovered Vipassana in its purest form by attaining
enlightenment through awareness and equanimity. Awareness implies “knowing things exactly as
they are” and Equanimity mean full surrender and being perfectly okay with whatever is happening in
the moment.
Vipassana is non-sectarian therefore, not any religion. It is based on Dharama, the Universal law.
This understanding is extremely important. We have always used the word Dharama while – alluding
- to a particular religion - Hindu Dharama, Jain Dharama, Muslim Dharama, Sikh Dharama,
Christianity Dharama, Bodh Dharama. This is because we have lost its true meaning as per ancient
language. The actual meaning of Dharam is “what one holds”, or “what mind is holding at this
moment”. In more simple words, “what are the attributes - of one’s matter (body) and mind (soul)”.
Let’s understand with example: the Dharama of fire is to burn itself and to burn others. Fire burns, and
ice cools. These are their universal laws; their innate nature. If fire doesn’t burn itself and others, it
cannot be fire. Similarly, dharama of sun is to give heat and light, dharama of moon is to give cool and
reflect light.
If i am holding ill will, animosity, anger, the dharma of my innate creation is that it will burn me and
others around me. As at this moment, I am the vessel containing fire, so vessel will be the first victim,
then the fire and heat will spread in the environment around it. It is innate nature. Similarly, if I am
holding the pure state of mind, it will reflect love, compassion, joy, peace and success. So, dharma
can be understood as the innate technology and operating mechanism of every matter and mind.
Characteristics of content one holds at any moment determines what it reflects at that moment. This
is Dharama - the universally accepted law.
The Vipassana Essence: The instructions seems to be simple: all you need to do is sit still, observe
your breath, be aware of sensations on your body, and allow your thoughts to flow with zero
judgment. But as I tried, I discovered over and over again, these instructions are extremely difficult to
follow as one is not chanting any word, neither using any tempo of breathing. So, one is barely able to
sit in one posture for a few minutes. This is the essence of Vipassana – knowing things as they really
are. With 4-5 group sittings giving attention to one’s natural breathing over an hour or so, one’s sense
of observation becomes sharp enough to experience the body’s sensations which are never
observed otherwise in any form of yoga, meditation, chanting, prayer or satsang. From here, the
discovery begins. These sensations are basically the scientific reality of our body. These are caused
by atoms with which body (matter) is made of. Each of these atoms is rising and dying at a pace of
10^21 times in 1 second and this “Bhav’ of evolution is what makes us feel sensations. Each atom at
its surface is made of 5 elements i.e. earth, fire, air, water and space and hence these 5 elements are
dviceSense WEALTH MANAGEMENT SIMPLY ETHICAL
constantly rising and dying with in us in various proportions depending upon what we eat, in what
conditions we live and what contents we are carrying. This is the foremost and basic awareness that
one gets to experience within one-self as a result of first 2 days of Vipassana experience.
After 3rd and 4th or 5th day of practice, one starts to experience the innate nature and structure of
each atom, beneath its outside surface, where lies the mind (soul) in it. Hence, we say there lies a
consciousness in each atom. With experience, one understands mind (soul) is made of 4 parts –
“Consciousness, Intellect, Vedana and Sanskara” and this is the structure, technology or innate
natural mechanism on the basis of which each atom is functioning. Our consciousness “gets to
know things”, Intellect “gets to understands them”, Vedana “feels and “We react ”. Sanskara, the 4rth
part of Mind “records the “overall experience”. Mind (Soul), which we know is immortal captures
these experiences over many past life times, and this leads a building of a deep and strong behaviour
pattern. The instant reaction mechanism, fears, instincts that we find in us today is the result of all
past experiences that are recorded (sansakara) in our mind and we carrying from one life to another.
Over thousands of life times, it has become very strong. Hence, one is naturally getting pulled to 5
evils - lust, anger, greed, attachment and ego.
As such, the 10 days Vipassana retreat that I attended are designed to reduce distractions and
provide conducive environment to experience the true nature and functioning of one’s body and
mind. For 10 days, you agree to live in complete silence, called Noble Silence, along with strangers
with whom you cannot even make eye contact. Predictably, men and women are completely
separated. You must handover your phone, valuables, and you are not allowed to read, write, or
exercise (even yoga is prohibited!). You must adhere to a vegetarian diet, you’re offered two meals -
BF and Lunch ( sorry no dinner ), a rigorous timetable, day begins at 4 am, you meditate for 120 hours
over 10 days.
After 7 Days of being in Vipassana, one gets to see within one self the hidden reasons responsible for
our fears, thoughts, miseries, reactions, and happiness by experiencing the innate nature of our
mind. 8th and 9th day starts the glimpses of wisdom from within i.e. “We have evolved after taking
many forms to reach the stage of human being”. We need to break old Sanskaras of Cravings and
Aversions that our mind ( soul) is carrying to experience the next stages of evolution. Unless we
break our old behaviour pattern of cravings and aversions, it’s an on-going chakra; unware living and
constant pains in various forms of life times.
While in Vipassana, as soon, one sees the urge to bring in a change emerging within, dharma, our
innate technology throws an instant blissful sensation – and craving goes – away at that moment.
So, regular practice thus is said to the tool to get rid of old Sanskaras, which is the key to break the
cycle of birth and death to reach the next stage of evolution, Nirvana.
Rewind :- Because, each atom (body matter) is in constant state of “bhav “ meaning sensations
rising and dying, each craving ( felt by body sensations ) is also in a constant bhav, rising and dying
constantly. The urge to control cravings arise from Awareness ( with self-experience ), and as a result
of this awareness, Mind (soul) which is deep inside structure of each atom throws a pure blissful
sensation to the outside surface of atom; its whole chemistry gets transformed leading to craving
going away, making us Equanimous. It doesn’t just stop here. As craving and aversions was our old
dviceSense WEALTH MANAGEMENT SIMPLY ETHICAL
behaviour, efforts to control this, reverses the direction of energy and creates a new behaviour. As the
collection of old Sanskaras used to resist change, the creation of one new Sanskara (behaviour), now
starts to assist in the process of change. As change is realised, sense of freedem is experience, and
one is filled with Gratitude and Compassion. Once the old contents of mind ( Soul ) begin to get
replaced with new contents of gratitude and compassion, universal power ( whom we know as God ),
holds us and begins to help us in your journey. As a result, life becomes free from fears, compulsive
behaviours, constant cravings, one becomes extremely serene, focussed, confident, sharp
successful and happy.
We were released from Noble Silence on the afternoon of Day 10. Unbelievable, but i didn’t really feel
like talking. What in the world would I say to these men with whom i had been practicing together
without knowing anything about them. For 10 long days, we had silently eaten together, slept in close
quarters, meditated in varying ways, and felt each other’s pains and joys. What words could capture
the depth of my experience. I wish everyone whom I have known experiences this. These were the
thoughts.
‘Hello,’ was the initial simple and meaningful word that came my way. For the first time, I looked
straight into the eyes of my roommate and partner who had sat behind me in the Hall for about 100
hours. As his face relaxed into a smile, I was delighted by his grace.
As each man commented, his voice seemed foreign when he emerged from silence. We were all
initially curious about each other’s retreat experiences. The curiosity shifted to wondering who each
other was in ‘the real world.’ I was heartened to learn that I was in great company. I had been
meditating near strong thinkers who had arrived from very different or distant places for learning this
ultimate wisdom.
I am reminded of many other things that happened in 2018, and amongst all other things, as per the
UN World happiness report released during the year, india ranked 133 on this list of 156 nations
studied behind Pakistan, Bhutan, Bangladesh, and Sri-Lanka. The research report truly mentions
that money and wealth are important factors responsible for happiness, but are not the only
ingredients in the recipe for happiness. Contents of our mind are responsible for our happiness and
not just external conditions. So, What really is keeping even successful and wealthy ones un-happy?
It is the habit pattern of always wanting more and more. The more we are running for more, the more
we are unhappy. Why are we being pulled into the compulsive craving of always wanting more? Why
can’t we pause, get happy with gratitude for the moment for what we have? If we do so, our
efficiencies increase many fold, our happiness increases many fold. The only way out is Awareness,
Equanimity and Gratitude. This is exactly what Vipassana Experience teaches. My experience made
me serene, confident, engaged, and thoughtful. I recommend Vipassana retreat to everyone. This
(free!) experience is very -transformational.
Experienced by: Kamal Manocha
Location: Dhamma Thali, Jaipur
Duration: 23rd Dec 2018 to 3rd Jan 2019
DISCLAIMER
Advice Sense is a brand owned by Hewepro Consultants (P) Ltd which is duly registered company with Association of Mutual Funds of India. Advice Sense provides Investment related services as a distributor of third party Investment Products (shortly referred as ‘investment products’).
Investment products that it deals in are not insured by any governmental agency and are subject to investment risks, including the possible loss of the principal amount invested. Past performance is not indicative of future results, prices/invested sum is subject to market risks which may result in appreciation or depreciation. The ownership of any investment decision(s) shall exclusively vest with the Investor after analysing all possible risk factors and by exercise of his/her/its independent discretion and Advice Sense, shall not be liable or held liable for any consequences thereof.
INVESTONOMICS is a quarterly investment guide and content mentioned herein is intended to be used and must be used for informational purposes only. It is very important to do ones own analysis before making any investment based on ones own personal circumstances. It carries general information for private use of the investor to whom this has been given, and it is not intended as a recommendation of particular financial instruments or strategies and thus it does not provide individually tailored investment advice, and does not take into account the individual investor’s particular financial situation, existing holdings or liabilities, investment knowledge and experience, investment objective and horizon or risk profile and preferences. The investor must particularly ensure the suitability of an investment as regards his/her financial situation, risk profile and investment objectives before investing. The investor bears the risk of losses in connection with any investment.
The information contained does not constitute advice on the tax consequences of making any particular investment decision or strategy. Each investor shall make his/her own appraisal of the tax and other financial merits of his/her investment.
One should take independent financial advice from a professional in connection with, and/or independently research and verify before investing.
Source of data has been mentioned where ever it was available. Also, the data has been complied on the best effort basis.
Investments are subject to market risks. Please read all Scheme Information Documents (SID) /Key Information Memorandum (KIM), addendum issued from time to time and other related documents carefully before investing.
Past performance is not indicative of future returns.
Data Sources
https://www.valueresearchonline.com/
https://www.mutualfundindia.com/
https://www.tradingeconomics.com/
https://www.nseindia.com/
http://www.bseindia.com/
dviceSense WEALTH MANAGEMENT SIMPLY ETHICAL

dviceSense WEALTH MANAGEMENT SIMPLY ETHICAL
We believe that great returns are generated with right investment decisions and commitment & not merely by purchasing of investment products. This is achieved with understanding and maintaining behavioral discipline, so we focus specifically on ‘You’ and operate in a very ‘transparent’ manner so that unbiased consulting takes the front seat, while selling of product(s) takes the back seat.
https://www.advicesense.com