job protection legislation and productivity growth in oecd ...ftp.iza.org/dp3555.pdf · luca...
TRANSCRIPT

IZA DP No. 3555
Job Protection Legislation and Productivity Growthin OECD Countries
Andrea BassaniniLuca NunziataDanielle Venn
DI
SC
US
SI
ON
PA
PE
R S
ER
IE
S
Forschungsinstitutzur Zukunft der ArbeitInstitute for the Studyof Labor
June 2008

Job Protection Legislation and
Productivity Growth in OECD Countries
Andrea Bassanini OECD and ERMES-TEPP, University of Paris 2
Luca Nunziata
University of Padua and IZA
Danielle Venn OECD
Discussion Paper No. 3555 June 2008
IZA
P.O. Box 7240 53072 Bonn
Germany
Phone: +49-228-3894-0 Fax: +49-228-3894-180
E-mail: [email protected]
Any opinions expressed here are those of the author(s) and not those of IZA. Research published in this series may include views on policy, but the institute itself takes no institutional policy positions. The Institute for the Study of Labor (IZA) in Bonn is a local and virtual international research center and a place of communication between science, politics and business. IZA is an independent nonprofit organization supported by Deutsche Post World Net. The center is associated with the University of Bonn and offers a stimulating research environment through its international network, workshops and conferences, data service, project support, research visits and doctoral program. IZA engages in (i) original and internationally competitive research in all fields of labor economics, (ii) development of policy concepts, and (iii) dissemination of research results and concepts to the interested public. IZA Discussion Papers often represent preliminary work and are circulated to encourage discussion. Citation of such a paper should account for its provisional character. A revised version may be available directly from the author.

IZA Discussion Paper No. 3555 June 2008
ABSTRACT
Job Protection Legislation and Productivity Growth in OECD Countries*
This paper examines the impact of employment protection legislation on productivity in the OECD, using annual cross-country aggregate data on the degree of regulations and industry-level data on productivity from 1982 to 2003. We adopt a "difference-in-differences" framework, which exploits likely differences in the productivity effect of dismissal regulations in different industries. Our identifying assumption is that stricter employment protection influences worker or firm behaviour, and thereby productivity, more in industries where the policy is likely to be binding than in other industries. The advantage of this approach is that, in contrast with standard cross-country analysis, we can control for unobserved factors that, on average, are likely to have the same effect on productivity in all industries. Our empirical results suggest that mandatory dismissal regulations have a depressing impact on productivity growth in industries where layoff restrictions are more likely to be binding. We present a large battery of robustness checks, including dealing with endogeneity issues, that suggest that our finding is robust. JEL Classification: J08, J23, J24 Keywords: productivity, EPL, labour market institutions, difference-in-differences Corresponding author: Luca Nunziata Department of Economics University of Padua Via del Santo 33 35121 Padova Italy E-mail: [email protected]
* Preliminary version of a paper prepared for the 48th Panel Meeting of Economic Policy in Paris. The views expressed here cannot be attributed to the OECD or its member countries. We are grateful to Robert Inklaar, Alex Hijzen, Stefano Scarpetta, Marcel Timmer and Bart van Ark for sharing their data with us. We are also grateful to Giuseppe Bertola, Giorgio Brunello, Eve Caroli, Dave Coe, Marco Leonardi, Romain Rancière, Mathias Thoenig, Raymond Torres, Jelle Visser and seminar participants in Bonn (IZA) and Milan (DEAS), for comments on a previous version of this paper, as well as to Jan van Ours for comments on the proposal. All errors remain ours.

DISMISSAL REGULATION AND PRODUCTIVITY
2
1. INTRODUCTION AND OVERVIEW
During the past 15 years, labour productivity growth accounted for at least half of GDP per capita growth in most OECD countries, and a considerably higher proportion in many of them. As the populations of OECD countries age and the proportion of the population of working age falls, continued growth in productivity, along with enhanced participation by demographic groups currently under-represented in the labour market, will be crucial to maintain and improve living standards. As such, the role of policy in promoting or impeding productivity growth is likely to be of increasing importance in the decades to come.
The impact of structural reforms on productivity, such as tax reductions or product market deregulation, has been widely analysed from a theoretical perspective (e.g. Zagler and Durnecker, 2003; Aghion et al., 2001) and has been the subject of a number of recent empirical investigations (e.g. Fölster and Henrekson, 2001; Nicoletti and Scarpetta, 2003). An increasing theoretical interest in the relationship between labour market institutions and productivity or productivity growth has recently manifested in the literature (e.g. Lagos, 2006; Wasmer, 2006). However, the empirical evidence on the impact of labour market policies and institutions on productivity is limited. As a result, structural labour market reforms are typically advocated on the grounds of fostering efficient use of labour resources (e.g. OECD, 2006).
In the case of employment protection legislation (that is, the set of mandatory restrictions governing the recruitment and dismissal of employees – EPL hereafter), however, there is little evidence of an aggregate employment impact (e.g. Nickell et al., 2005). This could explain the burgeoning interest in other effects of EPL, including those on job turnover, firm dynamics and productivity, as a means of justifying reforms in this area on efficiency grounds. Yet, empirically, little is known about the productivity effects of EPL (see for example the June 2007 issue of The Economic Journal Features).
This paper makes a contribution to filling this gap by providing industry-level cross-country/time-series evidence on the impact of EPL on productivity in order to better inform policy action. Most of the existing evidence for OECD countries uses aggregate or semi-aggregate1 regression analysis to examine the relationship between EPL and productivity, with inconclusive results (e.g. Nickell and Layard, 1999). Using aggregate cross-country/time-series data makes it possible to exploit the large variation in policies across countries and over time and examine general equilibrium effects. Yet, a key problem with aggregate analysis is that it is difficult to control for an exhaustive list of confounding factors. We circumvent this problem by exploiting the fact that cross-country comparable time-series data on productivity are available at the industry level and that, while EPL is defined at the aggregate level, its impact is likely to differ across
1 By semi-aggregate analyses we refer to studies such as Autor et al. (2007), where, despite the use of firm-level data, the source of policy variation remains aggregate and the effect of policies is identified through cross-country (cross-state) and time-series variation only.
DISMISSAL REGULATION AND PRODUCTIVITY
3
industries. Within this context we use a difference-in-difference strategy in the spirit of Rajan and Zingales (1998).
The basic premise is that EPL is more likely to be binding in some industries than others. Therefore, if EPL has an impact on productivity, it will be greater in these so-called EPL-binding industries. For example, reforms of dismissal regulations are likely to have a greater impact on productivity in industries where, in the absence of regulations, firms rely on layoffs to make staffing changes, rather than in industries where internal labour markets or voluntary turnover are more important. We can use these other industries as a control group for EPL-binding industries. In following this strategy, we will at worst underestimate the true effect of EPL on productivity growth.
The paper is structured as follows. Section 2 briefly describes the diversity and evolution of EPL across OECD countries, highlights recent cross-country productivity growth patterns and discusses previous literature on the link between EPL and productivity growth. Section 3 presents the data and discusses the empirical set-up. Section 4 presents the results, focusing mainly on the impact of dismissal regulations on productivity, along with several extensions, including the effect of hiring regulations, and a battery of robustness checks, including dealing with endogeneity issues. Section 5 discusses policy implications supported by the results.
2. BASIC FACTS AND PREVIOUS LITERATURE
2.1. Cross-country trends in job protection and productivity growth
2.1.1. Employment protection legislation
Employment or job protection usually refers to the rules governing hiring and firing employees. In general, regular employment contracts do not specify the duration of the employment relationship. Employment protection regulations for regular contracts typically define conditions for termination of employment. In particular, they set conditions under which it is possible to lay off an employee (fair dismissal) and the sanctions in the case of breach of these provisions (unfair dismissal).2 These regulations also detail the procedures that should be followed in the case of individual dismissal, which might include provisions for notice periods, involvement of third parties (such as courts, labour inspectorates, works’ councils, etc.) as well as procedures for the employee to challenge the layoff decision. Finally, these regulations specify monetary compensations employees are entitled to, once dismissed (severance payments). Additional provisions exist in all OECD countries in the case of collective dismissals and typically include additional procedural inconveniences for the employer.
2 For instance, in the US private sector, the “employment-at-will” principle implies that it is usually fair to terminate an open-ended employment relationship without justification or explanation, unless in the case of discriminatory dismissal, explicit restrictions on terminations specified in the employment contract, or implicit long-term relationship implied by the nature of the job (such as a job related to a specific construction project like a bridge, a road, etc.). By contrast, in many continental European countries, dismissals for economic reasons are unfair if the employee could have been retained in another capacity.

DISMISSAL REGULATION AND PRODUCTIVITY
4
Employment protection regulations also outline conditions under which workers can be hired on fixed-term or other types of contracts (such as seasonal contracts or project-related contracts). These rules usually concern the type of jobs and activities in which these contracts are allowed, their maximum duration, conditions for their renewal or termination of the employment relationship and possible employee compensation in the case termination (see OECD, 2004, for a detailed description of employment protection regulations in OECD countries).
Employment protection regulations may be specified in legislation, collective agreements or individual employment contracts. Their operation in practice depends also on the interpretation of rules by courts or tribunals and the effectiveness of enforcement, which might vary over time and be influenced by external conditions such as the state of the economy (see e.g. Ichino et al., 2003). However, there is little systematic information on average provisions specified in individual contracts and collective agreements in many OECD countries. With few exceptions, information on enforcement is similarly scattered. Therefore, cross-country comparable quantitative measures of the degree of stringency of employment protection that are available in the literature are essentially limited to mandatory legislative restrictions governing recruitments and dismissals – that is to employment protection legislation (EPL).
In this paper, we quantify the degree of stringency of EPL by using three OECD indicators (OECD, 2004). The index for regular employment (referred to herein as EPLR) refers to individual dismissals and incorporates notification procedures, delays before the notice period can start, the length of the notice period and size of severance payments (both by duration of employment), the circumstances in which a dismissal is considered unfair, and compensation and extent of reinstatement following unfair dismissal. The index for temporary contracts (referred to herein as EPLT) incorporates restrictions on the number of contract renewals and maximum cumulated duration of fixed-term and temporary work agency contracts, as well as the circumstances under which temporary contracts can be used. The index on additional legislation concerning collective dismissals (referred to herein as EPLC) incorporates the definition of, and additional notification requirements for, collective dismissals, delays before the notice period for collective dismissal can start and other costs to employers, such as additional severance payments, retraining or redeployment of redundant workers. The scale of all indicators is 0-6 from least to most restrictive. Table A1 in Appendix 1 provides the scoring procedure and aggregation weights used to construct each index. Similar to other measures available in the literature, these indices generally measure legislative requirements, rather than their operation in practice, although judicial interpretation is incorporated to a limited extent (e.g. components measuring compensation and extent of reinstatement in the event of unfair dismissal take into account courts’ decisions where

DISMISSAL REGULATION AND PRODUCTIVITY
5
this information is available). Dismissal regulations operating through collective agreements or individual contracts are not incorporated into the indices.3
There is considerable variation in the stringency of EPL across OECD countries (Figure 1). Countries where EPL is particularly strict, such as France and Spain, generally have stringent regulations both on dismissals and on the use of temporary forms of employment. In contrast, in the United Kingdom and the United States there is very little regulation on either individual dismissal of regular workers or the use of temporary contracts. This does not mean, however, that the two types of regulations tend to have the same degree of stringency in all countries. In a number of Eastern European countries and the Netherlands, for example, a degree of flexibility close to the OECD average is obtained by allowing a relatively free use of temporary contracts in a legislative framework where dismissals are relatively difficult. There is also considerably less cross-country variation in the stringency of regulation on collective dismissals, and the inclusion of these additional provisions does not alter significantly the ranking of countries as regards the strictness of dismissal legislation.
0.0
0.5
1.0
1.5
2.0
2.5
3.0
3.5
4.0
Aus
tralia
Aus
tria
Belgium
Can
ada
Cze
ch Repu
blic
Denm
ark
Finland
Franc
e
German
y
Greece
Hun
gary
Irelan
d
Italy
Japa
n
Korea
Mex
ico
Nethe
rlands
New
Zea
land
Norw
ay
Polan
d
Portugal
Slova
k Repu
blic
Spa
in
Swed
en
Switzerland
Turke
y
Unite
d Kingd
om
United States
S c ale 0‐6
L egis lation on temporary forms of employment
Additional requirements for collective dismissal
L egis lation on (individual) dismissal of regular workers
Figure 1. Summary index of EPL strictness and its components, including special provisions for collective dismissals, 2003 Notes: The summary index is a weighted average of indicators on regulation for temporary employment and for individual dismissals (with a weight of 5/12 each) and the indicator of additional requirements for collective dismissals (with a weight of 2/12). The chart presents the product of indicators and their weight, in such a way that column total height represents the summary index.
Source: OECD (2004)
3 The lack of information on collective agreements, individual contracts and, to some extent, judicial interpretations represents a limitation of the analysis that is undertaken in this paper, which must be acknowledged. However, to the extent that, collective bargaining, contracts and judicial interpretation are more affected by economic conditions than legislation, the use of indicators based on legislation only will reduce the risk of endogeneity in our analysis.

DISMISSAL REGULATION AND PRODUCTIVITY
6
Many countries have enacted legislation to reform their labour markets, including
relaxation of employment protection provisions (Figure 2). Only a handful of countries have implemented reforms increasing job protection, and in most cases starting from relatively lax regulations. However, countries have chosen different routes to reform. Few countries have concentrated on regular employment contracts, while most of the reform action has fallen on rules for temporary contracts, whose liberalisation typically raises less political opposition. There is no systematic information on rules for collective dismissals prior to 1998, so, following common practice, these are excluded from the time-series presented in Figure 2. Yet, scattered available information suggests that they have probably changed even less, on average, than regulations for individual dismissals (OECD, 2004).
‐2.0
‐1.5
‐1.0
‐0.5
0.0
0.5
1.0
Aus
tralia
Aus
tria
Belgium
Can
ada
Den
mark
Finland
Franc
e
German
y
Greec
e
Irelan
d
Italy
Japa
n
Nethe
rland
s
New Zea
land
Norway
Portuga
l
Spain
Swede
n
Switzerland
United Kingd
om
United States
S c ale 0‐6
C hange in leg is lation on temporary forms of employment
C hange in leg is lation on (individual) dismissal of regular workers
C hange in overall E P L s trictness
Figure 2. Changes in indices of EPL strictness, excluding special provisions for collective dismissals, 1982-2003 Notes: The summary index, which excludes additional provisions for collective dismissals, is an average of indicators on regulation for temporary employment and for individual dismissals, with a weight of one half each. The chart presents the product of indicators and their weight, in such a way that, except when reforms of regular and temporary contracts went in opposite directions, column total height corresponds to the change of the summary index.
Source: Authors’ calculations from OECD (2004). The chart includes only countries where data for 1982 and 2003 are available
2.1.2. Productivity growth
With a standard deviation as high as 0.9 percentage points in the past two decades, the cross-country variation of annual GDP per capita growth in the OECD area is remarkable (see Figure 3). GDP per capita growth can be decomposed into changes in

DISMISSAL REGULATION AND PRODUCTIVITY
7
hours worked per capita – that is, the contribution of total employment and demographic factors – and the growth of GDP per hour worked – commonly referred to as labour productivity. In a standard growth accounting framework, the latter can be decomposed further into the contributions of i) changes in the quality and composition of labour; ii) capital accumulation; and iii) an unexplained residual. The residual of this decomposition is commonly called aggregate total factor productivity (TFP) growth. TFP growth, in principle, captures all efficiency improvements (notably technological change) that increase output for a given amount of labour and capital inputs. Long-lasting differences in TFP growth across countries will be reflected, in the long-run, in differences in living standards.
In this paper, we will focus on TFP growth. Although on average capital service growth is the greatest contributor to GDP per capita (and labour productivity), Figure 3 shows that most of the cross-country variation in GDP per capita growth can be attributed to the variation of TFP growth across countries. The cross-country standard deviation of the latter is, in fact, twice as large as that of the contribution of capital services to GDP per capita growth. In other words, the cross-country variation in growth performance can mainly be attributed to cross-country differences in TFP growth. This basic fact motivates our interest in the role of country-specific institutions, and more specifically EPL, in determining cross-country differences in TFP growth.
‐2
‐1
0
1
2
3
4
5
6
German
y
Franc
e
Cze
ch Rep
ublic
Belgium Italy
Den
mark
United States
Nethe
rland
s
Aus
tria
Finland
Japa
n
United Kingd
om
Swed
en
Spa
in
Polan
d
Hun
gary
%
TFP Hours per capita L abour compos ition C apital services GDP per capita
Figure 3. Annual average GDP per capita growth and contribution of its components, 1982-2003 Notes: The figure shows the contribution of different components to GDP per capita growth (in percentage points). Data cover only 1985-2003 for Belgium, 1991-2003 for Germany, 1993-2003 for Sweden, 1995-2003 for the Czech Republic, Hungary and Poland.

DISMISSAL REGULATION AND PRODUCTIVITY
8
Source: Authors’ calculations from EUKLEMS, March 2007 public release.
As TFP growth is defined as the residual portion of output growth after accounting for growth in capital and labour, it will have a different meaning depending on the measure of capital inputs used. One method consists of deflating capital assets using quality-adjusted price indices and aggregating them using the user costs of each asset as weights, obtaining what is commonly called “aggregate capital services”. This is the method used in Figure 3. In this case, the corresponding TFP growth measure captures disembodied technological and organisational improvements (innovations) that increase output for a given quantity and quality of inputs. Jorgenson (1966) argues that this is the only identifiable component of technological progress. We will call this measure “fully-adjusted” TFP growth. Alternatively, a common method, often chosen in the literature for feasibility reasons (e.g. Nicoletti and Scarpetta, 2003; Griffith et al., 2004), is to equate capital inputs to productive capital stocks, deflated at real acquisition prices and aggregated using nominal asset shares. Under certain restrictive assumptions, TFP growth computed with this method also captures the adoption of new, higher-quality technologies, being therefore a proxy for total (embodied and disembodied) technological change (see Bassanini and Scarpetta, 2002, for a more detailed discussion). We will call this measure “broadly-defined” TFP growth. Not surprisingly, the choice of the measure matters: in certain countries “broadly-defined” average TFP growth can be more than twice as large as “fully-adjusted” TFP growth (Figure 4).4 To the extent that “fully-adjusted” TFP growth can be more precisely identified and interpreted under more general assumptions, most of the analysis of this paper will be based on “fully-adjusted” TFP. However, as we will see, much can be learnt by comparing the two measures.
0.0
0.5
1.0
1.5
2.0
2.5
3.0
S pain Ita
ly
Denmark
Germany
Belgium
Netherlands
United K ingdom
F rance
United S tates
Austria
F inland
%
Broadly‐defined TFP Fully‐adjus ted TF P
Figure 4. Different measures of average business-sector TFP growth, 1982-2003 Notes: The figure shows unweighted averages of business-sector TFP growth rates in percentage. Industries considered are those in Table A3 plus agriculture, mining, business services and social and personal services.
4 The extent of the adjustment of “fully-adjusted” TFP, however, depends on the available level of disaggregation of capital assets. In international comparisons, such as those in Figures 3 and 4, the number of assets considered is relatively small. This implies that embodied technological change is not thoroughly netted out of “fully-adjusted” TFP.

DISMISSAL REGULATION AND PRODUCTIVITY
9
Source: Authors’ calculations from Inklaar et al. (2008).
2.2. EPL and productivity: theory and previous empirical evidence
How does EPL affect economic performance, in general, and productivity, in particular? From an historical point of view, EPL was typically designed to protect jobs and increase job stability, by reducing job destructions. As suggested by Pissarides (2001) among others, firing restrictions may be rationalised in the presence of financial market imperfections which limit the ability of risk-averse workers to get insurance against dismissal. However, by imposing implicit and explicit costs on the firm’s ability to adjust its workforce to optimal levels, inefficient statutory dismissal protection may inhibit efficient job separations and, indirectly, reduce efficient job creation (e.g. Mortensen and Pissarides, 1994). In principle, inefficiencies implied by job security provisions could be offset by wage adjustments, private payments or the design of efficient contracts (Lazear, 1990). However, wage rigidities, financial market imperfections or uncertainty about the future of the firm may prevent these channels from operating. Nickell (1978), Bentolila and Bertola (1990) and Bertola (1990) describe firms’ dynamic behavior in presence of positive firing costs, showing that the optimal strategy for firms is to reduce both hirings and firings, with an ambiguous effect on average employment over the business cycle. Anyway, stricter employment protection implies a slower speed of adjustment towards equilibrium. Labour markets equilibrium models such as Garibaldi (1998) and Mortensen and Pissarides (1999) come to similar conclusions about job mobility being negatively affected by EPL.
The impact of EPL on the technical efficiency of production is less clear cut. The theoretical literature focuses almost exclusively on the role of dismissal restrictions, with little attention given to rules for temporary contracts. Stringent layoff regulations increase the cost of firing workers, thereby reducing the productivity threshold at which firms are willing to lay off workers. In addition, they make firms reluctant to hire new workers if they expect to make significant employment changes in the future. As such, EPL is likely to make it more difficult for firms to react quickly to rapid changes in technology or product demand that require reallocation of staff or downsizing, slowing the flow of labour resources into emerging high productivity firms, industries or activities. Under a general equilibrium framework, Hopenhayn and Rogerson (1993) show how the distortion induced by firing restrictions pushes firms to use resources less efficiently. As a result, employment levels adjust at a lower speed and productivity is reduced. Bertola (1994) presents a growth model where job security provisions decrease returns to investment and capital accumulation. Samaniego (2006) emphasises the role played by industry composition. In a vintage capital model firms optimally reduce their workforce as they fall behind the technological frontier. As a consequence, firing restrictions are more costly in industries characterised by rapid technological change such as ICT. Countries where regulations are more stringent will therefore tend to specialise in industries where the rate of technical change is sluggish. Finally, Poschke

DISMISSAL REGULATION AND PRODUCTIVITY
10
(2007) emphasises the role of firing costs in the selection of the most efficient firms and the exit decision of low productivity firms, if exiting firms cannot avoid paying them.
Another channel through which EPL may affect productivity is by influencing the risk level that firms are willing to endure. Saint-Paul (2002) argues that high firing costs may induce secondary innovation that improves existing products rather than introducing riskier ones. Similarly, Bartelsman et al. (2004) suggest that stringent layoff regulations might discourage firms from experimenting with new technologies, characterised by higher mean returns but also higher variance, in order to avoid the risk of paying high firing costs. They provide some suggestive evidence consistent with this hypothesis by showing that the dispersion of productivity of young businesses and of businesses that actively change their technology is wider in the United States than in Germany.
Layoff protection might also affect productivity by reducing worker effort because there is less threat of layoff in response to poor work performance or absenteeism. Ichino and Riphahn (2005) provide an empirical estimate of this effect on a sample of Italian white collar workers, showing that the increase in job security represented by the end of the probation period induces a significant increase in absenteeism. Similar findings are obtained by Riphahn (2004) using German data.
On the other hand, as argued by Koeniger (2005), layoff regulations could spur productivity-enhancing investments by incumbent firms in order to avoid downsizing. The net effect on aggregate innovation is however unclear, as strict regulations may also deter entry of innovative firms. Belot et al. (2007) propose a framework where, by providing additional job security, protection against dismissal may increase workers’ incentives to invest in firm-specific human capital, therefore enhancing productivity. However, there is a trade-off between the positive effects induced by this channel and the costs implied by firing costs at separations. As a consequence, it is possible to identify a strictly positive optimal level of employment protection which may depend on other institutions regulating wage rigidity and redistributive patterns. Under this framework, the gain from labour market deregulation may be larger for stricter levels of EPL. Similar considerations are suggested by Soskice (1997) and Hall and Soskice (2001) when comparing innovation patterns in Germany with those in the United Kingdom and the United States. While Germany mainly specialises in incremental innovation, the United Kingdom and the United States specialise in emerging radically new technologies. These two models require different types of labour market regulations, with stable and cooperative relationships between employers and employees being functional to the incremental path. Haucap and Wey (2004) provide analogous policy implications when discussing the effects of wage-bargaining regimes on innovation, suggesting a potential policy trade-off between high employment and productivity when designing labour market institutions. Nevertheless, as suggested by Wasmer (2006), by inducing substitution of specific for general skills, firing restrictions may have a negative effect on productivity in the presence of major shocks, when workers need to be reallocated across industries, thereby making industry-specific skills useless. Finally, if stringent EPL raises reservation wages, average productivity can

DISMISSAL REGULATION AND PRODUCTIVITY
11
increase simply because firms become more selective and less productive matches are not realised (Lagos, 2006).
The effects of changes in EPL on productivity may vary according to the specific dimension targeted by labour reforms. For example, Boeri and Garibaldi (2007) provide a dynamic labour demand model where reforms at the margin, such as those undertaken in many European countries in recent decades, have only a temporary effect on employment and productivity. Dolado et al. (2007) show instead how the effect of EPL reforms may vary according to the specific type of worker they are targeted at.
Looking at the empirical literature, the existing evidence on the relationship between EPL and productivity growth is mainly based on aggregate data and is not conclusive. For example, DeFreitas and Marshall (1998) find that strict EPL has a negative impact on labour productivity growth in the manufacturing industries of a sample of Latin American and Asian countries. On the other hand, Nickell and Layard (1999) and Koeniger (2005) find a weak positive relationship between EPL strictness and TFP growth and R&D intensity, respectively, for samples of OECD countries.
As far as we know, only three studies go beyond country-level data. Autor et al. (2007) study the impact of adoption of wrongful-discharge protection norms by state courts in the United States on several performance variables constructed using establishment-level data. By using cross-state differences in the timing of adopting stricter job security provisions, they find that capital deepening is increased while employment flows, firm entry and TFP are reduced. However, they do not control for other possible institutional factors (state minimum wages, experience rating systems, etc.) that might have had a simultaneous effect on productivity. Similar findings are provided by Cingano et al. (2008) using Italian data to examine a 1990 reform that raised dismissal costs for firms with fewer than 15 employees only. In a study on EPL and job flows, Micco and Pages (2006) provide also some weak evidence of a relationship between EPL and productivity, using a difference-in-differences estimator on a cross-section of industry-level data for several OECD and non-OECD countries. They find a negative relationship between layoff costs and the level of labour productivity – albeit dependent on the presence of Nigeria in the sample. However, they cannot control for the effect of previous EPL levels, which might have an impact on productivity levels if dismissal regulations affect long-run productivity growth beside any direct effect on levels, as theory seems to suggest. While not looking at productivity directly, many studies provide evidence on the
channels through which EPL may affect it. There is a lot of evidence on the effect of EPL on job flows. Using Italian firm-level data, Boeri and Jimeno (2005) exploit exemption clauses exonerating small firms from job security provisions within a difference-in-differences approach. Their estimates confirm a significant effect of EPL on job turnover and job destruction in particular. Similar findings are obtained by Schivardi and Torrini (2008), using an Italian matched employer-employees dataset, by Haltiwanger et al. (2006) and Micco and Pages (2006), on samples of 16 and 18 countries, respectively, and by Kugler and Pica (2008), who exploit the 1990 reform in Italy increasing firing restrictions for small firms. On the contrary, Bauer et al. (2007) do

DISMISSAL REGULATION AND PRODUCTIVITY
12
not find any significant effect of EPL on turnover using German matched employer-employees data. Finally, Messina and Vallanti (2007) find that EPL significantly dampens job destruction over the cycle with mild effects on job creation. The negative impact of EPL on job turnover, job creation and job destruction is found to be larger in industries where total employment is contracting and where firms cannot achieve substantial reductions in employment levels by purely relying on voluntary quits.
There is some support for the argument that EPL slows the speed of labour adjustment into new high-productivity industries. Burgess et al. (2000) examine the relationship between EPL and the dynamics of output and employment, controlling for industry effects. They find that countries with stricter regulations have slower rates of adjustment of productivity to long run levels. Similarly, Caballero et al. (2004) confirm a significant role of EPL in affecting the adjustment speed of employment in the presence of shocks using a cross-section of industry data for several countries. Using a growth model with constant returns to physical capital and diminishing returns to labour, they compute the implied effect on labour productivity, which they find large, especially in countries with strong rule of law. By contrast, they find only a minor effect on TFP.
Finally, analysing firm level data collected from 46 developing countries, Pierre and Scarpetta (2006) provide some empirical evidence showing that innovative firms are the most negatively affected by stringent EPL.
3. RESEARCH METHOD AND DATA
3.1. Empirical framework
As discussed in the previous section, the theoretical literature on the potential impact of job protection regulations on efficiency levels and productivity growth focuses mainly on the effects of dismissal regulations. We will therefore focus most of our analysis on these types of regulations, quantified by the index of employment protection legislation for individual dismissal of workers with regular contracts (EPLR). We will extend it to hiring and other regulations for temporary jobs (EPLT) in later sections.
In order to identify the effect of dismissal regulations on productivity we adopt a difference-in-differences type of approach. We assume that the effect of EPLR is larger in industries where dismissal regulations are more binding (let us call these industries EPL-binding industries hereafter), which in turn are likely to be those industries that have a relatively high “natural” propensity to adjust their human resources through layoffs, due industry-idiosyncratic technological and market-driven factors.5 For example, consider industries where firms need to lay off workers in order to restructure their operations in response to changes in technologies or product demand and/or in
5 Cross-country comparisons of data on job turnover (Haltiwanger et al. (2006); Micco and Pages (2006)) and layoffs (Table A3 in Appendix 1 of this paper) show that there is little cross-country variability in the ranking of industries according to their propensity to adjust on the external labour market, suggesting that country-invariant industry-specific factors shape this propensity. These factors could include technological characteristics of production processes, the type of knowledge management required by innovation and production activities and the dynamics of the global demand for the industry.

DISMISSAL REGULATION AND PRODUCTIVITY
13
response to the failure of risky innovative ventures. In this case high firing costs are likely to distort efficient resource reallocation and/or discourage firms from undertaking risky projects. In contrast, in industries where firms can restructure through internal adjustments or by relying on natural attrition of staff, dismissal regulations can be expected to have little impact on labour reallocation, and therefore on productivity levels, and/or incentives to innovate. In the simplest version of our difference-in-differences approach, differences in average TFP growth between EPL-binding and non-binding industries in any country at any point in time can therefore be expressed as a function of the level of and/or changes in EPLR (see Box 1). The main advantage of this approach is that, in contrast with standard aggregate analysis, we can control for all unobserved factors that are unlikely to have different effects, on average, on productivity in EPL-binding and other industries.
In practice, however, it is unlikely that firing restrictions are either always binding or always not binding in a particular industry. Rather, whether and to what extent they are binding depends on the costs they impose on firms. These costs will be higher, the larger the firms’ natural propensity to adjust through layoffs. To put it another way, if dismissal regulations have an effect on productivity, it is likely that that effect will be greater, the larger the natural layoff propensity of an industry. In the spirit of Rajan and Zingales (1998), we can therefore consider a slightly more sophisticated identification assumption, which still retains the advantages of the simplest difference-in-differences approach: we posit that, on average, the difference in TFP growth between any two industries in any country at any point in time can be expressed as a function of EPLR (and/or its change) multiplied by the difference between the layoff propensities of the two industries (see Box 1).
Box 1: Empirical specifications
In the simplest difference-in-differences approach, we assume that industries can be split into two groups – EPL-binding (b) and other (nb) industries and that the expected difference in TFP growth between the two groups can be modelled as a function f of EPLR and its change:
),(loglog 1 ititnb
itb
it EPLREPLRfTFPTFPE Δ=⎥⎦⎤
⎢⎣⎡ Δ−Δ − [1]
where EPLR varies along the country i and the time t dimensions, while the bar indicates an average over groups of industries and E stands for expectation. If we assume that f is linear in EPLR and ΔEPLR, we can estimate the following linear regression model consistent with equation [1] (see Appendix 2 for the derivation):
ijtitjitbjitbjijt DDEPLRIEPLRITFP εγβ +++Δ+=Δ −1log [2]

DISMISSAL REGULATION AND PRODUCTIVITY
14
where Ib is the indicator function of the set of industries j where EPL is binding (a function equal to 1 in these industries and 0 elsewhere), D stands for industry or country-by-time fixed effects (with respective dimensions indicated by subscripts), β and γ capture the effect of EPLR on TFP growth rate and level, respectively, and εs are standard disturbances. Note that, in equation [2], country-by-time dummies control for all aggregate effects, including the average effect of EPLR and ΔEPLR. In a more general version of the same model, we specify that the difference in TFP growth between any pair of industries is equal, in expected terms, to a function of EPLR and its change multiplied by a function g of the difference between the layoff propensities of the two industries. It is in fact more plausible that, rather than being entirely binding or entirely non-binding, the extent to which EPL is binding in an industry depends on the frequency at which firms in the industry would adjust human resources through layoffs in the absence of regulations. Formally this is equivalent to:
))(),((]loglog[ 1 hkithkitihtikt gEPLRgEPLRfTFPTFPE Λ−ΛΔΛ−Λ=Δ−Δ −
where (k, h) indexes the pair of industries and Λ captures the industry propensity to lay workers off. The simplest possible functional form that we can assume for g is the identity function (g(x) = x), in the spirit of Rajan and Zingales (1998). This implies that the linear regression model [2] becomes:
ijtitjitjitjijt DDEPLREPLRTFP εγβ +++ΔΛ+Λ=Δ −1log [2’]
Equations [2] and [2’] can be augmented with specific control variables. In particular, the Schumpeterian growth literature suggests that appropriate models of productivity growth at the industry (or firm) level should include, as explanatory variables, the productivity growth of the industry productivity leader as well as the productivity gap (in level terms) between each observation and the industry productivity leader (Aghion and Howitt, 2006; Griffith et al., 2004). This implies generalising previous models as:
ijtitjitjitj
ijtFjtijtijt
DDEPLREPLR
RTFPTFPTFP
εγβ
φψ
+++ΔΦ+Φ+
+−Δ=Δ
−
−
1
1
logloglog [3]
where RTFP denotes the ratio between TFP in industry j, country i and time t and the world productivity frontier for that industry, denoted with F, while Φ is either Ib or Λ – that is the industry classifier, be it dichotomous or quantitative. The coefficient of frontier TFP growth ψijt is assumed to be equal to a constant to be estimated, except for the industry productivity leader (for which it is constrained to be 0, see Appendix 2). Industries are, however, in different stages of their life-cycle and exposed to different global demand dynamics. For instance, ICT-producing industries have experienced substantially faster-than-average productivity growth in most countries in recent years. In order to control for these developments, we include industry-by-time dummies in our preferred specifications. The general model we estimate can therefore be written as:
ijtitjtijt
itjitjijtijt
DDX
EPLREPLRRTFPTFP
εδ
γβφ
++++
+ΔΦ+Φ+−=Δ −−
loglog 11 [4]
DISMISSAL REGULATION AND PRODUCTIVITY
15
where X is for a vector of other control variables that may or may not be included in different specifications. It is important to notice here that, in contrast with equation [3], the growth rate of the industry productivity frontier is not included in equation [4]. In fact, being almost perfectly collinear with industry-by-time dummies, its effect cannot be identified, although it is, by and large, controlled for by these dummies. The main advantage of our approach is that, in contrast with standard aggregate regression analysis, by including country-by-time dummies, we control for all unobserved aggregate institutions that are unlikely to have different effects, on average, on productivity in EPL-binding and other industries, or, more precisely, whose effects are unlikely to be greater the greater the industry layoff propensity. To our knowledge, only Micco and Pages (2006) have applied a similar methodology, although to labour productivity data only. However, lacking the time dimension in their data, they identify the effect of EPL using productivity levels rather than growth rates. Yet, if EPL has an impact on TFP growth, beside an effect on efficiency levels – a possibility suggested by a few theoretical papers (see section 2.2 above) – TFP levels are determined not only by current dismissal regulations, but also by regulations that were prevailing in the past. In a specification in levels, the impact of pre-sample EPL on TFP levels is unlikely to be captured by country dummies, since it is plausibly greater in EPL-binding industries. Therefore, an identification strategy based on TFP growth (that is, in first differences), which we follow, appears more cautious. Given the limited time series variation in the indicators of EPLR (see section 2.1 above), one limitation of our approach is that it is difficult to obtain a precise estimate of the effect of ΔEPLR in equation [4]. In other words, one can argue that equation [4] is likely to lead to reliable estimates of β only, while little can be said about γ. A key issue is how to interpret a significant estimate of β in [4] in the light of theory. Following the difference-in-differences logic outlined above, one would be tempted to interpret it as providing evidence that dismissal regulations have a long-run impact on productivity growth. While this interpretation is possible, there are at least two reasons why the estimated coefficient might reflect a direct impact on productivity levels – that is an effect that is not simply due to the impact of EPLR on long-run growth. First, level effects might materialise with some time after a reform, so that they might not be captured by γ in an equation specified in relatively short differences. Second, as suggested by equations [3] and [4], post-reform adjustment towards a new equilibrium might be slow. A reform affecting relative efficiency levels with respect to the productivity frontier might have a temporary effect on growth rates for many years without necessarily having a permanent growth effect. The conclusion is that, while a significant estimate of β suggests a significant effect of EPLR on TFP, one needs to look at other pieces of evidence to try to disentangle whether this reflects long-term growth or level effects, or both.

DISMISSAL REGULATION AND PRODUCTIVITY
16
3.2. Data
We use two closely related sources of data for TFP growth. Our main data source is the dataset used by Inklaar et al. (2008), which is derived from the consortium-only version of the March 2007 release of the EUKLEMS database and contains various measures of annual TFP growth and relative TFP levels with respect to the frontier for 11 OECD countries (Austria, Belgium, Denmark, Finland, France, Germany, Italy, the Netherlands, Spain, the United Kingdom, the United States) over a period of about 25 years. More specifically, this dataset contains measures of both “fully-adjusted” and “broadly-defined” TFP for a number of manufacturing and non-manufacturing industries at a slightly more aggregate level than two-digits of the ISIC Rev. 3 classification. The second source of data is the public version of the March 2007 release of the EUKLEMS database, which contains industry-level data on “fully-adjusted” TFP growth for 16 OECD countries (those listed above, plus the Czech Republic, Hungary, Japan, Poland and Sweden), as well as data on value added, capital service growth, employment, hours worked and labour composition by skills, age and gender that we use in certain specifications. As no data on TFP level are available in the public release of EUKLEMS, we use TFP data from Inklaar et al. (2008) in most of the analysis. However, to increase country coverage, we re-estimate using the public release of EUKLEMS all our specifications, which do not include a distance-to-frontier term.6
In our baseline specifications we use industry-level US layoff rates – defined as the percentage ratio of annual layoffs to total employment – as a proxy for underlying layoff propensity in the absence of EPL. The United States appears a natural benchmark in this regard because dismissal regulations are very light in comparison with other OECD countries (the EPLR index is close to zero in the United States, see Figure 1 above). Industry classifiers based on layoff rates are likely to be more appropriate than those based on gross job turnover rates (sometimes used in the literature) insofar as we focus on dismissal regulations.7 This is because gross job turnover rates tend to be larger in expanding industries characterised by a high share of hires in total turnover (such as many service industries) and in industries that usually rely on voluntary quits rather than layoffs to adjust their human resources (such as hotels and restaurants or retail trade). Nevertheless, we use job turnover rates in a sensitivity analysis and to study the effect of regulations for temporary employment.
We compute layoff rates from the 2004 CPS Displaced Workers Supplement (covering layoffs in 2001-2003). We use the 2004 CPS because it is the only wave with an industry classification that can be matched, at a sufficiently disaggregated level, to the ISIC classification that we use in our analysis.8 We develop two baseline measures of industry layoff propensity: (i) a “quantitative” indicator equal to the average industry layoff rate in the three years for which data are available (2001-2003); and (ii) a “qualitative” indicator, in which EPL-binding industries are identified as those with layoff rate above
6 In the remainder of this paper, however, except when differently specified, TFP data are from Inklaar et al. 7 Turnover rates have been used, for instance, by Micco and Pages (2006). 8 To match CPS data with our classification of industries, we adapt the mapping developed by OECD (2007) between the industry classification available in the CPS and the ISIC classification.

DISMISSAL REGULATION AND PRODUCTIVITY
17
the average for all industries in each of the three years. One potential problem with this approach is that the composition of industries in terms of more disaggregate sub-industries may differ between the United States and other countries in our sample. In addition, US layoff rates might be affected by specific institutional features of the US economy. For instance, unemployment insurance premia in the United States are, in part, dependent on past layoffs (experience rating). We cannot exclude the possibility that, despite very weak dismissal regulations, experience rating imposes significant additional costs on firms firing workers, which might differ across industries (depending on the choice of more or less risky development tracks by firms in each industry), thereby acting like endogenous additional firing restrictions.
In order to test the sensitivity of our results to the use of the US-based indicators, we re-estimate our main specifications using two similar measures of layoff propensity based on UK layoff rates and computed from the waves of the Quarterly UK Labour Force Survey in which data on redundancies are available (1997-2003). Dismissal regulations in the United Kingdom are the second lowest in the OECD area, after the United States, making it an alternative natural benchmark. Reassuringly, as shown in Appendix 1, US and UK average layoff rates appear to be closely correlated.9
Another key issue is whether the distribution of layoff rates is stable over time. Considering the limitations of our data, we check whether this is the case in two ways. First, we perform a simple analysis of variance to determine how much of the variation in the distribution of UK and US layoffs can be attributed to variation across industries rather than over time. We find that the industry dimension explains an overwhelming share of the variance (see Table A5 in Appendix 1). Admittedly, however, this exercise is more informative in the case of the United Kingdom, for which we have layoff data for seven years. Second, we match our layoff data with US average gross job turnover rates from Haltiwanger et al. (2006), covering an earlier period (1991-1996) for manufacturing and energy.10 The distribution of US average job turnover rates in this period appears to be remarkably correlated to both the – more recent – distributions of US and UK layoffs (see Table A3). In addition, it appears that job turnover measures perform almost as well as average layoff measures in explaining the variation of layoff rates across countries, across industries and over time (see Table A5). Nevertheless, as a further sensitivity analysis, we replicate our main results using qualitative and quantitative industry classifiers computed from job turnover rates.11
9 The comparison between average layoff rates in the United Kingdom and the United States is presented in Table A3. Table A4 reports the Spearman rank correlation between the distribution of average layoffs in the United Kingdom and the United States, which is high (0.8) and significant. Unfortunately, we do not have data on the distribution of layoffs in other countries and cannot check the extent to which the industry distribution of layoffs varies across countries. Notice, however, that the distribution of layoffs is likely to be affected by dismissal regulations. Had these data been available, it would have been difficult to disentangle cross-country differences due to stricter regulations from those due to possible differences in the industrial structure. 10 Although the original dataset covers the whole business sector, we limit the comparison to manufacturing and energy due to differences in the industry classification. 11 One advantage of replicating the analysis using US average job turnover rates is that they have been shown to explain a large fraction of the cross-industry/cross-country variation in job turnover rates within OECD countries, making the choice of the United States as a benchmark less crucial (see Haltiwanger et al., 2006, and Micco and Pages, 2006). We can also compare our data on job turnover (Table A3) with those of Micco and Pages (2006, Table 3) that refer to a longer period (1973-2003). Although industrial classifications are not exactly the same, visual inspection of the two distributions suggests that job turnover rates in the United States have been relatively stable during our whole sample period.

DISMISSAL REGULATION AND PRODUCTIVITY
18
The baseline level of industry aggregation is an intermediate level between one and two digits of the ISIC rev. 3 classification (see Table A3 for the list of industries). We focus on the non-agricultural business sector and exclude industries that typically have sizeable public sector employment, such as health care services or research and development. In our baseline specifications we also exclude those industries where productivity is more likely to be mismeasured (Financial intermediation and Coke, refined petroleum and nuclear fuel)12 as well as those where average layoff rates are more likely to suffer from measurement error (Motor trade and repair).13 Nevertheless, we check that our main results are robust to the inclusion of these industries in a sensitivity analysis
Aggregate cross-country comparable data on EPL and other institutions are mainly from OECD databases (Bassanini and Duval, 2006, Conway and Nicoletti, 2006, and OECD, 2007). Further details on data construction and sources as well as descriptive statistics are provided in Appendix 1. We exclude observations for Germany prior to and immediately following the reunification (up to 1992). Following a recent trend in the literature on institutions and aggregate unemployment (see Biagi and Lucifora, 2008, and the literature cited therein), in the base sample we also exclude observations for Finland in the year following the collapse of the Soviet Union (1992), which represented an unusually large idiosyncratic trade shock for this country. We check, however, that our results do not depend on the exclusion of these observations.
Our final base 11-country sample is slightly unbalanced and includes 19 industries that we follow for 21 years (1982-2003), for a total size of 4,180 observations. The alternative 16-country sample is much more unbalanced but includes 5,139 observations.
4. RESULTS
4.1. The effect of dismissal regulations on “fully-adjusted” TFP
We start our analysis by using the simplest difference-in-differences specifications (see equations [2] and [2’] in Box 1 above) to estimate the impact of the degree of stringency of individual dismissal regulations (EPLR) on “fully-adjusted” TFP. In these specifications, we do not include additional controls for possible confounding factors and we use industries where EPL is less likely to be binding as a comparison group for industries in which EPL is more likely to be binding, using industry classifiers based on US layoff rates. Panel A in Table 1 presents the results obtained with the 11-country base sample, while Panel B presents the results obtained with the 16-country sample.
12 See Crespi et al. (2006), Koszerek et al. (2007), and Inklaar et al. (2008) for a discussion of productivity mismeasurement in these industries. Among market service industries where productivity mismeasurement is widespread one could list also professional services. Due to the level of aggregation of available data, however, excluding the research and development industry already implies excluding the whole professional service industry. 13 Given the level of aggregation of industries in the CPS, our CPS-ISIC mapping is approximated, with few of the CPS industries mapping exactly into an ISIC industry. The potential for measurement error concerning layoffs is particularly large in the case of Motor trade and repair (ISIC 50), where potentially misclassified sub-industries make up 25% of the total employment of that industry.

DISMISSAL REGULATION AND PRODUCTIVITY
19
The table unambiguously shows that TFP growth tends to be smaller in industries with greater layoff propensity, the more stringent the level of EPLR. By contrast, changes in EPLR do not appear to have a significant effect, which, subject to the caveats mentioned in Box 1, suggests that we are unable to identify any direct effect of dismissal regulations on the level of efficiency – that is any effect on efficiency levels that is not simply due to the impact of EPLR on long-run growth.
Table 1: EPLR and TFP growth. Simple difference-in-differences models
Panel A: 11-country sample
Indicator of layoff propensity (1a) Qualitative
(2a) Qualitative
(3a) Quantitative
(4a) Quantitative
EPLR × Layoff -0.346** -0.365** -0.174*** -0.172***
(0.170) (0.167) (0.055) (0.054)
ΔEPLR × Layoff 1.318 -0.130 (1.927) (0.635)
Country-by-year dummies Yes Yes Yes Yes Industry dummies Yes Yes Yes Yes Observations 4180 4180 4180 4180 R2 0.188 0.188 0.189 0.189
Panel B: 16-country sample
Indicator of layoff propensity (1b) Qualitative
(2b) Qualitative
(3b) Quantitative
(4b) Quantitative
EPLR × Layoff -0.317* -0.338* -0.139** -0.142**
(0.181) (0.178) (0.060) (0.059)
ΔEPLR × Layoff 1.692 0.215 (1.931) (0.644)
Country-by-year dummies Yes Yes Yes Yes Industry dummies Yes Yes Yes Yes Observations 5139 5139 5139 5139 R2 0.194 0.194 0.194 0.194 Notes: Dependent variable: ΔlogTFP (“fully-adjusted” measure), expressed in percentage terms. Robust standard errors in parentheses. ***, **, *: significant at the 1%, 5% and 10% level, respectively. EPLR: index of employment protection for regular contracts (lagged one year). Layoff: indicator of layoff propensity. For each industry, the quantitative indicator of layoff propensity is equal to the industry average of layoff rates between 2001 and 2003 in the United States. The qualitative indicator takes value 1 in industries where the US layoff rate is above the US average for all industries for each year 2001-2003 and 0 elsewhere. The table shows that a 1-point reduction in the EPLR index is associated with 0.32-0.37 percentage-point greater productivity growth in EPL-binding industries with respect to other industries (Columns 1 and 2 in both panels). The same reform would also increase the difference in TFP growth between two industries that are 1 percentage point apart in terms of US layoff rates by 0.14-0.17 percentage points (columns 3 and 4 in both panels).
The estimated effect of dismissal regulations on TFP growth also appears to be significant from an economic point of view. For instance, consider a reform entailing a

DISMISSAL REGULATION AND PRODUCTIVITY
20
one-point reduction in the EPLR index, which roughly corresponds to (i) half of the difference between the OECD average and the United States; (ii) the difference between the United States and the United Kingdom (the two least regulated countries in the OECD); and (iii) the largest within-country time-series variation observed in the sample (in Spain, due to two reforms in the mid-1990s). Taking estimates based on the qualitative indicator of layoff propensity (columns 1 and 2 in both panels) at face value, we can argue that such a reform would raise by 0.32-0.37 percentage points the relative TFP growth rate of EPL-binding industries – with US layoff rates above the average in all years for which our data are available – compared with that of other industries. A similar figure can also be derived using the – potentially more reliable – estimates based on a quantitative indicator of layoff propensity (columns 3 and 4 in both panels). In order to see this, note that the estimates based on the qualitative indicator reported above refer to industries that differ, on average, by 2.16 percentage points as regards average US layoff rates (see Table A3, Appendix 1). Taken at face value, estimates obtained using the quantitative indicator of layoff propensity, suggest that a one-point reform should increase by 0.14-0.17 percentage points the difference in TFP growth between two industries whose average layoff rates differed by 1 percentage point. This in turn implies an effect of 0.30-0.38 percentage points in the case of two groups of industries that differ, on average, by 2.16 percentage points, such as between those that we labelled EPL-binding using the qualitative industry classifier and the other industries. Reassuringly, this suggests that the estimates obtained with alternative indicators are consistent.
The main limitation of the exercise presented in Table 1 is that the role of possible confounding factors that vary across countries, industries and years is not taken into account. In particular, the Schumpeterian growth literature suggests that one should control for the productivity growth of the industry leader as well as the ratio of the TFP level in a specific country and industry to the TFP level of the leader of that industry – relative TFP hereafter (Aghion and Howitt, 2006; Griffith et al., 2004). Results obtained by augmenting the specifications of Table 1 with these variables (see Box 1, equation [3]) are presented in Panel A of Table 2. Both the growth of the productivity frontier and relative TFP appear to be significantly associated with observed TFP growth. The signs of both variables are as expected and estimated coefficients are within the range of estimates found in the previous literature (see e.g. Nicoletti and Scarpetta, 2003; Griffith et al., 2004; Inklaar et al., 2008).14
14 The estimated 3% elasticity of TFP growth to relative TFP implies that, even in the event of no growth of the productivity frontier, countries that are laggard in a specific industry will take on average about 22 years to reduce their productivity gap by one half, in the absence of other developments lifting TFP up. Equation [3] can in fact be derived from a standard theoretical growth model in which country-industry TFP tends to converge to the industry productivity frontier following an exponential time path. Therefore, half-life to convergence can be obtained as -log(2)/log(1-φ). Conversely, the short-run elasticity of TFP growth to the growth of the productivity frontier is as low as 6%, suggesting that short-term spillovers from the productivity leader are rather limited.

DISMISSAL REGULATION AND PRODUCTIVITY
21
Table 2: EPLR and TFP growth. Baseline Schumpeterian models
Panel A: Including the industry productivity frontier
Indicator of layoff propensity (1a) Quantitative
(2a) Quantitative
(3a) Qualitative
(4a) Qualitative
Log relative TFP -0.031*** -0.031*** -0.031*** -0.030***
(0.004) (0.004) (0.004) (0.004)
ΔlogTFP of the industry frontier 0.063*** 0.063*** 0.063*** 0.063*** (0.016) (0.016) (0.016) (0.016)
EPLR × Layoff -0.195*** -0.194*** -0.435*** -0.458*** (0.054) (0.053) (0.166) (0.164)
ΔEPLR × Layoff -0.065 1.579 (0.627) (1.841)
Country-by-year dummies Yes Yes Yes Yes Industry dummies Yes Yes Yes Yes Observations 4180 4180 4180 4180 R2 0.210 0.210 0.208 0.208
Panel B: Including controls for differences in industry life-cycles
Indicator of layoff propensity (1b) Quantitative
(2b) Quantitative
(3b) Qualitative
(4b) Qualitative
Log relative TFP -0.039*** -0.039*** -0.039*** -0.038***
(0.004) (0.004) (0.004) (0.004)
EPLR × Layoff -0.199*** -0.203*** -0.458*** -0.480*** (0.052) (0.051) (0.163) (0.160)
ΔEPLR × Layoff 0.290 1.593 (0.602) (1.839)
Country-by-year dummies Yes Yes Yes Yes Industry-by-year dummies Yes Yes Yes Yes Observations 4180 4180 4180 4180 R2 0.330 0.330 0.329 0.329 Notes: Dependent variable: ΔlogTFP (“fully-adjusted” measure), expressed in percentage terms. Robust standard errors in parentheses. ***, **: significant at the 1% and 5% level, respectively. EPLR: index of employment protection for regular contracts. Layoff: indicator of layoff propensity. For each industry, the quantitative indicator of layoff propensity is equal to the industry average of layoff rates between 2001 and 2003 in the United States. The qualitative indicator takes value 1 in industries where the US layoff rate is above the US average for all industries for each year 2001-2003 and 0 elsewhere. All variables in levels are lagged one year. Log relative TFP and ΔlogTFP of the leader are expressed in percentage terms. The table shows that a 1-point reduction in the EPLR index would increase the difference in TFP growth between two industries that are 1 percentage point apart in terms of US layoff rates by 0.20 percentage points (columns 1 and 2 in both panels). The same reform is also associated with 0.44-0.48 percentage-point greater productivity growth in EPL-binding industries with respect to other industries (columns 3 and 4 in both panels).
Different industries are likely to be in very different stages of their life-cycles. For instance, in almost all countries employment grew faster in service and construction

DISMISSAL REGULATION AND PRODUCTIVITY
22
industries than in manufacturing and energy in the period under study. Nonetheless, certain manufacturing industries, such electrical and optical equipment experienced an impressive output boom, while more traditional low-tech industries, such as the agro-food and textile industries, underwent employment downsizing and productivity stagnation in most countries. It appears therefore appropriate to include further controls for industry-specific shocks and trends that are common across countries. This is done in the specifications presented in Panel B of Table 2 (corresponding to equation [4] in Box 1). The inclusion of these controls has two main effects: on the one hand, it increases the share of sample variation that is explained by the model by about 50%; and on the other hand, it increases the estimate of the speed of convergence by about one third.15
Table 2 confirms that TFP growth tends to be smaller in industries with greater layoff propensity, the more stringent the level of EPLR, while we cannot identify any effect on TFP levels. The estimated effect of EPLR appears greater than that estimated through the simplest difference-in-difference specifications (Table 1). In addition, results presented in Table 2 are quite stable across panels and specifications. Estimates obtained using the quantitative indicator of layoff propensity, suggest that a one-point reform of individual dismissal regulations is likely to raise by 0.20 percentage points the difference in TFP growth between two industries whose average layoff rates differ by one percentage point.16 Following the same reasoning as before, we can also conclude that such a reform would increase the relative TFP growth of EPL-binding industries compared to other industries by 0.42-0.48 percentage points.
What do the figures in Table 2 imply about the aggregate impact of dismissal regulations on TFP growth? We have already argued that, if EPL has an impact on productivity – be it positive or negative – it will be greater in EPL-binding industries. Consistently, we can conclude from the estimates presented above that dismissal regulations depress TFP. However, quantifying this aggregate effect is difficult because our identification strategy does not allow us to identify directly the average effect of
15 The TFP growth of the industry leader is by construction almost perfectly collinear with industry-by-time dummies and its effect is therefore not well identified. For this reason, we exclude this variable from the specifications presented in Panel B. However, re-estimating them including this variable has no consequence on the estimates concerning the other covariates, while yielding an excessively large and difficult to interpret coefficient for the growth of the leader (results not shown but available from authors on request). Another potential problem of estimates in Table 2 is serial correlation. Specification tests show some evidence of first-order correlation in the residuals from specifications in Panel B, but no sign of second-order correlation: Arellano-Bond test statistics are in fact between 2.24 and 2.33 for first-order serial correlation and between 1.08 and 1.12 for second-order serial correlation. Conversely, corresponding tests for Table 1 and Panel A in Table 2 are always insignificant at standard levels. In this context, we check the robustness of our results by re-estimating the specifications of Panel B in two alternative ways. First, we use 5-year differences. Second, we use feasible generalised least squares allowing for first-order autoregressive serial correlation and heteroskedasticity across panels. The use of 5-year differences has also the additional advantage of being more suited to evaluate long-run effects, although at the price of a loss in efficiency. The results, presented in Appendix 3 (Table A6), show that our estimates in Table 2 are generally robust to these types of problem. Another disadvantage of the specifications in Table 2 is that they can be estimated only on the 11-country sample. This is because, as already noticed, the level of TFP is not available in the public version of EUKLEMS. As an alternative, however, we can augment the specifications of Table 1 by including only controls for industry-specific shocks that are common across countries. This exercise is carried out in Table A7 in Appendix 3 and shows no evidence of lack of robustness. 16 As we highlight in Box 1, it is difficult to tell whether this measured effect represents a permanent or transitory impact on growth. One extreme alternative interpretation is to assume that, in the long-run, dismissal regulations have only an impact on efficiency levels. In that case, we can view the specifications presented in Table 2 as variations of some sort of error correction model, with the long-run parameter of TFP of the industry leader constrained to 1. Then one can compute the long-run relationship between EPLR and TFP levels by dividing the coefficient of EPLR by the coefficient of relative TFP, obtaining that a 1-point reform of individual dismissal regulations raises by 5 percentage points the long-run difference in TFP levels between two industries whose average layoff rates differ by 1 percentage point. This still sounds significant from an economic point of view.

DISMISSAL REGULATION AND PRODUCTIVITY
23
EPLR (see Box 1). A cautious lower-bound estimate of the average effect can be computed by assuming that dismissal regulations have an impact only in EPL-binding industries and that our industry classifier perfectly identifies them. The qualitative indicator is based on the already cautious assumption of labelling EPL-binding only those industries that appear to have layoff rates above the average in all years, so that only six industries appear to meet this criteria. As a result, the coefficients in Table 2 translate into a low average effect of about 0.15 percentage points for a one-point EPLR reform. A slightly less cautious prediction could be derived from estimates obtained using the quantitative industry classifier, by observing that industries with low layoff propensity cluster around a layoff rate of 3% in the United States. Suppose that 3% represents a “natural” low layoff level at which dismissal regulations impose no constraint on firms’ choices and that above this threshold the effect of EPLR is proportional to the difference between the layoff rate of the industry and the 3% threshold. With a sample mean for US layoff rates of 4.84%, a one-point reform would increase TFP growth by 0.35-0.40 percentage points in an industry with the average layoff propensity.17
Overall, the evidence presented in this section supports the idea that dismissal regulations have significant negative impact on TFP in OECD countries. However, before discussing the policy implications of this finding, we should challenge our results with further robustness checks, concerning notably their sensitivity to the indicator of layoff propensity used, the countries included in the sample and the possible endogeneity of employment protection regulations. We examine these issues in the next subsection.
4.2. Sensitivity analysis
4.2.1. Sensitivity to alternative indicators of layoff propensity
We use a number of alternative indicators of layoff propensity and EPL-binding industries to examine the robustness of our preferred specification (Column 2b in Table 2). First, we look at the consequences of using relatively aggregate industries that might contain sub-industries with very different layoff propensity. As discussed in Section 3, insofar as their composition may differ across countries, the US distribution of layoff rates might not be representative of the cross-industry differences in layoff propensity in other countries. We question, therefore, how our results depend on the choice of US layoffs as a benchmark by replacing them with UK layoffs and checking the impact on our results (Table 3, Columns 1 and 2). Second, our layoff data are based on relatively few years of observations only. Although we already noted that the distribution of layoffs appears to be, on average, stable over time, certain industries have experienced specific shocks during the period for which our data are available. For instance, the UK
17 At the opposite extreme, one could assume that the effect of EPLR is simply proportional to the average layoff rate of the industry. This assumption would be extreme insofar as it would imply that EPLR has no impact only in a hypothetical industry that never adjusts through layoffs. In the case of estimates of Table 2, this assumption would imply a much larger effect for the industry with the average layoff propensity (about 0.9%-1.0%).

DISMISSAL REGULATION AND PRODUCTIVITY
24
energy industry experienced a major restructuring in the second half of the 1990s due to privatisations that brought about several plant closures and significant downsizing. Similarly, significant employment downsizing of the telecommunication and computer hardware industries occurred in the United States in the aftermath of the 2000 explosion of the internet bubble, particularly in 2001. Qualitative indicators of layoff propensity already take this issue into account, since only industries with layoff rates above the average in every year are labelled EPL-binding. As an alternative, however, we re-estimate our preferred specification using indicators based on medians that are less dependent on outliers than averages (Columns 3 to 6). Finally, we use a different time period. As we do not have data on layoffs by industry for an earlier period, we derive alternative proxies for the industry layoff propensity from the 1991-1996 US distribution of job turnover rates for the industries for which we have data (manufacturing and energy, see section 3.2 above) and re-estimate our specifications with this set of indicators on the subsample where they are defined (Columns 7 and 8).
All the estimates of the impact of EPLR obtained using these alternative indicators are significant at conventional statistical levels. Estimates with UK quantitative indicators are smaller than the corresponding estimates obtained with US indicators, but no such finding emerges using qualitative indicators. Conversely, the differential impact of EPLR between EPL-binding and other industries is greater when EPL-binding industries are identified on the basis of median layoffs rather than average layoffs. Finally, even taking into account that turnover rates are more than three times larger than layoff rates (see Table A3 in Appendix 1), estimates using indicators based on US job turnover yield smaller estimates in the quantitative case but the opposite holds for the qualitative case. Overall, taking into account that one would expect lower and less significant estimates with industry classifiers based on less appropriate benchmarks (due to loss of information), these estimates appear remarkably consistent with our baseline results.

DISMISSAL REGULATION AND PRODUCTIVITY
25
Table 3: EPLR and TFP growth. Sensitivity to alternative indicators of layoff propensity
Indicator of layoff propensity (1) UK average
layoffs, quantitative
(2) UK average
layoffs, qualitative
(3) US median
layoffs, quantitative
(4) US median
layoffs, qualitative
(5) UK median
layoffs, quantitative
(6) UK median
layoffs, qualitative
(7) US average job
turnover, quantitative
(8) US average job
turnover, qualitative
Log relative TFP -0.038*** -0.038*** -0.039*** -0.039*** -0.038*** -0.037*** -0.044*** -0.043***
(0.004) (0.004) (0.004) (0.004) (0.004) (0.004) (0.006) (0.006)
EPLR × Layoff -0.106*** -0.430*** -0.146*** -0.741*** -0.091*** -0.714*** -0.046** -0.574*** (0.038) (0.166) (0.046) (0.181) (0.035) (0.201) (0.022) (0.197)
Country-by-year dummies Yes Yes Yes Yes Yes Yes Yes Yes Industry-by-year dummies Yes Yes Yes Yes Yes Yes Yes Yes Observations 4180 4180 4180 4180 4180 4180 2860 2860 R2 0.328 0.328 0.329 0.329 0.328 0.329 0.368 0.369 Notes: Dependent variable: ΔlogTFP (“fully-adjusted” measure), expressed in percentage terms. Robust standard errors in parentheses. ***, **, *: significant at the 1%, 5% and 10% level, respectively. EPLR: index of employment protection for regular contracts. Layoff: indicator of layoff propensity. For each industry, indicators of layoff propensity are as follows (by column): 1) 1997-2003 industry average of UK layoff rates; 2) 1 if the UK layoff rate is above the UK average for all industries in each year between 1997 and 2003 and 0 elsewhere; 3) industry median of US layoff rates between 2001, 2002 and 2003 ; 4) 1 in industries where the US layoff rate is above the US median of all available industries in the sample for each of the years 2001, 2002 and 2003 and 0 elsewhere; 5) 1997-2003 industry median of UK layoff rates; 6) 1 in industries where the UK layoff rate is above the UK median of all available industries in the sample for each of the years between 1997 and 2003 and 0 elsewhere; 7) 1991-1996 industry average of US gross job turnover rates; and 8) 1 in industries where the US gross job turnover rate is above the US average of manufacturing and energy in each of the years between 1991 and 1996 for which data are available and 0 elsewhere. Log relative TFP and EPLR are lagged one year. The former is expressed in percentage terms.

DISMISSAL REGULATION AND PRODUCTIVITY
26
4.2.2. Sensitivity to country coverage.
Aggregate regressions can be particularly sensitive to the composition of the country sample. In our case, since there are only 11 countries in our base sample, one can particularly worry about this fact, because excluding one country implies pruning nearly 10% of the observations. It is therefore important to check that our results are robust to the elimination of countries from the sample one-by-one.
The results of this exercise are presented in Figure 5. Panels A and B present point estimates and confidence intervals obtained using our baseline indicators of layoff propensity based on US layoffs. Given that Table 3 shows that estimates are sensitive to the choice of the industry classifier in the quantitative case, Panels C and D repeat the exercise using alternative quantitative indicators based on UK layoffs and US job turnover. Point estimates appear relatively robust: in no case are estimated coefficients obtained by excluding one country outside the 10% confidence interval we obtain with the full sample. Nevertheless, their precision is sensitive to the inclusion of the United States and Spain in the sample. This is not surprising insofar as these two countries are at the opposite extremes of the distribution of the EPLR index in our sample (see Figures 1 and 2).18
18 The exclusion of Spain and the United States makes also point estimates insignificant, in the case of indicators based on UK layoffs and US turnover, respectively. In both these cases, however, the United Kingdom appears to be an equally important outlier, whose elimination greatly increases point estimates and their statistical significance. Simultaneous elimination of the United Kingdom and of one of the other two outlier countries results in estimates that are significant, at least at the 10% level (Figure 5). Moreover, by excluding simultaneously Spain, the United Kingdom and the United States (not shown in the chart), we obtain estimated coefficients equal to -0.168 and -0.089 for indicators based on UK layoffs and US turnover, respectively (with standard errors of 0.091 and 0.051, respectively), both significant at the 10% level.

DISMISSAL REGULATION AND PRODUCTIVITY
27
Panel A: US layoffs (quantitative)
Panel B: US layoffs (qualitative)
Panel C: UK layoffs (quantitative)
Panel D: US turnover (quantitative)
-0.500
-0.400
-0.300
-0.200
-0.100
0.000
US
A
ES
P
NLD
AU
T
ITA
BE
L
ALL
DN
K
DE
U
FRA
FIN
GB
R
GB
R-U
SA
GB
R-E
SP
estimated coefficient 5% confidence interval: lower bound5% confidence interval: upper bound 10% confidence interval: lower bound10% confidence interval: upper bound
-1.000
-0.800
-0.600
-0.400
-0.200
0.000
AU
T
NLD
ES
P
BE
L
US
A
ALL ITA
GB
R
DE
U
FRA
DN
K
FIN
GB
R-U
SA
GB
R-E
SP
estimated coefficient 5% confidence interval: lower bound5% confidence interval: upper bound 10% confidence interval: lower bound10% confidence interval: upper bound
-0.300
-0.200
-0.100
0.000
0.100
US
A
ES
P
NLD BE
L
ITA
AU
T
ALL
DE
U
FRA
FIN
DN
K
GB
R
GB
R-U
SA
GB
R-E
SP
estimated coefficient 5% confidence interval: lower bound5% confidence interval: upper bound 10% confidence interval: lower bound10% confidence interval: upper bound
-0.150
-0.120
-0.090
-0.060
-0.030
0.000
0.030
ES
P
AU
T
NLD IT
A
DN
K
BE
L
ALL
DE
U
FIN
FRA
US
A
GB
R
GB
R-U
SA
GB
R-E
SP
estimated coefficient 5% confidence interval: lower bound5% confidence interval: upper bound 10% confidence interval: lower bound10% confidence interval: upper bound
Note: estimated coefficients of EPLR (interacted with the indicators of layoff propensity indicated in each panel) obtained by re-estimating the specifications of Column 2 in Table 2 (Panels A and B) and Columns 1 and 7 in Table 3 (Panels C and D), excluding the indicated countries. ALL stands for no country excluded.
Figure 5. Sensitivity to country coverage
DISMISSAL REGULATION AND PRODUCTIVITY
28
4.2.3. Sensitivity to inclusion of additional confounding factors.
We argued that one of the key advantages of our difference-in-differences approach is that it allows us to control for other aggregate confounding factors, including other institutions and policies, some of which are not easy to quantify. This claim is correct provided that there is no reason to believe that the impact of aggregate institutions on productivity varies, on average, between EPL-binding and other industries and/or proportionally to the industry layoff propensity. For institutions that have no direct bearing on layoffs, it is difficult to think of convincing reasons for such a differential impact. Yet, can we provide stronger evidence that this is the case? In order to do so, we augment our preferred specification with interactions between our baseline quantitative indicator of layoff propensity and levels and first-differences of several aggregate indicators of labour market institutions and product market regulations that are typically used in aggregate unemployment equations – the average labour tax wedge, the average unemployment benefit gross replacement rates (averaged across different durations and family situations), two dummies for high and intermediate levels of corporatism in collective bargaining, the share of workers covered by collective agreements (including administrative extension)19 and a time-varying aggregate indicator of the degree of stringency of anti-competitive product market regulation, all drawn from Bassanini and Duval (2006) and defined more precisely in Appendix 1.
Two policies – tax wedge and unemployment benefits – appear to have an effect that is significantly different across industries with different layoff propensity in some specifications. This is the case both in the most general model including the whole set of institutions defined above and in slightly simplified models where we do not include simultaneously all bargaining variables – since they essentially capture the same thing (Columns 1a to 3a in Table 4). Does this result undermine our claim that these institutions have a similar impact on productivity in EPL-binding and other industries? Such a judgement would be hasty. It is important to remember that our empirical strategy exploits both cross-country and time-series variation in institutions and that cross-country correlations among labour market institutions are high in OECD countries. We therefore suspect that this result emerges because of multicollinearity. Indeed, this appears to be the case: if we implement a simple tournament in which we estimate all possible models with one and two institutions (interacted with our indicator of layoff propensity), the only institution whose coefficient appear to be significant in all models is EPLR, consistent with our priors. As shown in Table 4, the coefficient of unemployment benefits become insignificant in these simpler models (Column 4a), and the coefficient of the tax wedge is significant only when EPLR is also included (Columns 5a and 6a). Moreover no institution, except EPLR, turns out to be significant when we use qualitative indicators of layoff propensity (see Table A8 in Appendix 3).
19 We use collective bargaining coverage rather than union density insofar as the latter is usually not comparable across countries (see OECD, 2004). A true time series for this variable is not available. However, there is evidence that it varies little over time; therefore, we include only its sample average by country. Similarly, the intermediate corporatism dummy does not vary over time in our sample. Conversely, since all other variables are also included in first-differences, we include also a first-differenced term for EPLR. Results obtained by dropping it are, by and large, the same.

DISMISSAL REGULATION AND PRODUCTIVITY
29
Next we consider other possible covariates that are defined at the industry level. Standard models of TFP growth typically include R&D intensity to capture innovative effort (see e.g. Griffith et al., 2004), particularly in models estimated for the manufacturing and energy industries only, where R&D statistics are widely available and not excessively plagued by measurement error. Some theoretical models also predict that R&D might speed up convergence to the productivity frontier (see Aghion and Howitt, 2006). We therefore re-estimate our baseline specification using data for the manufacturing and energy industries only, augmenting the model by the logarithm of R&D intensity and its interaction with relative TFP (Columns 1b and 2b in Table 4). Data on R&D intensity are drawn from the OECD STAN database.
Table 4: EPLR and TFP growth. Additional co-variates. Quantititative indicators of layoff propensity.
Panel A: Aggregate co-variates
(1a) (2a) (3a) (4a) (5a) (6a)
Log relative TFP -0.040*** -0.040*** -0.039*** -0.039*** -0.039*** -0.038***
(0.004) (0.004) (0.004) (0.004) (0.004) (0.004)
EPLR × Layoff -0.299*** -0.311*** -0.243*** -0.266*** -0.183*** (0.090) (0.090) (0.075) (0.055) (0.061)
Tax wedge × Layoff 0.027** 0.027** 0.027** 0.025*** 0.011 (0.012) (0.012) (0.012) (0.008) (0.008)
Unemp. ben. × Layoff -0.012* -0.011* -0.005 -0.003 (0.006) (0.006) (0.004) (0.004)
PMR × Layoff -0.012 -0.046 -0.017 (0.122) (0.097) (0.116)
High corp. × Layoff 0.511* 0.432 (0.291) (0.268)
Medium corp. × Layoff 0.458 0.416 (0.302) (0.297)
Coll. barg. coverage × Layoff
-0.003 0.001 (0.005) (0.004)
ΔEPLR × Layoff 0.145 0.149 0.172 0.146 0.355 (0.610) (0.611) (0.606) (0.603) (0.605)
ΔTax wedge × Layoff 0.055 0.051 0.054 0.050 0.026 (0.041) (0.041) (0.040) (0.039) (0.040)
ΔUnemp. ben. × Layoff 0.004 0.006 0.007 0.016 (0.034) (0.034) (0.032) (0.031)
ΔPMR × Layoff 0.259 0.242 0.270 (0.326) (0.324) (0.319)
ΔHigh corp. × Layoff -0.080 -0.115 (0.636) (0.634)
Country-year dummies Yes Yes Yes Yes Yes Yes Industry-year dummies Yes Yes Yes Yes Yes Yes Observations 4180 4180 4180 4180 4180 4180 R2 0.333 0.333 0.333 0.332 0.330 0.327

DISMISSAL REGULATION AND PRODUCTIVITY
30
Table 4 (cont.)
Panel B: Industry-level co-variates
(1b) (2b) (3b) (4b) (5b) (6b)
Log relative TFP -0.032*** -0.032*** -0.039*** -0.039*** -0.034*** -0.035***
(0.007) (0.008) (0.004) (0.004) (0.007) (0.008)
EPLR × Layoff -0.331*** -0.332*** -0.214*** -0.213*** -0.404*** -0.459*** (0.075) (0.075) (0.053) (0.053) (0.076) (0.092)
ΔEPLR × Layoff 0.290 0.286 0.269 0.274 0.132 -0.267 (0.736) (0.736) (0.600) (0.599) (0.736) (0.984)
Log R&D intensity 0.524** 0.528** 0.636*** 0.647** (0.208) (0.212) (0.210) (0.258)
Log R&D intensity × Log relative TFP
-0.001 (0.005)
PMR impact -3.558** -3.575** -11.432*** -20.235 (1.553) (1.557) (2.729) (13.856)
ΔPMR impact -7.630 -7.703 -3.437 -188.383 (5.488) (5.519) (6.888) (165.020)
PMR impact × Log relative TFP
-0.006 (0.018)
ΔImport-weighted real exchange rate
2.345 (6.074)
Country-year dummies Yes Yes Yes Yes Yes Yes Industry-year dummies Yes Yes Yes Yes Yes Yes Observations 1904 1904 4180 4180 1904 1737 R2 0.399 0.399 0.331 0.331 0.404 0.417 Notes: Dependent variable: ΔlogTFP (“fully-adjusted” measure), expressed in percentage terms. Robust standard errors in parentheses. ***, **, *: significant at the 1%, 5% and 10% level, respectively. All variables in levels are lagged one year. EPLR: index of employment protection for regular contracts. PMR: aggregate indicator of product market regulation. PMR impact: indicator measuring the direct and indirect impact of product market regulation (indirect impact through forward linkages). Layoff: indicator of layoff propensity. For each industry, the indicator of layoff propensity is equal to the industry average of layoff rates between 2001 and 2003 in the United States. Log relative TFP is expressed in percentage terms. When interacted with one another, log R&D intensity, PMR impact and log relative TFP are expressed in deviation from the sample average, so that coefficients of linear terms represent estimated effects at the sample average.
Theory also suggests that regulation and competition are important determinants of productivity growth (see e.g. Aghion et al., 2001). Ideally, we would like to include also industry-level indicators of product market regulations, since these regulations differ across industries.20 However, they are available only for a handful of non-manufacturing industries, making their use within our estimation strategy unfeasible. We try to partially capture the contemporaneous impact of the product market regulatory framework in two ways. First, we include the regulation impact indicator of Conway and Nicoletti (2006), which is available for all industries. In each industry, this indicator measures the direct and indirect impact of regulatory barriers to competition in highly-regulated industries, under the assumption that industries that buy more of the products of one upstream
20 As an alternative to regulatory indicators, mark-ups or Lerner indexes are also often used. However, their construction would require at least cross-country comparable capital stocks consistent with our TFP data, which we do not have. In addition, they are strongly endogenous, their level reflects more investment in intangibles than product market competition and even their change might badly capture changes in competitive conditions (see e.g. Boone, 2008).

DISMISSAL REGULATION AND PRODUCTIVITY
31
regulated industry are more affected by the lack of product market competition in that industry (Columns 3b to 5b in Table 4).21 Second, we also include changes in the industry-specific import-weighted real exchange rate (from OECD, 2007) to capture changes in foreign competition in each industry (Column 6b).22 All these covariates, except perhaps the latter, appear to attract the expected sign, even though they are not always significant, particularly in the case of terms interacted with relative TFP. The positive and insignificant sign for changes in the exchange rate is however consistent with Griffith et al. (2004). In all cases, and more relevant for the purpose of this paper, the estimated coefficient of EPLR does not appear to be affected in any noteworthy way.
4.2.4. On possible endogeneity of dismissal regulations.
There is evidence that liberalisation reforms are easier to implement and occur more frequently in bad economic times (e.g. Drazen and Easterly, 2001), and one can imagine that this argument applies to reforms of dismissal regulations. On the other hand, one can argue that, since dismissal restrictions slow job destruction and reduce unemployment risk for the insiders, political pressure to maintain or increase them will be higher during major downturns. The fact that dismissal regulations were tightened dramatically in the aftermath of the productivity slowdown and the economic crisis of the 1970s in many countries (see OECD, 1999) corroborates this alternative view. Up to now, we have treated estimated coefficients of EPLR, interacted with indicators of layoff propensity, as evidence of a causal impact of regulations on TFP growth. Do these political economy arguments point to the possible endogeneity of dismissal regulations and imply that our causal interpretation is unwarranted? When average TFP growth is lower than usual, EPLR may be more likely to fall or increase, depending on the mechanism that is assumed. Our identification strategy, however, controls for these types of aggregate effects through country-by-time dummies, provided that aggregate downturns do not strike more strongly, on average, in industries with high layoff propensity, which looks a priori unlikely.23 Therefore, it seems fair to conclude that the potential feedbacks outlined above have no bearing on the interpretation of our estimates.
There is, however, a more subtle political economy argument that can be put forward and that is potentially more problematic. Suppose that dismissal regulations do not affect productivity growth but only profits, and that they do so particularly in industries where EPL is binding. It is not inconceivable that industries that are expanding are also more effective in lobbying for their interests. As a consequence, due to lobbying pressure only, EPLR would tend to be lower in countries where EPL-binding industries grow faster, and our estimated coefficients might simply measure this correlation. In order to address
21 In low-regulated industries, this indicator quantifies only the likely impact on costs faced by firms that use the output of highly-regulated industries as input. It is constructed from total input requirements derived from input-output tables (see Appendix 1) and differs from the aggregate one used in Panel A, where the same average score is applied to the whole economy. 22 Industry-specific exchange rates can be included in first-differences only, since by construction their level is not comparable across countries (see Appendix 1 for details). In addition, they are available for manufacturing only. 23 The estimation of specifications augmented by the aggregate output gap interacted with indicators of layoff propensity yields additional support for this view. The estimated coefficient of the output gap term turns out to be always insignificant (results are available from authors upon request), suggesting that the correlation between aggregate shocks and industry TFP growth does not differ, on average, between high and low layoff propensity industries.

DISMISSAL REGULATION AND PRODUCTIVITY
32
this issue of causality, we need to find instruments that can predict the level of EPLR without affecting directly the difference in productivity growth between EPL-binding and other industries.
First, we can look at the characteristics of the legal system. Countries with common law systems tend to be attached to the principle of freedom of contracts and have relatively few regulatory provisions concerning labour contracts. In contrast, most civil law systems, and particularly those with a single codified civil code, tend to minutely regulate (see, for example, House of Lords, 2007). One would therefore expect more lenient dismissal regulations in common law countries and more constraining regulations in countries under civil law with a civil code tradition.24 Scandinavian countries with no consolidated civil codes and a customary law tradition will be a somewhat intermediate case (see Lando, 2001, and Smits, 2007). In fact, from an historical point of view, in Denmark, Finland and Sweden, employment protection rules were introduced first through collective agreements, with a few of them being reflected in legislation only subsequently (Sigeman, 2002). Next, we can look at countries that experienced dictatorships in the 20th century (excluding during World War II, when most European countries were under puppet pro-Nazi regimes). Due to their paternalistic view of labour relationships, pre-WWII fascist regimes were historically inclined to guarantee workers strong protection against dismissals, albeit within a strict industrial relation system with no voice rights.25 Stringent regulations generally survived the fall of these political regimes. All these historical and institutional factors pre-date EPL (by more than one century, in the case of legal systems), thereby limiting the risk of reverse causality. True, one can argue that they could also be at the origin of other institutions affecting productivity and/or could have a long-lasting effect on productivity themselves. This is not a problem, however, if we interact these variables with the corresponding indicators of layoff propensity used for EPLR and use the interacted variables as instruments, as we do. In fact, these interacted variables appears to qualify as valid instruments to the extent that we cannot think of any economic mechanism inducing an effect of legal systems or dictatorship spells on productivity that varies across industries as a function of layoff propensity without occurring through their effect on dismissal regulations. Obviously, the validity of our instrumental variable strategy crucially hinges on the validity of this latter statement.26
The disadvantage of these instruments is, however, that they are time invariant. A time-varying instrument can be constructed by looking at the political colour of governments, insofar as one can expect leftwing governments to be more inclined to
24 In addition, in common law countries case law might introduce de facto restrictions in the absence of legislation. In many US states, for instance, wrongful discharge in violation of public policy, such as because the employee has served on jury duty, is a commonly accepted exception to the employment-at-will doctrine even if it is not always written in a specific statute. This aspect of common law systems, however, represents an important source of measurement error, insofar as it implies that in common law countries EPL understates the effective stringency of regulations. Anyway, our instrumental variable strategy is likely to address this issue. In addition, its importance for our empirical analysis should not be exaggerated: as shown in Table 5 below, EPLR remain significant when instrumented with indicators of legal systems only, which would not occur if the variation of EPLR induced by the variation of legal systems had no effect on productivity. 25 For example, notice periods were introduced early in Italian legislation by the Mussolini government (Royal Decree 13 November 1924, n. 1825), lay-offs required government authorization in the Third Reich (see Shirer, 1960) and were in practice very difficult in Franco’s Spain (see Teixeira, 2001). 26 Anyway, overidentification tests presented in Table 5 provide some empirical support for it.

DISMISSAL REGULATION AND PRODUCTIVITY
33
maintain or increase the stringency of EPL. In certain specifications, therefore, we use the Schmidt index of cabinet composition – drawn from the Comparative Political Data Set (CPDS, see Armingeon et al., 2005), which varies between 0 and 5 from least to most leftwing. As with the other instruments, we interact this variable with indicators of layoff propensity.27
Results of instrumental variable regressions are reported in Table 5. Columns 1 to 4 in each panel report results obtained by re-estimating the preferred specification using instruments based on, respectively, the civil law/common law dichotomy; a refinement including information on civil codes; dictatorship spells; and all of the above plus cabinet composition. Two elements stand out from the first four columns of the table. First, the estimated coefficient of EPLR is always significant and not far from baseline estimates (see Table 2). In addition, we find no or little evidence suggesting that EPLR, interacted with indicators of layoff propensity, is endogenous, which downplays the importance of the lobbying argument.28
Table 5: EPLR and TFP growth. Instrumental variable estimates.
Panel A: Quantitative indicator of layoff propensity
Instruments used (1a) Legal
systems
(2a) Legal
systems (refined)
(3a) Dictator-
ship
(4a) All
(5a) All
(6a) All
Log relative TFP -0.038*** -0.038*** -0.039*** -0.038***
(0.004) (0.004) (0.004) (0.004)
EPLR × Layoff -0.129** -0.158*** -0.319*** -0.157*** -0.120** -0.107* (0.062) (0.058) (0.098) (0.056) (0.057) (0.057)
Country-year dummies Yes Yes Yes Yes Yes Yes Industry-year dummies Yes Yes Yes Yes Yes Yes Overid. score test (P-value) 0.158 0.195 0.232 0.247 Endog. score test (P-value) 0.084 0.195 0.181 0.135 0.090 0.227 1st-stage residual test (P-val.) 0.109 0.230 0.215 0.167 0.117 0.261 F-test on instruments (P-val.) 0.000 0.000 0.000 0.000 0.000 0.000 Observations 4180 4180 4180 4180 4180 4683 R2 0.330 0.330 0.329 0.330 0.308 0.307
27 To the extent that lobbying activity might influence electoral campaigns, it might be possible that countries tend to elect more frequently rightwing governments where EPL-binding industries grow faster: companies operating mainly in these industries could in fact throw their weight into electoral campaigns in order to support parties that will take a favourable stance as regards EPL. In this case, therefore, this instrument would not qualify as a valid instrument. Although the likelihood of this argument appears small, we use this instrument only in combination with other instruments, in such a way that we can rule this counter-argument out by means of overidentification tests. 28 Since specification tests do not show any sign of endogeneity of EPLR, interacted with indicators of layoff propensity, we can also test the consistency of our instrumental variable strategy in one additional way. We can augment our baseline specification with our instruments and re-estimate it by OLS. If the interacted EPLR variable is not endogenous, OLS estimates will be consistent. Therefore, if our instruments are valid instruments that fulfil the orthogonality condition, as we argued above, we would expect them to attract insignificant coefficients in these specifications. This indeed turns out to be the case (results not shown but available from authors).

DISMISSAL REGULATION AND PRODUCTIVITY
34
Table 5 (cont.)
Panel B: Qualitative indicator of layoff propensity
Instruments used (1b) Legal
systems
(2b) Legal
systems (refined)
(3b) Dictator-
ship
(4b) All
(5b) All
(6b) All
Log relative TFP -0.038*** -0.039*** -0.039*** -0.038***
(0.004) (0.004) (0.004) (0.004)
EPLR × Layoff -0.477** -0.495*** -0.744** -0.489*** -0.319* -0.332** (0.191) (0.180) (0.318) (0.174) (0.179) (0.169)
Country-year dummies Yes Yes Yes Yes Yes Yes Industry-year dummies Yes Yes Yes Yes Yes Yes Overid. score test (P-value) 0.779 0.746 0.675 0.937 Endog. score test (P-value) 0.981 0.895 0.333 0.925 0.708 0.986 1st-stage residual test (P-val.) 0.982 0.903 0.371 0.931 0.729 0.987 F-test on instruments (P-val.) 0.000 0.000 0.000 0.000 0.000 0.000 Observations 4180 4180 4180 4180 4180 4683 R2 0.329 0.329 0.328 0.329 0.306 0.306 Notes: 2SLS estimates. Dependent variable: ΔlogTFP (“fully-adjusted” measure). Robust standard errors in parentheses. ***, **, *: significant at the 1%, 5% and 10% level, respectively. ΔlogTFP and log relative TFP are expressed in percentage terms. All variables are lagged one year. EPLR: index of employment protection for regular contracts, treated as endogenous. Layoff: indicator of layoff propensity. For each industry, the quantitative indicator of layoff propensity is equal to the 2001-2003 average of US layoff rates, and the qualitative indicator takes value 1 in industries where the US layoff rate is above the US average for all industries for each year 2001-2003 and 0 elsewhere. Instruments: Legal systems: dummy for common law systems; Legal systems (refined): dummies for common law systems and for civil law systems with single codified civil code; Dictatorship: dummy for a dictatorship spell in the 20th century (excluding major wars); All includes all of the above plus an indicator of the partisan composition of the government. All these instruments are interacted with the indicator of layoff propensity. Score tests are Wooldridge’s (1995) robust score tests. The 1st-stage residual test for endogeneity is the t-test on the estimated coefficient of the 1st-stage residual in augmented OLS specifications. Col. 6 is based on an extended sample (16-country sample, excluding Eastern Europe). See Appendix 4 for first-stage estimates.
One problem with the estimates presented in the first four columns of Table 5 is that relative TFP, even if pre-determined, is likely to be endogenous to productivity growth. In fact, other factors, not included in the model, might simultaneously affect both the productivity gap with the leader and TFP growth. Unfortunately, it is difficult to find variables that affect relative productivity levels without affecting productivity growth directly. As an alternative strategy, we exclude relative TFP from the specification and re-estimate it using our instrumental variables. Point estimates turn out somewhat smaller (Column 5), but they are broadly in line with those presented in Table 1 and Table A7, confirming previous results. Finally, as most of our instruments are time-invariant, the number of countries in the sample may play a role. As an additional robustness check, using data from the 16-country sample for the countries for which our instruments are available, we re-estimate the specification of Column 5 (the only one that can be estimated on the 16-country sample), which again supports our main findings (Column 6).

DISMISSAL REGULATION AND PRODUCTIVITY
35
4.2.5. Other robustness checks.
In our baseline estimates, we exclude three industries (see section 3 above) where we are more likely to mismeasure productivity or layoffs. We also exclude observations for Finland in the year following the fall of the Soviet Union. Table 6 shows the impact of these choices on our estimates. While, as one would expect, the former affects significantly the precision of the estimates (Column 1),29 the latter has essentially no impact (Column 2).30
The EPLR indicator used in our baseline regressions does not include additional restrictions for collective dismissal, primarily because we lack a proper time-series indicator for these additional restrictions (see Section 2). This is unfortunate, since the theoretical literature does not distinguish between regulations on individual and collective dismissals when studying the link with productivity, and therefore collective dismissals are part of the phenomenon we want to study. However, we have already noted that available evidence on additional legislative requirements concerning collective dismissals show that the latter are seldom reformed – even less frequently than legislation for individual dismissals. As a rough proxy for the overall restrictions on dismissals, therefore, we can use a weighted average of EPLR and the 1998 value of EPLC (the indicator for additional restrictions for collective dismissals), with, say, 5/7 and 2/7 weights, respectively, to be consistent with OECD (2004) and Figure 1. When we replace our standard EPLR indicator with this refined one, we find that estimated effects are about 50% higher, regardless of the indicator of layoff propensity (Column 3).31 Although, this result can be partially explained by the fact that the standard deviation of the refined indicator is about one quarter smaller than that of the standard one, it suggests that, by using the standard indicator, at worst we underestimate the true impact of EPLR, consistent with our general methodological approach.
Up to here we have looked only at “fully-adjusted” TFP, following the mainstream literature on growth accounting. However, it can be argued that we are equally interested in “broadly-defined” TFP (see Section 2). In fact, both embodied and disembodied technological change matter from the point of view of increasing living standards in the long-run. Point-estimates obtained by using “broadly-defined” TFP (both as regards the dependent variable and relative TFP) are slightly smaller, but essentially tell the same story (Column 4). In other words, mandatory dismissal regulations appear to have a negative impact on technological change regardless of whether we look at total change or only its disembodied component.
29 Point estimates of the effect of EPLR appear to be affected when the quantitative indicator of layoff propensity is used. This effect is essentially due to the inclusion of Coke, refined petroleum and nuclear fuel, which is the industry that displays the most turbulent layoff pattern in the United States, in the years where we have data. In fact, although layoff rates in this industry are usually small, there is a 10% peak in 2002, which obviously affects the 2001-2003 average, but does not change the classification of this industry as non-binding using the qualitative indicator. 30 We also re-estimated all specifications on a sample restricted to manufacturing and energy only, where there are fewer problems of productivity measurement, and found essentially the same results. 31 Not surprisingly, using the 2003 value for EPLC leads to the same results.

DISMISSAL REGULATION AND PRODUCTIVITY
36
Table 6: EPLR and TFP growth. Additional robustness checks.
Panel A: Quantitative indicator of layoff propensity
Robustness check (1a) All
industries
(2a) Full time
sample for Finland
(3a) Including collective dismissals
(4a) “broadly-defined”
TFP Log relative TFP -0.060*** -0.038*** -0.039*** -0.037***
(0.011) (0.004) (0.004) (0.004)
EPLR × Layoff -0.151** -0.197*** -0.193*** (0.061) (0.051) (0.051)
EPLR (refined including collective dismissals) × Layoff
-0.294*** (0.070)
Country-year dummies Yes Yes Yes Yes Industry-year dummies Yes Yes Yes Yes Observations 4840 4199 4180 4180 R2 0.199 0.328 0.330 0.336
Panel B: Qualitative indicator of layoff propensity
Robustness check (1b) All
industries
(2b) Full time
sample for Finland
(3b) Including collective dismissals
(4b) “broadly-defined”
TFP Log relative TFP -0.060*** -0.038*** -0.038*** -0.037***
(0.011) (0.004) (0.004) (0.004)
EPLR × Layoff -0.469** -0.467*** -0.465*** (0.207) (0.160) (0.158)
EPLR (refined including collective dismissals) × Layoff
-0.687*** (0.218)
Country-year dummies Yes Yes Yes Yes Industry-year dummies Yes Yes Yes Yes Observations 4840 4199 4180 4180 R2 0.199 0.326 0.329 0.335 Notes: Dependent variable: ΔlogTFP (“fully-adjusted” measure), except in Column 4, where it is ΔlogTFP (“broadly-defined” measure). Robust standard errors in parentheses. ***, **: significant at the 1% and 5% level, respectively. EPLR: index of employment protection for regular contracts. Refined EPLR: index of employment protection for regular contracts including additional provisions for collective dismissals. Layoff: indicator of layoff propensity. For each industry, in Panel A the indicator of layoff propensity is equal to the industry average of layoff rates between 2001 and 2003 in the United States, and in Panel B, the indicator takes value 1 in industries where the US layoff rate is above the US average for all industries for each year 2001-2003 and 0 elsewhere. All variables except EPLR and refined EPLR are expressed in percentage terms. All variables in levels are lagged one year.

DISMISSAL REGULATION AND PRODUCTIVITY
37
4.3. Further questions
4.3.1. Does the impact of regulations depend on the distance from the frontier?
Firms that operate with technologies that are far from the technological frontier often improve their efficiency by adopting more efficient technologies developed by and/or already in use by industry leaders or elsewhere. Frequently, adoption of new technologies requires downsizing and/or other staff adjustments to cope with new skill needs (Cappelli, 2000). To the extent that dismissal regulations slow reallocation of resources across activities, firms and industries, one can expect that they dampen the pace of technology adoptions and, thereby, the speed of convergence towards the productivity frontier. If this were the case, reforms of overly strict dismissal regulations would be particularly important in countries that are, on average, further from that frontier. This possibility is explored in Table 7, where we modify our baseline specification by letting the effect of relative TFP vary as a function of EPLR, where the latter is, as always, multiplied by the indicator of layoff propensity. If EPLR had a negative impact on the speed of adoption, we would expect this additional interaction term to have a positive coefficient. Surprisingly, no significant interaction effect is estimated (Columns 1 and 2).
Table 7: EPLR and TFP growth. The effect of EPLR on the speed of convergence.
Indicator of layoff propensity and TFP measure
(1) Quantitative, fully adjusted
(2) Qualitative,
fully adjusted
(3) Quantitative,
broad measure
(4) Qualitative,
broad measure
Log relative TFP -0.041*** -0.040*** -0.039*** -0.038***
(0.004) (0.004) (0.004) (0.004)
EPLR × Layoff -0.172*** -0.361** -0.161*** -0.348** (0.052) (0.167) (0.051) (0.165)
EPLR × Layoff × Log rel. TFP -0.001 -0.006 -0.001 -0.006 (0.002) (0.006) (0.002) (0.006)
Country-year dummies Yes Yes Yes Yes Industry-year dummies Yes Yes Yes Yes Additional implicit interactions Yes Yes Yes Yes Observations 4180 4180 4180 4180 R2 0.332 0.330 0.338 0.336 Notes: Dependent variable: ΔlogTFP. Robust standard errors in parentheses. ***, **: significant at the 1% and 5% level, respectively. EPLR: index of employment protection for regular contracts. Layoff: indicator of layoff propensity. For each industry, the quantitative indicator of layoff propensity is equal to the 2001-2003 industry average of US layoff rates, while the qualitative indicator takes value 1 in industries where the layoff rate is above the US average for all industries for each year 2001-2003 and 0 elsewhere. ΔlogTFP and log relative TFP are expressed in percentage terms. All variables are lagged one year. When interacted with one another, EPLR and log relative TFP are expressed in deviation from the sample average. All specifications control for implicit additional interactions, required to identify the coefficients shown in the table: between log relative TFP and EPLR (not interacted with Layoff) and between log relative TFP and Layoff.

DISMISSAL REGULATION AND PRODUCTIVITY
38
In many cases, however, industry followers adopt new vintages of capital equipment already in use by productivity leaders, resulting mainly in embodied technological change. We can suspect, therefore, that the reason why EPLR does not appear to slow down convergence is related to the use, as dependent variable, of a proxy for disembodied technological change only. To check for this, we replace “fully-adjusted” TFP with “broadly-defined” TFP and redefine relative TFP accordingly (as in the last column of Table 6 above). Yet, no significant interaction effect appears (Columns 3 and 4 of Table 7).32
Another alternative way to assess the impact of EPLR on technology adoption is to look at the difference between “broadly-defined” and “fully-adjusted” TFP. If EPLR significantly depressed adoption of new equipment, we would expect that it had a negative – or, at least, not positive – relationship with this difference, insofar as stringent regulations would have a negative effect on embodied technological change. We estimate this effect using various specifications. First, we subtract the determinants of “fully-adjusted” TFP growth from those of “broadly-defined” TFP and use them as explanatory variables (Table 8, Columns 1 and 2). The problem with this specification is that both measures of relative TFP need to be included, raising problems of multicollinearity. As an alternative, given that the two gaps appear to have similar coefficients (cf. Column 4 in Table 6 and Columns 2b and 4b in Table 2), we include only their difference in the specification (Columns 3 and 4). Finally, we exclude relative TFP altogether (Columns 5 and 6). In all specifications of Table 8 in which the quantitative indicator of layoff propensity is used, EPLR is positively associated with the difference between the two TFP measures. This implies that the effect of EPLR on “broadly-defined” TFP appears to be significantly less negative than that on “fully-adjusted” TFP – albeit the estimated impact appears small, and becomes insignificant when qualitative indicators of layoff propensity are used.
Although the evidence presented here is far from being conclusive, it does not yield any empirical support to the idea that dismissal regulations negatively affect the pace of technology adoption. On the contrary, our evidence appears to suggest that the negative impact on productivity that we measure is mainly due to the depressing effect of stringent regulations on disembodied technological change, probably insofar as they dampen innovative effort. Moreover, this finding can be seen as consistent with the fact that firing restrictions has been found by some studies to increase capital deepening (see section 2) and one can expect a positive relationship between the pace of embodied technological change and capital deepening.
32 One needs to be cautious in interpreting these results. In particular, an exhaustive analysis of interaction effects would require looking simultaneously at all covariates that could potentially affect the speed of convergence, and is left for future research.

DISMISSAL REGULATION AND PRODUCTIVITY
39
Table 8: EPLR and differences between alternative measures of TFP growth.
Indicator of layoff propensity
(1) Quantitative
(2) Qualitative
(3) Quantitative
(4) Qualitative
(5) Quantitative
(6) Qualitative
Log relative TFP difference
-0.017*** -0.017*** -0.018*** -0.018*** (0.004) (0.004) (0.004) (0.004)
Log relative TFP (“fully-adjusted”)
0.001*** 0.001*** (0.000) (0.000)
EPLR × Layoff 0.010** 0.006 0.009* 0.002 0.009* -0.005 (0.005) (0.016) (0.005) (0.016) (0.005) (0.017)
Country-year Yes Yes Yes Yes Yes Yes Industry-year Yes Yes Yes Yes Yes Yes Observations 4180 4180 4180 4180 4180 4180 R2 0.369 0.369 0.367 0.366 0.355 0.354 Notes: Dependent variable: the difference between ΔlogTFP (“broadly-defined” measure) and ΔlogTFP (“fully-adjusted” measure). Robust standard errors in parentheses. ***, **, *: significant at the 1%, 5% and 10% level, respectively. Log relative TFP difference is the difference between log relative TFP for the “broadly-defined” and the “fully-adjusted” measures; Log relative TFP (“fully adjusted”) refers to the “fully-adjusted” TFP measure. Both ΔlogTFP and relative TFP variables are expressed in percentage terms. EPLR: index of employment protection for regular contracts. Layoff: indicator of layoff propensity. For each industry, the quantitative indicator of layoff propensity is equal to the 2001-2003 industry average of US layoff rates, while the qualitative indicator takes value 1 in industries where the US layoff rate is above the US average for all industries for each year 2001-2003 and 0 elsewhere. All independent variables are lagged one year.
4.3.2. Labour composition
One problem with any analysis of productivity that is not based on matched employer-employee data is that it might be difficult to disentangle changes in average productivity that are due to composition effects – that is the absorption or expulsion of less productive workers into or from employment – from changes in individual productivity (e.g. OECD, 2007; Dew Becker and Gordon, 2008). However, policy implications usually differ in the two cases. For example, if the effect of dismissal regulations on productivity growth were entirely due to its impact on the composition of employment, distributional consequences and unequal sharing of growth pay-offs could make EPL reforms less desirable. In particular, there is some evidence that strict EPL tends to increase retention of older unskilled workers into employment (e.g. Bassanini and Duval, 2006, Behagel et al., 2008) and dismissal regulations might increase average productivity simply by replacing older unskilled workers for younger skilled ones. In the data we use, TFP is constructed by taking into account 12 different types of labour (gender, 3 age classes, 3 educational attainment levels), which should in principle limit the importance of this problem. Nevertheless, this correction might not fully account for labour composition. In particular, one can expect that within each type of labour category, the least productive workers will be the first to be laid-off and the last to be hired when total employment adjusts. Similarly, when workers work longer hours, their individual hourly productivity is likely to decrease. To check that our results are not driven by these composition effects we augment our baseline specification by
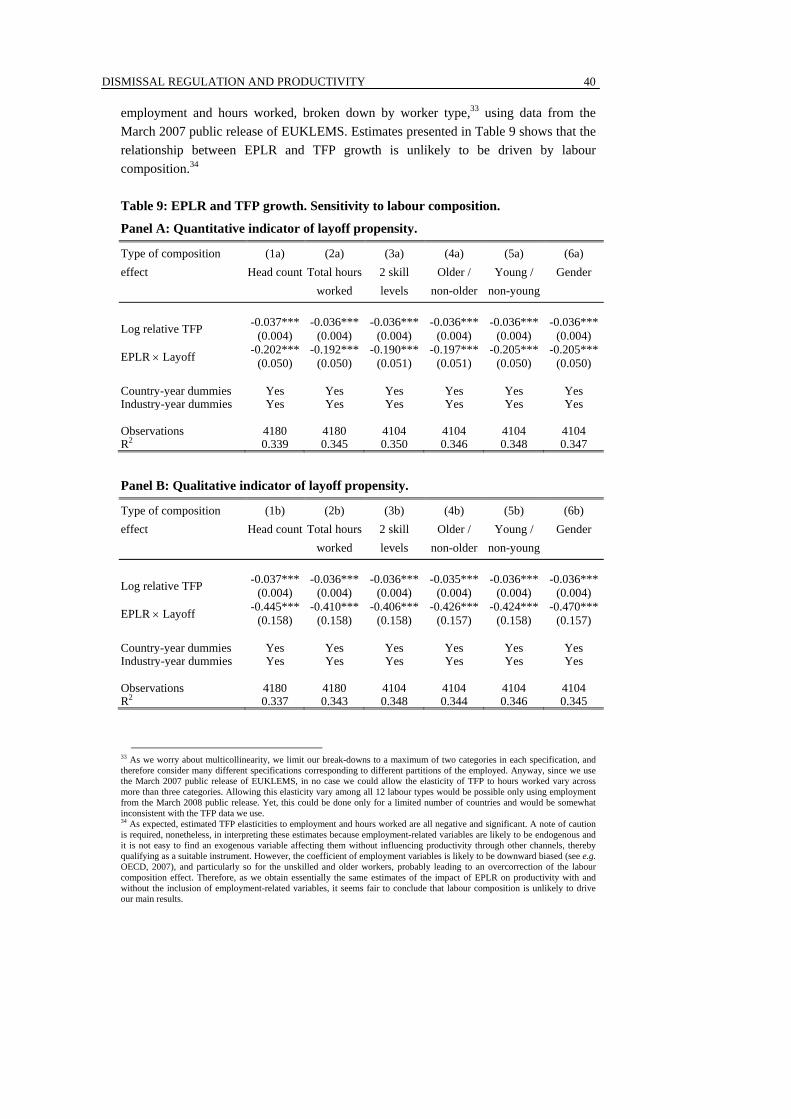
DISMISSAL REGULATION AND PRODUCTIVITY
40
employment and hours worked, broken down by worker type,33 using data from the March 2007 public release of EUKLEMS. Estimates presented in Table 9 shows that the relationship between EPLR and TFP growth is unlikely to be driven by labour composition.34
Table 9: EPLR and TFP growth. Sensitivity to labour composition.
Panel A: Quantitative indicator of layoff propensity.
Type of composition effect
(1a) Head count
(2a) Total hours
worked
(3a) 2 skill levels
(4a) Older /
non-older
(5a) Young /
non-young
(6a) Gender
Log relative TFP -0.037*** -0.036*** -0.036*** -0.036*** -0.036*** -0.036***
(0.004) (0.004) (0.004) (0.004) (0.004) (0.004)
EPLR × Layoff -0.202*** -0.192*** -0.190*** -0.197*** -0.205*** -0.205*** (0.050) (0.050) (0.051) (0.051) (0.050) (0.050)
Country-year dummies Yes Yes Yes Yes Yes Yes Industry-year dummies Yes Yes Yes Yes Yes Yes Observations 4180 4180 4104 4104 4104 4104 R2 0.339 0.345 0.350 0.346 0.348 0.347
Panel B: Qualitative indicator of layoff propensity.
Type of composition effect
(1b) Head count
(2b) Total hours
worked
(3b) 2 skill levels
(4b) Older /
non-older
(5b) Young /
non-young
(6b) Gender
Log relative TFP -0.037*** -0.036*** -0.036*** -0.035*** -0.036*** -0.036***
(0.004) (0.004) (0.004) (0.004) (0.004) (0.004)
EPLR × Layoff -0.445*** -0.410*** -0.406*** -0.426*** -0.424*** -0.470*** (0.158) (0.158) (0.158) (0.157) (0.158) (0.157)
Country-year dummies Yes Yes Yes Yes Yes Yes Industry-year dummies Yes Yes Yes Yes Yes Yes Observations 4180 4180 4104 4104 4104 4104 R2 0.337 0.343 0.348 0.344 0.346 0.345
33 As we worry about multicollinearity, we limit our break-downs to a maximum of two categories in each specification, and therefore consider many different specifications corresponding to different partitions of the employed. Anyway, since we use the March 2007 public release of EUKLEMS, in no case we could allow the elasticity of TFP to hours worked vary across more than three categories. Allowing this elasticity vary among all 12 labour types would be possible only using employment from the March 2008 public release. Yet, this could be done only for a limited number of countries and would be somewhat inconsistent with the TFP data we use. 34 As expected, estimated TFP elasticities to employment and hours worked are all negative and significant. A note of caution is required, nonetheless, in interpreting these estimates because employment-related variables are likely to be endogenous and it is not easy to find an exogenous variable affecting them without influencing productivity through other channels, thereby qualifying as a suitable instrument. However, the coefficient of employment variables is likely to be downward biased (see e.g. OECD, 2007), and particularly so for the unskilled and older workers, probably leading to an overcorrection of the labour composition effect. Therefore, as we obtain essentially the same estimates of the impact of EPLR on productivity with and without the inclusion of employment-related variables, it seems fair to conclude that labour composition is unlikely to drive our main results.

DISMISSAL REGULATION AND PRODUCTIVITY
41
Table 9 (cont.) Notes: Dependent variable: ΔlogTFP (“fully-adjusted” measure), expressed in percentage terms. Robust standard errors in parentheses. ***: significant at the 1% level. EPLR: index of employment protection for regular contracts. Layoff: indicator of layoff propensity. For each industry, the quantitative indicator of layoff propensity is equal to the 2001-2003 industry average of US layoff rates, while the qualitative indicator takes value 1 in industries where the US layoff rate is above the US average for all industries for each year 2001-2003 and 0 elsewhere. Log relative TFP and ΔlogTFP of the leader are expressed in percentage terms. Additional controls, by column: 1) employment (head count); 2) total hours worked; 3) hours worked by those with more than upper secondary education and hours worked by those with upper secondary education or less; 4) hours worked by those aged 50 years or more and hours worked by those aged 49 years or less; 5) hours worked by those aged 29 years or less and hours worked by those aged 30 years or more; and 6) hours worked by men and hours worked by women. All additional controls are in logarithm and included in levels and first-differences. All variables in levels are lagged one year.
4.3.3. Regulations for temporary contracts
As discussed in Section 2, the overall level of employment protection depends on a mixture of regulations concerning regular and temporary contracts. In countries with rigid dismissal regulations but lax legislation on the use of temporary contracts, firms can circumvent the constraints imposed by lay-off restrictions by opening fixed-term positions. Countries can therefore “choose” different combinations of the two types of regulations and achieve similar degrees of “aggregate flexibility” as regards job flows and employment levels (see Figure 1 above). But do these regulatory choices have the same effect on productivity? In principle, an expansion in temporary work could have opposing effects. On the one hand, in the presence of strict dismissal regulations, temporary contracts allow firms to adapt quickly to changes in technology or product demand and move resources easily into emerging, high productivity but high risk activities. Temporary workers might also display greater work effort than other workers if they perceive that good performance could lead to contract renewal or a permanent job offer (Engellandt and Riphahn, 2005). On the other hand, there is some evidence that temporary workers are less likely to participate in job-related training (e.g. OECD, 2002), or even are more prone to workplace accidents (Guadalupe, 2003). Establishing the impact of legislation for temporary contracts is relevant for policy purposes. Indeed, partial EPL reforms – whereby regulations on temporary contracts are weakened while maintaining strict EPL on regular contracts – have been more frequent in OECD countries in the last two decades (see Figure 2 above), often because they are easier to implement and are typically less opposed by insiders (see e.g. OECD, 2004).
We look at this issue in different ways. First, we augment our baseline specification by including the index of regulation for temporary contracts (EPLT), in such a way that the effect of both types of regulations is simultaneously estimated. This provides also another type of robustness check for our main result, since EPLT is a key confounding factor that we have omitted so far, even though it can affect productivity. Second, we also include an interaction between EPLR and EPLT since the latter is likely to matter more for the overall regulatory stance in countries where the former is more stringent (see e.g. Nunziata and Staffolani, 2007). Finally, we look at the implications of
DISMISSAL REGULATION AND PRODUCTIVITY
42
differences in the impact of the two types of regulation for the measured association between the overall index of EPL and TFP growth.
Table 10 shows the results of this exercise. They are presented for both the turnover-based and layoff-based classifications of EPL-binding industries. A turnover-based classification is arguably more appropriate than a layoff-based one in this case, since EPL for temporary contracts concerns hirings as much as dismissals. In all specifications, stricter regulation for temporary contracts has no or positive impact on TFP. By contrast, it appears that, controlling for EPLT, the estimated effect of EPLR on TFP remains negative, significant and of virtually the same magnitude as in our baseline specifications. In other words, partial EPL reforms, which liberalise only the rules on temporary contracts, do not appear the most promising route to boost productivity. Not surprisingly, the contrasting effects of EPLR and EPLT on productivity are reflected in the weak and often insignificant association between the overall index of EPL and TFP growth.
4.3.4. Other possible heterogeneous effects
Do other institutions and policies affect the relationship between EPLR and productivity? This question is key for policy purposes. In fact, our estimates might capture only relationships prevailing on average in our sample of countries. If the heterogeneity of institutional systems matter, our results might be of limited interest for policy-makers from countries whose institutional framework is far from the OECD average. In particular, the literature points out that coordinated industrial relation systems favour the development of specific skills and internal labour markets (e.g. Hall and Soskice, 2001, among others), which may make dismissal regulation less binding or even positively-related to productivity, at least at low stringency levels (see also section 2 above). Alternatively, it has been argued (e.g. Thesmar and Thoenig, 2004) that financial market development, by improving risk sharing between owners of listed firms, increases the willingness of these firms to take risks. This in turn increases firm-level uncertainty in sales, employment and profits, more so if the labour market is flexible. To the extent that risk-taking behaviours are required to experiment with new technologies, and the willingness to take risks is affected by dismissal regulations, one might expect that dismissal regulations have a greater impact on productivity in countries where the financial market is more developed.

DISMISSAL REGULATION AND PRODUCTIVITY
43
Table 10: EPL, EPLR, EPLT and TFP growth.
Indicator of layoff propensity
US layoffs, quantitative US layoffs, qualitative US job turnover, quantitative US job turnover, qualitative
(1) (2) (3) (4) (5) (6) (7) (8) (9) (10) (11) (12)
Log relative TFP -0.038*** -0.038*** -0.038*** -0.038*** -0.038*** -0.038*** -0.043*** -0.043*** -0.043*** -0.044*** -0.044*** -0.043***
(0.004) (0.004) (0.004) (0.004) (0.004) (0.004) (0.006) (0.006) (0.006) (0.006) (0.006) (0.006)
EPLR × Layoff -0.228*** -0.228*** -0.514*** -0.500** -0.074*** -0.084*** -0.784*** -0.748*** (0.055) (0.060) (0.175) (0.194) (0.024) (0.028) (0.215) (0.248)
EPLT × Layoff 0.041 0.041 0.057 0.070 0.047*** 0.039** 0.354*** 0.385** (0.033) (0.039) (0.106) (0.126) (0.016) (0.018) (0.128) (0.154)
EPLR × EPLT × Layoff
0.000 0.026 -0.017 0.063 (0.044) (0.144) (0.019) (0.181)
EPL (summary index) × Layoff
-0.100** -0.273* 0.012 -0.072 (0.046) (0.141) (0.020) (0.172)
Country/year dum. Yes Yes Yes Yes Yes Yes Yes Yes Yes Yes Yes Yes Industry/year dum. Yes Yes Yes Yes Yes Yes Yes Yes Yes Yes Yes Yes Observations 4180 4180 4180 4180 4180 4180 2860 2860 2860 2860 2860 2860 R2 0.330 0.330 0.328 0.329 0.329 0.328 0.371 0.371 0.367 0.371 0.371 0.367 Notes: Dependent variable: ΔlogTFP (“fully-adjusted” measure), expressed in percentage terms. Robust standard errors in parentheses. ***, **, *: significant at the 1% and 5% level, respectively. EPLR: index of employment protection for regular contracts. EPLT: index of employment protection for temporary contracts. EPL: summary index of employment protection, excluding additional provisions for collective dismissals. Layoff: indicator of layoff propensity. For each industry, indicators of layoff propensity are as follows (by column): 1-3) 2001-2003 industry average of US layoff rates; 4-6) 1 if the US layoff rate is above the US average for all industries in each year between 2001 and 2003 and 0 elsewhere; 7-9) 1991-1996 industry average of US gross job turnover rates; and 10-12) 1 in industries where the US gross job turnover rate is above the US average for manufacturing and energy in each of the years between 1991 and 1996 for which data are available and 0 elsewhere. When interacted with one another, EPLR and EPLT are expressed in deviation from the sample average. All variables are lagged one year. Log relative TFP is expressed in percentage terms.
DISMISSAL REGULATION AND PRODUCTIVITY
44
Table 11: EPLR and TFP growth. Heterogeneous effects.
Indicator of layoff propensity
Quantitative Qualitative
(1) (2) (3) (4) (5) (6)
Log relative TFP -0.039*** -0.039*** -0.039*** -0.039*** -0.038*** -0.039***
(0.004) (0.004) (0.004) (0.004) (0.004) (0.004) EPLR (low segment) × Layoff
-0.182 -0.443 (0.13) (0.39)
EPLR (medium segment) × Layoff
-0.064 -0.446 (0.15) (0.49)
EPLR (high segment) × Layoff
-0.515*** -0.618 (0.19) (0.63)
EPLR × Layoff -0.290** -0.220*** -0.784* -0.460** (0.145) (0.059) (0.445) (0.184)
High corp. × Layoff 0.019 -0.108 (0.344) (1.074)
Medium corp. × Layoff 0.668 0.204 (0.490) (1.726)
EPLR × High corp. × Layoff
0.089 0.306 (0.184) (0.573)
EPLR × Medium corp. × Layoff
-0.144 0.179 (0.213) (0.707)
Stock market cap. × Layoff
-0.187 -0.067 (0.190) (0.543)
EPLR × Stock market cap. × Layoff
-0.076 -0.224 (0.144) (0.420)
Country-year dummies Yes Yes Yes Yes Yes Yes Industry-year dummies Yes Yes Yes Yes Yes Yes Observations 4180 4180 4142 4180 4180 4142 R2 0.331 0.331 0.332 0.329 0.329 0.330 Notes: Dependent variable: ΔlogTFP (“fully-adjusted” measure), expressed in percentage terms. Robust standard errors in parentheses. ***, **,*: significant at the 1%, 5% and 10% level, respectively. All variables are lagged one year. EPLR: index of employment protection for regular contracts. EPLR (low, medium and high segments) are the three segments of a linear spline of EPLR, with knots at 1.7 and 2.65. Stock market capitalisation is normalised by GDP. High and medium corporatism are dummies for high and medium levels of centralisation/coordination of the wage bargaining, respectively. Layoff: indicator of layoff propensity. For each industry, the quantitative indicator of layoff propensity is equal to the 2001-2003 industry average of US layoff rates, while the qualitative one is equal to 1 if the US layoff rate is above the US average for all industries in each year between 2001 and 2003 and 0 elsewhere. Log relative TFP is expressed in percentage terms. All variables are lagged one year. When interacted with one another, EPLR and Stock market capitalisation are expressed in deviation from the sample average.
We take a look at these possible heterogeneous effects in Table 11. First, we examine possible non-linearities in the effect of EPLR, by fitting a continuous piecewise linear function, with knots approximately corresponding to the 33rd and the 67th percentiles of the distribution (Column 1 and 4).35 Looking at point estimates, it appears that the effect of dismissal regulations is stronger for high-stringency levels. However, specification tests show that differences across stringency levels are not significant,36 although this
35 In Appendix 3 (Table A10) we also consider alternative specifications: fitting a quadratic in EPLR or a piecewise linear function of the summary index of EPL instead of EPLR. 36 For each estimated coefficient we are unable to reject the hypothesis that it is equal to the average.
DISMISSAL REGULATION AND PRODUCTIVITY
45
might simply be the result of insufficient variation in the data, as shown by the large standard errors. In other words, our evidence is not inconsistent with, but nevertheless not very supportive of, the hypothesis that the effect of job security provisions on productivity varies according to the stringency level.
Next, we investigate the role played by the degree of corporatism of the industrial relation system in shaping the relationship between firing restrictions and productivity. We find that, although EPLR attracts a less negative coefficient in highly corporatist countries, with coordinated and/or centralised wage-bargaining systems, differences across wage-bargaining types do not appear statistically significant (Column 2 and 5). More importantly, the effect of dismissal regulations that we estimate for highly-corporatist countries is always approximately equal to the effect we estimate for the whole sample in our baseline specification (cf. Table 2). Overall, these results suggest that layoff legislation is likely to matter for TFP growth independently of the prevailing wage-bargaining system, although there might remain some second-order differences in the intensity of the relationship that we are unable to detect, given our data.
Finally, we roughly quantify the level of financial and stock market development by taking the ratio of stock market capitalisation to GDP, drawn from the World Bank’s Financial Structure Dataset and Beck et al. (2000). We then examine whether the relationship between EPLR and TFP growth is more intense when this ratio is larger. We find that, even though the interaction term attracts the right sign, its coefficient is largely insignificant. To put it another way, we find little evidence that financial development significantly affects the impact of dismissal regulations on TFP growth. If any, the effect of financial development on this relationship appears to be of second order.
5. POLICY IMPLICATIONS
Let us summarise our results. First, we find that mandatory dismissal regulations have a depressing impact on TFP growth in industries where layoff restrictions are more likely to be binding. We present a large battery of robustness checks that suggest that our finding is robust. In addition, our results suggest that the estimated relationship is not due to the impact of EPL on labour composition but reflects the effect of layoff restrictions on efficiency improvements and technological change. Insofar as any (positive or negative) impact of dismissal regulations on productivity is likely to be greater in industries where they are more binding, we argued that from our results one can infer that layoff restrictions have a negative impact on aggregate TFP growth, as well. Nevertheless, we are able to provide only a lower bound estimate to the average effect of these regulations. Second, we find no evidence that that these regulatory restrictions affect either adoption of better equipment or technological catch-up with the industry productivity frontier. Third, the dampening impact of EPL on productivity appears to be entirely due to the effect of dismissal regulations, while restrictions on the use of temporary employment have, if any, a positive impact on TFP growth.
There are two key policy implications that can be drawn from these findings. First, reforms of overly strict dismissal regulation in many OECD countries can be justified on
DISMISSAL REGULATION AND PRODUCTIVITY
46
the grounds of fostering TFP growth. Lack of conclusive evidence on the employment impact of EPL is not a good reason for policy inaction. However, relaxing layoff restrictions will be particularly valuable for firms that do not rely only on adoption of technologies developed elsewhere for their productivity growth. Second, partial EPL reforms, facilitating the use of fixed-term and atypical contracts, are unlikely to have an important impact on efficiency and technological change and cannot therefore be a substitute for comprehensive EPL reforms whereby dismissal restrictions for open-ended contracts are also weakened. In other words, even though in recent years many countries have chosen to ease regulations on temporary and atypical contracts to make their labour market more flexible, the pay-off in terms of productivity growth that can be expected from these reforms is very low. Italy, for example, made several reforms in the past 15 years, which created and eased the use of a multiplicity of atypical contracts, without however addressing the difficulty of dismissing workers with open-ended contracts (see also Figure 2 above). While these reforms might have delivered some benefit in terms of employment (see e.g. Boeri and Garibaldi, 2007), it is perhaps not surprising that the Italian productivity and GDP per capita growth was among the lowest in OECD countries during the same period (see e.g. OECD, 2007).
Reforming regular contracts is, however, difficult, since it often raises large opposition by workers. In this context, one interesting reforming strategy has been recently followed by Austria, which in 2003 introduced a system of individual savings accounts to replace redundancy payments for dismissals. Before the reform, employers were required to make severance payments to employees with more than three years service, in the event of termination. The size of the payment increased with employees’ tenure with the employer. Under the new rules, employers now pay a premium of 1.54% of the payroll into an account for each employee for the entire period of the employment contract. In the event of termination, an employee with more than three years of tenure with their current employer chooses between receiving a payment from their savings account and putting the amount in the account towards a future pension. If an employee quits, or is dismissed before reaching three years of tenure, the balance of the account is conserved and additional contributions are made by future employers. The employee continues to accumulate funds over his/her working life, with the balance accessible upon retirement. As the enactment of this individual accounts system entailed only a moderate increase in the financial risk born by workers, it left essentially little scope for opposing its implementation. Nevertheless, this system is likely to significantly increase mobility by removing disincentives for dismissals and voluntary separations.37 Such a reform amounts to a drop of 0.55 points in the EPLR indicator used in this paper. Taking our estimates at face value, in the long-run this would imply that Austria will raise its annual TFP growth in EPL-binding industries by about 0.25 percentage points, which translates into an average estimated growth rate of at least 0.1 percentage points for the whole economy. Although this figure might not seem huge, it would represent an increase in TFP growth by about 10% with respect to the Austrian average of the
37 Although it may also increase labour costs for employers if they are not able to transfer the contribution to employees in the form of lower wages.

DISMISSAL REGULATION AND PRODUCTIVITY
47
previous 20 years. And, as we discuss in this paper, the real effect could well be much greater. In other words, this might be an example of reform path that other countries wish to imitate.
REFERENCES
Aghion P, Harris C, Howitt P and Vickers J (2001) Competition, Imitation and Growth with Step-by-Step Innovation, Review of Economic Studies 68(3): 467-492.
Aghion, P. and P. Howitt (2006), Appropriate Growth Policy: A Unifying Framework, Journal of the European Economic Association, vol.4, pp. 269-314.
Armingeon, K., P. Leimgruber, M. Beyeler and S. Menegale (2005) Comparative Political Data Set 1960-2003, Institute of Political Science, University of Berne.
Autor, D.H., W.R.Kerr and A.D.Kugler (2007), “Do Employment Protections Reduce Productivity? Evidence from U.S. States”, Economic Journal, 117, F189-F217.
Bartelsman, E., A. Bassanini, J.Haltiwanger, R.Jarmin, S.Scarpetta and T.Schank (2004), “The Spread of ICT and Productivity Growth: Is Europe Really Lagging Behind in the New Economy?” in D.Cohen, P.Garibaldi and S.Scarpetta (eds.), The ICT Revolution: Productivity Differences and the Digital Divide, Oxford, Oxford University Press.
Bassanini A. and R. Duval (2006), “Employment Patterns in OECD Countries: Reassessing the Role of Policies and Institutions”, OECD Social, Employment and Migration Working Paper no. 35.
Bassanini A. and S.Scarpetta (2002), “Growth, Technological Change and ICT Diffusion: Recent evidence from OECD countries”, Oxford Review of Economic Policy, 18(3), pp. 324-344.
Bauer, T., Bender, S. and Bonin H. (2007), “Dismissal Protection and Worker Flows in Small Establishments”, Economica, 74, 804-821.
Beck, T., A. Demirgüç-Kunt and R. Levine, (2000), “A New Database on Financial Development and Structure” World Bank Economic Review, 14, 597-605.
Behaghel L., B. Crépon and B. Sédillot (2008), “The Perverse Effects of Partial Employment Protection Reform: Experience Rating and French Older Workers”, Journal of Public Economics, 92, 696-721
Belot, M., J. Boone and J.C. van Ours (2007), “Welfare Effects of Employment Protection”, Economica.
Bentolila, S., and G. Bertola (1990), “Firing costs and labour demand: how bad is eurosclerosis?”, Review of Economic Studies, 57, 381– 402.
Bertola, G. (1990), “Job Security, Employment and Wages,” European Economic Review, 34, pp. 851- 86.
Bertola, G. (1994), ‘Flexibility, Investment, and Growth’, Journal of Monetary Economics, 34(2), 215–238.
Biagi, F., and C. Lucifora (2008), Demographic and Education Effects on Unemployment in Europe, Labour Economics, forthcoming.
Boeri, T. and Garibaldi, P., (2007), "Two Tier Reforms of Employment Protection Legislation. A Honeymoon Effects", The Economic Journal, Volume 117, Issue 521, 357-385.
Boeri, T. and Jimeno, J. (2005), "The effects of employment protection: Learning from variable enforcement", European Economic Review, 49, 2057-2077.
Boone, J. (2008), “A New Way to Measure Competition”, Economic Journal, forthcoming. Burgess, S., Knetter, M., and Michelacci, C. (2000), Employment and Output Adjustment in the
OECD: A Disaggregate Analysis of the Role of Job Security Provisions, Economica, 67, 419-435 Caballero, R., Cowan, K., Engel, E. and Micco, A. (2004), “Effective Labor Regulation and
Microeconomic Flexibility”, Cowles Foundation Discussion Papers 1480. Cappelli, P. (2000), ‘Examining the Incidence of Downsizing and its Effect on Establishment
Performance’, in D. Neumark (Ed.), On the Job, New York: Russell Sage Foundation. Cingano, F., Leonardi, M., Messina, J. and Pica, G. (2008), “Employment Protection Legislation,
Productivity and Investment: Evidence from Italy” mimeo. Crespi, G., C. Criscuolo, J. Haskel and D. Hawkes (2006), “Measuring and Understanding
Productivity in UK Market Services”, Oxford Review of Economic Policy, 22(4), pp. 560-572.

DISMISSAL REGULATION AND PRODUCTIVITY
48
Conway, P., and G. Nicoletti (2006), Product market regulation in the non-manufacturing sectors of OECD countries: measurement and highlights, OECD Economics Department Working Paper 530
DeFreitas, G. and A. Marshall (1998), “Labour Surplus, Worker Rights and Productivity Growth: A Comparative Analysis of Asia and Latin America”, Labour, vol. 12, no. 3, pp. 515-539.
Dew-Becker I. and R.J.Gordon (2008) “The Role of Labor Market Changes in the Slowdown of European Productivity Growth”, NBER Working Paper 13840.
Dolado, J., M., Jansen, and J. Jimeno, (2007) A Positive Analysis of Targeted Employment Protection Legislation, The B.E. Journal of Macroeconomics: Topics, Vol. 7(1), Art. 14.
Drazen, A., and W. Easterly (2001), Do Crises Induce Reforms? Some Empirical Tests of Conventional Wisdom, Economics and Politics, 13(2), 129-157.
Engellandt, A. and R. Riphahn (2004), “Temporary Contracts and Employee Effort”, Labour Economics, 12 (3), 281-299.
Fölster, S. and M. Henrekson (2001), “Growth Effects of Government Expenditure and Taxation in Rich Countries”, European Economic Review, vol. 45, pp. 1501-1520.
Garibaldi, P. (1998), “Job Flow Dynamics and Firing Restrictions.” European Economic Review, 42, No. 2, 245-75.
Griffith, R., S. Redding and J. Van Reenen (2004) “Mapping the Two Faces of R&D: Productivity Growth in a Panel of OECD Industries,”, The Review of Economics and Statistics, Vol. 86(4), pp. 883-895
Guadalupe, M. (2003), “The Hidden Costs of Fixed Term Contracts: The Impact on Work Accidents”, Labour Economics, vol. 10, no.3, pp. 339-357.
Hall, P., and D. Soskice (2001), Varieties of Capitalism, Oxford, Oxford University Press. Haltiwanger, J., S.Scarpetta and H.Schweiger (2006), “Assessing Job Flows across Countries: The
Role of Industry, Firm-Size and Regulations”, IZA Discussion Paper no.2450. Haucap J. and Wey C. (2004), “Unionisation structures and innovation incentives,” Economic
Journal, vol. 114(494), pp. C149-C165. Hopenhayn, H. and R. Rogerson (1993), “Job Turnover and Policy Evaluation: A General
Equilibrium Analysis”, Journal of Political Economy, vol. 101, no. 5, pp. 915-938. House of Lords (2007), Memorandum by the Unquoted Companies Group, Written Evidence
Ordered by the House of Lords, London: House of Lords, European Union Committee Publications.
Ichino, A. and R.T. Riphahn (2005), “The Effect of Employment Protection on Worker Effort: A Comparison of Absenteeism During and After Probation”, Journal of the European Economic Association, 3(1), 120-143.
Ichino, A. M. Polo and E. Rettore (2004), “Are Judges Biased by Labour Market Conditions?”, European Economic Review.
Inklaar, R., Timmer, M.P. and B. van Ark (2008), “Market Services Productivity Across Europe and the US”, Economic Policy.
Jorgenson, D.W. (1966), The Embodiment Hypothesis, Journal of Political Economy, 74(1), 1-17. Kugler, A. and Pica, G. (2008), “Effects of Employment Protection on Worker and Job Flows:
Evidence from the 1990 Italian Reform”, Labour Economics, Volume 15, Issue 1, 78-95. Koeniger, W. (2005), “Dismissal Costs and Innovation”, Economics Letters, vol. 88, no. 1, pp. 79-
85. Koszerek, D., K. Havik, K. Mc Morrow, W. Röger and F. Schönborn (2007), “An overview of the
EU KLEMS Growth and Productivity Accounts”, European Economy Economic Papers 290, Brussels: European Commission.
Lagos, R. (2006), “A Model of TFP”, Review of Economic Studies, vol. 73, no. 4, pp. 983-1007. Lando, O. (2001), Nordic Countries, a Legal Family? A Diagnosis and a Prognosis, Global Jurist
Advances, 1(2), Art. 5. La Porta, R., A. Shleifer, F. Lopez-de-Silanes, and R. Vishny (1998), Law and Finance, Journal of
Political Economy. Lazear, E.P (1990), Job Security Provisions and Employment, Quarterly Journal of Economics,
105(3), 699-726. Messina, J. and Vallanti, G. (2007), “Job Flow Dynamics and Firing Restrictions: Evidence from
Europe”, The Economic Journal, 117, F279-F301. Micco, A. and C. Pages (2006), “The Economic Effects of Employment Protection: Evidence from
International Industry-Level Data”, IZA Discussion Paper no. 2433.
DISMISSAL REGULATION AND PRODUCTIVITY
49
Mortensen, D. T. and C. A. Pissarides (1994) “Job Creation and Job Destruction in the Theory of Unemployment”, Review of Economic Studies, 61(3), 397-415.
Mortensen, D. and Pissarides, C. A. (1999), “Unemployment responses to ‘skill biased’ shocks: The role of labor market policy”, Economic Journal, 109, 242-265.
Nickell, S. (1978), Fixed costs, employment and labour demand over the cycle. Economica, 1, 329– 345, (November).
Nickell, S. and R.Layard (1999), “Labor Market Institutions and Economic Performance”, in O.Ashenfelter and D.Card (eds), Handbook of Labor Economics, Elsevier.
Nickell, S., L. Nunziata and W. Ochel (2005), “Unemployment in the OECD Since the 1960s: What Do We Know?”, The Economic Journal, Vol. 115, No. 500, January.
Nicoletti, G. and S. Scarpetta (2003), “Regulation, Productivity and Growth: OECD Evidence”, Economic Policy, vol. 18, no. 36, pp. 9-72.
Nunziata, L., and S. Staffolani (2007), “Short-term contracts and dynamic labour demand: theory and evidence”, Scottish Journal of Political Economy, Vol. 54, No. 1, February.
O'Brien, K. (1999), ed., Atlas of World History, Oxford, Oxford University Press. OECD (1999), OECD Employment Outlook, OECD, Paris. OECD (2002), OECD Employment Outlook, OECD, Paris. OECD (2004), OECD Employment Outlook, OECD, Paris. OECD (2006), OECD Employment Outlook, OECD, Paris. OECD (2007), OECD Employment Outlook, OECD, Paris. Pierre, G. and Scarpetta, S. (2005), “Employment protection: Do firms' perceptions match with
legislation?”, Economics Letters, 90, 328-334. Pissarides, C. (2001). "Employment protection". Labour Economics, 8, 131–59. Poschke, M. (2007), "Employment protection, firm selection, and growth", IZA Discussion Paper. Rajan, R and L. Zingales (1998), "Financial Dependence and Growth", American Economic Review,
88, 559-586. Riphahn, R. (2005), "Employment protection and effort among German employees", Economics
Letters, 85, 353-357. Saint-Paul, G. (2002), “Employment Protection, International Specialization, and Innovation”,
European Economic Review, vol. 46, no. 2, pp. 375-395. Samaniego, R. (2006), Employment protection and high-tech aversion, Review of Economic
Dynamics, 9(2), 224-241. Schivardi F. and Torrini R., (2008), “Identifying the Effects of Firing Restrictions Through Size-
Contingent Differences in Regulation”, Labour Economics, 15(2). Shirer, W.L. (1960), The Rise and Fall of the Third Reich, New York: Simon and Schuster. Sigeman, T. (2002), Employment protection in Scandinavian Law, Scandinavian Studies in
Law, 43, 257-275. Smits, J.M. (2007), “Nordic Law in a European Context: Some Comparative Observations”, in J.
Husa et al. (eds) “Nordic Law: Between Tradition and Dynamism”, Antwerp and Oxford: Intersentia.
Soskice, D. (1997), “German Technology Policy, Innovation and National Institutional Frameworks”, Industry and Innovation, vol. 4, no. 1, pp. 75-96.
Thesmar, D. and M. Thoenig (2004), “Financial Market Development and the Rise in Firm Level Uncertainty”, CEPR Discussion Paper 4761.
Teixeira, P. (2001), “Labour Market Transitions in Portugal, Spain and Poland”, Estudios do GEMF 5/2001, University of Coimbra.
Wasmer, E. (2006), “General versus Specific Skills in Labor Markets with Search Frictions and Firing Costs”, American Economic Review, vol. 96, no. 3, pp. 811-831.
Wooldridge, J.M. (1995) Score diagnostics for linear models estimated by two stage least squares, in G.S. Maddala, P.C.B. Phillips, and T.N. Srinivasan (eds.), Advances in Econometrics and Quantitative Economics: Essays in Honor of Professor C.R. Rao, Oxford: Blackwell.
Zagler, M. and G. Durnecker (2003), “Fiscal Policy and Economic Growth”, Journal of Economic Surveys, 17, 397-418.

DISMISSAL REGULATION AND PRODUCTIVITY
50
APPENDIX 1: Data sources, definitions and descriptive statistics
EPL indicators
We use three indices for different aspects of EPL (source: OECD, 2004): EPLR refers to regulations for individual dismissals for regular contracts; EPLT refers to hiring and firing regulations for fixed-term contracts; and EPLC refers to additional legislation concerning collective dismissals. The scale of all indicators is 0-6 from least to most restrictive. Table A1 details components of each index and provides the scoring procedure and aggregation weights used to construct each index. The summary indicator of EPL used in the analysis is the simple average of EPLR and EPLT. The refined indicator of EPLR, that takes into account collective dismissals, is a weighted average of EPLR (time-varying) and EPLC (in 1998) with weights 5/7 and 2/7.
Other aggregate variables: sources and definitions.
The following aggregate variables are drawn from Bassanini and Duval (2006). Tax wedge: percentage ratio between the net take-home pay and the labour cost for the employer for a single-earner couple with two children earning 100% of the earnings of an average production worker (APW). Unemployment benefits: Average unemployment benefit replacement rate across two income situations (100% and 67% of APW earnings), three family situations (single, with dependent spouse, with spouse in work) and three different unemployment durations (first year, second and third years, and fourth and fifth years of unemployment). Product market regulation: OECD summary indicator of regulatory impediments to product market competition in seven non manufacturing industries, which covers regulations and market conditions in seven energy and service industries: gas, electricity, post, telecommunications (mobile and fixed services), passenger air transport, railways (passenger and freight services) and road freight and varies between 0 and 6 from least to most stringent. Degree of corporatism: Indicator of the degree of centralisation/co-ordination of the wage bargaining processes, which takes values 1 for decentralised and uncoordinated processes, and 2 and 3 for medium and high degrees of centralisation/co-ordination, respectively. Dummies are constructed out of this indicator. Collective bargaining coverage: Average share of workers covered by a collective agreement, in percentage.
The ratio of nominal stock market capitalisation to GDP is drawn from the World Bank’s Financial Structure Dataset. We extend time series before 1989 as follows: we regress annual changes of this ratio on the similarly defined ratio in Beck et al. (2000) for the years in which both are available. We then iteratively subtract predicted changes for the years 1982-1989 from the 1989 ratio to obtain our final time-series.
Legal system variables are constructed from various sources: the distinction between common law and civil law systems is available in several international databases, such as La Porta et al. (1998). Information on civil codes is from the Lexadin database (http://www.lexadin.nl/wlg/legis/nofr/legis.php) and Lando (2001).

DISMISSAL REGULATION AND PRODUCTIVITY
51
Table A1: Components of EPL indicators and their aggregation weights
Panel A: EPLR
Item (weight) Original unit and short description
Assigned strictness score
0 1 2 3 4 5 6 Delay involved before notice can start (1/6)
Days (Estimated) ≤ 2 < 10 < 18 < 26 < 35 < 45 ≥ 45
Notification procedures (1/6)
Oral or written statements, notification to a third party (such as works council or
the competent labour authority), authorisation to
be requested
0, when an oral statement is enough; 2, when a written statement of the reasons for dismissal must be supplied to the employee; 4, when a third party
must be notified; 6; when the employer cannot proceed to dismissal without authorisation from a
third party.
Notice period (1/21 for each tenure category)
Length in months (at 9 months) 0 ≤ 0.4 ≤ 0.8 ≤ 1.2 < 1.6 < 2 ≥ 2
Length in months (at 4 years) 0 ≤ 0.75 ≤ 1.25 < 2 < 2.5 < 3.5 ≥ 3.5
Length in months (at 20 years) < 1 ≤ 2.75 < 5 < 7 < 9 < 11 ≥ 11
Severance pay (4/63 for each tenure category)
Months pay (at 9 months) 0 ≤ 0.5 ≤ 1 ≤ 1.75 ≤ 2.5 < 3 ≥ 3 Months pay at (at 4 years) 0 ≤ 0.5 ≤ 1 ≤ 2 ≤ 3 < 4 ≥ 4 Months pay (at 20 years) 0 ≤ 3 ≤ 6 ≤ 10 ≤ 12 ≤ 18 > 18
Definition of justified or unfair dismissal (1/12)
Legal definition
0, when worker capability or redundancy of the job are sufficient ground for dismissal; 2, when social
considerations, age or job tenure must when possible influence the choice of which worker(s) to
dismiss; 4, when a transfer and/or a retraining to adapt the worker to different work must be
attempted prior to dismissal; 6, when worker capability or redundancy of the job cannot be a
ground for dismissal.
Length of trial period (1/12) Months ≥ 24 > 12 > 9 > 5 > 2.5 ≥ 1.5 < 1.5
Compensation after unfair dismissal (1/12)
Months pay ≤ 3 ≤ 8 ≤ 12 ≤ 18 ≤ 24 ≤ 30 > 30
Reinstatement (1/12)
Extent of reinstatement: conditions under which, after a finding of unfair
dismissal, the employee has the option of reinstatement into his/her previous job, even if this is against the wishes of the employer.
0, never; 1, reinstatement ordered only after violation of specific laws (such as anti-
discrimination laws); 2, reinstatement orders are possible but rare; 3, courts may order reinstatement
with back pay or compensation; 4, frequent reinstatement orders with back pay or
compensation; 5, Unfair dismissal gives rise to a right to reinstatement, except in cases where court decides that the employer cannot be fairly required
to reinstate the employee in question; 6, always.

DISMISSAL REGULATION AND PRODUCTIVITY
52
Table A1 (cont.)
Panel B: EPLT
Item (weight) Original unit and short description
Assigned strictness score
0 1 2 3 4 5 6
Valid cases for use of fixed-term contracts (1/4)
Conditions under which the use of fixed-term contracts
is allowed
0, fixed-term contracts are permitted only for "objective" or "material situation", i.e. to perform a task which itself is of fixed duration; 2, if specific exemptions apply to situations of employer need (e.g. launching a new activity) or employee need (e.g. workers in search of their first job); 4, when
exemptions exist on both the employer and employee sides; 6, when there are no restrictions on
the use of fixed-term contracts.
Maximum number of successive fixed-term contracts (1/8)
Number No limit ≥ 5 ≥ 4 ≥ 3 ≥ 2 ≥ 1.5 < 1.5
Maximum cumulated duration of successive fixed-term contracts (1/8)
Months No limit ≥ 36 ≥ 30 ≥ 24 ≥ 18 ≥ 12 < 12
Types of work for which temporary work agency (TWA) employment is legal (1/4)
Extent and type of restrictions to TWA
employment
Scale (0-4) × 6/4. 0, when TWA employment is illegal; between 0 and 4 when TWA employment is
legal but restrictions apply (the score being proportional to the severity of the restriction); 4
when no restriction applies.
Restrictions on the number of renewals of TWA contracts (1/8)
Yes/No 0 if No, 6 if Yes
Maximum cumulated duration of TWA contracts (1/8)
Months No limit ≥ 36 ≥ 24 ≥ 18 ≥ 12 > 6 ≤ 6
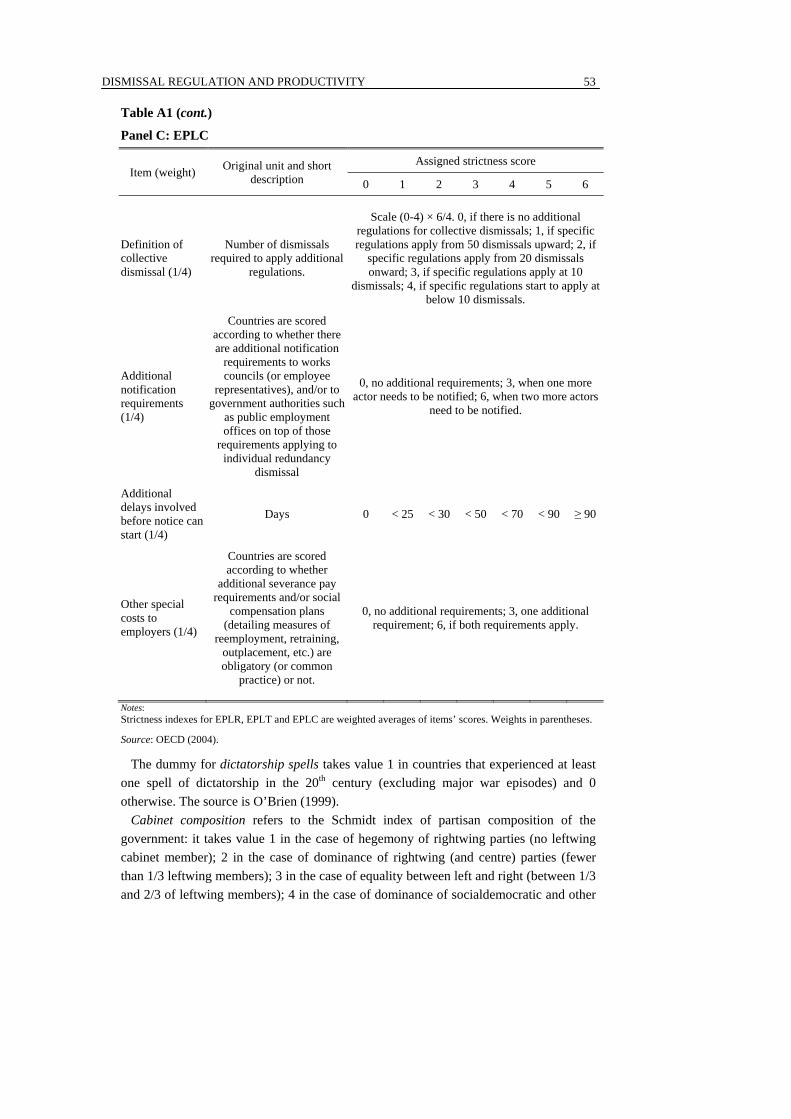
DISMISSAL REGULATION AND PRODUCTIVITY
53
Table A1 (cont.)
Panel C: EPLC
Item (weight) Original unit and short description
Assigned strictness score
0 1 2 3 4 5 6
Definition of collective dismissal (1/4)
Number of dismissals required to apply additional
regulations.
Scale (0-4) × 6/4. 0, if there is no additional regulations for collective dismissals; 1, if specific regulations apply from 50 dismissals upward; 2, if
specific regulations apply from 20 dismissals onward; 3, if specific regulations apply at 10
dismissals; 4, if specific regulations start to apply at below 10 dismissals.
Additional notification requirements (1/4)
Countries are scored according to whether there are additional notification
requirements to works councils (or employee
representatives), and/or to government authorities such
as public employment offices on top of those
requirements applying to individual redundancy
dismissal
0, no additional requirements; 3, when one more actor needs to be notified; 6, when two more actors
need to be notified.
Additional delays involved before notice can start (1/4)
Days 0 < 25 < 30 < 50 < 70 < 90 ≥ 90
Other special costs to employers (1/4)
Countries are scored according to whether
additional severance pay requirements and/or social
compensation plans (detailing measures of
reemployment, retraining, outplacement, etc.) are obligatory (or common
practice) or not.
0, no additional requirements; 3, one additional requirement; 6, if both requirements apply.
Notes: Strictness indexes for EPLR, EPLT and EPLC are weighted averages of items’ scores. Weights in parentheses.
Source: OECD (2004).
The dummy for dictatorship spells takes value 1 in countries that experienced at least one spell of dictatorship in the 20th century (excluding major war episodes) and 0 otherwise. The source is O’Brien (1999).
Cabinet composition refers to the Schmidt index of partisan composition of the government: it takes value 1 in the case of hegemony of rightwing parties (no leftwing cabinet member); 2 in the case of dominance of rightwing (and centre) parties (fewer than 1/3 leftwing members); 3 in the case of equality between left and right (between 1/3 and 2/3 of leftwing members); 4 in the case of dominance of socialdemocratic and other

DISMISSAL REGULATION AND PRODUCTIVITY
54
leftwing parties (more than 2/3 of leftwing members); 5 in the case of hegemony of leftwing parties (only leftwing members). Data are from Armingeon et al. (2005). A value of 3 is assigned to Italy in 1995 in replacement of a missing value.
Descriptive statistics for these and industry-level data (see below) are available in Table A2.
Industry data: sources and definitions
Data for TFP (levels, growth and relative levels) come from Inklaar et al. (2008) and the March 2007 public release of EUKLEMS (http://www.euklems.net). “Broadly-defined” TFP is obtained using a decomposition based on capital stocks and nominal factor shares, while “fully-adjusted” TFP is based on a decomposition using capital services, obtained by deflating capital assets using quality-adjusted price indices and aggregating them using the user costs of each asset as weights. Both measures are computed using industry-specific output purchasing power parities to convert output and inputs of all industries into a common currency.
R&D Intensity is the ratio between nominal business enterprise expenditure in R&D (BERD) to nominal value added. Value added is from the OECD STAN Database, while BERD is from the related BERD Database. For Austria, which is not included in the BERD Database, the OECD R&D Database is used. We interpolate the logarithm of R&D intensity when data for no more than two consecutive years are missing.
The regulation impact indicator, developed by Conway and Nicoletti (2006) is based on the idea that regulation in one industry has also an impact in another industry through forward linkages. It is computed as follows:
∑=
=J
jjtjkkt PMRwRI
1
where RIkt is the indicator in industry k at time t, PMRjt is the indicator of anti-competitive regulation in industry j at time t (which is available only in – typically highly-regulated – non-manufacturing industries, while it is set to 0 in manufacturing) and the weight wjk is the jk coefficient of the inverse Leontief matrix, obtained from (harmonised) input-output tables for OECD countries. Coefficients of the inverse Leontief matrix describe how many units of an industry’s output have to be produced at any stage of the value chain in order to produce one unit for final demand. For any industry pair j,k such as k≠j, the coefficient w measures the direct and indirect requirement of inputs from industry j to produce one unit for final demand in industry k. The coefficient for the industry’s own output (wjj) is typically large and close to 1, implying a large weight for the same industry’s PMR indicator in the RI indicator for that industry. As a result, in highly-regulated non-manufacturing industries, RI is highly correlated with PMR and essentially captures the direct impact of competition. Therefore, industry averages of these regulation impact indicators are not comparable across industries, and industry dummies must be included when they are used in a regression model. Obviously, the main limitation of this indicator is that it is based on
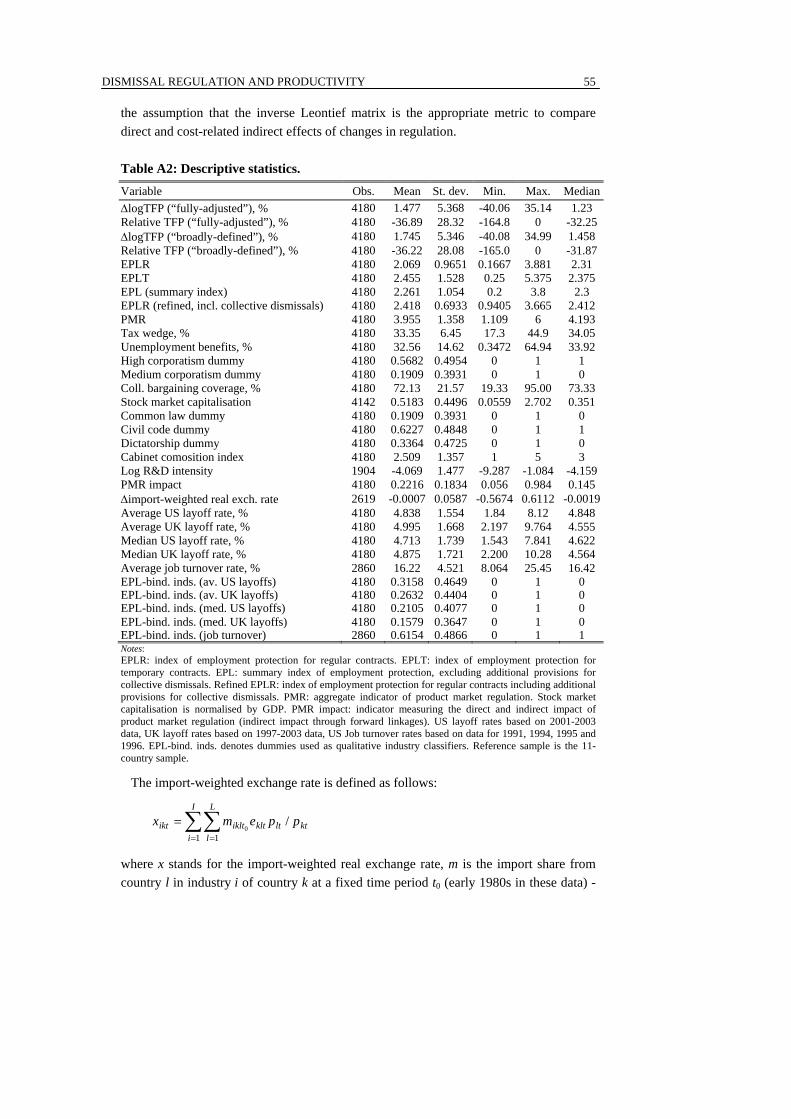
DISMISSAL REGULATION AND PRODUCTIVITY
55
the assumption that the inverse Leontief matrix is the appropriate metric to compare direct and cost-related indirect effects of changes in regulation. Table A2: Descriptive statistics.
Variable Obs. Mean St. dev. Min. Max. Median ΔlogTFP (“fully-adjusted”), % 4180 1.477 5.368 -40.06 35.14 1.23 Relative TFP (“fully-adjusted”), % 4180 -36.89 28.32 -164.8 0 -32.25 ΔlogTFP (“broadly-defined”), % 4180 1.745 5.346 -40.08 34.99 1.458 Relative TFP (“broadly-defined”), % 4180 -36.22 28.08 -165.0 0 -31.87 EPLR 4180 2.069 0.9651 0.1667 3.881 2.31 EPLT 4180 2.455 1.528 0.25 5.375 2.375 EPL (summary index) 4180 2.261 1.054 0.2 3.8 2.3 EPLR (refined, incl. collective dismissals) 4180 2.418 0.6933 0.9405 3.665 2.412 PMR 4180 3.955 1.358 1.109 6 4.193 Tax wedge, % 4180 33.35 6.45 17.3 44.9 34.05 Unemployment benefits, % 4180 32.56 14.62 0.3472 64.94 33.92 High corporatism dummy 4180 0.5682 0.4954 0 1 1 Medium corporatism dummy 4180 0.1909 0.3931 0 1 0 Coll. bargaining coverage, % 4180 72.13 21.57 19.33 95.00 73.33 Stock market capitalisation 4142 0.5183 0.4496 0.0559 2.702 0.351 Common law dummy 4180 0.1909 0.3931 0 1 0 Civil code dummy 4180 0.6227 0.4848 0 1 1 Dictatorship dummy 4180 0.3364 0.4725 0 1 0 Cabinet comosition index 4180 2.509 1.357 1 5 3 Log R&D intensity 1904 -4.069 1.477 -9.287 -1.084 -4.159 PMR impact 4180 0.2216 0.1834 0.056 0.984 0.145 Δimport-weighted real exch. rate 2619 -0.0007 0.0587 -0.5674 0.6112 -0.0019 Average US layoff rate, % 4180 4.838 1.554 1.84 8.12 4.848 Average UK layoff rate, % 4180 4.995 1.668 2.197 9.764 4.555 Median US layoff rate, % 4180 4.713 1.739 1.543 7.841 4.622 Median UK layoff rate, % 4180 4.875 1.721 2.200 10.28 4.564 Average job turnover rate, % 2860 16.22 4.521 8.064 25.45 16.42 EPL-bind. inds. (av. US layoffs) 4180 0.3158 0.4649 0 1 0 EPL-bind. inds. (av. UK layoffs) 4180 0.2632 0.4404 0 1 0 EPL-bind. inds. (med. US layoffs) 4180 0.2105 0.4077 0 1 0 EPL-bind. inds. (med. UK layoffs) 4180 0.1579 0.3647 0 1 0 EPL-bind. inds. (job turnover) 2860 0.6154 0.4866 0 1 1 Notes: EPLR: index of employment protection for regular contracts. EPLT: index of employment protection for temporary contracts. EPL: summary index of employment protection, excluding additional provisions for collective dismissals. Refined EPLR: index of employment protection for regular contracts including additional provisions for collective dismissals. PMR: aggregate indicator of product market regulation. Stock market capitalisation is normalised by GDP. PMR impact: indicator measuring the direct and indirect impact of product market regulation (indirect impact through forward linkages). US layoff rates based on 2001-2003 data, UK layoff rates based on 1997-2003 data, US Job turnover rates based on data for 1991, 1994, 1995 and 1996. EPL-bind. inds. denotes dummies used as qualitative industry classifiers. Reference sample is the 11-country sample.
The import-weighted exchange rate is defined as follows:
∑∑= =
=I
i
L
lktltkltikltikt ppemx
1 1
/0
where x stands for the import-weighted real exchange rate, m is the import share from country l in industry i of country k at a fixed time period t0 (early 1980s in these data) -

DISMISSAL REGULATION AND PRODUCTIVITY
56
the import weights thus vary across industries and countries but are constant over time, e is the nominal bilateral exchange rate between countries k and l at time t - which varies across partner countries and time, but not across industries, ps refer to price levels, as approximated by the GDP deflator, in countries l and k. An increase in the industry-specific exchange rate represents a real depreciation in the price of output produced in industry i of country k relative to its trading partners (weighted by import shares). As real exchange rates are not comparable across countries, only variations of this indicator are comparable across countries and industries. Source: OECD (2007).
Layoff and turnover data: sources and construction details
For each industry, the layoff rate is defined in this paper as the percentage ratio between annual recorded layoffs in a particular year and wage and salary employment of that year. In order to compute US layoff rates by industry and year, data from the 2004 CPS Displaced Workers Supplement are used. An individual is considered to have been laid off if he/she lost his/her job in the period covered by the survey (2001-2003), because of plant closing or moved, insufficient work, or position or shift abolished. Only wage and salary employees in the private for profit sector are considered. The use of the 2004 CPS is dictated by the classification of industries. As only employment in 2004 is available, for each industry, denominators are adjusted by subtracting from each industry’s 2004 employment the corresponding rate of employment change reported in EUKLEMS (March 2007 public release) for that industry. In order to compute UK layoff rates by industry and year, we use data from all waves of the UK Quarterly Labour Force that match our sample and report layoffs at the industry level (1997-2003). An individual is considered to have been laid off if he/she was made redundant in the period covered by the survey (a quarter). Only wage and salary employees in the private sector are considered. Data on gross job turnover rates are from Haltiwanger et al. (2006). For each industry, the industry job turnover rate is defined in this paper as the percentage ratio of annual gross job turnover in a particular year to the average of the employment of that and the preceding year. Industry-level data on employment and gross job turnover are aggregated from establishment level data (assuming, for continuing establishments, that net employment changes are equal to gross employment changes). Job turnover data are available for 1991, 1994, 1995 and 1996. Due to the different classification of industries data are available only for manufacturing and energy.
Table A3 reports average layoff and turnover rates, by industry, while Table A4 reports the Spearman rank correlation between these distributions. Table A5 shows results from different analyses of variance/covariance of the distribution of layoff rates, used in the paper to assess (i) the relative importance of industry-specific factors in accounting for layoffs, and (ii) the relative performance of indicators based on US layoffs, UK layoffs, and turnover in explaining the distribution of layoffs across countries, industries and years, where data are available.
Qualitative industry classifiers are also used in the paper. In qualitative classifiers based on average layoffs, an industry is labelled EPL-binding if its layoff rate in each

DISMISSAL REGULATION AND PRODUCTIVITY
57
year is greater than the layoff rate for the total economy in that year. In qualitative classifiers based on median layoffs, an industry is labelled EPL-binding if its layoff rate in each year is greater than the median of the distribution of layoffs across available industries in that year. In qualitative classifiers based on average job turnover, an industry is labelled EPL-binding if its layoff rate in each year is greater than the turnover rate for manufacturing and energy in that year.
Table A3: List of industries, average layoff rates, average job turnover rates
Industry ISIC Rev. 3 Code
US layoff rates (2001-2003)
UK layoff rates(1997-2003)
US job turnover rates (1991-1996)
Food and beverages 15-16 2.83 4.17 12.29 Textiles, wearing app. and leather 17-19 6.58 9.76 21.97 Wood and wood products 20 6.64 6.54 25.45 Paper, printing and publishing 21-22 4.27 4.56 14.35 Coke, refined petroleum, nuclear fuel 23 5.59 4.34 6.54 Chemicals and chemical products 24 3.09 4.05 12.21 Rubber and plastics 25 4.88 5.58 16.89 Non-metallic mineral products 26 4.85 5.37 17.43 Basic metals and fabricated metal 27-28 5.64 5.53 17.00 Machinery n.e.c. 29 5.42 5.40 16.00 Electrical and optical equipment 30-33 8.12 6.54 16.42 Transport equipment 34-35 4.53 4.54 11.73 Manufacturing, n.e.c.; recycling 36-37 5.95 6.76 21.03 Electricity, gas and water supply E 1.84 3.56 8.06 Construction F 5.69 5.86 Motor trade and repair 50 3.01 3.33 Wholesale trade 51 3.95 3.96 Retail trade 52 3.24 2.20 Hotels and restaurants H 3.35 2.79 Transport and storage 60-63 4.33 3.55 Post and telecommunications 64 6.72 4.18 Financial intermediation J 2.63 2.85 Notes: Rates are in percentage. US layoff rates are 2001-2003 averages, UK layoff rates are 1997-2003 averages, US Job turnover rates are averages across 1991, 1994, 1995 and 1996. Industries in italics indicate those with US layoff rates above the US average for all industries in each of the years 2001-2003.
Sources: Authors’ computation from the 2004 CPS Displaced Workers Supplement, UK QLFS 1997-2003 all quarters, Haltiwanger et al. (2006) and EUKLEMS, March 2007 release.
Table A4: Spearman rank correlations between layoff and turnover rates.
UK layoff rates (1997-2003)
US job turnover rates (1991-1996)
US layoff rates (2001-2003) 0.80 0.62
(0.00) (0.02)
UK layoff rates(1997-2003) 0.78 (0.00)
Notes: Spearman’s rank correlation coefficients (P-values in parentheses). Distributions considered are those of average rates by industry, shown in Table A3. See also notes to Table A3.

DISMISSAL REGULATION AND PRODUCTIVITY
58
Table A5: Percentage share of the variance of the distribution of layoff rates explained by different variables
Sample (1) US only
(2) UK only
(3) US and UK
(4) US and UK
(5) US and UK
(6) US and UK,
manufacturing
(7) US and UK,
manufacturing
(8) US and UK,
manufacturing
Industry dummies 52.50 60.66 51.84Country-by-year dummies 7.26 3.26 4.55 4.55 4.55 7.20 7.20 7.20 US Layoff rate 38.55 32.22UK Layoff rate 49.62 40.76US job turnover rate 25.99 Total explained variance 59.76 63.92 56.38 43.10 54.17 39.42 47.95 33.19 Observations 66 154 220 220 220 140 140 140 Notes: The table shows the percentage share of the variance explained by different variables and groups of dummy variables included in regression models where layoff rates by country, industry and year are the dependent variable. No additional variable is included. The total explained variance of the model is equal to the R-squared of the regression (expressed in percentage terms). US layoff rate is the 2001-2003 US average of layoff rates, by industry. UK layoff rate is the 1997-2003 UK average of layoff rates, by industry. US job turnover rate is the 1991-1996 US average of job turnover rates, by industry. Interpretation: the table shows that 52.5% of the cross-industry/time-series variance of the US layoff rates is explained by industry dummies only (Column 1).
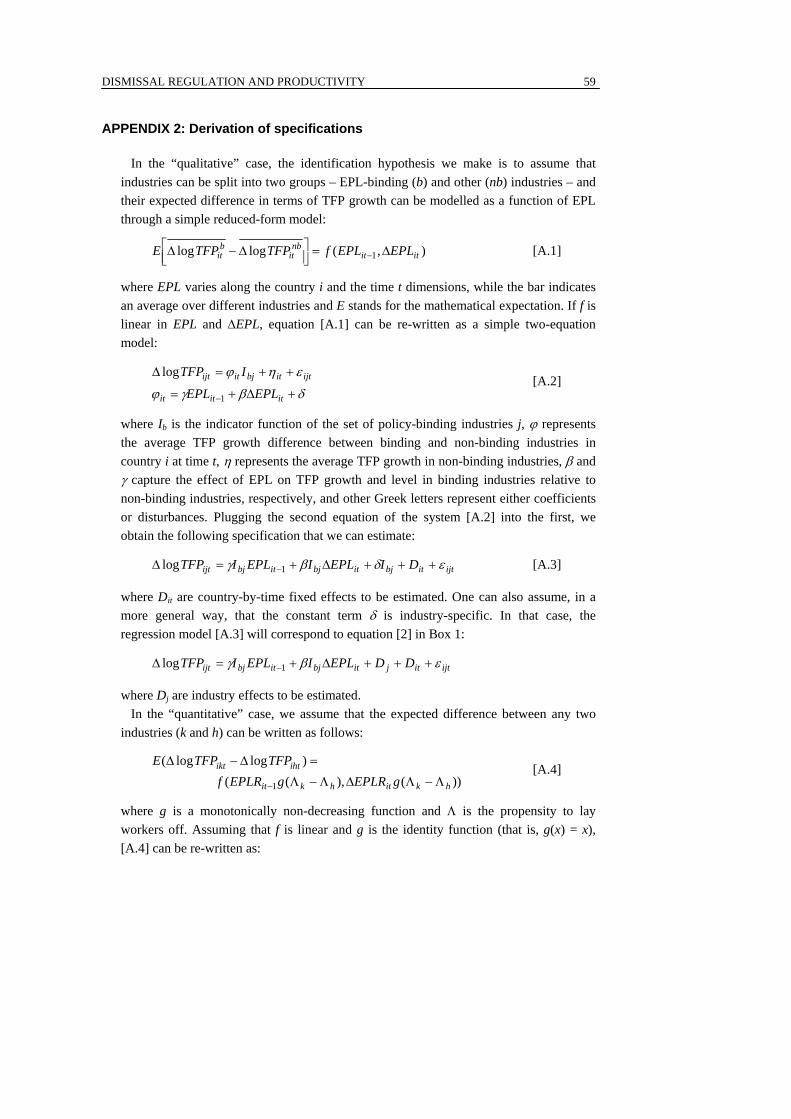
DISMISSAL REGULATION AND PRODUCTIVITY
59
APPENDIX 2: Derivation of specifications
In the “qualitative” case, the identification hypothesis we make is to assume that industries can be split into two groups – EPL-binding (b) and other (nb) industries – and their expected difference in terms of TFP growth can be modelled as a function of EPL through a simple reduced-form model:
),(loglog 1 ititnb
itb
it EPLEPLfTFPTFPE Δ=⎥⎦⎤
⎢⎣⎡ Δ−Δ − [A.1]
where EPL varies along the country i and the time t dimensions, while the bar indicates an average over different industries and E stands for the mathematical expectation. If f is linear in EPL and ΔEPL, equation [A.1] can be re-written as a simple two-equation model:
δβγϕ
εηϕ
+Δ+=
++=Δ
− ititit
ijtitbjitijt
EPLEPL
ITFP
1
log [A.2]
where Ib is the indicator function of the set of policy-binding industries j, ϕ represents the average TFP growth difference between binding and non-binding industries in country i at time t, η represents the average TFP growth in non-binding industries, β and γ capture the effect of EPL on TFP growth and level in binding industries relative to non-binding industries, respectively, and other Greek letters represent either coefficients or disturbances. Plugging the second equation of the system [A.2] into the first, we obtain the following specification that we can estimate:
ijtitbjitbjitbjijt DIEPLIEPLITFP εδβγ +++Δ+=Δ −1log [A.3]
where Dit are country-by-time fixed effects to be estimated. One can also assume, in a more general way, that the constant term δ is industry-specific. In that case, the regression model [A.3] will correspond to equation [2] in Box 1:
ijtitjitbjitbjijt DDEPLIEPLITFP εβγ +++Δ+=Δ −1log
where Dj are industry effects to be estimated. In the “quantitative” case, we assume that the expected difference between any two
industries (k and h) can be written as follows:
))(),((
)loglog(
1 hkithkit
ihtikt
gEPLRgEPLRfTFPTFPE
Λ−ΛΔΛ−Λ
=Δ−Δ
−
[A.4]
where g is a monotonically non-decreasing function and Λ is the propensity to lay workers off. Assuming that f is linear and g is the identity function (that is, g(x) = x), [A.4] can be re-written as:

DISMISSAL REGULATION AND PRODUCTIVITY
60
hithith
kitkitkihtikt
EPLREPLREPLREPLRTFPETFPE
δγβδγβ
−ΔΛ−Λ−
+ΔΛ+Λ=Δ−Δ
−
−
1
1
)log()log(
[A.5]
This is equivalent to assume that the expected TFP growth of any industry j is given by
itjitjitjijt EPLREPLRTFPE ηδγβ ++ΔΛ+Λ=Δ −1)log( , [A.6]
where ηit are factors that are common to all industries: in fact [A.5] can be obtained by simply subtracting [A.6] for industry h from [A.6] for industry k. In turn, this implies that TFP growth in industry j can be estimated using equation [2’] in Box 1:
ijtitjitjitjijt DDEPLEPLTFP εβγ +++ΔΛ+Λ=Δ −1log
The Schumpeterian growth literature suggests that appropriate models of productivity growth at the industry (or firm) level should include, as explanatory variables for industries in countries that are not on the productivity frontier, the productivity growth of the industry productivity leader as well as the productivity gap (in level terms) between each observation and the industry productivity leader (Aghion and Howitt, 2006; Griffith, Redding and van Reenen, 2004). In the “qualitative” case this implies that [A.2] applies only to the productivity leader, while, in the case of productivity followers, [A.2] becomes:
δβγϕ
εηϕφψ
+Δ+=
+++−Δ=Δ
−
−−
ititit
ijtitbjitFjtijt
Fjtijt
EPLEPL
ITFPTFPTFPTFP
1
11 )/log(loglog [A.7]
where F denotes the world productivity frontier for that industry. Putting together [A.7], for productivity followers and [A.2] for the productivity leader, and plugging the second equation of [A.7] into the first, we obtain:
ijtitjitbjitbj
Fjtijt
Fjtijtijt
EPLIEPLI
TFPTFPTFPTFP
εηδγβ
φψ
++++Δ+
−−Δ=Δ −−
)log(logloglog 11 ,
where ψijt =ψ if Fjtijt TFPTFP 11 −− ≠ and 0 otherwise, from which the empirical
specification corresponding to equation [3] in Box 1 can be derived. A similar argument can be developed as regards the “quantitative” case, whose “Schumpeterian” version of equation [A.6] for productivity followers is:
itjitjitj
Fjtijt
Fjtijt
EPLREPLR
TFPTFPTFPTFPE
ηδγβ
φψ
++ΔΛ+Λ+
−Δ=Δ
−
−−
1
11
)/log(log)log(.

DISMISSAL REGULATION AND PRODUCTIVITY
61
APPENDIX 3: Additional Tables
Table A6: Alternatives to baseline specifications (5-year differences and FGLS).
Panel A: 5-year differences
Indicator of layoff propensity (1a) Quantitative
(2a) Quantitative
(3a) Qualitative
(4a) Qualitative
Relative TFP -0.041*** -0.041*** -0.041*** -0.041***
(0.005) (0.005) (0.005) (0.005)
EPLR × Layoff -0.196*** -0.199*** -0.437** -0.509*** (0.069) (0.064) (0.210) (0.194)
ΔEPLR × Layoff 0.040 0.976 (0.222) (0.747)
Country-by-year dummies Yes Yes Yes Yes Industry-by-year dummies Yes Yes Yes Yes Observations 779 779 779 779 R2 0.481 0.481 0.477 0.476
Panel B: FGLS, allowing for serially correlated and panel heteroskedastic residuals
Indicator of layoff propensity (1b) Quantitative
(2b) Quantitative
(3b) Qualitative
(4b) Qualitative
Relative TFP -0.043*** -0.043*** -0.043*** -0.043***
(0.004) (0.004) (0.004) (0.004)
EPLR × Layoff -0.202*** -0.207*** -0.473*** -0.491*** (0.052) (0.052) (0.164) (0.162)
ΔEPLR × Layoff 0.269 1.196 (0.571) (1.895)
Country-by-year dummies Yes Yes Yes Yes Industry-by-year dummies Yes Yes Yes Yes Estimated autocorrelation coeff. 0.093 0.093 0.093 0.093 Observations 4180 4180 4180 4180 R2 0.324 0.324 0.323 0.323 Notes: Dependent variable: ΔlogTFP (“fully-adjusted” measure), expressed in percentage terms. Standard errors in parentheses (robust in Panel A). ***, **: significant at the 1% and 5% level, respectively. EPLR: index of employment protection for regular contracts. Layoff: indicator of layoff propensity. For each industry, the quantitative indicator of layoff propensity is equal to the industry average of US layoff rates between 2001 and 2003. The qualitative indicator takes value 1 in industries where the US layoff rate is above the US average for all industries for each year 2001-2003 and 0 elsewhere. All variables in levels are lagged one year. Relative TFP is expressed in percentage terms.

DISMISSAL REGULATION AND PRODUCTIVITY
62
Table A7: Simple difference-in-differences, controlling for industry life-cycles.
Panel A: 11-country sample
Indicator of layoff propensity (1a) Quantitative
(2a) Quantitative
(3a) Qualitative
(4a) Qualitative
EPLR × Layoff -0.170*** -0.173*** -0.339** -0.356**
(0.053) (0.052) (0.167) (0.164)
ΔEPLR × Layoff 0.157 1.167 (0.625) (2.002)
Country-by-year dummies Yes Yes Yes Yes Industry-by-year dummies Yes Yes Yes Yes Observations 4180 4180 4180 4180 R2 0.306 0.306 0.308 0.308
Panel B: 16-country sample
Indicator of layoff propensity (1b) Quantitative
(2b) Quantitative
(3b) Qualitative
(4b) Qualitative
EPLR × Layoff -0.142** -0.148*** -0.318* -0.345**
(0.057) (0.056) (0.175) (0.171)
ΔEPLR × Layoff 0.554 2.234 (0.647) (2.004)
Country-by-year dummies Yes Yes Yes Yes Industry-by-year dummies Yes Yes Yes Yes Observations 5139 5139 5139 5139 R2 0.287 0.287 0.286 0.286 Notes: Dependent variable: ΔlogTFP (“fully-adjusted” measure), expressed in percentage terms. Robust standard errors in parentheses. ***, **, *: significant at the 1%, 5% and 10% level, respectively. EPLR: index of employment protection for regular contracts, lagged one year. Layoff: indicator of layoff propensity. For each industry, the quantitative indicator of layoff propensity is equal to the industry average of US layoff rates between 2001 and 2003. The qualitative indicator takes value 1 in industries where the US layoff rate is above the US average for all industries for each year 2001-2003 and 0 elsewhere.

DISMISSAL REGULATION AND PRODUCTIVITY
63
Table A8: Additional co-variates. Qualititative indicators of layoff propensity.
Panel A: Aggregate co-variates
(1a) (2a) (3a) (4a) (5a) (6a)
Relative TFP -0.038*** -0.038*** -0.039*** -0.039*** -0.039*** -0.038***
(0.004) (0.004) (0.004) (0.004) (0.004) (0.004)
EPLR × Layoff -0.619** -0.671** -0.509** -0.556*** -0.402** (0.280) (0.276) (0.243) (0.176) (0.200)
Tax wedge × Layoff 0.026 0.026 0.030 0.031 0.001 (0.038) (0.038) (0.038) (0.026) (0.024)
Unemp. ben. × Layoff -0.027 -0.023 -0.009 -0.008 (0.019) (0.019) (0.014) (0.014)
PMR × Layoff 0.142 -0.014 0.107 (0.365) (0.301) (0.348)
High corp. × Layoff 1.353 0.993 (0.896) (0.825)
Medium corp. × Layoff 1.097 0.901 (0.938) (0.920)
Coll. barg. coverage × Layoff
-0.013 -0.002 (0.016) (0.014)
ΔEPLR × Layoff 1.193 1.210 1.336 1.395 1.686 (1.871) (1.875) (1.851) (1.843) (1.850)
ΔTax wedge × Layoff 0.177 0.161 0.172 0.156 0.106 (0.129) (0.127) (0.128) (0.125) (0.124)
ΔUnemp. ben. × Layoff -0.041 -0.032 -0.006 0.005 (0.116) (0.116) (0.109) (0.104)
ΔPMR × Layoff 1.559 1.485 1.462 (1.058) (1.052) (1.043)
ΔHigh corp. × Layoff 2.183 2.021 (1.961) (1.951)
Country-year dummies Yes Yes Yes Yes Yes Yes Industry-year dummies Yes Yes Yes Yes Yes Yes Observations 4180 4180 4180 4180 4180 4180 R2 0.330 0.330 0.330 0.329 0.329 0.327

DISMISSAL REGULATION AND PRODUCTIVITY
64
Table A8 (cont.)
Panel B: Industry-level co-variates
(1b) (2b) (3b) (4b) (5b) (6b)
Relative TFP -0.032*** -0.033*** -0.039*** -0.039*** -0.033*** -0.034***
(0.008) (0.008) (0.004) (0.004) (0.008) (0.008)
EPLR × Layoff -0.862*** -0.864*** -0.486*** -0.489*** -0.975*** -0.952*** (0.247) (0.248) (0.164) (0.164) (0.252) (0.269)
ΔEPLR × Layoff 1.339 1.348 1.622 1.633 1.142 0.649 (2.284) (2.283) (1.833) (1.828) (2.284) (2.440)
Log R&D intensity 0.620*** 0.613*** 0.721*** 0.704*** (0.212) (0.215) (0.215) (0.267)
Log R&D intensity × Relative TFP
0.001 (0.005)
PMR impact -3.152** -3.184** -8.861*** -18.346 (1.526) (1.531) (2.624) (14.078)
ΔPMR impact -7.085 -7.210 -1.090 -176.415 (5.454) (5.487) (6.606) (164.885)
PMR impact × Relative TFP
-0.010 (0.018)
ΔImport-weighted real exchange rate
2.112 (6.229)
Country-year dummies Yes Yes Yes Yes Yes Yes Industry-year dummies Yes Yes Yes Yes Yes Yes Observations 1904 1904 4180 4180 1904 1737 R2 Notes: Dependent variable: ΔlogTFP (“fully-adjusted” measure), expressed in percentage terms. Robust standard errors in parentheses. ***, **, *: significant at the 1%, 5% and 10% level, respectively. All variables in levels are lagged one year. EPLR: index of employment protection for regular contracts. PMR: aggregate indicator of product market regulation. PMR impact: indicator measuring the direct and indirect impact of product market regulation (indirect impact through forward linkages). Layoff: indicator of layoff propensity. For each industry, the indicator of layoff propensity is equal to 1 if the US layoff rate is above the US average for all industries in each year between 2001 and 2003 and 0 elsewhere. Relative TFP is expressed in percentage terms. When interacted with one another, log R&D intensity, PMR impact and relative TFP are expressed in deviation from the sample average.

DISMISSAL REGULATION AND PRODUCTIVITY
65
Table A9: First-stage estimates.
Panel A: Quantitative indicator of layoff propensity
Instruments used (1a) Legal
systems
(2a) Legal
systems (refined)
(3a) Dictator-
ship
(4a) All
(5a) All
(6a) All
Relative TFP -0.002 -0.000 -0.003 -0.001
(0.003) (0.003) (0.004) (0.003)
Common law × Layoff -1.855*** -1.438*** -1.287*** -1.285*** -1.454*** (0.139) (0.167) (0.143) (0.142) (0.134)
Civil code × Layoff 0.545*** 0.354** 0.358** 0.171 (0.158) (0.179) (0.175) (0.162)
Dictatorship × Layoff 0.940*** 0.270 0.269 0.269* (0.186) (0.175) (0.175) (0.159)
Cabinet composition × Layoff
0.156*** 0.156*** 0.173*** (0.021) (0.021) (0.017)
Country-year dummies Yes Yes Yes Yes Yes Yes Industry-year dummies Yes Yes Yes Yes Yes Yes Observations 4180 4180 4180 4180 4180 4683 R2 0.972 0.975 0.949 0.979 0.979 0.980
Panel B: Qualitative indicator of layoff propensity
Instruments used (1b) Legal
systems
(2b) Legal
systems (refined)
(3b) Dictator-
ship
(4b) All
(5b) All
(6b) All
Relative TFP -0.001 -0.000 -0.001 -0.000
(0.001) (0.001) (0.001) (0.001)
Common law × Layoff -1.854*** -1.437*** -1.286*** -1.285*** -1.454*** (0.116) (0.136) (0.117) (0.116) (0.109)
Civil code × Layoff 0.546*** 0.356** 0.358** 0.171 (0.128) (0.144) (0.143) (0.132)
Dictatorship × Layoff 0.938*** 0.269* 0.269* 0.269** (0.153) (0.143) (0.143) (0.130)
Cabinet composition × Layoff
0.156*** 0.156*** 0.173*** (0.017) (0.017) (0.014)
Country-year dummies Yes Yes Yes Yes Yes Yes Industry-year dummies Yes Yes Yes Yes Yes Yes Observations 4180 4180 4180 4180 4180 4683 R2 0.930 0.937 0.871 0.946 0.946 0.953

DISMISSAL REGULATION AND PRODUCTIVITY
66
Table A9 (cont.) Notes: Dependent variable: EPLR × Layoff. Robust standard errors, adjusted for clustering on countries and industries, in parentheses. ***, **, *: significant at the 1%, 5% and 10% level, respectively. Relative TFP is expressed in percentage terms. EPLR: index of employment protection for regular contracts. Common law: dummy for common law systems. Civil Code: dummy for civil law systems with single codified civil code. Dictatorship: dummy for a dictatorship spell in the 20th century (excluding major wars). Cabinet composition: Schmidt index of the partisan composition of the government, varying from 0 to 5 from least to most leftwing. Layoff: indicator of layoff propensity. For each industry, the quantitative indicator of layoff propensity is equal to the 2001-2003 average of US layoff rates, and the qualitative indicator takes value 1 in industries where the US layoff rate is above the US average for all industries for each year 2001-2003 and 0 elsewhere. Col. 6 is based on an extended sample (16-country sample, excluding Eastern Europe).
Table A10: Non-linear effects, alternative specifications.
Indicator of layoff propensity
Quantitative Qualitative
(1) (2) (3) (4) (5) (6)
Relative TFP -0.038*** -0.039*** -0.038*** -0.038*** -0.038*** -0.038***
(0.004) (0.004) (0.004) (0.004) (0.004) (0.004) EPL (low segment) × Layoff
-0.168 -0.418 (0.13) (0.39)
EPL (medium segment) × Layoff
0.107 -0.392 (0.38) (1.18)
EPL (high segment) × Layoff
-0.130 0.156 (0.17) (0.54)
EPLR × Layoff -0.074 -0.418 (0.186) (0.575)
EPLR squared × Layoff -0.034 -0.016 (0.046) (0.146)
EPL × Layoff -0.176 -0.821 (0.160) (0.578)
EPL squared × Layoff 0.021 0.146 (0.041) (0.148)
Country-year dummies Yes Yes Yes Yes Yes Yes Industry-year dummies Yes Yes Yes Yes Yes Yes Observations 4180 4180 4180 4180 4180 4180 R2 0.328 0.330 0.328 0.328 0.329 0.328 Notes: Dependent variable: ΔlogTFP (“fully-adjusted” measure), expressed in percentage terms. Robust standard errors in parentheses. ***, **: significant at the 1% and 5% level, respectively. All variables are lagged one year. EPL: overall index of employment protection legislation. EPLR: index of employment protection for regular contracts. EPL (low, medium and high segments) are the three segments of a linear spline of EPL (summary index), with knots at 2 and 2.6. Layoff: indicator of layoff propensity. For each industry, the quantitative indicator of layoff propensity is equal to the 2001-2003 industry average of US layoff rates, while the qualitative one is equal to 1 if the US layoff rate is above the US average for all industries in each year between 2001 and 2003 and 0 elsewhere. All variables are lagged one year. Relative TFP is expressed in percentage terms.