kimberley health profile · 07/07/2017 · potentially preventable hospitalisations (pph), 0 -14...
TRANSCRIPT

South West Health Profile
Planning and Evaluation Unit
January 2018

South West Health Profile 2018
i ONCE PRINTED THIS DOCUMENT MAY BECOME OUT OF DATE Trim Record No: ED-CO-17-17832 REFER TO THE ONLINE SOURCE FOR THE CURRENT VERSION
Prepared by Campbell Anderson, Nancy Bineham, Tia Lockwood, Aqif Mukhtar and Nina Waenerberg of the WA Country Health Service Planning and Evaluation Unit.
Acknowledgements Thanks are extended to our colleagues and specialists in the field who reviewed and commented on the report.
Special thanks to Tyana Lawless for final proof reading and editing.

South West Health Profile 2018
60 ONCE PRINTED THIS DOCUMENT MAY BECOME OUT OF DATE Trim Record No: ED-CO-17-17832 REFER TO THE ONLINE SOURCE FOR THE CURRENT VERSION
Contents
Summary ............................................................................................................................. 3
Introduction ........................................................................................................................ 8
Overview of the region ...................................................................................................... 9
Remoteness ..................................................................................................................... 9
Population ........................................................................................................................ 10
Economic, demographic and social factors .................................................................. 13
Socio-Economic Disadvantage ....................................................................................... 13
Maternal Health Status .................................................................................................... 15
Births .............................................................................................................................. 15
Teenage mothers ........................................................................................................... 16
Smoking in pregnancy .................................................................................................... 16
Alcohol in pregnancy ...................................................................................................... 16
Gestational Diabetes Mellitus (GDM) ............................................................................. 18
Health Status - Child and Adolescent ............................................................................ 18
Low birth weight ............................................................................................................. 18
Australian Early Childhood Development Census (AEDC) ............................................. 19
Childhood Vaccinations .................................................................................................. 20
Health and Wellbeing Surveillance System (HWSS), 0-15 years ................................... 21
Potentially Preventable Hospitalisations (PPH), 0 -14 years .......................................... 23
Injuries, 0-14 years ......................................................................................................... 25
Notifiable Infections, 0-14 years ..................................................................................... 26
Health of Adults ............................................................................................................... 28
Self-reported risk factors, 16 years and over .................................................................. 28
Self-reported chronic conditions, 16 years and over....................................................... 29
Self-reported service utilisation, 16 years and over ........................................................ 30
Hospitalisations, 15-64 years ......................................................................................... 31
Alcohol and tobacco related hospitalisations, 15-64 years ............................................. 32
Potentially preventable hospitalisations (PPH), 15-64 years .......................................... 33
Notifiable Infections and Events, 15-64 years ................................................................ 35
Vector-borne diseases, 15-64 years ............................................................................... 36
Enteric diseases, 15-64 years ........................................................................................ 37
Vaccine preventable diseases, 15-64 years ................................................................... 37
Sexually Transmitted Infections, all ages ....................................................................... 38

South West Health Profile 2018
60 ONCE PRINTED THIS DOCUMENT MAY BECOME OUT OF DATE Trim Record No: ED-CO-17-17832 REFER TO THE ONLINE SOURCE FOR THE CURRENT VERSION
Cancer Incidence, 15-64 years ....................................................................................... 40
Mental Health, 15-64 years ............................................................................................ 41
Youth Suicide, 15-24 years ......................................................................................... 41
Mental Health, 16 years and over ............................................................................... 41
Community Mental Health Activity, 15-64 years ......................................................... 41
Mortality, 15-64 years ..................................................................................................... 42
Alcohol and tobacco related mortality, 15-64 years ........................................................ 42
Avoidable Mortality, 15-64 years .................................................................................... 42
Health Status of Older People ......................................................................................... 43
Vaccinations, 65 years and over .................................................................................... 43
Hospitalisations, 65 years and over ................................................................................ 43
Potentially Preventable Hospitalisations, 65 years and over .......................................... 43
Mental Health, older people ............................................................................................ 45
Community Mental Health Activity, 65 years and over ................................................ 45
Disability and Carers ....................................................................................................... 46
Where South West Residents Accessed Emergency Care .......................................... 46
Emergency Department Attendances ............................................................................. 46
South West Hospitals.................................................................................................. 46
South West Residents ................................................................................................ 47
Hospitalisations .............................................................................................................. 48
Alcohol and tobacco related hospitalisations .................................................................. 49
Potentially preventable hospitalisations (PPH) ............................................................... 49
Where South West residents used hospital services ...................................................... 52
Hospitalisations within the region ................................................................................... 52
Mortality ............................................................................................................................ 54
Alcohol and tobacco related mortality ............................................................................. 55
Avoidable Mortality, 0 - 74 years .................................................................................... 55
Abbreviations ................................................................................................................... 57
Glossary ............................................................................................................................ 58
References ........................................................................................................................ 60
NOTE: Unless otherwise stated within this document the term rate refers to an age standardised rate. This means that the differing age and sex structures of the populations have been taken into account enabling two different areas or time periods to be compared.
© WA Country Health Service 201

South West Health Profile 2018
60 ONCE PRINTED THIS DOCUMENT MAY BECOME OUT OF DATE Trim Record No: ED-CO-17-17832 REFER TO THE ONLINE SOURCE FOR THE CURRENT VERSION
Key facts for South West residents

South West Health Profile 2018
60 ONCE PRINTED THIS DOCUMENT MAY BECOME OUT OF DATE Trim Record No: ED-CO-17-17832 REFER TO THE ONLINE SOURCE FOR THE CURRENT VERSION
Executive Summary This report presents an overview of the health of South West residents to inform evidence-based health services and planning.
Note: When state rates are referred to, the state rate is always set at 1.0 when compared against a regional rate. A higher regional rate is generally worse than the state rate and a lower regional rate is generally better than the state rate. Poor access to health care may mean a lower rate does not indicate the true health need.
If the rates are described as significantly different this means statistically significantly different.
Population
In 2016 the Australian Bureau of Statistics (ABS) found the South West region had an Estimated Resident Population (ERP) of 175,904 in 2016. The region also has a large number of visitors, especially in peak holiday seasons.
Based on WA Tomorrow 2017, the region’s resident population is projected to grow by 1.3 per cent per year between 2016 and 2026, with the largest growth in the over 70 year olds. i
Compared to the state, the region has a lower proportion of Aboriginal people (2.6% in 2015), a larger percentage of children aged 5-14 years and adults aged 45 years and over and lower proportion of people aged 20-39 years.
Economic, demographic and socio economic factors
Based on the 2011 census, the South West region has a lower level of disadvantage compared as per Socio-Economic Indexes for Areas (SEIFA) scores, compared to other regions.
South West areas with the highest level of disadvantage are Collie, Manjimup and some suburbs of Bunbury. Collie and Manjimup have scores in the lowest 30 per cent of the state.
Maternal Health
In the South West, between 2011/12 and 2015/16 there was an average annual increase in births of three per cent.
In 2015, 3.7 per cent of women in the South West who gave birth were aged less than 20 years. This was similar to the State rate. The proportion of births to Aboriginal teenage women was 19 per cent.
For the period 2011/12 to 2015/16, 42 per cent of Aboriginal mothers and 13 per cent of non-Aboriginal mothers from the South West reported smoking during pregnancy.
Child and Adolescent Health
In 2015, the proportion of South West children rated as developmentally vulnerable on one or more domains ranged from 13 per cent in Bridgetown-Greenbushes to 32 per cent in Bunbury. Six of the 11 communities with valid data had a higher rate of vulnerability than the national average of 22 per cent.

South West Health Profile 2018
60 ONCE PRINTED THIS DOCUMENT MAY BECOME OUT OF DATE Trim Record No: ED-CO-17-17832 REFER TO THE ONLINE SOURCE FOR THE CURRENT VERSION
For the period 2010 to 2015, South West region residents reported health enhancing behaviours, risk factors and conditions as well as health service utilisation in the past year at similar levels to the State.
For the period 2011-2015, the rate of Potentially Preventable Hospitalisations (PPH) in South West children was similar to children in the State. Dental conditions (acute) contributed for 43 per cent of PPH (1.2 times the State rate) and Ear, Nose and Throat (ENT) infections (acute) contributed to another 19 per cent (0.7 times the State rate). The third leading cause for PPH was convulsions and epilepsy (acute) at 1.1 times the State rate. The PPH rate for gangrene was 1.6 times the State rate.
For the period 2011-2015, injury and poisoning in the South West accounted for 11 per cent of all child hospitalisations. The hospitalisation rate for transport accidents was significantly higher (1.3 times) than the State rate.
For the period 2011-2015, the leading type of notifiable disease was vaccine preventable with a notification rate significantly higher (1.2 times) than the State rate for children aged 0-14 years. The pertussis notification rate was 2.3 times the State rate.
Adult
For the period 2013-2016, a significantly higher proportion of South West adults aged 16 years and over reported high blood pressure (19%) and obesity (33%) compared with the State. South West residents had a significantly higher rate of arthritis (23%) and osteoporosis (6%) than the State.
For the period 2011-2015, the main cause of hospitalisation by major category for adults aged 15-64 years was digestive diseases, as it was for the State.
For the period 2011-2015, Aboriginal South West residents had significantly higher rates than non-Aboriginal residents for both alcohol and tobacco hospitalisations in 15-64 year olds (alcohol 4.5 times and tobacco 3.4 times higher).
Four per cent of all hospitalisations in South West residents aged 15-64 years were potentially preventable. The PPH rate was significantly lower than the State rate.
The leading PPH for South West residents aged 15-64 years was dental conditions followed by cellulitis, angina and urinary tract infection.
The melanoma (skin) cancer rate in the South West was significantly higher (1.4 times) than the State rate for the period 2011-2015.
Notifiable diseases
For the period 2011-2015, the notification rates for enteric (1.2 times) and vector-borne diseases (1.5 times) for adults aged 15-64 years were significantly higher in the South West compared with the State rates.
Notably 63 per cent of enteric notifications were for campylobacteriosis, and 66 per cent of vector-borne diseases were for Ross River Virus.
The influenza notification rate increased significantly (by over 300 per cent) between 2011 and 2015.
Mental Health
For the period 2013-2016, 14 per cent of South West adults reported having a current diagnosed mental health problem, (17% among females and 11% for males).

South West Health Profile 2018
60 ONCE PRINTED THIS DOCUMENT MAY BECOME OUT OF DATE Trim Record No: ED-CO-17-17832 REFER TO THE ONLINE SOURCE FOR THE CURRENT VERSION
For the period 2011-2015, the rate of mental health occasions of service accessed by South West residents aged 15-64 years was lower than the State rate.
The leading reason was for schizophrenia schizotypal and delusional disorders, which accounted for 21 per cent of all mental health occasions of service in this age group.
The rate of occasions of service for substance abuse disorders for South West adults aged 15-64 years was, 1.8 times the State rate.
During 2006-2015, South West Aboriginal residents aged 15-64 years accessed community mental health services 2.2 times the rate of non-Aboriginal residents.
For the period 2011-2015, suicide was the leading cause of death in the South West 15-24 year olds causing 19 deaths in the region (1.4 times the State rate).
Older People
For the period 2011-2015, the hospitalisation rate of South West residents aged 65 years and over was significantly lower than the State rate. The leading causes of hospitalisation were renal dialysis (12%), diseases of the eye (9%) and chemotherapy (8%).
The leading causes of PPH were congestive cardiac failure (1.1 times) followed chronic obstructive pulmonary disease (COPD) (1.1 times) and angina, 1.3 times the State rate.
Emergency Departments – all ages
In 2016/17, 58 per cent of attendances to hospitals within South West hospitals were for semi-urgent or non-urgent cases, triage 4 and 5), which was significantly lower than WACHS (66%) indicating better access to primary care in the South West compared with some other regions.
Hospitalisations – all ages
For the period 2011-2015, the hospitalisation rate of South West residents (38,164 per 100,000) was significantly lower than that of the State.
The main cause of hospitalisation by major category was digestive diseases, as it was for the State, contributing to 11 per cent of hospitalisations.
The leading PPH was dental conditions accounting for 14 per cent of PPHs and the rate was significantly lower to the State rate. Among other conditions, COPD, angina and convulsions and epilepsy, had significantly higher rates (1.1, 1.3 and 1.1 times respectively) compared with State rates.
In 2016/17, 84 per cent of South West residents’ hospitalisations to public hospitals occurred within the region. Thus demonstrating a high ability of the region to provide public hospital care for its own residents locally. The WACHS average was 83 per cent (excluding Wheatbelt).
Mortality – all ages
For the period 2011-2015, the mortality rate for the South West region was similar to the State rate.

South West Health Profile 2018
60 ONCE PRINTED THIS DOCUMENT MAY BECOME OUT OF DATE Trim Record No: ED-CO-17-17832 REFER TO THE ONLINE SOURCE FOR THE CURRENT VERSION
The leading causes of death were ischaemic heart disease, cerebrovascular disease and dementia. The cerebrovascular disease mortality rate was significantly higher (1.3 times) than the State rate.
Just over half of deaths (52%) of South West residents under the age of 75 years were potentially avoidable. Ischaemic heart disease was the leading cause of avoidable mortality followed by suicide. Transport accidents were the third leading cause of death for South West and the rate was significantly higher than (1.6 times) the State rate.

South West Health Profile 2018
60 ONCE PRINTED THIS DOCUMENT MAY BECOME OUT OF DATE Trim Record No: ED-CO-17-17832 REFER TO THE ONLINE SOURCE FOR THE CURRENT VERSION
Introduction
This profile includes regional information on the population, demographics, determinants of health and health statistics such as immunisation rates, mortality and hospitalisation rates for residents of the South West. Where practicable the information is provided in the sequence of the continuity of care, and is provided by age group.
The information can be used to inform planning for service developments, support business cases and to focus services where they can best affect a positive outcome.
Additional information about the region and districts within the region may be found in service plan documents also published on WACHS Publications page along with the WACHS Child Health Profile and WACHS Health Profile Summary 2017.

South West Health Profile 2018
60 ONCE PRINTED THIS DOCUMENT MAY BECOME OUT OF DATE Trim Record No: ED-CO-17-17832 REFER TO THE ONLINE SOURCE FOR THE CURRENT VERSION
Overview of the region The South West region is located in the south-west corner of the state, facing the Indian and Southern Oceans. It shares its eastern boundary with Wheatbelt and Great Southern regions. It covers an area of 23,998 sq km, has 12 local government areas and a diverse geographic profile ranging from rugged coastline and beaches to agricultural landscapes. The economy is based around tourism, mining and construction, retail and agriculture.ii&iii
Remoteness
According to the Accessibility/Remoteness Index of Australia (ARIA), 50 per cent of the South West region is outer regional, 40 per cent is inner regional and the remaining ten per cent is remote.iv
Figure 1: Map of South West showing health districts and WACHS health facilities
Source: Department of Health, Spatial services Unit Epidemiology Branch, Public Health Division, December 2017.

South West Health Profile 2018
60 ONCE PRINTED THIS DOCUMENT MAY BECOME OUT OF DATE Trim Record No: ED-CO-17-17832 REFER TO THE ONLINE SOURCE FOR THE CURRENT VERSION
Population
The 2016 Estimated Residential Population (ERP) of the South West was 175,904, which represents 33 per cent of the WACHS population and seven per cent of the State's population. This is an increase of 23 per cent (32,905) since 2006. v
The 2015 South West region population density is seven people per sq km, which is greater than State average (1.0 per sq km; WA Rural: 0.24 per sq km). The gender distribution in the South West is quite even, with 49.5 per cent of population being male.vi
The age structure differs from that of the State by having a larger percentage of children aged 5-14 years and adults aged 50-74 years and a lower proportion of people aged 15-49 years.v
Figure 2: South West vs. State population age distribution 2016
Source: ABS, ERP 2016v
Table 1: South West Estimated Resident Population 2016
Source: ABS, ERP 2016v
Aboriginal people make up 2.6 per cent (4,548 people) of the region’s population which is less than the State proportion (3.6%) based on Aboriginal proportions in the 2015 ERP. The Aboriginal population has a younger age structure than the non-Aboriginal population.vii
Age Group 0-4 5-14 15-49 50-74 75+ Grand Total
Number 11,644 24,697 75,856 52,233 11,474 175,904
Proportion 7% 14% 43% 30% 7% 100%

South West Health Profile 2018
60 ONCE PRINTED THIS DOCUMENT MAY BECOME OUT OF DATE Trim Record No: ED-CO-17-17832 REFER TO THE ONLINE SOURCE FOR THE CURRENT VERSION
Figure 3: South West Estimated Resident Population (ERP) by Aboriginality 2015
Source: ABS via DoH Epi Calculator
vii
The South West population has experienced growth (2.1% per year) from 2006 to 2016. From 2017, the South West population is projected to grow at an average of 1.3 per cent per year until 2026. Busselton (2.2% per year) and Leschenault health districts (2% per year) are predicted to have the highest percentage growth.v & viii
Figure 5 shows projections by age group. The older age groups are expected to grow at a higher rate than younger age groups in the South West region. It is anticipated there will be 58 per cent (11,497) more people over 70 years in 2026 compared to 2016. The growth in the younger age cohorts is slower and the 0-4 year old age group is expected to grow by eight per cent and the15-44 year old cohort by 11 per cent in the same time period.viii
Figure 4: South West population projections 2006-2026
Source: Western Australia Tomorrow 2017
ix, and Australian Bureau of Statistics, ERP 2016
v
14% 13% 11% 13% 14% 14% 12% 6% 3% 100%
0% 10% 20% 30%
0-9 yrs
10-19 yrs
20-29 yrs
30-39 yrs
40-49 yrs
50-59 yrs
60-69 yrs
70-79 yrs
80 yrs +
Female
0%10%20%30%
Male
Non Aboriginal Aboriginal

South West Health Profile 2018
60 ONCE PRINTED THIS DOCUMENT MAY BECOME OUT OF DATE Trim Record No: ED-CO-17-17832 REFER TO THE ONLINE SOURCE FOR THE CURRENT VERSION
Figure 5: South West population projections by age group 2006-2026
Source: Western Australia Tomorrow 2017
viii, and Australian Bureau of Statistics, ERP 2016
v
Implications for health service planning: South West has a small proportion of Aboriginal people (2.6% compared to the State proportion of 3.6%) but this is still 4,548 people and they have a much younger age structure than non-Aboriginal population, with half the population aged under 20 (48% compared with 27% for non-Aboriginal people). It would be useful to take into account this differing age structure when planning health services and programs. The population of the South West is projected to grow at 1.3 per cent per year. The number of people 70 years and over is projected to increase by 58 per cent between 2016 and 2026 (11,497). This changing age structure is taken into account in the commencement and placement of services particularly in chronic condition management, older person’s health and aged care. This includes the use of Telehealth services to improve service access and reduce travel. Partnerships with primary health providers and General Practitioner (GP) services and other non-government providers will be important for this increasing older population.

South West Health Profile 2018
60 ONCE PRINTED THIS DOCUMENT MAY BECOME OUT OF DATE Trim Record No: ED-CO-17-17832 REFER TO THE ONLINE SOURCE FOR THE CURRENT VERSION
Economic, demographic and social factors There are many factors that influence a person’s health, including genetics, lifestyle and environmental, economic and social factors. The demographics within the South West are very diverse and different areas can differ in function and infrastructure. For example a coastal harbour or viticulture community will differ from an inland farming or forest community. The level of isolation and impact on health by environmental conditions is often more marked in rural than metropolitan communities.Error! Bookmark not defined.& x
Table 2 lists some of the socio-demographic factors for South West compared to the rest of the State.
Table 2: South West vs. State vs. WACHS vs. Metro socio demographic factors 2011
Source: ABS Census 2011 results via DoH, Health Tracks
Error! Bookmark not defined.
Socio-Economic Disadvantage
The Index of Relative Socio-Economic Advantage and Disadvantage (IRSAD) as a product of the Socio-Economic Indexes for Areas (SEIFA), is calculated from responses to the ABS Census. The more disadvantaged an area, the higher self-reported ill health or risk factors for ill health. A score below 1,000 indicates an area is relatively disadvantaged compared to an area with a score of at least 1000 or more.xi
Based on the 2011 Census, the lowest score for a South West LGA is 958 in Manjimup and Collie and the highest is in Capel with 1,045. There is an SA1 within Bunbury with a score of 717 and one in Capel with a score of 1,147. Collie and Manjimup are the only two LGAs with a score in the lowest 30 per cent of scores in the State. This indicates the South West is one of the least disadvantaged regions in the State. An indication of the distribution can be seen in Figure 6.xii
Measure Metro Country State
Counts % % % %
Born overseas 28,664 18.6 34.9 18.8 30.7
People who don't speak English at home 8,135 5.3 17.1 7.1 14.5
At primary school 14,727 9.5 8.2 9.2 8.4
At secondary school 8,940 5.8 5.7 5.1 5.5
At TAFE, CAE or Uni 5,442 3.5 7.3 3.5 6.3
Left school aged less than 15 years old 12,599 10.4 8.1 10.6 8.7
Persons with tertiary qualification 50,276 41.4 45.3 38.3 43.6
Families with annual income < $20,800 1850 4.4 3.9 5.1 4.2
One-parent families 6,009 14.4 14.7 14.1 14.5
Unemployed 3538 4.7 4.8 4.4 4.7
South West Health Region

South West Health Profile 2018
60 ONCE PRINTED THIS DOCUMENT MAY BECOME OUT OF DATE Trim Record No: ED-CO-17-17832 REFER TO THE ONLINE SOURCE FOR THE CURRENT VERSION
Figure 6: South West Socio-Economic Indexes for Areas distribution 2011
Source: DoH, Epidemiology GIS branch, 2015.
Notes: SEIFA 2011 is released according to the Australian Statistical Geography Standard (ASGS). Statistical Areas Level 1 (SA1s) are built from whole Mesh Blocks. There are 54,805 SA1s covering the whole of Australia without gaps or overlaps. They have been designed as the smallest area of output for the Census of Population and Housing, replacing the Census Collection Districts (CCDs). Whole SA1s aggregate to form Statistical Areas Level 2 (SA2s).
Implications for health service planning:
The SEIFA Index shows that there are areas within South West with high levels of disadvantage, even though the South West is one of the least disadvantaged regions in the State. Any services and programs that are planned may be better targeted towards more disadvantaged areas, such as Collie, Manjimup and specific suburbs of Bunbury.

South West Health Profile 2018
60 ONCE PRINTED THIS DOCUMENT MAY BECOME OUT OF DATE Trim Record No: ED-CO-17-17832 REFER TO THE ONLINE SOURCE FOR THE CURRENT VERSION
Maternal Health Status
Births
In 2015, the overall South West age-specific birth rate was 68.7 per 1,000 women. This was significantly higher than the State rate (63.6 per 1,000 women). For the period 2011-2015, the age-specific birth rate for Aboriginal women in the South West was 66.4 per 1,000 women and for non-Aboriginal women it was 68.4 per 1,000 women.Error! Bookmark not defined.
In 2015, in the South West, the proportion of births (3.7%) to women aged less than 20 years was higher to that of the State (2.8%) and the mean maternal age was 24.7 years for Aboriginal women and 29.0 years for non-Aboriginal women.xiii
In 2015/16, the proportion of births to non-Aboriginal teenage women was three per cent and to Aboriginal teenage women it was 19 per cent compared with 3% for WACHS Non-Aboriginal and 16% of WACHS Aboriginal women. xiii
Table 3: South West State vs. Metro maternity data 2011- 2015
Source: DoH, Health Tracks
Error! Bookmark not defined.
Within the South West hospitals, there was a 12 per cent increase in births between 2012 and 2016, an average annual increase of 2.8 per cent. The average annual increase was 9.1 per cent in Aboriginal women and 2.5 per cent in non-Aboriginal women. There was an increase in births of 3 per cent for South West region over the same period. This included a 31 per cent increase in Aboriginal births and a two per cent decrease in non-Aboriginal births. xiv
Table 4: South West births by Aboriginal status of mother 2012 - 2016
Source: WACHS Online data – Obstetric Deliveriesxiv
Maternity data
South West
Health Region
Perth
Metropolitan
Area WA State
Age-specificic birth rate (per 1,000 women aged
15-44 years, not having had hysterectomy) 68.7 62.0 63.6
Teenage births (%) <20 years old 3.7% 2.2% 2.8%
Birth in women aged 35 years and older (%) 17.5% 22.2% 20.7%
Aboriginal Non-Aboriginal Total Aboriginal Non-Aboriginal Total
2012 55 1374 1429 65 2124 2189
2013 57 1419 1476 71 2138 2209
2014 70 1458 1528 85 2180 2265
2015 61 1511 1572 64 2204 2268
2016 78 1516 1594 85 2176 2261
Increase 42% 10% 12% 31% 2% 3%
Average annual increase 9.1% 2.5% 2.8% 6.9% 0.6% 0.8%
All births by South West residentsBirth Year
Births in a South West hospital

South West Health Profile 2018
60 ONCE PRINTED THIS DOCUMENT MAY BECOME OUT OF DATE Trim Record No: ED-CO-17-17832 REFER TO THE ONLINE SOURCE FOR THE CURRENT VERSION
Teenage mothers
In the period 2015/16, in the South West, the average (mean) maternal age was 24.7 years for Aboriginal women and 29 years for non-Aboriginal women.
Over the period 2006-2015 teenage pregnancy has not changed significantly within the South West Health Region and the proportion of births to women aged less than 20 years was similar to the State. In the period 2015/16 in the South West, the proportion of births to Aboriginal teenage women was significantly higher (19%) than non-Aboriginal teenage women (3%).
Smoking in pregnancy
Smoking during pregnancy is associated with low birth weight, pre-term birth, placental complications and perinatal mortalityxv.
The proportion births to Aboriginal South West women who reported smoking during pregnancy (between 2011/12 and 2015/16) fluctuated and after a low of 35 per cent in 2013/14 finished slightly higher (43%) in 2015/16.
The five year average proportion of births to smoking Aboriginal women was 42 per cent, which was lower than the WACHS rate of 48 per cent. For non-Aboriginal mothers, the proportion of births to women who reported smoking during pregnancy had a downward trend and the five year average was 13 per cent (WACHS rate 13 %).xiii
Figure 7: South West proportion of women smoking during pregnancy 2011/12 to 2015/16
Source: Midwives Notification System
xiii
Alcohol in pregnancy
High rates of alcohol consumption while pregnant, is associated with Foetal Alcohol Spectrum Disorder (FASD) and various other impairments of the central nervous system. A 2014 report using data from 1980-2010 obtained from the WA Register of Developmental Anomalies and the Midwives Notification System, showed a birth prevalence of FASD in WA of 0.26 per 1000 births. The majority were Aboriginal (89%). The prevalence rate has doubled over the last 30 years in WA.xvi

South West Health Profile 2018
60 ONCE PRINTED THIS DOCUMENT MAY BECOME OUT OF DATE Trim Record No: ED-CO-17-17832 REFER TO THE ONLINE SOURCE FOR THE CURRENT VERSION
In 2017 a pioneering Western Australian study, ‘Prevalence and profile of Neurodevelopment and Fetal Alcohol Spectrum Disorder (FASD) amongst Australian Aboriginal children living in remote communities’, found that in remote Australian Aboriginal communities, where high rates of prenatal alcohol exposure have been recorded, FASD/partial FASD prevalence rates of 120.4 per 1,000 children have been reported. xvi & xvii
Figure 8 demonstrates an initial indication of the use of alcohol in pregnancy, with data that is currently available by Aboriginality in the South West region compared to that of WACHS. The data should be interpreted with caution as the question regarding alcohol consumption was only made compulsory to answer from June 2017 onwards and regional response rates vary.
Figure 8 demonstrates the majority (91%) of South West respondents did not report using alcohol during pregnancy. Sixteen (17%) South West Aboriginal mothers used alcohol. This rate is lower than the WACHS Aboriginal rate (340 mothers or 26% of respondents). Out of the 16 who had used alcohol, ten Aboriginal respondents had occasional alcohol i.e. less than one standard drink a week during pregnancy and six, reported alcohol use at higher risk levels.
Eight per cent (165) of South West non-Aboriginal mothers used alcohol during pregnancy; this rate was similar with WACHS non-Aboriginal mothers. Of the 165 who used alcohol, 118 had occasional alcohol, less than one standard drink a week during pregnancy and 47 mothers used higher levels of alcohol.
Figure 8: South West vs. WACHS proportion of mothers who used alcohol during pregnancy 2014-2015
*Proportion of mothers who responded to the question, not proportion of all mothers who gave birth. WACHS response rate was 72% and South West response rate 67%. No validation was carried out on the responses. Alcohol use became a compulsory field in June 2017 and will in the future provide more reliable data. Note: The error bars represent the 95% confidence interval of the proportion Source: Stork Perinatal Database as at 2 June 2017, accessed via Health Support Services
A number of projects are being conducted in regions throughout the State to address alcohol use during pregnancy and to secure out more information about FASD. Details can be obtained from the Australian Indigenous HealthInfoNetxviii and the Telethon Kids Institute.xix

South West Health Profile 2018
60 ONCE PRINTED THIS DOCUMENT MAY BECOME OUT OF DATE Trim Record No: ED-CO-17-17832 REFER TO THE ONLINE SOURCE FOR THE CURRENT VERSION
Gestational Diabetes Mellitus (GDM)
In 2010, the Australian Institute of Health and Welfare (AIHW) released a report on GDM discussing its impact on Australian woman and their babies. The report concluded that mothers with diabetes in pregnancy and their babies were at higher risk of adverse effects of pregnancy, labour and delivery, compared with those not affected by diabetes in pregnancy. Those with pre-existing diabetes who had diabetes in pregnancy and their babies were at higher risk of developing these adverse effects.
Aboriginal mothers and their babies experienced generally higher rates of the adverse effects of pregnancy, labour and delivery compared with non-Aboriginal mothers and their babies. The report stated that diabetes in pregnancy is an indicator of increased risk of developing Type 2 diabetes (also known as adult onset diabetes) later in life, and therefore provides an opportunity to intervene to improve health outcomes.
In the period 2011/12 – 2015/16, 6.8 per cent of South West Aboriginal women who gave birth had gestational diabetes mellitus (GDM). The proportion of GDM in non-Aboriginal South West women who gave birth was 6.3 per cent. The prevalence of GDM in WACHS Aboriginal mothers was 7.1 per cent and in WACHS non-Aboriginal mothers it was 5.9 per cent for the same time period.xiii
Health Status - Child and Adolescent
Low birth weight
Babies born with a low birth weight (less than 2,500g) have a higher risk of health complications. For the period 2007/08-2015/16, the low birth weight rate for full term babies born to women in the South West was 1.8 per cent and the State rate was two per cent. The low birth weight rate for South West Aboriginal babies born full term was 4.8 per cent and for the State Aboriginal babies it was 5.1 per cent.Error! Bookmark not defined.
Implications for health service planning: In the South West, Aboriginal women are more likely than non-Aboriginal women to be teenage mothers and to smoke during pregnancy. Alcohol consumption and diabetes in pregnancy are risk factors for all women. This suggests a need for targeted, culturally safe and appropriate health promotion strategies and ante-natal services for these women. Strengthening partnerships with primary care providers, including local GPs and Aboriginal Community Controlled Health Services could provide better outcomes. Resources to tackle Aboriginal maternal smoking in WA have been developed such as the Australian Indigenous HealthInfoNet new portal launched recently. (Source: Australian Indigenous HealthInfoNet accessed June 2015: http://www.healthinfonet.ecu.edu.au/about/news/3305 http://www.healthinfonet.ecu.edu.au/population-groups/preventing-aboriginal-maternal-smoking).

South West Health Profile 2018
60 ONCE PRINTED THIS DOCUMENT MAY BECOME OUT OF DATE Trim Record No: ED-CO-17-17832 REFER TO THE ONLINE SOURCE FOR THE CURRENT VERSION
Australian Early Childhood Development Census (AEDC)
The AEDC uses the early development instrument tool to measure how young children have developed as they start their first year of full-time school. A teacher completes a checklist for each child across each of the five domains of early childhood development: physical health and wellbeing, social competence, emotional maturity, language and cognitive skills, communication skills and general knowledge. The scores of all Australian children are ranked and children ranked in the bottom 10 per cent are classed as “developmentally vulnerable” whereas those in the top 75 per cent are classed as “on track” while those in between are classed as “at risk”. Results are reported by a child’s community of residence.
Across Australia in 2015, one in five children (22%) was developmentally vulnerable on one or more domains of the AEDC. Furthermore, 11 per cent were developmentally vulnerable on two or more domains.
The results for the South West local communities are shown in the Table 5, with 11 local communities having sufficient data for publishing. Bunbury, Capel, Dardanup Donnybrook-Balingup, Harvey and Manjimup had a higher proportion, vulnerable on one or more domains than the overall Australian proportion. The total published number of South West children vulnerable in at least one domain was 578 (284 in at least two domains) and there were additional vulnerable children in communities with numbers too low to publish.
Within the South West the proportion of children rated as developmentally vulnerable on one or more domains ranged from 13 per cent in Bridgetown-Greenbushes to 32 per cent in Bunbury. The proportion rated vulnerable on two or more domains ranged from five per cent in Boyup Brook to 17 per cent in Manjimup. It is important to consider the number of children, in relation to the proportion of children classed as developmentally vulnerable.
One South West local community had too few children to publish results. However, of the 11 for which data has been published, six had a higher proportion vulnerable on one or more domains than the overall Australian proportion and the same six had a higher proportion vulnerable on two or more domains than the overall Australian proportion.xx

South West Health Profile 2018
60 ONCE PRINTED THIS DOCUMENT MAY BECOME OUT OF DATE Trim Record No: ED-CO-17-17832 REFER TO THE ONLINE SOURCE FOR THE CURRENT VERSION
Table 5: South West AEDC children developmentally vulnerable on at least one domain 2015
Source: AEDCxx
#AEDC data are not reported for locations in which three or fewer children had been assessed. * Suppression of AEDC data also occurs when one or more of the following have not been met: Fewer than fifteen children had valid AEDC scores /Less than two teachers had completed AEDC instruments for children in that location/AEDC instruments were completed for less than 80% of all non-special needs children. Additional minor suppressions have occurred where necessary to preserve confidentiality of related suppressed cells These tables and more information may be found at http://www.aedc.gov.au/
Childhood Vaccinations
Immunisation against communicable disease is an effective public health intervention that reduces the mortality and morbidity associated with vaccine preventable conditions. Australian vaccination coverage targets of greater than 90 per cent of children at two years of age and near 100 per cent of children at school entry age are recommended. The coverage needs to exceed 90 per cent to create the community immunity necessary to stop the ongoing transmission of these diseases.xxi
In 2017, the childhood vaccination coverage for South West was over 90 per cent for all age groups except for the 24-<27 months which had a coverage of 89 per cent. The State coverage
Number % Number %
Augusta-Margaret River 48 20.5% 17 7.2% 234
Boyup Brook 4 18.2% 1 4.5% 22
Bridgetown-Greenbushes 7 13.2% 3 5.7% 53
Bunbury 126 31.9% 63 15.9% 395
Busselton 97 17.6% 46 8.4% 552
Capel 67 26.5% 35 13.8% 253
Collie 24 17.9% 12 9.0% 134
Dardanup 54 28.6% 26 13.8% 189
Donnybrook-Balingup 18 24.0% 12 16.0% 75
Harvey 96 23.7% 47 11.6% 405
Manjimup 37 28.9% 22 17.2% 128
Nannup * - * - 11
Australia 22.0% 11.1%
Local Community
Children Vulnerable Total
children
surveyed
One or more domains Two or more domains
Implications for health service planning:
The AEDC results indicate the need for child development services including access to multidisciplinary teams made up of medical services, child health nurses, speech pathology, physiotherapy and occupational therapy.
It is important to consider the number of children in relation to the proportion of children classed as developmentally vulnerable.

South West Health Profile 2018
60 ONCE PRINTED THIS DOCUMENT MAY BECOME OUT OF DATE Trim Record No: ED-CO-17-17832 REFER TO THE ONLINE SOURCE FOR THE CURRENT VERSION
was similarly over 90 per cent for the all age groups except for the 24-<27 month age group. The overall WACHS coverage was above 90 per cent for all age groups. Refer to Table 6.
Childhood immunisation coverage for South West Aboriginal children was lower than the State and WACHS for the age group 12 to <15 months. However, the South West Aboriginal immunisation coverage was higher than the non- Aboriginal people for children aged 24 to <27 months and 60 to <63 months. Childhood immunisation coverage for WACHS Aboriginal children was lower than the WACHS Non-Aboriginal children for the age groups 12 to <15 months and 24 to < 27 months but higher for children aged 60 to < 63 months. Same trend was observed at the State level. Refer to Table 6.
Table 6: South West vs. WACHS vs State childhood immunisation 2017
Source: Australian Childhood Immunisation Register - Coverage Reportxxii.
Health and Wellbeing Surveillance System (HWSS), 0-15 years
The Department of Health in WA conducts a continuous HWSS. This is a population survey carried out by phone, which is designed to provide results and examine trends at a population level. It is unlikely to be representative of minority groups such as Aboriginal people and the homeless as they are less likely to have phone access. Parents/guardians report on behalf of children aged 0-15 years. Given there is a low proportion of Aboriginal people in the South West, the prevalence counts and rates are more likely to be a closer estimate of the true amount than other regions.xxiii
The HWSS (2010-2015) showed that health enhancing behaviours, risk factors, conditions and health service utilisation were proportionally similar for the South West children compared with the children in the State, although the State shouldn’t be used as a benchmark in this instance as many state rates are not within acceptable ranges.
For the South West region, the HWSS also showed:
One in four children (25%) had a parent who smoked during their pregnancy although the proportion of people who reported their home was smoke free was 99 per cent;
most children (89%) did not eat the recommended daily serves of vegetables;
two in seven children (28%) did not eat the recommended daily serves of fruit;
over half of children (53%) did not do sufficient physical activity;
one in twenty children (5%) reported height and weight measurements that classified them as obese;
one in five children (20%) reported an injury requiring treatment from a medical professional in the previous year; and
one in eleven children (9%) had asthma.
AboriginalNon-
AboriginalPersons Aboriginal
Non-
AboriginalPersons Aboriginal
Non-
AboriginalPersons
12 to < 15 Months 91% 93% 93% 90% 94% 94% 88% 94% 94%
24 to < 27 Months 96% 88% 89% 85% 92% 91% 83% 90% 89%
60 to < 63 Months 96% 93% 93% 96% 92% 93% 95% 92% 92%
South West Health Region WACHS
Age Group
WA State

South West Health Profile 2018
60 ONCE PRINTED THIS DOCUMENT MAY BECOME OUT OF DATE Trim Record No: ED-CO-17-17832 REFER TO THE ONLINE SOURCE FOR THE CURRENT VERSION
Table 7: South West vs. State Health and Wellbeing Surveillance System (HWSS) child population profile 2010-2015
Results significantly better than the State are highlighted green, significantly worse are highlighted red. Where result could be interpreted as either better or worse, or results similar to the State have not been highlighted. Notes: (a) The number of serves of fruit recommended for sufficient consumption in the 2013 Australian Dietary Guidelines by the National Health and Medical Research Council varies dependent on age and sex. For reporting purposes, this table just presents the prevalence of children aged 5-15 years who consume 2 serves of fruit daily, this is not equivalent to 'sufficient intake'. (b) The number of serves of vegetables recommended for sufficient consumption in the 2013 Australian Dietary Guidelines by the National Health and Medical Research Council varies dependent on age and sex. For reporting purposes, this table just presents the prevalence of children aged 5-15 years who consume 5 serves of vegetables daily, this is not equivalent to 'sufficient intake'. (c ) Based on the 2014 Australian Physical Activity and Sedentary Behaviour Guidelines, children aged between 5 and 15 years are required to complete at least 60 minutes of moderate to vigorous physical activity each day to achieve good health. Table 5 presents the prevalence of children who are physically active 7 or more sessions per week and for at least 60 minutes a session. (d) Injury in the last 12 months requiring treatment from a health professional (e ) Primary health care service includes medical specialist, general practitioner, community health centre, community or district nurse. (f) Mental health care services include psychiatrist, psychologist or counsellor. (g) Allied health care services includes optician, physiotherapist, chiropractor, podiatrist, dietitian, nutritionist, occupational therapist or diabetes/ other health educator. (h) Hospital based health care service includes an overnight stay in hospital, an attendance at the emergency department or an outpatient clinic.
Source: WA Health and Wellbeing Surveillance Systemxxiii
South WestWestern
Australia
Prevalence
(%)
Prevalence
(%)
Health Enhancing Behaviours
Health is rated excellent or very good 88.3 87.0 -
Home is smoke free 98.5 98.2 -
Eats recommended serves of fruit daily 5-15 years (a) 71.8 67.4 -
Eats recommended serves of vegetables daily 5-15 years (b) 10.5 8.1 -
Sufficient physical activity 5-15 years (c ) 46.9 46.1 -
Risk factors
Either or both parents smoked during pregnancy 24.7 24.9 -
Sedentary for more than two hours a day 5-15 years 22.5 24.5 -
Overweight 5-15 years 15.5 16.1 -
Obese 5-15 years 5.1 6.5 -
Conditions and injury
Current asthma 9.1 9.2 -
Injury 20.4 20.7 -
Health Service Utilisation in the last 12 months
Used a primary health care service (e ) 80.3 80.7 -
Used a dental health care service 61.0 58.5 -
Used a mental health care service (f) 4.6 4.2 -
Used an allied health care service (g) 28.8 27.3 -
Used a hospital health care service (h) 25.5 27.2 -
Significant
difference from
WA*

South West Health Profile 2018
60 ONCE PRINTED THIS DOCUMENT MAY BECOME OUT OF DATE Trim Record No: ED-CO-17-17832 REFER TO THE ONLINE SOURCE FOR THE CURRENT VERSION
Potentially Preventable Hospitalisations (PPH), 0 -14 years
Hospitalisations are an indicator of severe conditions in the community and assist in targeting primary care resources to prevent hospitalisations. Many hospitalisations result from conditions where hospitalisations could potentially be avoided using preventive care and early disease management. These hospitalisations are known as PPH and are grouped into three major categories:
- Acute: This category includes dehydration and gastroenteritis, pyelonephritis (kidney infection), pelvic inflammatory disease (PID), ear, nose and throat (ENT) infections, dental conditions, appendicitis, epilepsy, gangrene and cellulitis (skin infection).
- Chronic: This category includes asthma, diabetes (excluding renal dialysis), chronic obstructive pulmonary disease (COPD), iron deficiency anaemia, nutritional deficiencies and rheumatic heart disease.
- Vaccine preventable: This category includes mumps, measles, rubella, whooping cough, influenza and pneumonia.
Public health measures have the greatest influence on vaccine preventable conditions. Effective clinical care with regular review is essential to reduce avoidable admissions for people with chronic conditions.
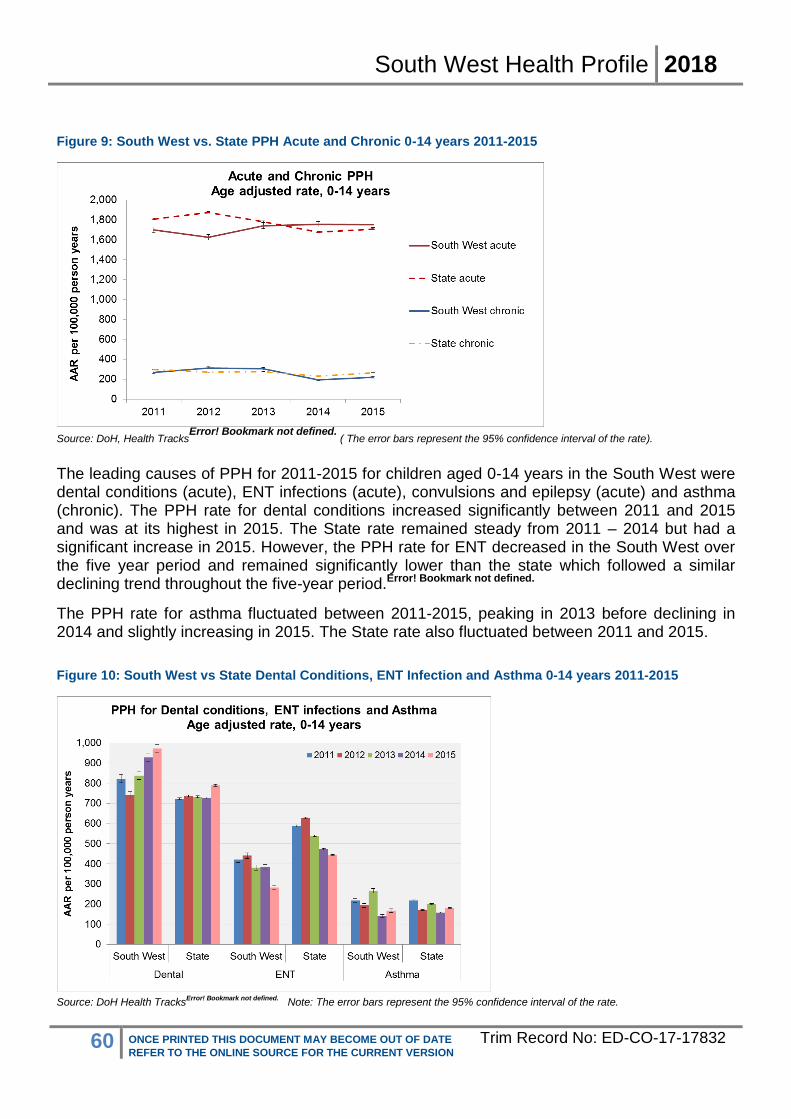
For the period 2011-2015, PPH accounted for 3,564 hospitalisations of South West children aged 0-14 years (13% of all child hospitalisations). The rate was similar to the State. In South West, the PPH rate has been steady throughout the five-year period.Error! Bookmark not defined.
For the period 2011-2015, PPH rates were largely similar to the State for both chronic and acute conditions while vaccine preventable conditions were significantly lower than the State. The PPH rate for acute conditions has significantly increased in 2013-2015 compared with 2011-2012 rate. The PPH rate for chronic conditions peaked in 2013 and hit a low in 2014 with a slight increase in 2015, remaining below the State rate.Error! Bookmark not defined.
Figure 9 compares age-adjusted rates from 2011 to 2015 for acute and chronic conditions. PPH rates for vaccine preventable conditions are significantly lower than acute and chronic conditions and are not shown in the figure.
South West Health Profile 2018
60 ONCE PRINTED THIS DOCUMENT MAY BECOME OUT OF DATE Trim Record No: ED-CO-17-17832 REFER TO THE ONLINE SOURCE FOR THE CURRENT VERSION
Figure 9: South West vs. State PPH Acute and Chronic 0-14 years 2011-2015
Source: DoH, Health Tracks
Error! Bookmark not defined. ( The error bars represent the 95% confidence interval of the rate).
The leading causes of PPH for 2011-2015 for children aged 0-14 years in the South West were dental conditions (acute), ENT infections (acute), convulsions and epilepsy (acute) and asthma (chronic). The PPH rate for dental conditions increased significantly between 2011 and 2015 and was at its highest in 2015. The State rate remained steady from 2011 – 2014 but had a significant increase in 2015. However, the PPH rate for ENT decreased in the South West over the five year period and remained significantly lower than the state which followed a similar declining trend throughout the five-year period.Error! Bookmark not defined.
The PPH rate for asthma fluctuated between 2011-2015, peaking in 2013 before declining in 2014 and slightly increasing in 2015. The State rate also fluctuated between 2011 and 2015.
Figure 10: South West vs State Dental Conditions, ENT Infection and Asthma 0-14 years 2011-2015
Source: DoH Health Tracks
Error! Bookmark not defined. Note: The error bars represent the 95% confidence interval of the rate.

South West Health Profile 2018
60 ONCE PRINTED THIS DOCUMENT MAY BECOME OUT OF DATE Trim Record No: ED-CO-17-17832 REFER TO THE ONLINE SOURCE FOR THE CURRENT VERSION
The PPH rate for dental conditions was significantly higher (1.2 times) than the State PPH rate in children of this age group, accounting for 43 per cent of all PPH. The PPH rate for ENT infections was significantly lower than the State rate and accounted for 19 per cent of all PPH.
Most PPH for ENT infections in children were in very young children aged 0-4 years.Error!
Bookmark not defined.
Data from a national survey in 2012-13, focussing on Aboriginal populations show that hearing problems and ear diseases, caused by chronic otitis media (middle ear infection) in childhood, is considerably higher among Aboriginal children aged 0-14 years (7%) than non-Aboriginal children (3.6%). This is of key concern as hearing loss resultant from otitis media has significant consequences for child language, social development and education.xxiv
Throughout the five-year period 2011-2015, the rate of hospitalisations for disease of the ear and mastoid process for children aged 0-14 years in the South West (824 per 100,000 person years) was similar with the State (796 per 100,000 person years in 2014).Error! Bookmark not defined.
The PPH for children aged 0-14 years in the South West are shown in Table 8.
Table 8: South West leading PPH 0-14 years 2011-2015
Note: The standardised rate ratio (SRR) is the ratio between a particular health region (or district) and the state. A ratio of 1 means the regional rate is the same as the state, a value of 2 indicates the regional rate is twice that of the state, and an SRR of 0.5 indicates the rate in a region is half that of the State population.
Note: Local rates are compared to the rate of all residents of the State using the SRR and the 95% confidence interval of the SRR. Those that are significantly different to the state rate (1.0) have black font, and those that are not significantly different to the state have white font. Those between 1 and 1.5 times the state rate are highlighted orange, higher than 1.5 times the state are highlighted red while those rates less than the state are highlighted green.
Source: DoH, Health TracksError! Bookmark not defined.
Injuries, 0-14 years
For the period 2011-2015, injury and poisoning hospitalisations in children aged 0-14 years in the South West accounted for 2,947 hospitalisations (11% of all hospitalisations in children). The hospitalisation rate of all injury and poisoning for South West children (1,674 per 100,000
PPH ConditionNumber of
PPH
% all child
PPHSRR
dental conditions (acute) 1,525 43% 1.2
ENT infections (acute) 674 19% 0.7
convulsions and epilepsy (acute) 388 11% 1.1
asthma (chronic) 345 10% 1.1
urinary tract infections, including pyelonephritis (acute) 298 8% 1.1
cellulitis (acute) 124 3% 0.5
diabetes complications (chronic) 90 3% 1.0
pneumonia and influenza (vaccine-preventable) (vaccine) 32 1% 0.4
gangrene (acute) 17 0% 1.6
pneumonia (not vaccine-preventable) (acute) 15 0% 1.1
All Potentially Preventable Hospitalisations (PPH) (0-
14 years)3,564 100% 1.0

South West Health Profile 2018
60 ONCE PRINTED THIS DOCUMENT MAY BECOME OUT OF DATE Trim Record No: ED-CO-17-17832 REFER TO THE ONLINE SOURCE FOR THE CURRENT VERSION
person years) was similar to the State rate (1,664 per 100,000 person years).Error! Bookmark not
defined.
The leading causes of injury and poisoning hospitalisations for children aged 0-14 years in the South West were accidental falls, exposure to mechanical forces and transport accidents. The hospitalisation rate for transport accidents was significantly higher (1.3 times) than the State rate.Error! Bookmark not defined.
The rate of hospitalisations for accidental falls in children in the South West increased significantly from 2011 to 2012 before decreasing significantly in 2014 and 2015. The State rate followed a similar trend; however the change was less significant.
Injury due to exposure to mechanical forces in children in the South West were mainly due to being hit struck or crushed by an object, cutting/piercing objects and accidents caused by other person(s). The hospitalisation rate due to mechanical forces peaked in 2012 before a downward trend from 2013 to 2015 to significantly lower levels than the State rate.Error! Bookmark not defined.
Pedal cyclist and motor vehicle/motorcycle occupants injured in a transport accident were the main causes of transport accident hospitalisations in South West children. The transport accident hospitalisation rate was significantly higher than the State rate. The rate for all transport accidents fluctuated between 2011 and 2015, peaking in 2012 while the State rate remained steady.Error! Bookmark not defined.
Figure 11: South West vs. State hospitalisations for leading causes of injury and poisoning 0-14 years 2011-2015
Source: DoH, Health TracksError! Bookmark not defined.
( The error bars represent the 95% confidence interval of the proportion)
Notifiable Infections, 0-14 years
Death and illness resulting from communicable diseases are a major public health problem. Effective containment of many communicable diseases has occurred due to public health legislation requiring reporting of these diseases. ‘Notifiable’ diseases includes a range of vaccine preventable diseases, vector borne diseases, food and water borne diseases, sexually transmitted infections and infections such as Severe Acute Respiratory Syndrome (SARS).

South West Health Profile 2018
60 ONCE PRINTED THIS DOCUMENT MAY BECOME OUT OF DATE Trim Record No: ED-CO-17-17832 REFER TO THE ONLINE SOURCE FOR THE CURRENT VERSION
Under the provisions of the Public Health Act 2016xxv, any medical practitioner or nurse practitioner attending a patient known or suspected to have a notifiable communicable disease has a legal obligation to report the diagnosis to the Department of Health. The Act states that notifications must also be made in the case of post mortem examination and by Pathologists who identify a patient may have a notifiable condition. A complete list of the current notifiable diseases can be accessed via the WA Department of Health.xxvi
For the period 2011-2015, there were 1,697 notifiable diseases in children aged 0-14 years in the South West. The notification rate of notifiable diseases (964 per 100,000 persons) was significantly higher, 1.1 times the State rate.
The leading disease notification type was vaccine preventable. The notification rate (665 per 100,000) (mainly pertussis, influenza, varicella) was significantly higher, 1.2 times than the State rate for children, while the pertussis notification rate was 2.3 times the State rate.
The enteric disease notification rate (269 per 100,000) (mainly campylobacteriosis, salmonellosis, rotavirus and cryptosporidiosis) was similar to the State rate for children. Sixty per cent of the enteric disease notifications were in the 0-4 year old age group, and the notification rate for this age group was also similar to the State rate.Error! Bookmark not defined.
Table 9: South West disease notifications 0-14 years 2011-2015
Condition Number SRR AAR*
vaccine preventable diseases 1,168 1.2 665.0
enteric diseases 477 1.0 269.2
vector-borne diseases 34 1.1 19.4
All notifications (including others) 1,697 1.1 963.9
Source: DoH, Health TracksError! Bookmark not defined.
(* Age-adjusted rate per 100,000 persons
Note: The standardised rate ratio (SRR) is the ratio between a particular health region (or district) and the state. A ratio of 1 means the regional rate is the same as the state, a value of 2 indicates the regional rate is twice that of the state, and an SRR of 0.5 indicates the rate in a region is half that of the State population. Note: Local rates are compared to the rate of all residents of the State using the SRR and the 95% confidence interval of the SRR. Those that are significantly different to the state rate (1.0) have black font, and those that are not significantly different to the state have white font. Those between 1 and 1.5 times the state rate are highlighted orange, higher than 1.5 times the state are highlighted red while those rates less than the state are highlighted green.
For younger children aged 0-4 years in the South West, the notifiable disease rate was highest for pertussis/whooping cough (vaccine preventable). The rate was significantly higher, 1.8 times the State rate. The next leading notifiable disease in the 0-4 year old age group was campylobacteriosis (enteric disease) and the rate was also significantly higher, 1.4 times the State rate.Error! Bookmark not defined.
Implications for health service planning: The leading causes of PPH for children in the South West, were acute dental conditions and acute ENT infections. As potentially preventable conditions can be greatly influenced by public health measures this suggests a need for increased preventative programs as well as maintenance programs and primary health care services. For the period 2011-2015, the notification rate of notifiable diseases was significantly higher than the State rate and the leading disease notification type was vaccine preventable. This highlights the importance of Public Health measures such as better immunisation coverage within the region.

South West Health Profile 2018
60 ONCE PRINTED THIS DOCUMENT MAY BECOME OUT OF DATE Trim Record No: ED-CO-17-17832 REFER TO THE ONLINE SOURCE FOR THE CURRENT VERSION
Health of Adults
Self-reported risk factors, 16 years and over
Lifestyle factors are particularly important due to their relationship with chronic conditions that are considered to be preventable. Prevention and management of these modifiable risk factors can have a substantial effect on these preventable chronic conditions.x
Results from the HWSS 2013-2016 for adults aged 16 years and over for the South West population are shown in Table 10. In summary:
one in eight adults (13%) smoked;
nearly half (48%) of adults did not eat the recommended daily serves of fruit;
most adults (87%) did not eat the recommended daily serves of vegetables;
nearly a third (31%) drank alcohol at risk for long-term harm;
one in eight (12%) drank alcohol at risk for short-term harm;
over a third (36%) of adults did not do sufficient physical activity;
one in five (19%) adults reported high blood pressure, significantly higher than the State;
one third (33%) of adults reported height and weight measurements that classified them as obese, significantly higher than the State.
While most risk factors showed no significant difference in the prevalence of South West residents compared with the State, the prevalence is still important because these behaviours are modifiable risk factors for chronic conditions.
Lifestyle risk factor information is not readily available for Aboriginal South West residents. For State Aboriginal people, 39 per cent were obese and 67 per cent were overweight or obese (BMI 25 or higher) in 2012-13. In 2014-15, 38 per cent of State Aboriginal people aged 18 years and over reported high or very high levels of psychological stress which is significantly more than the State prevalence of 7.6 per cent.xxvii
Table 10: South West vs. State lifestyle and psycho-social risk factors for persons aged 16 years and over by gender 2013-2016
Notes: Results significantly better than the State are highlighted green, significantly worse are highlighted red. Where result could be interpreted as either better or worse, or results similar to the State have not been highlighted. Population estimate refers to the estimated number of people with the risk factor/ condition. It is derived by multiplying the Estimated Resident Population by the persons prevalence estimate.
Female Male Persons Female Male Persons Female Male Persons
Health risk factors
Currently smokes 10.9 14.3 12.6 17,335 9.8 14.6 12.2 - - -
Does not eat two or more serves of fruit daily 42.5 52.6 47.6 65,250 45.3 52.7 49 - - -
Does not eat five or more serves of vegetables daily 85.1 89 87.1 119,405 87.3 90.8 89.1 - - -
Drinks at high risk levels for long-term harm (1) 19.9 40.7 30.5 41,743 17.9 38.6 28.3 - - -
Drinks at high risk levels for short-term harm (2) 6.8 16.4 11.7 16,021 5.4 16.5 11 - - -
Completes less than 150 minutes of moderate
physical activity per week (adults 18 years and over)
40.2 32.1 36.1 49,453 40.6 32.2 36.4 - - -
Current high blood pressure 18.4 18.5 18.5 25,292 15.6 16.6 16.1 Higher - Higher
Current high cholesterol 18 20.6 19.3 26,465 16.9 18.9 17.9 - - -
Overweight (3) 33.2 44.9 39.2 53,775 32.6 44.7 38.8 - - -
Obese (3) 32.4 33.4 32.9 45,128 27.4 28.2 27.8 Higher Higher Higher
High or very high psychological distress 8.1 7 7.6 10,364 9.4 7 8.2 - - -
Lack of control over life in general (4) 4.6 3.5 4.1 5,576 5.4 4.2 4.8 - - -
Indicator South West Prevalence
EstimatePopulation
Estimate
WA Prevalence Estimate Comparison to WA

South West Health Profile 2018
60 ONCE PRINTED THIS DOCUMENT MAY BECOME OUT OF DATE Trim Record No: ED-CO-17-17832 REFER TO THE ONLINE SOURCE FOR THE CURRENT VERSION
1. Drinks more than 2 standard drinks on any one day. 2. Drinks more than 4 standard drinks on any one day. 3. Height and weight measurements have been adjusted for errors in self-report. 4. Often or always feels a lack of control over life in general.
Source: WA Health and Wellbeing Surveillance System, Epidemiology Branch, DoHvi
Self-reported chronic conditions, 16 years and over
Hospital data only captures chronic conditions hospitalisations and cannot provide a complete picture of the prevalence of chronic conditions in the community. This type of information is more appropriately collected by population based surveys, such as the WA HWSS or Bettering the Evaluation and Care of Health (BEACH) surveys, which provide a more complete picture of prevalence of chronic conditions.
The HWSS survey 2013-2016 for self-reported, doctor diagnosed chronic conditions for South West adults found:
one in four adults (24%) reported an injury requiring treatment from a medical professional in the previous year;
nearly one in four adults (23%) reported arthritis, significantly higher than the State (20%);
one in seven adults (14%) reported a current mental health problem;
one in twelve adults (8%) had asthma;
one in fourteen (7%) had diabetes;
one in sixteen (6%) had osteoporosis, which was significantly higher than the State (5%). As the HWSS may not be representative of the Aboriginal population, national levels of chronic disease among the Aboriginal population must be factored into estimates of chronic disease in the South West region; given that three per cent of the population is Aboriginal. Nationally, Aboriginal people report a higher prevalence of most chronic conditions compared with non-Aboriginal people.xxiv
Table 11: South West vs. State self-reported doctor diagnosed health conditions for persons aged 16 years and over by gender 2013-2016
Notes: Results significantly better than the State are highlighted green, significantly worse are highlighted red. Where result could be interpreted as either better or worse, or results similar to the State have not been highlighted. Population estimate refers to the estimated number of people with the risk factor/ condition. It is derived by multiplying the Estimated Resident Population by the persons prevalence estimate. 1. Excludes skin cancer. 2. Respiratory problem other than asthma that has lasted 6 months or more. 3. Injury in the last 12 months requiring treatment from a health professional. 4. Diagnosed with depression, anxiety, stress-related or other mental health problem in the past 12 months. Source: WA Health and Wellbeing Surveillance System, Epidemiology Branch, DoH
xxviii.
Female Male Persons Female Male Persons Female Male Persons
Doctor diagnosed health conditions
Diabetes 6.8 6.6 6.7 9,166 5.9 6.4 6.2 - - -
Heart disease 5 7.8 6.5 8,847 4.5 7 5.8 - - -
Cancer (1) 7.5 5.2 6.3 8,617 6 4.9 5.5 - - -
Current asthma 8.9 6.5 7.7 10,549 9.8 6.9 8.4 - - -
Current respiratory problem (2) 2.3 2.8 2.6 3,508 1.9 2.2 2 - - -
Stroke 1.6 2.5 2.1 2,820 1.5 1.9 1.7 - - -
Arthritis 26.1 18.9 22.5 30,783 23 16.1 19.5 Higher - Higher
Osteoporosis 8.2 3.5 5.8 7,960 7.2 2.4 4.8 - - Higher
Injury (3) 20.3 26.9 23.6 32,403 19.7 25.8 22.8 - - -
Current mental health problem (4) 17.3 11.1 14.1 19,384 18.1 11.1 14.6 - - -
Indicator South West Prevalence
EstimatePopulation
Estimate
WA Prevalence Estimate Comparison to WA

South West Health Profile 2018
60 ONCE PRINTED THIS DOCUMENT MAY BECOME OUT OF DATE Trim Record No: ED-CO-17-17832 REFER TO THE ONLINE SOURCE FOR THE CURRENT VERSION
Self-reported service utilisation, 16 years and over
For the period 2013-2016, South West adult residents aged 16 years and over, reported that in the previous year:
most adults (88%) have used a primary health care service;
half of adults (52%) have used a dental health care service;
over half of adults (54%) have used an allied health care service;
nearly a third (29%) have used a hospital based health care service;
one in nine (11%) have used an alternative health care service; and
South West health service utilisation was similar to the State.
Table 12: South West vs. State self-reported health service utilisation for persons aged 16 years and over by gender 2013-2016
Note: Results significantly better than the State are highlighted green, significantly worse are highlighted red. Where result could be interpreted as either better or worse, or results similar to the State have not been highlighted. Population estimate refers to the estimated number of people with the risk factor/ condition. It is derived by multiplying the Estimated Resident Population by the persons prevalence estimate. 1. e.g. medical specialist, general practitioner, community health centre, community or district nurses. 2. e.g. psychiatrist, psychologist or counsellor. 3. e.g. optician, physiotherapist, chiropractor, podiatrist, dietician, nutritionist, occupational therapist, diabetes/other health educator. 4. e.g. overnight stay, emergency department or outpatients. 5. e.g. acupuncturist, naturopath, homeopath or any other alternative health service. Source: WA Health and Wellbeing Surveillance System, Epidemiology Branch, DoH
xxviii.
Female Male Persons Female Male Persons Female Male Persons
Health service utilisation in the past 12 months
Used a primary health care service (1) 91.1 85.6 88.3 121,023 92 86.3 89.1 - - -
Used a dental health care service 56.2 48.4 52.2 71,610 59.9 49.9 54.9 - - -
Used a mental health care service (2) 8.2 7.7 7.9 10,854 9.1 6.1 7.6 - - -
Used an allied health care service (3) 59 48.4 53.6 73,486 56 46.6 51.3 - - -
Used a hospital health care service (4) 27.4 29.8 28.6 39,196 27.9 25.2 26.5 - - -
Used an alternative health care service (5) 13.6 8 10.8 14,760 11.9 7.3 9.6 - - -
Mean number of health service visits in the past 12 months (of those who attended the service)
Mean visits to primary health care service (1) 4.8 3.9 4.3 4.9 3.7 4.3 - - -
Mean visits to dental health care service 1.1 0.9 1 1.2 0.9 1 - - -
Mean visits to mental health care service (2) 0.5 0.4 0.5 0.7 0.4 0.6 - - -
Mean visits to allied health care service (3) 3.3 2.3 2.8 3.6 2.4 3 - - -
Mean visits to hospital based health care service
(4)
0.5 0.5 0.5 0.6 0.5 0.6 - - -
Mean visits to alternative health care service (5) 0.6 0.4 0.5 0.6 0.4 0.5 - - -
Indicator South West Prevalence
EstimatePopulation
Estimate
WA Prevalence Estimate Comparison to WA
Implications for primary health service planning:
Primary health services are particularly important as they provide an opportunity to monitor modifiable risk factors and chronic conditions, and to implement public health programs and interventions, such as vaccinations. A high prevalence of a condition, but a low health service utilisation for that condition may suggest either a lack of access to services, or optimal control of the condition. Therefore, the reporting of actual numbers, as well as rates of conditions and service provision, could be a better representation of chronic condition management. A continued focus on ambulatory and primary health care in partnership with local government, other private and not-for-profit health providers is one means to improve chronic disease management is recommended

South West Health Profile 2018
60 ONCE PRINTED THIS DOCUMENT MAY BECOME OUT OF DATE Trim Record No: ED-CO-17-17832 REFER TO THE ONLINE SOURCE FOR THE CURRENT VERSION
Hospitalisations, 15-64 years
For the period 2011-2015, the overall hospitalisation rate of South West residents aged 15-64 years was similar to the State rate.
Table 13: South West resident’s hospitalisations adults 15-64 years by gender 2011-2015
Note: The standardised rate ratio (SRR) is the ratio between a particular health region (or district) and the state. A ratio of 1 means the regional rate is the same as the state, a value of 2 indicates the regional rate is twice that of the state, and an SRR of 0.5 indicates the rate in a region is half that of the State population. Note: Local rates are compared to the rate of all residents of the State using the SRR and the 95% confidence interval of the SRR. Those that are significantly different to the state rate (1.0) have black font, and those that are not significantly different to the state have white font. Those between 1 and 1.5 times the state rate are highlighted orange, higher than 1.5 times the state are highlighted red while those rates less than the state are highlighted green.
Source: DoH, Health TracksError! Bookmark not defined.
For the period 2006-2015, the overall hospitalisation rate of Aboriginal South West residents aged 15-64 years was significantly lower than the Aboriginal State. However, this rate was significantly higher (2.2 times) than the non-Aboriginal South West rate, highlighting the disparity between the Aboriginal and non-Aboriginal residents in the region. The rate for non-Aboriginal South West residents aged 15-64 years was significantly higher (1.1 times) than the non-Aboriginal State rate.
Table 14: South West hospitalisations Aboriginal and non-Aboriginal residents 15-64 years 2006-2015
Note: The standardised rate ratio (SRR) is the ratio between a particular health region (or district) and the state. A ratio of 1 means the regional rate is the same as the state, a value of 2 indicates the regional rate is twice that of the state, and an SRR of 0.5 indicates the rate in a region is half that of the State population.
Note: Local rates are compared to the rate of all residents of the State using the SRR and the 95% confidence interval of the SRR. Those that are significantly different to the state rate (1.0) have black font, and those that are not significantly different to the state have white font. Those between 1 and 1.5 times the state rate are highlighted orange, higher than 1.5 times the state are highlighted red while those rates less than the state are highlighted green.
Source: DoH, Health TracksError! Bookmark not defined.
For the period 2006-2015 the leading cause of hospitalisation by major diagnosis category for 15-64 year old South West residents was digestive diseases. This accounted for 13 per cent of hospitalisations in this age group, followed by pregnancy and childbirth (9%) and musculo-skeletal diseases (9%).
Number SRR AAR*
South West
Males 80,374 1.0 27,465
Females 107,963 1.0 38,497
Persons 188,337 1.0 32,988
Number SRR AAR*
South West
Aboriginal 14,562 0.6 68,968
Non-Aboriginal 331,076 1.1 31,474

South West Health Profile 2018
60 ONCE PRINTED THIS DOCUMENT MAY BECOME OUT OF DATE Trim Record No: ED-CO-17-17832 REFER TO THE ONLINE SOURCE FOR THE CURRENT VERSION
Table 15: South West leading cause of hospitalisation 15-64 years 2011-2015
Note: The list of leading causes exclude ‘Factors influencing health status and contact with health services’ and ‘attending health services for examination and investigation’, reproduction, specific procedures, and other circumstances, and potential health hazards related to communicable diseases, socioeconomic and psychosocial circumstances, family and personal history. This also exclude renal dialysis. These are included in the total.
Source: DoH, Health TracksError! Bookmark not defined.
For the period 2011-2015 South West residents aged 15-64 years had 14,313 separations for dialysis (4% of total). For adults aged 15-64 years, across the State renal dialysis accounted for 343,744 separations, while 7% of total ‘Other’ leading reasons for South West hospitalisations by minor category were chemotherapy (3%), delivery (3%), arthropathies (3%) and symptoms involving the digestive system and abdomen (2%).Error! Bookmark not defined.
The leading cause of hospitalisation by minor diagnosis category for Aboriginal residents aged 15-64 years was also dialysis, which accounted for 28 per cent of hospitalisations in this age group (2006-2015). This was followed by alcohol and drug disorders (3%), delivery (3%), symptoms involving the circulatory and respiratory systems (2%) and ischaemic heart disease (2%).Error! Bookmark not defined.
For non-Aboriginal residents, the leading cause of hospitalisation by minor diagnosis category was chemotherapy (4%), followed by dialysis (3%), delivery (3%) arthropathies (3%) and symptoms involving the digestive system and abdomen (2%). The non-Aboriginal residents’ leading causes were similar to the overall South West residents aged 15-64 years. The period stated for Aboriginal people is longer to provide more accurate and confidential data.Error!
Bookmark not defined.
Alcohol and tobacco related hospitalisations, 15-64 years
For the period 2011-2015, the alcohol-related hospitalisation rate was 826 per 100,000 person years for South West adults aged 15-64 years. This was similar with the State rate. The tobacco-related hospitalisation rate (518 per 100,000 person years) was also similar to the State rate.Error! Bookmark not defined.
For the period 2011-2015, South West Aboriginal residents had significantly lower rates for both alcohol (0.7 times) and tobacco (0.8 times) than State Aboriginal residents. Although South West Aboriginal residents had lower rates compared to the State, they had significantly higher rates than non-Aboriginal residents for both alcohol and tobacco hospitalisations in this age group (alcohol 4.5 times and tobacco 3.4 times). South West non-Aboriginal residents had
Rank Cause of Hospitalisation Number% of all hospitalisations
(15-64yrs)State Rank
1 Digestive diseases 24,726 13% 1
2 Pregnancy and childbirth 17,843 9% 2
3 Musculo-skeletal diseases 17,003 9% 4
4 Ill-defined conditions 14,020 7% 3
5 Injury and Poisoning 13,474 7% 5
All hospitalisations (15-64yrs) 188,337 100%

South West Health Profile 2018
60 ONCE PRINTED THIS DOCUMENT MAY BECOME OUT OF DATE Trim Record No: ED-CO-17-17832 REFER TO THE ONLINE SOURCE FOR THE CURRENT VERSION
significantly higher rate for tobacco-related hospitalisations (1.1 times) than State non-Aboriginal residents in this age-group.Error! Bookmark not defined.
Potentially preventable hospitalisations (PPH), 15-64 years
For the period 2011-2015, PPH accounted for 8,338 hospitalisations of South West adults (4% of all hospitalisations in this age group). The overall PPH rate for adults was significantly lower for the South West region than for the State. Specifically, the rate for acute conditions was significantly lower while vaccine preventable and chronic condition rates were similar to the State rates.Error! Bookmark not defined.
The Figure 12 compares age-adjusted rates from 2011 to 2015 for the South West and State by Aboriginality. South West Aboriginal residents aged 15-64 years had a significantly higher rate than South West non-Aboriginal residents in this age group, over the whole period. However, they had a significantly lower rate than State Aboriginal residents for most of the period except in 2011, where the rate was similar.Error! Bookmark not defined.
Figure 12: South West vs State PPH by Aboriginality 15-64 years 2011-2015
Notes: The error bars represent the 95% confidence interval of the proportion;
Source: DoH, Health TracksError! Bookmark not defined.
Figure 13 shows the trends in PPH rates for acute and chronic conditions for adults in the South West. The PPH rates for vaccine preventable conditions in South West adults aged 15-64 years were lower than acute and chronic conditions and during 2011-2015. The rate increased significantly during the five year period and was 2.4 times higher in 2015 compared with 2011.Error! Bookmark not defined.
The PPH rate for acute conditions for South West residents aged 15-64 years was significantly lower than the State rate from 2011 to 2014 and was similar to the State rate in 2015. While the PPH rate for chronic conditions was similar to the State rate throughout the 2011- 2015 period.Error! Bookmark not defined.

South West Health Profile 2018
60 ONCE PRINTED THIS DOCUMENT MAY BECOME OUT OF DATE Trim Record No: ED-CO-17-17832 REFER TO THE ONLINE SOURCE FOR THE CURRENT VERSION
Figure 13: South West vs. State Acute and Chronic PPH 15-64 years 2011-2015
Notes: The error bars represent the 95% confidence interval of the proportion;
Source: DoH, Health TracksError! Bookmark not defined.
For the period 2011-2015, the overall leading PPH condition in South West residents aged 15-64 years were dental conditions, which accounted for 15 per cent of all PPH in this age group. The PPH rate for dental conditions was lower than the State rate during this period.Error! Bookmark
not defined.
The second leading cause of PPH for South West residents aged 15-64 years was cellulitis. The PPH rate remained fairly steady between 2011 and 2015 in the South West and was similar to the State rate. The third leading cause of PPH rates for South West residents aged 15-64 years was angina. The PPH rate decreased significantly from 2011 to 2014 and then remained steady. The rate was 1.3 times higher than the State rate in 2011-2015 for this age group. The fourth leading cause of PPH, urinary tract infections including pyelonephritis, was below the State rate for the five year period.Error! Bookmark not defined.
Figure 14: South West vs. State Top 4 PPH 15-64 years 2011-2015

South West Health Profile 2018
60 ONCE PRINTED THIS DOCUMENT MAY BECOME OUT OF DATE Trim Record No: ED-CO-17-17832 REFER TO THE ONLINE SOURCE FOR THE CURRENT VERSION
Notes: The error bars represent the 95% confidence interval of the proportion; Source: DoH, Health TracksError! Bookmark not defined.
Other leading PPH for adults aged 15-64 years in the South West are shown in Table 16. Rates of PPH caused by convulsions and epilepsy and chronic obstructive pulmonary disease (COPD) were significantly higher (1.1 times) than the State rates for adults aged 15-64 years.
Table 16: South West leading PPH 15-64 years 2011-2015
Note: The standardised rate ratio (SRR) is the ratio between a particular health region (or district) and the state. A ratio of 1 means the regional rate is the same as the state, a value of 2 indicates the regional rate is twice that of the state, and an SRR of 0.5 indicates the rate in a region is half that of the State population.
Note: Local rates are compared to the rate of all residents of the State using the SRR and the 95% confidence interval of the SRR. Those that are significantly different to the state rate (1.0) have black font, and those that are not significantly different to the state have white font. Those between 1 and 1.5 times the state rate are highlighted orange, higher than 1.5 times the state are highlighted red while those rates less than the state are highlighted green.
Source: DoH, Health TracksError! Bookmark not defined.
Notifiable Infections and Events, 15-64 years
For the period 2011-2015, communicable disease notification rates for South West region residents aged 15-64 years were significantly lower than the State rates. However enteric (1.2
PPH Condition Number % all PPH
(15-64 years)SRR
dental conditions 1,222 15% 0.8
cellulitis 924 11% 1.0
angina 820 10% 1.3
urinary tract infections, including pyelonephritis 783 9% 0.8
iron deficiency anaemia 717 9% 1.02
diabetes complications 696 8% 0.9
convulsions and epilepsy 688 8% 1.1
chronic obstructive pulmonary disease 514 6% 1.1
ENT infections 422 5% 0.9
asthma 398 5% 1.1
gangrene 243 3% 1.01
congestive cardiac failure 206 2% 0.8
pneumonia and influenza (vaccine-preventable) 158 2% 0.8
pelvic inflammatory disease 115 1% 0.8
hypertension 89 1% 1.01
All PPH (15-64yrs) 8,338 100% 0.9
Implications for health service planning:
The overall PPH rate for adults was significantly lower for the South West compared to the
State. The PPH rate for South West Aboriginal residents was significantly higher that the non-
Aboriginal rate. This highlights the health disparity between Aboriginal and non-Aboriginal people in the region and the need to prioritise investment in preventative programs, maintenance programs and primary health care services that engage with and support Aboriginal people to better manage and improve their health.

South West Health Profile 2018
60 ONCE PRINTED THIS DOCUMENT MAY BECOME OUT OF DATE Trim Record No: ED-CO-17-17832 REFER TO THE ONLINE SOURCE FOR THE CURRENT VERSION
times) and vector-borne diseases (1.5 times) were significantly higher than State rates.Error!
Bookmark not defined.
Table 17: South West resident communicable disease notification rates 15-64 years 2011-2015
Source: DoH, Health TracksError! Bookmark not defined. Notes: * Age-adjusted rate per 100,000 persons
Note: The standardised rate ratio (SRR) is the ratio between a particular health region (or district) and the state. A ratio of 1 means the regional rate is the same as the state, a value of 2 indicates the regional rate is twice that of the state, and an SRR of 0.5 indicates the rate in a region is half that of the State population.
Note: Local rates are compared to the rate of all residents of the State using the SRR and the 95% confidence interval of the SRR. Those that are significantly different to the state rate (1.0) have black font, and those that are not significantly different to the state have white font. Those between 1 and 1.5 times the state rate are highlighted orange, higher than 1.5 times the state are highlighted red while those rates less than the state are highlighted green.
Vector-borne diseases, 15-64 years
There were 958 vector-borne notifications for the period 2011-2015 in South West residents aged 15-64 years, mostly notifications of Ross River Virus (RRV) (66% of all notifications for vector borne diseases in this age group; 114 per 100,000 persons). The RRV rate was significantly higher (1.8 times) than the State rate for this age group. The age group most affected by vector-borne diseases and RRV was the 45-64 year olds.Error! Bookmark not defined.
The notification rate for RRV fluctuated between 2011 and 2015 for both the South West and the State. There was a significant decrease in 2014 and 2015 for the South West and the rate was similar to the State rate in 2015.Error! Bookmark not defined.
Figure 15 South West Ross River Virus notifications residents aged 15-64 years 2011-2015
Source: DoH, Health TracksError! Bookmark not defined.
(Notes: The error bars represent the 95% confidence interval of the proportion)
Condition Number SRR AAR*
sexually transmitted diseases 2,970 0.8 621.0
enteric diseases 953 1.2 177.1
vaccine preventable diseases 1,681 0.9 302.1
vector-borne diseases 958 1.5 174.3
blood-borne diseases 448 0.9 86.4
All notifications (15-64yrs) 7,052 0.9 1,367.8

South West Health Profile 2018
60 ONCE PRINTED THIS DOCUMENT MAY BECOME OUT OF DATE Trim Record No: ED-CO-17-17832 REFER TO THE ONLINE SOURCE FOR THE CURRENT VERSION
Enteric diseases, 15-64 years
There were 953 enteric notifications for the period 2011-2015 in South West residents aged 15-64 years, mostly notifications of campylobacteriosis (63% of all enteric notifications; 110 per 100,000 person years). The campylobacteriosis notification rate was significantly higher (1.2 times) than the State rate for this age group for this period as a whole. The notification rate in the South West 15-64 year old age group peaked in 2012 but was similar to the State rate in 2013 and 2015.Error! Bookmark not defined.
Figure 16: South West South West Campylobacteriosis notifications 15-64 years 2011-2015
Source: DoH, Health Tracks
Error! Bookmark not defined. The error bars represent the 95% confidence interval of the proportion
Vaccine preventable diseases, 15-64 years
There were 1,681 vaccine preventable notifications For the period 2011-2015 in South West residents aged 15-64 years, mostly for influenza (37% of all vaccine preventable; 111 per 100,000 person years) and pertussis/whooping cough (34%; 105 per 100,000 person years). The pertussis rate was significantly higher (1.4 times) than the State rate for this age group. The age group most affected by pertussis was the 5-14 year olds. The pertussis notification rate fluctuated over 2011 -2015 bottoming out in 2013 and increasing back up to 2011 levels in 2015. The State rate decreased significantly after 2012 and remained steady in 2013-2015.Error!
Bookmark not defined.
For influenza notifications, the rate increased significantly between 2013 and 2014 and while it decreased significantly again in 2015, the rate remained significantly higher (3 times higher) than in 2011-2013 for this age group. The State rate fluctuated significantly within the time period and was at its highest in 2015.Error! Bookmark not defined.

South West Health Profile 2018
60 ONCE PRINTED THIS DOCUMENT MAY BECOME OUT OF DATE Trim Record No: ED-CO-17-17832 REFER TO THE ONLINE SOURCE FOR THE CURRENT VERSION
Figure 17: South West residents Pertussis/whooping cough and Influenza notifications 15-64 years 2011 to 2015
Notes: The error bars represent the 95% confidence interval of the proportion;
Source: DoH, Health TracksError! Bookmark not defined.
Sexually Transmitted Infections, all ages
Notifiable STIs information for South West residents is represented in Figure 18, Figure 19 and Table 18 Information for this section presents all age groups combined as per the data source.
Figure 18: South West vs. State sexually transmitted notification rates 2011-2015
Notes: The error bars represent the 95% confidence interval of the proportion; Source: DoH, Health TracksError! Bookmark not defined.
The rate of sexually transmitted infections (STI) was lower among South West residents compared with the State between 2011 and 2015. The trend for STIs in the South West was fairly steady throughout the five year period with no significant change. The State rate remained steady until 2013 and decreased significantly in 2014 and remained the same in 2015.Error!
Bookmark not defined.& xxix

South West Health Profile 2018
60 ONCE PRINTED THIS DOCUMENT MAY BECOME OUT OF DATE Trim Record No: ED-CO-17-17832 REFER TO THE ONLINE SOURCE FOR THE CURRENT VERSION
At the State level, there are noticeable differences in the rate of some notifiable diseases in the Aboriginal compared with non-Aboriginal populations. Table 18 demonstrates the South West STI and Blood-borne virus notification rates.Error! Bookmark not defined.
Table 18: South West notifiable disease by Aboriginality 2006-2015
Notes:* includes newly acquired and unspecified. ASR = Age-standardised notification rate per 100,000 population. Source: DoH Health Tracks
Chlamydia is the first and gonorrhoea is the second most commonly notified STI in WA. There was no significant change in the chlamydia notification rate for the South West region between 2011 and 2015. During this time period, the State notification rate for chlamydia decreased significantly. Gonorrhoea notification rate increased significantly in the five year period for South West residents. The Hepatitis B and C notification rates for South West have remained steady between 2011 and 2015.Error! Bookmark not defined.
Figure 19: WA Health Service Provider Notification Rate of Chlamydia and Gonorrhoea 2015
Source: The Epidemiology of Notifiable Sexually Transmitted Infections and Blood-Borne Viruses in Western Australia 2015
xxx.
No. ASR No. ASR
Sexually Transmitted Infections (STI)
Chlamydia 213 410.8 3,019 230.6
Gonorrhea 34 68.1 211 15.6
Blood Borne Virus (BBV)
Hepatitis B 5 N/A 139 9.9
Hepatitis C 90 253.6 628 43.5
Aboriginal Non-Aboriginal

South West Health Profile 2018
60 ONCE PRINTED THIS DOCUMENT MAY BECOME OUT OF DATE Trim Record No: ED-CO-17-17832 REFER TO THE ONLINE SOURCE FOR THE CURRENT VERSION
Cancer Incidence, 15-64 years Cancer is a leading cause of disease burden and contributed to one in five cases of the total disease burden in Australia in 2011. Many cancers have high survival rates, yet 94 per cent of cancer burden was due to premature death. People living in very remote and remote areas across Australia have the highest cancer death rates. The five most commonly diagnosed cancers in 2017 were breast, melanoma, prostate, colorectal, and lung cancers. xxxi&xxxi
Table 19 shows a summary of the leading cancer incidence in the South West. The melanoma (skin) cancer rate in the South West was significantly higher (1.4 times) than the State rate for the period 2011-2015.Error! Bookmark not defined.
Table 19: South West Cancer incidence 15-64 years 2011-2015
Note: The standardised rate ratio (SRR) is the ratio between a particular health region (or district) and the state. A ratio of 1 means the regional rate is the same as the state, a value of 2 indicates the regional rate is twice that of the state, and an SRR of 0.5 indicates the rate in a region is half that of the State population. Note: Local rates are compared to the rate of all residents of the State using the SRR and the 95% confidence interval of the SRR. Those that are significantly different to the state rate (1.0) have black font, and those that are not significantly different to the state have white font. Those between 1 and 1.5 times the state rate are highlighted orange, higher than 1.5 times the state are highlighted red while those rates less than the state are highlighted green.
Source: DoH, Health TracksError! Bookmark not defined.
Rank Condition N% all cases
(15-64yrs)SRR
1 breast 383 18% 1.1
2 melanoma (skin) 329 16% 1.4
3 prostate gland 323 16% 1.1
4 colorectal 178 9% 1.0
5 lung, bronchus & trachea 98 5% 0.8
All cancer incidence (15-64 yrs) 2,080 100% 1.1
Implications for health service planning: When planning health promotion programs and screening opportunities aimed at reducing notifiable diseases, and particularly STIs, the number of diseases and trends need to be considered. Notification rates for STIs are higher in the younger population and Aboriginal people. Opportunistic screening may help to reduce the spread of notifiable diseases. Health regions could consider the recommendations and five key strategies of the “Third National Transmissible Infections Strategy 2014-2017” when planning targeted programs for this populationxxix. The Environmental Health Directorate’s management of mosquito control across WA was recognised at the Mosquito Control Association of Australia Conference 2014, coordinated with local government programs getting significant assistance and support from the WA Department of Health and Research Institutions. WA is seen as taking a lead role in the management of mosquitoes and mosquito borne disease. http://www.public.health.wa.gov.au/cproot/6278/2/Environmental%20Health%20Yearbook%202014-15.pdf

South West Health Profile 2018
60 ONCE PRINTED THIS DOCUMENT MAY BECOME OUT OF DATE Trim Record No: ED-CO-17-17832 REFER TO THE ONLINE SOURCE FOR THE CURRENT VERSION
Mental Health, 15-64 years
Youth Suicide, 15-24 years
Table 20 shows the youth suicide rates for males and females between 2006 and 2015 and that suicide was the leading cause of death in the South West 15-24 year olds causing 19 deaths in 2011-2015 in the region (1.4 times the State rate). The suicide rate for males aged 15-24 years in the South West region was 22.3 per 100,000 persons and for females it was 6.6 per 100,000 persons.Error! Bookmark not defined.
Table 20: South West youth suicide rates by gender 15-24 years 2006-2015
* These rates have been age-standardised to the Australian 2001 population.
Source: DoH, Health TracksError! Bookmark not defined.
Mental Health, 16 years and over
For the period 2013-2016, HWSS found that one in seven (14%) South West adults aged 16 years and over reported having a current diagnosed mental health problem, with the prevalence of 17 per cent among females and 11 per cent for males. However, only eight per cent reported having used a mental health care service in the last year. These figures were similar to the State.Error! Bookmark not defined.
HWSS collects information regarding psychological distress and perceived lack of control, which are both related to mental health and can have adverse effects on health. Eight per cent of South West adults reported high or very high psychological distress, while four per cent reported lack of control over their life in general. These figures were similar to the State.Error!
Bookmark not defined.
Whilst this information is not available for the South West Aboriginal population, the Aboriginal population aged 15 years and over has been found reporting higher levels of psychological stress than their non-Aboriginal counterparts with 36 per cent of State Aboriginal and Torres Strait Islander people reporting high or very high psychological distress.xxxii
Community Mental Health Activity, 15-64 years
For the period 2011-2015, South West residents aged 15-64 years accessed community mental health services at a significantly lower rate compared with the State and they had 172,959 occasions of service. The South West Aboriginal residents aged 15-64 years accessed community mental health services 2.2 times the rate of non-Aboriginal residents.Error! Bookmark not
defined.
Nearly half of the occasions of service (48%) were for the 25-44 year old age group. The leading cause for were schizophrenia schizotypal and delusional disorders and the rate was significantly lower than the State. This was followed by disorders of adult personality and behaviour (1.4 times), substance abuse disorders (1.8 times) and mental retardation (1.8 times) had higher rates than the State.Error! Bookmark not defined.
Youth suicides (per 100,000 persons)* Metro State
2006-2015
Males (15-24 years) 22.3 15.1 19.6
Females (15-24 years) 6.6 6.4 7.7
South West Health
Region
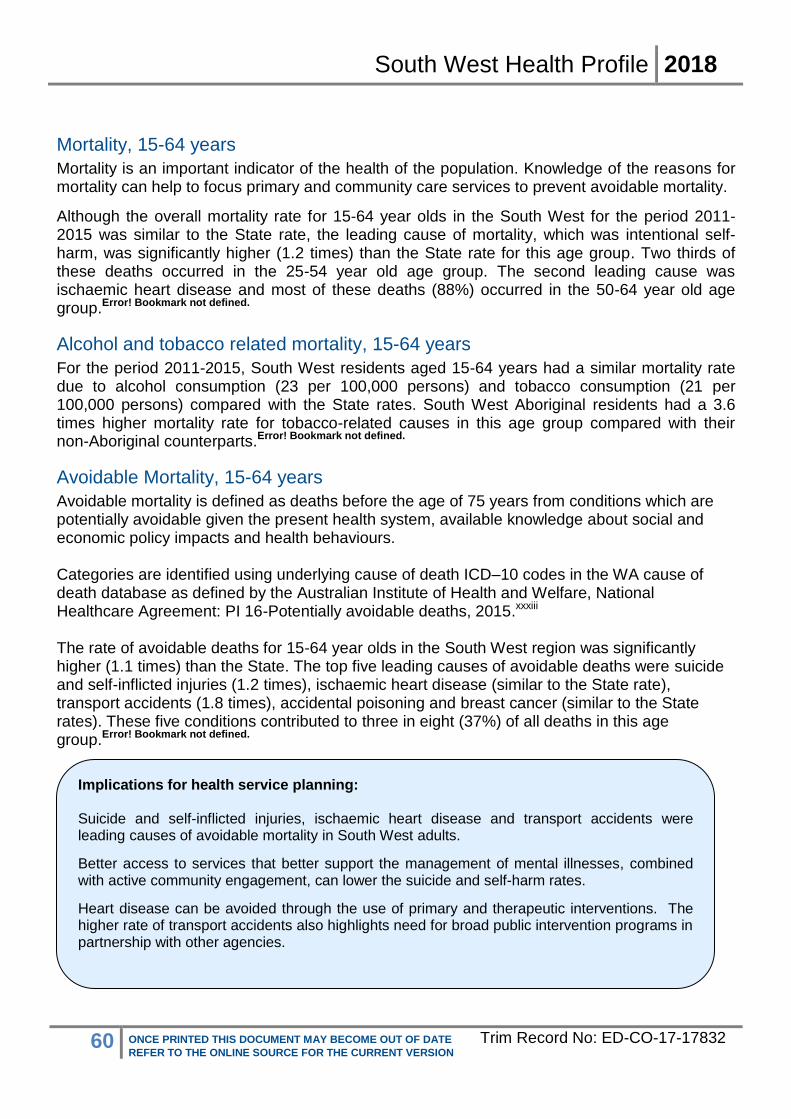
South West Health Profile 2018
60 ONCE PRINTED THIS DOCUMENT MAY BECOME OUT OF DATE Trim Record No: ED-CO-17-17832 REFER TO THE ONLINE SOURCE FOR THE CURRENT VERSION
Mortality, 15-64 years
Mortality is an important indicator of the health of the population. Knowledge of the reasons for mortality can help to focus primary and community care services to prevent avoidable mortality.
Although the overall mortality rate for 15-64 year olds in the South West for the period 2011-2015 was similar to the State rate, the leading cause of mortality, which was intentional self-harm, was significantly higher (1.2 times) than the State rate for this age group. Two thirds of these deaths occurred in the 25-54 year old age group. The second leading cause was ischaemic heart disease and most of these deaths (88%) occurred in the 50-64 year old age group.Error! Bookmark not defined.
Alcohol and tobacco related mortality, 15-64 years
For the period 2011-2015, South West residents aged 15-64 years had a similar mortality rate due to alcohol consumption (23 per 100,000 persons) and tobacco consumption (21 per 100,000 persons) compared with the State rates. South West Aboriginal residents had a 3.6 times higher mortality rate for tobacco-related causes in this age group compared with their non-Aboriginal counterparts.Error! Bookmark not defined.
Avoidable Mortality, 15-64 years
Avoidable mortality is defined as deaths before the age of 75 years from conditions which are potentially avoidable given the present health system, available knowledge about social and economic policy impacts and health behaviours. Categories are identified using underlying cause of death ICD–10 codes in the WA cause of death database as defined by the Australian Institute of Health and Welfare, National Healthcare Agreement: PI 16-Potentially avoidable deaths, 2015.xxxiii The rate of avoidable deaths for 15-64 year olds in the South West region was significantly higher (1.1 times) than the State. The top five leading causes of avoidable deaths were suicide and self-inflicted injuries (1.2 times), ischaemic heart disease (similar to the State rate), transport accidents (1.8 times), accidental poisoning and breast cancer (similar to the State rates). These five conditions contributed to three in eight (37%) of all deaths in this age group.Error! Bookmark not defined.
Implications for health service planning: Suicide and self-inflicted injuries, ischaemic heart disease and transport accidents were leading causes of avoidable mortality in South West adults.
Better access to services that better support the management of mental illnesses, combined with active community engagement, can lower the suicide and self-harm rates.
Heart disease can be avoided through the use of primary and therapeutic interventions. The higher rate of transport accidents also highlights need for broad public intervention programs in partnership with other agencies.

South West Health Profile 2018
60 ONCE PRINTED THIS DOCUMENT MAY BECOME OUT OF DATE Trim Record No: ED-CO-17-17832 REFER TO THE ONLINE SOURCE FOR THE CURRENT VERSION
Health Status of Older People
Vaccinations, 65 years and over
Annual flu vaccinations and five yearly pneumonia vaccinations are recommended for people aged 65 years and over and are an important primary health intervention.
Influenza vaccinations
In 2015 for South West, 58 per cent of adults aged 65 years and over received the flu vaccination since 1st of March of the previous year. The influenza vaccination rate for the State was also 58 per cent.
Pneumonia vaccinations
In 2015 for South West, 39 per cent of adults received the pneumonia vaccination within the past 5 years. The pneumonia vaccination rate for the State was 40 per cent.xxxiv
Hospitalisations, 65 years and over
South West residents aged 65 years and over had 122,989 hospitalisations between 2011 -2015. The rate was significantly lower than the State rate for this age group. The leading cause of hospitalisation was renal dialysis (12 per cent in this age group) followed by eye diseases and chemotherapy. Leading causes of hospitalisations for South West residents that had higher rates than the State were arthropathies and ischaemic heart diseases.Error! Bookmark not defined. Table 21: South West leading causes of hospitalisation 65 years and over 2011-2015
Note: The standardised rate ratio (SRR) is the ratio between a particular health region (or district) and the state. A ratio of 1 means the regional rate is the same as the state, a value of 2 indicates the regional rate is twice that of the state, and an SRR of 0.5 indicates the rate in a region is half that of the State population.
Note: Local rates are compared to the rate of all residents of the State using the SRR and the 95% confidence interval of the SRR. Those that are significantly different to the state rate (1.0) have black font, and those that are not significantly different to the state have white font. Those between 1 and 1.5 times the state rate are highlighted orange, higher than 1.5 times the state are highlighted red while those rates less than the state are highlighted green.
Source: DoH, Health TracksError! Bookmark not defined.
Potentially Preventable Hospitalisations, 65 years and over
For the period 2011-2015, PPH accounted for 8,930 hospitalisations of South West people aged 65 years and over (7% of all hospitalisations in older people). The rate of all PPH for South West residents aged 65 years and over was similar to the State rate for this age group.Error!
Bookmark not defined.
Condition N% all hosp.
(65 years and over)SRR
Dialysis 14,185 12% 0.6
Diseases of the eye & adnexa 10,608 9% 0.9
Chemotherapy 9,525 8% 0.8
Arthropathies 4,871 4% 1.2
Persons encountering health services for examination & investigation 3,930 3% 1.1
All hospitalisations (65 yrs and over) 122,989 100% 0.9

South West Health Profile 2018
60 ONCE PRINTED THIS DOCUMENT MAY BECOME OUT OF DATE Trim Record No: ED-CO-17-17832 REFER TO THE ONLINE SOURCE FOR THE CURRENT VERSION
Figure 20 shows the trend between 2011 and 2015 for PPH for South West residents aged 65 years and over. While the PPH events are steadily increasing throughout the years, the PPH rate increased in 2012 and then remained steady through the next four years.
Figure 20: South West PPH 65 years and over 2011-2015
Notes: The error bars represent the 95% confidence interval of the proportion; Source: DoH, Health TracksError! Bookmark not defined.
Figure 21 compares age-adjusted rates of PPH from 2011 to 2015 for the South West and State. Figure 21: South West vs. State PPH 65 years and over 2011-2015
Source: DoH, Health TracksError! Bookmark not defined.
For the period 2011-2015 the leading PPH condition for South West people aged 65 years and over was congestive cardiac failure (CCF) as shown in Table 22. In South West residents aged 65 years and over CCF accounted for 19 per cent of all PPH. The next leading PPH condition was COPD at 18 per cent of all PPH. These rates were significantly higher than the State rates
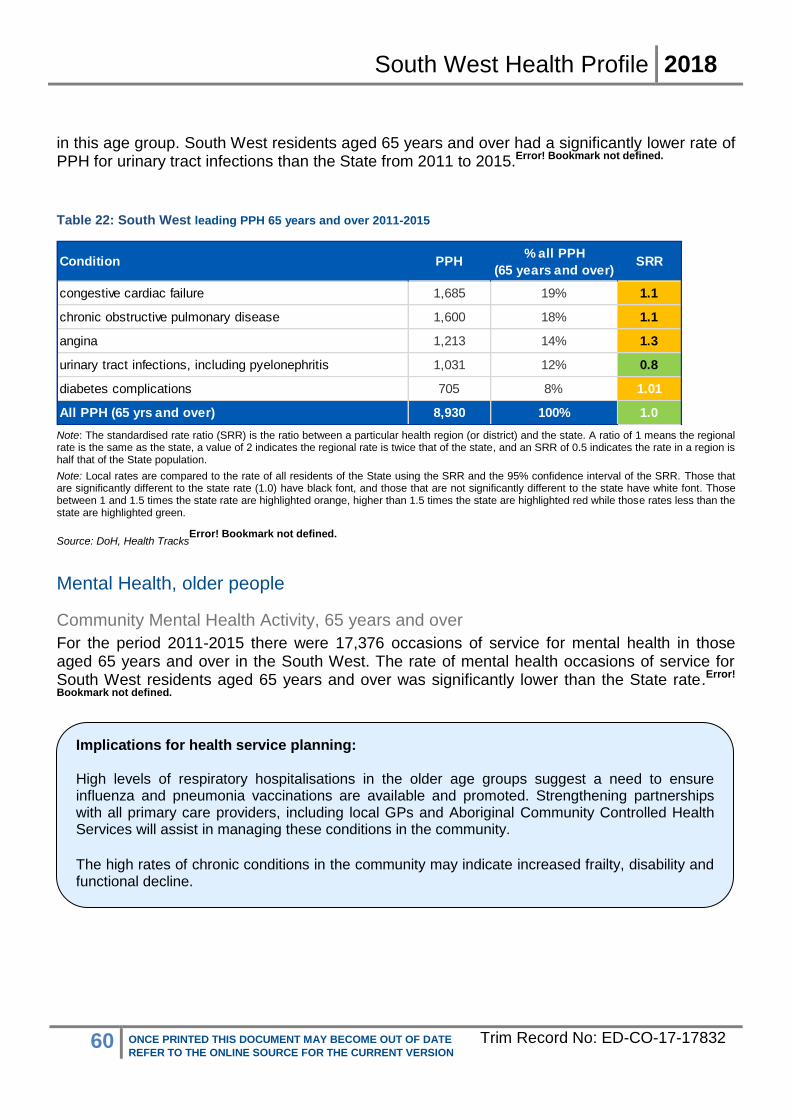
South West Health Profile 2018
60 ONCE PRINTED THIS DOCUMENT MAY BECOME OUT OF DATE Trim Record No: ED-CO-17-17832 REFER TO THE ONLINE SOURCE FOR THE CURRENT VERSION
in this age group. South West residents aged 65 years and over had a significantly lower rate of PPH for urinary tract infections than the State from 2011 to 2015.Error! Bookmark not defined.
Table 22: South West leading PPH 65 years and over 2011-2015
Note: The standardised rate ratio (SRR) is the ratio between a particular health region (or district) and the state. A ratio of 1 means the regional rate is the same as the state, a value of 2 indicates the regional rate is twice that of the state, and an SRR of 0.5 indicates the rate in a region is half that of the State population.
Note: Local rates are compared to the rate of all residents of the State using the SRR and the 95% confidence interval of the SRR. Those that are significantly different to the state rate (1.0) have black font, and those that are not significantly different to the state have white font. Those between 1 and 1.5 times the state rate are highlighted orange, higher than 1.5 times the state are highlighted red while those rates less than the state are highlighted green.
Source: DoH, Health TracksError! Bookmark not defined.
Mental Health, older people
Community Mental Health Activity, 65 years and over
For the period 2011-2015 there were 17,376 occasions of service for mental health in those aged 65 years and over in the South West. The rate of mental health occasions of service for South West residents aged 65 years and over was significantly lower than the State rate.Error!
Bookmark not defined.
Condition PPH% all PPH
(65 years and over)SRR
congestive cardiac failure 1,685 19% 1.1
chronic obstructive pulmonary disease 1,600 18% 1.1
angina 1,213 14% 1.3
urinary tract infections, including pyelonephritis 1,031 12% 0.8
diabetes complications 705 8% 1.01
All PPH (65 yrs and over) 8,930 100% 1.0
Implications for health service planning: High levels of respiratory hospitalisations in the older age groups suggest a need to ensure influenza and pneumonia vaccinations are available and promoted. Strengthening partnerships with all primary care providers, including local GPs and Aboriginal Community Controlled Health Services will assist in managing these conditions in the community. The high rates of chronic conditions in the community may indicate increased frailty, disability and functional decline.

South West Health Profile 2018
60 ONCE PRINTED THIS DOCUMENT MAY BECOME OUT OF DATE Trim Record No: ED-CO-17-17832 REFER TO THE ONLINE SOURCE FOR THE CURRENT VERSION
Disability and Carers In the South West region, 3.9 per cent of residents had a core need for assistance in activities of daily living while 7.8 per cent provided unpaid care to a person with a disability, as shown in Table 23.
Overall, the South West has a significantly higher proportion of people needing assistance (3.9%) compared to WACHS (3.5%) however, South West residents aged 65-74 years had a significantly lower proportion (6.6%) compared to WACHS (7.5%).
In the South West, 7.8 per cent of residents provided unpaid care. This was significantly higher than WACHS (7.2%). The main age group providing the care was the 45-64 year age group followed by 65-74 year olds.xxxv
Table 23: South West residents with a core need for assistance, or who provide unpaid care to a person with a disability
Have Core Need for
Assistance
% WACHS % Provide Unpaid Care
% WACHS %
0-14 years 541 1.6% 1.6% - - -
15-44 years 884 1.5% 1.3% 4,065 7.0% 7.0%
45-64 years 1,460 3.5% 3.4% 5,938 14% 12%
65-74 years 801 6.6% 7.5% 1,308 11% 11%
Over 75 years 2,289 25% 25% 678 7.5% 7.3%
All ages 5,975 3.9% 3.5% 11,989 7.8% 7.2%
Source: ABS table builder, Census 2011xxxv
Where South West Residents Accessed Emergency Care
Emergency Department Attendances
South West Hospitals
In 2016/17, there were 92,887 Emergency Department (ED) attendances in South West hospitals. Of these attendances, 11 per cent were for patients who were not residents of the region. The average annual growth rate over the last five years showed an increasing trend of two per cent. xxxvi
In regional areas where workforce shortages and challenges can mean there are insufficient GPs, many residents use the hospital services for primary care. The ED attendances at hospitals within South West are shown by triage category in

South West Health Profile 2018
1 ONCE PRINTED THIS DOCUMENT MAY BECOME OUT OF DATE Trim Record No: ED-CO-17-17832 REFER TO THE ONLINE SOURCE FOR THE CURRENT VERSION
Figure 22.
In 2016/17, the majority of attendances (58%) were classified as semi or non-urgent (triage 4 or 5), suggesting issues that could be dealt with by GPs and primary health care services. This was significantly lower than WACHS (66%).xxxvi

South West Health Profile 2018
2 ONCE PRINTED THIS DOCUMENT MAY BECOME OUT OF DATE Trim Record No: ED-CO-17-17832 REFER TO THE ONLINE SOURCE FOR THE CURRENT VERSION
Figure 22: South West hospitals, emergency attendances by triage category
Source: WACHS online ED pivot accessed 25/11/2015
xxxvi
The leading causes for ED attendances to hospitals in South West for the period 2016/17 are shown in Table 24.
Table 24: South West hospitals emergency attendances by triage category 2012/13 - 2016/17
Source: WACHS online ED pivot
xxxvi
Aboriginal people were over-represented in the ED attendances, accounting for four per cent of all ED attendances in 2016/17, but only 2.6 per cent of the population in 2015.xxxvi
The South West Aboriginal Medical Service (SWAMS), is a Nyoongar Community Controlled Health Organisation, offers the delivery of best-practice and culturally appropriate holistic health services to the Aboriginal population of the South West region of Western Australia.
South West Residents
For the period 2011-2015, the proportion of ED attendances for triage 4 and 5 for South West residents was 61 per cent and for the State was 58 per cent. The proportion for triage 4 and triage 5 were significantly higher (1.3 and 1.6 times respectively) than the State proportions.Error!
Bookmark not defined.
Major Diagnosis Category (MDC)Number of ED
Attendances% of Total
Musculoskeletal system and connective tissue 13,813 15%
Injuries, poisonings and toxic effects of drugs 10,932 12%
Digestive system 10,096 11%
Skin, subcutaneous tissue and breast 8,047 9%
Ear, nose, mouth and throat 7,632 8%
Total ED Attendances 92,887 100%

South West Health Profile 2018
3 ONCE PRINTED THIS DOCUMENT MAY BECOME OUT OF DATE Trim Record No: ED-CO-17-17832 REFER TO THE ONLINE SOURCE FOR THE CURRENT VERSION
Hospitalisations
For the period 2011-2015, the overall hospitalisation rate of South West residents was significantly lower than that of the State.Error! Bookmark not defined.
Table 25: South West hospitalisations residents 2011-2015
Note: The standardised rate ratio (SRR) is the ratio between a particular health region (or district) and the state. A ratio of 1 means the regional rate is the same as the state, a value of 2 indicates the regional rate is twice that of the state, and an SRR of 0.5 indicates the rate in a region is half that of the State population. Note: Local rates are compared to the rate of all residents of the State using the SRR and the 95% confidence interval of the SRR. Those that are significantly different to the state rate (1.0) have black font, and those that are not significantly different to the state have white font. Those between 1 and 1.5 times the state rate are highlighted orange, higher than 1.5 times the state are highlighted red while those rates less than the state are highlighted green.
Source: DoH, Health TracksError! Bookmark not defined.
For 2006-2015, in the South West the Aboriginal hospitalisation rate was significantly lower than the State Aboriginal rate. However, this rate was significantly higher (1.7 times) than the non-Aboriginal South West rate. The rate for South West non-Aboriginal residents was similar to the State non-Aboriginal rate.Error! Bookmark not defined.
Table 26: South West hospitalisations Aboriginals and non-Aboriginal residents 2006-2015
Source: DoH, Health Tracks
Error! Bookmark not defined.
For the period 2011-2015, the leading cause of hospitalisation by major category for South West residents was ‘digestive diseases’ as it was for the State, accounting for 11 per cent of
South West Number SRRASR per 100,000
persons
Males 159,829 0.94 36,481
Females 178,909 1.0 40,182
Persons 338,738 0.96 38,164
South West Number SRRASR per 100,000
persons
Aboriginal (2006-2015) 18,477 0.6 65,044
Non-Aboriginal (2011-2015) 327,473 1.0 37,506
Implications for health service planning:
South West residents present at high rates to emergency departments compared to the metropolitan area, particularly in the semi and non-urgent attendances. This is usually an indication of a need for increased primary health services such as increased GP and population health services. The region also sees a high proportion of attendances from non-residents. This indicates a need for the continuation of investments in primary health services as per the Southern Inland Health Initiative funded by Royalties for Regions to increase the GP Sector. Co-located and collaborative service models between GP primary care, other non-government health providers and WACHS is also strongly recommended.
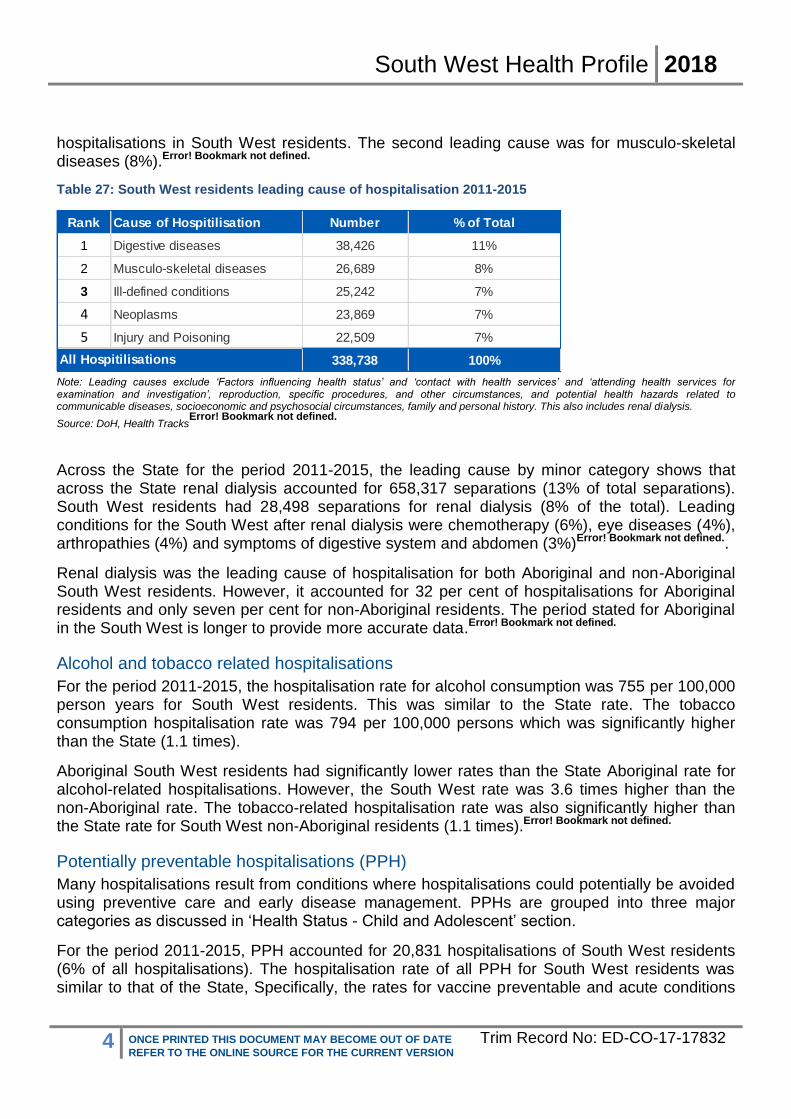
South West Health Profile 2018
4 ONCE PRINTED THIS DOCUMENT MAY BECOME OUT OF DATE Trim Record No: ED-CO-17-17832 REFER TO THE ONLINE SOURCE FOR THE CURRENT VERSION
hospitalisations in South West residents. The second leading cause was for musculo-skeletal diseases (8%).Error! Bookmark not defined.
Table 27: South West residents leading cause of hospitalisation 2011-2015
Note: Leading causes exclude ‘Factors influencing health status’ and ‘contact with health services’ and ‘attending health services for examination and investigation’, reproduction, specific procedures, and other circumstances, and potential health hazards related to communicable diseases, socioeconomic and psychosocial circumstances, family and personal history. This also includes renal dialysis.
Source: DoH, Health TracksError! Bookmark not defined.
Across the State for the period 2011-2015, the leading cause by minor category shows that across the State renal dialysis accounted for 658,317 separations (13% of total separations). South West residents had 28,498 separations for renal dialysis (8% of the total). Leading conditions for the South West after renal dialysis were chemotherapy (6%), eye diseases (4%), arthropathies (4%) and symptoms of digestive system and abdomen (3%)Error! Bookmark not defined..
Renal dialysis was the leading cause of hospitalisation for both Aboriginal and non-Aboriginal South West residents. However, it accounted for 32 per cent of hospitalisations for Aboriginal residents and only seven per cent for non-Aboriginal residents. The period stated for Aboriginal in the South West is longer to provide more accurate data.Error! Bookmark not defined.
Alcohol and tobacco related hospitalisations
For the period 2011-2015, the hospitalisation rate for alcohol consumption was 755 per 100,000 person years for South West residents. This was similar to the State rate. The tobacco consumption hospitalisation rate was 794 per 100,000 persons which was significantly higher than the State (1.1 times).
Aboriginal South West residents had significantly lower rates than the State Aboriginal rate for alcohol-related hospitalisations. However, the South West rate was 3.6 times higher than the non-Aboriginal rate. The tobacco-related hospitalisation rate was also significantly higher than the State rate for South West non-Aboriginal residents (1.1 times).Error! Bookmark not defined.
Potentially preventable hospitalisations (PPH)
Many hospitalisations result from conditions where hospitalisations could potentially be avoided using preventive care and early disease management. PPHs are grouped into three major categories as discussed in ‘Health Status - Child and Adolescent’ section.
For the period 2011-2015, PPH accounted for 20,831 hospitalisations of South West residents (6% of all hospitalisations). The hospitalisation rate of all PPH for South West residents was similar to that of the State, Specifically, the rates for vaccine preventable and acute conditions
Rank Cause of Hospitilisation Number % of Total
1 Digestive diseases 38,426 11%
2 Musculo-skeletal diseases 26,689 8%
3 Ill-defined conditions 25,242 7%
4 Neoplasms 23,869 7%
5 Injury and Poisoning 22,509 7%
338,738 100%All Hospitilisations

South West Health Profile 2018
5 ONCE PRINTED THIS DOCUMENT MAY BECOME OUT OF DATE Trim Record No: ED-CO-17-17832 REFER TO THE ONLINE SOURCE FOR THE CURRENT VERSION
were significantly lower while the chronic condition rate was significantly higher (1.04 times) than the State rate.Error! Bookmark not defined.
The leading PPH condition for South West residents was dental conditions, which accounted for 14 per cent of PPH.
Figure 23: South West leading PPH by gender PPH 2011-2015
Source: DoH, Health Tracks
Error! Bookmark not defined.
The iron deficiency anaemia PPH rate was significantly higher in females compared with males in South West residents (2 times). However, the iron deficiency PPH rate for females in the South West was similar to the State female rate. However, the PPH rates for diabetes complications, COPD, angina and epilepsy were significantly higher (1.1-1.2 times), than the State rates.Error! Bookmark not defined.
For non-Aboriginal people in the South West, four out of top ten PPH category rates were higher than the State rates with angina rate 1.3 times higher than the State. For Aboriginal people, only the PPH rate for convulsions and epilepsy (1.3 times) and angina (1.7 times) were higher than the State rate. Aboriginal rates for other leading causes were similar to or lower than the State rates.
Although South West Aboriginal people have a similar or lower rate to State Aboriginal people for majority of PPH, the rate is significantly higher (three times) than South West non-Aboriginal people.

South West Health Profile 2018
6 ONCE PRINTED THIS DOCUMENT MAY BECOME OUT OF DATE Trim Record No: ED-CO-17-17832 REFER TO THE ONLINE SOURCE FOR THE CURRENT VERSION
Table 28: South West leading causes of PPH 2011-2015
Source: DoH, Health Tracks
Error! Bookmark not defined.
Table 29: South West leading causes of PPH for Aboriginal residents 2011-2015
Source: DoH, Health TracksError! Bookmark not defined.
Condition Number % all PPH SRR
dental conditions 2,848 14% 0.9
chronic obstructive pulmonary disease 2,050 10% 1.1
urinary tract infections, including pyelonephritis 2,033 10% 0.9
angina 1,924 10% 1.3
congestive cardiac failure 1,858 9% 1.1
cellulitis 1,642 8% 1.1
diabetes complications 1,389 7% 1.0
iron deficiency anaemia 1,327 7% 0.9
ENT infections 1,105 6% 0.8
All Potentially Preventable Hospitilisations (PPH) 19,785 100% 1.0
Condition Number % all PPH SRR
convulsions and epilepsy 197 19% 1.3
dental conditions 126 12% 1.0
angina 109 10% 1.7
diabetes complications 102 10% 0.9
cellulitis 86 8% 0.4
urinary tract infections, including pyelonephritis 79 8% 0.6
ENT infections 72 7% 0.5
chronic obstructive pulmonary disease 66 6% 0.7
asthma 55 5% 0.7
All Potentially Preventable Hospitilisations (PPH) 1,046 100% 1.0

South West Health Profile 2018
7 ONCE PRINTED THIS DOCUMENT MAY BECOME OUT OF DATE Trim Record No: ED-CO-17-17832 REFER TO THE ONLINE SOURCE FOR THE CURRENT VERSION
Where South West residents used hospital services
South West residents were hospitalised across the State. The proportion of resident hospitalisations in public hospitals that occur within the region is known as self-sufficiency. The South West public self-sufficiency was 84 per cent. The WACHS average was 77 per cent.xxxvii
Table 30: South West place of hospitalisation 2016/17
Note: Excludes unqualified neonates and boarders; Source: HMDS via Clinical Modelling Unit DoH Inpatient Pivot
xxxvii
Hospitalisations within the region
Historic activity at hospitals within the South West region is shown in Figure 24. Between 2011/12 and 2015/16, hospital separations increased at an average of two per cent per year. Total bed days also increased over the period, by an annual average of two per cent.
The proportion of activity for non-residents of the region was around five per cent between 2011/12 to 2014/15.
Place of Hospitalisation Number % of Total Beddays
Augusta 227 <1% 1,312
Boyup Brook 89 <1% 455
Bridgetown 704 2% 2,367
Bunbury 19,469 49% 52,205
Busselton 5,241 13% 13,626
Collie 1,715 4% 5,798
Donnybrook 154 <1% 1,162
Harvey 258 <1% 1,479
Margaret River 1,311 3% 3,172
Nannup 32 <1% 169
Pemberton 175 <1% 626
SJOG Bunbury 9,755 24% 11,936
Warren (Manjimup) 896 2% 4,118
South West Hospitals Total 40,026 84% 96,946
Other WACHS 469 1% 1,094
Fiona Stanley Hospital 2,344 5% 11,819
Other Metropolitan 4,630 10% 17,623
South West Residents Total 47,469 100% 127,482

South West Health Profile 2018
8 ONCE PRINTED THIS DOCUMENT MAY BECOME OUT OF DATE Trim Record No: ED-CO-17-17832 REFER TO THE ONLINE SOURCE FOR THE CURRENT VERSION
Figure 24: South West hospitalisations 2012/13 - 2016/17
Note: Excludes unqualified neonates,boarders & Aged Care / NHT
Source: HCARe, webPAS & TOPAS via Data Extractsxxxviii
Implications for health service planning:
Aboriginal South West residents have a greater need for ED and inpatient services than non-Aboriginal residents. Culturally appropriate services and programs are necessary in partnership with the ACCHOs and other providers. An increase in the GP sector, combined with co-located and collaborative service models between GP primary care, other non-government health providers (e.g. Silver Chain and Aboriginal organisations) and WACHS ED and population health/primary health services contribute to improved care.

South West Health Profile 2018
9 ONCE PRINTED THIS DOCUMENT MAY BECOME OUT OF DATE Trim Record No: ED-CO-17-17832 REFER TO THE ONLINE SOURCE FOR THE CURRENT VERSION
Mortality
State level ABS data from 2013 to 2015 in Figure 24 shows life expectancy at birth has increased for the total population to 80.4 years for males but decreased to 84.5 years for females compared with the 2011 to 2013 figures of 80.3 years and 84.8 years respectively.xxxix&xl
Aboriginal people in Western Australia have a significantly lower life expectancy compared with their non-Aboriginal counterparts. The gap in 2010-2012 was estimated by ABS to be 15.1 years for males and 13.5 years for females.xli
Figure 25: Western Australian life expectancy at birth by Aboriginality and gender 2010-2012
Source: ABS Life Tablesxli
Mortality rates have fallen state-wide and in Australia overall from 2005 to 2015. The Australian Aboriginal mortality rate however, remained steady during this 10-year period.xlii
Table 31: Australian standardised mortality rates 2005, 2014, 2015
Note: Deaths per 1,000 standard population. Standardised death rates use the age distribution of total persons in the Australian population at 30 June 2001 as the standard population.
Source: ABS Deathsxlii
When considering mortality within a region, a longer time period is required to ensure anonymity and accuracy. For the period 2011-2015, there were 5,059 deaths for South West residents. The region’s mortality rate was similar to the State. The five leading causes of mortality for the period 2011-2015 are shown in the Table 32. The leading cause of mortality for South West
65.0 70.2
80.1 83.7
0
10
20
30
40
50
60
70
80
90
Males Females
Age Aboriginal Non-Aboriginal
Population 2005 2014 2015
Western Australia 5.9 5.3 5.3
Australia 6.1 5.5 5.5
Aboriginal (Australia) 10.0 9.8 9.8

South West Health Profile 2018
10 ONCE PRINTED THIS DOCUMENT MAY BECOME OUT OF DATE Trim Record No: ED-CO-17-17832 REFER TO THE ONLINE SOURCE FOR THE CURRENT VERSION
residents was ischaemic heart disease. The second leading cause was cerebrovascular disease which was significantly higher (1.2 times) than the State rate. Rates for all other conditions were similar to the State rateError! Bookmark not defined..
For 2006-2015, there were 126 deaths for Aboriginal South West residents. The Aboriginal South West mortality rate was significantly lower than the State.Error! Bookmark not defined.
Table 32: South West leading cause of mortality 2011-2015
Note: The standardised rate ratio (SRR) is the ratio between a particular health region (or district) and the state. A ratio of 1 means the regional rate is the same as the state, a value of 2 indicates the regional rate is twice that of the state, and an SRR of 0.5 indicates the rate in a region is half that of the State population. Note: Local rates are compared to the rate of all residents of the State using the SRR and the 95% confidence interval of the SRR. Those that are significantly different to the state rate (1.0) have black font, and those that are not significantly different to the state have white font. Those between 1 and 1.5 times the state rate are highlighted orange, higher than 1.5 times the state are highlighted red while those rates less than the state are highlighted green.
.Source: DoH, Health TracksError! Bookmark not defined.
Alcohol and tobacco related mortality
For 2006-2015, alcohol-caused mortality rate in the South West region was 25 per 100,000 person-years and tobacco-caused mortality rate was 74 per 100,000 person-years. These rates were similar to the State rates.Error! Bookmark not defined.
Avoidable Mortality, 0 - 74 years
Avoidable mortality is defined as deaths before the age of 75 years from conditions which are potentially avoidable given the present health system, available knowledge about social and economic policy impacts and health behaviours, as described in ‘Avoidable Mortality, 15-64 years’ section.
For the period 2011-2015, just over half (52%) of the South West resident deaths under the age of 75 were classified as avoidable. The use of screening and primary prevention could potentially have reduced over half of avoidable deaths in South West residents and better treatment measures could potentially have reduced just under half of avoidable deaths.
Table 33 shows the leading causes of avoidable mortality for South West residents for the period 2011-2015. Ischaemic heart disease accounted for 19 per cent, followed by suicide and self-inflicted injuries (13%). The rate of avoidable mortality for transport accidents was significantly higher (1.6 times) than the State rate.Error! Bookmark not defined.
Condition Deaths % all deaths SRR
Ischaemic heart diseases 616 12% 1.0
Cerebrovascular diseases 368 7% 1.3
Dementia (incl Alzheimers disease) 326 6% 0.9
Lung cancer 305 6% 1.0
COPD 217 4% 1.1
All deaths 5,059 100% 1.0

South West Health Profile 2018
11 ONCE PRINTED THIS DOCUMENT MAY BECOME OUT OF DATE Trim Record No: ED-CO-17-17832 REFER TO THE ONLINE SOURCE FOR THE CURRENT VERSION
Table 33: South West leading cause of avoidable mortality 0-74 years 2011-2015
Notes:
Note: The standardised rate ratio (SRR) is the ratio between a particular health region (or district) and the state. A ratio of 1 means the regional rate is the same as the state, a value of 2 indicates the regional rate is twice that of the state, and an SRR of 0.5 indicates the rate in a region is half that of the State population.
Note: Local rates are compared to the rate of all residents of the State using the SRR and the 95% confidence interval of the SRR. Those that are significantly different to the state rate (1.0) have black font, and those that are not significantly different to the state have white font. Those between 1 and 1.5 times the state rate are highlighted orange, higher than 1.5 times the state are highlighted red while those rates less than the state are highlighted green.
Source: DoH, Health TracksError! Bookmark not defined.
Persons, 2011 - 2015 Number% of all deaths
(<75 years)SRR
Ischaemic heart disease 184 19% 1.0
Suicide and self-inflicted injuries 124 13% 1.2
Transport accidents 81 8% 1.6
Cerebrovascular diseases 68 7% 1.3
Colorectal cancer 61 6% 1.0
COPD 59 6% 1.04
Breast cancer 57 6% 0.9
Skin cancer 53 5% 1.3
Accidental poisoning by and exposure to noxious substances43 4% 1.1
Diabetes 43 4% 0.9
All avoidable deaths (<75 years) 977 52% 1.1
All deaths (<75 years) 1,887 100% 1.02
Implications for health service planning: Just over half of the deaths of South West residents under the age of 75 were classified as avoidable. Of these deaths, ischaemic heart diseases followed by suicide or self-inflicted were the leading causes of avoidable mortality. These conditions are avoidable through the use of primary and secondary interventions, this highlights the need for public health and mental health programs and screening.

South West Health Profile 2018
12 ONCE PRINTED THIS DOCUMENT MAY BECOME OUT OF DATE Trim Record No: ED-CO-17-17832 REFER TO THE ONLINE SOURCE FOR THE CURRENT VERSION
Abbreviations
Abbreviation Definition
AAR Age Adjusted Rate
ABS Australian Bureau of Statistics
ACCHS Aboriginal Community Controlled Health Services
AEDC Australian Early Development Census
ARIA Accessibility/Remoteness Index of Australia
ASR Age-standardised rate
ATSIC Aboriginal and Torres Strait Islander Commission
BEACH Bettering the Evaluation and Care of Health
BMI Body Mass Index
CCF Congestive Cardiac Failure
CI 95% Confidence Interval of a rate or proportion
COPD Chronic Obstructive Pulmonary Disease
DoH Department of Health WA
ED Emergency Departments
ENT Ear, nose and throat infections
ERP Estimated Residential Population
GDM Gestational Diabetes Mellitus
HMDS Hospital Morbidity Data System
HWSS Health and Wellbeing Surveillance System
ICD–10 codes International Statistical Classification of Diseases and Related Health Problems 10th Revision
LGA Local Government Area
PID Pelvic Inflammatory Disease
PPH Potentially Preventable Hospitalisations
SEIFA Socio-Economic Indexes for Areas
STA1 Statistical Area Level 1
STI Sexually Transmitted Infection

South West Health Profile 2018
13 ONCE PRINTED THIS DOCUMENT MAY BECOME OUT OF DATE Trim Record No: ED-CO-17-17832 REFER TO THE ONLINE SOURCE FOR THE CURRENT VERSION
SRR Standardised rate ratio
WA Tomorrow, 2012
Department of Planning Population Projections from 2006 Census
WACHS Western Australia Country Health Service
WAT Western Australia Tomorrow 2015
Glossary
Term Definition
Accessibility/Remoteness Index of Australia (ARIA)
A systematic approach to classification of areas of Australia according to levels of remoteness. Within this classification system there are five categories ranging from Major Cities to Very Remote.
Age Adjusted Rate (AAR)
Age-adjusted mortality rate per 100,000 person years. Direct standardisation using a range of age groups of 2001 Australian Standard Population in order to compare rates between population groups and different years for the same population group.
Chronic conditions Long-term conditions that last for six months or more
Health and Wellbeing Surveillance System (HWSS)
The WA Health and Wellbeing Surveillance (HWSS) was established by the Department of Health in 2002 to monitor the health status of the general WA population. Each month, approximately 550 randomly selected households take part in a telephone survey.
ICD–10 codes ICD-10 is the 10th revision of the International Statistical Classification of Diseases and Related Health Problems (ICD), a medical classification list by the World Health Organization (WHO). It contains codes for diseases, signs and symptoms, abnormal findings, complaints, social circumstances, and external causes of injury or diseases.
Statistical Areas
Are designed to maximise the spatial detail available for Census data. WA Health primarily uses SA2s in its epidemiology and mapping of health utilisation and areas. SA1s have a population of between 200 to 800 persons with an average population of approximately 400 persons. SA1s aim to separate out areas with different geographic characteristics within Suburb and Locality boundaries. In rural areas they often combine related Locality boundaries.

South West Health Profile 2018
14 ONCE PRINTED THIS DOCUMENT MAY BECOME OUT OF DATE Trim Record No: ED-CO-17-17832 REFER TO THE ONLINE SOURCE FOR THE CURRENT VERSION
SA2s generally have a population range of 3,000 to 25,000 persons, and have an average population of about 10,000 persons. SA2s are aggregations of whole SA1s. They are designed to reflect functional areas that represent a community that interacts together socially and economically.
Socio-Economic Indexes for Areas (SEIFA)
Is a product developed by the ABS that ranks areas in Australia according to relative socio-economic advantage and disadvantage. The indexes are based on information from the five-yearly Census.
Standardised Rate Ratio (SRR)
The SRR is derived by the regional AAR divided by the State AAR or alternatively the regional ASR divided by the state ASR.
Ref: EM-CO-18-11746
Triage The urgency of the patient's need for medical and nursing care, as represented by a code. Triage 1 (resuscitation) Triage 2 (emergency) Triage 3 (urgent) Triage 4 (semi-urgent) Triage 5 (non-urgent)

South West Health Profile 2018
15 ONCE PRINTED THIS DOCUMENT MAY BECOME OUT OF DATE Trim Record No: ED-CO-17-17832 REFER TO THE ONLINE SOURCE FOR THE CURRENT VERSION
References
i Department of Health, Modelling Unit, via WA Department of Planning, Sept 2017. ii WACHS South West intranet home page, http://wacountry.health.wa.gov.au/index.php?id=509#c1062 (accessed July 21, 2015)
iii South West Development Commission, http://www.swdc.wa.gov.au/ accessed July 21, 2015
iv DoHA, 2001.Measuring Remoteness: Accessibility/Remoteness Index of Australia (ARIA)
v Australian Bureau of Statistics (ABS), 3235.0 Population by Age and Sex, Regions of Australia
vi Department of Health WA, Health Tracks - Epidemiology Branch (PHI) in collaboration with the Cooperative Research Centre for Spatial Information (CRC-SI)
vii Department of Health WA, Rates Calculator - Epidemiology Branch (PHI) based on ABS ERP 2012
viii Western Australia Tomorrow, Population Report No. 10, Medium-term Forecasts for Western Australia 2014-2026 and Sub-regions 2016-2026
ix Department of Planning, Lands and Heritage, Western Australia Tomorrow 2017 via the Clinical Modelling Unit, Department of Health WA (Accessed September 2017). x Radomiljac, Ali and Joyce, Sarah 2014. Health and Wellbeing of Adults in Western Australia 2013, Overview and Trends. Department of Health, Western Australia
xi ABS, 2008 Socio-Economic Indexes for Areas (SEIFA) - Technical Paper, 2006. Cat No. 2039.0.55.001
xii ABS, Census of Population and Housing: Socio-Economic Indexes for Areas (SEIFA), Australia, 2011 (cat. no. 2033.0.55.001).
xiii Midwives Notification System (via WACHS Safety, Quality and Performance)
xiv WACHS Online data – Obstetric Deliveries (HCARe, webPAS & TOPAS via Data Extracts)
xv Australian Institute of Health and Welfare 2012. A picture of Australia’s children 2012. Cat. no. PHE 167. Canberra: AIHW.
xvi Raewyn CM, Watkins R and Bower C, 2014. Fetal alcohol spectrum disorders: Notifications to the Western Australian Register of Developmental Anomalies. Journal of Paediatrics and Child Health. doi: 10.1111/jpc.12746. xvii Fitzpatrick J, Latimer J, Carmichael Olson H, Carter M, Oscar J, Lucas B, Doney R, Salter C, Try J, Hawkes G, Fitzpatrick E, Hand M, Watkins R, Tsang T, Bower C, Ferreira M, Boulton J, Elliott J 2017. Prevalence and profile of Neurodevelopment and Fetal Alcohol Spectrum Disorder (FASD) amongst Australian Aboriginal children living in remote communities. Research in Developmental Disabilities 65 (2017) 114-126 http://dx.doi.org/10.1016/j.ridd.2017.04.001
xviii Australian Indigenous HealthInfoNet: Australian Indigenous Alcohol and Other Drugs Knowledge Centre accessed 7 July 2017. http://www.aodknowledgecentre.net.au/aodkc/alcohol/fasd xix Telethon Kids Institute https://www.telethonkids.org.au/our-research/brain-and-behaviour/disability/alcohol-and-pregnancy-and-fasd-research/3m-fasd-prevention-project/ (Accessed 16/10/2017). xx Australian Early Development Census, 2015 http://www.aedc.gov.au/data accessed 31/8/2017
xxi 4813.0.55.001 - Occasional Paper: Vaccination Coverage in Australian Children - ABS Statistics and the Australian Childhood Immunisation Register (ACIR), 2001

South West Health Profile 2018
16 ONCE PRINTED THIS DOCUMENT MAY BECOME OUT OF DATE Trim Record No: ED-CO-17-17832 REFER TO THE ONLINE SOURCE FOR THE CURRENT VERSION
xxii Australian Childhood Immunisation Register - Coverage Report. Communicable Disease Control Branch, Department of Health, Western Australia.
xxiii Epidemiology Branch, 2014, WA Country Health Region Child Health Profiles, HWSS 2008-2013, WA Department of Health: Perth.
xxiv ABS, 2013. Australian Aboriginal and Torres Strait Islander Health Survey: First Results, Australia, 2012-13 cat. no. 4727.0.55.001 http://www.abs.gov.au/ausstats/[email protected]/Lookup/4727.0.55.001main+features12012-13
xxv WA Public Health Act 2016 https://www.slp.wa.gov.au/legislation/statutes.nsf/main_mrtitle_13791_homepage.html
xxvi Department of Health Notification of infectious diseases and related conditions. http://ww2.health.wa.gov.au/Articles/N_R/Notification-of-infectious-diseases-and-related-conditions xxvii ABS, 4714.0 – National Aboriginal and Torres Strait Islander Social Survey 2014-15. Table 23.3. Health risk factor indicators, by state/territory and remoteness area, persons ages 18 years and over – 2014-15, Proportion of persons. http://www.abs.gov.au/AUSSTATS/[email protected]/DetailsPage/4714.02014-15?OpenDocument (Accessed June 2017)
xxviii Epidemiology Branch, 2017, Health Region Profiles, 2015. HWSS, WA Department of Health: Perth.
xxix Department of Health, July 2014, Third National Sexually Transmissible Infections Strategy 2014-2017 at http://www.health.gov.au/internet/main/publishing.nsf/Content/ohp-bbvs-sti: accessed December 2014. Australian Government. Canberra xxx The Epidemiology of Notifiable Sexually Transmitted Infections and Blood-Borne Viruses in Western Australia 2012. Communicable Disease Control Directorate, Department of Health, Western Australia.
xxxi Australian Institute of Health and Welfare (AIHW) 2016. Australian Burden of Disease Study: impact and causes of illness and death in Australia 2011. Australian Burden of Disease Study series no. 3. BOD 4. Canberra: AIHW. xxxii Australian Bureau of Statistics (ABS), 4714.0 – National Aboriginal and Torres Strait Islander Social Survey, 2014-15. Accessed 21 December 2016. xxxiii
National Healthcare Agreement: PI 16-Potentially avoidable deaths, 2015, Australian Institute of Health and Welfare. http://meteor.aihw.gov.au/content/index.phtml/itemId/559036 Accessed 4 October 2017 xxxiv Epidemiology Branch, 2014, Pneumonia and Flu Vaccination Prevalence by Health Region, HWSS 2009-2013, WA Department of Health: Perth.
xxxv ABS, Census 2011 via Table Builder
xxxvi WACHS Business Intelligence Data Warehouse as at September 2017.
xxxvii Inpatient Modelling Data; Baseline 2014/15.
xxxviii HCARe, webPAS & TOPAS via Data Extracts (WACHS Online Pivot Tables: Inpatient Separation Details as at end July 2015)
xxxix ABS 3302.0.55.001 - Life Tables, States, Territories and Australia, 2011-2013 xl ABS 3302.5.55.001 - Life Tables, Western Australia, 2008-2010

South West Health Profile 2018
17 ONCE PRINTED THIS DOCUMENT MAY BECOME OUT OF DATE Trim Record No: ED-CO-17-17832 REFER TO THE ONLINE SOURCE FOR THE CURRENT VERSION
xli ABS, 2013. Life tables for Aboriginal and Torres Strait Islander Australians, 2010–2012. ABS cat. no. 3302.0.55.003. Canberra: ABS.
xlii ABS 3302.0 - Deaths, Australia, 2013