lecture notes in economics - ciando ebooks · ior of firms and households to their underlying...
TRANSCRIPT

Lecture Notes in Economicsand Mathematical Systems 550
Founding Editors:
M. BeckmannH. P. Kunzi
Managing Editors:
Prof. Dr. G. FandelFachbereich WirtschaftswissenschaftenFernuniversitat HagenFeithstr. 140/AVZII, 58084 Hagen, Germany
Prof. Dr. W. TrockelInstitut fiir Mathematische Wirtschaftsforschung (IMW)Universitat BielefeldUniversitatsstr. 25, 33615 Bielefeld, Germany
Editorial Board:
A. Basile, A. Drexl, H. Dawid, K. Inderfurth, W. Kursten, U. Schittko
Thomas LuxStefan ReitzEleni Samanidou (Eds.)
Nonlinear Dynamicsand HeterogeneousInteracting Agents
fyj. Springer

Editors
Prof. Dr. Thomas Lux Eleni SamanidouDepartment of Economics Department of EconomicsUniversity of Kiel University of KielOlshausenstraBe 40 OlshausenstraBe 4024118 Kiel, Germany 24118 Kiel, GermanyE-mail: [email protected] E-mail: [email protected]
Dr. Stefan ReitzDepartment of Economicsand Business AdministrationUniversity of GiessenLicher StraBe 6635394 GieBen, GermanyE-mail: [email protected]
Library of Congress Control Number: 2004114604
ISSN 0075-8442ISBN 3-540-22237-5 Springer Berlin Heidelberg New York
This work is subject to copyright. All rights are reserved, whether the whole or partof the material is concerned, specifically the rights of translation, reprinting, re-use ofillustrations, recitation, broadcasting, reproduction on microfilms or in any other way,and storage in data banks. Duplication of this publication or parts thereof is permittedonly under the provisions of the German Copyright Law of September 9,1965, in itscurrent version, and permission for use must always be obtained from Springer-Verlag.Violations are liable for prosecution under the German Copyright Law.
Springer is a part of Springer Science+Business Media
springeronline.com
© Springer-Verlag Berlin Heidelberg 2005
The use of general descriptive names, registered names, trademarks, etc. in thispublication does not imply, even in the absence of a specific statement, that suchnames are exempt from the relevant protective laws and regulations and thereforefree for general use.
Typesetting: Camera ready by authorCover design: Erich Kirchner, Heidelberg
Printed on acid-free paper 42/3130Di 5 4 3 2 10
Preface
This volume contains a selection of contributions presented at the WEHIA 03(Workshop on Economics with Heterogeneous Interacting Agents), which washeld at the Institute of World Economics in Kiel, Germany, on May 29-31,2003. WEHIA 03 has been the 8th edition of a workshop which had beenheld for the first time at the University of Ancona, Italy, in 1996. Ancona hadalso hosted the second and third workshop, before it moved to Genoa (1999),Marseille (2000), Maastricht (2001) and Trieste (2002), cf. [1] to [6] for pro-ceedings volumes emerging from these previous editions of the workshop.
Founded by a nucleus of Italian researchers around Mauro Gallegatti andDomenico Delli Gatti, the annual workshops have attracted a steadily in-creasing audience of economists and scientists from neighboring fields givingevidence for the growing interest in heterogeneity and interaction of agentsin the economics profession. The WEHIA circle also soon became a truly in-ternational and interdisciplinary one collecting scientists from all around theworld whose background ranges from economics and finance to computer sci-ence and physics.
The WEHIA series testifies the (re)emergence of interest in interactions be-tween economic agents in the early nineties. Among others, two seminal con-tributions are outstanding landmarks of this new current and gave birth to anavalanche of innovative research which is still gaining in scope and momentum.The first is Alan Kirman's provocative (if not heretic at that time) question"whom or what does the representative individual represent?" in his articleof the same title [7]. The second was Masanao Aoki's advertisement of mean-field approximations and related concepts as versatile tools for the study ofensembles of heterogeneous agents [8] which culminated in two monographswith a wealth of examples for stochastic models of microscopic economic en-tities and analysis of emergent macroscopic patterns of such systems [9, 10].
These and other adventures into unknown territory have brought to the atten-
VI Preface
tion of economists the many facets of real-life economic interaction neglectedby the representative agent paradigm. By its very construction, the emergencein the seventies of the representative agent modeling device had eliminatedany consideration of interaction and heterogeneity. This paradigm shift hadoriginated from the need felt by economists of developing micro-foundationsof assumed macroeconomic behavior, i.e. by tracing back the market behav-ior of firms and households to their underlying objectives of profit or utilitymaximization.
Over the seventies and eighties, this seemed only possible with an extremelylimited number of agents showing up in economic models, mostly one (repre-sentative) firm and one household. However, gradually doubts began to riseconcerning the validity of this methodological approach as, in particular, ag-gregation theory in economics has often demonstrated the non-conservationof key properties of demand and supply functions under aggregation.
Furthermore, natural scientists have been aware for a long time that themacroscopic properties of large systems result as emergent phenomena fromthe interaction of their individual units and are different from and cannot beinferred from the behavior of its constituent parts (be it molecules or economicagents). It rather counts as a well established tenet in complex system theorythat systems which consist of a large number of interacting units often obeyuniversal laws that are independent of their microscopic details (and would,thus, be a rubust outcome for a broad class of models). Interestingly, theseuniversal laws can often be framed as power or scaling laws, i.e. hyperbolicdistributions of macroscopic characteristics. Under this perspective, it doesnot come as a surprise that several extremely robust scaling laws also existin economics, e.g. for the conditional and unconditional distribution of assetreturns, firms and city sizes, and the distribution of income and wealth. Thedynamic system perspective suggests that these power laws might be due tosome basic mechanisms of economic interaction for which a micro-foundationin terms of interaction patterns might be more important than intertemporaloptimization under rational expectations of all economic actors. The repre-sentative agent methodology might, thus, have fallen victim to the fallacy ofa reductionist approach - which in biology had already in 1970 been so force-fully critisized by Nobel laureate Jacques Monod [11]. The recent merger ofagent-based economics with "econophysies" approaches inspired by statisticalmechanics modelling of interaction has greatly contributed to the awarenessof statistical features of economic data being macroscopic emergent phenom-ena of the underlying microscopic patterns [12, 13]. It is, however, only fairto mention that "econophysies" had a number of predecessors who providedimportant stimuli to agent-based work in economics and other social sciences,e.g. the "synergetics" group arround Hermann Haken and Wolfgang Weidlichwhose first attempt at applying statistical physics methods to social prob-lems dates back to the early seventies (see [14] for a summary of their work).
Preface VII
Furthermore, recent interest in sociology and political science in agent-basedanalyses and macroscopic imprints of complex system behavior indicates thatthe necessity of modeling heterogeneous interacting individuals is not confinedto economics, but is also felt in other social sciences [15].
The current volume exemplifies how many branches of economic theory andadjacent fields have already been touched by the ever increasing WEHIA com-munity. The first part of the book focuses on learning in computational andexperimental settings. Jasmina Arifovic, one of the keynote speakers of theworkshop, provides an overview of the Turing tournament initiated by her, inwhich computer programs are sought that can replicate human behavior inexperiments as well as programs that can distinguish between the behavior ofhuman and artificial subjects. Giulio Bottazzi and Giovanna Devetag reportlaboratory experiments on the emergence and confirmation of expectations ina pure exchange economy. Atakelty Hailu and Steven Schilizzi investigate themechanism of land-conservation auctions in an agent-based framework, whileJiirgen Huber, Michael Kirchler and Matthias Sutter conduct laboratory ex-periments on the value of information in financial markets.
Part II is devoted to games and strategic interaction. It starts with a pa-per by Neil Johnson et al. (based on Neil's keynote lecture) which presentsa new formalism for the analysis of the seminal minority game or El Farolproblem introduced by Brian Arthur [16]. Hiroshi Sato and Akira Namatamepropose new altruistic strategies for the minority game demonstrating thatthis leads to an overall gain in efficiency. Frank Schweitzer, Robert Mach andHeinz Muhlenbein investigate the temporal evolution of the strategy config-uration in a spatial iterated prisonner's dilemma, and Yasuo Nonaka studiesthe dynamic properties of a Cournot duopoly model with nonlinear reactionfunctions.
Part III turns to problems related to innovations and network formation. Itstarts with Ulrich WiWs keynote lecture discussing the relationship betweenheterogeneity and novelty. Nicolas Carayol and Pascale Roux study the dy-namics of an economic network in which agents benefit from communication.In a similar vein, Giorgio Fagiolo, Luigi Marengo and Marco Valente inves-tigate the possibility of population-wide learning via endogeneous networkformation in a random game framework. Another similar line of research isfollowed by Davide Fiaschi and Pier Maria Pacini who study network for-mation embedded into an endogeneous growth model. The last paper of thissection, by Stefano Battiston, Diego Garlaschelli and Guido Caldarelli pro-vides an empirical analysis of shareholder networks in the Italian and US stockmarket.
Part IV collects papers on applications of statistical physics concepts to eco-nomic settings. Masanao Aoki and Hiroshi Yoshikawa add heterogeneous la-

VIII Preface
bor to the multi-sector economy of Aoki [10]. They introduce the concept ofultrametric distance to capture the heterogeneity of workers with differentqualifications and explore the behavior of this economy via simulations. As itturns out, the behavior of this model is in accordance with Okun's law (an-other emergent macroscopic property of economic systems), while a standardneoclassical approach could not reproduce this regularity. Domenico Constan-tini, Ubaldo Garibaldi and Paolo Viarengo present a new characterization ofpopulation dynamics applicable in various fields which had already been usedin analyses of cluster size distributions. Finally, Taisei Kaizoji proposes a newstochastic model of stock market dynamics which is shown to give rise to ei-ther a power-law or an exponential distribution of large returns depending onthe number of non-fundamental traders in the market.
This provides a link to the papers collected in part V on asset price dynamics.The first contribution, by Carl Chiarella, Roberto Died and Laura Gardiniextends previous single-market models of chartist and fundamentalist inter-action to a system of two markets for different risky assets, while the secondentry, by Chiarella and Xue-Zhong He focuses attention on the simultaneousstrategy choice and wealth development in a similar model with two strat-egy types. Sheri Markose, Edward Tsang and Serafin Jaramillo investigatean agent-based artificial market in which speculators' strategies are evolvedby genetic programs. Extensions of previous artificial stock market models arepresented in the two remaining papers: Marco Roberto et al. report compu-tational experiments with a limit order book mechanism with asynchronoustrading which is shown to be able to generate realistic features of the result-ing returns dynamics. Enrico Scalas et al. use a similar artificial market toinvestigate the effects of insider trading.
The preparation of both WEHIA 03 and this proceedings volume involvedinputs from various sides. We wish to express our gratitude to the membersof the international program committee for their guidance and advice, andthe members of our local organizing committee who did a splendid job inmaking WEHIA 03 a memorable event. We are also indebted to the refereeswho helped immensely in evaluating the submissions for this volume. Lastbut not least, we are extremely grateful for the excellent work of our studentsChristian Lange and Ulrich Stolzenburg who managed to transform the indi-vidual files supplied by the authors into the final I^I^X version of this volume.
Thomas LuxStefan ReitzEleni Samanidou
Kiel, October 2004
Preface IX
References
1. Gallegatti, M. and Kirman, A. P., eds. (1999) Beyond the Representative Agent.London: Edward Elgar.
2. Delli Gatti, D. and Gallegatti, M. and Kirman, A. P., eds. (2000) Interaction andMarket Structure. Berlin: Springer.
3. Lux, T. and Marchesi, M. (2002) Special issue on "Heterogeneous InteractingAgents in Financial Markets". Journal of Economic Behaviour and Organizationvol. 49, no.2.
4. Kirman, A. P. and Zimmermann, J.-B., eds. (2001) Economics with Heteroge-neous Interacting Agents. Berlin: Springer.
5. Cowan, R. and Jonard, N., eds. (2002) Heterogeneous Agents, Interactions andEconomic Performance. Berlin: Springer.
6. Gallegatti, M. and Kirman, A. P. and Marsili, M., eds. (2004) The ComplexDynamics of Economic Interaction. Berlin: Springer.
7. Kirman, A. P. (1992) Whom or what does the representative individual represent?Journal of Economic Perspectives 6, 117-136.
8. Aoki, M. (1994) New macroeconomic modeling approaches: hierarchical dynamicsand mean field approximations. Journal of Economic Dynamics & Control 18, 865-877.
9. Aoki, M. (1996) New Approaches to Macroeconomic Modeling: EvolutionaryStochastic Dynamics, Multiple Equilibria, and Externalities as Field Effects. Cam-bridge: University Press.
10. Aoki, M. (2002) Modeling Aggregate Behavior and Fluctuations in Economics:Stochastic Views of Interacting Agents. Cambridge: University Press.
11. Monod, J. (1970) Le hasard et la necessite. Paris: Editions du Seuil.12. Mantegna, R. N. and Stanley, H. E. (2000) An Introduction to Econophysics:
Correlations and Complexity in Finance. Cambridge: University Press.13. Takayasu, H., ed. (2002) Empirical Science of Financial Fluctuations: The Ad-
vent of Econophysics. Tokyo: Springer.14. Weidlich, W. (2000) Sociodynamics: A Systematic Approach to Mathematical
Modeling in the Social Sciances. London: Taylor Sz Francis.15. Cioffi-Revilla, C, ed. (2004) Power Laws in the Social Sciences: Discovering
Complexity and Non-Equilibrium in the Social Universe. Book volume in prepa-ration.
16. Arthur, W.B. (1994) Inductive Reasoning and Bounded Rationality. AmericanEconomic Review, Papers Sz Proceedings 84, 406-411.
Contents
Part I Learning in Computational and Laboratory Experiments
The Implementation of the Turing Tournament: A ReportJasmina Arifovic 3
Expectations Structure in Asset Pricing ExperimentsGiulio Bottazzi, Giovanna Devetag 11
Learning in a "Basket of Crabs": An Agent-BasedComputational Model of Repeated Conservation AuctionsAtakelty Hailu, Steven Schilizzi 27
On the Benefit of Additional Information in Markets withHeterogeneously Informed Agents - an Experimental StudyJiirgen Huber, Michael Kirchler, Matthias Sutter 41
Part II Games and Strategic Interactions
Crowd Effects in Competitive, Multi-Agent Populations andNetworksNeil F. Johnson, Sehyo C. Choe, Sean Gourley, Timothy Jarrett, PakMing Hui 55
Local Minority Game and Emergence of Efficient DynamicOrderHiroshi Sato, Akira Namatame 71
Agents with Heterogeneous Strategies Interacting in a SpatialIPDFrank Schweitzer, Robert Mach, Heinz Muhlenbein 87
XII Contents
Complexity Leads to Benefits: Pareto-Improving Chaos in aHeterogeneous Duopoly MarketYasuo Nonaka 103
Part III Innovation, Networks and Learning Dynamics
On Novelty and HeterogeneityUlrich Witt 123
'Collective Innovation' in a Model of Network Formation withPreferential MeetingNicolas Carayol, Pascale Roux 139
Population Learning in Random Games with EndogenousNetwork FormationGiorgio Fagiolo, Luigi Marengo, Marco Valente 155
Growth and Coalition FormationDavide Fiaschi, Pier Mario Pacini 171
The Topology of Shareholding NetworksStefano Battiston, Diego Garlaschelli, Guido Caldarelli 189
Part IV Statistical Physics Approaches
A New Model of Labor Dynamics: Ultrametrics, Okun's Law,and Transient DynamicsMasanao Aoki, Hiroshi Yoshikawa 203
A Finitary Characterization of the Ewens Sampling FormulaDomenico Costantini, Ubaldo Garibaldi, Paolo Viarengo 221
Statistical Properties of Absolute Log-Returns and aStochastic Model of Stock Markets with HeterogeneousAgentsTaisei Kaizoji 237
Part V Asset Price Dynamics
Asset Price Dynamics and Diversification with HeterogeneousAgentsCarl Chiarella, Roberto Died, Laura Gardini 251

Contents XIII
An Asset Pricing Model with Adaptive Heterogeneous Agentsand Wealth EffectsCarl Chiarella, Xue-Zhong He 269
The Red Queen Principle and the Emergence of EfficientFinancial Markets: An Agent Based ApproachSheri Markose, Edward Tsang, Serafin Martinez Jaramillo 287
Price Formation in an Artificial Market: Limit Order BookVersus Matching of Supply and DemandMarco Raberto, Silvano Cincotti, Christian Dose, Sergio M. Focardi,Michele Marchesi 305
Fraudulent Agents in an Artificial Financial MarketEnrico Scalas, Silvano Cincotti, Christian Dose, Marco Raberto 317
Part I
Learning in Computational and LaboratoryExperiments
The Implementation of the TuringTournament: A Report
Jasmina Arifovic
Department of Economics, Simon Eraser University, Burnaby, BC V5A 1S6,Canada [email protected]
Summary. This paper provides an overview of the research activities that havealready been undertaken regarding the development and implementation of the ideaof the Turing Tournament. This is a two-sided Tournament designed to encourageimprovement of the existing as well as creation of new models of human behavior,emulators, that will be capable of replicating the main features that characterizebehavior of experimental human subjects in a variety of economic environments.The other side of the Tournament is represented by the algorithms designed todistinguish between machine and human generated behavior. The paper discussesgeneral design questions and its first implementation within the context of repeatedgames. Finally, the paper describes further stages of the Tournament developmentwhich will include its implementation in more complicated economic environmentswith larger strategy space.
1 Introduction
The main goal of social science is to develop good models of human behavior.However, it is not always clear how we know when we have been successful.Econometric methods can tell us which of several models does a better job ofexplaining a given set of data. But the classical econometric way of formulatingthis question does not really address the question of when the model is "goodenough."
A good example of this problem is in the current literature on learningin repeated games. There are now many competing models to explain howindividuals learn in such a setting. Two classical ones are Fictitious Play andCournot Best Reply. (See Boylan and El Gamal (1993) for an experimen-tal evaluation of these models). Crawford (1991, 1995) considers Evolution-ary models. Stahl (1996, 1998) explores boundedly rational rules. Roth andErev (1998, 1999) use the Reinforcement Learning model to explain learningin repeated games. Camerer and Ho (1999a, 1999b) develop the ExperienceWeighted Attraction (EWA) models.
4 J.Arifovic
All the above models have been evaluated by using standard econometricmethods (usually maximum likelihood methods) to fit the models to experi-mental data. Using these methods, one can get estimates of the parametersof the model, test various hypotheses about the parameters of the models,and compare models to each other. However, there is no really good way oftelling whether the model has done a "good enough" job of representing theunderlying decision making process.
Arifovic and McKelvey (2003) explore an alternative approach to evaluat-ing when models of human behavior are "good enough." They note that if thegoal is to mimic human behavior, then the appropriate test to tell if we havedone a good enough job is the Turing Test. In a famous paper in 1950, AlanTuring addressed the question of determining when computers can "think."His proposal was to replace this question with the more manageable questionof when a computer can mimic human behavior. Turing's answer was the socalled Turing Test: a machine is sufficiently human when a third party cannot distinguish between the behavior of the machine and a human. In Tur-ing's version, the third party is a human interrogator who is allowed to askwhatever questions he or she wants to both a machine and a human. Boththe machines and humans have their answers put on tape for the interrogatorto read.
Arifovic and McKelvey modify the original idea of the Turing test by sub-stituting a computer algorithm for a human interrogator. Thus, their Tourna-ment consists of computer algorithms that they call the emulators which canmimic human behavior and of computer algorithms that they call detectors,designed to detect whether the observed behavior is generated by the humansor by the emulators. Once all of the entries to the Tournament are submitted,the first stage involves generation of data, some of which is based on humanbehavior and some of which is based on the machine behavior. Then the dataare presented to the detectors that try to determine which data is human andwhich is machine generated. The winning detector is the one that does thebest job of distinguishing between the human and machine data. The winningemulator is the one that does the best job of fooling the best detector. Thus,unlike the original Turing test that represents an open ended interrogation,their Turing Tournament has the interrogator (detector) and the model ofhuman behavior (emulator) be represented by computer algorithms.
This report proceeds by describing, in section 2, the Turing Tournamentin greater detail. An overview of the results of the Initial implementation ofthe Tournament is given section 3. Finally, section 4 discusses possibilitiesfor future applications of the Turing Tournament methodology to a variety ofinteresting economic environments.
The Implementation of the Turing Tournament: A Report 5
2 The Turing Tournament - A Description
In the Tournament, the emulators that are submitted generate data sets withinformation on actions of computer agents in a given environment. The humanbehavior is represented by datasets generated in the experiments with humansubjects in the same environment. The detectors are then presented with allthe data sets, both those generated by emulators and by experiments withhuman subjects, and they try to distinguish between machine and humandatasets. They do so by assigning a probability that a given data set is humanrather than machine generated. Each detector gets a score based on how closeits decisions are to the true state. The detector that obtains the highest score isthe winner of the Tournament. The winning emulator is a computer algorithmto which the best detector assigns the highest probability of being human.
It is important to note that the score for a detector is determined by aproper scoring rule (the logarithmic proper scoring rule.) This gives incentivesfor each detector to give a truthful assessment of the posterior probability thateach dataset is human. Thus, the winning detector will be the detector whosetruthful posterior beliefs are the overall best (given the set of datasets thatare presented.) Also, since the winning emulator is the one that does thebest job of fooling the best detector, this gives incentives for the emulators tolook as human as possible to the best detector, again providing incentives fordeveloping the best theories of the social behavior in question.
Note that a detector is an algorithm that can contain a variety of differentmethods for evaluating data including various statistical tests, econometrictechniques, data mining methods, algorithmic procedures capable of exploit-ing some of the well known differences between human and machine generatedbehavior, etc. In addition, researchers working in the area of learning and ex-perimental economics are well aware of some of the differences, and are ableto distinguish between the charts that contain time series of human and thosethat contain time series of machine generated behavior in various economicsettings. Construction of a good detector should actually lead towards for-malization and algorithmic expression of the knowledge and intuition that isused when distinguishing between charts that represent human and those thatrepresent machine generated behavior.
The actual development of the Turing Tournament involved addressing anumber of design questions. The participants were required to submit theirsource code in addition to their executable programs. The programs had tobe written in such a way to be able to take certain input files supplied bythe main Tournament program, and to generate their output in a specifiedformat. (There was a set of requirements relevant for emulators, and the otherset relevant for detectors.)
In order for the Tournament methodology to work, it is essential that theincentives be such that the emulators that represent the best models of humanbehavior in the given setting and the detectors best at distinguishing betweenhuman and machine behavior are attracted. In order to guarantee this, it
6 J.Arifovic
is important that there not be collusion between various participants in theTournament (three groups of participants, the emulators, the detectors andthe human subjects). Thus, one of the Tournament rules specifies that anyattempt at collusion is explicit grounds for disqualification. The availabilityof programs' source code makes any kind of collusion identifiable.
3 Initial Implementation
In order to test the Tournament software that was developed, an internalTournament was conducted at the California Institute of Technology. Thefull description of this implementation can be found in Arifovic, McKelvey,and Pevnitskaya (2003). They 'submitted' to the Tournament the source codefor the programs of several emulators (a number of well-known learning al-gorithms that have been extensively studied in the literature). The main al-gorithms that were simulated included Fictitious Play, Cournot Best Reply,Adjusted Reinforcement, and Experience Weighted Attractions. In addition,several variants of mixed models where players were using different emulatorsto make their decisions were submitted. This implementation of emulatorsand detectors was for illustrative purposes only. While they tried to imple-ment a number of well-known learning algorithms as emulators, and used theparameter sets reported in the literature, Arifovic, McKelvey and Pevnitskayadid not try to compute the 'optimal' parameters for each of emulators in eachof the games.
The programs for several relatively simple detectors were also submitted.These detectors compute various measures using presented datasets, such ascloseness to Nash equilibrium, closeness to payoff dominant outcome, changesin players' payoffs overtime etc. Based on the values of these measures, de-tectors give a probability that a particular dataset is human. These detectorsrepresented just an initial attempt to tackle the problem of developing thistype of algorithms. They were based on some of the well known differencesbetween human and machine generated data. *
For this 'test' Tournament, experimental data collected by McKelvey andPalfrey (2001) were used. The games that were considered were: Ochs Game,Stag Hunt, Ultimatum game, Centipede game, Prisoner's Dilemma, Battleof Sexes and the game of Chicken. Machine datasets were generated for theabove games using the programs developed for various learning algorithms.
These initial simulations showed significant differences between human andcomputer generated data. To illustrate the differences, we mention a coupleof points in this report (the rest of the discussion can be found in Arifovic etal. (2003)).The first point to notice shows up in the data for the Battle of theSexes game. None of the learning models were able to mimic the coordination
1A concept of detectors is a new one and a real challenge in the Tournament isto develop good performing detectors.
The Implementation of the Turing Tournament: A Report 7
that occurs in human data. In the human data, subjects would frequentlyachieve more than could be achieved by independent randomization by al-ternating back and forth between the pure strategy equilibria. Thus, on oddmoves, they would go to the equilibrium preferred by one of the players, andon even moves to the equilibrium preferred by the other. The emulators didnot match this. As a result, the "coordination detector" that tried to detectintertemporal coordination in the Battle of Sexes game was very successful indistinguishing between human generated and computer generated data.
Another observation can be made from the data for the Prisoner's Dilemmagame. None of the existing models of learning that were implemented achievedas much cooperation as human subjects did and as a result the average individ-ual payoffs observed in the experiments are much higher than those obtainedby the emulators.
The results showed there was room for improvement in developing newemulators or more appropriate and better implemented versions of the existingemulators. The emulators that were implemented were really not designed totake into account either the repeated character of the game, or the fact thatthe opponent was also learning over time. The differences between human andcomputer behavior demonstrate that there is room for development of gooddetectors as well. Building good detectors represents development of a newmethodology for evaluating models of human behavior. Building a detectorrequires one to really think about how humans behave. In addition, betterdetectors will force improvements in the emulators, the models of humanbehavior.
4 Implementation During Summer 2003
These preliminary results, reported in Arifovic, McKelvey, and Pevnitskaya,served as motivation to conduct a full-scale public Tournament by invitingsubmissions of better adjusted and more sophisticated emulators and detec-tors. The Turing software that runs iteratively until, in statistical terms, asignificantly winning detector and emulator are identified was developed atthe California Institute of Technology and was ready to be implemented ina real Tournament. The organizers of the Tournament, the Turing Group 2
announced the beginning of the first official Tournament in March of 2003.The deadline for the emulator and detector submissions was May 31, 2003.
A detailed description of the Tournament, its rules and how it was goingto be conducted was made available on the Tournament's web site.3 TheTuring group gave a list of games that would be used, and the lower andupper bounds for the payoffs for each of the games from the list. In addition,they conducted a new set of experiments to be used for testing purposes only.
2Jasmina Arifovic, John Ledyard, Walter Yuan, and Chris Crabbe3The Turing Tournament web site is http://turing.ssel.caltech.edu.

8 J.Arifovic
The human subjects were California Institute of Technology undergraduatestudents. The samples of these data were also made available on the web sitein order to provide developers of emulators and detectors with the data thatcan be used for testing purposes.
After the deadline, a new set of experiments with human subjects usingthe set of games that algorithms were later tested on was conducted. Thus,new human datasets were created. At the same time, the programs were testedin order to check if they could be successfully implemented and used with theTuring Tournament software. Once the testing was over, the Tournament wasconducted for 10,000 iterations in order to ensure that the winning detectorand the winning emulator have statistically significant scores. The Turinggroup is now working on finalizing the presentation of the results that will beannounced shortly. Both the winning detector, and the winning emulator willget a prize of US $10,000 each.
When the computational part is over and the winners are announced, theTuring group will start the analysis of the submitted algorithms. The objectiveis to study what it is about the good emulators that distinguishes them fromthose that do not perform as well, and what characterizes good detectors.
5 Other Applications
The next stage of this research program involves a new application of theTournament to a more complicated environments in terms of the strategyspace and number of players. We will proceed to an implementation in publicgood environments. This will raise the technical difficulty of both running theTournament and creating emulators and detectors that can cope with largernumbers of players (greater than 2) and larger strategy spaces. But it willalso reveal whether the Tournament technology can be effectively used onmore than very limited set of environments. With obvious modifications, thebasic methodology, described above for learning in two person games, willhave applications in several areas of study. Examples are:
• Studying how cooperation and coordination develop in repeated normalform games, and how it depends on the information and matching condi-tions.
• Modeling behavior in public good provision problems.• Explaining bidding behavior and convergence to equilibrium in experimen-
tal economic markets.• Studying and detection of computerized trading in various asset markets
(e.g. stock markets, foreign exchange markets).• Detection of "program trading" in financial markets, i.e. development of
a methodology for distinguishing between human traders and programtrading.
• Development of methods to detect "market bots" (auction bots, shop bots)on internet auction sites.
The Implementation of the Turing Tournament: A Report 9
• Design of robot agents for use in laboratory experiments.• Design of machine translation programs.
The Tournament raises fundamental unsolved problems in game theory,computer science, econometrics/statistics, and experimental economics. Theexpectations are that it will attract general interdisciplinary interest and at-tention.
References
1. Arifovic J, McKelvey RD (2003) The Turing Tournament: A Method for Eval-uation of Social Science Theories. Manuscript
2. Arifovic J, McKelvey RD, and Pevnitskaya S (2003) An Initial Implementa-tion of the Turing Tournament to Learning in Two Person Games. Manuscript,available at http://turing.ssel.caltech.edu/index.html.
3. Boylan R and El Gamal M (1993) Fictitious Play: A Statistical Study of MultipleEconomic Experiments. Games and Economic Behavior 5:205-222.
4. Camerer CF, Ho TH (1999) Experience-Weighted Attraction Learning inGames: Estimates from Weak Link Games. In Budescu D, Erev I, Zwick R (eds)Games and Human Behavior: Essays in Honor of Amnon Rapoport. Erlbaum,31-51.
5. Camerer CF, Ho TH (1999) Experience-Weighted Attraction in Games. Econo-metrica 67:827-874
6. Crawford, V (1991) An 'Evolutionary' Interpretation of Van Huyck, Battalio,and Beil's Experimental Results on Coordination. Games and Economic Behav-ior 3:25-59.
7. Crawford V (1995) Adaptive Dynamics in Coordination Games. Econometrica63 :103-143.
8. Erev I, Roth AE (1998) Predicting How People Play Games: Reinforcementlearning in Experimental Games with Unique, Mixed Strategy Equilibria. Amer-ican Economic Review 88:848-881.
9. Erev I, Roth AE (1999) On the Role of Reinforcement Learning in Experi-mental Games: The Cognitive Game Theory Approach. In Budescu D, Erev I,Zwick I (eds) Games and Human Behavior: Essays in Honor of Amnon Rapport,Erlbaum, 53-77
10. McKelvey RD, Palfrey TR (2001) Playing in the Dark: Information, Learning,and Coordination in Repeated Games. Manuscript.
11. Roth AE, Erev I (1995) Learning in Extensive-Form Games: Experimental Dataand Simple Dynamic Model in the Intermediate Term. Games and EconomicBehavior, Special Issue: Nobel Symposium 8:164-212
12. Stahl DO (1998) Evidence Based Rules and Learning in Symmetric NormalForm Games. International Journal of Game Theory 28:111-130
13. Stahl DO (1996) Boundedly Rational Rule Learning in a Guessing Game. Gamesand Economic Behavior 16:303-330.
14. Turing A (1950) Cmputing Machinery and Intelligence. Mind 59:433-460.
Expectations Structure in Asset PricingExperiments
Giulio Bottazzi1 and Giovanna Devetag2
1 Sant'Anna School of Advanced Studies, Piazza Martiri della Liberta, 33 -1-56127 Pisa, Italy bottazziQsssup.it.
2 Department of Management and Computer Science, University of Trento, ViaInama, 5 - 38100 Trento, Italy [email protected]
Summary. Notwithstanding the recognized importance of traders' expectations incharacterizing the observed market dynamics, for instance the formation of specu-lative bubbles and crashes on financial markets, little attention has been devoted sofar by economists to a rigorous study of expectation formation in the laboratory.
In this work we describe a laboratory experiment on the emergence and coor-dination of expectations in a pure exchange framework. We largely base our studyon previous experiments on expectation formation in a controlled laboratory envi-ronment by Cars Hommes, Joep Sonnemans, Ian Tuinstra and Henk van de Velden(2002a).
We consider a simple two asset economy with a riskless bond and a risky stock.Each market is composed of six experimental subjects who act as financial advisorsof myopic risk-averse utility maximizing investors and are rewarded according tohow well their forecasts perform in the market. The participants are asked to pre-dict not only the price of the risky asset at time t + 1, as in Hommes et al. (2002a),but also the confidence interval of their prediction, knowing the past realizations ofthe price until time t — 1. The realized asset price is derived from a Walrasian mar-ket equilibrium equation, unknown to the subjects, with feedback from individualforecasts. Subjects' earnings are proportional to the increase in their wealth level.With respect to previous experiments that did not include an explicit evaluation ofrisk by participants, we observe a higher price volatility, a decreased likelihood ofbubble dynamics and, in general, a higher heterogeneity of predictions.
1 Introduction
It is by now largely acknowledged that investors' expectations play a keyrole in the formation of speculative bubbles and crashes on financial mar-kets. However, notwithstanding the recognized importance of trying to assesthe dynamics that govern the formation of expectations and their responseto information and experience, little attention has been devoted so far byeconomists to a rigorous study of expectation formation in the laboratory.
12 G.Bottazzi and G.Devetag
There are several experimental studies on asset markets (see, among oth-ers, [4], [5], [6], [7], [8]. However, most of these studies' main focus is the processof trading and the way in which trading activity itself may push prices farabove or below the asset's fundamental value, although in several cases infor-mation about the participants' expectations is collected as well (see [9] for areview).
In this work we describe a simple laboratory experiment on the emergenceand coordination of expectations in a financial market, in which no tradingtakes place and in which subjects' only task is to form predictions aboutthe future return of an asset and give a confidence range of their prediction.We largely base our study on a previous experiment of this type by [2] onexpectation formation in a controlled laboratory environment. In their exper-iment, each market is composed of six experimental subjects who are askedto predict the price of a risky asset at time t+1 knowing the past realizationsof the price until time t-1, the mean dividend at each period and the risk-free interest rate. Subjects' earnings are a function of their forecasting errors,and the realized asset price is derived from an unknown market equilibriumequation with feedback from individual forecasts. The authors find out thatin most markets prices diverge significantly from the (constant) fundamen-tal value; moreover, speculative bubbles emerge endogenously due to positivefeedback expectations. In a related experiment ([3]), the authors introduce asmall fraction of artificial, fundamentalist traders. In this latter case, the mar-ket dynamics show regular oscillations of the price around the fundamentalvalue, and excess volatility. In both experiments, subjects belonging to thesame market tend to coordinate on a common prediction strategy.
We replicate the experimental design in [2], but change some importantfeatures. First and most importantly, we ask our subjects to predict not onlythe future price of the asset, but also the confidence interval of their prediction,which we use as an estimate of the forecasted variance of the returns. In thisway subjects are asked to provide an estimation of the risk associated withtheir prediction and we are recreating a framework that is more similar to theones really faced by financial advisors. We believe that adding informationabout the forecasted variance in the model may affect the dynamics observedin the experimental market compared to the baseline case of [2, 3].
Secondly, in our experiments a subject's earnings do not depend on hisforecasting errors, but are proportional to the increase in the wealth level of ahypothetical investor (played by the computer program) who makes tradingdecisions according to a mean-variance approach taking as inputs the sub-jects' forecasts and acting with the time horizon of one step. In other words,experimental subjects act as financial advisors of myopic risk-averse utilitymaximizing investors and are rewarded according to how well their forecastsperform in the market. This experimental design allows us to focus exclusivelyon the dynamics of subjects' expectations, as in the original experiment byHommes et al; in fact, our subjects are not engaged in any trading, whichis done automatically by the computer program on the basis of the predic-
Expectations Structure in Asset Pricing Experiments 13
tions they provide; however, the payoff assignment rule that we adopt is morecorrespondent to what happens in real financial markets, where predictionaccuracy only matters inasmuch as it leads to 'correct' trading decisions.
Finally, we inform subjects of the positive feedback mechanism governingthe dynamics of price. In particular, subjects know that the price at time t isan increasing function of all market participants' forecasted returns at timet + 1, and a decreasing function of the forecasted variability of the predictedreturns. Subjects are also informed about the way in which the computer pro-gram calculates their personal demand functions for shares on the basis of theirpredictions, and on the nature of the asset pricing equation. In other words,subjects know that the price level at each time step - and the correspond-ing return - is generated by their own forecasting activity in a deterministicway. With such additional information, there is the possibility for groups tocoordinate on a common expectation strategy. Section 2.1 and Section 3 re-spectively describe our model of asset pricing and our experimental designand implementation. Section 4 discusses the results and Section 5 offers someconcluding remarks.
2 The Model
As previously said, participants in our experiment are asked to act as financialadvisors for mean-variance utility maximizing speculators with a short (onetime step) time horizon. We consider a simple economy with one risky stockpaying a constant dividend D at each trading round, and a riskless bond with aconstant return R. At each round of the experiment the participants are askedto provide a prediction of the risky asset's price return in the next round, i.e.,of the relative price increase between the present and the next round, togetherwith a confidence interval for their prediction. The participants' predictionsare then used as inputs to drive the investment decisions of synthetic riskaverse traders, played by the computer, which finally determine the asset pricefor that round. In this section we describe the behavior of the synthetic tradersin order to derive the explicit rules by which the participants' predictions doactually generate the price at every time step. We begin by describing thetraders' demand functions following [1] and, afterwards, describe how theindividual demand functions are merged to obtain the asset pricing equation.
2.1 Personal Demand Function
Let W(t) be the trader's wealth at the beginning of time t and let x be thefraction of wealth he wants to invest in the risky asset. If the price of the assetis p(t) and A(t) is the number of possessed shares then W(t) x — p(t) A(t).
The future trader wealth (i.e. its wealth at the beginning of the next round)depends on the future return on the stock price h(t) = p(t + l)/p{t) — 1 andreads
14 G.Bottazzi and G.Devetag
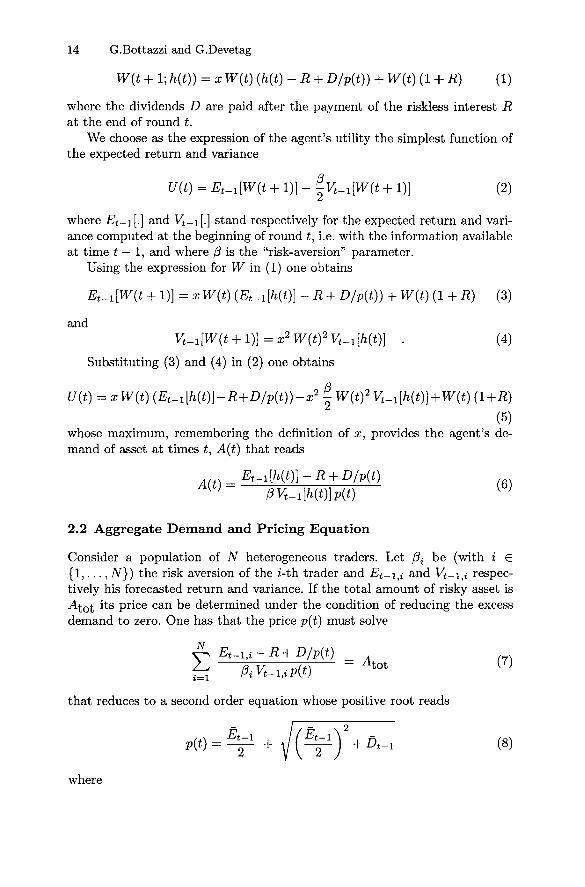
W(t + 1; h(t)) = x W(t) (h(t) -R + D/p(t)) + W(t) (1 + R) (1)
where the dividends D are paid after the payment of the riskless interest Rat the end of round t.
We choose as the expression of the agent's utility the simplest function ofthe expected return and variance
U(t) = Et_1[W(t + 1)] - £vt-1\W(t + 1)] (2)
where Et-i[.] and V^_i[.] stand respectively for the expected return and vari-ance computed at the beginning of round t, i.e. with the information availableat time t — 1, and where (3 is the "risk-aversion" parameter.
Using the expression for W in (1) one obtains
Et^[W(t + l)]=x W(t) (Et^[h(t)] -R + D/p(t)) + W(t) (1 + R) (3)
and. (4)
Substituting (3) and (4) in (2) one obtains
U(t) =xW(t) (Et^lhW-R+D/pW-x2 | W{tf VUWOl+WW (i+fl)(5)
whose maximum, remembering the definition of x, provides the agent's de-mand of asset at times t, A{t) that reads
_ EtA{t} ~
2.2 Aggregate Demand and Pricing Equation
Consider a population of N heterogeneous traders. Let f3i be (with i G{1 , . . . , N}) the risk aversion of the i-th trader and Et-i^ and Vt-ij respec-tively his forecasted return and variance. If the total amount of risky asset isAfot its price can be determined under the condition of reducing the excessdemand to zero. One has that the price p(t) must solve
A D/pjt)= t o t (7)
that reduces to a second order equation whose positive root reads
where
Expectations Structure in Asset Pricing Experiments 15
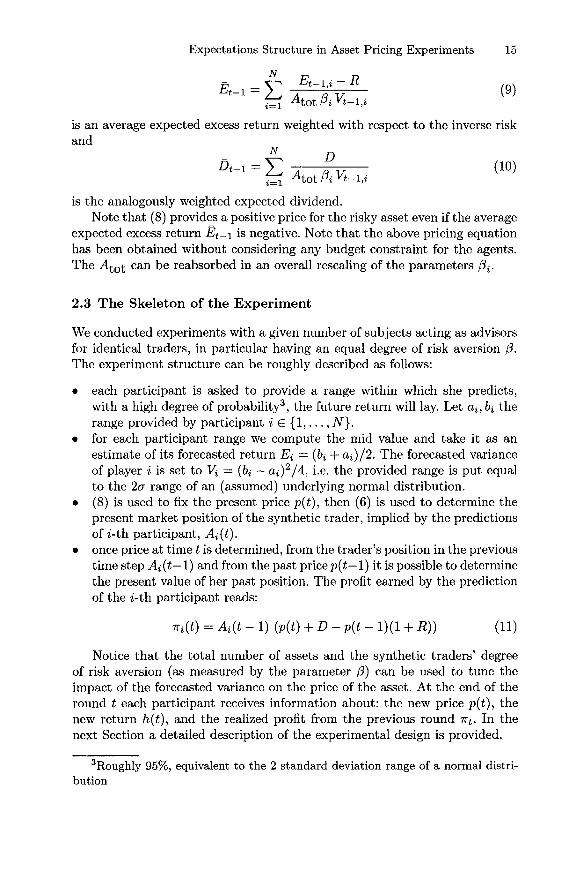
N F n
is an average expected excess return weighted with respect to the inverse riskand
A RV <10)Aotft^-M
is the analogously weighted expected dividend.Note that (8) provides a positive price for the risky asset even if the average
expected excess return Et-\ is negative. Note that the above pricing equationhas been obtained without considering any budget constraint for the agents.The A^QI can be reabsorbed in an overall rescaling of the parameters /^.
2.3 The Skeleton of the Experiment
We conducted experiments with a given number of subjects acting as advisorsfor identical traders, in particular having an equal degree of risk aversion (3.The experiment structure can be roughly described as follows:
• each participant is asked to provide a range within which she predicts,with a high degree of probability3, the future return will lay. Let a , bi therange provided by participant i E { l , . . . , i V } .
• for each participant range we compute the mid value and take it as anestimate of its forecasted return E{ = (bi + a>i)/2. The forecasted varianceof player i is set to Vi = (bi — di)2/£, i.e. the provided range is put equalto the 2<r range of an (assumed) underlying normal distribution.
• (8) is used to fix the present price p(t), then (6) is used to determine thepresent market position of the synthetic trader, implied by the predictionsof z-th participant, Ai(t).
• once price at time t is determined, from the trader's position in the previoustime step Ai(t—1) and from the past price p(t—l) it is possible to determinethe present value of her past position. The profit earned by the predictionof the i-th participant reads:
7n(t) = Ai(t - 1) (p(t) + D-p(t- 1)(1 + R)) (11)
Notice that the total number of assets and the synthetic traders' degreeof risk aversion (as measured by the parameter (3) can be used to tune theimpact of the forecasted variance on the price of the asset. At the end of theround t each participant receives information about: the new price p(t), thenew return h(t), and the realized profit from the previous round 7rt. In thenext Section a detailed description of the experimental design is provided.
3Roughly 95%, equivalent to the 2 standard deviation range of a normal distri-bution
16 G.Bottazzi and G.Devetag
3 The Experimental Design and Implementation
The experiment was entirely computerized and it took place in one of thecomputer rooms of the Computable and Experimental Economics Lab of theUniversity of Trento on May 7, 2003. We conducted two sessions of the exper-iment, with three cohorts of 6 subjects each participating in the first sessionand two cohorts of six participants in the second session, for a total of 30subjects, who were recruited through ads posted at the various departmentbuildings.
Subjects were mostly undergraduate students in economics and had neverparticipated in experiments of this type before. Before the experiment be-gan, subjects received paper copies of the instructions which were read aloudby the experimenter to make sure that the rules of the market were commonknowledge among participants4. In addition, a handout with a summary of themarket functioning together with the specification of the relevant parameterswas also given to every subject. All subjects could see each other but were pre-vented from looking at each other's computer screens by wooden separators.They were told that they would participate in a financial market composed ofsix participants in which their task was to predict the expected price return ofa hypothetical asset and its range of variability for a total of 50 periods. Theirearnings would depend on the increase in the value of an initial endowment Xthat they would have at the beginning of every period. Instructions explainedto subjects how their given forecasts of the expected price return at time t -f 1Ei(t+1) and the confidence interval Vi(t+1) would be utilized by the softwareto compute their personal demand function in every round, and how the sumof the personal demand functions of all six participants would determine themarket price of the asset in period t. It was explained to subjects that therange V would be the interval of values that according to them would containthe forecasted return with a probability roughly equal to 95%.
Finally, instructions also explained that their earnings at the end of eachperiod would consist of the capital gain achieved (which of course dependedon the realized price return), the dividends paid and the fixed interest rateR gained on the residual of their endowment. It was made clear that therewas no dependence between the investment choices made in different rounds,as a new, initial endowment X would be available to them at the beginningof every period. In other words, subjects acted as financial advisors of differ-ent investors, each of which acted as a mean-variance optimizer with a timehorizon of one step.
Subjects were told that their demand of shares could be negative or zeroin some rounds, meaning that they could hold short positions or invest allof their endowment in the acquisition of bonds that would yield the risklessrate R. Their final earnings would be determined by the sum of their earningsin every round, and converted into cash as follows: the participant within
A complete English translation of the instructions is available upon request.
Expectations Structure in Asset Pricing Experiments 17
1000
20 30 40 50
pricesfundamental
10 20 30 40 50
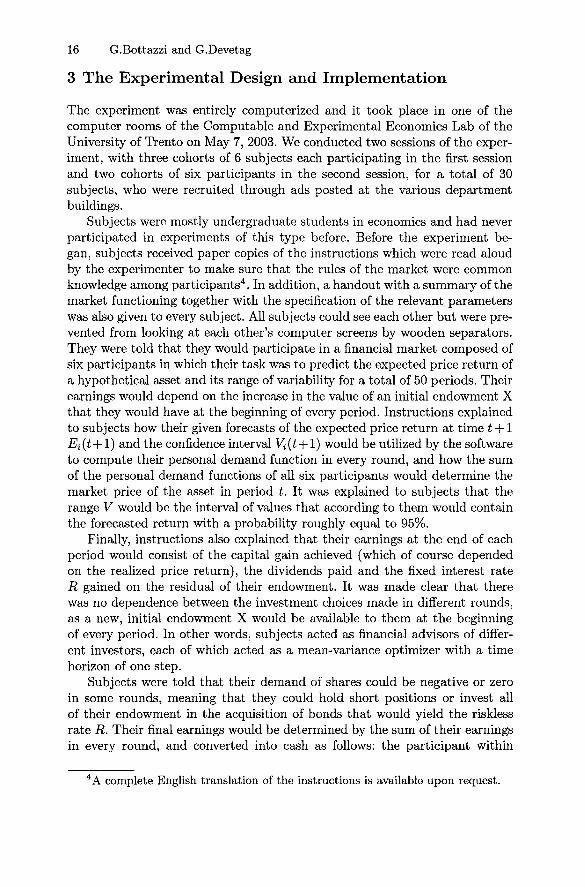
Fig. 1. Price history for the 5 groups
the group that had achieved the highest cumulative payoff would receive anamount of 25 , € while the participant with the minimum cumulative payoffwould receive an amount of 5 . € All other would get a payoff proportional tothe maximum achieved. Subjects were informed of the payoff assignment rulebut did not have any information throughout the experiment about otherparticipants' earnings, therefore such payoff assignment rule gave them thehighest incentive to maximize their earnings. Finally, although subjects knewthat the market would be composed of six participants, they did not knowthe identity of the other five participants.
Sessions lasted one hour and a half each. The initial endowment X was setequal to 100 experimental schillings, the risk-less interest rate R was equal to5%, the dividend was equal to 3 schillings. The parameters /3 and ^ o t w e r e
fixed to the values of 100 and 1, respectively.
4 Results
In Fig. 1 we report the observed asset prices p(t) for the 5 different groupstogether with the asset fundamental value p = 60. As can be seen from theplots, price volatility is very high but, except for the final rounds of groups 3and 5, it oscillates around the fundamental value. Moreover, notice that theprice increase observed in group 3 and 5 is inconsistent with an idea of ratio-
18 G.Bottazzi and G.Devetag
returnsexpectations
1 2 3 4 5
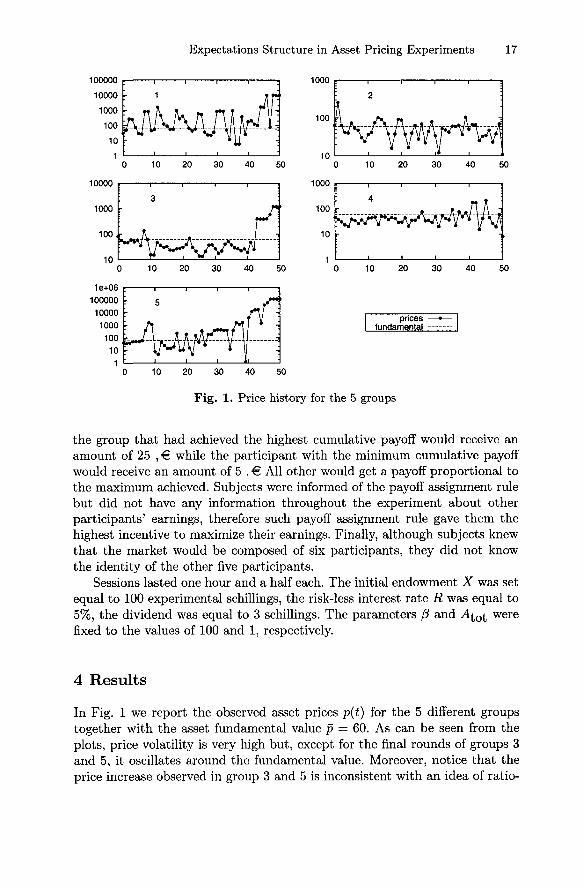
Fig. 2. Autocorrelogram of price returns for the 5 groups
nal bubble, since it does not display the expected exponential growth. Hence,these can be plausibly interpreted as "speculative" bubbles. Their appearancetoward the end of the experiment is probably due to a more 'extremist' behav-ior of some of the participants as the end of the experiment is approaching.
The behavior of the asset price in our experiment is remarkably differentfrom the one observed in [2, 3], exhibiting a higher volatility and a substantiallack of creation of relatively stable bubbles.
In Fig. 2 the autocorrelation structure of asset price returns r(t) —p(t + l)/p(t) — 1 for the 5 groups is shown (bold line) together with the au-tocorrelation of expected returns Etj. The former is analogous in all groupsexcept group 5, showing a tendency toward anti-correlation at 1 time lag. Asfar as the forecasted returns are concerned, one can notice that their autocor-relation structure is rather heterogeneous, with, however, a general tendencytoward positive correlation, in contrast with the observed structure in pricereturns.
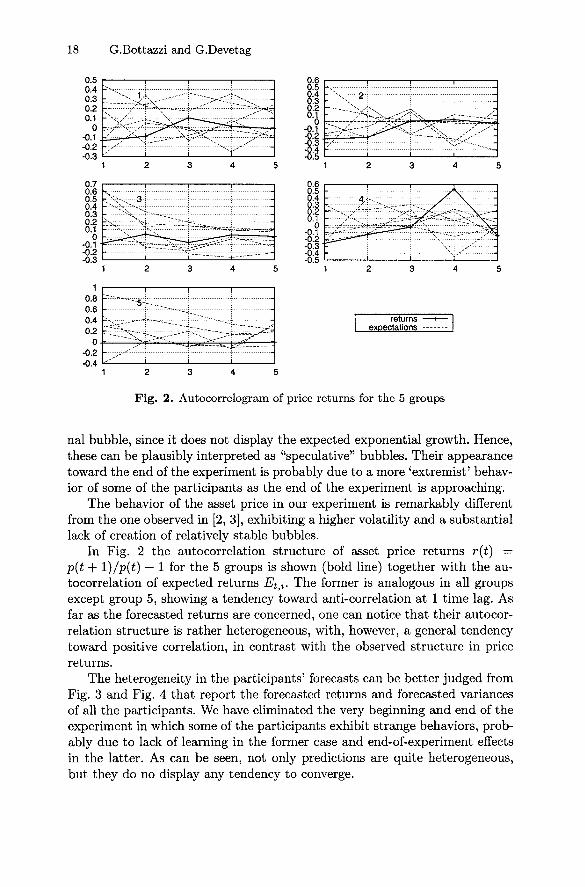
The heterogeneity in the participants' forecasts can be better judged fromFig. 3 and Fig. 4 that report the forecasted returns and forecasted variancesof all the participants. We have eliminated the very beginning and end of theexperiment in which some of the participants exhibit strange behaviors, prob-ably due to lack of learning in the former case and end-of-experiment effectsin the latter. As can be seen, not only predictions are quite heterogeneous,but they do no display any tendency to converge.
Expectations Structure in Asset Pricing Experiments 19
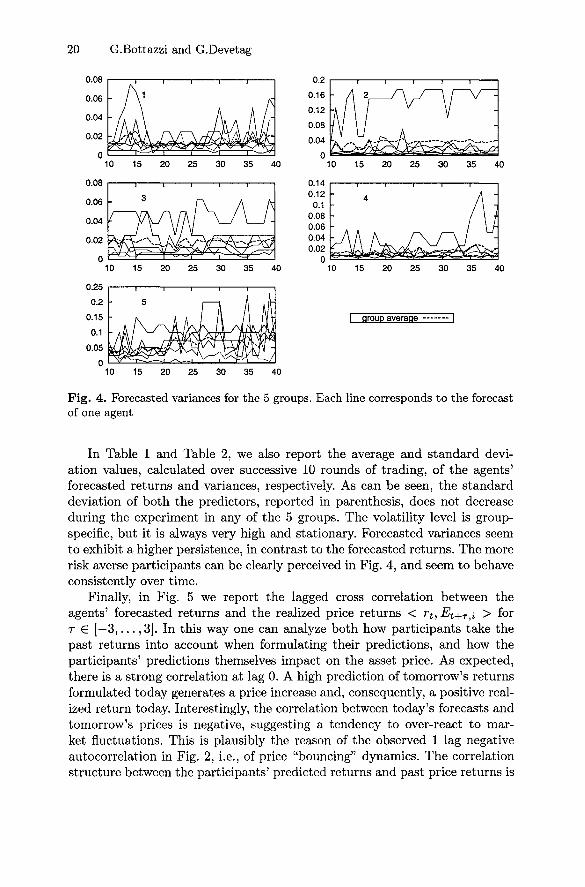
Fig. 3. Forecasted returns for the 5 groups. Each line corresponds to the forecastof one agent
Table 1. Average and standard deviation of players forecasted returns computedover 10 rounds
time group 1 group 2 group 3 group 4 goup 5TO 4.061(15.688) 0.129(0.217) 0.326(1.336) 0.117(0.238) 0.510(1.100)20 1.617(5.011) 0.173(0.402) 0.029(0.312) 0.157(0.275) 0.427(0.884)30 2.812(10.972) 0.224(0.449) 0.224(0.490) 0.074(0.306) 0.827(1.239)40 1.585(8.221) 0.189(0.511) 0.285(0.408) 0.132(0.425) 2.838(8.731)
Table 2. Average and standard deviation (inside parenthesis) of players forecastedvariances computed over 10 rounds
time group 1 group 2 group 3 group 4 goup 510 0.012(0.008) 0.016(0.027) 0.016(0.014) 0.012(0.011) 0.029(0.031)20 0.014(0.014) 0.033(0.052) 0.017(0.016) 0.012(0.010) 0.050(0.039)30 0.014(0.009) 0.037(0.056) 0.019(0.016) 0.016(0.014) 0.069(0.056)40 0.018(0.019) 0.038(0.061) 0.020(0.016) 0.021(0.028) 0.077(0.068)
20 G.Bottazzi and G.Devetag
35 40
15 20 25 30 35 40
I group average I
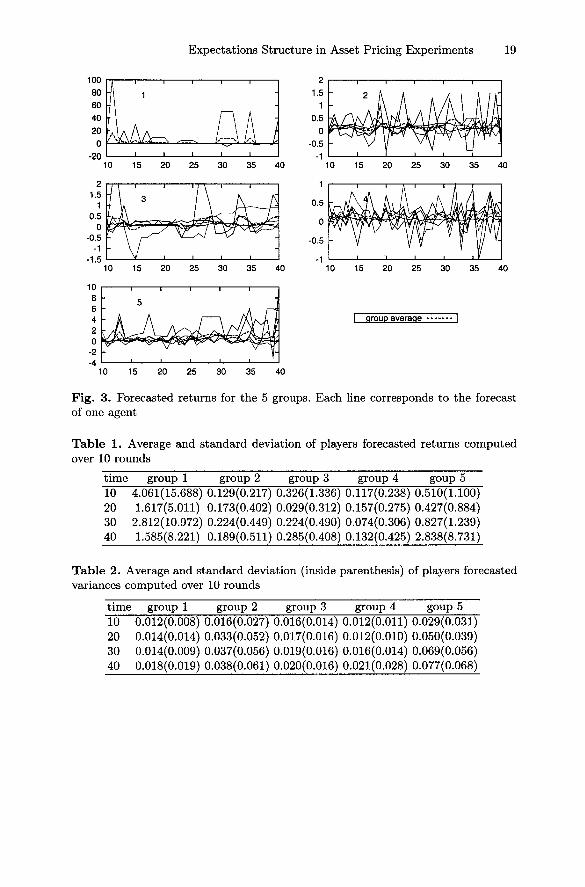
Fig. 4. Forecasted variances for the 5 groups. Each line corresponds to the forecastof one agent
In Table 1 and Table 2, we also report the average and standard devi-ation values, calculated over successive 10 rounds of trading, of the agents'forecasted returns and variances, respectively. As can be seen, the standarddeviation of both the predictors, reported in parenthesis, does not decreaseduring the experiment in any of the 5 groups. The volatility level is group-specific, but it is always very high and stationary. Forecasted variances seemto exhibit a higher persistence, in contrast to the forecasted returns. The morerisk averse participants can be clearly perceived in Fig. 4, and seem to behaveconsistently over time.
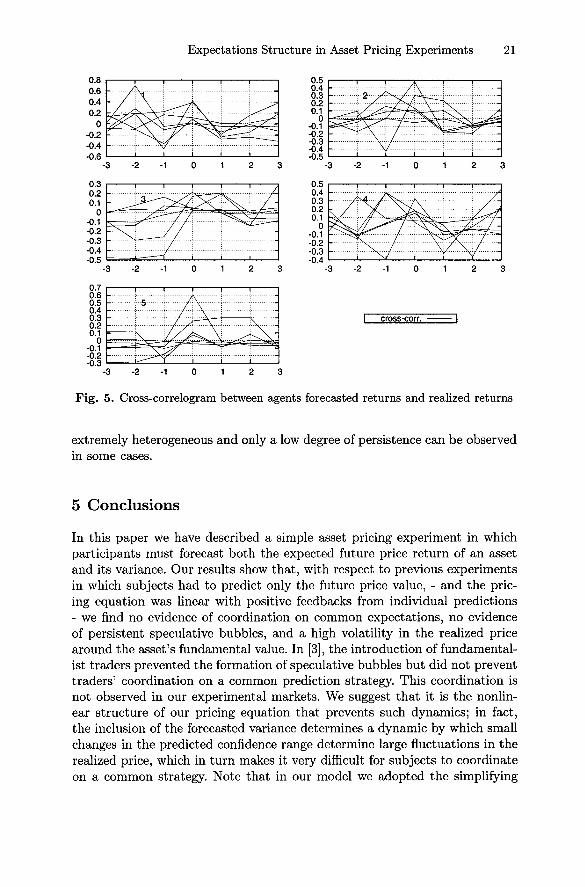
Finally, in Fig. 5 we report the lagged cross correlation between theagents' forecasted returns and the realized price returns < rt,Et+Tii > forr € [—3,..., 3]. In this way one can analyze both how participants take thepast returns into account when formulating their predictions, and how theparticipants' predictions themselves impact on the asset price. As expected,there is a strong correlation at lag 0. A high prediction of tomorrow's returnsformulated today generates a price increase and, consequently, a positive real-ized return today. Interestingly, the correlation between today's forecasts andtomorrow's prices is negative, suggesting a tendency to over-react to mar-ket fluctuations. This is plausibly the reason of the observed 1 lag negativeautocorrelation in Fig. 2, i.e., of price "bouncing" dynamics. The correlationstructure between the participants' predicted returns and past price returns is
Expectations Structure in Asset Pricing Experiments 21
I cross-corr.
Fig. 5.
- 2 - 1 0 1 2 3
Cross-correlogram between agents forecasted returns and realized returns
extremely heterogeneous and only a low degree of persistence can be observedin some cases.
5 Conclusions
In this paper we have described a simple asset pricing experiment in whichparticipants must forecast both the expected future price return of an assetand its variance. Our results show that, with respect to previous experimentsin which subjects had to predict only the future price value, - and the pric-ing equation was linear with positive feedbacks from individual predictions- we find no evidence of coordination on common expectations, no evidenceof persistent speculative bubbles, and a high volatility in the realized pricearound the asset's fundamental value. In [3], the introduction of fundamental-ist traders prevented the formation of speculative bubbles but did not preventtraders' coordination on a common prediction strategy. This coordination isnot observed in our experimental markets. We suggest that it is the nonlin-ear structure of our pricing equation that prevents such dynamics; in fact,the inclusion of the forecasted variance determines a dynamic by which smallchanges in the predicted confidence range determine large fluctuations in therealized price, which in turn makes it very difficult for subjects to coordinateon a common strategy. Note that in our model we adopted the simplifying
22 G.Bottazzi and G.Devetag
assumption of an equal degree of risk aversion for our subjects. Future experi-ments should aim at controlling for the - presumably - different risk attitudesof the participants in the experimental market, which are a relevant determi-nant of predictions and expectations in this type of settings. Another possiblecontribution would be to induce different risk attitudes to the subjects andtest for its effect on coordination. Taken together, our results confirm theimportance of the market institutional details - and in particular the natureof the expectations feedback structure - in determining the observed marketdynamics.
Acknowledgments
The authors thank participants in WEHIA 2003 and an anonymous referee foruseful comments and suggestions, and Marco Tecilla and Ivan Soraperra forsoftware development. The first author acknowledges financial support fromthe St.Anna School of Advanced Studies (grant n. E6003GB). The secondauthor acknowledges support from MIUR (Cofm 2002). The usual disclaimerapplies.
Appendix
Instructions
The following is an English translation of the instructions given to subjects.
You are about to participate in an experiment on decisions in market settings.Your earnings will depend on your decision and on other participants' decisions.If you make appropriate decisions, you will be able to earn an appreciable sum ofmoney that will be paid to you privately and in cash at the end of the experiment.
In this experiment you will participate in a financial market, and you will beasked to provide your estimates about the price variation of a financial asset. Themarket will last for a total of 50 periods. Your earnings will be based on the accuracyof your predictions in a way that will explained to you shortly.
All monetary quantities in the experiment will be expressed in experimental"schillings".
The Market
Each of you will participate in a market in which a hypothetical asset will be traded.Each market is composed of six participants (hence, yourself and other five partici-pants) . The division between groups of six participants will be made by the softwarerandomly at the beginning of the experiment, and the group composition will re-main the same throughout the experiment. The only information that you will haveabout the market will be the price of the asset over time, and its corresponding
Expectations Structure in Asset Pricing Experiments 23
return (i.e., the price variation from one period to the next). This financial assetis such that at the end of every period a fixed dividend of 3 schillings is paid foreach share owned (the dividends, for those of you who don't know it, represent thedistribution of a firm's profits to the shareholders). In this market you will only haveto make predictions. The trading decisions will be made for you by the computerprogram in the following way.
Predictions
At the beginning of period t - hence having information only up to period t — 1 -you will be asked to provide two estimates:
1. your estimate of the asset's price variation in period t + 1, or, in other words,its return, which we call E. This value can be positive or negative
2. Your confidence range for such estimate, i.e., the range in which, according toyou, the actual return E will fall with a probability roughly equal to 95%. Wewill label this confidence range with V
For example, you may predict that the asset return will be equal to 5%, witha confidence range of ±1%. This means that the most likely return for you will be5%, and that such return may vary from a minimum of 4% to a maximum of 6%with a probability of roughly 95%.
The return is simply the price variation from round to round, defined as follows:
priceft -f 1) - priced) ^ 10Q
price(t)
Clearly, if the price rises the return will be positive, whereas if the price falls,the corresponding return will be negative.
Investment
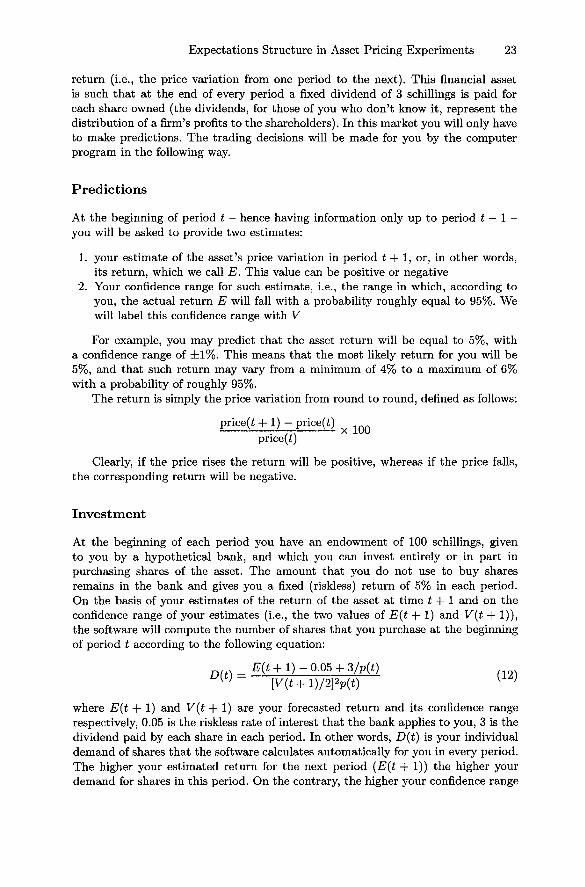
At the beginning of each period you have an endowment of 100 schillings, givento you by a hypothetical bank, and which you can invest entirely or in part inpurchasing shares of the asset. The amount that you do not use to buy sharesremains in the bank and gives you a fixed (riskless) return of 5% in each period.On the basis of your estimates of the return of the asset at time t + 1 and on theconfidence range of your estimates (i.e., the two values of E(t + 1) and V(t + 1)),the software will compute the number of shares that you purchase at the beginningof period t according to the following equation:
£(*+!)-0.05+ 3/p(t)[V(t+l)/2]Wt)
where E(t + 1) and V(t + 1) are your forecasted return and its confidence rangerespectively, 0.05 is the riskless rate of interest that the bank applies to you, 3 is thedividend paid by each share in each period. In other words, D(t) is your individualdemand of shares that the software calculates automatically for you in every period.The higher your estimated return for the next period (E(t + 1)) the higher yourdemand for shares in this period. On the contrary, the higher your confidence range