lloydminster public school division 2017 18 annual report
TRANSCRIPT

Lloydminster Public SD Board of Education Annual Report – 2017‐18
EnsuringPersonalExcellenceForAllStudents
LloydminsterPublicSchool
Division#99
2017‐18AnnualReport
Lloydminster Public SD Board of Education Annual Report – 2017‐18
Table of Contents
School Division Contact Information
Letter of Transmittal
Introduction
Governance
School Division Profile
School Division in the Community
Strategic Direction and Reporting
Demographics
Infrastructure and Transportation
Financial Overview
Appendix A – Payee List
1
2
3
4
6
8
11
39
41
43
45
52 Appendix B – Management Report and Audited Financial Statements

Lloydminster Public SD Board of Education Annual Report – 2017‐18 – Page 1
School Division Contact Information
Lloydminster Public School Division #99 “Ensuring Personal Excellence for All Students”
5017‐ 46 Street Lloydminster, AB T9V 1R4
Phone: 780‐875‐5541 Fax: 780‐875‐7829 Website: www.lpsd.ca
An electronic copy of this report is available at http://www.lpsd.ca

Lloydminster Public SD Board of Education Annual Report – 2017‐18 – Page 2
Letter of Transmittal
Honourable Gordon S. Wyant Q.C. Minister of Education
Dear Minister Wyant:
The Board of Education of Lloydminster Public School Division #99 is pleased to provide you and the residents of the school division with the 2017‐18 annual report. This report presents an overview of the Lloydminster Public School Division’s goals, activities and results for the fiscal year September 1, 2017 to August 31, 2018. It provides audited financial statements that have been audited by an independent auditor following the Canadian Generally Accepted Auditing Standards.
Respectfully submitted,
David Thompson

Lloydminster Public SD Board of Education Annual Report – 2017‐18 – Page 3
Introduction This annual report presents an overview of Lloydminster Public School Division’s activities and results for the fiscal year September 1, 2017 to August 31, 2018. It provides a snapshot of the division, its governance structures, students, staff, programs, and facilities. It also includes results and analysis of a number of indicators that contribute to student success. In addition to detailing the school division’s activities and performance, this report outlines how the division is implementing its strategic plan, provides a financial overview and audited financial statements, and includes appendices such as a school list and payee list. Financial statements included in this report have been audited by an independent auditor following the Canadian Generally Accepted Auditing Standards.
Lloydminster Public SD Board of Education Annual Report – 2017‐18 – Page 4
Governance
The Board of Education
Lloydminster Public School Division is governed by a seven‐person elected Board of Education. The Education Act, 1995 gives the Board of Education the authority to “administer and manage the educational affairs of the school division” and to “exercise general supervision and control over the schools in the school division”.
Board members are elected “at large” and reside in the City of Lloydminster. There are no sub‐divisions in Lloydminster Public School Division.
The current Board of Education was elected on October 24, 2016 and will serve a four‐year term. Board of Education members at August 31, 2018 were:
Chair ...................................................................................... David Thompson
Vice‐Chair.............................................................................. Karoline Kennedy
Member................................................................................ Eric Bloch‐Hansen
Member........................................................................................ Cathy Cornet
Member........................................................................................... Chrissy Gee
Member........................................................................................... Allan Park
Member....................................................................................... Joy Wareham
A list of the remuneration paid to board members in 2017‐18 is provided in Appendix A.
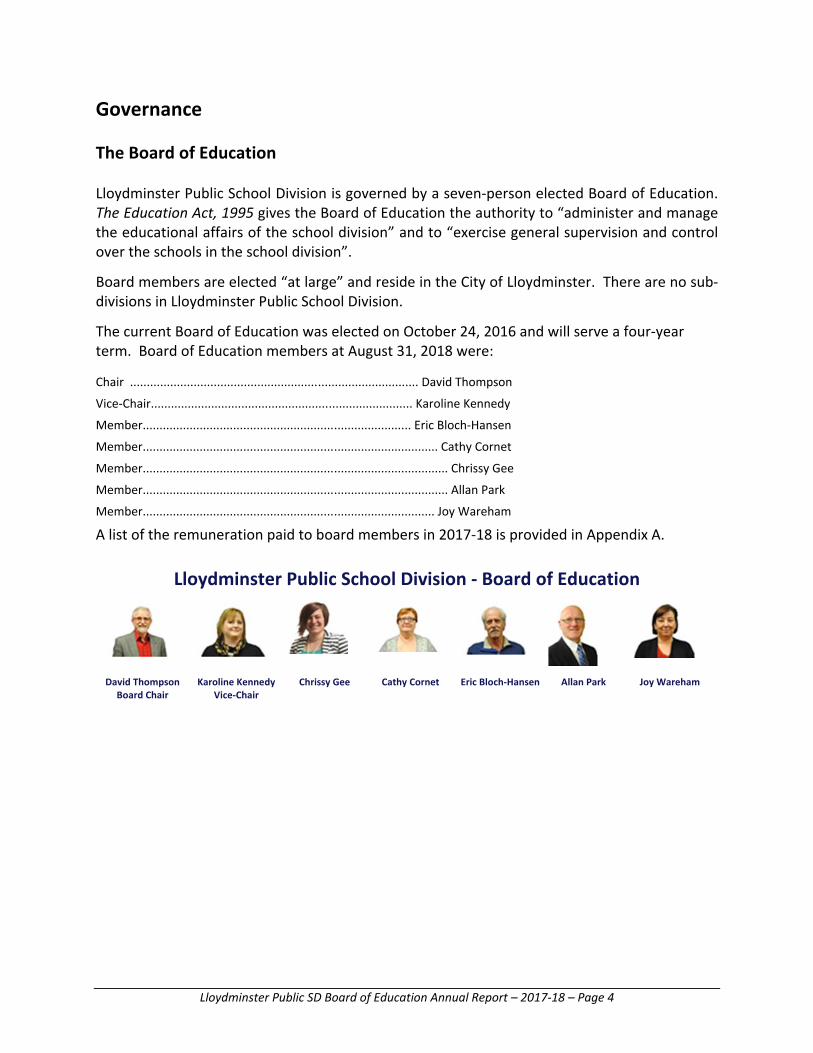
Lloydminster Public School Division ‐ Board of Education
David Thompson Board Chair
Karoline Kennedy Vice‐Chair
Chrissy Gee Cathy Cornet Eric Bloch‐Hansen Allan Park Joy Wareham

Lloydminster Public SD Board of Education Annual Report – 2017‐18 – Page 5
School Community Councils The Board of Education has established a School Community Council (SCC) for each of the ten schools in the Lloydminster Public School Division. All ten of the SCCs in Lloydminster Public School Division are made up of the required number of elected and appointed members, as outlined in The Education Regulations, 2015. The actual number of members varies from one SCC to another. Our SCC members are an integral part of our school communities through volunteering within classrooms, fundraisers and reviewing and supporting our School Learning Improvement plans.
The Education Regulations, 2015 require school divisions to undertake orientation, training, development and networking opportunities for their SCC members. In 2017‐18 Lloydminster Public School Division conducted two forums, for this purpose, for all ten of its SCCs and executives. The SCCs operate under the direction of the school and are not presently funded by the Board of Education.
The Regulations also require SCCs to work with school staff to develop an annual school Learning Improvement Plan (LIP) that is aligned with the school division’s strategic plan and to recommend that plan to the Board of Education. In 2017‐18, all ten of the division’s SCCs reviewed and signed these LIPs.
School Community Councils are also expected to facilitate parent and community participation in planning and to provide advice to the Board of Education, the school’s staff, and other agencies involved in the learning and development of students. SCCs enable the community to participate in educational planning and decision making, and promote shared responsibility for learning among community members, students and educators. The advice the SCCs give to the Board of Education encompasses policies, programs, and educational service delivery; the advice they give to the school staff relates to the school’s programs. We had two meetings in 2017‐18, once in the Fall and once in the Spring whereby each SCC chair or designate shared their goals and accomplishments and heard from our Board Chair and Director about such items as the Strategic Plan. It was a great opportunity to celebrate, ask questions and seek feedback.

Lloydminster Public SD Board of Education Annual Report – 2017‐18 – Page 6
School Division Profile
About Us
The Lloydminster Public School Division is a very complex organization, in that it is both a Saskatchewan and Alberta school division. The Lloydminster Public School Division (LPSD) follows the Saskatchewan curriculum and reports primarily to the Saskatchewan Ministry of Education. It also receives funding from Alberta Education to support a number of student learning and facility initiatives. This complex environment creates an opportunity for the Division to simultaneously glean the best from two provinces. However, at the same time, the situation presents challenges by requiring LPSD to be accountable to two provincial authorities and operating procedures.
LPSD has five elementary schools, one kindergarten to grade 9 school, two middle schools, one high school and one outreach school. All of our schools offer students a well‐rounded education based on curricula provided by the Saskatchewan Ministry of Education. Students who attend our schools not only receive excellent curricular instruction, but also benefit from extensive co‐curricular and extracurricular opportunities! The economy of the Lloydminster area reflects both the Oil industry and Agriculture. There has been evidence of the downturn in the economy through job loss, which results in more students for breakfast/lunch programs and other subsidies we can offer.
Lloydminster Public SD Board of Education Annual Report – 2017‐18 – Page 7
Division Philosophical Foundation
DivisionMissionStatement
“Ensuring Personal Excellence for All Students”
DivisionVisionStatement
Lloydminster Public School Division has a shared commitment with parents and community to create a safe and caring learning environment in order to prepare students to be inspired learners and productive citizens.
DivisionValues
● Respect for diversity ● Care for themselves and others ● Respect for authority, property, and the environment ● Continuous improvement ● Excellence in all they do ● Leadership in making positive choices ● Accountability for their choices and actions ● Collaborative relationships DivisionBeliefStatements● We believe all students can achieve personal excellence given sufficient time and the right
supports; ● We believe high expectations and early and ongoing interventions are essential; ● We believe all staff can perform to high standards given the right assistance; ● We believe all staff can articulate what they do and why they perform the way they do.

Lloydminster Public SD Board of Education Annual Report – 2017‐18 – Page 8
School Division in the Community
Community Involvement Lloydminster Public School Division is an integral part of community life in west central Saskatchewan. The division, as a whole, and individual schools are linked to the broader community in a multitude of ways. The Board of Education places strong emphasis on community and parent involvement, and on community partnerships.
Community and Parent Involvement Research has shown that students achieve at higher levels in school when their families and other community members are involved in education. The schools of Lloydminster Public School Division all have programs and initiatives to encourage community and parent involvement. These programs vary from school to school and are, therefore, unique to each school community.
LPSD had over 1000 parent volunteers throughout the 2017‐18 school year! Community Partnerships Lloydminster Public School Division and individual schools within the division have established a range of formal and informal community partnerships in order to promote student learning and ensure that students’ school experience is positive and successful. Some examples of these partners include: Lakeland College, City of Lloydminster, Vic Juba Theatre, Native Friendship Center, FOPA (Friends of the Performing Arts) and the Junior A Bobcats Hockey.
LPSD uses an integrated services model in which they partner with social service agencies to ensure that students’ physical, social, and psychological needs are met. This approach recognizes that students who are healthy and happy have greater capacity to learn and to succeed in school and in life.
Several schools in LPSD have partnered with local businesses. The purpose of these partnerships is to enrich students’ educational experience and to help them connect what they learn at school to the world of work. Typically, the partner business provides job shadowing opportunities for students and sends representatives to the schools to talk about their business or industry.
Lloydminster Public School Division provided leadership in developing and chairing of HUB meetings throughout the school year. This framework unites Prairie North Regional Health, AB/SK Social Services, Lloydminster RCMP, AB/SK Ministries of Justice and Corrections and Alberta Works to serve individuals and families who are at risk.

Lloydminster Public SD Board of Education Annual Report – 2017‐18 – Page 9
Program Overview
The students in Lloydminster Public School Division are diverse. They vary in age, personal circumstances, learning styles, interests, and individual strengths and needs. In order to provide
the best education possible for all our students, Lloydminster Public School Division offers a wide range of programs in the 10 schools of the division.
Central to the program in every school is the provincially‐mandated core curricula, broad areas of learning and cross‐curricular competencies. Classroom instruction is designed to incorporate
differentiated instruction, First Nations, Métis and Inuit (FNMI) content, perspectives and ways of knowing, and the adaptive dimension.
In addition, each school in LPSD offers specialized programming that responds to the needs of its students. The following list identifies programs in operation at one or more of the division’s
schools: • Alternative programming for vulnerable students • Community school programming • Core French instruction • Distance education • English as an Additional Language programming • Technical/Vocational programs • Hockey Academy • Music/band programming • Junior kindergarten program • Technology‐enhanced learning • Nutrition programs • Pre‐kindergarten programs • Cree Language • Land‐based Learning
Additional services and supports are offered to students and teachers by specialized LPSD staff including:
• Literacy Coaches and Technology Consultants • Educational psychologist services • English as an Additional Language lead teachers • Occupational Therapist • Speech and language Pathologists
• Student Counsellors • Targeted Skills Teachers • FNMI Lead Teachers

Lloydminster Public SD Board of Education Annual Report – 2017‐18 – Page 10
The Lloydminster Public School Division has undertaken a number of ongoing initiatives which include the following:
• Early Reading Intervention
• Skills Canada • Student Leadership • Job Safety • Hockey Academy
• Technology Plan • Avery Outreach School • FNMI Cultural Activities and Events • Embedded Music Lessons (FOPA)
• Student and staff Wellness (Nutrition, Strengths Finder)

Lloydminster Public SD Board of Education Annual Report – 2017‐18 – Page 11
Strategic Direction and Reporting
The Education Sector Strategic Plan
Members of the education sector have worked together to develop an Education Sector Strategic Plan (ESSP) for 2014‐2020. The ESSP describes the strategic direction of the education sector. The ESSP priorities and outcomes align the work of school divisions and the Ministry of Education. The plan is expected to shape a new direction in education for the benefit of all Saskatchewan students. 2017‐18 was the fourth year of deployment of the 2014‐2020 ESSP.
Enduring Strategies
● The Enduring Strategies in the ESSP are: ● Culturally relevant and engaging curriculum; ● Differentiated, high quality instruction; ● Culturally appropriate and authentic assessment; ● Targeted and relevant professional learning; ● Strong family, school and community partnerships; and, ● Alignment of human, physical and fiscal resources.

Lloydminster Public SD Board of Education Annual Report – 2017‐18 – Page 12
Reading, Writing, Math at Grade Level ESSP Outcome: By June 30, 2020, 80% of students will be at grade level or above in reading, writing and math. ESSP Improvement Targets: ● By June 2018, at least 75% of students will be at or above grade level in reading and writing. ● By June 2019, at least 75% of students will be at or above grade level in math. ESSP Priority: Contingent on recommendations from the sector, implement and actualize the provincial Unified Student Information System.
School division goals aligned with Reading, Writing and Math at Grade Level outcome
● By June 30, 2020 80% of students will be at or above grade level in reading, writing and math.
● By June 2018, at least 80% of students will be at or above grade level in reading and writing.
● By June 2019, at least 75% of students will be at or above grade level in math.
School division actions taken during the 2017‐18 school year to achieve the outcomes and targets of the Reading, Writing and Math at Grade Level outcome
Shared sector math rubrics
● Provincial rubrics (Gr. 1‐9) made available to school staff. School
administrators developed a process to share and build capacity.
Data collected for Reading (Gr. 1‐6) and Writing (Gr. 4,7,9).
● Data collected and analyzed at each school.
Representatives from LPSD attended the annual Reading, Writing and Math literacy day hosted by Sector.
100% of Elementary Schools deployed a literacy program based on Saskatchewan Reads (Sask Reads) that was aligned with the Educational Sector Strategic Plan.
● LPSD elementary schools developed a Saskatchewan Reads implementation plan in collaboration with their school Superintendent (reference Appendix D in SK Reads).
● In‐school administrators observed teachers to support and celebrate the teachers’ learning (reference Sask Reads for Admin. Pg. 32‐34).
● School administrators planned for strategic use of literacy leads within their schools (Elementary).
● School improvement teams involved the literacy lead.
Provided professional development necessary for in‐school administrators.
● In school administration reflected upon and developed practices outlined in Saskatchewan Reads for Administrators & Appendix D in SasK Reads.
● Conference opportunities provided.
All Middle School ELA teachers attended August professional development delivered by Ruth Culham. Other opportunities were provided throughout school year as deemed necessary by administrators.
● Built teacher capacity and skills in Reading/Writing.

Lloydminster Public SD Board of Education Annual Report – 2017‐18 – Page 13
Measures for Reading, Writing and Math at Grade Level
Proportion of Grade 3 Students Reading At or Above Grade Level
Grade 3 reading levels are considered a leading indicator of future student performance. In response to the Plan for Growth Improvement target, Grade 3 reading levels have been tracked using provincially developed benchmarks since 2014. Ensuring that each year a greater proportion of Grade 3s in the province (currently about three‐quarters) is reading at grade level will mean more students each year are ready to learn in Grade 4 and beyond. The following bar graph displays the percentage of Grade 3 students (FNMI, non‐FNMI, all) by reading level. The charts below the graph indicate the percentage of Grade 3 students in the province reading at or above grade level, as well as the proportion of Grade 3 students with reported reading levels.
Notes: Reading levels are reported based on provincially developed benchmarks. The percentages of students in each of the reading level groupings were found using the number of students with a 'valid' reported reading level as the denominator. (Excluded or non‐participant students were not included in these calculations.) Results for populations of fewer than 10 students have not been reported to avoid identifying individuals or very small groups of students. FNMI students are those who choose to self‐identify as First Nations (Registered/Treaty/Status Indian, Non‐Status Indian), Métis,

Lloydminster Public SD Board of Education Annual Report – 2017‐18 – Page 14
or Inuit/Inuk. Non‐FNMI students are those who do not identify as FNM or I, however, this category may include FNMI students who choose not to self‐identify. Source: Ministry of Education, 2018
Analysis of results
Within our school division we have seen some growth from the 2013‐14 school year (78.5% all students) to the 2014‐15 school year (79.7%). In 2015‐16 we went down slightly to 77.5% to show a 2% decrease, in 2016‐17 we went up to 78.8% and last year we saw a significant increase to 82.4%. Aside from 2015‐16, we have shown steady growth with last year being our biggest gain. We are pleased that results for our Grade 3 students overall are consistently above the provincial results (74.8% in 2017‐18). We continue to track the progress and actively analyze the data for those students who have not yet achieved grade level in reading. Our FNMI students achieved 65.1% (much higher than the province at 55.1%), compared to our Non‐FNMI population which achieved 85.2% (above the province at 79.2%). Overall, we are higher than the province with all students achieving 82.4% versus the province at 74.8%. We continue to work on closing the gap between our FNMI and Non‐FNMI students.
Proportion of Students Writing At or Above Grade Level
Writing is a key measure identified in the ESSP Reading, Writing and Math at Grade Level Outcome. The following bar graph displays the percentage of students (FNMI, non‐FNMI, all) by writing level in Grades 4, 7 and 9. The charts below the graph indicate the percentage of Grades 4, 7 and 9 students in the province writing at or above grade level, as well as the proportion of students with reported writing levels.

Lloydminster Public SD Board of Education Annual Report – 2017‐18 – Page 15
Notes: Writing levels are reported based on provincially developed rubrics. The percentages of students in each of the writing level groupings were found using the number of students with a 'valid' reported writing level as the denominator. (Excluded or non‐participant students were not included in these calculations.) Results for populations of fewer than 10 students have not been reported to avoid identifying individuals or very small groups of students. FNMI students are those who choose to self‐identify as First Nations (Registered/Treaty/Status Indian, Non‐Status Indian), Métis, or Inuit/Inuk. Non‐FNMI students are those who do not identify as FNM or I, however, this category may include FNMI students who choose not to self‐identify. Source: Ministry of Education, 2018
Analysis of results
This year represents our baseline data. We are proud of our grade 4 overall results with 85.9% of students who are at or above grade level (compared to the province at 62.5%) and meeting the goal set at 75% or greater. We have concerns with both grade 7 and 9 overall data with 65.5% of students at grade 7 and 67.4% of grade 9 students reading at or above grade level.
● In grade 4 for LPSD, 63% of FNMI students achieved at or above grade level (compared to the province at 42.3%), 90.8% of Non‐FNMI students achieved at or above grade level (compared to the province at 67.2%) and 85.9% of students overall were at or above grade level (compared to the province at 62.5%).
● In grade 7 for LPSD, 41.3% of FNMI students achieved at or above grade level (compared to the province at 40.2%), 65.5% of Non‐FNMI students achieved at or above grade level (compared to the province at 69.7%) and 62% of students overall were at or above grade level (compared to the province at 63.8%).
Lloydminster Public SD Board of Education Annual Report – 2017‐18 – Page 16
● In grade 9 for LPSD, 34.2% of FNMI students achieved at or above grade level (compared to the province at 44.6%), 67.4% of Non‐FNMI students achieved at or above grade level (compared to the province at 72.5%), 62.6% of students overall were at or above grade level (compared to the province at 67.7%).
● Areas we need to attend to include the gap between FNMI and Non‐FNMI achievement. Also, our grade 7 and 9 data are both below the provincial data and do not meet the provincial goal of 75% of students writing at or above grade level.

Lloydminster Public SD Board of Education Annual Report – 2017‐18 – Page 17
Improving First Nations, Métis and Inuit Student Engagement and Graduation Rates ESSP Outcome: By June 30, 2020, collaboration between First Nations, Métis and Inuit and non‐First Nations, Métis and Inuit partners will result in significant improvement in First Nations, Métis and Inuit student engagement and will increase three‐year graduation rates from 35% in June 2012 to at least 65% and the five‐year graduation rate to at least 75%. ESSP Improvement Targets: ● Achieve an annual increase of four percentage points in the First Nations, Métis and Inuit three‐year and
five‐year graduation rates. ● By June 2019, schools involved in FTV for at least 2 years will collectively realize an 8% annual increase in
First Nations, Métis and Inuit student graduation rates. ● By 2018, school divisions will achieve parity between First Nations, Métis and Inuit and non‐First Nations,
Métis and Inuit students on the OurSCHOOL engagement measures. ESSP Priority: In partnership with First Nations, Métis and Inuit stakeholders, continue to implement the Following Their Voices (FTV) Initiative.
School division goals aligned with the Improving First Nations, Métis and Inuit Student Engagement and Graduation Rates outcome
By June 2018, 65% of FNMI students will graduate from high school within three years of starting grade 10.
School division actions taken during the 2017‐18 school year to achieve the outcomes and targets of the Improving First Nations, Métis and Inuit Student Engagement and Graduation Rates outcome
Schools have connected with various organizations and Elders to encourage partnership initiatives.
● LPSD First Nations Education Committee was involved with the planning of school and division events. All schools had a representative on the committee.
● An Aboriginal Coordinator was hired to support the infusion of First Nations content and perspectives (Treaty Education) into curricular outcomes.
● LPSD developed a procedure to recognize Treaty 6 Land. ● Students experienced Aboriginal cultural events in all schools.
In response to the Truth and Reconciliation Council’s (TRC)’s Calls to Action, LPSD ensured learning environments were responsive to student needs, including positive relationships and shared responsibility.
● A wide variety of targeted professional development was offered to teachers and administrators.
● All LPSD school staffs participated in the Blanket Exercise at a staff meeting. ● Administrators were provided with targeted professional development to
support their understanding of the Education Calls to Action and reconciliation. ● The school division reported on Our School (Inclusion composite) data.
Schools engage Families and caregivers in student support. ● Parents were invited to participate in Our School Survey, Student Led
Conferences and school events.

Lloydminster Public SD Board of Education Annual Report – 2017‐18 – Page 18
Measures for Improving First Nations, Métis and Inuit Student Engagement and Graduation
Average Final Marks
Teacher‐assigned marks are important indicator of student performance in school. Classroom marks are used for grade promotion and graduation decisions, to meet entrance requirements for postsecondary education, to determine eligibility for scholarships and awards and by some employers when hiring. The following displays average final marks in selected secondary‐level courses for all students, and by non‐FNMI and FNMI student subpopulations in the division, along with provincial results for each category.
.
Notes: Results for populations of fewer than 10 students have not been reported to avoid identifying individuals or very small groups of students (nr). FNMI students are those who choose to self‐identify as First Nations (Registered/Treaty/Status Indian, Non‐Status Indian), Métis, or Inuit/Inuk. Non‐FNMI students are those who do not identify as FNM or I, however, this category may include FNMI students who choose not to self‐identify. Source: Ministry of Education, 2018
Analysis of results
The average final marks for selected secondary‐level courses for FNMI students are generally higher than the provincial mark for FNMI students. The average final marks for selected secondary‐level courses all students are lower than the province in six course areas, but higher in two than the province. In seven of the selected secondary‐level courses, FNMI students achieved lower grades than non‐FNMI students and in one course the grade was the same. This trend has been consistent for the past five years. The gap ranges from 0 to 16 percentage points in marks for the selected secondary‐level courses. The division will attend to further analysis of this data to investigate the achievement gap between FNMI students and Non‐FNMI students.

Lloydminster Public SD Board of Education Annual Report – 2017‐18 – Page 19
Credit Attainment
Credit attainment provides a strong predictive indicator of a school system’s on‐time graduation rate. Students receiving eight or more credits per year are more likely to graduate within three years of beginning Grade 10 than those who do not achieve eight or more credits per year. The following displays the credit attainment of secondary students attaining eight or more credits per year for all students, and by non‐FNMI and FNMI student subpopulations in the division, along with provincial results for each category.
Notes: Credit attainment measures are calculated as the percentage of students enrolled at the secondary level on September 30 attaining eight or more credits yearly. Results for populations of fewer than 10 students have not been reported to avoid identifying individuals or very small groups of students (nr). FNMI students are those who choose to self‐identify as First Nations (Registered/Treaty/Status Indian, Non‐Status Indian), Métis, or Inuit/Inuk. Non‐FNMI students are those who do not identify as FNM or I, however, this category may include FNMI students who choose not to self‐identify. Source: Ministry of Education, 2018

Lloydminster Public SD Board of Education Annual Report – 2017‐18 – Page 20
Analysis of results
The percentage of grades 10‐12 students attaining overall 8 or more credits in Lloydminster Public School Division increased slightly over the past three years; to a rate within one percent of the provincial results. The percentage of FNMI grades 10‐12 students attaining 8 or more credits in Lloydminster Public School Division (37%) was significantly higher than the province (31%) in the 2017‐18 school year. However, the difference in the percentage of FNMI students attaining 8 or more credits compared to the percentage of non‐FNMI students attaining 8 or more credit was 32 percentage points. This trend has been consistent over the past three years and is an area of concern. The division will attend to further analysis of this data to investigate the credit attainment gap between FNMI students and Non‐FNMI students.

Lloydminster Public SD Board of Education Annual Report – 2017‐18 – Page 21
Graduation Rates ESSP Outcome: By June 30, 2020, Saskatchewan will achieve an 85% three‐year graduation rate and a 90% five‐year graduation rate. ESSP Improvement Targets: ● Achieve an annual increase of three percentage points in the provincial three‐year graduation rate. ● By June 2018, students will report a 5% increase in intellectual engagement as measured by OurSCHOOL.
School Division goals aligned with the Graduation Rates outcome
The 2017‐18 school goals were: ● By June 2018, the ‘on time’ graduation rate at LCHS will meet or exceed 90%.
● By June 2018, the ‘on time’ graduation rate for FNMI students at LCHS will
meet or exceed 75%.
● By June 2018, the percentage of LCHS students that indicate they have
moderate to high levels of anxiety from the Our School survey will match the
national average (18%).
● By June 2018, LCHS students will meet or exceed a course completion rate of
95% in their ELA and Math courses at LCHS, as calculated by grade level.
School division actions taken during the 2017‐18 school year to achieve the outcomes and targets of the Graduation Rates outcome
LCHS supported improving the graduation rate to meet or exceed 90% by maintaining a School Improvement Team who investigated and incorporated the following actions:
● Implemented a universal Relearn/Reassess policy at LCHS.
● Implemented a flexible learning block that was embedded throughout the
instructional day which had a positive impact on student learning and
achievement.
● Supported teacher practice by providing collaboration, professional learning,
and ongoing feedback throughout the year.
● Closely monitored course completion rates for each reporting period and
engaged in discussions with staff to understand the ‘why’ behind the number.
● Interacted with the Ministry division student list to help monitor student
achievement.
● Created a data wall (spreadsheet) for students who were on track (Green), or
at risk (Yellow or Red) to help monitor student achievement as it related to
credits and graduation. (Specifically, in the first semester to ensure that
students in grade 10, 11, and 12 were achieving 8 or more credits.)
● Explored alternative strategies for credit accumulation towards high school
graduation and post‐secondary credit such as dual credits, special projects,
and offered a new course, Intro to Service Rigs.
● Added an instructional administrator at the school level to support the
actualization of the three focus areas of My Students First Classroom.
Lloydminster Public SD Board of Education Annual Report – 2017‐18 – Page 22
LCHS supported the ‘on time’ graduation rate for FNMI students at LCHS to meet or
exceed 75% through the following actions:
● Monitored course completion rates for the FNMI cohort each reporting period.
● Created a data wall (spreadsheet) for the FNMI cohort who were on track
(Green), or at risk (Yellow or Red) as a means to help monitor student
achievement as it related to credits and graduation.
● Built upon the connections with Elders in the community.
● Continued to offer the LCHS FNMI Soar Mentorship Program.
● Implemented an FNMI Grad Coach initiative at LCHS which included engaging
in a process that defined the grad coach role and focus areas of the program.
● Support was given to the LCHS FNMI cohort to explore and apply to post‐
secondary institutions.
● Built staff capacity and FNMI understanding by engaging in professional
development opportunities.
● Implemented new strategies that allowed students to have an increased
connection to the school. Some of the examples included:
○ recognizing and building residential school awareness and its impact on
First Nations peoples
○ Increasing awareness for all students regarding diversity.
● LCHS had a representative on a LPSD FNMI Education committee.
LCHS supported the goal to increase the percentage of LCHS students that indicated
they had moderate to high levels of anxiety from the Our School survey to match the
national average (18%) though the following actions:
● Implemented new strategies to build an increased connection to the school and peers. One example included ensuring that the intramural program was not only reaching kids but also incorporating a mentorship program.
● Increased the awareness for all students regarding diversity.
● Continued to reach at risk students through increasing the frequency for the Anxiety group to meet.
● Explored introducing a course on Mental Health and Well Being for credit.
● Introduced a flexible learning block embedded throughout the day to increase the hope and aspirations towards credit accumulation, graduation, and to assist the students to find balance in their lives.
● Ensured that LCHS is created an environment where kids could exhibit resiliency by utilizing the relearn/reassess policy.
● Displayed the Our School data and responses to the student‐parent voice in the hallway. Shared teacher voice with staff.
● Explored proactive measures to increase student attendance and engagement.

Lloydminster Public SD Board of Education Annual Report – 2017‐18 – Page 23
LCHS supported the goal for LCHS students to meet or exceed a course completion
rate of 95% in their ELA and Math courses, as calculated by grade level, by the
following actions:
● Created and implemented a transition document as a resource for teachers
which outlined adaptations to increase the success rate of each student.
● Generated data on Teacher/subject course completion rates at each reporting
term and provided feedback to teachers for personal reflection and
professional learning.
● Prioritized having less English teachers at the grade 10 level when scheduling at
the end of the year. The goal was to create consistencies which were aligned to
the MSFC/Sask Reads teaching practices.
● Implemented the LCHS relearn/reassess policy in conjunction with the flexible
learning environment.
Measures for Graduation Rates
Grade 12 Graduation Rate: On‐Time (within 3 years)
To graduate within the typical three‐year period after beginning Grade 10, students must accumulate an average of eight credits per year to achieve the minimum requirement of 24 required secondary level credits at the end of Grade 12. On ‐time graduation rates are on measure of the efficiency of the school system. The following displays the percentage of students (all students, non‐FNMI and FNMI) in the school division who graduated within three years of entering Grade 10, along with provincial results in each of these categories.

Lloydminster Public SD Board of Education Annual Report – 2017‐18 – Page 24
Notes: On‐time graduation rates are calculated as the percentage of students who complete Grade 12 within 3 years of ‘starting’ Grade 10. Results for populations of fewer than 10 students have not been reported to avoid identifying individuals or very small groups of students (nr). FNMI students are those who choose to self‐identify as First Nations (Registered/Treaty/Status Indian, Non‐Status Indian), Métis, or Inuit/Inuk. Non‐FNMI students are those who do not identify as FNM or I, however, this category may include FNMI students who choose not to self‐identify. Source: Ministry of Education, 2018
Analysis of results
Over the past 9 years, Lloydminster Public School Division’s on‐time graduation rate for all students has been steadily increasing. This has been a celebration for staff and students. In 2008‐09 the on‐time graduation rates were 67% for all students and the results from the last two years were as follows: 2016‐17 and 2017‐18 were both 80%. Compared to the provincial on‐time graduation rate for all students, LPSD students are achieving graduation status at a slightly higher rate. Lloydminster Public School Division FNMI on‐time graduation rates have gradually increased over the past 9 years. The results in 2008‐09 were 23% and the results from the last two years were as follows: 2016‐17 (59%) and 2017‐18 (52%). The FNMI on‐time graduation rate for the 2017‐18 resulted in a decline to 52%. Compared to the FNMI

Lloydminster Public SD Board of Education Annual Report – 2017‐18 – Page 25
provincial on‐time graduation rate of 45%, LPSD FNMI students are achieving a slightly higher graduation rate. The division’s FNMI graduation rate has been consistently higher than the province’s FNMI graduation rate over the past nine years; however, a 32% graduation rate difference between FNMI and Non‐FNMI exists. This achievement gap is a concern. The school division will attend to further analysis of this data to investigate the decline.
Grade 12 Graduation Rate: Extended‐Time (within 5 years)
Some students need more time to complete all the courses necessary to graduate so they continue in school longer than the typical three years after beginning Grade 10. Extended‐time graduation rates are one measure of the responsiveness of the school system. The following displays the percentage of students (all students, non‐FNMI and FNMI) in the school division who graduated within five years of entering Grade 10, which includes those who graduated on‐time, along with provincial results in each of these categories.
Notes: Extended‐time graduation rates are calculated as the percentage of students who complete Grade 12 within 5 years of ‘starting’ Grade 10 (and include those who graduate on‐time). Results for populations of fewer than 10 students have not

Lloydminster Public SD Board of Education Annual Report – 2017‐18 – Page 26
been reported to avoid identifying individuals or very small groups of students (nr). FNMI students are those who choose to self‐identify as First Nations (Registered/Treaty/Status Indian, Non‐Status Indian), Métis, or Inuit/Inuk. Non‐FNMI students are those who do not identify as FNM or I, however, this category may include FNMI students who choose not to self‐identify. Source: Ministry of Education, 2018
Analysis of results
Extended‐time Graduation Rates for Non‐FNMI students for Lloydminster Public School Division have decreased slightly from 2016‐17 (94%) to 2017‐18 (92%). In 2017‐18 this rate is aligned to the provincial results (91%). Extended‐time Graduation Rates for FNMI students for Lloydminster Public School Division have decreased slightly from 2016‐17 (74%) to 2017‐18 (73%). The school division will attend to further analysis of this data to investigate the decline. Students are accessing school supports to attain a grade 12 education after a period of disengagement from school or at a slower pace that meets their personal situations. As a school division, we intend to further analyze students who are not attaining graduation standing within three years of grade 10 and implement ways of keeping these students connected with the school system.
Grade 9 to 10 Transition
The transition from Grades 9 to 10 can be difficult for some students for many different reasons, including not having reached all outcomes from each subject area in the elementary grades. This measure is intended to show how well Grade 9 students adjust in the transition to Grade 10. Achieving eight or more credits per year is important for steady progress towards graduating on‐time. The following displays the percentage of Grade 9 students (all students and the FNMI subpopulation) in the school division who achieved eight or more credits the following school year, along with provincial results for the past eight years and the eight year average.

Lloydminster Public SD Board of Education Annual Report – 2017‐18 – Page 27
Notes: Grade 9 to 10 transition rates are calculated as the number of students attaining eight or more credits in the year immediately following their Grade 9 year divided by the number of students in the Grade 9 cohort. Results for populations of fewer than five have not been reported to avoid identifying individuals or very small groups of students. FNMI students are those who choose to self‐identify as First Nations (Registered/Treaty/Status Indian, Non‐Status Indian), Métis, or Inuit/Inuk. Non‐FNMI students are those who do not identify as FNM or I, however, this category may include FNMI students who choose not to self‐identify. Source: Ministry of Education, 2018
Analysis of results
The percentage of the Grade 9 cohort achieving 8 or more credits the following school year for FNMI students has gradually increased over the past eight years; two positive spikes in the trend line are noted for the 2010/11 and 2013/14 Grade 9 cohorts. In 2017‐18, 51.6% of the 2016‐17 Grade 9 FNMI cohort students achieved 8 or more credits in Grade 10; these results are above the provincial results. The percentage of all students in the Grade 9 cohort achieving 8 or more credits in the following school year has gradually increased over the past 6 years, however in the last year has slightly declined. In 2017‐18, 87.5% of all the 2016‐17 Grade 9 cohort students in Lloydminster Public School Division achieved 8 or more credits in Grade 10; this was a slight decline from the previous school year but still exceeds the provincial results. Lloydminster Public School Division is proud of the achievement of the Grade 9 cohort students transitioning to Grade 10 and these results indicate that transition practices are working well as students move from Grade 9 to Grade 10. As a school division, the achievement gap between all students and FNMI students is a concern; LPSD intends to analyze this further.
Lloydminster Public SD Board of Education Annual Report – 2017‐18 – Page 28
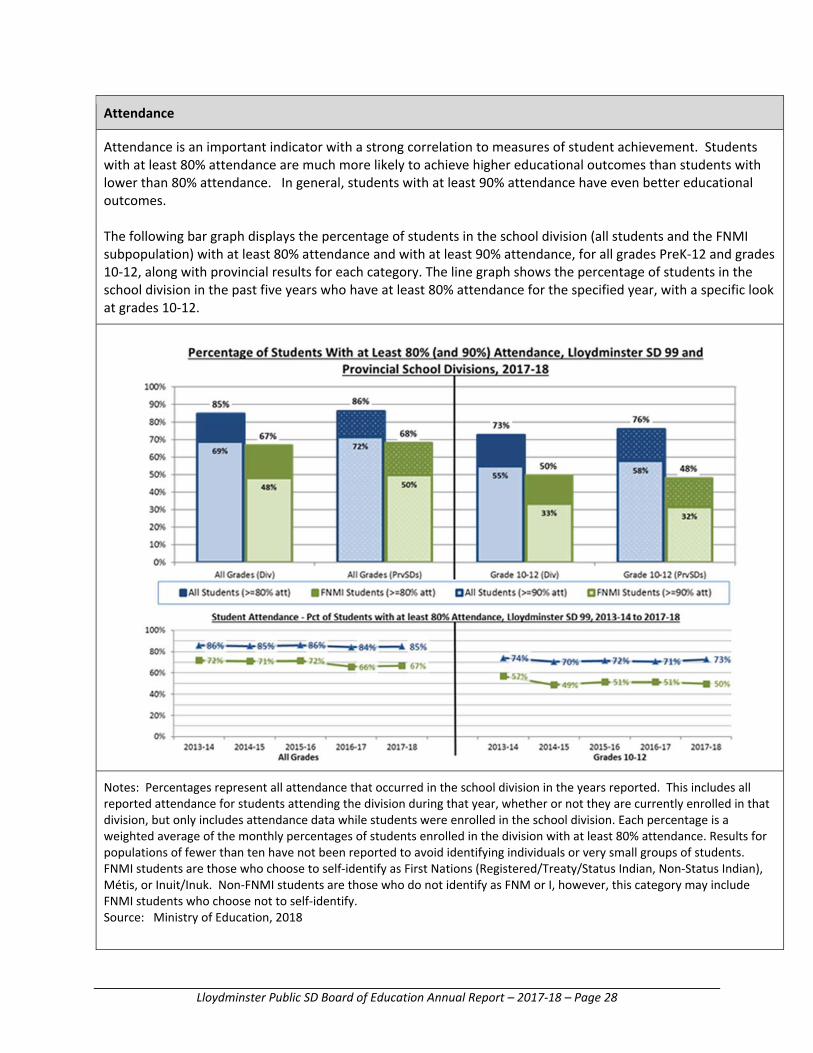
Attendance
Attendance is an important indicator with a strong correlation to measures of student achievement. Students with at least 80% attendance are much more likely to achieve higher educational outcomes than students with lower than 80% attendance. In general, students with at least 90% attendance have even better educational outcomes. The following bar graph displays the percentage of students in the school division (all students and the FNMI subpopulation) with at least 80% attendance and with at least 90% attendance, for all grades PreK‐12 and grades 10‐12, along with provincial results for each category. The line graph shows the percentage of students in the school division in the past five years who have at least 80% attendance for the specified year, with a specific look at grades 10‐12.
Notes: Percentages represent all attendance that occurred in the school division in the years reported. This includes all reported attendance for students attending the division during that year, whether or not they are currently enrolled in that division, but only includes attendance data while students were enrolled in the school division. Each percentage is a weighted average of the monthly percentages of students enrolled in the division with at least 80% attendance. Results for populations of fewer than ten have not been reported to avoid identifying individuals or very small groups of students. FNMI students are those who choose to self‐identify as First Nations (Registered/Treaty/Status Indian, Non‐Status Indian), Métis, or Inuit/Inuk. Non‐FNMI students are those who do not identify as FNM or I, however, this category may include FNMI students who choose not to self‐identify. Source: Ministry of Education, 2018

Lloydminster Public SD Board of Education Annual Report – 2017‐18 – Page 29
Analysis of results
The percentage of the students of all grades with at least 80% attendance rate has relatively remained the same in the last 4 years. The significant gap between all students (85%) and the FNMI (67%) population is a concern; LPSD intends to analyze this further. The percentage of students of grades 10 ‐12 with at least 80% attendance rate has relatively remained the same in the last 4 years for all students. As a school division, the achievement gap between all students (73%) and FNMI (50%) students is a concern; LPSD intends to analyze this further. In all accounts, as a school division, the percentage of students with at least 80% attendance rate are lower than the provincial rates; ongoing strategies will be explored to improve the overall rates.

Lloydminster Public SD Board of Education Annual Report – 2017‐18 – Page 30
Early Years ESSP Outcome: By June 30, 2020, children aged 0‐6 years will be supported in their development to ensure that 90% of students exiting Kindergarten are ready for learning in the primary grades. ESSP Improvement Targets: ● By June 2018, 75% of Prekindergarten educators will have completed Responding to Children's Interests
(SPDU) workshop and 75% of Kindergarten educators will have completed Literacy Practices in Kindergarten
School division goals aligned with the Early Years outcome
By June 2020, children aged 0‐6 years will be supported in their development to ensure that 90% of students exiting Kindergarten are ready for learning in the primary grades. By June 2018, 80% of Kindergarten educators will have completed Responding to Children’s Interests (SPDU and Literacy Practices in Kindergarten.
● We surpassed our goal for Kindergarten teachers completing SPDU p.d. at 87%. ● We missed our goal of 90% of students exiting Kindergarten who are ready for
learning by 3.5%. (86.5%)
School division actions taken during the 2017‐18 school year to achieve the outcomes and targets of the Early Years outcome
Supported appropriate use of EYE results. ● Provided EYE data reports and resources from Ministry to school administration
and teachers ● Implemented Ministry‐developed resource of developmentally appropriate
practices into Early Learning programs and Kindergarten. ● Enhanced teachers’ use of holistic resources to meet children’s needs based on
quantitative EYE data Supported the enhancement of early childhood teaching practices through formal and informal professional development opportunities.
● Examined and identified local professional development opportunities, resources, and supports for teachers to enhance early childhood pedagogy
Aligned LPSD practices with Ministry standards. ● Continued to Implement Current Early Years Walk‐Through Document.
Explored effective practices for family engagement in Early Learning programs and
Kindergarten.
● Implemented effective family engagement practices in Early Learning programs
and Kindergarten.
● Ensured schools were aware of Early Years students who are in their
attendance area, from LPSD programs.
● Schools developed a plan to engage students/families currently in LPSD Early
Years Programs, who are in their attendance area.
Continued to work with partner agencies to promote early learning. ● Enhanced partner agency knowledge and understanding of Ministry Pre‐
Kindergarten goals and criteria. ● Continued to have collaborative partnerships with partner agencies to identify
vulnerable children. ● Developed a process to share school division EYE data with community/partner
stakeholders.

Lloydminster Public SD Board of Education Annual Report – 2017‐18 – Page 31
Measures for Early Years
Early Years Evaluation
The Early Years Evaluation‐Teacher Assessment (EYE‐TA) is a readiness screening tool that provides information about each child’s development and learning with a focus on reading readiness skills. Results from the EYE‐TA allow educators and school‐based interdisciplinary teams to quickly identify children most likely to require extra support during the Kindergarten year, based on their levels of skill development in five key domains at school entry. In addition to results for specific domains, children are also assigned a comprehensive score known as a Responsive Tiered Instruction (RTI) level. RTI is a preventative approach that allows educators, school teams and divisions to allocate resources early and continuously, rather than waiting until after children have experienced failure before responding. The following displays the percentage of children (all children, non‐FNMI and FNMI) in the division assessed as Tier I at Kindergarten entry and after the Kindergarten year at exit, for the 2014‐15 (baseline) year and the three years following, as well as the provincial results for each category.
Readiness for school: children screened at Tier I (%) on Early Years Evaluation – Teacher Assessment
(EYE‐TA) at Kindergarten entry & exit, 2014‐15 (baseline) through to 2017‐18 (current)
Lloydminster Public SD 99

Lloydminster Public SD Board of Education Annual Report – 2017‐18 – Page 32
Saskatchewan (all divisions)
All Tier I children at K entry / exit (%)
FNMI Tier I children at K entry / exit (%)
Non‐FNMI Tier I children at K entry / exit (%)
Notes: Research shows early identification followed by a responsive, tiered approach to instruction from Kindergarten to Grade 3 can substantially reduce the prevalence of reading challenges. The primary role of EYE is to help inform educational practice. EYE screening at Kindergarten entry is used by classroom teachers and school divisions to identify children who experience difficulties with important skills when they arrive in Kindergarten, and who may need closer monitoring or further assessment during the year. Children who have difficulty with important skills at Kindergarten entry are also re‐assessed before the end of the Kindergarten year, allowing school divisions to measure the impact of their supports and responses. Children assigned Tier I RTIs are able to complete developmental tasks without difficulty. These children have a high probability of reading at grade level by Grade 3 ‐ an important predictor of school success, including Grade 12 graduation. The format of EYE‐TA results reported previously in school division annual reports varies from the format used here. Prior to 2016‐17, displays showed percentage results for all RTI Tiers at Kindergarten entry and exit of the assessment year. The amended displays now show only the percentage of children assessed as Tier I at Kindergarten entry and after the Kindergarten year at exit. In addition, school division EYE‐TA displays also now show results for self‐declared First Nations (Registered/Treaty/Status Indian, Non‐Status Indian), Métis, or Inuit/Inuk children (FNMI), and for those who do not identify as FNMI (non‐FNMI), provided both comparison groups consist of a minimum of 10 children. It should be noted that the non‐FNMI group may include FNMI students who choose not to self‐identify. Source: Ministry of Education, Early Years Branch, 2018

Lloydminster Public SD Board of Education Annual Report – 2017‐18 – Page 33
Analysis of results
Trends:
● Year after year (2015 to 2018) we see an approximate increase of 20 percentage points at Tier 1 from kindergarten entry to exit in all categories for LPSD. This means that about 50 students move into the Tier 1 category during kindergarten and are ready to learn in Grade 1
● LPSD has overall results that are higher than the province at exit (87% in 2017‐18 compared to 79%), and yearly percentage point gains for the province have been slightly less (22 in 2017‐18 compared to 23 in LPSD).
● In 2014‐15, EYE‐TA results for LPSD went from 64% of children in Tier 1 at Kindergarten entry (Fall) to 88% at Kindergarten exit (Spring), showing an increase of 24 percentage points of children achieving developmental tasks. Provincial data shows an increase from 57% of children at Tier 1 at Kindergarten entry to 79% at Tier 1 at Kindergarten exit. Provincial data shows an increase of 22 percentage points, a similar increase over the year.
● 2015‐16 EYE data for LPSD shows 63% of children at Tier 1 at Kindergarten entry compared with provincial data of 59% of children at Tier 1. At Kindergarten exit, 82% of children in LPSD were at Tier 1, showing an increase of 19 percentage points over the year. Provincial data at Kindergarten exit shows 80% of children at Tier 1, to an increase across the province of 21 percentage points.
● 2016‐17 EYE‐TA results for LPSD went from 69% in the Fall (Province 58%) to 85% in the Spring (Province
80%) for an overall increase of 16 percentage points.
● 2017‐18 EYE‐TA results for LPSD went from 64% overall in the Fall (Province 57%) to 87% in the Spring
(Province 79%) for an overall increase of 23 percent as opposed to the province at 22 percent.
● LPSD FNMI students went up 26% during the 2017‐18 school year. If we look at the three‐year trend, our FNMI students go up an average of 23%. When we compare this to the province, FNMI students went up 25% during the 2017‐18 school year with a three‐year average of 26%. When we compare this to our Non‐FNMI students, we see that for LPSD in 2017‐18, students went up 22% with a three‐year average of 19% as compared to the province Non‐FNMI students who showed 22% growth for the 2017‐18 school year with a three‐year average of 21%.
Results LPSD is proud of:
● The formation of the Early Years Community of Practice provided six opportunities for Prekindergarten and Kindergarten Teachers to meet, share resources and best practices, and to explore Ministry documents.
● While the Early Years Community of Practice meetings were held after school hours and were
voluntary, each meeting had an attendance rate of over 90% of Early Years Teachers.
● The Early Years Walkthrough document was utilized twice a year with the focus being on teacher practice. These documents provided opportunities for teachers to reflect on practice and develop professional goals with their administration.
● LPSD established a Junior Kindergarten program for 4 year olds as a way to reach more of our youth. Areas of Concern:
● LPSD continues to have a large wait list for Prekindergarten. ● The community is experiencing an economic downturn. This has increased the number of children
coming to our schools from vulnerable situations.
Lloydminster Public SD Board of Education Annual Report – 2017‐18 – Page 34
● The community has a large EAL (English as an Additional Language) population and refugee families. ● When looking at our Division attendance report we fall below the provincial average in our Kindergarten
programs (even though transportation is provided).
● Our FNMI children enter kindergarten with a much smaller proportion at Tier 1 (41% compared to 68%
of Non‐FNMI children in 2017‐18).
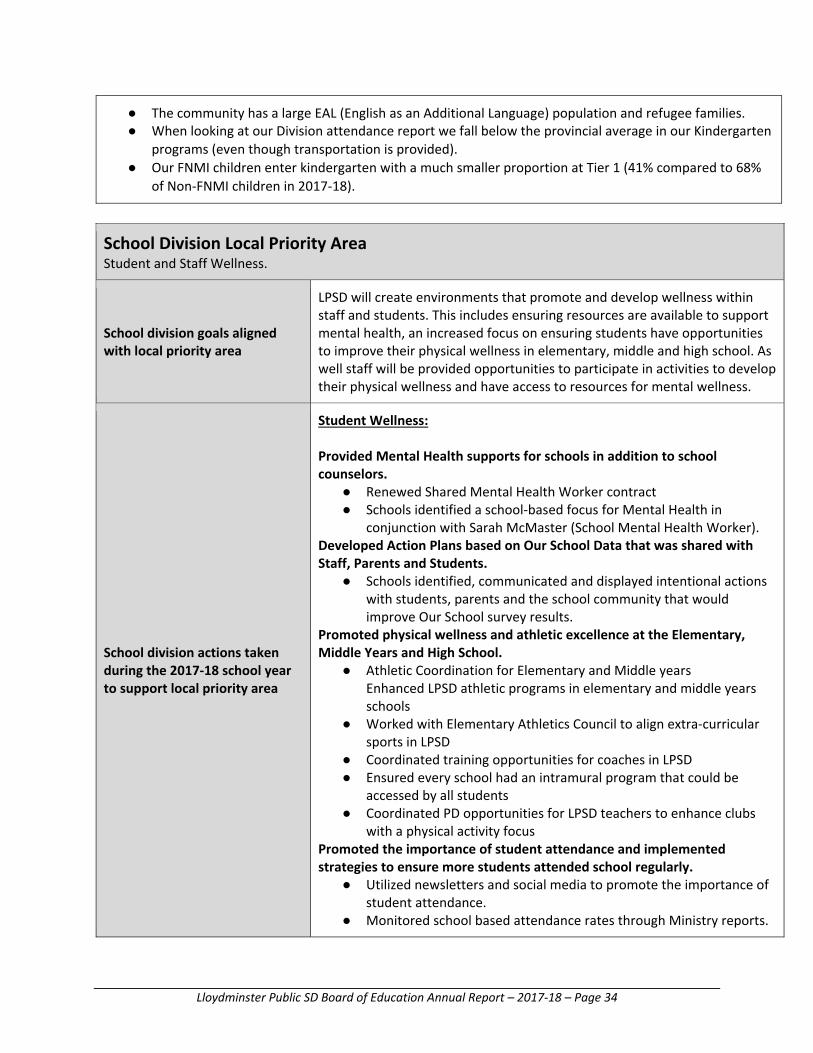
School Division Local Priority Area Student and Staff Wellness.
School division goals aligned with local priority area
LPSD will create environments that promote and develop wellness within staff and students. This includes ensuring resources are available to support mental health, an increased focus on ensuring students have opportunities to improve their physical wellness in elementary, middle and high school. As well staff will be provided opportunities to participate in activities to develop their physical wellness and have access to resources for mental wellness.
School division actions taken during the 2017‐18 school year to support local priority area
Student Wellness: Provided Mental Health supports for schools in addition to school counselors.
● Renewed Shared Mental Health Worker contract ● Schools identified a school‐based focus for Mental Health in
conjunction with Sarah McMaster (School Mental Health Worker). Developed Action Plans based on Our School Data that was shared with Staff, Parents and Students.
● Schools identified, communicated and displayed intentional actions with students, parents and the school community that would improve Our School survey results.
Promoted physical wellness and athletic excellence at the Elementary, Middle Years and High School.
● Athletic Coordination for Elementary and Middle years Enhanced LPSD athletic programs in elementary and middle years schools
● Worked with Elementary Athletics Council to align extra‐curricular sports in LPSD
● Coordinated training opportunities for coaches in LPSD ● Ensured every school had an intramural program that could be
accessed by all students ● Coordinated PD opportunities for LPSD teachers to enhance clubs
with a physical activity focus Promoted the importance of student attendance and implemented strategies to ensure more students attended school regularly.
● Utilized newsletters and social media to promote the importance of student attendance.
● Monitored school based attendance rates through Ministry reports.

Lloydminster Public SD Board of Education Annual Report – 2017‐18 – Page 35
● Ensured that protocols and procedures which address barriers to attendance were followed.
● Researched strategies and developed procedures to incentivize student attendance
Developed and promoted system wide, community based activities that promote physical activity.
● LPSD Fun Run ● Lloydminster Triathlon
Promoted best practice in school based nutrition. ● Renewal of LPSD Nutrition Administrative Procedure ● Implemented new standards as outlined within the LPSD Nutrition
Administrative Procedure Staff Wellness: Promoted and fostered an environment that improved wellness and staff engagement.
● Developed and distributed a monthly Wellness Newsletter that promoted Mental and Physical Health strategies including the Resilience program from Manulife
● Developed physical wellness challenges for LPSD staff to participate in
● Gathered baseline data on Staff Engagement and developed Engagement Improvement Plans in August 2018
Enhance working environments to improve staff wellness ● Increased availability of healthy food options for LPSD staff
attending Division events ● Provided ergonomic options for staff required to sit for the majority
of their work day Provided personal and professional development in wellness, resilience and mental health
● Integrated strengths into Professional Growth Plan processes ● Provided the Strengths Discovery Day training through Leadership
Academy ● Delivered Strengths Discovery Day training through Division PD Days ● Provided Leadership training opportunities for LPSD leaders in
Strengths and Engagement.

Lloydminster Public SD Board of Education Annual Report – 2017‐18 – Page 36
Local Measures for Student and Staff Wellness Priority
1. Individual school Our School Survey Results and School Improvement Plan Goal
Our School Survey April 2018 Results:
Participation
In Sports
Sense of
Belonging
Anxiety/Depression Advocacy
at School
Positive
Teacher Student Relationships
Canadian
Norm
Elementary
n/a 86% 16% 49% 79%
LPSD
Elementary
Schools
n/a 78% 25% 63% 84%
Canadian
Norm Gr. 7‐9
48% 71% 18%/18% 27% 76%
LPSD Schools
Gr. 7‐9
52% 64% 24%/24% 31% 77%
Canadian
Norm Gr.
1012
48% 71% 18%/18% 27% 76%
LPSD Gr. 10‐
12
35% 61% 24%/25% 32% 77%
2. Anecdotal data on impact of Mental Health Workera. Success stories of the impact of the Mental Health Workerb. School administration and counselors completed a survey to identify the impact the Mental HealthWorker had on their school community.
3. Number of students participating in extracurricular programs and activities (after school sports, intramurals, InMotion Program, LPSD Fun Run)4. Analysis of number of staff participating in physical challenges and reading the Wellness Newsletter.5. Number of schools that created displays showing what they have done with their Our School survey data.

Lloydminster Public SD Board of Education Annual Report – 2017‐18 – Page 37
Analysis of results
Trends ● More and more students are looking to the school for adult connectedness and a sense of belonging.
Schools are being creative and flexible to build connections with students. Elementary students report no change in sense of belonging from 2017 to 2018 staying at 78% (compared to the Canadian norm at 86% in 2018) At the Middle School level, we saw decline from 2017 to 2018 from 67% to 64% (Canadian norm 71% in 2018). High school students went from 60% in 2017 to 61% in 2018 (Canadian norm 71% in 2017).
● Teachers are feeling the pressures and challenges of working with students who have mental health concerns. They are also experiencing more mental health concerns themselves. Positive student‐teacher relationships (Elementary 2017 ‐ 85%, 2018 ‐ 84% Canadian norm 2018 ‐ 79%) (Middle years 2017 ‐ 62%, 2018 ‐ 77% Canadian norm 76%) (High school 2017 ‐ 63%, 2018 ‐ 77% Canadian norm ‐76%) The implementation of My Student First Classroom (MSFC) would have appeared to have a positive result on this data.
● Schools are having to expand the variety and times of extra‐curricular opportunities to meet the vast student interests and needs. At the Middle School level, we saw a decline from 2017 at 59% to 2018 at 52% (Canadian norm 48% in 2018). At the High School level students went from 36% in 2017 to 35% in 2018 (Canadian norm 48% in 2018).
● Participation in sports at the high school level is slightly decreasing. ● Counseling referrals remained high and are trending upward. Many of these referrals are beyond the
scope of school counselors and require significant support and deal with anxiety and depression in elementary, middle and high school. Anxiety and Depression reports have increased from 22% in 2017 to 25% in 2018 for elementary (Canadian Norm being 16%). The Anxiety level for the Middle School remained the same between 2017 and 2018 (24%) however the depression increased from 21% to 24% for this grade group (Canadian Norm of 18%/18%). The high school reported to have decreased in anxiety between 2017 and 2018 (from 25% to 24%), however, the depression increased from 2017 and 2018 (from 22% to 25%) with the Canadian norm of 18%/18%. We will continue to work with community partners so that students receive the help they need.
● No cost/low cost activities remain popular with students and families. ● Staff are willing to participate in a variety of physical wellness options.
Results We Are Proud Of
● The Mental Health Worker has been a valuable resource for schools and families. This resource has: ○ Built capacity with our teaching staff ○ Provided support for students with severe mental health concerns to access service in a
predictable and expedited way ○ A strong connection for school counsellors to Mental Health and Addictions (Saskatchewan
Health) ● Schools are being intentional about the structures and supports they are putting in place to support
students and build resiliency ● Schools are ensuring students and parents know what they have targeted as a result of the Our School
survey Results ● School staffs are identifying and targeting at risk students in order to ensure better connection for
these students in schools ● School extra‐curricular opportunities are expanding.

Lloydminster Public SD Board of Education Annual Report – 2017‐18 – Page 38
● School athletic programs are now more aligned and provide more involvement opportunities for students
● The LPSD Fun Run had over 900 participants (students and parents) ● Teachers are starting to build knowledge about how to support students with mental health
challenges in the classroom and how to access supports for their own needs, as well. ● LPSD has built strong partnerships in the community in the area of Mental Health. This includes
medical professionals, RCMP, and other community organizations. ● Schools are building positive teacher‐student relationships.
Staff Wellness:
● Many staff participating in physical challenges ● Staffs making healthy food choices when it comes to lunches ● A new Staff Wellness Newsletter has been created ● School Admin are learning about their “Strengths” and using this knowledge to become more effective
leaders ● All staff now have access to a new, comprehensive employee assistance plan
Areas of Concern:
● Students are coming to our schools with high levels of need in the areas of mental health (anxiety, depression, self‐ harm behaviours, etc.). We are seeing this in younger and younger students.
● Schools need continued community resource support to help families and children access the appropriate services.
● There are longer wait times for students and families to receive outside services especially in the areas of mental health and addictions counselling, and psychiatry.
New Needs:
● Staff mental and physical wellness continues to be something LPSD has identified as requiring attention and focus. This has been connected to staff engagement and job satisfaction.
● An increased focus on student physical wellness including nutrition and activity levels. ● Initiatives and education for teachers, parents and students around attendance.
Lloydminster Public SD Board of Education Annual Report – 2017‐18 – Page 39
Demographics
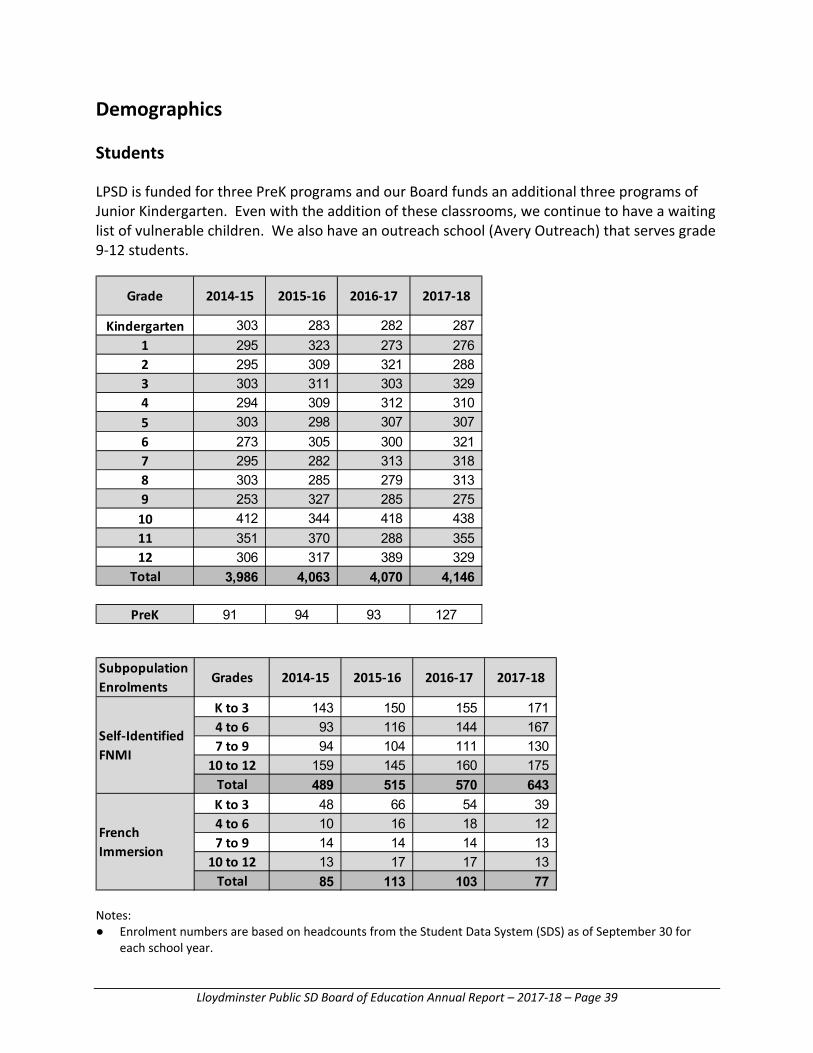
Students
LPSD is funded for three PreK programs and our Board funds an additional three programs of Junior Kindergarten. Even with the addition of these classrooms, we continue to have a waiting list of vulnerable children. We also have an outreach school (Avery Outreach) that serves grade 9‐12 students.
Notes: ● Enrolment numbers are based on headcounts from the Student Data System (SDS) as of September 30 for
each school year.
Kindergarten 303 283 282 287
1 295 323 273 276
2 295 309 321 288
3 303 311 303 329
4 294 309 312 310
5 303 298 307 307
6 273 305 300 321
7 295 282 313 318
8 303 285 279 313
9 253 327 285 275
10 412 344 418 438
11 351 370 288 355
12 306 317 389 329
Total 3,986 4,063 4,070 4,146
PreK 91 94 93 127
Grade 2014‐15 2015‐16 2016‐17 2017‐18
K to 3 143 150 155 171
4 to 6 93 116 144 167
7 to 9 94 104 111 130
10 to 12 159 145 160 175
Total 489 515 570 643
K to 3 48 66 54 39
4 to 6 10 16 18 12
7 to 9 14 14 14 13
10 to 12 13 17 17 13
Total 85 113 103 77
Subpopulation
EnrolmentsGrades 2014‐15 2015‐16 2017‐18
Self‐Identified
FNMI
French
Immersion
2016‐17
Lloydminster Public SD Board of Education Annual Report – 2017‐18 – Page 40
● Enrolments includes all residency types, all ages, home‐based and home‐bound students, with the exceptionof English as an Additional Language (EAL) enrolments, which exclude non‐Saskatchewan residents, students22 years and older, and home‐based students.
● PreK enrolments are the 3‐ and 4‐year‐old enrolments in the Student Data System (SDS) which includes thosechildren who occupy the ministry designated PreK spaces and those in other school division operated PreK orpreschool programs.
Source: Ministry of Education, 2017
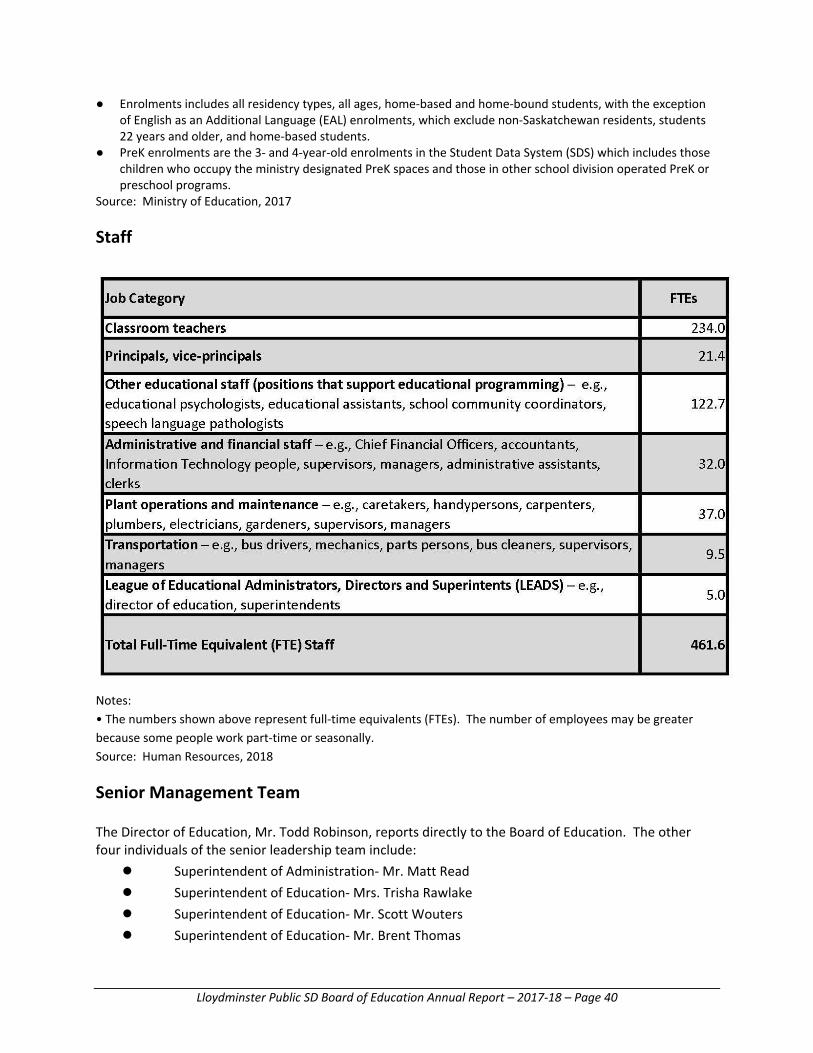
Staff
Notes:
• The numbers shown above represent full‐time equivalents (FTEs). The number of employees may be greater
because some people work part‐time or seasonally.
Source: Human Resources, 2018
Senior Management Team
The Director of Education, Mr. Todd Robinson, reports directly to the Board of Education. The other four individuals of the senior leadership team include:
● Superintendent of Administration‐ Mr. Matt Read
● Superintendent of Education‐ Mrs. Trisha Rawlake
● Superintendent of Education‐ Mr. Scott Wouters
● Superintendent of Education‐ Mr. Brent Thomas
Lloydminster Public SD Board of Education Annual Report – 2017‐18 – Page 41
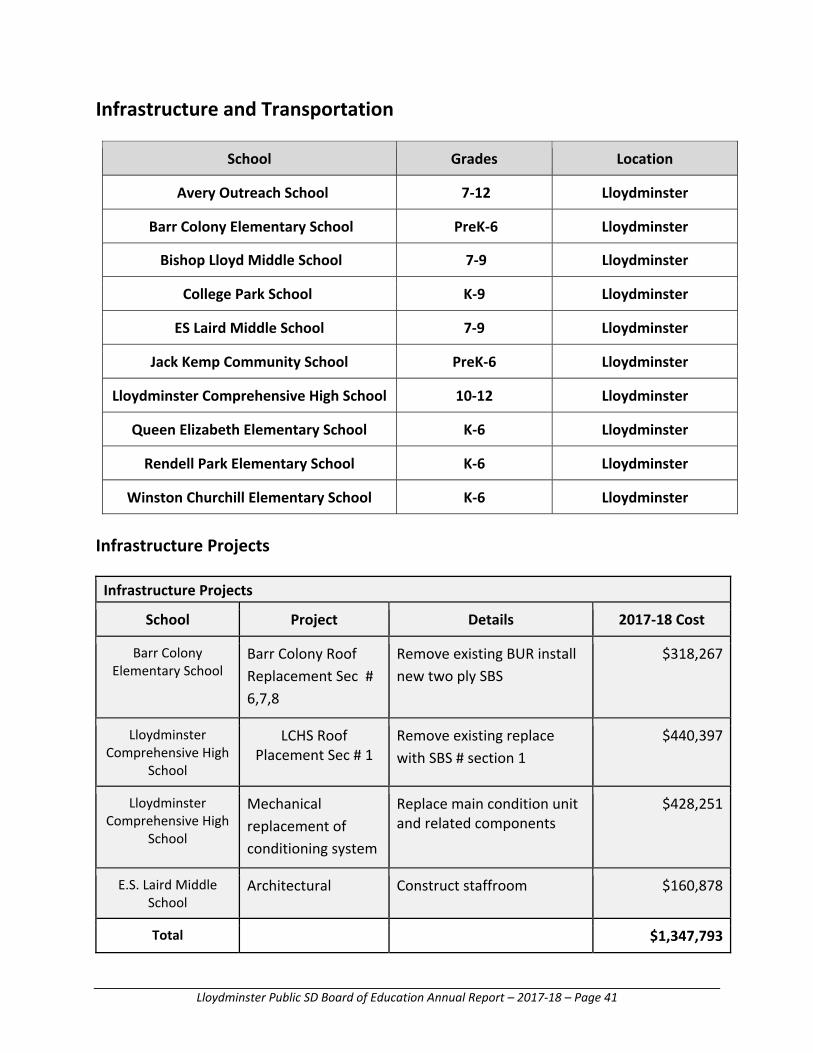
Infrastructure and Transportation
School Grades Location
Avery Outreach School 7‐12 Lloydminster
Barr Colony Elementary School PreK‐6 Lloydminster
Bishop Lloyd Middle School 7‐9 Lloydminster
College Park School K‐9 Lloydminster
ES Laird Middle School 7‐9 Lloydminster
Jack Kemp Community School PreK‐6 Lloydminster
Lloydminster Comprehensive High School 10‐12 Lloydminster
Queen Elizabeth Elementary School K‐6 Lloydminster
Rendell Park Elementary School K‐6 Lloydminster
Winston Churchill Elementary School K‐6 Lloydminster
Infrastructure Projects
Infrastructure Projects
School Project Details 2017‐18 Cost
Barr Colony Elementary School
Barr Colony Roof
Replacement Sec #
6,7,8
Remove existing BUR install
new two ply SBS
$318,267
Lloydminster Comprehensive High
School
LCHS Roof Placement Sec # 1
Remove existing replace
with SBS # section 1
$440,397
Lloydminster Comprehensive High
School
Mechanical
replacement of
conditioning system
Replace main condition unit and related components
$428,251
E.S. Laird Middle School
Architectural Construct staffroom $160,878
Total $1,347,793

Lloydminster Public SD Board of Education Annual Report – 2017‐18 – Page 42
Transportation
Lloydminster Public School Division owns and operates 21 buses. We run 14 three tier routes and 1 one tier route on a daily basis and 6 Pre‐kindergarten routes Monday to Thursday. Agreements are in place with Northwest School Division(SK) and Buffalo Trails School Division(AB) to provide busing services to eligible rural students attending school in Lloydminster. * Lloydminster Public School Division also has an agreement with the local Handi‐van to transport students with special needs who are unable to ride a regular bus due to their disability.
Lloydminster Public School Division provides transportation services for eligible students within Lloydminster City limits to their designated school based on the following distances:
∙ Pre‐kindergarten door to door service to the designated school;
∙ K to Grade 6 if they reside 0.6 km or more from their designated school;
∙ Grades 7 – 9 if they reside 0.9 km or more from their designated school;
∙ Grades 10 ‐12 if they reside 1.5 km or more from their designated school.
*Statistics below do not include numbers or cost from rural students.
Transportation Statistics
Students transported 1400
Transportation routes 13 – 3 tier 1‐1 tier 6 Pre K
Number of buses 21
Daily kilometers traveled 717.6
Average age of bus (excluding spares) 10.25 years
Capacity utilized on buses 57 %
Average one‐way ride time 7.75 min
Longest one‐way ride time 21 min
Cost per student per year $720.49
Cost per kilometer traveled $7.68
Lloydminster Public SD Board of Education Annual Report – 2017-18 – Page 43
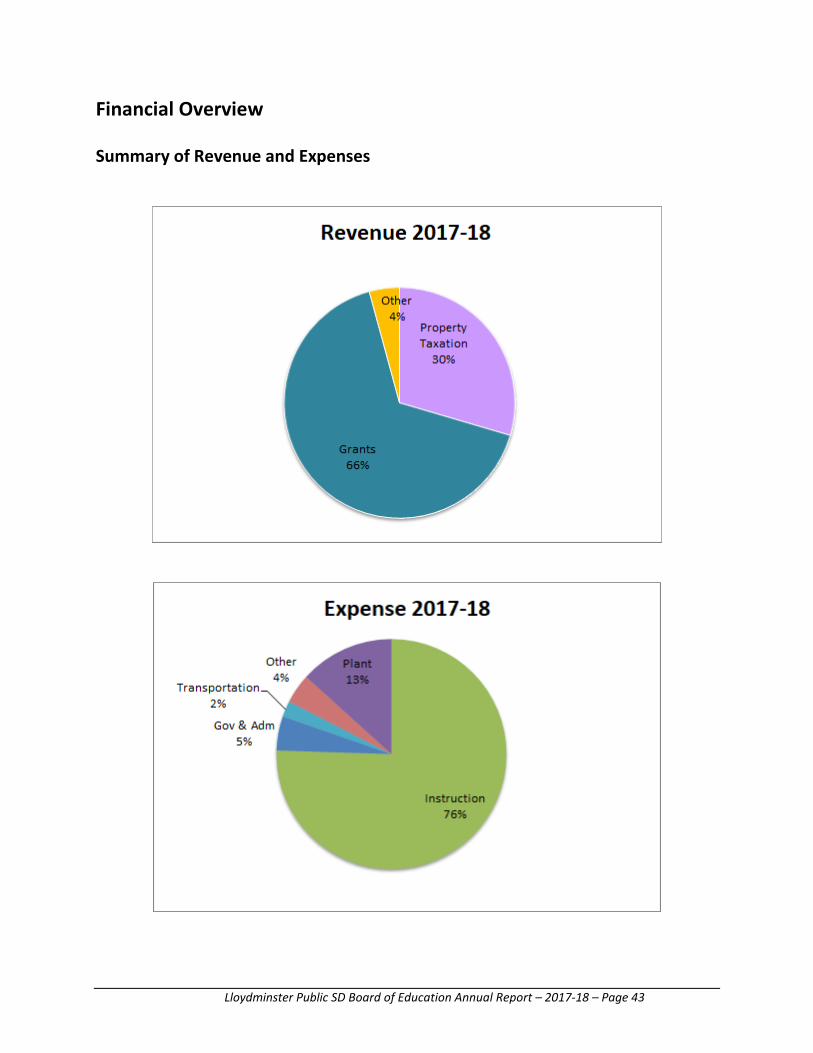
Financial Overview
Summary of Revenue and Expenses
Lloydminster Public SD Board of Education Annual Report – 2017-18 – Page 44
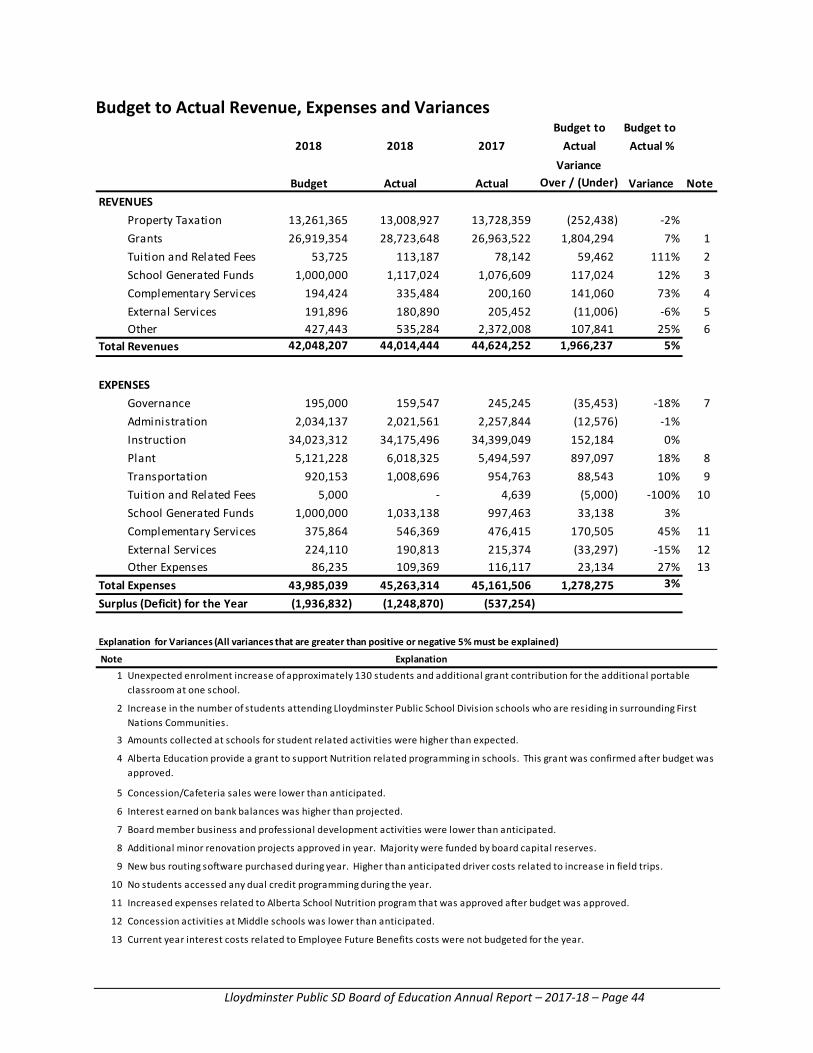
Budget to Actual Revenue, Expenses and Variances Budget to Budget to
2018 2018 2017 Actual Actual %Variance
Over / (Under)
Property Taxation 13,261,365 13,008,927 13,728,359 (252,438) -2%Grants 26,919,354 28,723,648 26,963,522 1,804,294 7% 1 Tuition and Related Fees 53,725 113,187 78,142 59,462 111% 2 School Generated Funds 1,000,000 1,117,024 1,076,609 117,024 12% 3 Complementary Services 194,424 335,484 200,160 141,060 73% 4 External Services 191,896 180,890 205,452 (11,006) -6% 5 Other 427,443 535,284 2,372,008 107,841 25% 6
42,048,207 44,014,444 44,624,252 1,966,237 5%
Governance 195,000 159,547 245,245 (35,453) -18% 7 Administration 2,034,137 2,021,561 2,257,844 (12,576) -1%Instruction 34,023,312 34,175,496 34,399,049 152,184 0%Plant 5,121,228 6,018,325 5,494,597 897,097 18% 8 Transportation 920,153 1,008,696 954,763 88,543 10% 9 Tuition and Related Fees 5,000 - 4,639 (5,000) -100% 10 School Generated Funds 1,000,000 1,033,138 997,463 33,138 3%Complementary Services 375,864 546,369 476,415 170,505 45% 11 External Services 224,110 190,813 215,374 (33,297) -15% 12 Other Expenses 86,235 109,369 116,117 23,134 27% 13
43,985,039 45,263,314 45,161,506 1,278,275 3%
(1,936,832) (1,248,870) (537,254)
Note1
2
3
4
5
6
7
8
9
10
11
12
13
Concession/Cafeteria sales were lower than anticipated.
Interest earned on bank balances was higher than projected.
Board member business and professional development activities were lower than anticipated.
Alberta Education provide a grant to support Nutrition related programming in schools. This grant was confirmed after budget was approved.
Additional minor renovation projects approved in year. Majority were funded by board capital reserves.
New bus routing software purchased during year. Higher than anticipated driver costs related to increase in field trips.
No students accessed any dual credit programming during the year.
Increased expenses related to Alberta School Nutrition program that was approved after budget was approved.
Concession activities at Middle schools was lower than anticipated.
Current year interest costs related to Employee Future Benefits costs were not budgeted for the year.
Explanation for Variances (All variances that are greater than positive or negative 5% must be explained)
ExplanationUnexpected enrolment increase of approximately 130 students and additional grant contribution for the additional portable classroom at one school.
Increase in the number of students attending Lloydminster Public School Division schools who are residing in surrounding First Nations Communities.
Amounts collected at schools for student related activities were higher than expected.
NoteREVENUES
Total Revenues
EXPENSES
Total Expenses
Actual Variance
Surplus (Deficit) for the Year
Budget Actual

Lloydminster Public SD Board of Education Annual Report – 2017-18 – Page 45
Appendix A – Payee List
Board Remuneration
Name Remuneration
Travel Professional Development
Other Total In
Province Out of
Province In
Province Out of
Province
Bloch-Hansen, Eric $5,312 $1,534 $ - $213 $ - $ - $7,059
Cornet, Cathy 5,346 1,534 - 983 - - 7,863
Gee, Chrissy 4,535 1,710 - 195 - - 6,440
Kennedy, Karoline** - 1,508 - 180 - - 1,688
Park, Allan 4,293 661 - 195 - - 5,149
Thompson, David* 8.368 2,001 - 211 - - 10,580
Wareham, Joy 3,415 218 - 58 - - 3,691
* Board Chair** Board Vice-Chair
Personal Services
Name Amount
ALLIN, FERN R 53,522
ANDERSON, ALVIN D 82,269
ANDERSON, JOANN C 77,425
APRIL, RACHELLE J 66,489
ARMSTRONG, DEREK B 82,383
ARMSTRONG, ERIN L 86,755
BABCOCK, DEBBIE A 53,233
BALL, JENNIFER L 86,294
BAUM, HYDEE K 86,418
BEAUCHESNE, VALERIE S 52,481
BECOTTE, SAMANTHA 83,670
BEHM, ELAINE A 69,206
BEHM, EMILY L 64,641
BERG, TRACY J 87,232
BLANCHETTE, LISA 81,801
BLOCK, DENISE L 88,553
BLOCK, REGINALD H 85,896
BLOXAM, COLE AJ 75,975
BLYTHE, CRAIG M 85,349

Lloydminster Public SD Board of Education Annual Report – 2017-18 – Page 46
BORN, BRENDA L 86,180
BOUCK, JACQUELINE R 109,474
BOUCK, KELSEY R. 63,532
BRAND, ELENA M 123,150
BREBBER, SCOTT A 79,766
BRINKLOW, NICOLE 67,406
BRITTON, KAYLIN 59,569
BROWN, BRENDA G 67,316
BROWN, DEBBIE 50,867
BROWN, JENSON K 84,132
BRUCE, DENAE 76,104
BRUMMUND, JODY A 75,670
BUCKNELL, PATRICIA 81,510
BUHNAI, CHRISTINE R 88,045
BURRAGE, NICOLE A 90,360
BURRELL, AMIE E 66,069
CANFIELD, AARON D 112,579
CARTER, ADAM R 68,421
CHARLESWORTH, SAMANTHA 78,525
CHOCAN, KAMMY 93,306
CHOCAN, SANDY K. 87,949
CHOCAN, TRINA L 85,896
CHRISTIE, TYLER G 86,865
CLARKSON, MALLORY A. 66,929
CLAXTON, KATHLEEN E 89,625
COISH, KRISTA L 86,058
COLLINS, JUDY M 55,481
COPELAND, TASIA R 69,882
COTE, KRISTON L 87,242
COULTER, SHAWN T 83,540
CROSSLEY, DANIELLE C 68,339
DANIELS, JESSICA T 63,338
DAVIES, CATHERINE A 91,962
DETCHON, SHERYL A 54,002
DETERS NOWOSAD, MICHELLE D 61,086
DIXON, TARA D 87,349
DMYTERKO, TERRANCE J 67,888
DONALD, SHAUN D 80,041
DOSDALL, TARA L 86,171
DUBE, MARIE CHANTELLE 61,222
DUNHAM, PAMELA R 76,181
DYER, AUSTIN L 84,329
ELFORD, THERESA C 62,587
ELLIOTT, TAMMY S 94,488
FINLAY, RANDY J 100,000
FLETCHER, RHAE L 68,442
FONTAINE, LUC G 78,605
FORBES, BRENDA L 61,429
FRASER, MARY A 121,247
FREESTON, LANELLE B 87,796
FRIESEN, TYSON 69,302
FULLER, NATASHA R 52,405
GALE, DEVIN G. 76,835
GALLAGHER, WILLIAM S 115,408

Lloydminster Public SD Board of Education Annual Report – 2017-18 – Page 47
GAREAU, LAURIE M 87,157
GAUTHIER, BERNARD B 123,996
GEORGE, LOIS A 68,734
GILCHRIST, KRISTEN A. 51,750
GOLDEN, BRENT M 86,180
GORDON, JOSIE K 115,832
GRANT, JAIME N 81,774
GRASSL, WAYNE D 76,165
GRATTON, CORY LP 91,214
GRIFFITH, ALAN G 86,211
GRILLANDINI, BRYAN MARK 92,532
GRINDLE, NATHAN 71,035
GROAT, SHIRLEY J 120,394
GROENINK, MARIE A 61,433
GUEST, BAILIE A.L. 56,581
GUSTAFSON, LORNE F 90,929
GUSTAFSON, MYRA A 66,419
HALLIDAY, LORALIE E. 91,401
HAMILTON, BRENT D 97,690
HAMILTON, DEBRA A 91,290
HANN, LEEANNE D. 68,831
HANSON, GINA L 87,369
HARBIN, CHANTAL T 64,493
HAREWOOD, LOUIS M 92,236
HARPER, AARON G. 69,860
HART, ELIZABETH L 79,583
HEINRICHS, ARRIN L 90,076
HICKMAN, CHARMAINE 69,869
HILL, CHARLENE A. 65,283
HIRON, AMY M 90,116
HOLTBY, CHERYL M 83,425
HOWLAND, LESLEY C 76,138
HURD, STEPHANIE N 85,896
HYLAND, DEREK A 77,833
HYLAND, LESLIE 55,915
HYSUIK, JARETT J. 61,056
INKSTER, DAYNA L.M. 66,391
JEFFERY, DWAYNE D 87,318
JEFFERY, POPPY L 91,214
JEWITT-MERRYWEATHER, JANINE J 86,493
JOHANNESSON, CHRISTINE 92,569
JONES, CHELLE L 89,887
JONES, KEVIN DA 90,076
KAPPEL, DEREK J 77,912
KARDAS, LYNN M 67,628
KELLY, JUSTIN T 94,289
KELLY, MINDY L 86,757
KENT, CHRISTINE I. E. 73,522
KETCHUM, LORELLIE 71,805
KETTLE, SARAH J 54,630
KING, GRAYDON F 99,937
KING, JOANNE M. 86,341
KING, MCKENZIE M. 65,485
KLAMOT, LUELLA A 86,516

Lloydminster Public SD Board of Education Annual Report – 2017-18 – Page 48
KLISOWSKY, STACEY L 115,811
KORN, LESLIE J 98,117
KORT, KEN G 86,228
KRAHN, CORNELIUS 96,369
KRAWCHUK PARCHOMA, KARLA 91,562
KRUCHKOWSKI, DEBORAH L 116,462
KVILL, CHARLENE D 66,041
KYLE, GLENYS S 52,342
LABONTE, KIMBERLY L 79,495
LAING, C. DAWN 86,180
LANE, KENDRA L 86,523
LARSON, SHAWN L 119,449
LEPAGE, NICOLE A 114,696
LINK, KIERAN D 87,548
LITTLE, KELCI 61,171
LOPASCHUK, CAROLINE A 89,065
LUMBARD, KELANIE N 90,645
LUMBARD, R SCOTT 90,076
LYONS, SCOTT C 92,041
MACCARTHY, DARREN J 93,242
MACDOUGALL, JESSICA C. 60,058
MAINVILLE, MEGAN M 89,987
MANN, G.MORGAN 91,047
MARCHAND, LAWRENCE H 71,126
MARCINIW, DWAYNE J 131,499
MATHER, PAMELA R 108,114
MATHER, RYAN G 109,370
MAW, LUKE 66,043
MAZZEI, JEFFREY P 86,180
MCEWEN-SPENCE, LISA D 88,395
MCFARLANE, DARCY R 92,540
MCVEY, ADAM C 85,356
MEDINA, JANET L. 50,672
MELNECHENKO, LEANNE M 86,180
MERILEES, ROB S 105,631
MERTH, SHELLEY L 98,799
MESSMER, MATTHEW J 77,527
MILLER, DACIENNE B 87,221
MILNE, MICHELLE J 85,612
MOISAN, MELANIE I 87,034
MOLINE, KOREE J 64,749
MORRELL, TONI-LYNN 90,685
MORROW, MANDY L 90,612
MOSER, MICHAEL J. 69,000
MUIR, LEAH R 85,896
MUSYJ, ANGIE V 85,906
NAMUR, LYNETTE J 86,559
NAPPER, DANIELLE L 87,905
NELSON, VIRGINIA 84,971
NEWMAN, PAMELA M 91,368
NICHOLSON, CRYSTAL L 58,735
NORDBY, ASHLEY F 50,517
OAKES, REBECCA M 54,273
OBERG, JERRAIE L. 67,195

Lloydminster Public SD Board of Education Annual Report – 2017-18 – Page 49
O'CONNOR, AMY T 88,254
O'CONNOR, GARRY WE 50,953
O'GRADY, MEAGHAN M 87,750
OLDERSHAW, VICTORIA K 86,784
OLEKSYN, MICHELLE A 86,495
OLIVER, TORRIE S 104,477
OSTER-HARDER, MARCIA E 87,763
PALKO, LEAH G 83,847
PARK, JOANNE M. 92,166
PEARN, BRYCE 81,106
PECK, REBECCA L 108,570
PEDERSEN, MELISSA S 58,037
PETERSON, BARBARA ANN 78,215
PHIPPS, HEIDI 83,527
POLLARD, E. ERIN 75,776
POLLARD, JACQUELINE D 86,420
POROZNUK, PHYLLIS M 85,906
PREDIGER, MARINA A 86,171
PROCTOR, BLAIR 84,866
PROKOP, JASON B 69,042
PROSPER, TRACY M 85,231
RAWLAKE, TRISHA L 161,078
RAWLUK, BRADLEY M 90,076
READ, MATTHEW K 146,621
RIDEOUT-BRACE, TRACY E 105,616
RIVETT, PAMELA L 86,226
ROBERTS, CAROL D 51,656
ROBERTSON, KAITLYN A. 60,664
ROBINSON, TODD R 202,791
ROGERS, HEATHER R 86,271
ROGERS, KELSEY E. 65,948
ROSS, DESIREE A.M. 60,329
RUSSELL, JOANNA K 86,919
RYAN, HELEN F 51,529
SAULNIER, JUSTIN C 98,267
SCHEMENAUER, TRACY 91,021
SCHWENK, RHONDA J 82,220
SCUTT, CRYSTAL L 87,397
SENDECKI, COURTNEE J 59,071
SEXSMITH, JEFF M 86,465
SHARKEY, PATRICK 70,576
SHAW, HILARY J. 66,751
SHUMILAK, MARLA J. 68,044
SKINNER, AMY F 112,266
SKLAPSKY, RYAN B 88,810
SMITH, CHAD D 87,318
SMITH, DOUG 117,905
SMITH, TREVOR W 83,563
SMITH, TRICIA L 90,076
SNIDER, JANE C 56,272
SPENRATH, GORDON E 86,396
SPRATT, BRITTNEY C. 66,892
SPRINGER, KIMBERLEY J 86,332
STANG, SIMON E 76,243

Lloydminster Public SD Board of Education Annual Report – 2017-18 – Page 50
STEINHAUER, CERISSA M 86,737
STENE, THERESA S 91,792
STEPHENS, SHERYL A 86,446
STEVENSON, JOLENE R 78,311
STEWART, SHELLA D 87,770
STUDER, SARAH L 71,496
SUTHERLAND, CORA L 86,281
SWATSCHINA, TAYLER R. 63,532
SWENDSEN, BARRETT 82,763
TAYLOR, ASHLEY A. 67,635
TEASDALE, BRENT J 90,757
TEMPLE, MELINDA M 91,363
THIESSEN, CHRISTINE L 91,360
THOMAS, BRENT M 161,078
THOMAS, JACQUELYN M 90,685
THOMAS, JOCELYN K 62,955
THOMPSON, JEREMY 65,703
THOMSON, GLEN M 87,499
THOMSON, TEIRA L 86,636
TOPOTT, CONNIE C 97,303
TOPP, ASHLEY M 86,052
TREMMEL, PATTI D 85,896
TROTCHIE, KENDALL W 68,066
TROTZUK, DONAVON MARK 69,994
UTKE, MEAGAN L. 82,011
UTLEY, NANCY B 68,287
VALETTE-TOPLEY, DANIELLE K 71,568
VAN DRESAR KHAN, JACQUELINE M 87,464
WALKER, COLLIN K 87,888
WANDLER, ASHLEY 73,568
WANDLER, TANYA L 61,444
WARD, LANCE C. 81,500
WEBB, NICOLE M 60,247
WEHRKAMP, DANIELLE J. M. 72,881
WEIR, SHAWNA L 87,285
WENDT, WES H 56,168
WESTMAN, MARK A. 76,552
WHITE, HILARY E 56,276
WIEBE, NATALIE 80,981
WILCHYNSKI, RAEMI J 87,034
WILLARD, ANGELA N 86,762
WILLIAMS, WENDY A 85,896
WILSON, REBECA L 65,296
WOODBURY, KELSIE J. 57,020
WOODS, TENILLE C 98,488
WOUTERS, JANICE L 115,160
WOUTERS, SCOTT G 170,987
WOYTIUK, ERINN A 88,438
WRIGHT, WANDA M 60,011
YOUNG, NEVADA 82,762
YUSEP, DONALD I 90,261
ZALASKY, EUGENE J 52,446
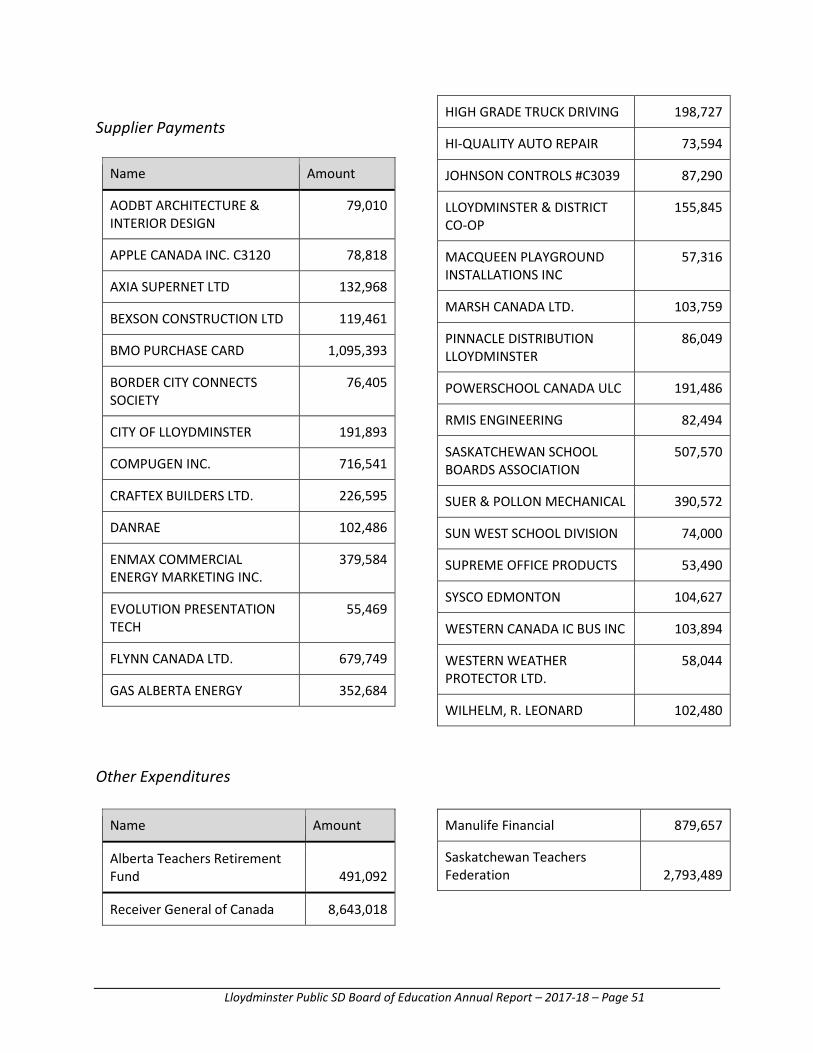
Lloydminster Public SD Board of Education Annual Report – 2017-18 – Page 51
Supplier Payments
Name Amount
AODBT ARCHITECTURE & INTERIOR DESIGN
79,010
APPLE CANADA INC. C3120 78,818
AXIA SUPERNET LTD 132,968
BEXSON CONSTRUCTION LTD 119,461
BMO PURCHASE CARD 1,095,393
BORDER CITY CONNECTS SOCIETY
76,405
CITY OF LLOYDMINSTER 191,893
COMPUGEN INC. 716,541
CRAFTEX BUILDERS LTD. 226,595
DANRAE 102,486
ENMAX COMMERCIAL ENERGY MARKETING INC.
379,584
EVOLUTION PRESENTATION TECH
55,469
FLYNN CANADA LTD. 679,749
GAS ALBERTA ENERGY 352,684
HIGH GRADE TRUCK DRIVING 198,727
HI-QUALITY AUTO REPAIR 73,594
JOHNSON CONTROLS #C3039 87,290
LLOYDMINSTER & DISTRICT CO-OP
155,845
MACQUEEN PLAYGROUND INSTALLATIONS INC
57,316
MARSH CANADA LTD. 103,759
PINNACLE DISTRIBUTION LLOYDMINSTER
86,049
POWERSCHOOL CANADA ULC 191,486
RMIS ENGINEERING 82,494
SASKATCHEWAN SCHOOL BOARDS ASSOCIATION
507,570
SUER & POLLON MECHANICAL 390,572
SUN WEST SCHOOL DIVISION 74,000
SUPREME OFFICE PRODUCTS 53,490
SYSCO EDMONTON 104,627
WESTERN CANADA IC BUS INC 103,894
WESTERN WEATHER PROTECTOR LTD.
58,044
WILHELM, R. LEONARD 102,480
Other Expenditures
Name Amount
Alberta Teachers Retirement Fund 491,092
Receiver General of Canada 8,643,018
Manulife Financial 879,657
Saskatchewan Teachers Federation 2,793,489

Lloydminster Public SD Board of Education Annual Report – 2017-18 – Page 52
Appendix B – Management Report and Audited Financial Statements

Audited Financial Statements
Of the
School Division No. 6050000
For the Period Ending: August 31, 2018
Matthew Read, CPA, CMA
Chief Financial Officer
Wilkinson Livingston Stevens LLP
Auditor
Note - Copy to be sent to Ministry of Education, Regina
Lloydminster School Division No. 99

Management’s Responsibility for the Financial Statements
The school division’s management is responsible for the preparation of the financial statements in accordance with Canadian public sector accounting standards and the format specified in the Financial Reporting Manual issued by the Ministry of Education. The preparation of financial statements necessarily involves the use of estimates based on management’s judgment, particularly when transactions affecting the current accounting period cannot be finalized with certainty until future periods.
The school division’s management maintains a system of accounting and administrative controls to ensure that accurate and reliable financial statements are prepared and to provide reasonable assurance that transactions are authorized, assets are safeguarded, and financial records are properly maintained to provide reliable information for the preparation of financial statements.
The Board of Education is composed of elected officials who are not employees of the school division. The Board is responsible for ensuring that management fulfills its responsibilities for financial reporting and internal control, and for approving the financial statements. The Board is also responsible for the appointment of the school division’s external auditors.
The external auditors, Wilkinson Livingston Stevens LLP, conduct an independent examination in accordance with Canadian auditing standards and express their opinion on the financial statements. The accompanying Auditors’ Report outlines their responsibilities, the scope of their examination and their opinion on the school division’s financial statements. The external auditors have full and free access to, and meet periodically and separately with, both the Board and management to discuss their audit findings.
On behalf of the Lloydminster Public School Division No. 99:
___________________________ Board Chair
___________________________ Director of Education
___________________________ Chief Financial Officer
November 28, 2018

Box 10350, The Atrium CentreLloydminster, Alberta T9V 3A5
Phone: (780) 875-9144Fax: (780) 875-6056
Email: [email protected]: www.wlsca.com
INDEPENDENT AUDITOR'S REPORT
The Board of DirectorsLloydminster Public School Division No. 99Lloydminster, Saskatchewan
We have audited the accompanying financial statements of the Lloydminster Public School Division No. 99,which comprise the statement of financial position as at August 31, 2018, and the statement of operationsand accumulated surplus from operations, changes in net financial assets and cash flows for the year thenended, and a summary of significant accounting policies and other explanatory information.
Management's Responsibility for the Financial Statements
Management is responsible for the preparation and fair presentation of these financial statements inaccordance with Canadian generally accepted accounting principles established by the Public SectorAccounting Board of the Canadian Institute of Chartered Accountants, and for such internal control asmanagement determines is necessary to enable the preparation of financial statements that are free frommaterial misstatement, whether due to fraud or error.
Auditor's Responsibility
Our responsibility is to express an opinion on these financial statements based on our audit. We conductedour audit in accordance with Canadian generally accepted auditing standards. Those standards require thatwe comply with ethical requirements and plan and perform the audit to obtain reasonable assurancewhether the financial statements are free of material misstatement.
An audit involves performing procedures to obtain audit evidence about amounts and disclosures in thefinancial statements. The procedures selected depend on the auditor's judgment, including the assessmentof the risks of material misstatement of the financial statements, whether due to fraud or error. In makingthose risk assessments, the auditor considers internal control relevant to the entity's preparation and fairpresentation of the financial statements in order to design audit procedures that are appropriate in thecircumstances, but not for the purpose of expressing an opinion on the effectiveness of the entity's internalcontrol. An audit also includes evaluating the appropriateness of accounting policies used and thereasonableness of accounting estimates made by management, as well as evaluating the overallpresentation of the financial statements.
We believe that the audit evidence we have obtained is sufficient and appropriate to provide a basis for ouraudit opinion.
Opinion
In our opinion, the financial statements present fairly, in all material respects, the financial position of theLloydminster Public School Division No. 99 as at August 31, 2018, and the results of its operations andchanges in net financial assets and cash flows for the year then ended in accordance with Canadian publicsector accounting standards.
Lloydminster, AlbertaNovember 28, 2018 Chartered Accountants

PAGEManagement's Responsibility for the Financial Statements
Independent Auditor's Report
Statement of Financial Position 1
Statement of Operations and Accumulated Surplus from Operations 2
Statement of Changes in Net Financial Assets 3
Statement of Cash Flows 4
Schedule A: Supplementary Details of Revenue 5-6
Schedule B: Supplementary Details of Expenses 7-9
Schedule C - Supplementary Details of Tangible Capital Assets 10
Schedule D: Non-Cash Items Included in Deficit 11
Schedule E: Net Change in Non-Cash Operating Activities 11
Notes to the Financial Statements 12-30
LLOYDMINSTER SCHOOL DIVISION NO. 99
FOR THE YEAR ENDED AUGUST 31, 2018
INDEX TO THE FINANCIAL STATEMENTS

… page 1
2018 2017
$ $
Financial Assets
Cash and Cash Equivalents 7,745,770 11,185,868
Accounts Receivable (Note 8) 746,181 395,630
Portfolio Investments (Note 4) 3,067,097 166,887
Total Financial Assets 11,559,048 11,748,385
Liabilities
Accounts Payable and Accrued Liabilities (Note 9) 1,963,021 2,176,840
Long-Term Debt (Note 10) 1,945,127 2,053,878
Liability for Employee Future Benefits (Note 6) 568,500 514,800
Deferred Revenue (Note 11) 3,022,392 3,080,515
Total Liabilities 7,499,040 7,826,033
Net Financial Assets 4,060,008 3,922,352
Non-Financial Assets
Tangible Capital Assets (Schedule C) 48,051,848 49,364,548
Inventory of Supplies for Consumption 193,032 202,304
Prepaid Expenses 106,274 170,828
Total Non-Financial Assets 48,351,154 49,737,680
Accumulated Surplus (Note 14) 52,411,162 53,660,032
Contractual Obligations and Commitments (Note 18)
The accompanying notes and schedules are an integral part of these statements.
Approved by the Board:
Chairperson
Chief Financial Officer
Lloydminster School Division No. 99
Statement of Financial Position
as at August 31, 2018

… page 2
2018 2018 2017
Budget Actual Actual
$ $ $
REVENUES(Note 15)
Property Taxation 13,261,365 13,008,927 13,728,359
Grants 26,919,354 28,723,648 26,963,522
Tuition and Related Fees 53,725 113,187 78,142
School Generated Funds 1,000,000 1,117,024 1,076,609
Complementary Services (Note 12) 194,424 335,484 200,160
External Services (Note 13) 191,896 180,890 205,452
Other 427,443 535,284 2,372,008
Total Revenues (Schedule A) 42,048,207 44,014,444 44,624,252
EXPENSES
Governance 195,000 159,547 245,245
Administration 2,034,137 2,021,561 2,257,844
Instruction 34,023,312 34,175,496 34,399,049
Plant 5,121,228 6,018,325 5,494,597
Transportation 920,153 1,008,696 954,763
Tuition and Related Fees 5,000 - 4,639
School Generated Funds 1,000,000 1,033,138 997,463
Complementary Services (Note 12) 375,864 546,369 476,415
External Services (Note 13) 224,110 190,813 215,374
Other Expenses 86,235 109,369 116,117
Total Expenses (Schedule B) 43,985,039 45,263,314 45,161,506
Operating Deficit for the Year (1,936,832) (1,248,870) (537,254)
Accumulated Surplus from Operations, Beginning of Year 53,660,032 53,660,032 54,197,286
Accumulated Surplus from Operations, End of Year 51,723,200 52,411,162 53,660,032
The accompanying notes and schedules are an integral part of these statements.
Lloydminster School Division No. 99
Statement of Operations and Accumulated Surplus from Operations
for the year ended August 31, 2018

… page 3
2018 2018 2017
Budget Actual Actual
$ $ $
(Note 15)
Net Financial Assets, Beginning of Year 3,922,352 3,922,352 4,313,997
Changes During the Year
Operating Deficit for the Year (1,936,832) (1,248,870) (537,254)
Acquisition of Tangible Capital Assets (Schedule C) (810,839) (1,231,257) (2,674,160)
Proceeds on Disposal of Tangible Capital Assets (Schedule C) - 3,420 1,709,590
Net Gain on Disposal of Capital Assets (Schedule C) - (3,420) (1,707,539)
Amortization of Tangible Capital Assets (Schedule C) 2,508,500 2,543,957 2,771,586
Net Acquisition of Inventory of Supplies - 9,272 37,951
Net Change in Other Non-Financial Assets - 64,554 8,181
Change in Net Financial Assets (239,171) 137,656 (391,645)
Net Financial Assets, End of Year 3,683,181 4,060,008 3,922,352
The accompanying notes and schedules are an integral part of these statements.
Lloydminster School Division No. 99
Statement of Changes in Net Financial Assets
for the year ended August 31, 2018

… page 4
2018 2017
$ $
OPERATING ACTIVITIES
Operating Deficit for the Year (1,248,870) (537,254)
Add Non-Cash Items Included in Deficit (Schedule D) 2,540,537 1,064,047
Net Change in Non-Cash Operating Activities (Schedule E) (494,967) 4,142,890
Cash Provided by Operating Activities 796,700 4,669,683
CAPITAL ACTIVITIES
Cash Used to Acquire Tangible Capital Assets (1,231,257) (969,160)
Proceeds on Disposal of Tangible Capital Assets 3,420 4,590
Cash Used by Capital Activities (1,227,837) (964,570)
INVESTING ACTIVITIES
Cash Used to Acquire Portfolio Investments (2,900,210) (6,894)
Cash Used by Investing Activities (2,900,210) (6,894)
FINANCING ACTIVITIES
Repayment of Long-Term Debt (108,751) (110,569)
Cash Used by Financing Activities (108,751) (110,569)
INCREASE (DECREASE) IN CASH AND CASH EQUIVALENTS (3,440,098) 3,587,650
CASH AND CASH EQUIVALENTS, BEGINNING OF YEAR 11,185,868 7,598,218
CASH AND CASH EQUIVALENTS, END OF YEAR 7,745,770 11,185,868
The accompanying notes and schedules are an integral part of these statements.
Lloydminster School Division No. 99
Statement of Cash Flows
for the year ended August 31, 2018

... page 5
2018 2018 2017
Budget Actual Actual
$ $ $
Property Taxation Revenue
Tax Levy Revenue
Property Tax Levy Revenue 13,261,365 12,823,497 13,518,798
Total Property Tax Revenue 13,261,365 12,823,497 13,518,798
Grants in Lieu of Taxes
Federal Government - 3,333 5,457
Provincial Government - 15,055 56,005
Other - - 2,661
Total Grants in Lieu of Taxes - 18,388 64,123
Other Tax Revenues
House Trailer Fees - 49,997 58,746
Total Other Tax Revenues - 49,997 58,746
Additions to Levy
Penalties - 134,156 121,932
Total Additions to Levy - 134,156 121,932
Deletions from Levy
Cancellations - (13,301) (26,265)
Other Deletions - (3,810) (8,975)
Total Deletions from Levy - (17,111) (35,240)
Total Property Taxation Revenue 13,261,365 13,008,927 13,728,359
Grants
Operating Grants
Ministry of Education Grants
Operating Grant 11,770,007 12,550,048 11,974,623
Other Ministry Grants 68,000 77,395 73,760
Total Ministry Grants 11,838,007 12,627,443 12,048,383
Federal Grants - 2,611 -
Grants from Others 14,766,173 15,329,091 14,599,965
Total Operating Grants 26,604,180 27,959,145 26,648,348
Capital Grants
Ministry of Education Capital Grants 315,174 537,303 315,174
Other Capital Grants - 227,200 -
Total Capital Grants 315,174 764,503 315,174
Total Grants 26,919,354 28,723,648 26,963,522
Tuition and Related Fees Revenue
Operating Fees
Tuition Fees
School Boards - 3,270 14,725
Federal Government and First Nations 53,725 88,117 62,327
Individuals and Other - 21,800 1,090
Total Tuition Fees 53,725 113,187 78,142
Total Tuition and Related Fees Revenue 53,725 113,187 78,142
Lloydminster School Division No. 99Schedule A: Supplementary Details of Revenues
for the year ended August 31, 2018

… page 6
2018 2018 2017
Budget Actual Actual
$ $ $
School Generated Funds Revenue
Curricular
Student Fees 180,000 215,339 218,721
Total Curricular Fees 180,000 215,339 218,721
Non-Curricular Fees
Commercial Sales - GST 140,000 131,235 158,772
Commercial Sales - Non-GST - 4,227 4,427
Fundraising 100,000 209,350 163,943
Students Fees 200,000 294,983 268,992
Other 380,000 261,890 261,754
Total Non-Curricular Fees 820,000 901,685 857,888
Total School Generated Funds Revenue 1,000,000 1,117,024 1,076,609
Complementary Services
Operating Grants
Ministry of Education Grants
Operating Grant 194,424 194,484 200,160
Other Grants - 141,000 -
Total Operating Grants 194,424 335,484 200,160
Total Complementary Services Revenue 194,424 335,484 200,160
External Services
Operating Grants
Ministry of Education Grants
Other Ministry Grants 76,896 76,896 76,896
Other Provincial Grants - 6,597 12,187
Total Operating Grants 76,896 83,493 89,083
Fees and Other Revenue
Other Revenue 115,000 97,397 116,369
Total Fees and Other Revenue 115,000 97,397 116,369
Total External Services Revenue 191,896 180,890 205,452
Other Revenue
Miscellaneous Revenue 325,068 377,551 559,510
Sales & Rentals 26,000 33,176 29,565
Investments 76,375 121,137 75,394 Gain on Disposal of Capital Assets - 3,420 1,707,539
Total Other Revenue 427,443 535,284 2,372,008
TOTAL REVENUE FOR THE YEAR 42,048,207 44,014,444 44,624,252
Schedule A: Supplementary Details of Revenues
for the year ended August 31, 2018
Lloydminster School Division No. 99

… page 7
2018 2018 2017
Budget Actual Actual
$ $ $
Governance Expense
Board Members Expense 67,700 34,281 34,503
Professional Development - Board Members 5,250 8,191 24,803
Advisory Committees 19,360 887 -
Elections - - 497
Other Governance Expenses 102,690 116,188 185,442
Total Governance Expense 195,000 159,547 245,245
Administration Expense
Salaries 1,325,192 1,325,686 1,457,311
Benefits 149,545 130,039 204,112
Supplies & Services 122,750 119,469 121,839
Non-Capital Furniture & Equipment 51,000 49,426 48,483
Building Operating Expenses 41,550 41,861 34,970
Communications 29,000 25,871 33,154
Travel 45,000 43,093 51,824
Professional Development 33,000 32,803 42,385
Amortization of Tangible Capital Assets 237,100 253,313 263,766
Total Administration Expense 2,034,137 2,021,561 2,257,844
Instruction Expense
Instructional (Teacher Contract) Salaries 22,384,138 22,466,714 23,059,686
Instructional (Teacher Contract) Benefits 1,131,090 1,088,551 1,142,067
Program Support (Non-Teacher Contract) Salaries 5,403,666 5,678,292 5,183,851
Program Support (Non-Teacher Contract) Benefits 749,688 735,889 702,375
Instructional Aids 816,241 696,943 555,903
Supplies & Services 598,607 542,938 633,928
Non-Capital Furniture & Equipment 181,365 211,932 189,190
Communications 287,938 245,630 245,118
Travel 27,000 16,775 20,197
Professional Development 220,264 242,644 207,480
Student Related Expense 87,515 114,990 107,987
Amortization of Tangible Capital Assets 2,135,800 2,134,198 2,351,267
Total Instruction Expense 34,023,312 34,175,496 34,399,049
Lloydminster School Division No. 99Schedule B: Supplementary Details of Expenses
for the year ended August 31, 2018

… page 8
2018 2018 2017
Budget Actual Actual
$ $ $
Plant Operation & Maintenance Expense
Salaries 2,048,931 2,083,495 2,098,111
Benefits 310,659 294,440 301,652
Supplies & Services 4,200 557 555
Non-Capital Furniture & Equipment 11,500 20,610 23,943
Building Operating Expenses 2,659,738 3,527,181 2,983,233
Communications 12,000 2,983 2,589
Travel 33,200 34,554 26,247
Professional Development 6,000 7,112 5,468
Amortization of Tangible Capital Assets 35,000 47,393 52,799
Total Plant Operation & Maintenance Expense 5,121,228 6,018,325 5,494,597
Student Transportation Expense
Salaries 420,118 470,607 491,886
Benefits 70,910 61,450 67,588
Supplies & Services 130,775 143,699 122,642
Non-Capital Furniture & Equipment 130,000 151,771 129,287
Travel 3,500 2,937 2,347
Professional Development 5,000 4,862 7,024
Contracted Transportation 59,250 64,317 30,235
Amortization of Tangible Capital Assets 100,600 109,053 103,754
Total Student Transportation Expense 920,153 1,008,696 954,763
Tuition and Related Fees Expense
Tuition Fees 5,000 - 4,639
Total Tuition and Related Fees Expense 5,000 - 4,639
School Generated Funds Expense
Cost of Sales 75,000 103,326 140,121
School Fund Expenses 925,000 929,812 857,342
Total School Generated Funds Expense 1,000,000 1,033,138 997,463
Lloydminster School Division No. 99Schedule B: Supplementary Details of Expenses
for the year ended August 31, 2018

… page 9
2018 2018 2017
Budget Actual Actual
$ $ $
Complementary Services Expense
Instructional (Teacher Contract) Salaries & Benefits 210,783 213,461 251,641
Program Support (Non-Teacher Contract) Salaries & Benefits 144,516 200,711 213,108
Student Related Expenses 20,565 132,197 11,666
Total Complementary Services Expense 375,864 546,369 476,415
External Service Expense
Grant Transfers 75,996 75,906 75,906
Program Support (Non-Teacher Contract) Salaries & Benefits 51,504 54,823 60,088
Supplies & Services 96,610 60,084 76,135
Building Operating Expenses - - 3,245
Total External Services Expense 224,110 190,813 215,374
Other Expense
Interest and Bank Charges
Current Interest and Bank Charges 2,200 25,356 27,566
Interest on Capital Loans 84,035 84,013 88,551
Total Interest and Bank Charges 86,235 109,369 116,117
Total Other Expense 86,235 109,369 116,117
TOTAL EXPENSES FOR THE YEAR 43,985,039 45,263,314 45,161,506
for the year ended August 31, 2018Schedule B: Supplementary Details of Expenses
Lloydminster School Division No. 99

Lloydminster School Division No. 99
Schedule C - Supplementary Details of Tangible Capital Assets
for the year ended August 31, 2018
Furniture Computer
Land Buildings School Other and Hardware and Computer Assets
Land Improvements Buildings Short-Term Buses Vehicles Equipment
Audio Visual
Equipment Software
Under
Construction 2018 2017
$ $ $ $ $ $ $ $ $ $ $ $
Tangible Capital Assets - at Cost
Opening Balance as of September 1 2,282,580 2,308,851 73,983,761 2,595,984 2,024,168 471,936 3,355,655 2,473,025 284,547 - 89,780,507 88,084,397
Additions/Purchases - - - - 100,529 38,051 115,785 687,321 136,008 153,563 1,231,257 2,674,160
Disposals - - - - - (51,512) (159,581) (1,035,377) - - (1,246,470) (978,050)
Closing Balance as of August 31 2,282,580 2,308,851 73,983,761 2,595,984 2,124,697 458,475 3,311,859 2,124,969 420,555 153,563 89,765,294 89,780,507
Tangible Capital Assets - Amortization
Opening Balance as of September 1 - 849,506 32,597,414 1,339,738 1,456,824 377,229 1,740,866 1,780,371 274,011 - 40,415,959 38,620,372
Amortization of the Period - 99,826 1,548,008 112,610 100,460 26,832 331,185 289,737 35,299 - 2,543,957 2,771,586
Disposals - - - - - (51,512) (159,581) (1,035,377) - - (1,246,470) (975,999)
Closing Balance as of August 31 N/A 949,332 34,145,422 1,452,348 1,557,284 352,549 1,912,470 1,034,731 309,310 N/A 41,713,446 40,415,959
Net Book Value
Opening Balance as of September 1 2,282,580 1,459,345 41,386,347 1,256,246 567,344 94,707 1,614,789 692,654 10,536 - 49,364,548 49,464,025
Closing Balance as of August 31 2,282,580 1,359,519 39,838,339 1,143,636 567,413 105,926 1,399,389 1,090,238 111,245 153,563 48,051,848 49,364,548
Change in Net Book Value - (99,826) (1,548,008) (112,610) 69 11,219 (215,400) 397,584 100,709 153,563 (1,312,700) (99,477)
DisposalsHistorical Cost - - - - - 51,512 159,581 1,035,377 - - 1,246,470 978,050
Accumulated Amortization - - - - - 51,512 159,581 1,035,377 - - 1,246,470 975,999
Net Cost - - - - - - - - - - - 2,051
Price of Sale - - - - - 3,420 - - - - 3,420 1,709,590
Gain on Disposal - - - - - 3,420 - - - - 3,420 1,707,539
… p
ag
e 10

… page 11
2018 2017
$ $
Non-Cash Items Included in Deficit
Amortization of Tangible Capital Assets (Schedule C) 2,543,957 2,771,586
Net Gain on Disposal of Tangible Capital Assets (Schedule C) (3,420) (1,707,539)
Total Non-Cash Items Included in Deficit 2,540,537 1,064,047
2018 2017
$ $
Net Change in Non-Cash Operating Activities
Decrease (Increase) in Accounts Receivable (350,551) 3,565,762
Decrease in Accounts Payable and Accrued Liabilities (213,819) (42,432)
Increase in Liability for Employee Future Benefits 53,700 74,300
Increase (Decrease) in Deferred Revenue (58,123) 499,128
Decrease in Inventory of Supplies for Consumption 9,272 37,951
Decrease in Prepaid Expenses 64,554 8,181
Total Net Change in Non-Cash Operating Activities (494,967) 4,142,890
Schedule E: Net Change in Non-Cash Operating Activities
for the year ended August 31, 2018
Lloydminster School Division No. 99
Schedule D: Non-Cash Items Included in Deficit
for the year ended August 31, 2018
Lloydminster School Division No. 99

LLOYDMINSTER SCHOOL DIVISION NO. 99 NOTES TO THE FINANCIAL STATEMENTS
As at August 31, 2018 P a g e | 12
1. AUTHORITY AND PURPOSEThe school division operates under the authority of The Education Act, 1995 of Saskatchewan as a corporation under the name of “The Board of Education of the Lloydminster Public School Division No. 99” and operates as “the Lloydminster Public School Division No. 99”. The school division provides education services to residents within its geographic region and is governed by an elected board of trustees. The school division is exempt from income tax and is a registered charity under the Income Tax Act.
2. SIGNIFICANT ACCOUNTING POLICIES
These financial statements have been prepared in accordance with Canadian public sector accounting standards for other government organizations as established by the Public Sector Accounting Board (PSAB) and as published by the Chartered Professional Accountants of Canada (CPA Canada).
Significant aspects of the accounting policies adopted by the school division are as follows:
a) Basis of Accounting
The financial statements are prepared using the accrual basis of accounting.
b) Reporting Entity
The financial statements include all of the assets, liabilities, revenues and expenses ofthe school division reporting entity.
c) Trust Funds
Trust funds are properties assigned to the school division (trustee) under a trustagreement or statute to be administered for the benefit of the trust beneficiaries. Astrustee, the school division merely administers the terms and conditions embodied inthe agreements, and has no unilateral authority to change the conditions set out in thetrust indenture.
Trust funds are not included in the financial statements as they are not controlled bythe school division. Trust fund activities administered by the school division aredisclosed in Note 17 of the financial statements.
d) Measurement Uncertainty and the Use of Estimates
Canadian public sector accounting standards require management to make estimatesand assumptions that affect the reported amount of assets and liabilities and disclosureof contingent assets and liabilities at the date of the financial statements, and thereported amounts of revenues and expenses during the year.
Measurement uncertainty that may be material to these financial statements exists for:
• the liability for employee future benefits of $568,500 (2017 - $514,800) becauseactual experience may differ significantly from actuarial estimations.
• property taxation revenue of $13,008,927 (2017 - $13,728,359) because final taxassessments may differ from initial estimates.
• useful lives of capital assets and related amortization of $2,543,957 (2017 -$2,771,586) because the actual useful lives of the capital assets may differ fromtheir estimated economic lives.

LLOYDMINSTER SCHOOL DIVISION NO. 99 NOTES TO THE FINANCIAL STATEMENTS
As at August 31, 2018 P a g e | 13
These estimates and assumptions are reviewed periodically and, as adjustments become necessary, they are reported in earnings in the periods in which they become known. While best estimates are used for reporting items subject to measurement uncertainty, it is reasonably possible that changes in future conditions, occurring within one fiscal year, could require material changes in the amounts recognized or disclosed.
e) Financial Instruments
Financial instruments are any contracts that give rise to financial assets of one entity and financial liabilities or equity instruments of another entity. A contract establishing a financial instrument creates, at its inception, rights and obligations to receive or deliver economic benefits. The school division recognizes a financial instrument when it becomes a party to the contractual provisions of a financial instrument. The financial assets and financial liabilities portray these rights and obligations in the financial statements. Financial instruments of the school division include cash and cash equivalents, accounts receivable, portfolio investments, accounts payable and accrued liabilities and long-term debt. All financial instruments are measured at cost or amortized cost. Transaction costs are a component of the cost of financial instruments measured using cost or amortized cost. For financial instruments measured using amortized cost, the effective interest rate method is used to determine interest revenues or expenses. Impairment losses such as write-downs or write-offs are reported in the statement of operations and accumulated surplus from operations. Gains and losses on financial instruments, measured at cost or amortized cost, are recognized in the statement of operations and accumulated surplus from operations in the period the gain or loss occurs.
f) Financial Assets
Financial assets are assets that could be used to discharge existing liabilities or finance future operations and are not for consumption in the normal course of operations. Valuation allowances are used where considered necessary to reduce the amounts reported for financial assets to their net realizable value. Cash and Cash Equivalents consist of cash, bank deposits and highly liquid investments with initial maturity terms of three months or less and held for the purpose of meeting short-term operating cash commitments rather than for investing purposes.
Accounts Receivable includes taxes receivable, provincial grants receivable and other receivables. Taxes receivable represent education property taxes assessed or estimated owing to the end of the fiscal period but not yet received. The allowance for uncollected taxes is a valuation allowance used to reduce the amount reported for taxes receivable to the estimated net recoverable amount. The allowance represents management’s estimate of the amount of taxes that will not be collected taking into consideration prior years’ tax collections and information provided by municipalities regarding collectability of outstanding balances. Provincial grants receivable represent operating, capital and other grants earned but not received at the end of the fiscal year, provided reasonable estimates of the amounts

LLOYDMINSTER SCHOOL DIVISION NO. 99 NOTES TO THE FINANCIAL STATEMENTS
As at August 31, 2018 P a g e | 14
can be made. Grants are earned when the events giving rise to the grant have occurred, the grant is authorized and any eligibility criteria have been met. Other receivables are recorded at cost less valuation allowances. These allowances are recorded where collectability is considered doubtful. Portfolio Investments consist of term deposits and equity in common shares which are carried at cost. The school division values its portfolio investments in accordance with its policy for financial instruments, as described in Note 2 (e).
g) Non-Financial Assets
Non-financial assets are assets held for consumption in the provision of services. These assets do not normally provide resources to discharge the liabilities of the school division unless they are sold. Tangible Capital Assets have useful lives extending beyond the accounting period, are used by the school division to provide services to the public and are not intended for sale in the ordinary course of operations. Tangible capital assets include land and land improvements, buildings, buildings – short-term, school buses, other vehicles, furniture and equipment, computer hardware and software, audio visual equipment and assets under construction. Tangible capital assets are recorded at cost (or estimated cost when the actual cost is unknown) and include all costs directly attributable to the acquisition, design, construction, development, installation and betterment of the tangible capital asset. The school division does not capitalize interest incurred while a tangible capital asset is under construction.
The cost of depreciable tangible capital assets, net of any residual value, is amortized on a straight line basis over their estimated useful lives as follows:
Land improvements (pavement, fencing, lighting, etc.) 20 years Buildings 50 years Buildings – short-term (portables, storage sheds, outbuildings, garages)
20 years
School buses 12 years Other vehicles – passenger 5 years Other vehicles – heavy (graders, 1 ton truck, etc.) 10 years Furniture and equipment 10 years Computer hardware and audio visual equipment 5 years Computer software 5 years
Assets under construction are not amortized until completed and placed into service for use.
Inventory of Supplies for Consumption consists of supplies held for consumption by the school division in the course of normal operations and are recorded at the lower of cost and replacement cost. Prepaid Expenses are prepaid amounts for goods or services which will provide economic benefits in one or more future periods. Prepaid expenses include such items

LLOYDMINSTER SCHOOL DIVISION NO. 99 NOTES TO THE FINANCIAL STATEMENTS
As at August 31, 2018 P a g e | 15
as insurance premiums, Saskatchewan School Boards Association membership fees, other membership fees, software licenses, vehicle licensing and copier leases.
h) Liabilities
Liabilities are present obligations arising from transactions and events occurring prior to year-end, which will be satisfied in the future through the use of assets or another form of economic settlement. Accounts Payable and Accrued Liabilities include accounts payable and accrued liabilities owing to third parties and employees for work performed, goods supplied and services rendered, but not yet paid, at the end of the fiscal period. Long-Term Debt is comprised of capital loans with initial maturities of more than one year and are incurred for the purpose of financing capital expenses in accordance with the provisions of The Education Act, 1995. Liability for Employee Future Benefits represents post-employment and compensated absence benefits that accrue to the school division's employees. The cost of these benefits is recorded as the benefits are earned by employees. The liability relating to these benefits is actuarially determined using the projected benefit method pro-rated on service. Actuarial valuations are performed periodically using assumptions including discount rate, inflation, salary escalation, termination and retirement rates and mortality. An actuary extrapolates these valuations when a valuation is not done in the current fiscal year. Actuarial gains and losses are amortized on a straight line basis over the expected average remaining service life of the related employee groups. Deferred Revenue from Non-government Sources represents fees or payments for services received in advance of the fee being earned or the services being performed, and other contributions for which the contributor has placed restrictions on the use of the resources. Revenue from tuition and related fees is recognized as the course is delivered and revenue from other contributions is recognized in the fiscal year in which the resources are used for the purpose specified by the contributor.
i) Employee Pension Plans
Employees of the school division participate in the following pension plans: Multi-Employer Defined Benefit Plans
The school division’s employees participate in one of the following multi-employer defined benefit plans:
i) Teachers participate in the Saskatchewan Teachers’ Retirement Plan (STRP), or the Alberta Teachers’ Retirement Fund (ATRF). The school division’s obligation for these plans is limited to collecting and remitting contributions of the employees at rates determined by the plans.
ii) One employee participates in the Municipal Employees’ Pension Plan (MEPP). The plan is accounted for as a defined contribution plan whereby the school division’s contributions are expensed when due.

LLOYDMINSTER SCHOOL DIVISION NO. 99 NOTES TO THE FINANCIAL STATEMENTS
As at August 31, 2018 P a g e | 16
Defined Contribution Plans
The school division’s support staff, excluding one support staff who participated in MEPP, participate in a defined contribution pension plan. The school division’s contributions to the plan are expensed when due.
j) Revenue Recognition
Revenues are recorded on the accrual basis. Revenues are recognized in the period in which the transactions or events occurred that gave rise to the revenues, provided the amount to be received can be reasonably estimated and collection is reasonably assured. The school division’s sources of revenues include the following: i) Government Transfers (Grants)
Grants from governments are considered to be government transfers. Government transfers are recognized as revenues when the transfer is authorized, all eligibility criteria have been met, the amount can be estimated and collection is reasonably assured except when, and to the extent, stipulations by the transferor give rise to an obligation that meets the definition of a liability. For transfers with stipulations, revenue is recognized in the statement of operations and accumulated surplus from operations as the stipulation liabilities are settled.
ii) Property Taxation
Property tax is levied and collected on a calendar year basis. Uniform education property tax mill rates are set by the Governments of Saskatchewan and Alberta. Tax revenues are recognized on the basis of time with 1/12th of estimated total tax revenue recorded in each month of the school division’s fiscal year. The tax revenue for the September to December portion of the fiscal year is based on the actual amounts reported by the municipalities for the calendar taxation year. For the January to August portion of its fiscal year, the school division estimates tax revenue based on estimate information provided by municipalities who levy and collect the property tax on behalf of the school division. The final annual taxation amounts are reported to the division by each municipality following the conclusion of each calendar taxation year, and any difference between final amounts and the school division’s estimates is recorded as an adjustment to revenue in the next fiscal year. As at January 1, 2018, pursuant to The Education Property Tax Act, the Government of Saskatchewan became the taxing authority for education property tax for the Rural Municipalities of Wilton and Britannia. As of that date, the school division no longer earns taxation revenue from these municipalities.
iii) Fees and Services
Revenues from tuition fees and other fees and services are recognized in the year they are earned. Amounts that are restricted pursuant to legislation, regulation or agreements with external parties that may only be used in the conduct of certain programs or in the delivery of specific services and transactions are initially recorded as deferred revenue and subsequently recognized as revenue in the fiscal year the related expenses are incurred or services are performed.

LLOYDMINSTER SCHOOL DIVISION NO. 99 NOTES TO THE FINANCIAL STATEMENTS
As at August 31, 2018 P a g e | 17
iv) Interest Income Interest is recognized as revenue when it is earned.
v) Other (Non-Government Transfer) Contributions
Unrestricted contributions are recognized as revenue in the year received or in the year the funds are committed to the school division if the amount can be reasonably estimated and collection is reasonably assured. Externally restricted contributions are contributions for which the contributor has placed restrictions on the use of the resources. Externally restricted contributions that are not held in perpetuity are deferred until the resources are used for the purpose specified, at which time the contributions are recognized as revenue. In-kind contributions are recorded at their fair value when they are received.
k) Statement of Remeasurement Gains and Losses The school division has not presented a statement of remeasurement gains or losses because it does not have financial instruments that give rise to material remeasurement gains or losses.
3. SHORT-TERM BORROWINGS
Bank indebtedness consists of a demand operating line of credit with a maximum borrowing limit of $2,600,000 that bears interest at a rate of the bank’s prime rate per annum with Synergy Credit Union. This line of credit is authorized by a borrowing resolution by the board of education dated November 22, 2017 and is secured by an overdraft protection agreement and borrowing resolution. The line of credit was approved by the Minister of Education on January 22, 2013. The balance drawn on the line of credit at August 31, 2018 was $0 (August 31, 2017 - $0).
4. PORTFOLIO INVESTMENTS
Portfolio investments are comprised of the following:
Portfolio investments in the cost and amortized cost category: Cost CostTerm deposits 2,890,000$ -$ Equity common shares at Credit Union and Co-op 177,097 166,887 Total portfolio investments 3,067,097$ 166,887$
2018 2017

LLOYDMINSTER SCHOOL DIVISION NO. 99 NOTES TO THE FINANCIAL STATEMENTS
As at August 31, 2018 P a g e | 18
5. EXPENSES BY FUNCTION AND ECONOMIC CLASSIFICATION
6. EMPLOYEE FUTURE BENEFITS
The school division provides certain post-employment, compensated absence and termination benefits to its employees. These benefits include accumulating non-vested sick leave, severance benefits, retirement gratuity, and vacation banks. The liability associated with these benefits is calculated as the present value of expected future payments pro-rated for service and is recorded as Liability for Employee Future Benefits in the statement of financial position. Morneau Shepell Ltd, a firm of consulting actuaries, performed an actuarial valuation as at March 31, 2018 and extrapolated the results to estimate the Liability for Employee Future Benefits as at August 31, 2018. Details of the employee future benefits are as follows:
FunctionSalaries &
BenefitsGoods & Services
Debt Service
Amortization of TCA
2018 Actual
2017 Actual
Governance $ 40,437 $ 119,110 $ - $ - $ 159,547 $ 245,245
Administration 1,455,725 312,523 - 253,313 2,021,561 2,257,844
Instruction 29,969,446 2,071,852 - 2,134,198 34,175,496 34,399,049
Plant 2,377,935 3,592,997 - 47,393 6,018,325 5,494,597
Transportation 532,057 367,586 - 109,053 1,008,696 954,763
Tuition and Related Fees - - - - - 4,639
School Generated Funds - 1,033,138 - - 1,033,138 997,463
Complementary Services 414,172 132,197 - - 546,369 476,415
External Services 54,823 135,990 - - 190,813 215,374
Other - - 109,369 - 109,369 116,117
TOTAL $34,844,595 $7,765,393 $109,369 $ 2,543,957 $45,263,314 $45,161,506
2018 2017 Long-term assumptions used:
Discount rate at end of period 3.00% 2.69%Inflation and productivity rate (excluding merit and promotion) - Teachers 2.50% 2.50%Inflation and productivity rate (excluding merit and promotion) - Non-Teachers 3.00% 3.00%Expected average remaining service life (years) 16 16
Liability for Employee Future Benefits 2018 2017 Accrued Benefit Obligation - beginning of year 559,300$ 599,800$ Current period service cost 54,600 66,200 Interest cost 16,200 13,800 Benefit payments (20,800) (15,900) Actuarial gains (99,000) (104,600) Accrued Benefit Obligation - end of year 510,300 559,300 Unamortized Net Actuarial Gains (Losses) 58,200 (44,500) Liability for Employee Future Benefits 568,500$ 514,800$
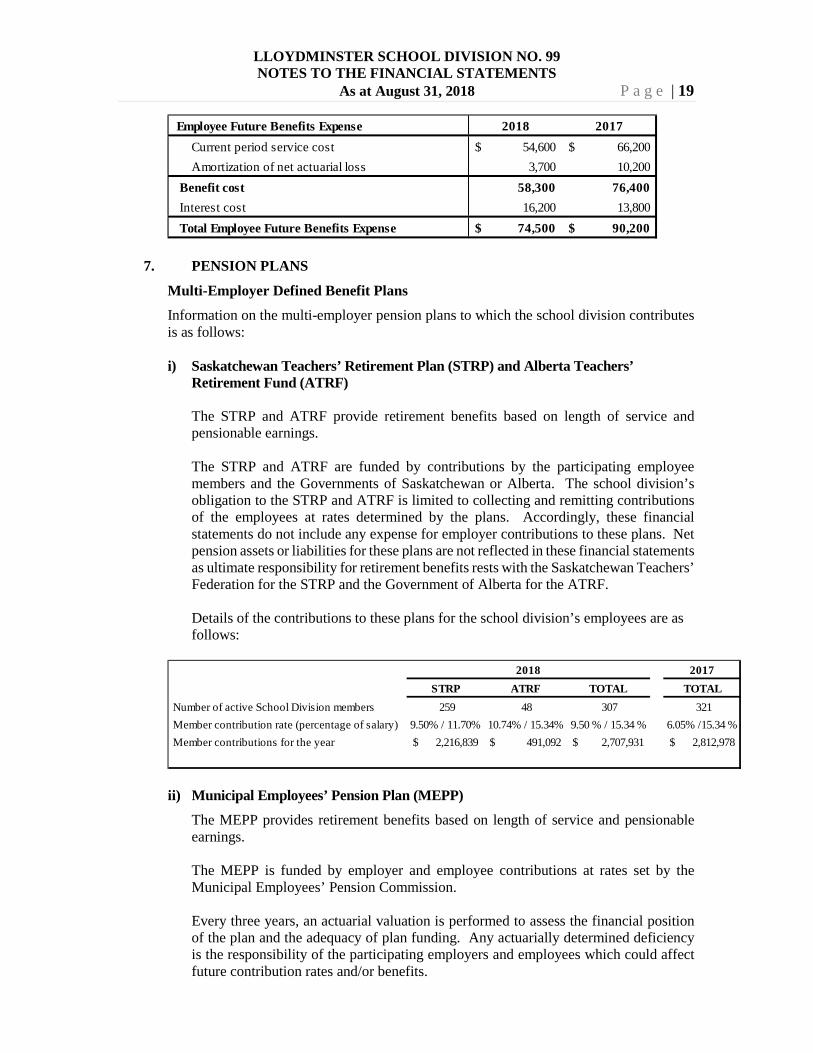
LLOYDMINSTER SCHOOL DIVISION NO. 99 NOTES TO THE FINANCIAL STATEMENTS
As at August 31, 2018 P a g e | 19
7. PENSION PLANS
Multi-Employer Defined Benefit Plans
Information on the multi-employer pension plans to which the school division contributes is as follows: i) Saskatchewan Teachers’ Retirement Plan (STRP) and Alberta Teachers’
Retirement Fund (ATRF) The STRP and ATRF provide retirement benefits based on length of service and pensionable earnings. The STRP and ATRF are funded by contributions by the participating employee members and the Governments of Saskatchewan or Alberta. The school division’s obligation to the STRP and ATRF is limited to collecting and remitting contributions of the employees at rates determined by the plans. Accordingly, these financial statements do not include any expense for employer contributions to these plans. Net pension assets or liabilities for these plans are not reflected in these financial statements as ultimate responsibility for retirement benefits rests with the Saskatchewan Teachers’ Federation for the STRP and the Government of Alberta for the ATRF. Details of the contributions to these plans for the school division’s employees are as follows:
ii) Municipal Employees’ Pension Plan (MEPP)
The MEPP provides retirement benefits based on length of service and pensionable earnings. The MEPP is funded by employer and employee contributions at rates set by the Municipal Employees’ Pension Commission. Every three years, an actuarial valuation is performed to assess the financial position of the plan and the adequacy of plan funding. Any actuarially determined deficiency is the responsibility of the participating employers and employees which could affect future contribution rates and/or benefits.
Employee Future Benefits Expense 2018 2017 Current period service cost 54,600$ 66,200$ Amortization of net actuarial loss 3,700 10,200 Benefit cost 58,300 76,400 Interest cost 16,200 13,800 Total Employee Future Benefits Expense 74,500$ 90,200$
2017STRP ATRF TOTAL TOTAL
Number of active School Division members 259 48 307 321 Member contribution rate (percentage of salary) 9.50% / 11.70% 10.74% / 15.34% 9.50 % / 15.34 % 6.05% /15.34 % Member contributions for the year 2,216,839$ 491,092$ 2,707,931$ 2,812,978$
2018
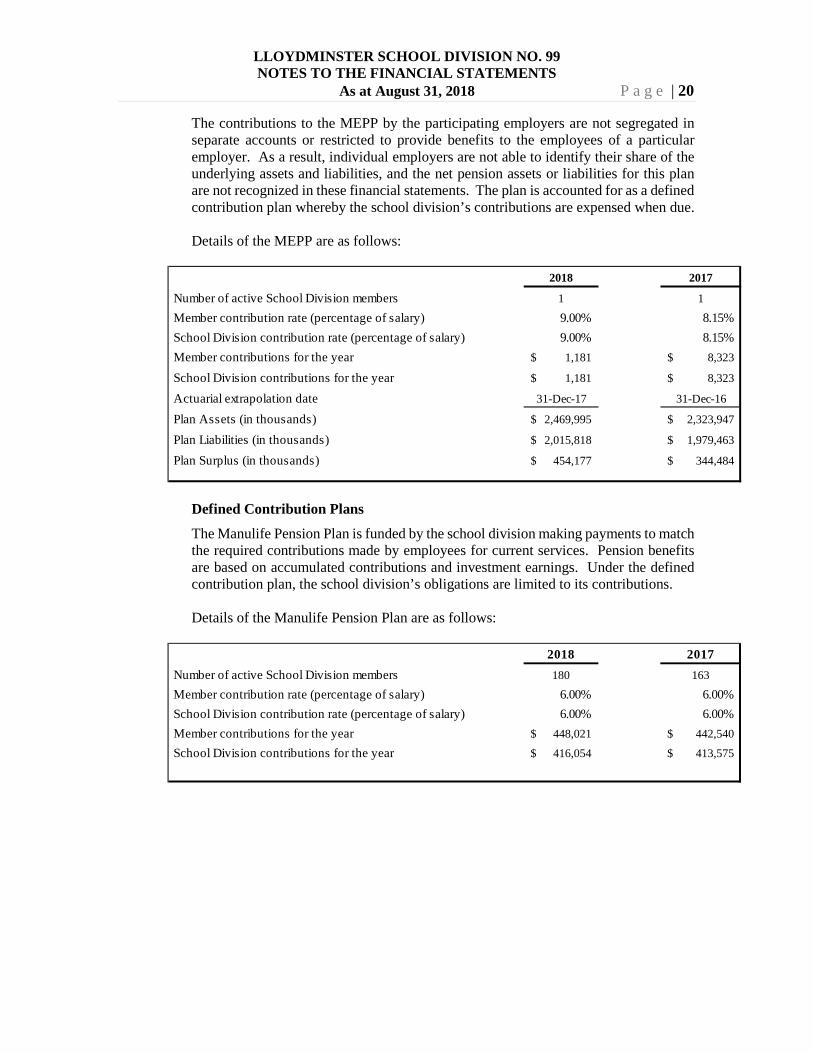
LLOYDMINSTER SCHOOL DIVISION NO. 99 NOTES TO THE FINANCIAL STATEMENTS
As at August 31, 2018 P a g e | 20
The contributions to the MEPP by the participating employers are not segregated in separate accounts or restricted to provide benefits to the employees of a particular employer. As a result, individual employers are not able to identify their share of the underlying assets and liabilities, and the net pension assets or liabilities for this plan are not recognized in these financial statements. The plan is accounted for as a defined contribution plan whereby the school division’s contributions are expensed when due. Details of the MEPP are as follows:
Defined Contribution Plans
The Manulife Pension Plan is funded by the school division making payments to match the required contributions made by employees for current services. Pension benefits are based on accumulated contributions and investment earnings. Under the defined contribution plan, the school division’s obligations are limited to its contributions. Details of the Manulife Pension Plan are as follows:
2018 2017
Number of active School Division members 1 1
Member contribution rate (percentage of salary) 9.00% 8.15% School Division contribution rate (percentage of salary) 9.00% 8.15% Member contributions for the year 1,181$ 8,323$
School Division contributions for the year 1,181$ 8,323$
Actuarial extrapolation date 31-Dec-17 31-Dec-16
Plan Assets (in thousands) 2,469,995$ 2,323,947$
Plan Liabilities (in thousands) 2,015,818$ 1,979,463$
Plan Surplus (in thousands) 454,177$ 344,484$
2018 2017 Number of active School Division members 180 163
Member contribution rate (percentage of salary) 6.00% 6.00% School Division contribution rate (percentage of salary) 6.00% 6.00% Member contributions for the year 448,021$ 442,540$
School Division contributions for the year 416,054$ 413,575$

LLOYDMINSTER SCHOOL DIVISION NO. 99 NOTES TO THE FINANCIAL STATEMENTS
As at August 31, 2018 P a g e | 21
8. ACCOUNTS RECEIVABLE
All accounts receivable presented on the statement of financial position are net of any valuation allowances for doubtful accounts. Details of accounts receivable balances and allowances are as follows:
9. ACCOUNTS PAYABLE AND ACCRUED LIABILITIES
Details of accounts payable and accrued liabilities are as follows:
10. LONG-TERM DEBT
Details of long-term debt are as follows:
Total Valuation Net of Total Valuation Net ofReceivable Allowance Allowance Receivable Allowance Allowance
Taxes Receivable -$ -$ -$ 48,452$ -$ 48,452$ Provincial Grants Receivable 322,931 - 322,931 6,924 - 6,924 Other Receivables 423,250 - 423,250 340,254 - 340,254 Total Accounts Receivable 746,181$ -$ 746,181$ 395,630$ -$ 395,630$
2018 2017
2018 2017
Accrued Salaries and Benefits 134,766$ 48,030$ Supplier Payments 1,808,119 2,128,810 Other - GST Payable 20,136 -
Total Accounts Payable and Accrued Liabilities 1,963,021$ 2,176,840$
2018 2017
Capital Loans:
(1) Monthly payments of principal and interest combined of $15,005, interest rate of 4.20%; due on the 28th day of each month through January 2033 (BMO - College Park School Construction) 1,945,127$ 2,041,325$
(2) Monthly payments of principal and interest combined of $1,589, interest rate of 3.30%; due on the last day of each month through April 2018 (BMO - Replacement of Bishop Lloyd Boiler) - 12,553
Total Long-Term Debt 1,945,127$ 2,053,878$

LLOYDMINSTER SCHOOL DIVISION NO. 99 NOTES TO THE FINANCIAL STATEMENTS
As at August 31, 2018 P a g e | 22
11. DEFERRED REVENUE
Details of deferred revenues are as follows:
Future principal repayments over the next 5 years are estimated as follows:
Capital Loans Total
2019 100,294$ 100,294$ 2020 104,590 104,590 2021 109,067 109,067 2022 113,737 113,737 2023 118,607 118,607 Thereafter 1,398,832 1,398,832
Total 1,945,127$ 1,945,127$
Principal and interest payments on the long-term debt are as follows:
Capital Loans 2018 2017
Principal 108,751$ 108,751$ 110,569$ Interest 84,013 84,013 88,570 Total 192,764$ 192,764$ 199,139$
Balance Additions Revenue Balanceas at during the recognized as at
Aug. 31, 2017 Year in the Year Aug. 31, 2018 Other deferred revenue:Property Taxes 3,010,045$ 2,880,080$ 3,010,045$ 2,880,080$ Other 70,470 142,312 70,470 142,312 Total Deferred Revenue 3,080,515$ 3,022,392$ 3,080,515$ 3,022,392$

LLOYDMINSTER SCHOOL DIVISION NO. 99 NOTES TO THE FINANCIAL STATEMENTS
As at August 31, 2018 P a g e | 23
12. COMPLEMENTARY SERVICES
Complementary services represent those services and programs where the primary purpose is other than K-12 learning/learning support, but which have the specific objective of enhancing the school division’s ability to successfully deliver its K-12 curriculum/learning programs. Following is a summary of the revenue and expenses of the Complementary Services programs operated by the school division:
The purpose and nature of each Complementary Services program is as follows:
i) Pre-Kindergarten is a comprehensive initiative targeting children who may benefit from additional supports such as speech language and social development programming and is limited to children who are three and four years of age.
ii) School Nutrition is an initiative funded by the Alberta Ministry of Education to establish or enhance existing nutrition programs in identified schools.
iii) Other Programs represent Breakfast Programs, where the diverse learning needs of children and youth are met by incorporating a comprehensive range of effective educational practices. One of these practices includes providing nutritional meal options to students.
13. EXTERNAL SERVICES
External services represent those services and programs that are outside of the school division’s learning/learning support and complementary programs. These services have no direct link to the delivery of the school division’s K-12 programs nor do they directly enhance the school division’s ability to deliver its K-12 programs. Following is a summary of the revenue and expenses of the External Services programs operated by the school division:
Summary of Complementary Services Revenues and Expenses, by Program Pre-K
ProgramsSchool
NutritionOther
Programs 2018 2017
Revenues:
Operating Grants $ 194,484 $ 141,000 $ - $ 335,484 $ 200,160 Total Revenues 194,484 141,000 - 335,484 200,160 Expenses:Salaries & Benefits 388,322 20,847 5,003 414,172 464,749 Student Related Expenses 6,335 116,292 9,570 132,197 11,666 Total Expenses 394,657 137,139 14,573 546,369 476,415 Excess (Deficiency) of Revenues over Expenses $ (200,173) $ 3,861 $ (14,573) $ (210,885) $ (276,255)

LLOYDMINSTER SCHOOL DIVISION NO. 99 NOTES TO THE FINANCIAL STATEMENTS
As at August 31, 2018 P a g e | 24
The purpose and nature of each External Services program is as follows:
i) The Cafeteria provides food services for students at the school division’s Middle Schools and High School over the noon hour, as well as for special events that are occurring within the school division throughout the year.
ii) The KidsFirst program helps vulnerable families to become the best parents they can be by enhancing knowledge, providing support and building on family strengths.
iii) Other Programs represents LPSD Literacy program. The LPSD Literacy program promotes increasing literacy rates amongst the students within the division and ensuring that students have access to supports during the periods of time when traditional teaching is not available.
14. ACCUMULATED SURPLUS
Accumulated surplus represents the financial assets and non-financial assets of the school division less liabilities. This represents the accumulated balance of net surplus arising from the operations of the school division including school generated funds. Certain amounts of the accumulated surplus, as approved by the board of education, have been designated for specific future purposes such as school generated funds, incomplete budgets, replacement of aging vehicles, community track and technology evergreening. These internally restricted amounts are included in the accumulated surplus presented in the statement of financial position. The school division does not maintain separate bank accounts for the internally restricted amounts. Details of accumulated surplus are as follows:
Summary of External Services Revenues and Expenses, by Program
Cafeteria KidsFirstOther
Programs 2018 2017
Revenues:Operating Grants $ - $ 76,896 $ 6,597 $ 83,493 $ 89,083 Fees and Other Revenues 97,397 - - 97,397 116,369 Total Revenues 97,397 76,896 6,597 180,890 205,452 Expenses:Grant Transfers - 75,906 - 75,906 75,906 Salaries & Benefits 54,823 - - 54,823 60,088 Supplies and Services 59,086 - 998 60,084 76,135 Building Operating Expenses - - - - 3,245 Total Expenses 113,909 75,906 998 190,813 215,374 Excess (Deficiency) of Revenues over Expenses $ (16,512) $ 990 $ 5,599 $ (9,923) $ (9,922)

LLOYDMINSTER SCHOOL DIVISION NO. 99 NOTES TO THE FINANCIAL STATEMENTS
As at August 31, 2018 P a g e | 25
(1) PMR Maintenance Project Allocations represent transfers received from the
Ministry of Education as funding support for maintenance projects on the school division’s approved 3-year capital maintenance plans. Unspent funds at the end of a fiscal year are designated for future approved capital plan maintenance project expenditures.
The purpose and nature of each Internally Restricted Surplus amount is as follows:
i) The Designated for tangible capital asset reserve is monies received through government grants that have been set aside for the addition of a new portable classroom at Avery Outreach School.
ii) The Community Track fund is to be used to enhance the track and field area at the Lloydminster Comprehensive High School.
iii) The Maintenance Vehicle Purchase fund is to be used for the purchase of maintenance vehicles in the future.
iv) The Technology Evergreening fund will be used to refresh computers and other technology over a predetermined period of time.
v) The School Bus Purchase fund will be used to support the purchase of additional school buses in future fiscal years.
vi) The Facilities Upgrade fund will be used to fund capital projects in future fiscal years. vii) School generated funds are accumulated surpluses from the various extracurricular
activities that are to support future operating costs of these activities.
August 31 2017
Additions during the
year
Reductions during the
yearAugust 31
2018 Invested in Tangible Capital Assets: Net Book Value of Tangible Capital Assets 49,364,548$ 1,231,257$ 2,543,957$ 48,051,848$ Less: Debt owing on Tangible Capital Assets (2,053,878) - (108,751) (1,945,127)
47,310,670 1,231,257 2,435,206 46,106,721
PMR maintenance project allocations (1) 315,174 364,503 576,157 103,520
Internally Restricted Surplus: Capital projects: Designated for tangible capital asset expenditures - 247,863 - 247,863 Community Track 32,000 8,000 - 40,000 Maintenance Vehicle Purchase 5,000 5,000 - 10,000 Technology Evergreening 552,116 - 266,000 286,116 School Bus Purchase - 115,000 - 115,000 Facilities Upgrades 3,303,218 30,270 304,829 3,028,659
3,892,334 406,133 570,829 3,727,638 Other: School generated funds 299,689 146,439 - 446,128 Board Strategies 504,000 - - 504,000 School budget carryovers 81,281 67,882 81,281 67,882 Incomplete Budgets 27,253 3,173 27,253 3,173 Parkland Proceeds 93,029 1,582 - 94,611 Support Staff SEB Plan - 40,000 - 40,000 KidsFirst Program 76,896 76,896 76,896 76,896
1,082,148 335,972 185,430 1,232,690
Unrestricted Surplus 1,059,706 180,887 - 1,240,593 Total Accumulated Surplus 53,660,032$ 2,518,752$ 3,767,622$ 52,411,162$

LLOYDMINSTER SCHOOL DIVISION NO. 99 NOTES TO THE FINANCIAL STATEMENTS
As at August 31, 2018 P a g e | 26
viii) The Board Strategies fund is accessible by the board to support strategic initiatives that it feels are of importance to the division.
ix) School budget carryovers are unspent school budgets from the current year that are to be spent in the upcoming fiscal year.
x) Incomplete Budgets are unspent funds on various projects that are to be completed in the upcoming fiscal year.
xi) The Parkland Proceeds fund is to be used to purchase specialized equipment to support the program for intensive needs children.
xii) The Support Staff SEB Plan fund is set up to top up an employee’s Employment Insurance benefits during the period of time immediately following the birth of a child.
xiii) The KidsFirst Program represents a transfer received from the Ministry of Education as funding to support the KidsFirst Program in the upcoming fiscal year.
15. BUDGET FIGURES
Budget figures included in the financial statements were approved by the board of education on June 28, 2017 and the Minister of Education on August 28, 2017.
16. RELATED PARTIES
These financial statements include transactions with related parties. The school division is related to all Government of Saskatchewan ministries, agencies, boards, school divisions, Saskatchewan Health Authority, colleges, and crown corporations under the common control of the Government of Saskatchewan. Related parties of the school division also include its key management personnel, close family members of its key management personnel, and entities controlled by, or under shared control of any of these individuals.
Related Party Transactions
Transactions with these related parties have occurred and been settled on normal trade terms.
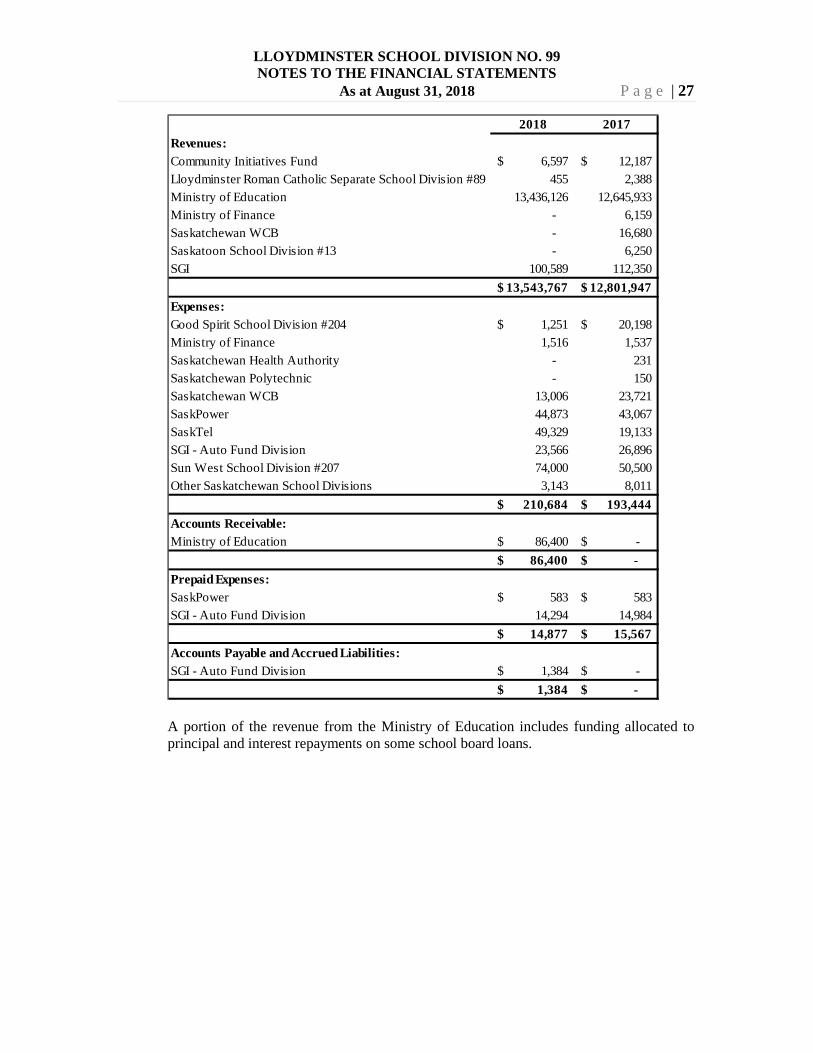
LLOYDMINSTER SCHOOL DIVISION NO. 99 NOTES TO THE FINANCIAL STATEMENTS
As at August 31, 2018 P a g e | 27
A portion of the revenue from the Ministry of Education includes funding allocated to principal and interest repayments on some school board loans.
2018 2017Revenues:Community Initiatives Fund 6,597$ 12,187$ Lloydminster Roman Catholic Separate School Division #89 455 2,388 Ministry of Education 13,436,126 12,645,933 Ministry of Finance - 6,159 Saskatchewan WCB - 16,680 Saskatoon School Division #13 - 6,250 SGI 100,589 112,350
13,543,767$ 12,801,947$ Expenses:Good Spirit School Division #204 1,251$ 20,198$ Ministry of Finance 1,516 1,537 Saskatchewan Health Authority - 231 Saskatchewan Polytechnic - 150 Saskatchewan WCB 13,006 23,721 SaskPower 44,873 43,067 SaskTel 49,329 19,133 SGI - Auto Fund Division 23,566 26,896 Sun West School Division #207 74,000 50,500 Other Saskatchewan School Divisions 3,143 8,011
210,684$ 193,444$ Accounts Receivable:Ministry of Education 86,400$ -$
86,400$ -$ Prepaid Expenses:SaskPower 583$ 583$ SGI - Auto Fund Division 14,294 14,984
14,877$ 15,567$ Accounts Payable and Accrued Liabilities:SGI - Auto Fund Division 1,384$ -$
1,384$ -$

LLOYDMINSTER SCHOOL DIVISION NO. 99 NOTES TO THE FINANCIAL STATEMENTS
As at August 31, 2018 P a g e | 28
17. TRUSTS
The school division, as the trustee, administers trust funds for legacy scholarships. The trust assets and transactions are not included in the financial statements. Information about these trusts is as follows:
18. CONTRACTUAL OBLIGATIONS AND COMMITMENTS
Significant contractual obligations and commitments of the school division are as follows:
• Construction contract for the addition of two portables at Avery Outreach School in the amount of $489,863 payable over the next year.
• Contract for the purchase of one wheelchair accessible school bus in the amount of $112,304, payable in October 2018.
• 4-year Funding Agreement with the City of Lloydminster for a School Resource Officer program for the Division. The agreement commits the division to provide $130,000 in funding for the program over a 4-year period starting with the 2018/19 School Year.
• Lease agreements for the provision of multi-function printers at all schools and Division Office.
Operating lease obligations of the school division are as follows:
Total TotalCraig Hawkens Jones Other 2018 2017
Cash and short-term investments 68,085$ 54,472$ 44,845$ 274,624$ 442,026$ 30,566$ Portfolio investments - - - 34,487 34,487 458,447 Total Assets 68,085 54,472 44,845 309,111 476,513 489,013 Revenues Contributions and donations - - - 11,594 11,594 12,472 Interest on investments 1,406 1,104 919 6,297 9,726 10,056
1,406 1,104 919 17,891 21,320 22,528 Expenses Awarded to Students 4,000 1,500 2,000 26,320 33,820 35,786
4,000 1,500 2,000 26,320 33,820 35,786 Deficiency of Revenues over Expenses (2,594) (396) (1,081) (8,429) (12,500) (13,258) Trust Fund Balance, Beginning of Year 70,679 54,868 45,926 317,540 489,013 502,271 Trust Fund Balance, End of Year 68,085$ 54,472$ 44,845$ 309,111$ 476,513$ 489,013$
2018
Copier Leases
Total Operating
Future minimum lease payments:
2019 22,752$ 22,752$
Total Lease Obligations 22,752$ 22,752$
Operating Leases

LLOYDMINSTER SCHOOL DIVISION NO. 99 NOTES TO THE FINANCIAL STATEMENTS
As at August 31, 2018 P a g e | 29
19. RISK MANAGEMENT
The school division is exposed to financial risks from its financial assets and liabilities. These risks include credit risk, liquidity risk and market risk consisting of interest rate risk.
i) Credit Risk
Credit risk is the risk to the school division from potential non-payment of accounts receivable. The credit risk related to the school division's receivables from the provincial government, federal government and their agencies are considered to be minimal. For other receivables, the school division has adopted credit policies which include the close monitoring of overdue accounts. The school division does not have a significant exposure to any individual customer. Management reviews accounts receivable on a case by case basis to determine if a valuation allowance is necessary to reflect impairment in collectability. The aging of provincial grants and other accounts receivable as at August 31, 2018 was:
Receivable amounts related to GST are not applicable to credit risk, as these do not meet the definition of a financial instrument.
ii) Liquidity Risk
Liquidity risk is the risk that the school division will not be able to meet its financial obligations as they come due. The school division manages liquidity risk by maintaining adequate cash balances and through its budget practices and monitoring. The following table sets out the contractual maturities of the school division’s financial liabilities:
Total Current 0-30 days 30-60 days 60-90 days Over 90 days
Grants Receivable 322,931$ -$ 322,931$ -$ -$ -$ Other Receivables 19,845 15,376 - 419 50 4,000 Net Receivables 342,776$ 15,376$ 322,931$ 419$ 50$ 4,000$
August 31, 2018
TotalWithin
6 months6 months to 1 year 1 to 5 years > 5 years
Accounts payable and accrued liabilities 1,963,021$ 1,963,021$ -$ -$ -$ Long-term debt (includes interest) 2,596,237 90,467 90,028 720,221 1,695,521 Total 4,559,258$ 2,053,488$ 90,028$ 720,221$ 1,695,521$
August 31, 2018

LLOYDMINSTER SCHOOL DIVISION NO. 99 NOTES TO THE FINANCIAL STATEMENTS
As at August 31, 2018 P a g e | 30
iii) Market Risk
The school division is exposed to market risks with respect to interest rates as follows: Interest Rate Risk
Interest rate risk is the risk that the fair value or future cash flows of a financial instrument will fluctuate because of changes in market interest rates. The school division’s interest rate exposure relates to cash and cash equivalents and portfolio investments.
The school division also has an authorized bank line of credit of $2,600,000 with interest payable monthly at the bank’s prime rate. Changes in the bank's prime rate can cause fluctuation in interest payments and cash flows. There was no balance outstanding on this credit facility as of August 31, 2018. The school division minimizes these risks by:
• holding cash in an account at a Canadian Credit Union, denominated in Canadian currency,
• investing in GICs and term deposits for short terms at fixed interest rates, • managing cash flows to minimize utilization of its bank line of credit, • managing its interest rate risk on long-term debt through the exclusive use of
fixed rate terms for its long-term debt.