lloydminster public school division #99 2015-16 annual report
TRANSCRIPT

Ensuring Personal Excellence For All Students
Lloydminster Public School Division #99 2015-16 Annual Report

Table of Contents Table of Contents ............................................................................................................................. i
School Division Contact Information ...............................................................................................ii
Letter of Transmittal ....................................................................................................................... 1
Introduction .................................................................................................................................... 2
School Division Profile..................................................................................................................... 3
Division Mission Statement ................................................................................................... 4
Division Vision Statement ..................................................................................................... 4
Division Values ........................................................................................................................ 4
Governance ..................................................................................................................................... 6
School Division in the Community .................................................................................................. 8
Strategic Direction and Reporting ................................................................................................ 10
Demographics ............................................................................................................................... 31
Facilities Infrastructure Projects and Transportation ................................................................... 33
Student Transportation ............................................................................................................. 34
Financial Overview ........................................................................................................................ 36
Summary of Revenue and Expenses ......................................................................................... 36
Budget to Actual Revenue, Expenses and Variances ................................................................ 37
Appendices .................................................................................................................................... 38
Appendix A – Payee List ............................................................................................................ 38
Board Remuneration ............................................................................................................. 38
Personal Services ................................................................................................................... 38
Supplier Payments ................................................................................................................. 42
Appendix B – Management Report and Audited Financial Statements ................................... 44
Lloydminster Public SD Board of Education Annual Report – 2015-16 – Page i

School Division Contact Information
Lloydminster Public School Division #99 “Ensuring Personal Excellence for All Students”
5017- 46 Street Lloydminster, AB T9V 1R4 Phone: 780-875-5541 Fax: 780-875-7829 Website: http://www.lpsd.ca An electronic copy of this report is available at http://www.lpsd.ca
Lloydminster Public SD Board of Education Annual Report – 2015-16 – Page ii

Letter of Transmittal
Honourable Don Morgan Minister of Education Dear Minister Morgan: The Board of Education of Lloydminster School Division #99 is pleased to provide you and the residents of the school division with the 2015-16 annual report. This report outlines activities and accomplishments of the school division and provides audited financial statements for the fiscal year September 1, 2015 to August 31, 2016. Respectfully submitted,
David Thompson
Lloydminster Public SD Board of Education Annual Report – 2015-16 – Page 1

Introduction This annual report presents an overview of Lloydminster Public School Division’s activities and results for the fiscal year September 1, 2015 to August 31, 2016. It provides a snapshot of the division, its governance structures, students, staff, programs, and facilities. It also includes results and analysis of a number of indicators that contribute to student success. In addition to detailing the school division’s activities and performance, this report outlines how the division is implementing its strategic plan, provides a financial overview and audited financial statements, and includes appendices such as an organizational chart, school list, and payee list. Financial statements included in this report have been audited by an independent auditor following the Canadian Generally Accepted Auditing Standards.
Lloydminster Public SD Board of Education Annual Report – 2015-16 – Page 2

School Division Profile About Us The Lloydminster Public School Division is a very complex organization, in that it is both a Saskatchewan and Alberta school division. The Division follows the Saskatchewan curriculum and reports primarily to the Saskatchewan Ministry of Education. It also receives funding from Alberta Education to support a number of student learning and facility initiatives. This complex environment creates an opportunity for the Division to simultaneously glean the best from two provinces. However, at the same time, the situation presents challenges by requiring the School Division to be accountable to two provincial authorities and operating procedures.
Our School Division has five elementary schools, one kindergarten to grade 9 school, two middle schools, one -high school and one outreach school. All of our schools offer students a well-rounded education based on curricula provided by the Saskatchewan Ministry of Education. Students who attend our schools not only receive excellent curricular instruction, but also benefit from extensive co-curricular and extra-curricular opportunities! The economy of the Lloydminster area reflects both the Oil industry and Agriculture. There has been evidence of the downturn in the economy through job loss, which results in more students for breakfast/lunch programs and other subsidies we can offer.
Lloydminster Public SD Board of Education Annual Report – 2015-16 – Page 3

Division Philosophical Foundation
Division Mission Statement
“Ensuring Personal Excellence for All Students”
Division Vision Statement
Lloydminster Public School Division has a shared commitment with parents and community to create a safe and caring learning environment in order to prepare students to be inspired learners and productive citizens.
Division Values
• Respect for diversity • Care for themselves and others • Respect for authority, property, and the environment • Continuous improvement • Excellence in all they do • Leadership in making positive choices • Accountability for their choices and actions • Collaborative relationships
Division Belief Statements
• We believe all students can achieve personal excellence given sufficient time and the right supports;
• We believe high expectations and early and ongoing interventions are essential; • We believe all staff can perform to high standards given the right assistance; • We believe all staff can articulate what they do and why they perform the way they do.
Program Overview The students in Lloydminster Public School Division are diverse. They vary in age, personal circumstances, learning styles, interests, and individual strengths and needs. In order to provide the best education possible for all our students, Lloydminster Public School Division offers a wide range of programs in the 10 schools of the Division. Central to the program in every school is the provincially-mandated core curricula, broad areas of learning and cross-curricular competencies. Classroom instruction is designed to incorporate differentiated instruction, First Nations and Métis (FNM) content, perspectives and ways of knowing, and the adaptive dimension. In addition, each school in the Division offers specialized programming that responds to the needs of its students. The following list identifies programs in operation at one or more of the Division’s schools:
Lloydminster Public SD Board of Education Annual Report – 2015-16 – Page 4

• Alternative programming for vulnerable students • Community school programming • Core French instruction • Distance education • English as an Additional Language programming • Technical/Vocational programs • Hockey Academy • Music/band programming • Nutrition programs • Pre-kindergarten programs • Technology-enhanced learning
Additional services and supports are offered to students and teachers by specialized School Division staff including:
• Literacy Coaches and Technology Consultants • Educational psychologist services • English as an Additional Language lead teachers • Occupational Therapist • Speech and language Pathologists • Student Counsellors • Targeted Skills Teachers • FNM Lead Teachers
The School Division has undertaken a number of on-going initiatives which include the following:
• Early Reading Intervention • Skills Canada • Student Leadership • Soundfield Systems • Job Safety • Hockey Academy • Technology Plan • Avery Outreach School • FNM Cultural Activities and Events • Embedded Music Lessons (FOPA) • Pre-kindergarten • Student and staff Wellness
Lloydminster Public SD Board of Education Annual Report – 2015-16 – Page 5

Governance The Board of Education Lloydminster Public School Division is governed by a seven-person elected Board of Education. The Education Act, 1995 gives the Board of Education the authority to “administer and manage the educational affairs of the school division” and to “exercise general supervision and control over the schools in the school division”.
Board members are elected “at large” and reside in the City of Lloydminster. There are no sub-divisions in Lloydminster Public School Division.
The current Board of Education was elected on October 24, 2012 and will serve a four-year term. Board of Education members at September 1, 2016 were:
Chair ...................................................................................... David Thompson Vice-Chair.............................................................................. Karoline Kennedy Member................................................................................ Eric Bloch-Hansen Member........................................................................................ Cathy Cornet Member........................................................................................... Chrissy Gee Member........................................................................................... Yana Knight Member....................................................................................... Joy Wareham A list of the remuneration paid to board members in 2015-16 is provided in Appendix A.
Lloydminster Public School Division - Board of Education
David Thompson
Board Chair Karoline Kennedy
Vice-Chair Chrissy
Gee Cathy Cornet Eric Bloch-Hansen Yana Knight Joy Wareham
Lloydminster Public SD Board of Education Annual Report – 2015-16 – Page 6

School Community Councils The Board of Education has established a School Community Council (SCC) for each of the ten schools in the Lloydminster Public School Division.
The Education Regulations, 1986 require school divisions to undertake orientation, training, development and networking opportunities for their SCC members. In 2015-16 Lloydminster Public School Division conducted a forum, for this purpose, for all ten of its SCCs and executives.
The Regulations also require SCCs to work with school staff to develop an annual school Learning Improvement Plan (LIP) that is aligned with the school division’s strategic plan and to recommend that plan to the Board of Education. In 2015-16, all ten of the division’s SCCs reviewed and signed these Plans.
School Community Councils are also expected to facilitate parent and community participation in planning and to provide advice to the Board of Education, the school’s staff, and other agencies involved in the learning and development of students. We had two meetings in 2015-16, once in the Fall and once in the Spring whereby each SCC chair or designate shared their goals and accomplishments and heard from our Board Chair and Director about such items as the Strategic Plan. It was a great opportunity to celebrate, ask questions and seek feedback. The advice the SCCs give to the Board of Education encompasses policies, programs, and educational service delivery; the advice they give to the school staff relates to the school’s programs. SCCs enable the community to participate in educational planning and decision making, and promote shared responsibility for learning among community members, students and educators.
All ten of the SCCs in Lloydminster Public School Division are made up of the required number of elected and appointed members, as outlined in The Education Regulations, 1986. The actual number of members varies from one SCC to another.
Lloydminster Public SD Board of Education Annual Report – 2015-16 – Page 7

School Division in the Community Lloydminster Public School Division is an integral part of community life in west central Saskatchewan. The Division, as a whole, and individual schools are linked to the broader community in a multitude of ways. The Board of Education places strong emphasis on community and parent involvement, and on community partnerships.
Community and Parent Involvement Research has shown that students achieve at higher levels in school when their parents/guardians and other community members are involved in education. The schools of Lloydminster Public School Division all have programs and initiatives to encourage community and parent involvement. These programs vary from school to school and are, therefore, unique to each school community.
What all the schools of Lloydminster Public School Division have in common is the importance of School Community Councils (SCCs) as a mechanism for connecting community and school. SCCs play a role in governance (described more fully in the next section) and most have established formal processes to foster community and parent involvement.
An example of Lloydminster Public School Division in the Community was having Board Members, Senior Leaders and Principal/Vice-Principals take shifts at a Lloydminster Public School Division Booth at the Annual Fall Trade Show. The public was encouraged to do a short survey about the best ways to communicate with families, visit and enter draws. It was an amazing opportunity to visit, gain insight and be a presence within the community. We had a lot of positive feedback from parents, staff and community members and therefore we will do it again this November.
LPSD had over 1000 parent volunteers throughout the 2015-16 school year!
Community Partnerships Lloydminster Public School Division and individual schools within the Division have established a range of formal and informal community partnerships in order to promote student learning and ensure that students’ school experience is positive and successful. Some examples of these partners include: Lakeland College, City of Lloydminster, Vic Juba Theatre, Native Friendship Center, FOPA (Friends of the Performing Arts) and the Jr. A Bobcats.
Schools in the Division use an integrated services model in which they partner with social service agencies to ensure that students’ physical, social, and psychological needs are met. This approach recognizes that students who are healthy and happy have greater capacity to learn and to succeed in school and in life.
Several schools in the Division have partnered with local businesses. The purpose of these partnerships is to enrich students’ educational experience and to help them connect what they learn at school to the world of work. Typically, the partner business provides job shadowing
Lloydminster Public SD Board of Education Annual Report – 2015-16 – Page 8

opportunities for students and sends representatives to the schools to talk about their business or industry.
Lloydminster Public School Division provided leadership in the developing and chairing of HUB meetings throughout the school year. This framework unites Prairie North Regional Health, AB/SK Social Services, Lloydminster RCMP, AB/SK Ministries of Justice and Corrections and Alberta Works to serve individuals and families who are at risk.
Partnerships were formed between Thunderchild First Nations for a High School project and Lloydminster Native Friendship Centre for an Elementary School project which began in the 2014-15 School year and continues today.
Lloydminster Public SD Board of Education Annual Report – 2015-16 – Page 9

Strategic Direction and Reporting The Education Sector Strategic Plan Members of the education sector have worked together to develop an Education Sector Strategic Plan (ESSP) for 2014-2020. The ESSP describes the strategic direction of the education sector and its priorities and outcomes align the work of school divisions and the Ministry of Education. The plan is expected to shape a new direction in education for the benefit of all Saskatchewan students. 2015-16 was the second year of deployment of the 2014-2020 ESSP. Enduring Strategies The Enduring Strategies in the ESSP are:
Culturally relevant and engaging curriculum; Differentiated, high quality instruction; Culturally appropriate and authentic assessment; Targeted and relevant professional learning; Strong family, school and community partnerships; Alignment of human, physical and fiscal resources.
Lloydminster Public SD Board of Education Annual Report – 2015-16 – Page 10

Improving First Nations and Métis Student Engagement and Graduation Rates and Following Their Voices OUTCOME: By June 30, 2020, collaboration between First Nations and Métis and non-First Nations and Métis partners will result in significant improvement in First Nations and Métis student engagement and will increase the three-year graduation rate from 35% in June 2012 to at least 65%. PRIORITY: In partnership with First Nations and Métis stakeholders implement the Following Their Voices Initiative (Phase 1).
School division goals aligned with the First Nations and Métis Student Engagement and Graduation Rates outcome and the Following Their Voices priority
• By March 2016, 80% of First Nations and Métis (FNM) students in Grades 1-3 will perform at grade level using the Fountas and Pinnell Reading Benchmark Assessment System.
• By June, 2016, 65% of FNM students will graduate from high school within three years of starting grade 10.
School division actions taken during the 2015-16 school year to achieve the targets and outcomes of the First Nations and Métis Student Engagement and Graduation Rates outcome and the Following Their Voices priority
• Collected disaggregated FNM reading and math achievement for grades 1-3, 4-6 and achievement data for grades 7-9; course completion for grades 10-12.
• Refined implementation of the Level Literacy Intervention Program. • Developed and implemented a list of strategies and actions to support
students of FNM background at Lloydminster Comprehensive High School.
• Engaged LPSD students by participating in Aboriginal cultural activities. Schools planned to host or participate in an Aboriginal Cultural activity or event.
• Provided teachers and administrators with opportunities to develop FNM understandings and Treaty Education knowledge through professional development.
Measures for Improving First Nations and Métis Student Engagement and Graduation Rates and Following Their Voices
Average Final Marks Teacher assigned marks are important indicators of student performance in school. Classroom marks are used for grade promotion and graduation decision, to meet entrance requirements for postsecondary education, to determine eligibility for scholarships and awards and by some employers when hiring. The following displays average final marks in selected secondary-level courses for all students, and by non-FNMI and FNMI student subpopulations in the division, along with provincial results for each category.
Lloydminster Public SD Board of Education Annual Report – 2015-16 – Page 11

Notes: Results for populations of fewer than 10 students have not been reported to avoid identifying individuals or very small groups of students (nr). FNMI students are those who choose to self-identify as First Nations (Registered/Treaty/Status Indian, Non-Status Indian), Métis, or Inuit/Inuk. Non-FNMI students are those who do not identify as FNM or I, however this category may include FNMI students who choose not to self-identify. Source: Ministry of Education, 2016
Analysis of results
Average final marks for selected secondary-level courses for FNMI students are generally slightly higher than the provincial marks for FNMI students. The average final marks for selected secondary-level courses for all students are generally slightly lower than the province. In all selected secondary-level courses, FNMI students achieved lower grades than non-FNMI students. This trend has been consistent over the past three years. The gap ranges from 15% difference to a 5% difference in marks for the selected secondary-level courses. The division will attend to further analysis of this data to investigate the achievement gap between FNMI students and Non-FNMI students.
Credit Attainment Credit attainment provides a strong predictive indicator of a school system’s on-time graduation rate. Students receiving eight or more credits per year are more likely to graduate within three years of beginning Grade 10 than those who do not achieve eight or more credits per year. The following displays the credit attainment of secondary students attaining eight or more credits per year for all students, and by non-FNMI and FNMI student subpopulations in the division, along with provincial results for each category.
ProvinceLloydminster
SDProvince
Lloydminster SD
ProvinceLloydminster
SDEnglish Language Arts A 10 (Eng & Fr equiv) 73.0 71.7 76.1 72.8 61.1 61.9
English Language Arts B 10 (Eng & Fr equiv) 73.4 73.7 76.2 74.2 62.5 67.8
Science 10 (Eng & Fr equiv) 72.0 75.8 75.1 76.8 59.6 65.9
Math: Workplace and Apprenticeship 10 (Eng & Fr equiv) 72.8 70.1 76.1 69.9 60.8 70.8
Math: Foundations and Pre-calculus 10 (Eng & Fr equiv) 72.4 70.2 74.8 71.1 60.3 59.4
English Language Arts 20 (Eng & Fr equiv) 74.4 71.0 76.3 72.3 64.7 63.3
Math: Workplace and Apprenticeship 20 (Eng & Fr equiv) 66.9 65.9 69.3 66.8 61.3 62.9
Math: Foundations 20 (Eng & Fr equiv) 73.6 72.3 75.3 73.1 63.6 61.1
Average Final Marks in Selected Secondary-Level Courses, 2015-16
SubjectAll Students Non-FNMI FNMI
Lloydminster Public SD Board of Education Annual Report – 2015-16 – Page 12

Notes: Proportions are calculated as the percentage of students enrolled at the secondary level on September 30 attaining eight or more credits yearly. Results for populations of fewer than 10 students have not been reported to avoid identifying individuals or very small groups of students (nr). FNMI students are those who choose to self-identify as First Nations (Registered/Treaty/Status Indian, Non-Status Indian), Métis, or Inuit/Inuk. Non-FNMI students are those who do not identify as FNM or I, however this category may include FNMI students who choose not to self-identify. Source: Ministry of Education, 2016
Analysis of results
The percentage of grades 10-12 students attaining 8 or more credits in Lloydminster Public School Division has stayed the same over the past three years; this rate is similar to the provincial results. The percentage of FNMI grades 10-12 students attaining 8 or more credits in Lloydminster Public School Division (41%) is significantly higher than the province (31%) in the 2015-16 school year. However, the difference in the percentage of FNMI students attaining 8 or more credits compared to the percentage of Non-FNMI students attaining 8 or more credits was 21 percent. This trend has been consistent over the past three years and is an area of concern. The division will attend to further analysis of this data to investigate the credit attainment gap between FNMI students and Non-FNMI students.
Lloydminster Public SD Board of Education Annual Report – 2015-16 – Page 13

Reading, Writing, Math at Grade Level and Saskatchewan Reads OUTCOME: By June 30, 2020, 80% of students will be at grade level or above in reading, writing and math. PRIORITY: Implement a refined set of provincial high impact reading assessment, instruction and intervention strategies (Saskatchewan Reads).
School division goals aligned with Reading, Writing and Math at Grade Level outcome and the Saskatchewan Reads priority
1) Throughout the 2015-2106, the focus of LPSD was to support Middle School Literacy teachers to be able to incorporate the pedagogy of the Saskatchewan Reads into their practice so that they were able to meet the diverse needs of their students in Reading.
2) By June 2020, 80% of grade 3 students will be reading at or above grade level.
School division actions taken during the 2015-16 school year to achieve the targets and outcomes of the Reading, Writing, Math at Grade Level outcome and the Saskatchewan Reads priority
1) To support the teachers to be successful at incorporating the Saskatchewan Reads, the following actions were taken:
• August Professional Development for Middle School Literacy Teachers
- Modelled and Shared Reading • November - Middle School Literacy Teachers learned how to analyze
data so they were able to plan their reading instruction accordingly • Throughout the year, Middle School Literacy Teachers implemented
teaching strategies - Modelled and Shared • Administration reported monthly on the progress of
students/teachers’ implementation of Saskatchewan Reads - Modelled and Shared
• Resources were researched for the following year (Guided and Independent)
• Middle Schools submitted reading achievement data to the Division Office in January, 2016 and June, 2016
2) The following actions support our reading goal:
• Grades 1-6 reading levels for 100% of *eligible students will be collected using consistent administration, collation, and reporting practices with F&P. (F&P testing will occur 3X per year (Oct., Mar., June)
• 100% of schools will design and deploy a literacy program based on Saskatchewan Reads that is aligned with the Educational Strategic Sector Plan.
• Provide professional development necessary at the school division level for in-school administrators.
• Review/assessment of SK Reads deployment with superintendent at
Lloydminster Public SD Board of Education Annual Report – 2015-16 – Page 14

School Operations Meetings • Engagement of stakeholders:
● Students will demonstrate Grade 3 reading proficiency through their comprehension, fluency and engagement. Students will set goals in reading. ● Caregivers will be informed of their child’s reading progress and efforts will be made to engage them in improving their child’s reading. ● Teachers will be provided with a family literacy brochure to share with families. ● SCCs will provide input and support on School Improvement Plans.
Measures for Reading, Writing and Math at Grade Level and Saskatchewan Reads
Proportion of Grade 3 Students Reading At or Above Grade Level Grade 3 reading levels are considered a leading indicator of future student performance. The following bar graph displays the percentage of Grade 3 students (FNMI, non-FNMI, all) by reading level grouping. The charts below the graph indicate the percentage of Grade 3 students in the province reading at or above grade level, as well as the proportion of Grade 3 students with reported reading levels.
Lloydminster Public SD Board of Education Annual Report – 2015-16 – Page 15
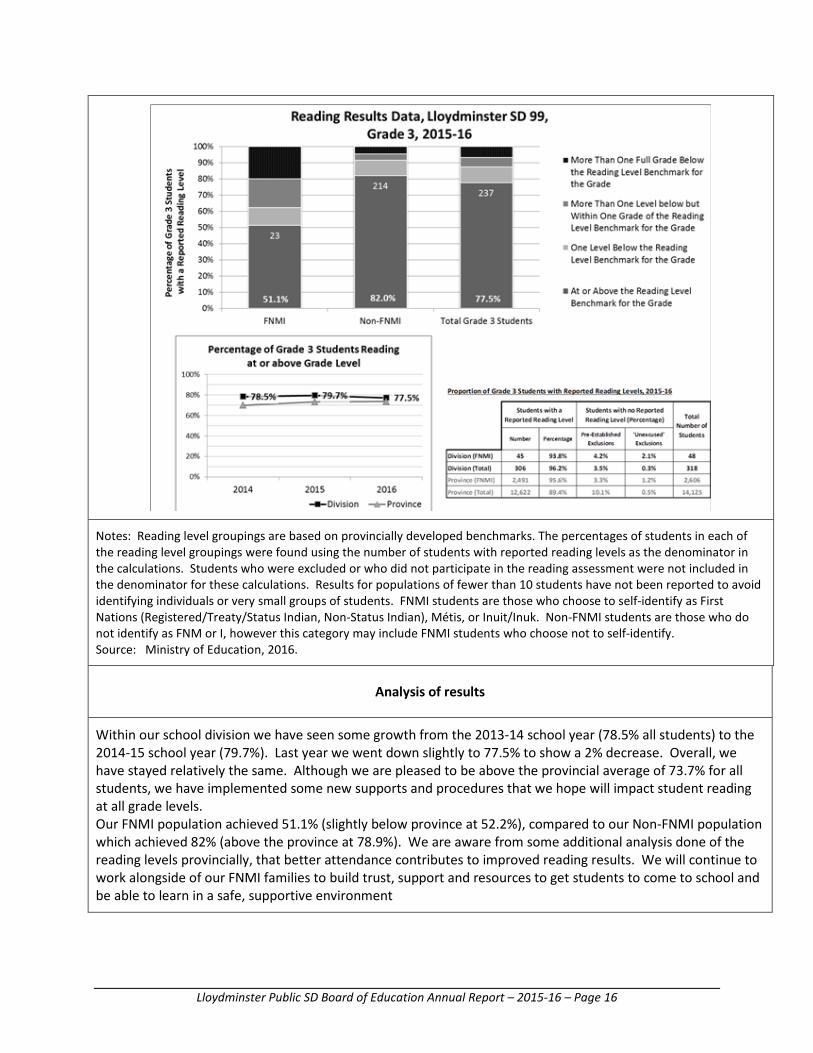
Notes: Reading level groupings are based on provincially developed benchmarks. The percentages of students in each of the reading level groupings were found using the number of students with reported reading levels as the denominator in the calculations. Students who were excluded or who did not participate in the reading assessment were not included in the denominator for these calculations. Results for populations of fewer than 10 students have not been reported to avoid identifying individuals or very small groups of students. FNMI students are those who choose to self-identify as First Nations (Registered/Treaty/Status Indian, Non-Status Indian), Métis, or Inuit/Inuk. Non-FNMI students are those who do not identify as FNM or I, however this category may include FNMI students who choose not to self-identify. Source: Ministry of Education, 2016.
Analysis of results
Within our school division we have seen some growth from the 2013-14 school year (78.5% all students) to the 2014-15 school year (79.7%). Last year we went down slightly to 77.5% to show a 2% decrease. Overall, we have stayed relatively the same. Although we are pleased to be above the provincial average of 73.7% for all students, we have implemented some new supports and procedures that we hope will impact student reading at all grade levels. Our FNMI population achieved 51.1% (slightly below province at 52.2%), compared to our Non-FNMI population which achieved 82% (above the province at 78.9%). We are aware from some additional analysis done of the reading levels provincially, that better attendance contributes to improved reading results. We will continue to work alongside of our FNMI families to build trust, support and resources to get students to come to school and be able to learn in a safe, supportive environment
Lloydminster Public SD Board of Education Annual Report – 2015-16 – Page 16

Graduation Rates Outcome: By June 30, 2020, Saskatchewan will achieve an 85% three-year graduation rate.
School Division goals aligned with the Graduation Rates outcome
By June 2016, Lloydminster Public School Division will achieve an 87% three-year graduation rate.
School division actions taken during the 2015-16 school year to achieve the targets and outcomes of the Graduation Rates outcome
Students entering grade 9 will develop and maintain a graduation and transition from high school plan.
● Developed school based procedures to meet the requirements outlined in the LPSD Assessment Administration Procedure.
● Investigated alternate pathways to learning at the high school and middle school levels.
● Compared cohort lists from the Ministry and LPSD. ● Identified former and current LPSD students who would qualify for an adult
12 diploma.
Measures for Graduation Rates
Grade 12 Graduation Rate: On-Time To graduate within the typical three year period after beginning Grade 10, students must accumulate an average of eight credits per year to achieve the minimum requirement of 24 required secondary level credits at the end of Grade 12. On-time graduation rates are one measure of the efficiency of a school system. The following displays the percentage of students (all students, non-FNMI and FNMI) in the division who graduated within three years of entering Grade 10, along with provincial results in each of these categories.
Lloydminster Public SD Board of Education Annual Report – 2015-16 – Page 17

Notes: On-time graduation rates are calculated as the percentage of students who complete Grade 12 within 3 years of ‘starting’ Grade 10. Results for populations of fewer than 10 students have not been reported to avoid identifying individuals or very small groups of students (nr). FNMI students are those who choose to self-identify as First Nations (Registered/Treaty/Status Indian, Non-Status Indian), Métis, or Inuit/Inuk. Non-FNMI students are those who do not identify as FNM or I, however this category may include FNMI students who choose not to self-identify. Source: Ministry of Education, 2016
Analysis of results
Over the past 4 years, Lloydminster Public School Division’s on-time graduation rate for all students has been steadily increasing. This has been a celebration for staff and students. In 2011-12 the on-time graduation rates was 66% for all students and the results from the next three years were as follows: 2012-13 (74%), 2013-14 (79%) and 2014-15 (85%). The on-time graduation rate for all students for the 2015-16 resulted in a decline to 78%. Compared to the provincial on-time graduation rate for all students, LPSD students are achieving graduation status at a slightly higher rate. The decline in the on-time graduation rate for all students is a concern and will be investigated. Lloydminster Public School Division FNMI On-time graduation rates have gradually increased over the past 4 years. The results in 2011-12 were 29% and the results from the next three years are as follows: 2012-13 (51%), 2013-14 (57%), 2014-15 (56%). The FNMI On-time graduation rate for the 2015-16 resulted in a decline to 47%. Compared to the FNMI provincial on-time graduation rate of 42%, LPSD FNMI students are achieving a slightly higher graduation rate. The division’s FNMI graduation rate has been consistently higher than the province’s
Lloydminster Public SD Board of Education Annual Report – 2015-16 – Page 18

FNMI graduation rate over the past three years; however, a 37% graduation rate difference between FNMI and Non-FNMI exists. This achievement gap is a concern. The school division will attend to further analysis of this data to investigate the decline.
Grade 12 Graduation Rate: Extended-Time Some students need more time to complete all the courses necessary to graduate so they continue in school longer than the typical three years after beginning Grade 10. Extended-time graduation rates are one measure of the responsiveness of the school system. The following displays the percentage of students (all students, non-FNMI and FNMI) in the division who graduated within five years of entering Grade 10, which includes those who graduated on-time, along with provincial results in each of these categories.
Notes: Extended-time graduation rates are calculated as the percentage of students who complete Grade 12 within 5 years of ‘starting’ Grade 10 (and include those who graduate on-time). Results for populations of fewer than 10 students have not been reported to avoid identifying individuals or very small groups of students (nr). FNMI students are those who choose to self-identify as First Nations (Registered/Treaty/Status Indian, Non-Status Indian), Métis, or Inuit/Inuk. Non-FNMI students are those who do not identify as FNM or I, however this category may include FNMI students who choose not to self-identify. Source: Ministry of Education, 2016
Lloydminster Public SD Board of Education Annual Report – 2015-16 – Page 19

Analysis of results
Extended-Time Graduation Rates for Non-FNMI students for Lloydminster Public School Division have increased slightly from 2014-15 (84%) to 2015-16 (90%). In 2015-16 this rate is aligned to the provincial results (89%). Extended-Time Graduation Rates for FNMI students for Lloydminster Public School Division have increased significantly from 2014-15 (63%) to 2015-16 (77%); this result is a celebration for our school division. Students are accessing school supports to attain a grade 12 education after a period of disengagement from school or at a slower pace that meets their personal situations. As a school division, we intend to further analyze students who are not attaining graduation standing within three years of grade 10 and implement ways of keeping these students connected with the school system.
Grade 9 to 10 Transition The transition from Grades 9 to 10 can be difficult for some students for many different reasons, including not having reached all outcomes from each subject area in the elementary grades. This measure is intended to show how well Grade 9 students adjust in the transition to Grade 10. Achieving eight or more credits a year is important for steady progress towards graduating on-time. The following displays the percentage of Grade 9 students (all students and the FNMI subpopulation) in the division who achieved eight or more credits the following school year, along with provincial results for the past eight years and the eight year average.
Lloydminster Public SD Board of Education Annual Report – 2015-16 – Page 20

Notes: Percentages are calculated as the number of students attaining eight or more credits in the year immediately following their Grade 9 year divided by the number of students in the Grade 9 cohort. Results for populations of fewer than five have not been reported to avoid identifying individuals or very small groups of students. FNMI students are those who choose to self-identify as First Nations (Registered/Treaty/Status Indian, Non-Status Indian), Métis, or Inuit/Inuk. Non-FNMI students are those who do not identify as FNM or I, however this category may include FNMI students who choose not to self-identify. Source: Ministry of Education, 2016
Analysis of results
The percentage of the Grade 9 cohort achieving 8 or more credits the following school year for FNMI students has gradually increased over the past five years; two positive spikes in the trend line are noted for 2010/11 and 2013/14. In 2015-16, 59.3% of FNMI students achieved 8 or more credits; these results are above the provincial results. The percentage of all students in the grade 9 cohort achieving 8 or more credits in the following school year has gradually increased over the past 5 years. In 2014/15, 84.7% of all students in Lloydminster Public School Division achieved 8 or more credits; this was a decline from the 2013/14 school year and exceeds the provincial results. Lloydminster Public School Division is proud of the achievement of grade 10 students and these results indicate that transition practices are working well as students move from grade 9 to grade 10. As a school division, the achievement gap between all students and FNMI students is a concern; LPSD intends to analyze this further.
Lloydminster Public SD Board of Education Annual Report – 2015-16 – Page 21

Operational Spending Outcome: By August 31, 2020, implement a sector-wide approach to find efficiencies and increase value add in order for the sector to be responsive to the challenges of student needs.
School division goals aligned with the Operational Spending outcome
Lloydminster Public School Division will have an operational budget that is predictable and sustainable. Practices and policies within the organization will be efficient and effective while being flexible to accommodate student and staff needs.
School division actions taken during the 2015-16 school year to achieve the targets and outcomes of the Operational Spending outcome
1. Create and Implement a revised annual Budget creation process that is based on Board priorities and financial assumptions.
2. Conduct 2 LEAN events during the 2015/2016 school year. a. Event 1 – Transportation b. Event 2 – Earned Days Off
3. To enhance the understanding of the Lean leadership philosophy on the Division Leadership team.
4. Development of a management strategy for Curricular and Extra-Curricular travel.
5. Development of a management strategy for Noon Hour Supervision
6. Implement Enterprise Risk Management.
Lloydminster Public SD Board of Education Annual Report – 2015-16 – Page 22

Early Years Outcome: By June 30, 2020, children aged 0-6 years will be supported in their development to ensure that 90% of students exiting Kindergarten are ready for learning in the primary grades.
School division goals aligned with the Early Years outcome
Throughout the 2015-16 school year the focus of LPSD was to support Early Years Teachers in the implementation of teaching and learning activities that promoted the development of, and school readiness for, children in Prekindergarten and Kindergarten.
School division actions taken during the 2015-16 school year to achieve the targets and outcomes of the Early Years outcome
The following actions were taken to achieve the outcomes of the Early Years Outcome:
1. Administer the Early Years Evaluation (EYE) and share results with parents in face-to-face meetings
2. Ensure that all Early Years Teachers are trained as per Ministry standards on EYE processes
3. Use EYE data to inform decisions on interventions for school readiness
4. Provide collaboration opportunities for Early Years Teachers with the formation of a Community of Practice
5. Implement administrative walk-through and teacher self-assessment tool.
Measures for Early Years
Early Years Evaluation The Early Years Evaluation-Teacher Assessment (EYE-TA) is a readiness screening tool that provides information about each child’s development and learning with a focus on reading readiness skills. Results from the EYE-TA allow educators and school-based interdisciplinary teams to quickly identify children most likely to require extra support during the Kindergarten year, based on their levels of skill development in five key domains at school entry. In addition to results for specific domains, children are also assigned a comprehensive score known as a Responsive Tiered Instruction (RTI) level. Responsive Tiered Instruction (RTI) is a preventive approach that allows educators, school teams and divisions to allocate resources early and continuously, rather than waiting until after children have experienced failure before responding. The following displays the percentage of students by RTI tiers at the end of Kindergarten in 2015-16, as well as the provincial results for each category.
Lloydminster Public SD Board of Education Annual Report – 2015-16 – Page 23

Copy and paste “EYE-TA” display here.
Lloydminster Public SD Board of Education Annual Report – 2015-16 – Page 24

Notes: Research shows early identification followed by a responsive, tiered approach to instruction from Kindergarten to Grade 3 can substantially reduce the prevalence of reading problems. Children who have Tier 2 or Tier 3 needs at Kindergarten entry are re-assessed before Kindergarten exit, allowing school divisions to measure the impact of their supports and responses. Spring RTI data also serves as a leading indicator of the population of students who may need Tier 2 or Tier 3 instructional supports as they transition from Kindergarten to Grade 1. Results reported previously for division EYE RTI Tiers at Kindergarten exit in 2014-15 may vary from results reported here. This is due to a change in reporting methodology. Prior to 2015-16, EYE results at Kindergarten exit omitted results for children who were assessed in spring post-screens only. The amended reporting methodology now includes results for all children screened in a division, regardless of whether or not they were enrolled and present during fall pre-screens. Source: Ministry of Education, Early Years Branch, 2016
Analysis of results
Trends: ● In 2014-15, EYE-TA results for LPSD went from 64% of children in Tier 1 at Kindergarten entry (Fall) to
88% at Kindergarten exit (Spring), showing an increase of 24% of children achieving developmental tasks. Provincial data shows an increase from 57% of children at Tier 1 at Kindergarten entry to 79% at Tier 1 at Kindergarten exit. Provincial data shows an increase of 22% over the year.
● In 2014-15, EYE-TA results for LPSD went from 9% of children at Tier 3 at Kindergarten entry to 3% at Kindergarten exit. This compares with the provincial data that shows 15% of children at Tier 3 at Kindergarten entry, moving to 7% at Kindergarten exit.
● 2015-16 EYE data for LPSD shows 63% of children at Tier 1 at Kindergarten entry compared with provincial data of 59% of children at Tier 1. At Kindergarten exit, 82% of children in LPSD were at Tier 1, showing an increase of 19% over the year. Provincial data at Kindergarten exit shows 80% of children at Tier 1, to an increase across the province of 21%.
● 2015-16 EYE data for LPSD went from 15% of children at Tier 3 at Kindergarten entry to 6% at Kindergarten exit. This compares with the provincial data that shows 15% of children at Tier 3 at Kindergarten entry, moving to 7% at Kindergarten exit.
● LPSD trend data shows a slight decrease of Tier 1 at Kindergarten exit from 2014-15 to 2015-16 (6%) but LPSD results remain above the provincial average for each year.
Results LPSD is proud of;
● The formation of the Early Years Community of Practice provided six opportunities for Prekindergarten and Kindergarten Teachers to meet, share resources and best practices, and to explore Ministry documents.
● While the Early Years Community of Practice meetings were held after school hours and were voluntary, each meeting had an attendance rate of over 90% of Early Years Teachers.
● The Early Years Walkthrough document was utilized twice a year with the focus being on teacher practice. These documents provided opportunities for teachers to reflect on practice and develop professional goals with their administration.
Areas of Concern:
● LPSD continues to have a large wait list for Prekindergarten (over 40 children in 2015-16). ● The community is experiencing an economic downturn. This has increased the number of children
Lloydminster Public SD Board of Education Annual Report – 2015-16 – Page 25

coming to our schools from vulnerable situations. ● The community has a large EAL population and refugee families.
Lloydminster Public SD Board of Education Annual Report – 2015-16 – Page 26

School Division Local Priority Area The local priority in Lloydminster Public School Division was a focus on addressing and improving Student Wellness and Student Resiliency.
School division goals aligned with local priority area
Schools in LPSD will create environments that promote and develop resiliency within students. This includes ensuring resources are available to support student mental health, and an increased focus on ensuring students have opportunities to improve their physical wellness in elementary, middle and high school.
School division actions taken during the 2015-16 school year to support local priority area
The following actions aligned with the LPSD local priority were undertaken in 2015-16: 1) Consult with resiliency expert Dr. Michael Ungar to work directly with
LPSD Staff and partner organizations. a) Provide professional development presentations and direct
consultation opportunities for staff and partner organizations 2) Develop/Build school environments, based on Dr. Ungar’s work, that
contribute to student resiliency. a) School Admin to complete an analysis of school environment. b) Develop a school plan that focuses on the “9 Things Students
Need”. 3) Hire a school based mental health professional to build capacity of
staff and support student mental health. a) The mental health professional will develop and present mental
health specific presentations to staff b) The mental health professional will work directly with schools and
families to facilitate mental health support. 4) Hire an athletic coordinator to align athletics and physical wellness
opportunities throughout LPSD. 5) Administer the Tell Them From Me Survey in grades 4-12.
a) Schools will use data to create an actionable goal that is related to student engagement and sense of belonging..
6) Attend the Alberta Mental Health Conference to build staff capacity in the area of wellness.
Lloydminster Public SD Board of Education Annual Report – 2015-16 – Page 27

Local Measures for Student Wellness Priority
1. Individual school Tell Them From Me Survey Results and School Improvement Plan Goal Tell Them From Me Survey April 2016 Results:
Participation In Sports
Sense of Belonging
Anxiety/Depression Advocacy at School
Positive Teacher-Student Relations
Canadian Norm Elementary
68% 86% 16% 49% 79%
LPSD Elementary Schools
77% 78% 21% 65% 86%
Canadian Norm Gr. 7-9
48% 71% 18% 27% 60%
LPSD Schools Gr. 7-9
60% 64% 20% 30% 65%
Canadian Norm Gr. 10-12
42% 61% 18% 28% 64%
LPSD Gr. 10-12
28% 56% 22% 35% 71%
2. School extra-curricular opportunity data.
a. Lists of extracurricular opportunities available at schools. 3. Anecdotal data on impact of Mental Health Worker
a. Success stories of the impact of the Mental Health Worker 4. School counselor referrals analysis 5. Identification of the number of referrals for anxiety, and depression
Analysis of results
Lloydminster Public SD Board of Education Annual Report – 2015-16 – Page 28

Trends ● More and more students are looking to the school for adults connectedness and a sense of belonging. ● Schools do many things in their school environment that contribute to resilience for students. ● Schools are able to identify the things that they are intentionally doing to ensure students feel a sense
of belonging and are connected to the school. ● Teachers are feeling the pressures and challenges of working with students who have mental health
concerns. They are needing more professional development and support in this area. ● Schools are having to expand the variety and times of extra-curricular opportunities to meet the vast
student interests and needs. ● Participation in sports at the high school level is decreasing. ● Counseling referrals remain high and are trending upward. Many of these referrals are beyond the
scope of school counselors and require significant support and deal with anxiety and depression in elementary, middle and high school.
Results We Are Proud Of
● The addition of a Mental Health Worker has provided schools a valuable resource. This resource has began to build capacity with our teaching staff and support students with severe mental health concerns access service in a predictable and expedited way. Counselors are able to consult with her and as a result students are receiving better services in this area.
● School staffs are now aware and focused on the things they can intentionally do to build resilience within their students. They are assessing their school environment and ensuring that they are filling any gaps that they have identified.
● School staffs are identifying and targeting at risk students. They are expanding and altering the ways they offer services to ensure student needs are being met in and outside of the classroom.
● Schools extra-curricular opportunities are expanding. A larger variety of opportunities are being offered to meet student interests and needs.
● School athletic programs are now more aligned and provide more involvement opportunities for students
● Teachers are starting to build knowledge about how to support students with mental health challenges in the classroom. This has been done through targeted support from the school counselors and Mental Health Worker.
● LPSD has built strong partnerships in the community in the area of Mental Health. This includes medical professionals, RCMP, and other community organizations.
● Schools are building positive teacher-student relationships. Areas of Concern
● The community is going through an economic downturn. This has increased the number of students coming our schools with high levels of need in the areas of mental health (anxiety, depression, self harm behaviours, etc.)
● Schools need continued community resource support to help families and children access the appropriate services.
New Needs
● Staff mental and physical wellness is becoming a challenge. This has been connected to staff engagement and job satisfaction.
● An increased focus on student physical wellness including nutrition, and activity levels.
Lloydminster Public SD Board of Education Annual Report – 2015-16 – Page 29

Lloydminster Public SD Board of Education Annual Report – 2015-16 – Page 30

Demographics The following sections outline student enrollment, staffing full time equivalents and senior management for LPSD. Students
Note: The table above identifies the actual number of students enrolled in each grade as of
September 30 of each year. Source: Ministry of Education, 2015 LPSD is funded for three pre-k programs and our Board funds an additional three programs. Even with the addition of these classrooms, we continue to have a waiting list of at-risk children. We also have an outreach school (Avery Outreach) that serves grade 9-12 students.
SOURCE:Ministry of Education, 2015
2013-14 2014-15 2015-16 2013-14 2014-15 2015-16Kindergarten 289 303 283 K to 3 135 143 150
1 292 295 323 4 to 6 94 93 1162 303 295 309 7 to 9 111 94 1043 283 303 311 10 to 12 144 159 1454 300 294 309 Total 484 489 5155 278 303 298 1 to 3 40 48 666 284 273 305 4 to 6 20 10 167 314 295 282 7 to 9 17 14 148 267 303 285 10 to 12 4 13 179 306 253 327 Total 81 85 11310 398 412 34411 320 351 37012 311 306 317
Total 3945 3986 4063
PreK 99 91 94
NOTES:
Lloydminster SD 99
Grade SubpopulationEnrolments
Grades
4. A student's FNMI identity is established through self-identification.
Self-IdentifiedFNMI
English as anAdditionalLanguage
1. Enrolment numbers are based on headcounts from Student Data Services (SDS) as of September 30 for each school year.
2. Enrolments includes all residency types, all ages, home based and home bound students, with the exception of EAL enrolments which exclude non-Saskatchewan residents, students 22 years and older, and home based students.
3. PreK enrolments are the 3- and 4-year-old enrolments on the SDS which includes those children who occupy the Ministry designated PreK spaces and those in other school division operated PreK or preschool programs.
Lloydminster Public SD Board of Education Annual Report – 2015-16 – Page 31

Staff
Job Category FTEs
Classroom teachers 249.6
Principals, vice-principals 18.4
Other educational staff (positions that support educational programming) – e.g., educational psychologists, educational assistants, school community coordinators, speech language pathologists
117.4
Administrative and financial staff – e.g., accountants, Information Technology people, supervisors, administrative assistants, clerks
32.6
Plant operations and maintenance – e.g., caretakers, handypersons, carpenters, plumbers, electricians, gardeners, supervisors
38.9
Transportation – e.g., bus drivers, mechanics, parts persons, bus cleaners, supervisors
9.5
Senior management team (as described below) – e.g., chief financial officer, director of education, superintendents
6.0
Total Full-Time Equivalent (FTE) Staff 472.4
Notes: • The numbers shown above represent full-time equivalents (FTEs). The number of employees may be greater because some people work part-time or seasonally. • Some individuals are counted in more than one category. For example, a teaching principal might be counted as 0.4 as a classroom teacher and 0.6 as a principal.
Senior Management Team The Director of Education, Mr. Todd Robinson, reports directly to the Board of Education. The other five members of the senior leadership team include:
Chief Financial Officer - Mr. Matthew Read Superintendent of Student Services - Mr. Brent Thomas Superintendent of Curriculum and Instruction - Mrs. Shirley Groat Superintendent of Curriculum and Instruction - Mrs. Trisha Rawlake Superintendent of Human Resources - Mr. Scott Wouters
Lloydminster Public SD Board of Education Annual Report – 2015-16 – Page 32

Facilities Infrastructure Projects and Transportation Facilities School List 2015-16
School Grades Location Avery Outreach School 7-12 Lloydminster
Barr Colony Elementary School K-6 Lloydminster Bishop Lloyd Middle School 7-9 Lloydminster
College Park School K-9 Lloydminster ES Laird Middle School 7-9 Lloydminster
Jack Kemp Community School K-6 Lloydminster Lloydminster Comprehensive High School 10-12 Lloydminster
Queen Elizabeth Elementary School K-6 Lloydminster Rendell Park Elementary School K-6 Lloydminster
Winston Churchill Elementary School K-6 Lloydminster Infrastructure Projects 2015-16
Infrastructure Projects
School Project Details 2014-15 Cost
Lloydminster Comprehensive
High School
LCHS Canopies and
Bus Lane
This project involved the addition of visitor parking lot, bus lane and extended student parking lot. Installed new aluminum frames/doors to include canopies to North, N.W, east and south. updated all the door hardware to meet current code requirements.
$1,154,400
Lloydminster Comprehensive
High School
LCHS Fieldhouse
Constructed two change rooms to the south side of gym. The building exterior is a steel frame with steel studs with a brick exterior. Installed a main sprinkler tree that was sized for future expansion.
$1,069,604
Jack Kemp Community
School
Relocate Portable to Jack Kemp
The Portables were Installed on steel piles with a link attaching them to the school. The washrooms were also tied in too existing services. The sprinklers system was extended from
$400,000
Lloydminster Public SD Board of Education Annual Report – 2015-16 – Page 33

the main school
Queen Elizabeth Queen Elizabeth
Roof Phase 1
Replace section 8 of existing school with a two ply membrane system. The exterior face was also replaced due to weather damage.
$390,000
Total $3,014,004
Transportation
Student Transportation Lloydminster Public School Division owns and operates 21 buses. We run 13 three tier routes on a daily basis and 6 Pre-K routes Monday to Thursday. Agreements are in place with Northwest School Division(SK) and Buffalo Trails School Division(AB) to provide busing services to eligible rural students attending school in Lloydminster.* Lloydminster Public School Division also has an agreement with the local Handi-van to transport students with special needs who are unable to ride a regular bus due to their disability.
Lloydminster Public School Division provides transportation services for eligible students within Lloydminster City limits to their designated school based on the following distances:
· Pre K door to door service to the designated school;
· K to Grade 6 if they reside 0.6 km or more from their designated school
· Grades 7 – 9 if they reside 0.9 km or more from their designated school;
· Grades 10 -12 if they reside 1.5 km or more from their designated school.
*Statistics below do not include numbers or cost from rural students.
Transportation Statistics
Students transported 1383
Transportation routes 13 – 3 tier; 6 Pre K
Number of buses 21
Daily kilometres traveled 674.3
Average age of bus (excluding spares) 10
Capacity utilized on buses 55 %
Average one-way ride time 8.75 min
Longest one-way ride time 32 min
Lloydminster Public SD Board of Education Annual Report – 2015-16 – Page 34

Cost per student per year $762.26
Cost per kilometre traveled $7.79
Lloydminster Public SD Board of Education Annual Report – 2015-16 – Page 35

Financial Overview Summary of Revenue and Expenses
Property Taxation
31%
Grants 65%
Other 4% Revenue 2015-16
Instruction 78%
Gov & Adm 5%
Transportation 2%
Other 5%
Plant 10%
Expense 2015-16
Lloydminster Public SD Board of Education Annual Report – 2015-16 – Page 36

Budget to Actual Revenue, Expenses and Variances
Budget to Budget to 2016 2016 2015 Actual Actual %
VarianceOver / (Under)
Property Taxation 11,971,985 12,917,349 11,647,997 945,364 8% 1 Grants 28,235,817 27,323,212 28,454,922 (912,605) -3%Tuition and Related Fees 52,900 57,132 51,455 4,232 8% 2 School Generated Funds 1,000,000 1,010,221 1,023,162 10,221 1%Complementary Services 200,081 200,076 193,692 (5) 0%External Services 271,135 206,936 204,450 (64,199) -24% 3 Other 369,450 530,478 610,606 161,028 44% 4
42,101,368 42,245,404 42,186,284 144,036 0%
Governance 276,985 250,726 198,998 (26,259) -9% 5 Administration 2,162,096 2,195,212 2,312,690 33,116 2%Instruction 35,203,533 35,920,548 36,941,157 717,015 2%Plant 4,986,386 4,415,626 5,349,873 (570,760) -11% 6 Transportation 1,162,113 1,054,211 1,084,467 (107,902) -9% 7 Tuition and Related Fees - - 1,258 - School Generated Funds 1,000,000 1,011,813 1,002,811 11,813 1%Complementary Services 371,366 452,741 369,664 81,375 22% 8 External Services 251,321 214,940 208,929 (36,381) -14% 9 Other Expenses 108,152 445,279 87,251 337,127 312% 10
45,521,952 45,961,096 47,557,098 439,144 1%
(3,420,584) (3,715,692) (5,370,814)
Note
1
2
3
4
5
6
7
8
9
10
Surplus (Deficit) for the Year
Budget Actual NoteREVENUES
Total Revenues
EXPENSES
Total Expenses
Actual Variance
Explanation for Variances (All variances that are greater than positive or negative 5% must be explained)Explanation
Assessment values for City of Lloydminster properties increased by 7.1% for 2016 which was significantly higher than budgeted.One additional student from Onion Lake First Nation attended for a portion of the school year.
Concession Revenues at Middle Schools were lower than expected.
Additional Reimbursements received above what was budgeted, including increased facility rentals.
Additional Educational Assistants and Bus Supervisors hired to assist in the Pre-Kindergarten program.
Food purchases at Middle School Concessions were lower than budgeted.
Write down of amounts receivable from SK & AB governments relating to the College Park School Construction Project.
Fewer regular board meetings than what was originally budgeted, not all board members attended all conventions.
Renegotiated Energy contracts and warmer than normal winter resulted in lower utility costs.
Use of chartered & coach buses reduced during the year. Using Division owned buses as much as possible.
Lloydminster Public SD Board of Education Annual Report – 2015-16 – Page 37

Appendices Appendix A – Payee List Board Remuneration
Name Remuneration Expenses Travel Professional Development Total
Bloch-Hansen, Eric $5,841 $141 $82 $365 $6,429 Cornet, Cathy 7,190 141 2,389 4,331 14,051 Gee, Chrissy 5,985 141 82 365 6,573 Kennedy, Karoline 10,416 141 2,498 832 13,887 Knight, Yana 3,193 125 - 141 3,459 Thompson, David* 12,973 141 4,275 4,530 21,919 Wareham, Joy 2,288 141 - 141 2,570
*Board Chair ** Professional Development includes education, training and conferences Personal Services Name Amount Abbott, Travis $61,280 Allin, Fern 53,161 Anderson, Joann 70,114 Anderson , Alvin 82,506 April, Rachelle 58,795 Armstrong, Derek 75,707 Babcock, Deb 52,439 Ball, Jennifer 84,863 Barron, Danielle 62,472 Baum, Hydee 85,889 Bear, Sarah 67,742 Beaulac, Diane 57,579 Becotte, Sam 55,202 Behm, Elaine 71,138 Behm, Emily 59,790 Berg, Tracy 79,824 Bishop, Nicole 52,560 Block, Amanda 63,290 Block, Denise 86,215
Name Amount Block, Reg 84,295 Bloxam, Cole 69,608 Blythe, Craig 76,134 Blythe, Laura 76,054 Bodnarchuk, Jennifer 68,883 Bouck , Jacqueline 118,015 Brand, Elena 121,593 Brebber, Scott 71,647 Brinklow, Nicole 62,569 Brown, Jennifer 75,360 Brummund, Jody 66,299 Bucknell, Patricia 79,993 Buhnai, Christine 88,563 Burrage, Nicole 89,225 Burrell, Amie 65,316 Burzynski, Robin 57,314 Canfield, Aaron 110,346 Carter, Aaron 73,711 Cheryian, Shauna 68,013
Lloydminster Public SD Board of Education Annual Report – 2015-16 – Page 38

Name Amount Chocan, Kammy 90,860 Chocan, Trina 86,137 Christie, Tyler 84,516 Clarkson, Mallory 62,055 Claxton, Kathleen 83,867 Close, Tara 87,921 Coish, Krista 78,978 Collins, Grant 67,518 Collins, Judy 62,495 Copeland, Tasia 63,064 Corriveau, Erica 61,307 Cote, Kriston 77,829 Coulter, Shawn 75,628 Coutts-radke, Gwen 88,396 Dalrymple, Ashley 62,698 Daniels, Jessica 60,013 Davies, Catherine 89,884 Delaire, Diane 52,787 Deters Nowosad , Michelle 56,960 Dmyterko, Terrance 60,667 Donald, Shauna 71,250 Dunham, Pam 75,133 Dyck, Wendy 56,639 Dyer, Austin 76,918 Elford, Theresa 57,843 Elliott, Dawn 89,316 Elliott, Tammy 91,195 Ellison, Brenda 84,295 Evans, Brittney 61,602 Ferguson, Danielle 87,769 Finlay, Randy 97,250 Fletcher, Rhae 62,222 Fontaine, Luc 71,651 Fraser, Mary 118,500 Freeman, Victoria 51,495 Freeston, Lanelle 85,809 Gale, Devin 69,355 Gallagher, William 114,398
Name Amount Ganzert , Jessica 61,432 Gareau, Laurie 86,323 Gauthier, Bernard 110,461 George, Lois 62,580 Golden, Brent 85,865 Gordon, Josie 114,831 Grant , Jaime 73,048 Grassl, Wayne 71,816 Gratton, Cory 89,808 Griffith, Alan 85,005 Grillandini, Bryan 91,106 Grindle, Nathan 70,741 Groat, Shirley 150,470 Gustafson, Lorne 89,225 Gustafson, Myra 66,000 Halliday, Loralie 89,286 Hamilton, Brent 96,748 Hamilton, Debra 90,837 Hann, Leeanne 83,867 Hanson, Gina 86,536 Harbin, Chantal 58,631 Harewood , Louis 92,363 Harper, Aaron 66,044 Harper, Bronwyn 65,336 Hart, Elizabeth 73,444 Heath, Shannon 70,478 Heinrichs, Arrin 88,396 Hill , Charlene 60,545 Hiron, Amy 88,396 Howland, Lesley 68,387 Howland, Sharon 84,295 Hurd, Stephanie 76,816 Hyland, Derek 70,360 Hysiuk, Jarett 55,269 Inkster, Dayna 60,810 Jeffery , Dwayne 85,400 Jeffery , Poppy 89,225 Jewell, Chelsea 67,832
Lloydminster Public SD Board of Education Annual Report – 2015-16 – Page 39

Name Amount Jewittmerryweather, Janine 85,283 Johal, Christine 55,394 Johannesson, Christine 90,049 Johnson, Caroline 89,040 Jones, Anna 74,602 Jones, Chelle 82,449 Jones, Kevin 88,826 Kaminski, Richard 84,433 Kappel, Derek 68,887 Kardas, Lynn 75,270 Keller, Denee 67,833 Keller, Terry 69,822 Kelly, Justin 93,834 Kelly, Mindy 80,214 Ketchum, Lorellie 64,566 Kinaschuk , Katherine 87,732 King, Graydon 98,065 Klamot, Luella 84,996 Klisowsky , Stacey 114,684 Kolla, Christine 75,037 Korn, Leslie 97,852 Kort, Ken 77,396 Krahn, Cornelius 95,645 Krawchuk, Karla 85,591 Kruchkowski, Debra 101,860 Kvill, Charlene 59,893 Kyle, Glenys 69,506 Labonte, Kim 87,451 Laing, Dawn 84,848 Lane, Kendra 84,060 Larson, Shawn 114,218 Lepage, Nicole 111,003 Link, Kieran 80,856 Long, Jordan 56,317 Lumbard, Kelanie 88,396 Lumbard, Scott 88,396 Lynn, Theresa 81,363 Lyons, Scott 89,902
Name Amount Macarthur, Debra 52,838 Maccarthy, Darren 91,931 Mainville, Megan 81,902 Mann, Morgan 88,949 Marchand, Lawerance 71,130 Marciniw, Dwayne 130,529 Mather , Pam 106,189 Mather , Ryan 109,188 Mazzei, Jeff 67,524 McEwen, Lisa 87,087 Mcfarlane, Darcy 91,855 Mcgean, Brittney 66,580 Mcintyre, Kelly 61,394 Mclennan, David 122,927 Mcvey, Adam 77,833 Mcvey, Alana 75,582 Melnechenko, Leanne 85,124 Merilees, Robin 102,635 Merth, Shelley 97,236 Messmer, Matthew 73,699 Mestre, Tanya 67,526 Miller, Dacienne 84,534 Milne, Michelle 84,295 Moilne, Koree 72,069 Moisan, Melanie 84,295 Morrell, Toni 89,225 Morrow, Mandy 51,111 Moser, Michael 62,445 Muir, Leah 84,295 Musyj, Angie 84,571 Namur, Lynette 84,295 Nelson, Virginia 73,711 Newman, Pam 90,707 Nordby, Ashley 79,200 Oberg, Jerraie 62,816 O'Connor, Amy 85,865 Oestreicher, Cindy 86,134 O'Grady, Meaghan 80,242
Lloydminster Public SD Board of Education Annual Report – 2015-16 – Page 40
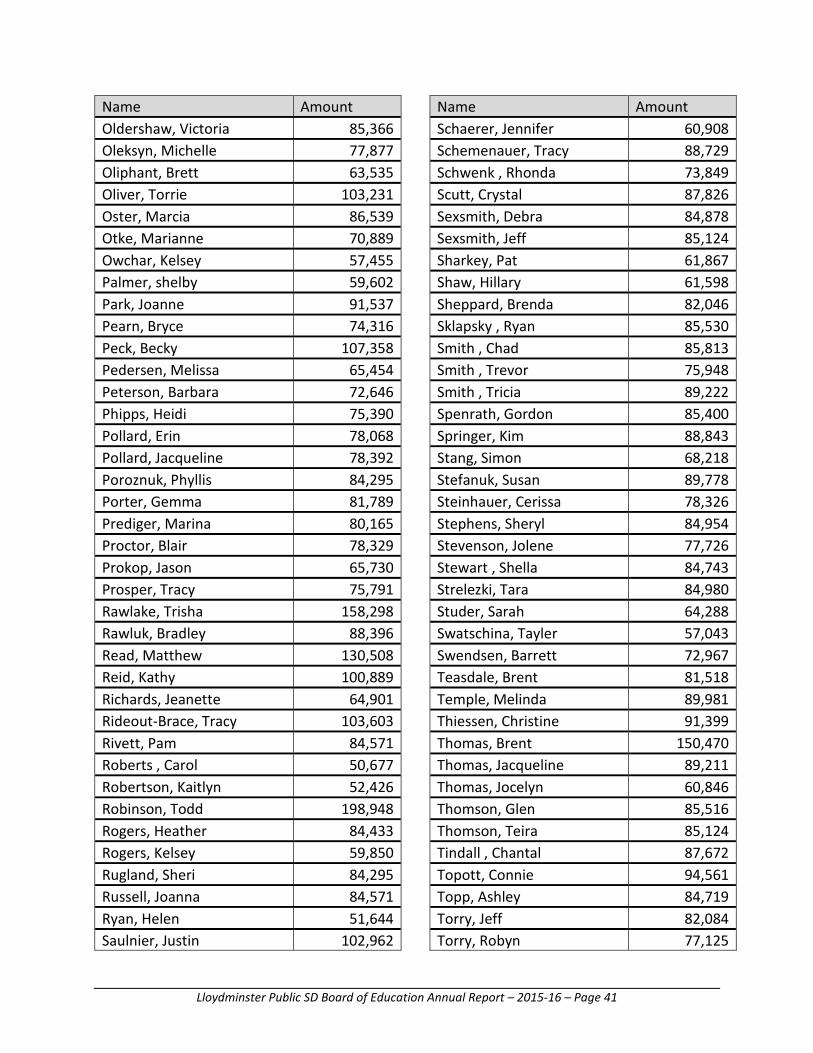
Name Amount Oldershaw, Victoria 85,366 Oleksyn, Michelle 77,877 Oliphant, Brett 63,535 Oliver, Torrie 103,231 Oster, Marcia 86,539 Otke, Marianne 70,889 Owchar, Kelsey 57,455 Palmer, shelby 59,602 Park, Joanne 91,537 Pearn, Bryce 74,316 Peck, Becky 107,358 Pedersen, Melissa 65,454 Peterson, Barbara 72,646 Phipps, Heidi 75,390 Pollard, Erin 78,068 Pollard, Jacqueline 78,392 Poroznuk, Phyllis 84,295 Porter, Gemma 81,789 Prediger, Marina 80,165 Proctor, Blair 78,329 Prokop, Jason 65,730 Prosper, Tracy 75,791 Rawlake, Trisha 158,298 Rawluk, Bradley 88,396 Read, Matthew 130,508 Reid, Kathy 100,889 Richards, Jeanette 64,901 Rideout-Brace, Tracy 103,603 Rivett, Pam 84,571 Roberts , Carol 50,677 Robertson, Kaitlyn 52,426 Robinson, Todd 198,948 Rogers, Heather 84,433 Rogers, Kelsey 59,850 Rugland, Sheri 84,295 Russell, Joanna 84,571 Ryan, Helen 51,644 Saulnier, Justin 102,962
Name Amount Schaerer, Jennifer 60,908 Schemenauer, Tracy 88,729 Schwenk , Rhonda 73,849 Scutt, Crystal 87,826 Sexsmith, Debra 84,878 Sexsmith, Jeff 85,124 Sharkey, Pat 61,867 Shaw, Hillary 61,598 Sheppard, Brenda 82,046 Sklapsky , Ryan 85,530 Smith , Chad 85,813 Smith , Trevor 75,948 Smith , Tricia 89,222 Spenrath, Gordon 85,400 Springer, Kim 88,843 Stang, Simon 68,218 Stefanuk, Susan 89,778 Steinhauer, Cerissa 78,326 Stephens, Sheryl 84,954 Stevenson, Jolene 77,726 Stewart , Shella 84,743 Strelezki, Tara 84,980 Studer, Sarah 64,288 Swatschina, Tayler 57,043 Swendsen, Barrett 72,967 Teasdale, Brent 81,518 Temple, Melinda 89,981 Thiessen, Christine 91,399 Thomas, Brent 150,470 Thomas, Jacqueline 89,211 Thomas, Jocelyn 60,846 Thomson, Glen 85,516 Thomson, Teira 85,124 Tindall , Chantal 87,672 Topott, Connie 94,561 Topp, Ashley 84,719 Torry, Jeff 82,084 Torry, Robyn 77,125
Lloydminster Public SD Board of Education Annual Report – 2015-16 – Page 41

Name Amount Trembel, Patti 85,124 Trotchie, Kendall 50,312 Utley, Nancy 61,490 Vajdec, Victoria 65,626 Valette-Topley, Danielle 64,894 Vandresar Khan, Jacqueline 78,943 Vetter, Sondra 64,804 Walker, Cheryl 74,915 Walker, Collin 85,661 Wandler, Ashley 59,442 Wandler, Tanya 63,227 Ward, Lance 86,202 Weaver, Amanda 60,610 Weir, Lauren 59,735 Weir, Shawna 79,829 Wendt, Wes 55,914 Wesson, Caitlin 69,558
Name Amount Westman, Mark 68,110 White, H Ashley 65,438 White, Hilary 72,637 Wiebe, Natalie 73,358 Wilchynski, Raemi 80,991 Willard, Angela 87,014 Williams, Wendy 84,848 Woods , Tenille 91,895 Wouters, Janice 115,591 Wouters, Scott 168,310 Woytiuk, Erin 83,218 Wright, Wanda 73,109 Young, Nevada 74,673 Yusep, Don 89,225 Zalasky, Eugene 51,074
Supplier Payments Name Amount AB Teachers Retirement Fund $479,931 Alberta Distance Learning 54,858 Alberta WCB 51,252 Ameresco 69,508 AODBT Architecture & Interior Design 184,422
AXIA Supernet Ltd. 170,321 Bank of Montreal MasterCard 959,128 Bexson Construction 41,885 Brite Images Ltd. 74,865 Bus Sales of Saskatoon 112,699 Century Roofing & Sheet Metal Ltd. 165,281
Christensen and Mclean Roofing Co. 145,530
City of Lloydminster 167,181 Compugen Inc. 241,438
Name Amount Craftex Builders 1,995,281 Enmax Commercial Energy Marketing Inc. 383,356
Friesens Yearbooks 77,657 Gas Alberta Energy 179,881 High Grade Truck Driving 197,502 J&N Holdings O/A 928231 57,997 Lloydminster & District Co-op 155,455 Lloydminster Handivan Service 70,140
Manulife Financial 894,982 Marsh Canada Ltd. 93,514 Marshall-Lee Construction Corp. 305,000
Office Max Canada 69,236 Outreach Support Services Inc. 118,340
Lloydminster Public SD Board of Education Annual Report – 2015-16 – Page 42

Name Amount Pioneer Landscaping 62,822 Ricoh Canada Inc. 68,117 Saskatchewan School Board Association 44,588
Saskatchewan Teachers Federation 2,655,312
Saskatchewan WCB 72,253
Name Amount Servus Credit Union LTD 8,900,193 Telus Advanced Communication 50,400
Unisource Canada 118,582 Weinrauch, Cheryl - ATM 115,000 Western Canada Bus 110,902 Wilhelm, Leonard 91,000
Lloydminster Public SD Board of Education Annual Report – 2015-16 – Page 43

Appendix B – Management Report and Audited Financial Statements
Lloydminster Public SD Board of Education Annual Report – 2015-16 – Page 44

Audited Financial Statements
Of the
School Division No. 6050000
For the Period Ending: August 31, 2016
_Matthew Read, CPA, CMA_______________________________________Chief Financial Officer
_Wilkinson Livingston Stevens LLP_________________________________Auditor
Note - Copy to be sent to Ministry of Education, Regina
Lloydminster School Division No. 99
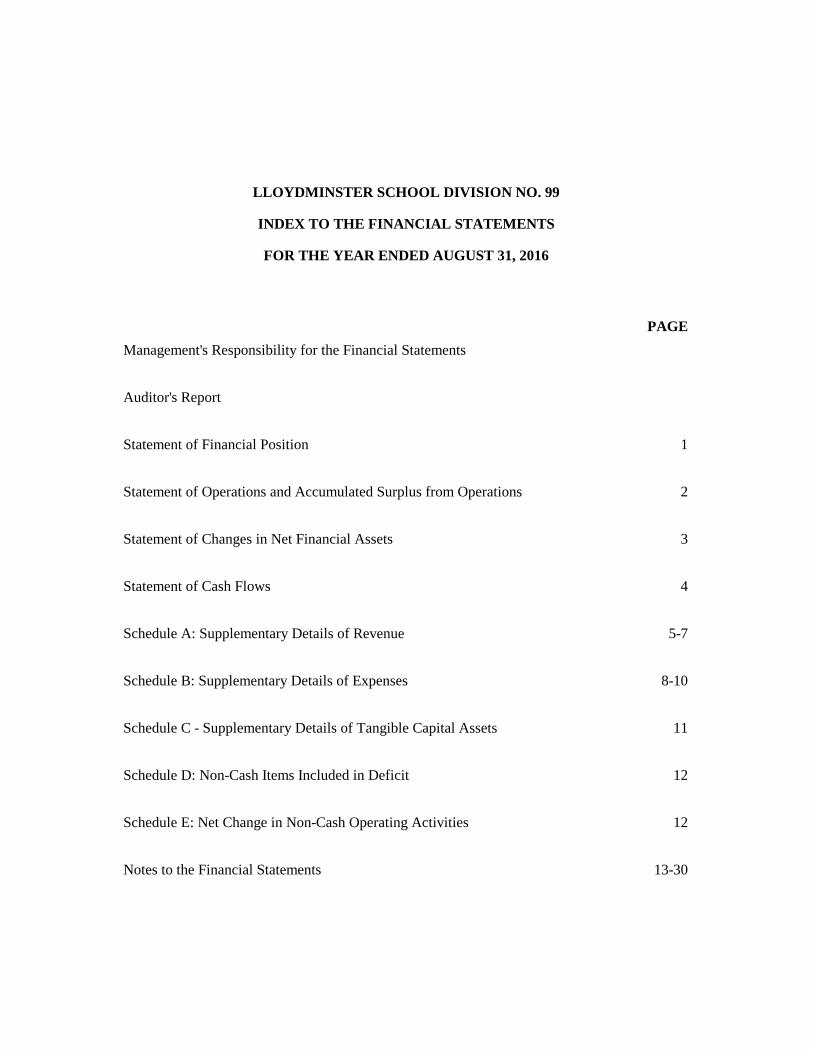
PAGEManagement's Responsibility for the Financial Statements
Auditor's Report
Statement of Financial Position 1
Statement of Operations and Accumulated Surplus from Operations 2
Statement of Changes in Net Financial Assets 3
Statement of Cash Flows 4
Schedule A: Supplementary Details of Revenue 5-7
Schedule B: Supplementary Details of Expenses 8-10
Schedule C - Supplementary Details of Tangible Capital Assets 11
Schedule D: Non-Cash Items Included in Deficit 12
Schedule E: Net Change in Non-Cash Operating Activities 12
Notes to the Financial Statements 13-30
LLOYDMINSTER SCHOOL DIVISION NO. 99
FOR THE YEAR ENDED AUGUST 31, 2016
INDEX TO THE FINANCIAL STATEMENTS

Management’s Responsibility for the Financial Statements The school division’s management is responsible for the preparation of the financial statements in accordance with Canadian public sector accounting standards and the format specified in the Financial Reporting Manual issued by the Ministry of Education. The preparation of financial statements necessarily involves the use of estimates based on management’s judgment, particularly when transactions affecting the current accounting period cannot be finalized with certainty until future periods. The school division’s management maintains a system of accounting and administrative controls to ensure that accurate and reliable financial statements are prepared and to provide reasonable assurance that transactions are authorized, assets are safeguarded, and financial records are properly maintained to provide reliable information for the preparation of financial statements. The Board of Education is composed of elected officials who are not employees of the school division. The Board is responsible for ensuring that management fulfills its responsibilities for financial reporting and internal control, and for approving the financial statements. The Board is also responsible for the appointment of the school division's external auditors. The external auditors, Wilkinson Livingston Stevens LLP, conduct an independent examination in accordance with Canadian auditing standards and express their opinion on the financial statements. The accompanying Auditor’s Report outlines their responsibilities, the scope of their examination and their opinion on the school division’s financial statements. The external auditors have full and free access to, and meet periodically and separately with, both the Board and management to discuss their audit findings. On behalf of the Lloydminster Public School Division No. 99: ___________________________ Board Chair ___________________________ CEO/Director of Education ___________________________ Chief Financial Officer November 23, 2016

Box 10350, The Atrium CentreLloydminster, Alberta T9V 3A5
Phone: (780) 875-9144Fax: (780) 875-6056
Email: [email protected]: www.wlsca.com
INDEPENDENT AUDITOR'S REPORT
The Board of DirectorsLloydminster Public School Division No. 99Lloydminster, Saskatchewan
We have audited the accompanying financial statements of the Lloydminster Public School Division No. 99,which comprise the statement of financial position as at August 31, 2016, and the statement of operationsand accumulated surplus, changes in net financial assets and cash flows for the year then ended, and asummary of significant accounting policies and other explanatory information.
Management's Responsibility for the Financial Statements
Management is responsible for the preparation and fair presentation of these financial statements inaccordance with Canadian generally accepted accounting principles established by the Public SectorAccounting Board of the Canadian Institute of Chartered Accountants, and for such internal control asmanagement determines is necessary to enable the preparation of financial statements that are free frommaterial misstatement, whether due to fraud or error.
Auditor's Responsibility
Our responsibility is to express an opinion on these financial statements based on our audit. We conductedour audit in accordance with Canadian generally accepted auditing standards. Those standards require thatwe comply with ethical requirements and plan and perform the audit to obtain reasonable assurancewhether the financial statements are free of material misstatement.
An audit involves performing procedures to obtain audit evidence about amounts and disclosures in thefinancial statements. The procedures selected depend on the auditor's judgment, including the assessmentof the risks of material misstatement of the financial statements, whether due to fraud or error. In makingthose risk assessments, the auditor considers internal control relevant to the entity's preparation and fairpresentation of the financial statements in order to design audit procedures that are appropriate in thecircumstances, but not for the purpose of expressing an opinion on the effectiveness of the entity's internalcontrol. An audit also includes evaluating the appropriateness of accounting policies used and thereasonableness of accounting estimates made by management, as well as evaluating the overallpresentation of the financial statements.
We believe that the audit evidence we have obtained is sufficient and appropriate to provide a basis for ouraudit opinion.
Opinion
In our opinion, the financial statements present fairly, in all material respects, the financial position of theLloydminster Public School Division No. 99 as at August 31, 2016, and the results of its operations andchanges in net financial assets and cash flows for the year then ended in accordance with Canadian publicsector accounting standards.
Lloydminster, AlbertaNovember 23, 2016 Chartered Accountants

… page 1
2016 2015Financial Assets
Cash and Cash Equivalents 7,598,218 6,438,866 Accounts Receivable (Note 8) 3,961,392 8,367,210 Portfolio Investments (Note 4) 159,993 152,800
Total Financial Assets 11,719,603 14,958,876
LiabilitiesAccounts Payable and Accrued Liabilities (Note 9) 2,219,272 2,348,561 Long-Term Debt (Note 10) 2,164,447 2,270,634 Liability for Employee Future Benefits (Note 6) 440,500 377,100 Deferred Revenue (Note 11) 2,581,387 2,786,607
Total Liabilities 7,405,606 7,782,902
Net Financial Assets 4,313,997 7,175,974
Non-Financial AssetsTangible Capital Assets (Schedule C) 49,464,025 50,270,773 Inventory of Supplies for Consumption 240,255 216,511 Prepaid Expenses 179,009 249,720
Total Non-Financial Assets 49,883,289 50,737,004
Accumulated Surplus (Note 14) 54,197,286 57,912,978
Contractual Obligations and Commitments (Note 18)
The accompanying notes and schedules are an integral part of these statements.
Approved by the Board:
Chairperson
Chief Financial Officer
Lloydminster School Division No. 99Statement of Financial Position
as at August 31, 2016
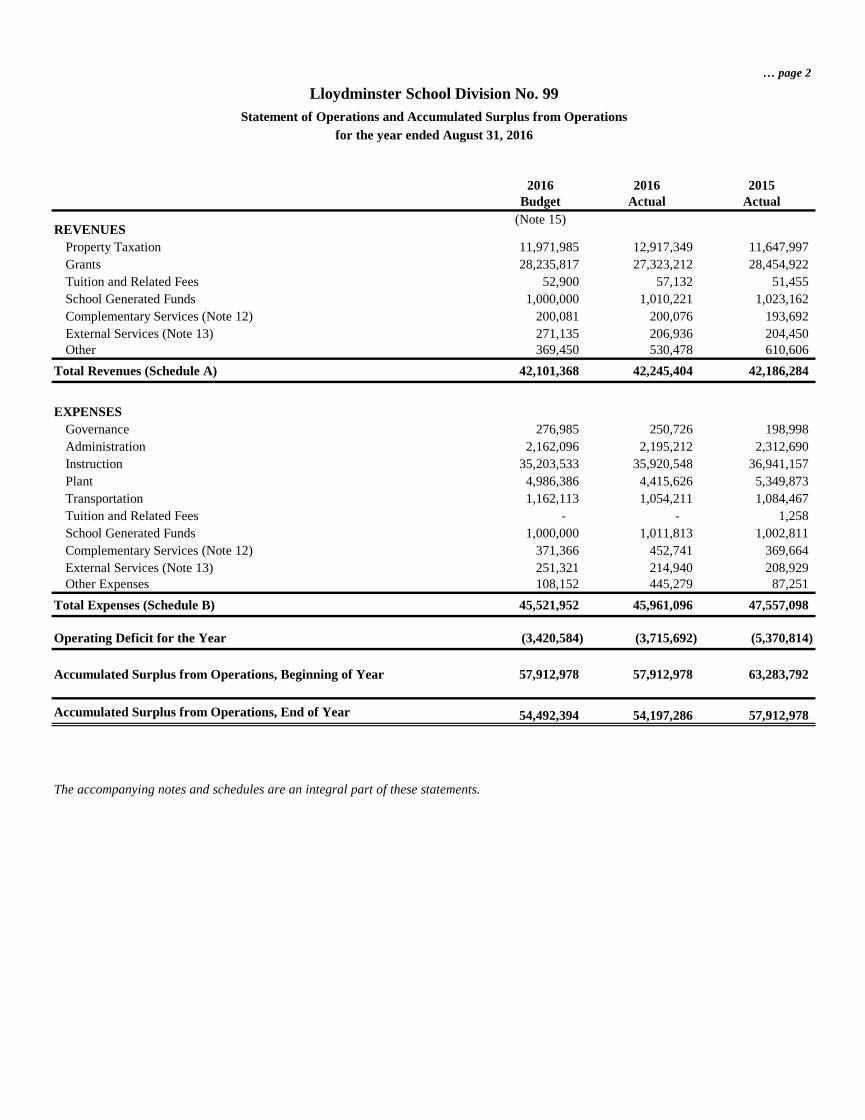
… page 2
2016 2016 2015Budget Actual Actual
REVENUES(Note 15)
Property Taxation 11,971,985 12,917,349 11,647,997 Grants 28,235,817 27,323,212 28,454,922 Tuition and Related Fees 52,900 57,132 51,455 School Generated Funds 1,000,000 1,010,221 1,023,162 Complementary Services (Note 12) 200,081 200,076 193,692 External Services (Note 13) 271,135 206,936 204,450 Other 369,450 530,478 610,606
Total Revenues (Schedule A) 42,101,368 42,245,404 42,186,284
EXPENSESGovernance 276,985 250,726 198,998 Administration 2,162,096 2,195,212 2,312,690 Instruction 35,203,533 35,920,548 36,941,157 Plant 4,986,386 4,415,626 5,349,873 Transportation 1,162,113 1,054,211 1,084,467 Tuition and Related Fees - - 1,258 School Generated Funds 1,000,000 1,011,813 1,002,811 Complementary Services (Note 12) 371,366 452,741 369,664 External Services (Note 13) 251,321 214,940 208,929 Other Expenses 108,152 445,279 87,251
Total Expenses (Schedule B) 45,521,952 45,961,096 47,557,098
Operating Deficit for the Year (3,420,584) (3,715,692) (5,370,814)
Accumulated Surplus from Operations, Beginning of Year 57,912,978 57,912,978 63,283,792
Accumulated Surplus from Operations, End of Year 54,492,394 54,197,286 57,912,978
The accompanying notes and schedules are an integral part of these statements.
Lloydminster School Division No. 99Statement of Operations and Accumulated Surplus from Operations
for the year ended August 31, 2016

… page 3
2016 2016 2015Budget Actual Actual
(Note 15)
Net Financial Assets, Beginning of Year 7,175,974 7,175,974 8,117,455
Changes During the YearOperating Deficit for the Year (3,420,584) (3,715,692) (5,370,814) Acquisition of Tangible Capital Assets (Schedule C) (1,261,949) (3,522,673) (2,414,628) Net Loss on Disposal of Capital Assets (Schedule C) - 1,766 - Amortization of Tangible Capital Assets (Schedule C) 3,988,300 4,327,655 6,780,991 Net Acquisition of Inventory of Supplies - (23,744) (15,930) Net Change in Other Non-Financial Assets - 70,711 78,900
Change in Net Financial Assets (694,233) (2,861,977) (941,481)
Net Financial Assets, End of Year 6,481,741 4,313,997 7,175,974
The accompanying notes and schedules are an integral part of these statements.
Lloydminster School Division No. 99Statement of Changes in Net Financial Assets
for the year ended August 31, 2016

… page 4
2016 2015OPERATING ACTIVITIES
Operating Deficit for the Year (3,715,692) (5,370,814) Add Non-Cash Items Included in Deficit (Schedule D) 4,329,421 6,780,991 Net Change in Non-Cash Operating Activities (Schedule E) 4,181,676 (3,005,149)
Cash Provided (Used) by Operating Activities 4,795,405 (1,594,972)
CAPITAL ACTIVITIESCash Used to Acquire Tangible Capital Assets (3,522,673) (2,414,628)
Cash Used by Capital Activities (3,522,673) (2,414,628)
INVESTING ACTIVITIESCash Used to Acquire Portfolio Investments (7,193) (7,838) Proceeds on Disposal of Portfolio Investments - 96,182
Cash Provided (Used) by Investing Activities (7,193) 88,344
FINANCING ACTIVITIESRepayment of Long-Term Debt (106,187) (101,979)
Cash Used by Financing Activities (106,187) (101,979)
INCREASE (DECREASE) IN CASH AND CASH EQUIVALENTS 1,159,352 (4,023,235)
CASH AND CASH EQUIVALENTS, BEGINNING OF YEAR 6,438,866 10,462,101
CASH AND CASH EQUIVALENTS, END OF YEAR 7,598,218 6,438,866
The accompanying notes and schedules are an integral part of these statements.
Lloydminster School Division No. 99Statement of Cash Flows
for the year ended August 31, 2016

… page 5
2016 2016 2015Budget Actual Actual
Property Taxation RevenueTax Levy Revenue
Property Tax Levy Revenue 11,971,985 12,767,517 11,519,838 Total Property Tax Revenue 11,971,985 12,767,517 11,519,838
Grants in Lieu of Taxes Federal Government - (9,156) 18,936 Provincial Government - 57,898 44,118 Other - 7,819 560
Total Grants in Lieu of Taxes - 56,561 63,614
Other Tax RevenuesHouse Trailer Fees - 40,841 24,332
Total Other Tax Revenues - 40,841 24,332
Additions to Levy Penalties - 85,581 65,134
Total Additions to Levy - 85,581 65,134
Deletions from Levy Cancellations - (25,681) (21,511)
Other Deletions - (7,470) (3,410) Total Deletions from Levy - (33,151) (24,921)
Total Property Taxation Revenue 11,971,985 12,917,349 11,647,997
Grants
Operating GrantsMinistry of Education Grants
Operating Grant 11,572,166 11,524,226 11,367,440 Other Ministry Grants 68,000 121,844 73,923 Total Ministry Grants 11,640,166 11,646,070 11,441,363
Federal Grants - 1,344 - Grants from Others 16,385,497 15,407,657 16,803,405 Total Operating Grants 28,025,663 27,055,071 28,244,768
Capital GrantsMinistry of Education Capital Grants 210,154 268,141 210,154 Total Capital Grants 210,154 268,141 210,154
Total Grants 28,235,817 27,323,212 28,454,922
Lloydminster School Division No. 99Schedule A: Supplementary Details of Revenues
for the year ended August 31, 2016
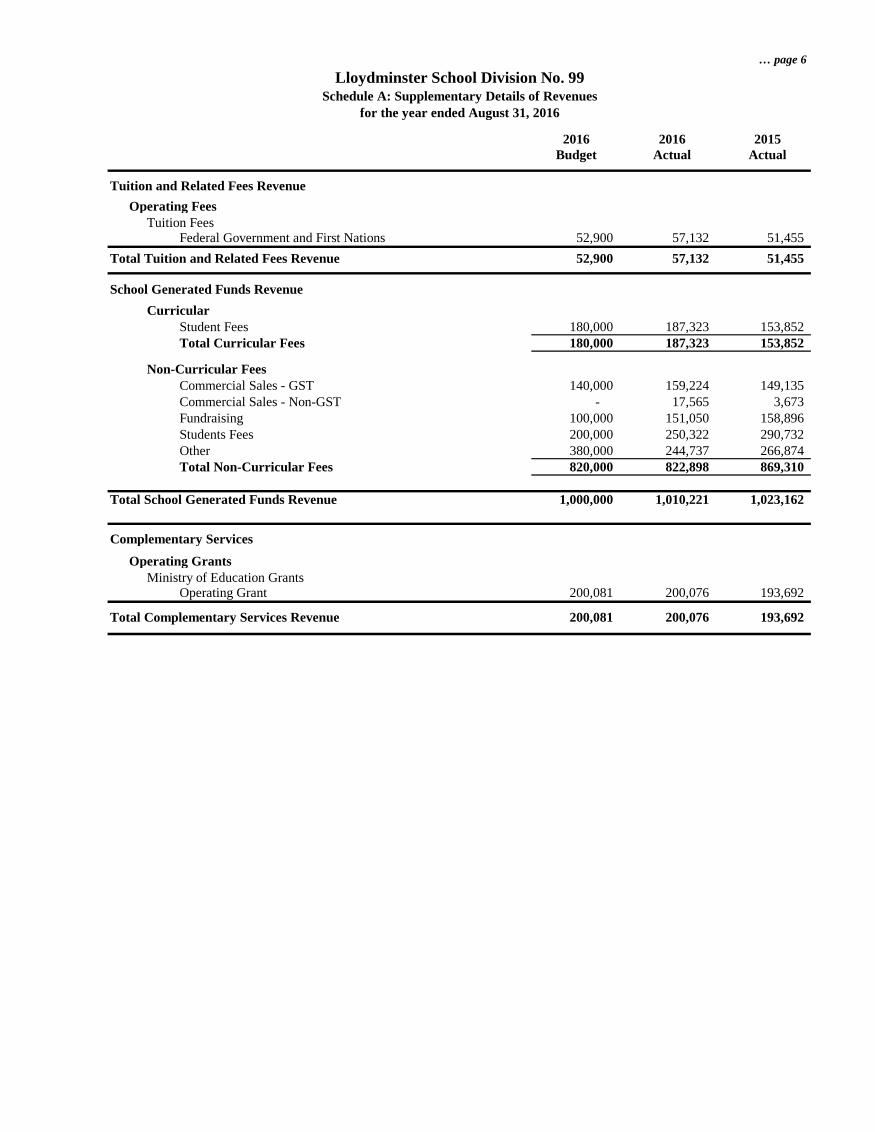
… page 6
2016 2016 2015Budget Actual Actual
Tuition and Related Fees RevenueOperating Fees
Tuition Fees Federal Government and First Nations 52,900 57,132 51,455
Total Tuition and Related Fees Revenue 52,900 57,132 51,455
School Generated Funds Revenue Curricular
Student Fees 180,000 187,323 153,852 Total Curricular Fees 180,000 187,323 153,852
Non-Curricular Fees Commercial Sales - GST 140,000 159,224 149,135 Commercial Sales - Non-GST - 17,565 3,673
Fundraising 100,000 151,050 158,896 Students Fees 200,000 250,322 290,732 Other 380,000 244,737 266,874 Total Non-Curricular Fees 820,000 822,898 869,310
Total School Generated Funds Revenue 1,000,000 1,010,221 1,023,162
Complementary ServicesOperating Grants
Ministry of Education GrantsOperating Grant 200,081 200,076 193,692
Total Complementary Services Revenue 200,081 200,076 193,692
Schedule A: Supplementary Details of Revenuesfor the year ended August 31, 2016
Lloydminster School Division No. 99

… page 7
2016 2016 2015Budget Actual Actual
External Services
Operating GrantsMinistry of Education Grants
Other Ministry Grants 76,135 76,896 76,896 Other Provincial Grants 10,000 8,643 2,794 Total Operating Grants 86,135 85,539 79,690
Fees and Other RevenueTuition and Related Fees - - 4,480 Other Revenue 185,000 121,397 120,280 Total Fees and Other Revenue 185,000 121,397 124,760
Total External Services Revenue 271,135 206,936 204,450
Other Revenue
Miscellaneous Revenue 262,000 448,305 519,629 Sales & Rentals 31,000 56,553 27,232 Investments 76,450 25,620 63,745
Total Other Revenue 369,450 530,478 610,606
TOTAL REVENUE FOR THE YEAR 42,101,368 42,245,404 42,186,284
for the year ended August 31, 2016
Lloydminster School Division No. 99Schedule A: Supplementary Details of Revenues

… page 8
2016 2016 2015Budget Actual Actual
Governance Expense
Board Members Expense 50,650 41,412 30,637 Professional Development- Board Members 26,100 27,820 11,556 Advisory Committees 5,000 - - Elections - - 7,055 Other Governance Expenses 195,235 181,494 149,750
Total Governance Expense 276,985 250,726 198,998
Administration Expense
Salaries 1,377,817 1,437,450 1,548,287 Benefits 144,279 149,588 156,213 Supplies & Services 116,450 113,518 105,951 Non-Capital Furniture & Equipment 67,000 63,297 51,593 Building Operating Expenses 52,050 39,867 41,459 Communications 49,000 35,489 56,365 Travel 42,500 38,345 32,328 Professional Development 45,000 53,644 42,855 Amortization of Tangible Capital Assets 268,000 264,014 277,639
Total Administration Expense 2,162,096 2,195,212 2,312,690
Instruction ExpenseInstructional (Teacher Contract) Salaries 22,238,338 22,614,956 21,368,406 Instructional (Teacher Contract) Benefits 1,188,604 1,184,664 1,207,583 Program Support (Non-Teacher Contract) Salaries 5,085,199 5,222,962 5,174,687 Program Support (Non-Teacher Contract) Benefits 710,582 725,737 707,391 Instructional Aids 748,932 659,425 605,376 Supplies & Services 933,795 785,571 807,288 Non-Capital Furniture & Equipment 185,577 218,321 162,808 Communications 256,801 257,666 276,851 Travel 27,500 28,483 21,485 Professional Development 186,952 208,434 173,325 Student Related Expense 104,953 114,950 95,674 Amortization of Tangible Capital Assets 3,536,300 3,899,379 6,340,283
Total Instruction Expense 35,203,533 35,920,548 36,941,157
Lloydminster School Division No. 99Schedule B: Supplementary Details of Expenses
for the year ended August 31, 2016

… page 9
2016 2016 2015Budget Actual Actual
Plant Operation & Maintenance Expense
Salaries 2,134,188 2,092,020 2,088,117 Benefits 321,793 327,601 304,801 Supplies & Services 4,200 1,141 2,432 Non-Capital Furniture & Equipment 14,800 34,806 30,855 Building Operating Expenses 2,392,305 1,867,273 2,825,474 Communications 2,400 4,156 9,613 Travel 41,000 29,375 24,201 Professional Development 11,500 4,987 12,002 Amortization of Tangible Capital Assets 64,200 54,267 52,378
Total Plant Operation & Maintenance Expense 4,986,386 4,415,626 5,349,873
Student Transportation Expense
Salaries 532,640 515,389 513,490 Benefits 85,448 75,085 74,188 Supplies & Services 152,875 122,072 149,165 Non-Capital Furniture & Equipment 124,100 149,041 136,116 Communications 300 270 563 Travel 3,500 2,770 2,818 Professional Development 6,400 5,466 8,277 Contracted Transportation 137,050 74,123 89,159 Amortization of Tangible Capital Assets 119,800 109,995 110,691
Total Student Transportation Expense 1,162,113 1,054,211 1,084,467
Tuition and Related Fees Expense
Tuition Fees - - 1,258
Total Tuition and Related Fees Expense - - 1,258
School Generated Funds Expense
Cost of Sales 75,000 154,150 142,210 School Fund Expenses 925,000 857,663 860,601
Total School Generated Funds Expense 1,000,000 1,011,813 1,002,811
Schedule B: Supplementary Details of Expensesfor the year ended August 31, 2016
Lloydminster School Division No. 99

… page 10
2016 2016 2015Budget Actual Actual
Complementary Services Expense
Instructional (Teacher Contract) Salaries & Benefits 244,736 243,547 243,834 Program Support (Non-Teacher Contract) Salaries & Benefits 114,080 193,979 112,335 Student Related Expenses 12,550 15,215 13,495
Total Complementary Services Expense 371,366 452,741 369,664
External Service ExpenseGrant Transfers 75,175 75,906 75,175 Program Support (Non-Teacher Contract) Salaries & Benefits 69,536 56,878 56,734 Supplies & Services 106,610 79,551 74,394 Building Operating Expenses - 2,605 2,626
Total External Services Expense 251,321 214,940 208,929
Other Expense
Interest and Bank ChargesCurrent Interest and Bank Charges 15,200 24,619 15,112 Interest on Capital Loans 92,952 92,932 97,139 Total Interest and Bank Charges 108,152 117,551 112,251
Provision for Uncollectable Accounts - 327,728 (25,000)
Total Other Expense 108,152 445,279 87,251
TOTAL EXPENSES FOR THE YEAR 45,521,952 45,961,096 47,557,098
Schedule B: Supplementary Details of ExpensesLloydminster School Division No. 99
for the year ended August 31, 2016

Lloydminster School Division No. 99Schedule C - Supplementary Details of Tangible Capital Assetsfor the year ended August 31, 2016
Furniture ComputerLand Buildings School Other and Hardware and Computer Assets
Land Improvements Buildings Short-Term Buses Vehicles EquipmentAudio Visual Equipment Software
Under Construction 2016 2015
Tangible Capital Assets - at Cost
Opening Balance as of September 1 577,580 994,476 72,079,410 2,608,293 1,919,533 447,754 3,557,321 2,852,554 284,547 190,708 85,512,176 83,792,160
Additions/Purchases - 964,512 1,973,344 - 135,184 - 172,421 277,212 - - 3,522,673 2,414,628 Disposals - - - - - - (194,038) (754,648) - (1,766) (950,452) (694,612) Transfers to (from) - - 188,942 - - - - - - (188,942) - -
Closing Balance as of August 31 577,580 1,958,988 74,241,696 2,608,293 2,054,717 447,754 3,535,704 2,375,118 284,547 - 88,084,397 85,512,176
Tangible Capital Assets - Amortization
Opening Balance as of September 1 - 646,525 28,327,734 1,114,864 1,290,726 318,317 1,540,672 1,821,144 181,421 - 35,241,403 29,155,024
Amortization of the Period - 97,950 3,111,386 118,299 101,443 28,866 348,392 475,024 46,295 - 4,327,655 6,780,991 Disposals - - - - - - (194,038) (754,648) - - (948,686) (694,612)
Closing Balance as of August 31 N/A 744,475 31,439,120 1,233,163 1,392,169 347,183 1,695,026 1,541,520 227,716 N/A 38,620,372 35,241,403
Net Book ValueOpening Balance as of September 1 577,580 347,951 43,751,676 1,493,429 628,807 129,437 2,016,649 1,031,410 103,126 190,708 50,270,773 54,637,136 Closing Balance as of August 31 577,580 1,214,513 42,802,576 1,375,130 662,548 100,571 1,840,678 833,598 56,831 - 49,464,025 50,270,773 Change in Net Book Value - 866,562 (949,100) (118,299) 33,741 (28,866) (175,971) (197,812) (46,295) (190,708) (806,748) (4,366,363)
DisposalsHistorical Cost - - - - - - 194,038 754,648 - 1,766 950,452 694,612 Accumulated Amortization - - - - - - 194,038 754,648 - - 948,686 694,612 Net Cost - - - - - - - - - 1,766 1,766 - Loss on Disposal - - - - - - - - - (1,766) (1,766) -
… page 11
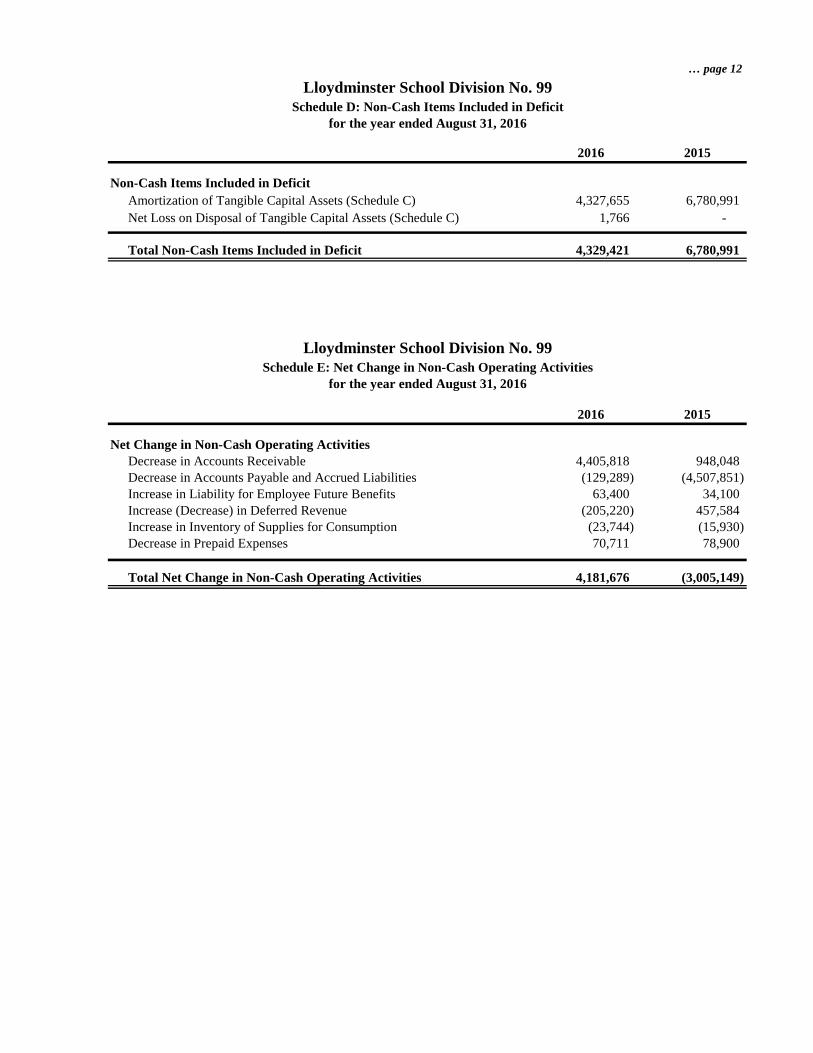
… page 12
2016 2015
Non-Cash Items Included in DeficitAmortization of Tangible Capital Assets (Schedule C) 4,327,655 6,780,991 Net Loss on Disposal of Tangible Capital Assets (Schedule C) 1,766 -
Total Non-Cash Items Included in Deficit 4,329,421 6,780,991
2016 2015
Net Change in Non-Cash Operating ActivitiesDecrease in Accounts Receivable 4,405,818 948,048 Decrease in Accounts Payable and Accrued Liabilities (129,289) (4,507,851) Increase in Liability for Employee Future Benefits 63,400 34,100 Increase (Decrease) in Deferred Revenue (205,220) 457,584 Increase in Inventory of Supplies for Consumption (23,744) (15,930) Decrease in Prepaid Expenses 70,711 78,900
Total Net Change in Non-Cash Operating Activities 4,181,676 (3,005,149)
Schedule E: Net Change in Non-Cash Operating Activitiesfor the year ended August 31, 2016
Lloydminster School Division No. 99Schedule D: Non-Cash Items Included in Deficit
for the year ended August 31, 2016
Lloydminster School Division No. 99

LLOYDMINSTER SCHOOL DIVISION NO. 99 NOTES TO THE FINANCIAL STATEMENTS
As at August 31, 2016 P a g e | 13
1. AUTHORITY AND PURPOSE The school division operates under the authority of The Education Act, 1995 of Saskatchewan as a corporation under the name of “The Board of Education of the Lloydminster Public School Division No. 99” and operates as “the Lloydminster Public School Division No. 99”. The school division provides education services to residents within its geographic region and is governed by an elected board of trustees. The school division is funded mainly by grants from the Governments of Saskatchewan and Alberta and a levy on the property assessment included in the school division’s boundaries at mill rates determined by the provincial government. The school division is exempt from income tax and is a registered charity under the Income Tax Act.
2. SIGNIFICANT ACCOUNTING POLICIES
These financial statements have been prepared in accordance with Canadian public sector accounting standards for other government organizations as established by the Public Sector Accounting Board (PSAB) and as published by the Chartered Professional Accountants of Canada (CPA Canada). Significant aspects of the accounting policies adopted by the school division are as follows: a) Basis of Accounting
The financial statements are prepared using the accrual basis of accounting.
b) Reporting Entity
The financial statements include all of the assets, liabilities, revenues and expenses of the school division reporting entity.
c) Trust Funds
Trust funds are properties assigned to the school division (trustee) under a trust agreement or statute to be administered for the benefit of the trust beneficiaries. As trustee, the school division merely administers the terms and conditions embodied in the agreements and has no unilateral authority to change the conditions set out in the trust indenture. Trust funds are not included in the financial statements as they are not controlled by the school division. Trust fund activities administered by the school division are disclosed in Note 17 of the financial statements.
d) Measurement Uncertainty and the Use of Estimates
Canadian public sector accounting standards require management to make estimates and assumptions that affect the reported amount of assets and liabilities and disclosure of contingent assets and liabilities at the date of the financial statements, and the reported amounts of revenues and expenses during the year. Measurement uncertainty that may be material to these financial statements exists for:
• the liability for employee future benefits of $440,500 (2015 - $377,100) because actual experience may differ significantly from actuarial estimations.

LLOYDMINSTER SCHOOL DIVISION NO. 99 NOTES TO THE FINANCIAL STATEMENTS
As at August 31, 2016 P a g e | 14
• property taxation revenue of $12,917,349 (2015 - $11,647,997) because final tax assessments may differ from initial estimates.
• useful lives of capital assets and related amortization of $4,327,655 (2015 - $6,780,991) because the actual useful lives of the capital assets may differ from their estimated economic lives.
These estimates and assumptions are reviewed periodically and, as adjustments become necessary, they are reported in earnings in the periods in which they become known. While best estimates are used for reporting items subject to measurement uncertainty, it is reasonably possible that changes in future conditions, occurring within one fiscal year, could require material changes in the amounts recognized or disclosed.
e) Financial Instruments
Financial instruments are any contracts that give rise to financial assets of one entity and financial liabilities or equity instruments of another entity. A contract establishing a financial instrument creates, at its inception, rights and obligations to receive or deliver economic benefits. The school division recognizes a financial instrument when it becomes a party to the contractual provisions of a financial instrument. The financial assets and financial liabilities portray these rights and obligations in the financial statements. Financial instruments of the school division include cash and cash equivalents, accounts receivable, portfolio investments, accounts payable and accrued liabilities and long-term debt. All financial instruments are measured at cost or amortized cost. Transaction costs are a component of the cost of financial instruments measured using cost or amortized cost. For financial instruments measured using amortized cost, the effective interest rate method is used to determine interest revenues or expenses. Impairment losses such as write-downs or write-offs are reported in the statement of operations and accumulated surplus from operations. Gains and losses on financial instruments, measured at cost or amortized cost, are recognized in the statement of operations and accumulated surplus from operations in the period the gain or loss occurs.
f) Financial Assets
Financial assets are assets that could be used to discharge existing liabilities or finance future operations and are not for consumption in the normal course of operations. Valuation allowances are used where considered necessary to reduce the amounts reported for financial assets to their net realizable value. Cash and Cash Equivalents consist of cash, bank deposits and highly liquid investments with initial maturity terms of three months or less and held for the purpose of meeting short-term operating cash commitments rather than for investing purposes.

LLOYDMINSTER SCHOOL DIVISION NO. 99 NOTES TO THE FINANCIAL STATEMENTS
As at August 31, 2016 P a g e | 15
Accounts Receivable includes taxes receivable, provincial grants receivable and other receivables. Taxes receivable represent education property taxes assessed or estimated owing to the end of the fiscal period but not yet received. The allowance for uncollected taxes is a valuation allowance used to reduce the amount reported for taxes receivable to the estimated net recoverable amount. The allowance represents management’s estimate of the amount of taxes that will not be collected taking into consideration prior years’ tax collections and information provided by municipalities regarding collectability of outstanding balances. Provincial grants receivable represent operating, capital and other grants earned but not received at the end of the fiscal year, provided reasonable estimates of the amounts can be made. Grants are earned when the events giving rise to the grant have occurred, the grant is authorized and any eligibility criteria have been met. Other receivables are recorded at cost less valuation allowances. These allowances are recorded where collectability is considered doubtful. Portfolio Investments consist of equity in common shares which are carried at cost. The school division values its portfolio investments in accordance with its policy for financial instruments, as described in Note 2 (e).
g) Non-Financial Assets
Non-financial assets are assets held for consumption in the provision of services. These assets do not normally provide resources to discharge the liabilities of the school division unless they are sold. Tangible Capital Assets have useful lives extending beyond the accounting period, are used by the school division to provide services to the public and are not intended for sale in the ordinary course of operations. Tangible capital assets include land and land improvements, buildings, buildings – short-term, school buses, other vehicles, furniture and equipment, computer hardware and software, audio visual equipment, and assets under construction. Tangible capital assets are recorded at cost (or estimated cost when the actual cost is unknown) and include all costs directly attributable to the acquisition, design, construction, development, installation and betterment of the tangible capital asset. The school division does not capitalize interest incurred while a tangible capital asset is under construction.
The cost of depreciable tangible capital assets, net of any residual value, is amortized on a straight line basis over their estimated useful lives as follows:
Land improvements (pavement, fencing, lighting, etc.) 20 years Buildings 50 years Buildings – short-term (portables, storage sheds, outbuildings, garages)
20 years
School buses 12 years Other vehicles – passenger 5 years Other vehicles – heavy (graders, 1 ton truck, etc.) 10 years

LLOYDMINSTER SCHOOL DIVISION NO. 99 NOTES TO THE FINANCIAL STATEMENTS
As at August 31, 2016 P a g e | 16
Furniture and equipment 10 years Computer hardware and audio visual equipment 5 years Computer software 5 years
Assets under construction are not amortized until completed and placed into service for use. Assets that have a historical or cultural significance, such as works of art, monuments and other cultural artifacts, are not recognized as tangible capital assets because a reasonable estimate of future benefits associated with these properties cannot be made. Inventory of Supplies for Consumption consists of supplies held for consumption by the school division in the course of normal operations and are recorded at the lower of cost and replacement cost. Prepaid Expenses are prepaid amounts for goods or services which will provide economic benefits in one or more future periods. Prepaid expenses include such items as insurance premiums, Saskatchewan School Boards Association membership fees, other membership fees, software licenses, vehicle licensing and copier leases.
h) Liabilities
Liabilities are present obligations arising from transactions and events occurring prior to year-end, which will be satisfied in the future through the use of assets or another form of economic settlement. Accounts Payable and Accrued Liabilities include accounts payable and accrued liabilities owing to third parties and employees for work performed, goods supplied and services rendered, but not yet paid, at the end of the fiscal period. Long-Term Debt is comprised of capital loans with initial maturities of more than one year and are incurred for the purpose of financing capital expenses in accordance with the provisions of The Education Act, 1995. Liability for Employee Future Benefits represents post-employment and compensated absence benefits that accrue to the school division's employees. The cost of these benefits is recorded as the benefits are earned by employees. The liability relating to these benefits is actuarially determined using the projected benefit method pro-rated on service. Actuarial valuations are performed periodically using assumptions including discount rate, inflation, salary escalation, termination and retirement rates and mortality. An actuary extrapolates these valuations when a valuation is not done in the current fiscal year. Actuarial gains and losses are amortized on a straight line basis over the expected average remaining service life of the related employee groups. Deferred Revenue from Non-government Sources represents fees or payments for services received in advance of the fee being earned or the services being performed, and other contributions for which the contributor has placed restrictions on the use of the resources. Revenue from tuition and related fees is recognized as the course is delivered and revenue from other contributions is recognized in the fiscal year in which the resources are used for the purpose specified by the contributor.

LLOYDMINSTER SCHOOL DIVISION NO. 99 NOTES TO THE FINANCIAL STATEMENTS
As at August 31, 2016 P a g e | 17
i) Employee Pension Plans
Employees of the school division participate in the following pension plans: Multi-Employer Defined Benefit Plans
The school division’s employees participate in one of the following multi-employer defined benefit plans:
i) Teachers participate in the Saskatchewan Teachers’ Retirement Plan (STRP), the Saskatchewan Teachers’ Superannuation Plan (STSP), or the Alberta Teachers’ Retirement Fund (ATRF). The school division’s obligation for these plans is limited to collecting and remitting contributions of the employees at rates determined by the plans.
ii) One employee participates in the Municipal Employees’ Pension Plan (MEPP). In
accordance with the Public Sector Accounting Board (PSAB) standards, the plan is accounted for as a defined contribution plan whereby the school division’s contributions are expensed when due.
Defined Contribution Plans
The school division’s support staff, excluding one support staff who participates in MEPP, participate in a defined contribution pension plan. The school division’s contributions to the plan are expensed when due.
j) Revenue Recognition
Revenues are recorded on the accrual basis. Revenues are recognized in the period in which the transactions or events occurred that gave rise to the revenues, provided the amount to be received can be reasonably estimated and collection is reasonably assured. The school division’s sources of revenues include the following: i) Government Transfers (Grants)
Grants from governments are considered to be government transfers. In accordance with PS3410 standard, government transfers are recognized as revenues when the transfer is authorized, all eligibility criteria have been met, the amount can be estimated and collection is reasonably assured except when, and to the extent, stipulations by the transferor give rise to an obligation that meets the definition of a liability. For transfers with stipulations, revenue is recognized in the statement of operations and accumulated surplus from operations as the stipulation liabilities are settled.
ii) Property Taxation
Property tax is levied and collected on a calendar year basis. Uniform education property tax mill rates are set by the Government of Saskatchewan. Tax revenues are recognized on the basis of time with 1/12th of estimated total tax revenue recorded in each month of the school division’s fiscal year. The tax revenue for the September to December portion of the fiscal year is based on the actual amounts reported by the municipalities for the calendar taxation year. For the January to August portion of its fiscal year, the school division estimates tax revenue based on estimate information provided by municipalities who levy and collect the property tax on behalf of the school division. The final annual taxation amounts are reported

LLOYDMINSTER SCHOOL DIVISION NO. 99 NOTES TO THE FINANCIAL STATEMENTS
As at August 31, 2016 P a g e | 18
to the division by each municipality following the conclusion of each calendar taxation year, and any difference between final amounts and the school division’s estimates is recorded as an adjustment to revenue in the next fiscal year.
iii) Fees and Services
Revenues from tuition fees and other fees and services are recognized in the year they are earned. Amounts that are restricted pursuant to legislation, regulation or agreements with external parties that may only be used in the conduct of certain programs or in the delivery of specific services and transactions are initially recorded as deferred revenue and subsequently recognized as revenue in the fiscal year the related expenses are incurred or services are performed.
iv) Interest Income
Interest is recognized on an accrual basis when it is earned.
v) Other (Non-Government Transfer) Contributions
Unrestricted contributions are recognized as revenue in the year received or in the year the funds are committed to the school division if the amount can be reasonably estimated and collection is reasonably assured. Externally restricted contributions are contributions for which the contributor has placed restrictions on the use of the resources. Externally restricted contributions that are not held in perpetuity are deferred until the resources are used for the purpose specified, at which time the contributions are recognized as revenue. In-kind contributions are recorded at their fair value when they are received.
k) Statement of Remeasurement Gains and Losses The school division has not presented a statement of remeasurement gains or losses because it does not have financial instruments that give rise to material remeasurement gains or losses.
3. SHORT-TERM BORROWINGS
Bank indebtedness consists of a demand operating line of credit with a maximum borrowing limit of $2,600,000 (2015 - $7,000,000) that bears interest at a rate of the bank’s prime rate less 1.85% (2015 – prime less 0.5%) per annum with Servus Credit Union. This line of credit is authorized by a borrowing resolution by the board of education dated April 24, 2013 and is secured by an overdraft protection agreement and borrowing resolution. This line of credit was approved by the Minister of Education on January 22, 2013. The balance drawn on the line of credit at August 31, 2016 was $0 (August 31, 2015 - $0).
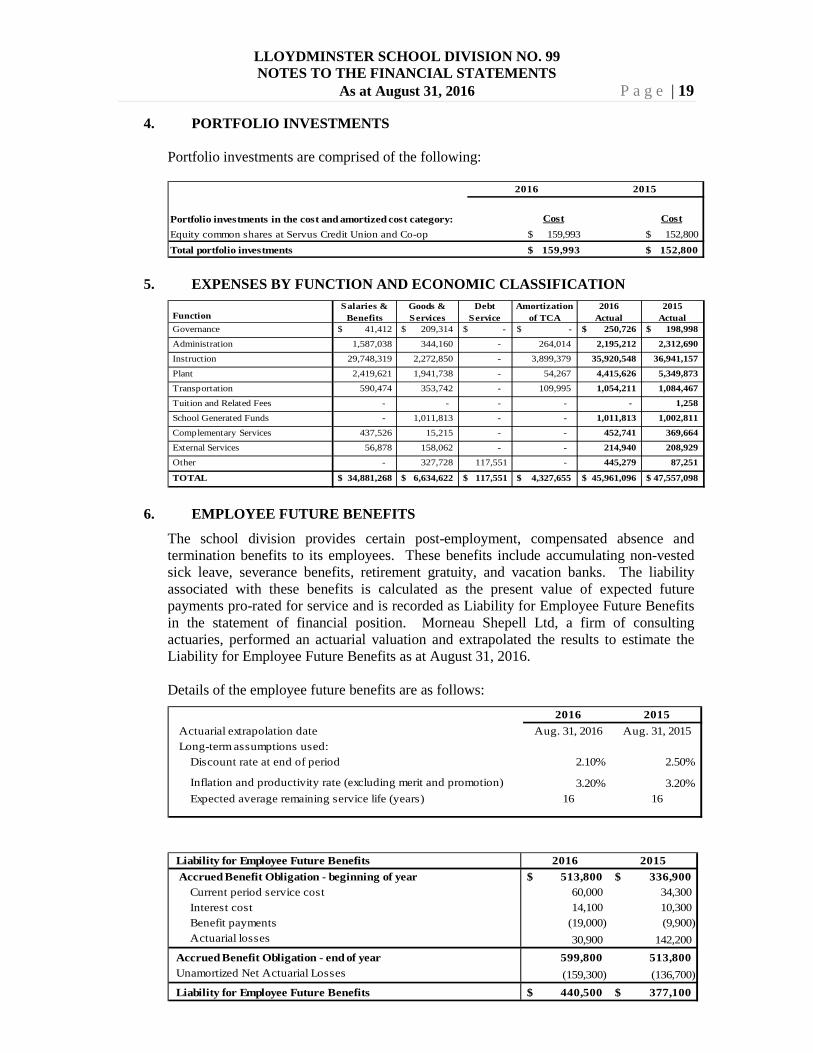
LLOYDMINSTER SCHOOL DIVISION NO. 99 NOTES TO THE FINANCIAL STATEMENTS
As at August 31, 2016 P a g e | 19
4. PORTFOLIO INVESTMENTS
Portfolio investments are comprised of the following:
Portfolio investments in the cost and amortized cost category: Cost CostEquity common shares at Servus Credit Union and Co-op 159,993$ 152,800$ Total portfolio investments 159,993$ 152,800$
2016 2015
5. EXPENSES BY FUNCTION AND ECONOMIC CLASSIFICATION
FunctionSalaries &
BenefitsGoods & Services
Debt Service
Amortization of TCA
2016 Actual
2015 Actual
Governance $ 41,412 $ 209,314 $ - $ - $ 250,726 $ 198,998
Administration 1,587,038 344,160 - 264,014 2,195,212 2,312,690
Instruction 29,748,319 2,272,850 - 3,899,379 35,920,548 36,941,157
Plant 2,419,621 1,941,738 - 54,267 4,415,626 5,349,873
Transportation 590,474 353,742 - 109,995 1,054,211 1,084,467
Tuition and Related Fees - - - - - 1,258
School Generated Funds - 1,011,813 - - 1,011,813 1,002,811
Complementary Services 437,526 15,215 - - 452,741 369,664
External Services 56,878 158,062 - - 214,940 208,929
Other - 327,728 117,551 - 445,279 87,251
TOTAL $ 34,881,268 $ 6,634,622 $ 117,551 $ 4,327,655 $ 45,961,096 $ 47,557,098
6. EMPLOYEE FUTURE BENEFITS
The school division provides certain post-employment, compensated absence and termination benefits to its employees. These benefits include accumulating non-vested sick leave, severance benefits, retirement gratuity, and vacation banks. The liability associated with these benefits is calculated as the present value of expected future payments pro-rated for service and is recorded as Liability for Employee Future Benefits in the statement of financial position. Morneau Shepell Ltd, a firm of consulting actuaries, performed an actuarial valuation and extrapolated the results to estimate the Liability for Employee Future Benefits as at August 31, 2016. Details of the employee future benefits are as follows:
2016 2015 Actuarial extrapolation date Aug. 31, 2016 Aug. 31, 2015 Long-term assumptions used:
Discount rate at end of period 2.10% 2.50%
Inflation and productivity rate (excluding merit and promotion) 3.20% 3.20% Expected average remaining service life (years) 16 16
Liability for Employee Future Benefits 2016 2015 Accrued Benefit Obligation - beginning of year 513,800$ 336,900$ Current period service cost 60,000 34,300 Interest cost 14,100 10,300 Benefit payments (19,000) (9,900) Actuarial losses 30,900 142,200 Accrued Benefit Obligation - end of year 599,800 513,800 Unamortized Net Actuarial Losses (159,300) (136,700) Liability for Employee Future Benefits 440,500$ 377,100$

LLOYDMINSTER SCHOOL DIVISION NO. 99 NOTES TO THE FINANCIAL STATEMENTS
As at August 31, 2016 P a g e | 20
Employee Future Benefits Expense 2016 2015 Current period service cost 60,000$ 34,300$ Amortization of net actuarial (gain) / loss 8,300 (600) Benefit cost 68,300 33,700 Interest cost 14,100 10,300 Total Employee Future Benefits Expense 82,400$ 44,000$
7. PENSION PLANS
Multi-Employer Defined Benefit Plans
Information on the multi-employer pension plans to which the school division contributes is as follows: i) Saskatchewan Teachers’ Retirement Plan (STRP), Saskatchewan Teachers’
Superannuation Plan (STSP) or Alberta Teachers’ Retirement Fund (ATRF) The STRP, STSP and ATRF provide retirement benefits based on length of service and pensionable earnings. The STRP, STSP and ATRF are funded by contributions by the participating employee members and the Governments of Saskatchewan or Alberta. The school division’s obligation to the STRP, STSP and ATRF is limited to collecting and remitting contributions of the employees at rates determined by the plans. Accordingly, these financial statements do not include any expense for employer contributions to these plans. Net pension assets or liabilities for these plans are not reflected in these financial statements as ultimate responsibility for retirement benefits rests with the Saskatchewan Teachers’ Federation for the STRP, with the Government of Saskatchewan for the STSP and the Government of Alberta for the ATRF. Details of the contributions to these plans for the school division’s employees are as follows:
2015STRP STSP ATRF TOTAL TOTAL
Number of active School Division members 272 2 47 321 315 Member contribution rate (percentage of salary) 10.20% / 12.40% 6.05% / 7.85% 11.44% / 16.34% 6.05% / 16.34% 6.05% / 16.34% Member contributions for the year 2,031,006$ 4,778$ 497,931$ 2,533,715$ 2,280,985$
2016

LLOYDMINSTER SCHOOL DIVISION NO. 99 NOTES TO THE FINANCIAL STATEMENTS
As at August 31, 2016 P a g e | 21
ii) Municipal Employees’ Pension Plan (MEPP)
The MEPP provides retirement benefits based on length of service and pensionable earnings. The MEPP is funded by employer and employee contributions at rates set by the Municipal Employees’ Pension Commission. Every three years, an actuarial valuation is performed to assess the financial position of the plan and the adequacy of plan funding. Any actuarially determined deficiency is the responsibility of the participating employers and employees which could affect future contribution rates and/or benefits. The contributions to the MEPP by the participating employers are not segregated in separate accounts or restricted to provide benefits to the employees of a particular employer. As a result, individual employers are not able to identify their share of the underlying assets and liabilities, and the net pension assets or liabilities for this plan are not recognized in these financial statements. In accordance with the Public Sector Accounting Board (PSAB) standards, the plan is accounted for as a defined contribution plan whereby the school division’s contributions are expensed when due. Details of the MEPP are as follows:
2016 2015 Number of active School Division members 1 1 Member contribution rate (percentage of salary) 8.15% 8.15% School Division contribution rate (percentage of salary) 8.15% 8.15% Member contributions for the year 8,200$ 17,959$ School Division contributions for the year 8,200$ 17,959$
Actuarial (extrapolation) valuation date (Dec-31-2015) Dec-31-2014 Plan Assets (in thousands) 2,148,676$ 2,006,587$
Plan Liabilities (in thousands) 1,831,743$ 1,672,585$
Plan Surplus (in thousands) 316,933$ 334,002$
Defined Contribution Plans
The Manulife Pension Plan is funded by the school division making required payments to match the contributions made by employees for current services. Pension benefits are based on accumulated contributions and investment earnings. Under the defined contribution plan, the school division’s obligations are limited to its contributions. Details of the Manulife Pension Plan are as follows:
2016 2015 Number of active School Division members 175 166 Member contribution rate (percentage of salary) 6.00% 6.00% School Division contribution rate (percentage of salary) 6.00% 6.00% Member contributions for the year 434,763$ 409,277$ School Division contributions for the year 402,709$ 385,067$

LLOYDMINSTER SCHOOL DIVISION NO. 99 NOTES TO THE FINANCIAL STATEMENTS
As at August 31, 2016 P a g e | 22
8. ACCOUNTS RECEIVABLE
All accounts receivable presented on the statement of financial position are net of any valuation allowances for doubtful accounts. Details of accounts receivable balances and allowances are as follows:
Total Valuation Net of Total Valuation Net ofReceivable Allowance Allowance Receivable Allowance Allowance
Taxes Receivable 465,249$ -$ 465,249$ 46,537$ -$ 46,537$ Provincial Grants Receivable 3,204,114 - 3,204,114 7,916,592 - 7,916,592 Other Receivables 292,029 - 292,029 404,081 - 404,081 Total Accounts Receivable 3,961,392$ -$ 3,961,392$ 8,367,210$ -$ 8,367,210$
2016 2015
9. ACCOUNTS PAYABLE AND ACCRUED LIABILITIES
Details of accounts payable and accrued liabilities are as follows:
2016 2015 Accrued Salaries and Benefits 19,457$ 64,840$
Supplier Payments 2,199,815 2,283,721
Total Accounts Payable and Accrued Liabilities 2,219,272$ 2,348,561$
10. LONG-TERM DEBT
Details of long-term debt are as follows:
2016 2015
Capital Loans:
(1) Monthly payments of principal and interest combined of $15,004.61, interest rate of 4.20%; due on the 28th day of each month through to January 2033 (BMO - College Park School Construction) 2,133,574$ 2,222,034$ (2) Monthly payments of principal and interest combined of $1,588.62, interest rate of 3.30%; due on the last day of each month through to April 2018 (BMO - Replacement of Bishop Lloyd School Boiler) 30,873 48,600
Total Long-Term Debt 2,164,447$ 2,270,634$
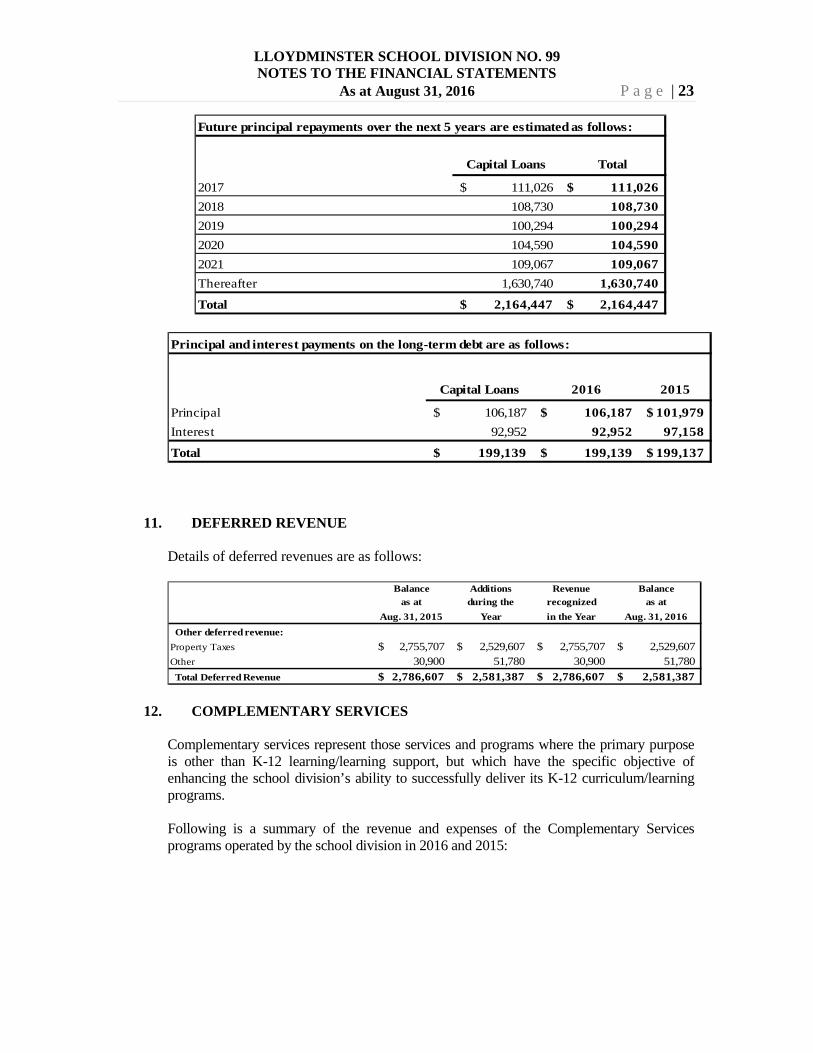
LLOYDMINSTER SCHOOL DIVISION NO. 99 NOTES TO THE FINANCIAL STATEMENTS
As at August 31, 2016 P a g e | 23
Future principal repayments over the next 5 years are estimated as follows:
Capital Loans Total
2017 111,026$ 111,026$ 2018 108,730 108,730 2019 100,294 100,294 2020 104,590 104,590 2021 109,067 109,067 Thereafter 1,630,740 1,630,740
Total 2,164,447$ 2,164,447$ Principal and interest payments on the long-term debt are as follows:
Capital Loans 2016 2015
Principal 106,187$ 106,187$ 101,979$ Interest 92,952 92,952 97,158
Total 199,139$ 199,139$ 199,137$
11. DEFERRED REVENUE
Details of deferred revenues are as follows:
Balance Additions Revenue Balanceas at during the recognized as at
Aug. 31, 2015 Year in the Year Aug. 31, 2016 Other deferred revenue:Property Taxes 2,755,707$ 2,529,607$ 2,755,707$ 2,529,607$ Other 30,900 51,780 30,900 51,780 Total Deferred Revenue 2,786,607$ 2,581,387$ 2,786,607$ 2,581,387$
12. COMPLEMENTARY SERVICES
Complementary services represent those services and programs where the primary purpose is other than K-12 learning/learning support, but which have the specific objective of enhancing the school division’s ability to successfully deliver its K-12 curriculum/learning programs. Following is a summary of the revenue and expenses of the Complementary Services programs operated by the school division in 2016 and 2015:

LLOYDMINSTER SCHOOL DIVISION NO. 99 NOTES TO THE FINANCIAL STATEMENTS
As at August 31, 2016 P a g e | 24
Summary of Complementary Services Revenues and Expenses, by Program Pre-K
ProgramsOther
Programs 2016 2015
Revenues:Operating Grants $ 200,076 $ - $ 200,076 $ 193,692 Total Revenues 200,076 - 200,076 193,692 Expenses:Salaries & Benefits 433,010 4,516 437,526 356,169 Student Related Expenses 6,796 8,419 15,215 13,495 Total Expenses 439,806 12,935 452,741 369,664 Deficiency of Revenues over Expenses $ (239,730) $ (12,935) $ (252,665) $ (175,972)
The purpose and nature of each Complementary Services program is as follows:
i) Pre-Kindergarten is a comprehensive initiative targeting children who may benefit from additional supports such as speech language and social development programming and is limited to children who are three and four years of age.
ii) Other programs represent Breakfast Programs, where the diverse learning needs of children and youth are met by incorporating a comprehensive range of effective educational practices. One of these practices includes providing nutritional meal options to students.
13. EXTERNAL SERVICES
External services represent those services and programs that are outside of the school division’s learning/learning support and complementary programs. These services have no direct link to the delivery of the school division’s K-12 programs nor do they directly enhance the school division’s ability to deliver its K-12 programs. Following is a summary of the revenue and expenses of the External Services programs operated by the school division in 2016 and 2015: Summary of External Services Revenues and Expenses, by Program Cafeteria
Other Programs 2016 2015
Revenues:Operating Grants $ - $ 85,539 $ 85,539 $ 79,690 Fees and Other Revenues 121,397 - 121,397 124,760 Total Revenues 121,397 85,539 206,936 204,450 Expenses:Grant Transfers - 75,906 75,906 75,175 Salaries & Benefits 56,878 - 56,878 56,734 Supplies and Services 74,831 4,720 79,551 74,394 Building Operating Expenses - 2,605 2,605 2,626 Total Expenses 131,709 83,231 214,940 208,929 Excess (Deficiency) of Revenues over Expenses $ (10,312) $ 2,308 $ (8,004) $ (4,479) The purpose and nature of each External Services program is as follows:
i) The Cafeteria provides food services for students at the school division’s Middle Schools and High School over the noon hour, as well as for special events that are occurring within the school division throughout the year.

LLOYDMINSTER SCHOOL DIVISION NO. 99 NOTES TO THE FINANCIAL STATEMENTS
As at August 31, 2016 P a g e | 25
ii) Other programs represent the Kids First program and LPSD Kids-in-Motion program. The Kids First program helps vulnerable families to become the best parents they can by enhancing knowledge, providing support and building on family strengths. The LPSD Kids-in-Motion program promotes increasing physical activity for health, social, environmental and economic benefits.
14. ACCUMULATED SURPLUS
Accumulated surplus represents the financial assets and non-financial assets of the school division less liabilities. This represents the accumulated balance of net surplus arising from the operations of the school division including school generated funds. Certain amounts of the accumulated surplus, as approved by the board of education, have been designated for specific future purposes such as school generated funds, incomplete budgets, replacement of aging vehicles, community track and technology evergreening. These internally restricted amounts are included in the accumulated surplus presented in the statement of financial position. The school division does not maintain separate bank accounts for the internally restricted amounts. Details of accumulated surplus are as follows:
August 31 2015
Additions during the
year
Reductions during the
yearAugust 31
2016 Invested in Tangible Capital Assets: Net Book Value of Tangible Capital Assets 50,270,773$ 3,522,673$ (4,329,421)$ 49,464,025$ Less: Debt owing on Tangible Capital Assets 2,270,634 - (106,187) 2,164,447
48,000,139 3,522,673 (4,223,234) 47,299,578
PMR maintenance project allocations (1) 46,354 268,141 (46,354) 268,141
Internally Restricted Surplus: Capital projects: Designated for tangible capital asset expenditures 3,299,633 - (3,149,633) 150,000 Community Track 16,000 8,000 - 24,000 Maintenance Vehicle Purchase 20,000 - (20,000) - Technology Evergreening 536,245 235,000 (219,129) 552,116 Facilities Upgrades 3,742,759 2,162,672 (2,475,985) 3,429,446
7,614,637 2,405,672 (5,864,747) 4,155,562 Other: School generated funds 320,829 - (74,454) 246,375 Board Strategies 580,000 - - 580,000 School budget carryovers 90,686 25,891 (90,686) 25,891 Incomplete Budgets 35,005 365,045 (35,005) 365,045 Parkland Proceeds 98,432 - (5,684) 92,748 Kids First Program 76,896 - - 76,896
1,201,848 390,936 (205,829) 1,386,955
Unrestricted Surplus 1,050,000 37,050 - 1,087,050
Total Accumulated Surplus 57,912,978$ 6,624,472$ (10,340,164)$ 54,197,286$

LLOYDMINSTER SCHOOL DIVISION NO. 99 NOTES TO THE FINANCIAL STATEMENTS
As at August 31, 2016 P a g e | 26
(1) PMR Maintenance Project Allocations represent transfers received from the Ministry of Education as funding support for maintenance projects on the school division’s approved 3 year capital maintenance plans. Unspent funds at the end of a fiscal year are designated for future approved capital plan maintenance project expenditures.
The purpose and nature of each Internally Restricted Surplus amount is as follows: i) The Designated for tangible capital asset reserve is monies received through
government grants, loans, and internal resources set aside to be used for the construction of the new K – 9 College Park School.
ii) The Facilities upgrades fund will be used to fund capital projects in future fiscal years.
iii) School generated funds are accumulated surpluses from the various extracurricular activities that are to support future operating costs of these activities.
iv) The Board strategies fund is accessible by the board to support strategic initiatives that it feels are of importance to the division.
v) School budget carryovers are unspent school budgets from the current year that are to be spent in the upcoming fiscal year.
vi) Incomplete budgets are unspent funds on various projects that are to be completed in the upcoming fiscal year.
vii) The Parkland proceeds fund is to be used to purchase specialized equipment to support the program for intensive needs children.
viii) The Community track fund is to be used to enhance the track and field area at the Lloydminster Comprehensive High School.
ix) The technology evergreening fund will be used to refresh computers and other technology over a predetermined period of time.
x) The Maintenance vehicle purchases fund is to be used for the purchase of maintenance vehicles in the future.
xi) The Kids First program represents a transfer received from the Ministry of Education as funding to support the Kids First program in the upcoming fiscal year.
15. BUDGET FIGURES
Budget figures included in the financial statements were approved by the board of education on June 17, 2015 and the Minister of Education on August 20, 2015.
16. RELATED PARTIES
These financial statements include transactions with related parties. The school division is related to all Government of Saskatchewan ministries, agencies, boards, school divisions, health authorities, colleges, and crown corporations under the common control of the Government of Saskatchewan. The school division is also related to non-crown enterprises that the Government jointly controls or significantly influences. In addition, the school division is related to other non-government organizations by virtue of its economic interest in these organizations.
Related Party Transactions
Transactions with these related parties are in the normal course of operations. Amounts due to or from and the recorded amounts of transactions resulting from these transactions are included in the financial statements and the table below. They are recorded at exchange amounts which approximate prevailing market rates charged by those organizations and are settled on normal trade terms.

LLOYDMINSTER SCHOOL DIVISION NO. 99 NOTES TO THE FINANCIAL STATEMENTS
As at August 31, 2016 P a g e | 27
2016 2015
Revenues:Community Initiatives Fund 8,643$ -$ Ministry of Education 12,192,111 11,923,404 Saskatchewan Lotteries - 2,794 Saskatchewan WCB 88,990 14,244 SGI 197,502 240,796
12,487,246$ 12,181,238$ Expenses:Good Spirit School Division 15,115$ 5,221$ Minister of Finance 1,586 1,547 Prairie North Health Authority 193 - Saskatchewan WCB 72,253 34,545 SaskPower 40,412 37,971 SaskTel 19,834 17,228 SGI - Auto Fund Division 27,684 40,961 Sun West School Division #207 49,000 30,000 Other Saskatchewan School Divisions 750 1,293
226,827$ 168,766$ Accounts Receivable:Ministry of Education -$ 4,338,950$ SGI Driver's Ed 66,045 -
66,045$ 4,338,950$ Prepaid Expenses:Good Spirit School Division -$ 5,675$ Saskpower 667 583 SGI - Auto Fund Division 12,397 15,000
13,064$ 21,258$
In addition, the school division pays Provincial Sales Tax to the Saskatchewan Ministry of Finance on all its taxable purchases and customer sales on items that are deemed taxable. Taxes paid are recorded as part of the cost of those purchases. A portion of the revenue from the Ministry of Education includes funding allocated to principal and interest repayments on some school board loans.
Other transactions with related parties and amounts due to/from them are described separately in the financial statements or notes thereto.

LLOYDMINSTER SCHOOL DIVISION NO. 99 NOTES TO THE FINANCIAL STATEMENTS
As at August 31, 2016 P a g e | 28
17. TRUSTS
The school division, as the trustee, administers trust funds for legacy scholarships. The trust assets and transactions are not included in the financial statements. Information about these trusts is as follows:
Total TotalCraig Hawkens Jones Other 2016 2015
Cash and short-term investments 1,130$ -$ -$ 75,110$ 76,240$ 120,961$ Portfolio investments 73,100 55,251 46,991 250,689 426,031 328,476 Total Assets 74,230$ 55,251$ 46,991$ 325,799$ 502,271$ 449,437$
Revenues Contributions and donations -$ -$ -$ 75,723$ 75,723$ 6,000$ Interest on investments 2,904 2,016 1,751 10,899 17,570 8,284
2,904 2,016 1,751 86,622 93,293 14,284
Expenses Awards to Students 5,000 1,500 2,000 31,959 40,459 32,513
5,000 1,500 2,000 31,959 40,459 32,513 Excess (Deficiency) of Revenue over Expenses (2,096) 516 (249) 54,663 52,834 (18,229) Trust Fund Balance, Beginning of Year 76,326 54,735 47,240 271,136 449,437 467,666 Trust Fund Balance, End of Year 74,230$ 55,251$ 46,991$ 325,799$ 502,271$ 449,437$
2016
18. CONTRACTUAL OBLIGATIONS AND COMMITMENTS
Significant contractual obligations and commitments of the school division are as follows:
• Lease agreements for the provision of Multi-Function Printers at all schools and Division Office.
Operating lease obligations of the school division are as follows:
Copier Leases
Total Operating
Future minimum lease payments:
2017 34,455$ 34,455$ 2018 34,455 34,455 2019 22,752 22,752
Total Lease Obligations 91,662$ 91,662$
Operating Leases
19. COMPARATIVE INFORMATION Certain comparative figures have been reclassified to conform to the current year's presentation.

LLOYDMINSTER SCHOOL DIVISION NO. 99 NOTES TO THE FINANCIAL STATEMENTS
As at August 31, 2016 P a g e | 29
20. SUBSEQUENT EVENTS
In May 2016 the Board of Education agreed to a property exchange with the City of Lloydminster. The Lloydminster Public School Division will transfer a parcel of land on the Alberta side of the city to the City of Lloydminster in exchange for a parcel of land on the Saskatchewan side of the city. The Minister of Education approved this exchange on June 30, 2016. As of August 31, 2016 the transfer had not been completed. This transfer is expected to be completed by November 30, 2016.
21. RISK MANAGEMENT
The school division is exposed to financial risks from its financial assets and liabilities. These risks include credit risk, liquidity risk and market risk consisting of interest rate risk. i) Credit Risk
Credit risk is the risk to the school division from potential non-payment of accounts receivable. The credit risk related to the school division's receivables from the provincial government, federal government and their agencies are considered to be minimal. For other receivables, the school division has adopted credit policies which include the close monitoring of overdue accounts. The school division does not have a significant exposure to any individual customer. Management reviews accounts receivable on a case by case basis to determine if a valuation allowance is necessary to reflect impairment in collectability. The aging of provincial grants and other accounts receivable at August 31, 2016 was:
Total Current 0-30 days 30-60 days 60-90 days Over 90 days
Grants Receivable 3,204,114$ 7,392$ -$ -$ -$ 3,196,722$ Other Receivables 100,590 2,805 - 97,785 - - Net Receivables 3,304,704$ 10,197$ -$ 97,785$ -$ 3,196,722$
August 31, 2016
ii) Liquidity Risk
Liquidity risk is the risk that the school division will not be able to meet its financial obligations as they come due. The school division manages liquidity risk by maintaining adequate cash balances and through its budget practices and monitoring. The following table sets out the contractual maturities of the school division’s financial liabilities:
Within 6 months
6 months to 1 year 1 to 5 years > 5 years
Accounts payable and accrued liabilities 2,219,272$ -$ -$ -$ Long-term debt (includes interest) 99,560 99,560 732,930 2,055,632 Total 2,318,832$ 99,560$ 732,930$ 2,055,632$
August 31, 2016

LLOYDMINSTER SCHOOL DIVISION NO. 99 NOTES TO THE FINANCIAL STATEMENTS
As at August 31, 2016 P a g e | 30
iii) Market Risk
The school division is exposed to market risks with respect to interest rates as follows: Interest Rate Risk
Interest rate risk is the risk that the fair value or future cash flows of a financial instrument will fluctuate because of changes in market interest rates. The school division’s interest rate exposure relates to cash and cash equivalents and portfolio investments. The school division also has an authorized bank line of credit of $2,600,000 with interest payable monthly at a rate of prime less 1.85%. Changes in the bank's prime rate can cause fluctuation in interest payments and cash flows. There was no balance outstanding on this credit facility as of August 31, 2016. The school division minimizes these risks by:
• holding cash in an account at a Canadian bank, denominated in Canadian currency,
• investing in GICs and term deposits for short terms at fixed interest rates, • managing cash flows to minimize utilization of its bank line of credit, • managing its interest rate risk on long-term debt through the exclusive use of
fixed rate terms for its long-term debt.