long-term bridge performance program: overview - utpraprev.enea.it/2015-11-02 maherali-enea...
TRANSCRIPT

A U.S. Department of Transportation University Transportation Center
Long-Term Bridge Performance Program: Overview ENEA
November 2, 2015
Ali Maher, Ph.D.

State of Good Repair in a complex, high-volume, multimodal corridor environment
Mission>>

The Roadway Network >>
U.S. Roadways Transportation
Infrastructure System
4.1 trillion passenger miles driven per year
Steady increase in travel demands 1977–2011
± 600,000 highway bridges
Carries $8 trillion worth of goods per year (≈60% of U.S. GDP)
3.9 million miles of roadway

Multimodal SGR >>

Reduction of Life Cycle Cost Advanced condition monitoring systems
Data-driven decision support tools
Dynamic asset management
Improving Resiliency Mitigate against natural and man made hazards
Incorporate climate change effects
Safety
Framework for Research>>

CAIT’s National Network of Laboratories >>

CAIT’s Key International Partnerships >>

LTBP Overview
Research Approach & Bridge Selection

Aging bridge population
Funding limitations
Growing traffic and load demands
Eliminating deficient bridges
Performance poorly understood
Lack of data-driven decision-making tools
Stewardship & Management Challenges >>

The LTBP program will serve as the national platform for strategic long-term investigation of in-service bridge performance…
To improve bridge health and performance for more effective stewardship and management
Standardizing and enhancing inspection techniques and criteria
Enhancing design, construction, preservation and operation practices from data-driven tools
Program Objectives >>

Research Approach >>
Define Bridge Performance
Determine high priority performance
related issues
Design of Experiment
Identify bridges for data collection;
Reference cluster concept
Data Analysis
Portal Platform
Verify Data Collection Protocols
Pilot Program

Bridge Performance: Study Topics >>
CATEGORY ISSUE Decks Untreated Concrete Bridge Decks
Decks Bridge Deck Treatments
Joints Bridge Deck Joints
Steel Bridges Coatings for Steel Superstructure Elements
Foundations Reinforced Concrete Substructures Deterioration
Concrete Bridges Reinforced Concrete Superstructure Deterioration
New Bridges Innovative Bridge Designs & Materials (e.g. ABC, FRP)
Concrete Bridges Embedded Prestressing Wires and Tendons
Bearings Bridge Bearings
Decks Precast Concrete Deck Systems
Joints Integral Abutments and Jointless Structures

Bridge Performance: High-Priority Topics >>
CATEGORY ISSUE Decks Untreated Concrete Bridge Decks
Decks Treated Concrete Bridge Decks
Joints Bridge Deck Joints
Bearings Bridge Bearings
Steel Bridges Coatings for Steel Superstructure Elements
Concrete Bridges Prestressed Wire, Strands, and Tendons
Based on input from stakeholders and considering current resources of the program, the following key topics will initially be addressed:

Research Approach >>
Define Bridge Performance
Determine high priority performance
related issues
Design of Experiment
Identify bridges for data collection;
Reference cluster concept
Data Analysis
Portal Platform
Verify Data Collection Protocols
Pilot Program

Research Approach >>
Define Bridge Performance
Determine high priority performance
related issues
Design of Experiment
Identify bridges for data collection;
Reference cluster concept
Data Analysis
Portal Platform
Verify Data Collection Protocols
Pilot Program

Selection of Experimental Variables
Potential Experimental Variables (Available in either NBI or other comprehensive databases)
Attributes Inputs
Age
Max
imu
m
Span
Le
ngt
h
Bri
dge
Typ
e
Stat
e –
D
esig
n
Pra
ctic
es
De
ck
Tre
atm
en
ts
Clim
ate
AD
TT
Stat
e –
Win
ter
Mai
nte
nan
ce
Stat
e –
P
reve
nta
tive
M
ain
ten
ance
Feat
ure
In
ters
ect
ed
Air
bo
rne
A
gen
ts -
ch
lori
des
, su
fid
es, e
tc
Perf
orm
ance
Iss
ues
Performance of Untreated Decks P P P S - P P P P S S
Performance of Treated Decks P P P S P P P P P S S
Performance of Bearings P P P S - P - S - - -
Performance of Joints P P P S - S S S - - -
Performance of Steel Coatings P - - S - P - S P P P
Performance of PS Conc Girders P P - P - P P S P - -
P Potential primary influence
S Potential secondary influence
- Likely not influential or not applicable

Design of Experiment>> Experimental Variables Table 2 – Key Performance Questions Regarding Untreated Decks
Untreated Decks
Potential Experimental Variables
Age Live Load
Env. Str. Details Mat'l Const. Maint.
What influence do truck loads and
truck volumes have on long-term
deterioration of bridge decks?
V V C C C C C C
What are the influences of
environment (rain/snowfall, deicing,
marine environment, temperature
range) on rate of deterioration of
decks?
V C V C C C C C
What influences do structural
configuration (girder spacing, span
length, continuity, skew) have on
structural dynamics and initiation or
progression of deck cracking?
V C C V C C C C
What aspects of deck detailing and
construction (reinforcement
configuration, clear cover, materials,
stay-in-place forms, etc.) influence
deterioration rate of bridge decks?
V C C C V C C C
What tools are most efficient and
effective in early detection and in
accurate quantification of
deterioration (corrosion, cracking,
delamination, spalling) of bridge
decks?
NA NA NA NA NA NA NA NA
What aspects, aside from material
deterioration, affect bridge deck
performance and functional service
life?
V V V V V V V V
What tools are most efficient and
effective in determining the deviation
between what was designed and
specified and the actual constructed,
as-built condition of the bridge?
NA NA NA NA NA NA V NA

Size and diversity of the population
Funding – Can not address all performance issues
Coordination and logistics – mobilization and coordination with state agencies
Sample size
Combination of these issues has led to the concept of Reference & Cluster Approach
Identify Bridges for Data Collection: Challenges >>

Recommended Clusters >>

Recommended Corridors >>

Reference Bridge and Supporting Cluster >>
Visual Inspection Non-standard Arms length Segmental Conventional Tools
Comparison: Reference vs. Cluster Influences of Inputs: Traffic Influences of Attributes: Materials, Protective Systems, Structural Form/Complexity, etc. Establish typical levels of variability
Reference bridge Cluster bridges
Targeted Technology Cursory NDE Short-term response monitoring Ambient vibration
Approximate Scale: 30 mi

Reference Bridge >>
Visual Inspection Non-standard Arms length Segment-based Conventional Tools
Materials Testing Material Sampling
Stiffness, Strength, Porosity Chloride Content
Global Testing Load Testing Modal Testing Continuous Monitoring
NDE Impact Echo GPR Ultrasonic Seismic Resistivity
Approximate Scale: 200 ft

Research Approach >>
Define Bridge Performance
Determine high priority performance
related issues
Identify bridges for data collection;
Reference cluster concept
Data Analysis
Portal Platform
Verify Data Collection Protocols
Pilot Program

Long Term Bridge Performance Program (LTBP) Bridge Portal

Q: What is the LTBP Bridge Portal ? – A centralized, national-level repository for efficiently and
quickly accessing and querying bridge performance-related data and information
Combined With
– Data-driven deterioration modeling, GIS mapping, and other data and statistical data analysis tools
Long Term Bridge Performance Program (LTBP) Bridge Portal

Q: What are some of the Benefits LTBP Bridge Portal ?
Long Term Bridge Performance Program (LTBP) Bridge Portal
- User Friendly, no manual needed
- Visualize the data on the map
- Generate charts/reports quickly
- View/Interpret historical data
– Combines bridge infrastructure data sources into centralized data repository for analysis, interpretation, and data-driven predictive modeling
– Provides storage of and access to LTBP Program data\research
– Provides a greater understanding of bridge performance

NBI & Element
Level (V1)
Traffic & Truck Data
(V2)
LTBP Bridge Portal
Data-Driven Tool
LTBP Field Data (V1)
Basic Deterioration Model
Advanced Data & Statistical Analysis
Bridge Performance Assessment
Life Cycle Model
GIS Mapping & Visualization
Long Term Bridge Performance Program (LTBP) Bridge Portal
Maintenance & Preservation (FD)
Weather Data (FD)
Inspection Data (V2)
Bridge Timelines (materials & design)
Data-Driven Deterioration Model
Mobile Apps
(V1) Version 1 (September 2015)
(V2) Version 2 (Expected 2017)
(FD) Future Development
Tools for Asset Management
NDE Web Manual Link
Custom Reporting & Data Extraction
3-D Visualization
Combines bridge infrastructure data sources into centralized data repository for analysis, interpretation, and Data- Driven predictive modeling
Data Visualization capabilities
User Friendly, no manual needed
BENEFITS
(V1)
(V2)
(FD)

Long Term Bridge Performance Program (LTBP) Bridge Portal Prestressed Multi-Girder Bridges – Deck Condition of Bridges Shown by Color
Bridge Query Summary Report
Charting Capabilities
(Example: Distribution of Bridges by State)
GIS Map Visualization Capabilities
(Example: Bridge Deck Condition State)

Long Term Bridge Performance Program (LTBP) Bridge Portal Prestressed Multi-Girder Bridges (I-95 Corridor) – Deck Condition of Bridges Shown by Color
GIS Map Visualization Capabilities
(Example: Bridge Deck Condition State – I-95 Corridor Only)

Long Term Bridge Performance Program (LTBP) Bridge Portal Prestressed Multi-Girder Bridges (I-95 Corridor) – Query Results Summary Report
Bridge Query Summary Report
With a simple click the Portal
can provide an overall
statistical summary of the
query results almost
instantaneously.
• # bridges
• # sq ft deck
• Average Age
• ADT/ADTT
• # postings
• # Scour Critical
• Condition States
• Comparisons

Long Term Bridge Performance Program (LTBP) Bridge Portal
To learn more about the LTBP Bridge Portal please contact: Dr. Robert Zobel,
HRDI-60 LTBP Program Coordinator (202) 493-3024 or [email protected]

Traditional Deterioration Learning Approach
Determine Deterioration Model
Specification
Estimate Model Suitability with Data
Data (to drive learning)
• Inherently assume that the chosen model specification best
describes deterioration. → Problematic
• Only very poor fit would motivate new choice of model
specifications. → Compromised Accuracy
• Only one model specification can be considered every time. →
Inability to Incorporate Different Opinions
ISSUE: Data should determine model specification, not
subjective judgments
Ideally…
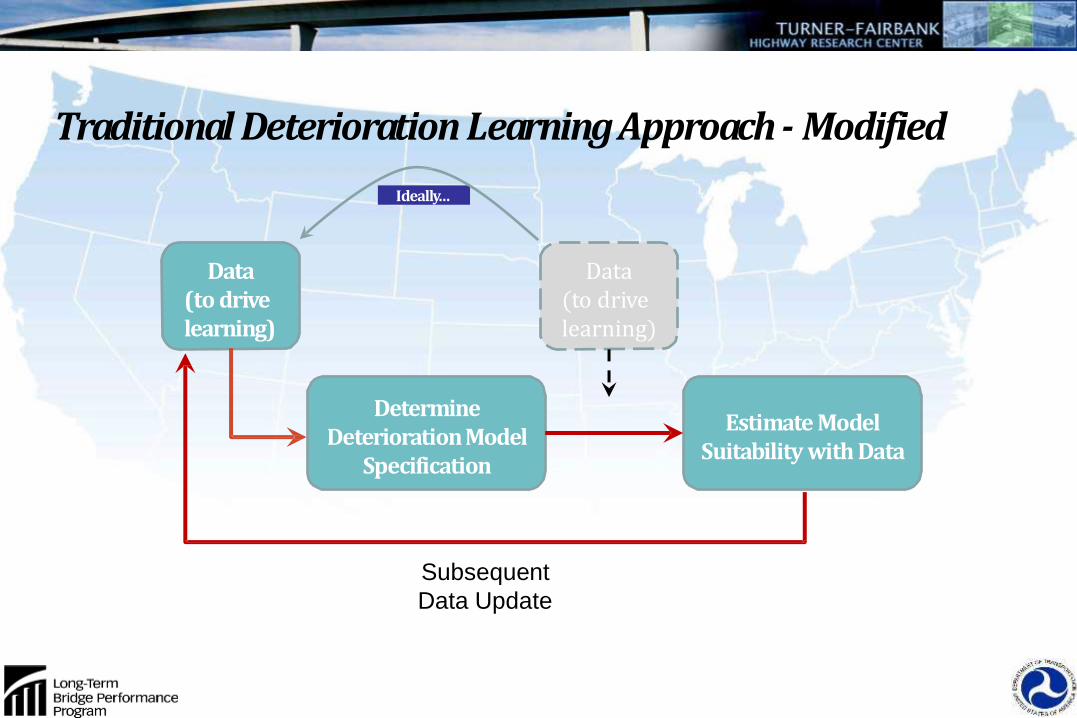
Traditional Deterioration Learning Approach - Modified
Determine Deterioration Model
Specification
Estimate Model Suitability with Data
Data (to drive learning)
Data (to drive learning)
Subsequent
Data Update

LTBP Data-Driven Deterioration Modeling Methodology (D3M2)
A modified approach to “learning”

Research Approach >>
Define Bridge Performance
Determine high priority performance
related issues
Identify bridges for data collection;
Reference cluster concept
Data Analysis
Portal Platform
Verify Data Collection Protocols
Pilot Program

RITA Transportation Innovation Series LTBP Overview
Pilot Program 2008-2011

Validate Draft Protocols and Procedures for:
Data Collection
Data Housing and Analysis (Bridge Portal)
QA/QC
Field Coordination
Refine & Streamline Testing Methodologies
Collect Early and Useful Data
Pilot Study Objectives >>

LTBP Pilot Bridges >>

Pilot States & Bridge Types >>
Simple span steel stringer
New Jersey
Continuous steel stringer
Virginia
Simple span pre-stressed concrete stringer
Utah
2-span prestressed post-tensioned continuous CIP box girder
California
Steel deck truss
Minnesota
Two simple spans of adjacent concrete box beams
New York
Precast, segmental post-tensioned concrete box beams
Florida

Well defined protocols and conventions, supported by quality control tools, are needed to ensure repeatability and reliability of data collected
NDE technology is a valuable tool for characterization and monitoring of deck deterioration
Good correlation between NDE surveys and physical testing
Increasing speed of NDE data collection will be essential as the LTBP Program moves into the next phase
Pilot Study: Lessons Learned >>
Pilot Study Virginia Bridge
LTBP Overview
NDE/NDT Evaluation

• About 600,000 bridges in the U.S. are of an average age of almost 45 years.
• Concrete decks, due to their higher exposure, deteriorate faster than other bridge components.
• Between 50 and 85% of bridge maintenance funds are spent to repair or replace portions of the Nation’s 2.8 billion square feet of bridge decks.
• Conservative estimate is that more than $5B is spent
annually to maintain, repair and replace bridge decks.
Importance of Condition of Bridge Decks

Reinforced Concrete Deterioration Types of Primary Interest
Corrosion Delamination Concrete Degradation

Deck Evaluation - State of Practice

Bride Deck Evaluation – State of the Art
Resistivity
GPR
Seismic/Ultrasonic
GPR Ultrasonics
Impact Echo
Half-Cell
Ultrasonics and
Impact Echo

Deck Condition Assessment Vs. NDE Method
Rebar Corrosion Delamination Spalling
GPR
Impact Echo
Chain Drag/Hammer Sounding
Visual Inspection
Bridge Deck Condition
Time
Half-Cell Potential
Ultrasonic Echo
IR Thermography
Electrical Resistivity

Comparison of Electrical Resistivity Results September 2009 and August 2011
Corrosive Environment from Electrical Resistivity (kOhm-cm)
2009 Testing
2011 Testing

Depth-Corrected GPR Condition Map
Signal Attenuation (Normalized dB) as Condition Indicator
010
20
30
La
tera
l Dis
tan
ce (
ft)
0 20 40 60 80 100 120 140 160 180 200 220 240 260 280
Longitudinal Distance (ft)
010
20
30
La
tera
l Dis
tan
ce (
ft)
0 20 40 60 80 100 120 140 160 180 200 220 240 260 280
Longitudinal Distance (ft)
0.5 1 1.5 2 2.5 3 3.5 4 4.5 5
Approximate Rebar Depth (GPR)
Concrete Cover Thickness (in)
-43 -33 -23 -21 -19 -17 -15 -13 -11 -9 -7
FAIRSERIOUS POOR GOOD
Comparison of GPR Assessments September 2009 and August 2011
Depth Corrected GPR Condition Maps
2009 Testing
2011 Testing

NDT Condition Assessment 2009 2011 2014
Active Corrosion 39.4 28.1 25.8
Delamination Assessment 70.0 57.2 39.8
Concrete Degradation 48.1 35.3 26.4
Combined NDT Rating 52.5 40.2 30.6
NBI Rating (Visual) 6 6 6
Condition rating on a scale 0 (worst) to 100 (best).
Comparison of 2009, 2011 and 2014 Condition Ratings of the Virginia Bridge
Example: Delamination rating = (% of sound area X 100 + % of area with initial delamination X 50 + % of area with severe delamination X 0)/100

Approximate Deterioration Curves for Haymarket Bridge

NDE Data Collection
Impact Echo
Electrical
Resistivity
Moisture
Scan
USW
GPR
Half-Cell
Potential

RABIT Components

Robotic Assisted Bridge Inspection Tool (RABIT) Joint CAIT&FHWA Development

3D Visualization of Deterioration

Impact Echo Data Superimposed on LiDAR Image

Thank You! Winner of 2013 ASCE Charles Pankow Award for
Innovation &
USDOT Secretary Award

Nondestructive Rehabilitation System (NRS)

STATE OF THE ART BRIDGE CAPACITY ESTIMATION

Rapid Load Testing and Rating of Large
Populations of Bridges
Step 1 Rapid modal impact testing using a self-contained mobile device
Step 2
Semi-Automated pre- and post-processing to obtain global frequencies and mode shapes
Step 3
Automated FE modeling using NBI data and on-site assessment
Step 4
Automated FE model calibration and load rating
Step 5
Reporting

Comparison with Best Practices Approach
Mode 1: 13.18 Hz Mode 2: 20.31 Hz Mode 3: 40.92 Hz Mode 4: 50.78 Hz
Mode 1: 13.51 Hz Mode 2: 20.47 Hz Mode 3: 39.46 Hz Mode 4: 49.65 Hz
MIMO Impact Testing
Rapid Impact Testing

Comparison with Current Structural Testing Approaches
Technology/
Approach Cost
Prep.
Time
Testing
Time
Report
Time
Access
Equip
Bridge
Closure
Overall
Quality
Quasi-S
tatic
Ambient
monitoring w/
displacement
transducers
$30-
50K
5-10
days 2-5 day 3-5 days Yes
Only
under-
side
Mod
Load testing w/
displacement
transducers
$30-
50K
5-10
days 1 day 3-5 days Yes
Partial
2 hrs High
Dynam
ic
Ambient
vibration
monitoring
$20-
30K 5-7 days 2-5 days 5-7 days Yes
Only
under-
side
Mod
MIMO Impact
Testing
$40-
60K 5-7 days 1 day
5- 7
days Yes
Partial
2 hrs
High/
Mod
Rapid Load
Testing System Low N.A. 1-3 hrs 1-2 hrs No
Slow
downs Mod

Rapid Evaluation of Bridge Load Capacity (THMPR) – Collaboration with TFHRC, FHWA

Truck fire under bridge
Owner to close a lane to traffic
Resulted in major traffic headache for commuters
Rapid Load Testing of I-195 Bridge over the NJ Turnpike New Jersey, USA

Drones in Bridge Condition Monitoring – Collaboration with TFHRC-FHWA

3 sets of
Strain
Rosettes
inside the
box girder
Typical FBG
Tilt Meter
Typical FBG
strain
Rosettes
Typical FBG
accelerometer
(blue)
Remote FBG Data Acquisition
System
CAIT-Rutgers

Energy Harvesting – FHWA Collaboration

A U.S. Department of Transportation University Transportation Center
Bridge Evaluation and Accelerated
Structural Testing Lab
August 12, 2015

BEAST: Mission >>
For the first time, will allow the scientific study of deterioration processes on full-scale bridge decks in a rapidly compressed time. The lines of innovation:
Calibrate field data with BEAST data to estimate/forecast remaining service life for much larger population of bridges
Develop reliable deck deterioration models
Evaluation of numerous technologies, materials and components
Validating new technologies being developed to augment bridge deck inspection

BEAST: Technical Specifications>>
Specification Bridge Deck Tester
Bridge Specimen Size 50-ft span by up to 28-ft wide
Specimen Superstructure Depth Up to 60 inches above floor
Overall Length (ft) Approximately 125 feet
Overall Weight (lb) 120,000 lb
Max Normal Load (lb) Normal 60,000
Min Normal Load (lb) Normal 10,000
Trafficking Speed (mph) 0 to 20
Primary Drive System Electric winch
Drive System Power (hp) 400 HP
Axle Size Two Full 30,000 lb capacity each
Portability Lateral movement provided between loading cycles
Bi-directional Loading Yes
Electrical Power 3 Phase 480 Volt

Testing Capabilities: Bridge Systems, Components & Materials >>
Concrete Any concrete bridge deck mix design, corrosion inhibitors, supplemental cementing materials, and additives
Decking Systems Open, filled, partially-filled or unfilled grid decks such as exodermic bridge deck systems; orthotropic or other metal deck systems; prefabricated deck systems; precast slabs; and others
Rebar Steel, epoxy coated, galvanized, stainless steel, steel clad, glass and carbon fiber polymer, etc.
Prestressing & Post-tensioning Strands
Bar, wire, strands, couplers, anchorages, ducts, and other components
Coatings & Sealants Latex-modified concrete, joint sealants, epoxy waterproofing seal coating, etc.
Superstructure Frames Structural steel, reinforced concrete, precast concrete, prestressed concrete, and timber
Joints Preformed joint filler, elastomeric joint assemblies, strip seal expansion dams, modular bridge joint systems, longitudinal joints, shear locks, and others
Bearings Bearing pads, reinforced elastomeric bearing assemblies, high-load multi-rotational bearing assemblies, and others
Deck Drainage Scuppers, inlets, downspouts, grates, and other drainage elements
Safety Devices Striping paint, pavement reflectors, auditory safety devices (e.g., Bott's dots, rumble strips, etc.), ITS devices and sensors, traffic cams, signage materials, and more

BEAST: Superstructure Plan and Select Details >>
Flexible Specimen Envelope: Up to a 5-ft superstructure depth Multiple girder options
Steel, concrete Spacing Shapes (I, Box, Tees) Various framing details
Deck joint systems Bearing assemblies

Site Location – Livingston Campus >>
Access to major routes: Route I-95 – 6.5 miles Route I-287 – 5.5 miles NJ Route 18 - 2 miles NJ Route 1 - 5 miles

The BEAST in Action!>>

BEAST: Rolling @ 20 mph >>

BEAST: Brine Spray >>

BEAST: Walkthrough >>

BEAST: Walkthrough >>

International Bridge Study (IBS)
International collaborative study of a bridge in New Jersey to demonstrate and document best practices and technology selection for bridge health assessment and monitoring.

Industry, government, and academic teams from Austria, Canada, China, Great Britain, Japan, Korea, Switzerland, and the United States participated.
International Bridge Study (IBS)

IBS: Potential Future Expansion & T2
Contribute curriculum and fieldwork to educate current and future DOT/FHWA workforce, bridge inspectors, practicing engineers, and technology providers
Test bed for validation of new/emerging technologies
Create field calibration QA/QC “hubs” for inspectors and technology providers
Advance technology applications to diagnosis and prognosis of bridge-specific concerns
Leverage technology more effectively by establishing proper integration and application standards for common bridge types and performance issues

China • Southeast University
European Union • Sheffield University (United Kingdom) • Vienna Consulting Engineers (Austria) • École Polytechnique Fédérale de Lausanne (Switzerland)
Japan • University of Tokyo • Central Nippon Expressway Co. (NEXCO-W) • Keisoku Research Consultant
South Korea • KAIST • Seoul National University • INHA University • Pyunghwa Engineering Consultants • Korea Expressway Corporation • SEJONG University
United States • Rutgers CAIT • Intelligent Infrastructure Solutions • Drexel University • Princeton University • Utah State University • University of New Hampshire • Western Michigan University
IBS International Collaborators
• Georgia Tech • Inspecttech • Parsons Brinckerhoff • Pennoni Associates • Olsen Engineering • Smart Structures

Thank You!
• Questions? >>
cait.rutgers.edu

Thank you!
Keep in Touch with CAIT >>