magic quadrants 1. research processes behind methodologies 2 qualitative insight research...
TRANSCRIPT
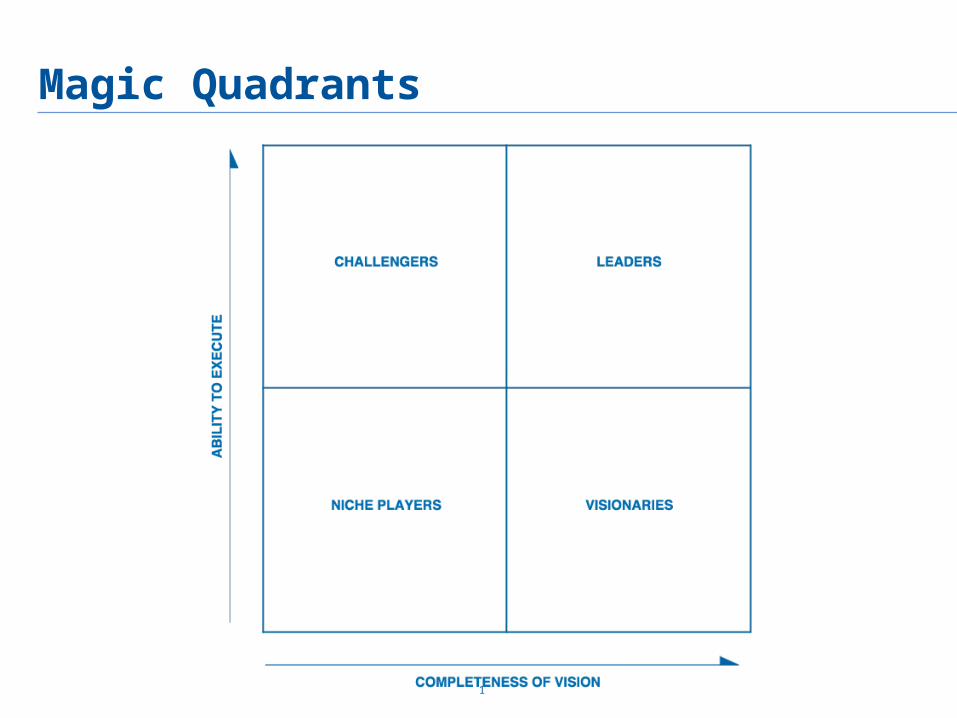
Magic Quadrants
1
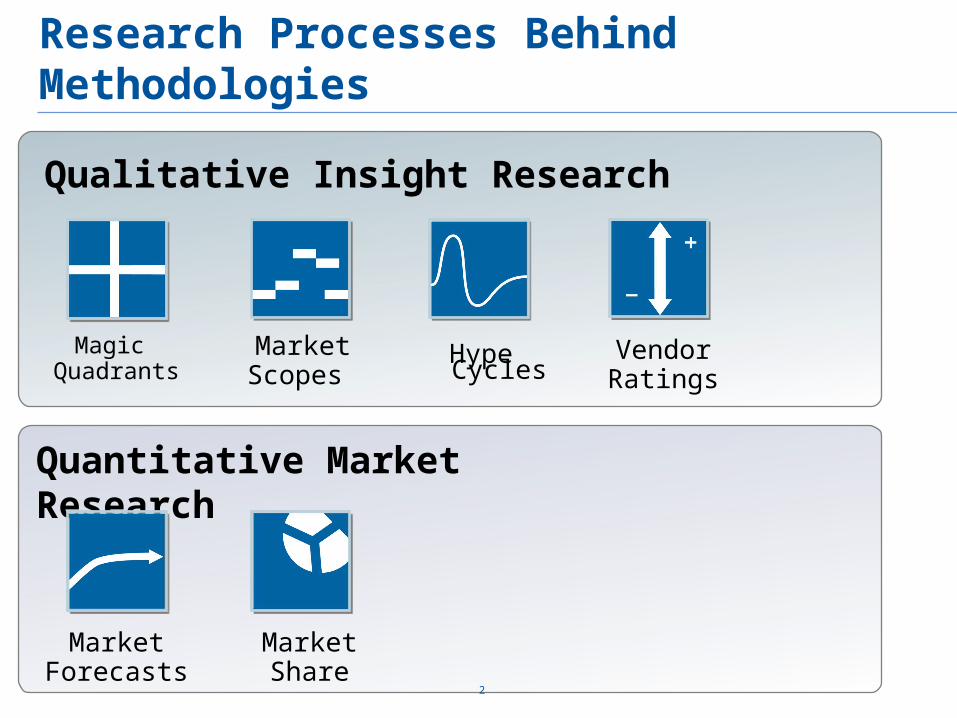
Research Processes Behind Methodologies
2
Qualitative Insight Research
Quantitative Market Research
Magic Quadrants
MarketScopes
Hype Cycles VendorRatings
MarketForecasts
MarketShare
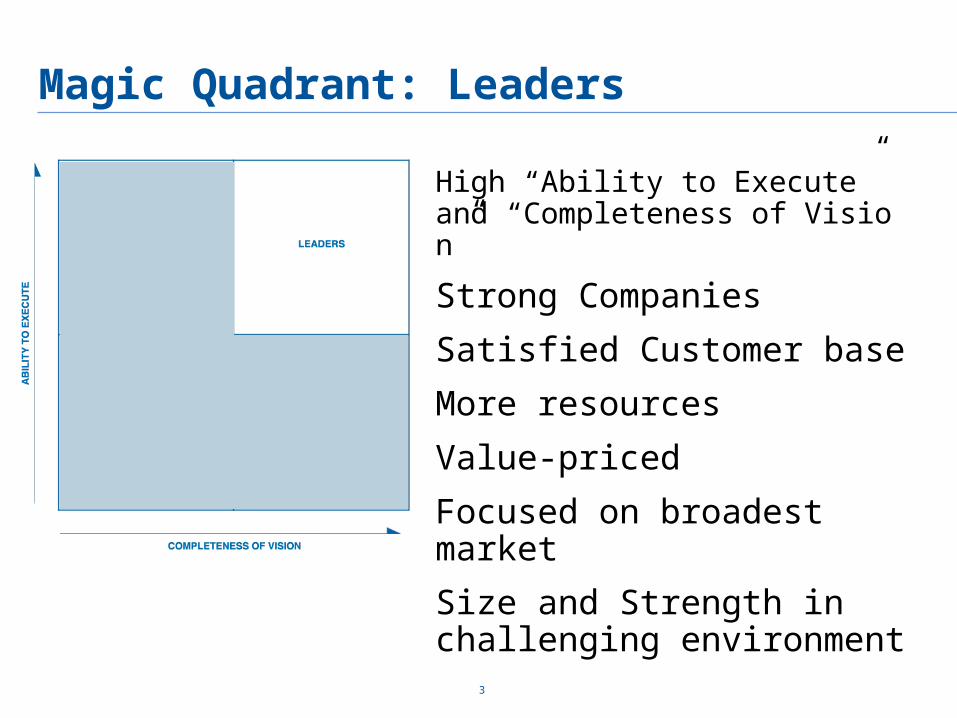
Magic Quadrant: Leaders
High “Ability to Execute” and “Completeness of Vision”
Strong Companies
Satisfied Customer base
More resources
Value-priced
Focused on broadest market
Size and Strength in challenging environment
3
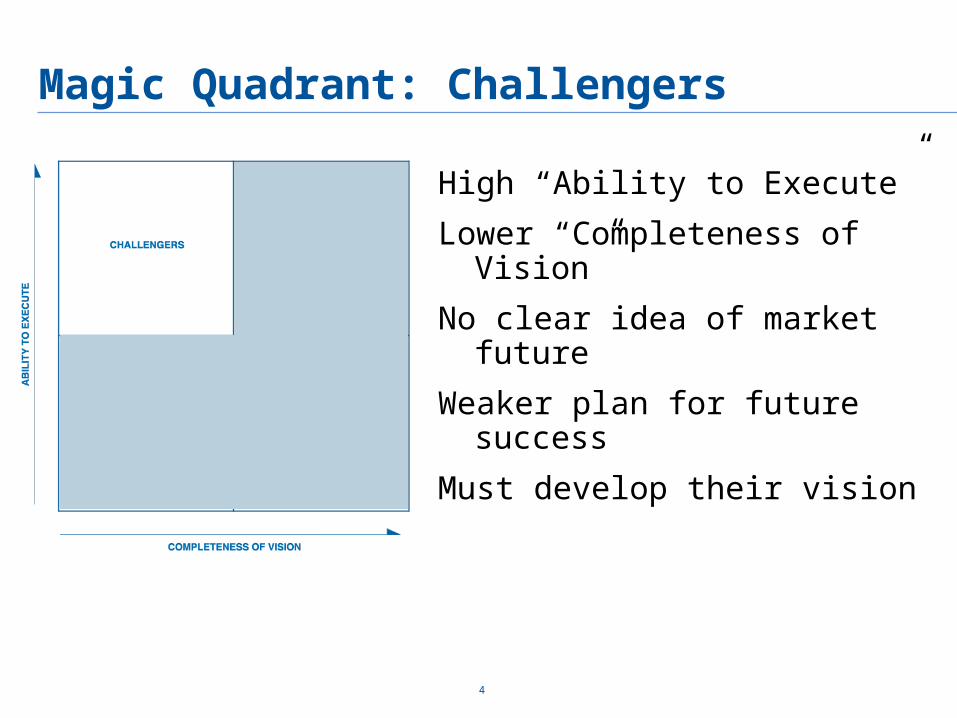
Magic Quadrant: Challengers
High “Ability to Execute”
Lower “Completeness of Vision”
No clear idea of market future
Weaker plan for future success
Must develop their vision
4
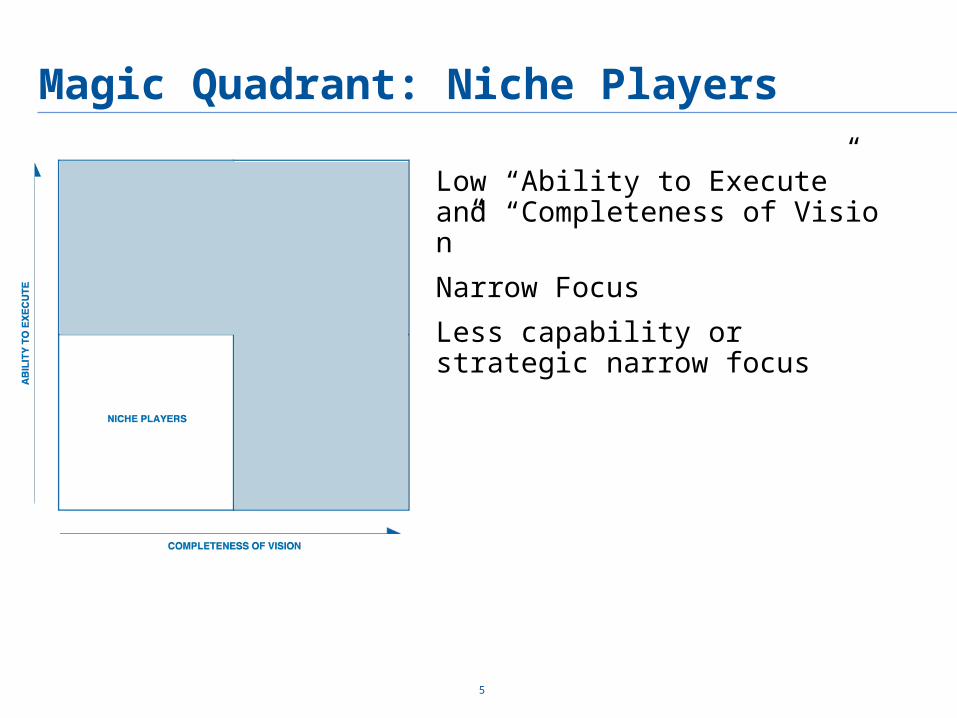
Magic Quadrant: Niche Players
Low “Ability to Execute” and “Completeness of Vision”
Narrow Focus
Less capability or strategic narrow focus
5
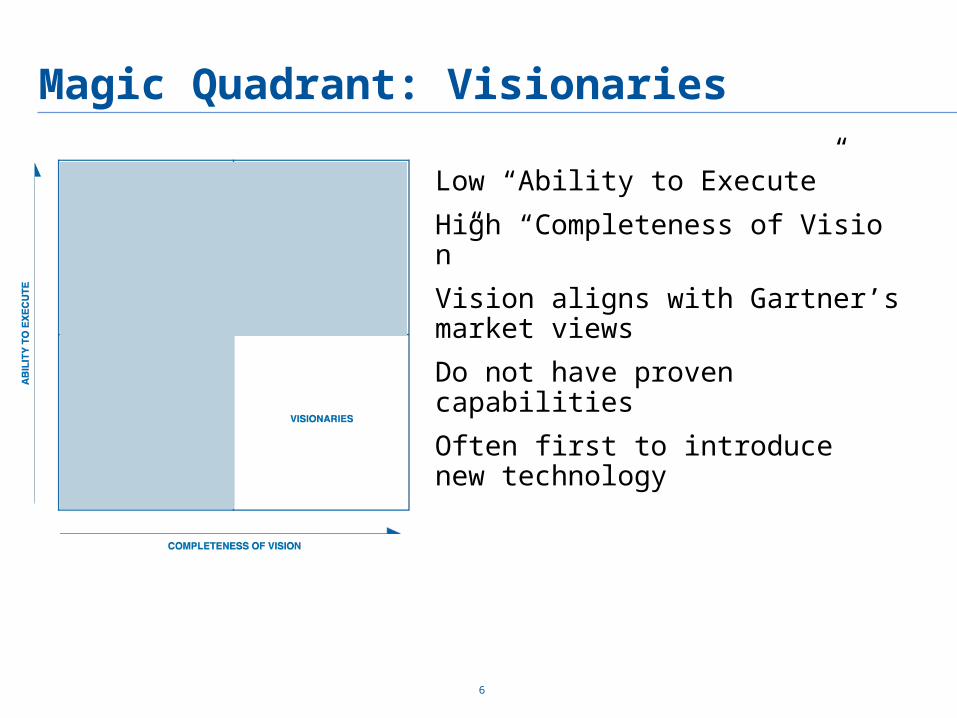
Magic Quadrant: Visionaries
Low “Ability to Execute”
High “Completeness of Vision”
Vision aligns with Gartner’s market views
Do not have proven capabilities
Often first to introduce new technology
6
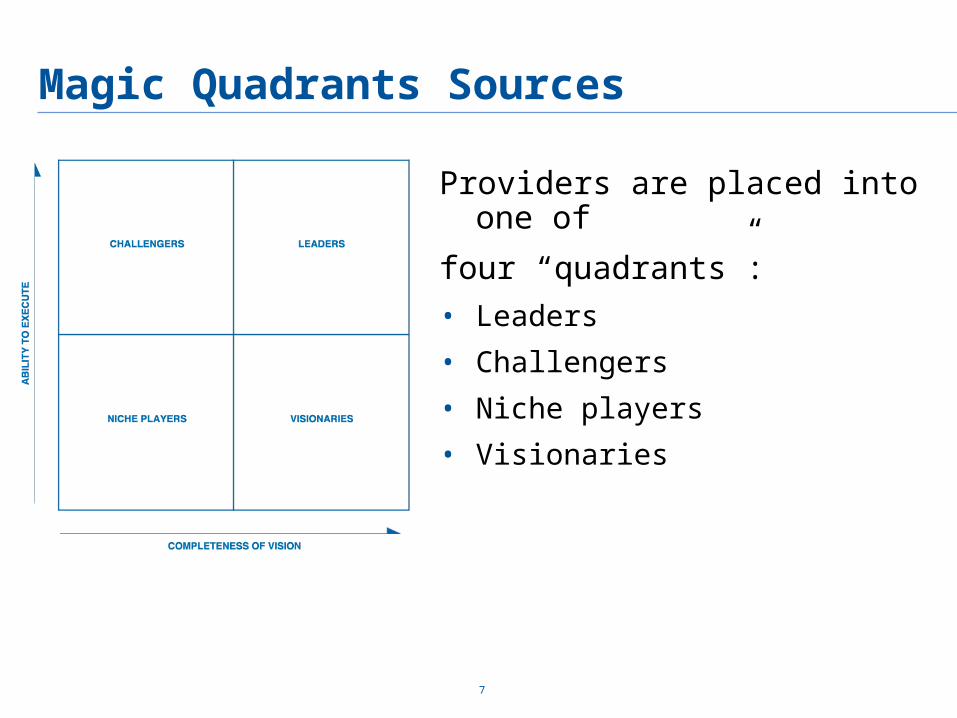
Magic Quadrants Sources
Providers are placed into one of
four “quadrants”:
• Leaders
• Challengers
• Niche players
• Visionaries
7
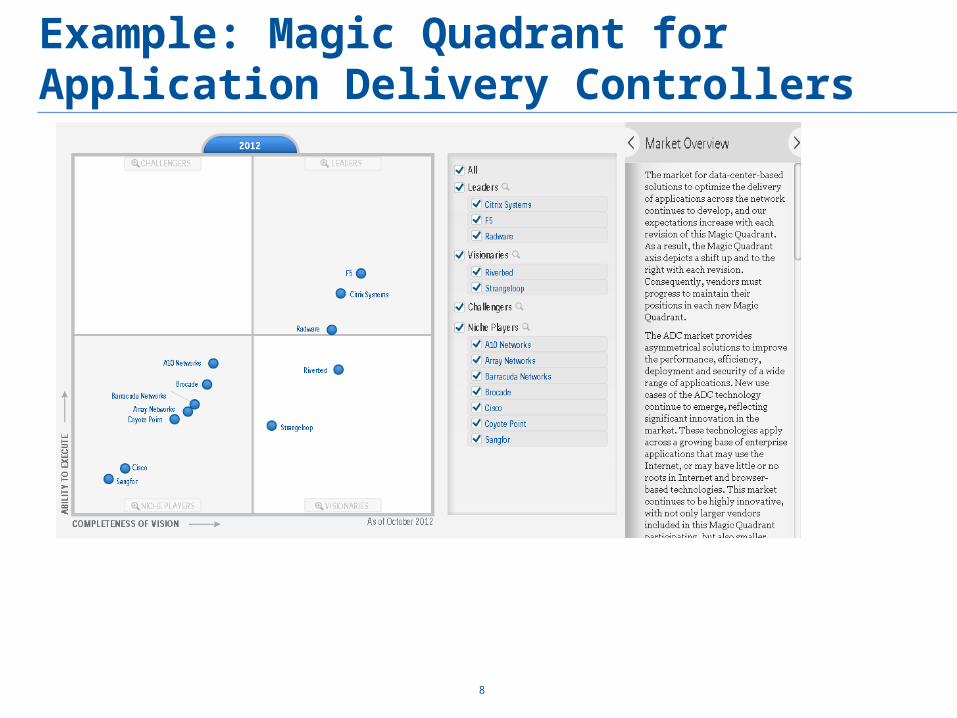
Example: Magic Quadrant for Application Delivery Controllers
8
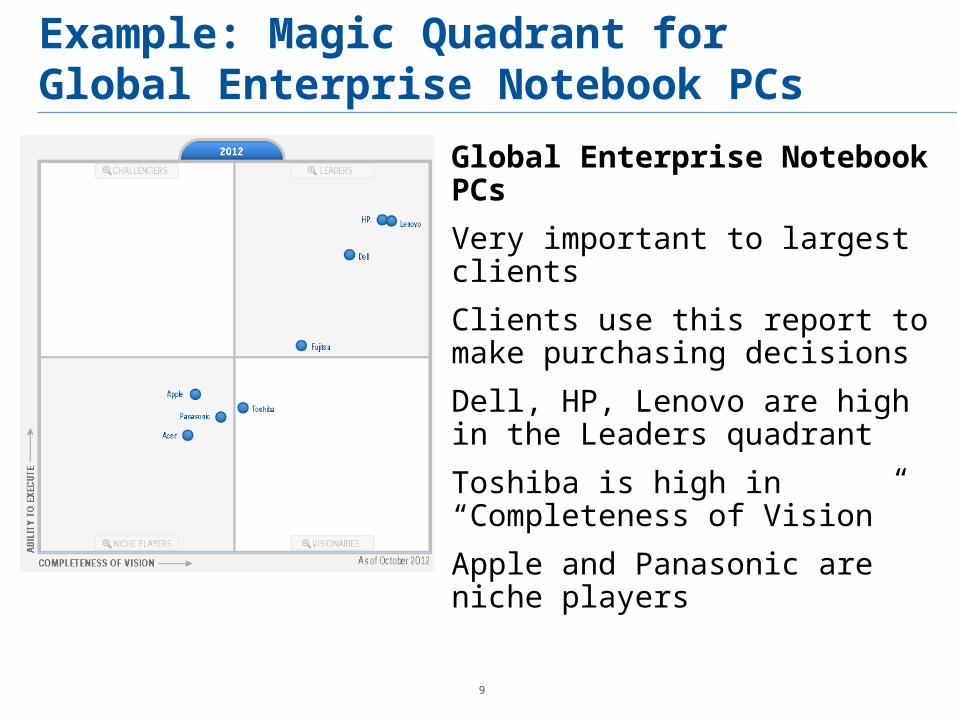
Example: Magic Quadrant for Global Enterprise Notebook PCs
Global Enterprise Notebook PCs
Very important to largest clients
Clients use this report to make purchasing decisions
Dell, HP, Lenovo are high in the Leaders quadrant
Toshiba is high in “Completeness of Vision”
Apple and Panasonic are niche players
9
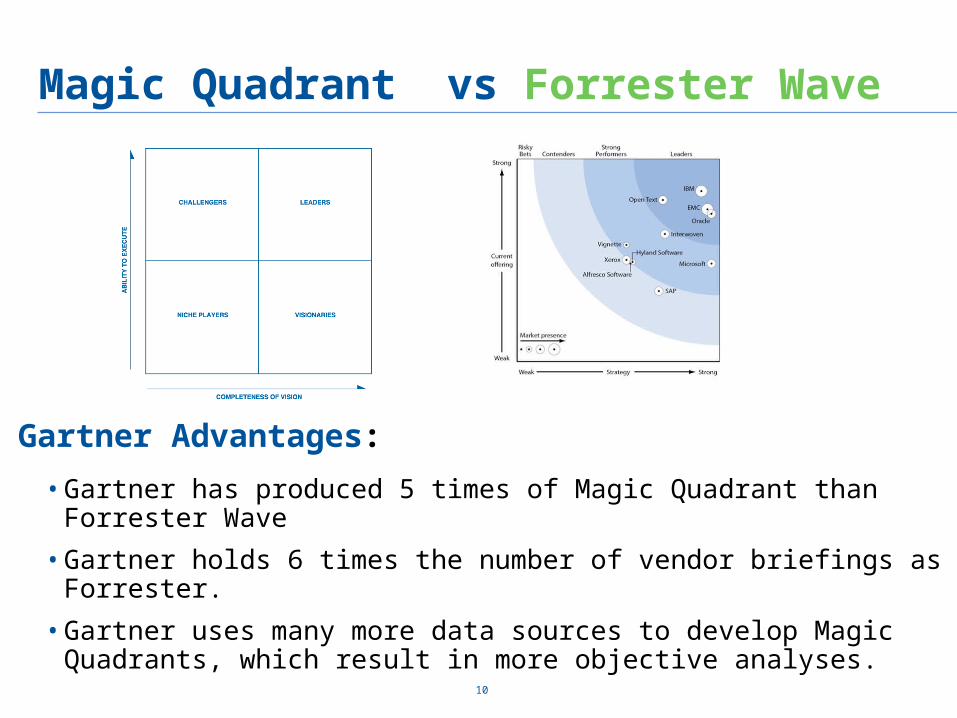
Magic Quadrant vs Forrester Wave
• Gartner has produced 5 times of Magic Quadrant than Forrester Wave
• Gartner holds 6 times the number of vendor briefings as Forrester.
• Gartner uses many more data sources to develop Magic Quadrants, which result in more objective analyses.
10
Gartner Advantages:
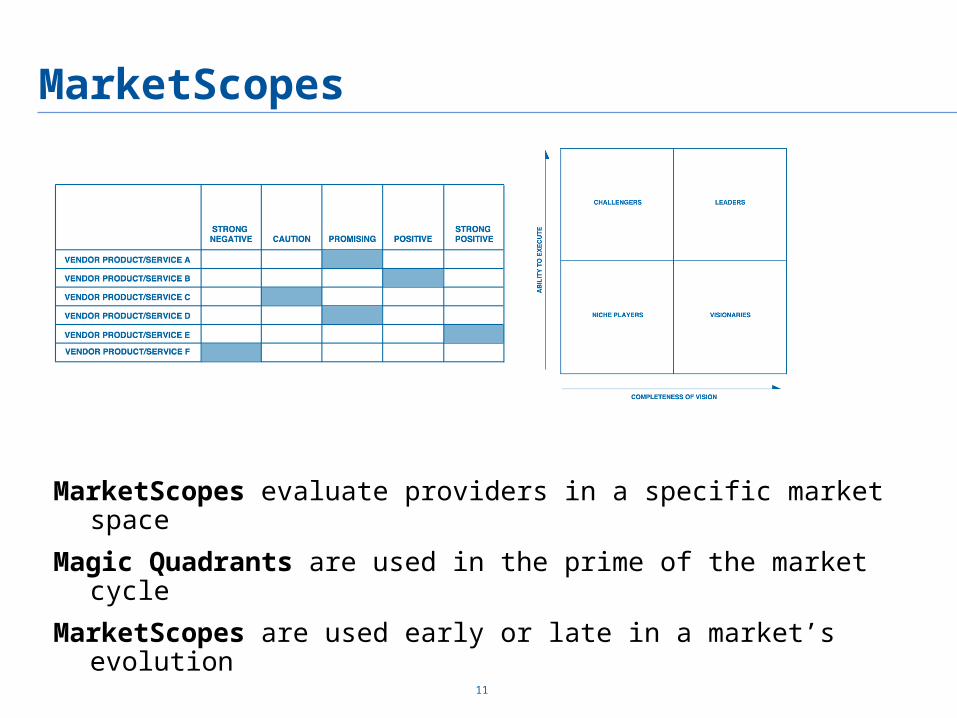
MarketScopes
MarketScopes evaluate providers in a specific market space
Magic Quadrants are used in the prime of the market cycle
MarketScopes are used early or late in a market’s evolution
11
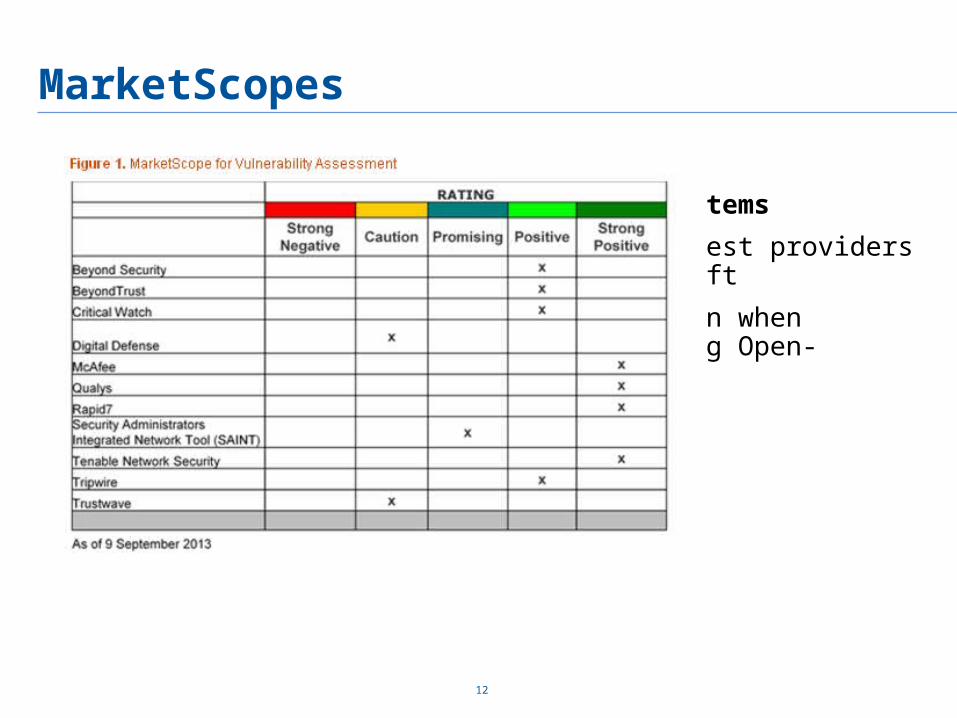
MarketScopes
E-mail Systems
The strongest providers is Microsoft
Use caution when considering Open-Xchange
12
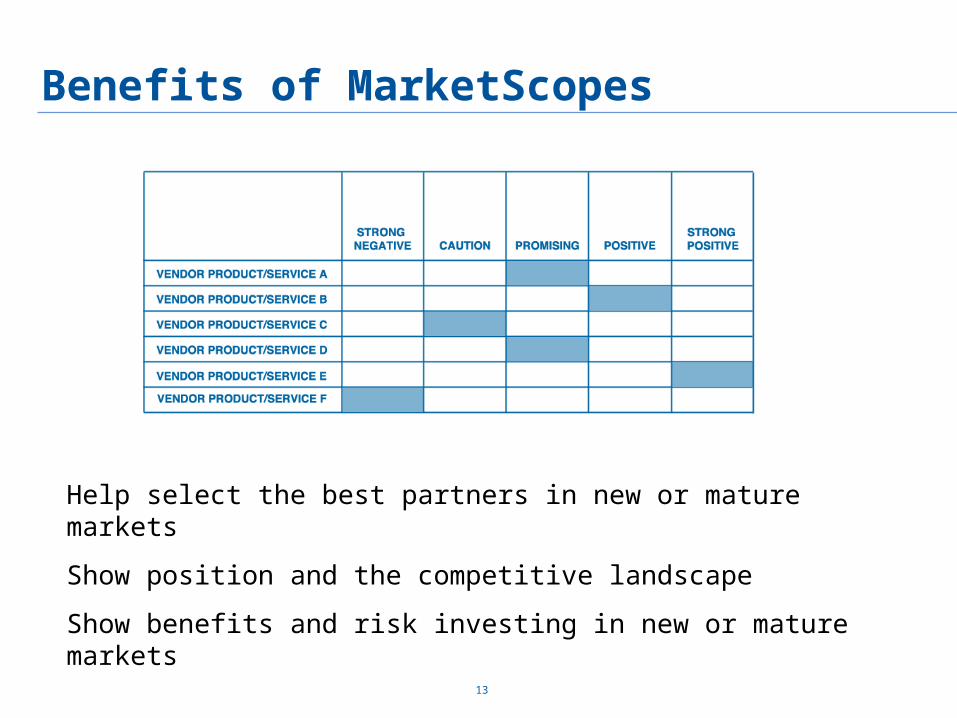
Benefits of MarketScopes
13
Help select the best partners in new or mature markets
Show position and the competitive landscape
Show benefits and risk investing in new or mature markets
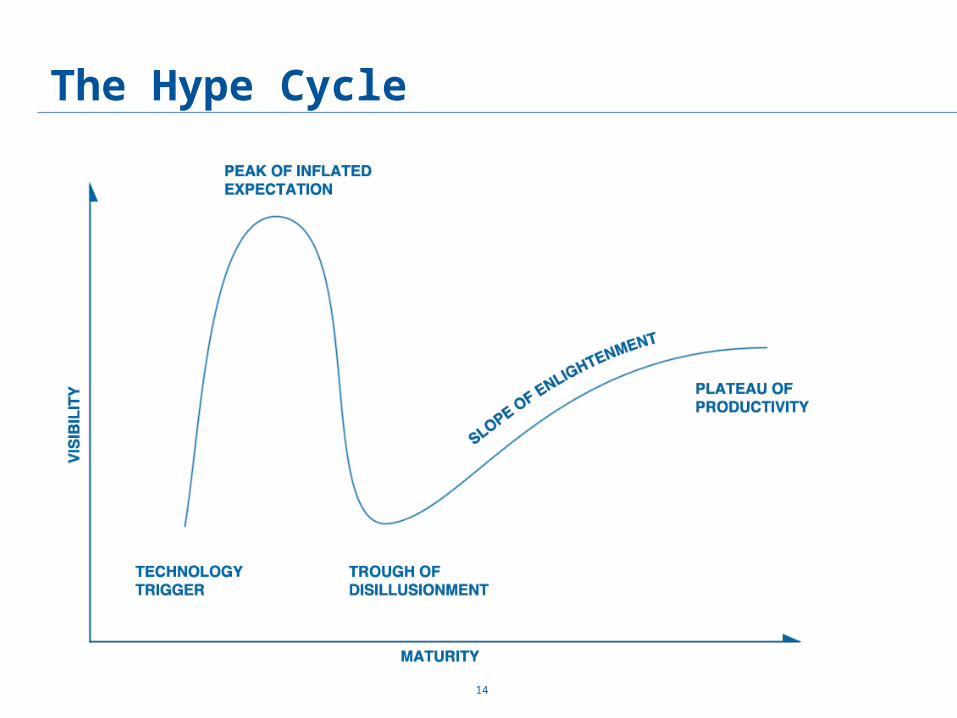
The Hype Cycle
14
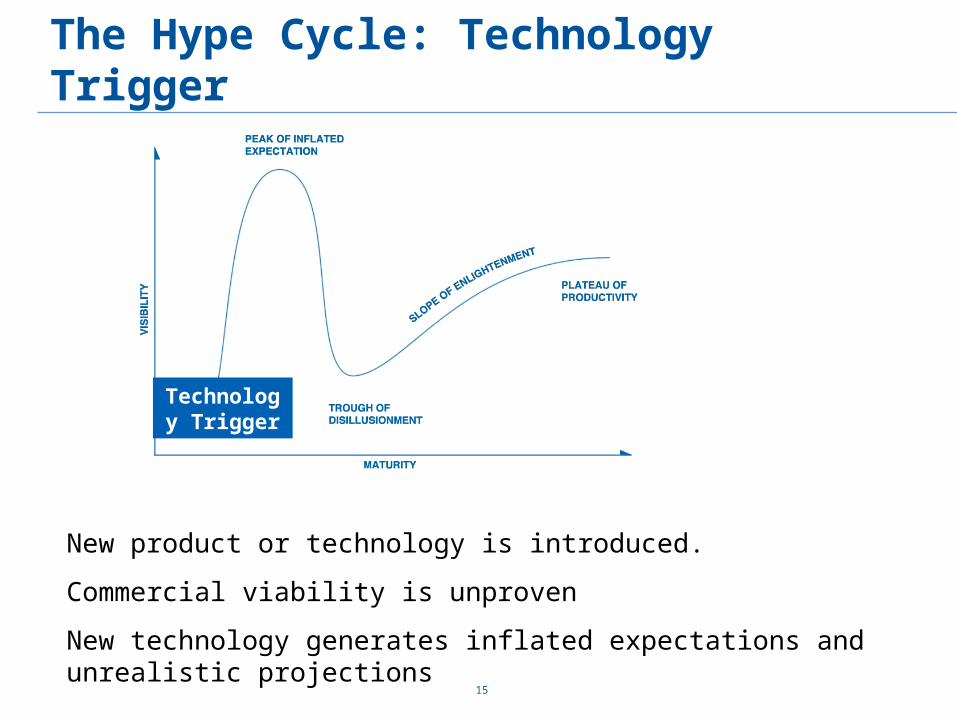
The Hype Cycle: Technology Trigger
15
Technology Trigger
New product or technology is introduced.
Commercial viability is unproven
New technology generates inflated expectations and unrealistic projections
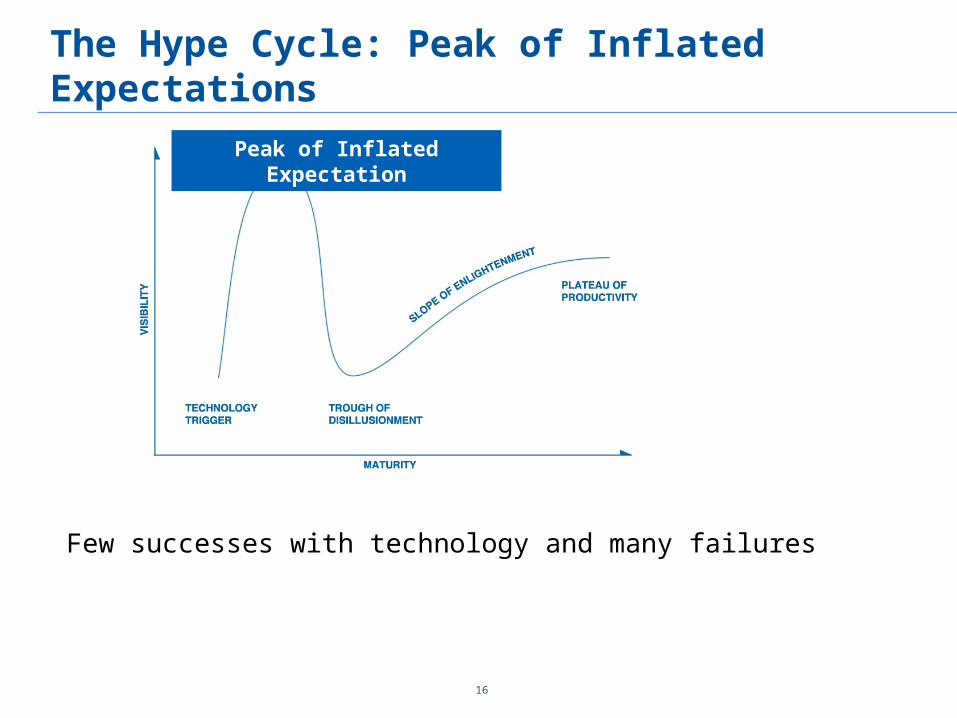
The Hype Cycle: Peak of Inflated Expectations
16
Peak of Inflated Expectation
Few successes with technology and many failures
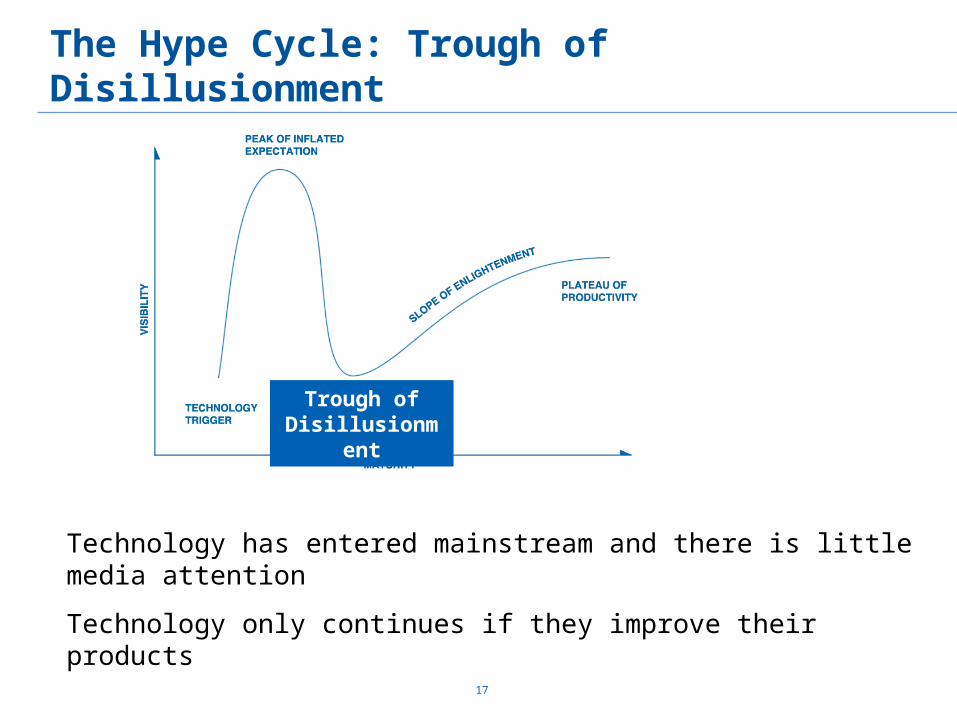
The Hype Cycle: Trough of Disillusionment
17
Trough of Disillusionment
Technology has entered mainstream and there is little media attention
Technology only continues if they improve their products
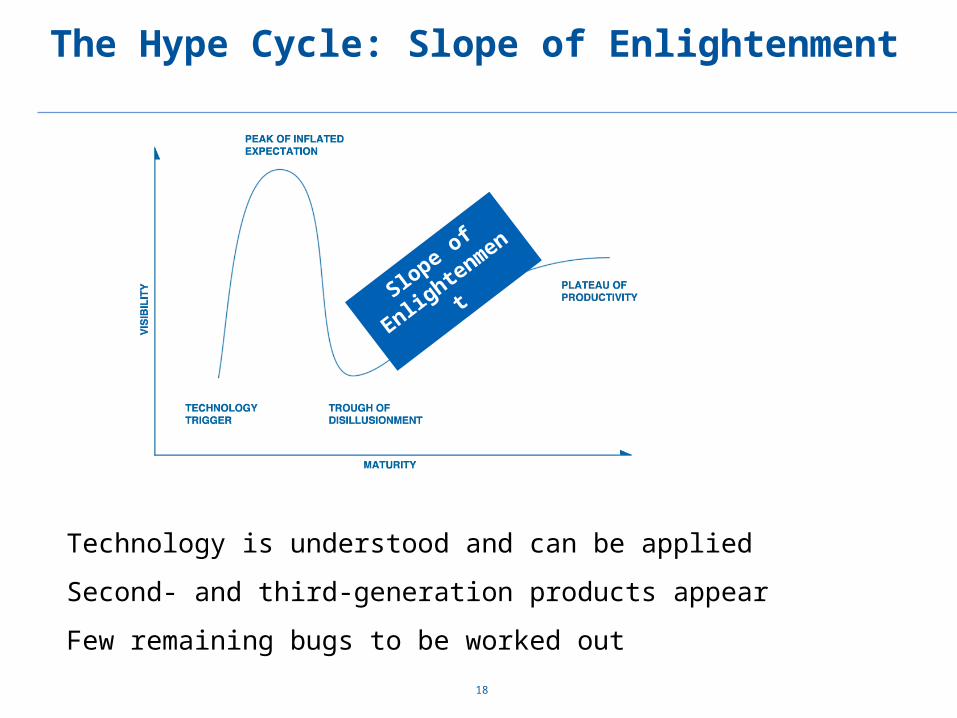
The Hype Cycle: Slope of Enlightenment
18
Slope of
Enlightenment
Technology is understood and can be applied
Second- and third-generation products appear
Few remaining bugs to be worked out
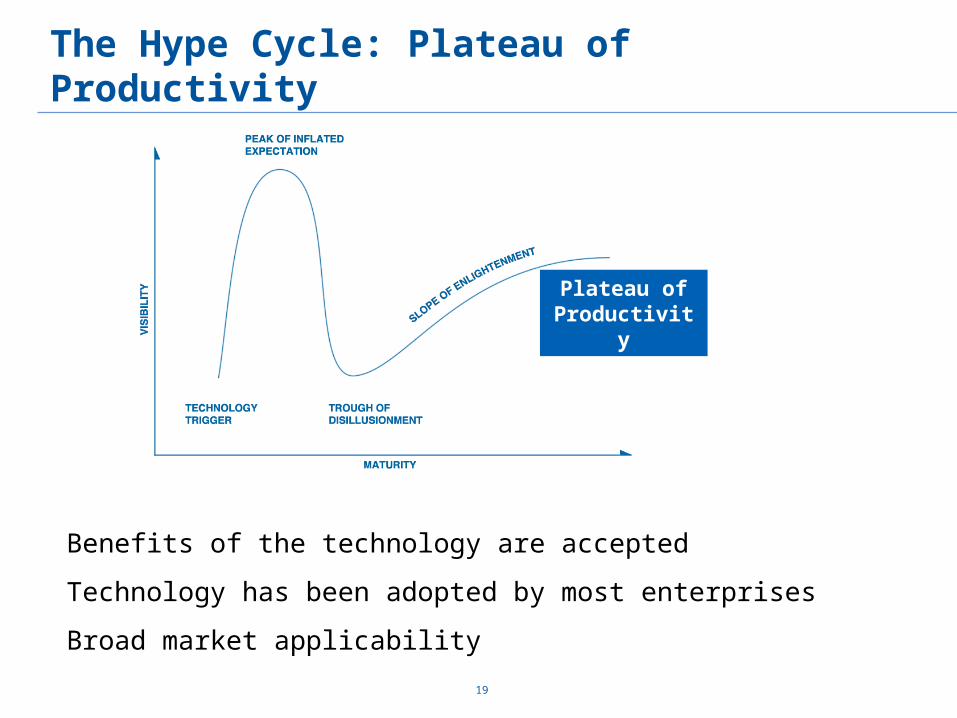
The Hype Cycle: Plateau of Productivity
19
Plateau of Productivity
Benefits of the technology are accepted
Technology has been adopted by most enterprises
Broad market applicability
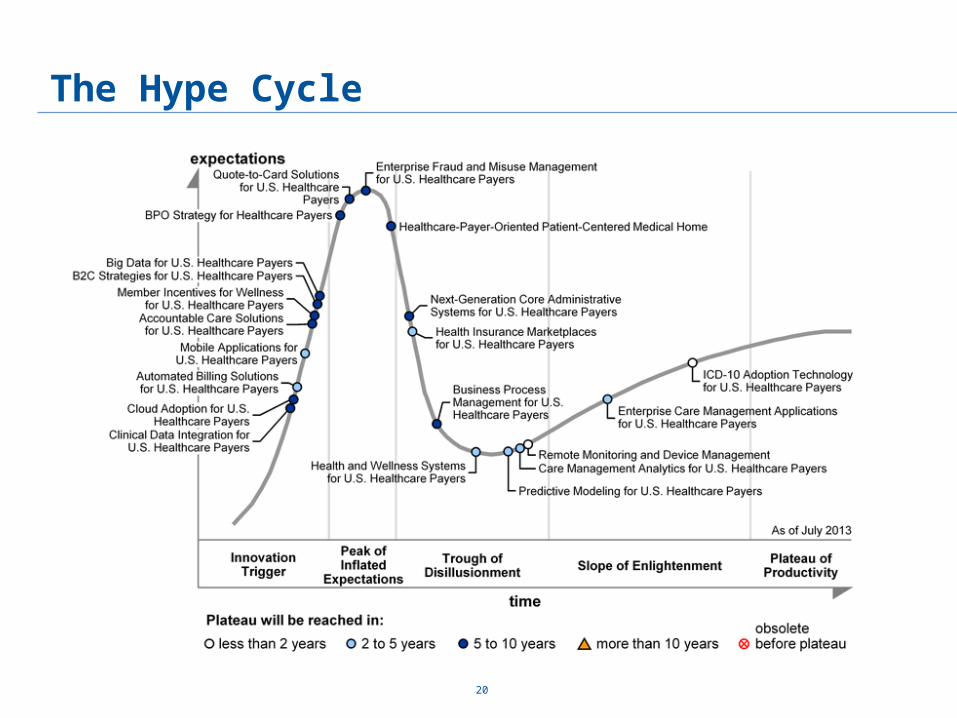
The Hype Cycle
20
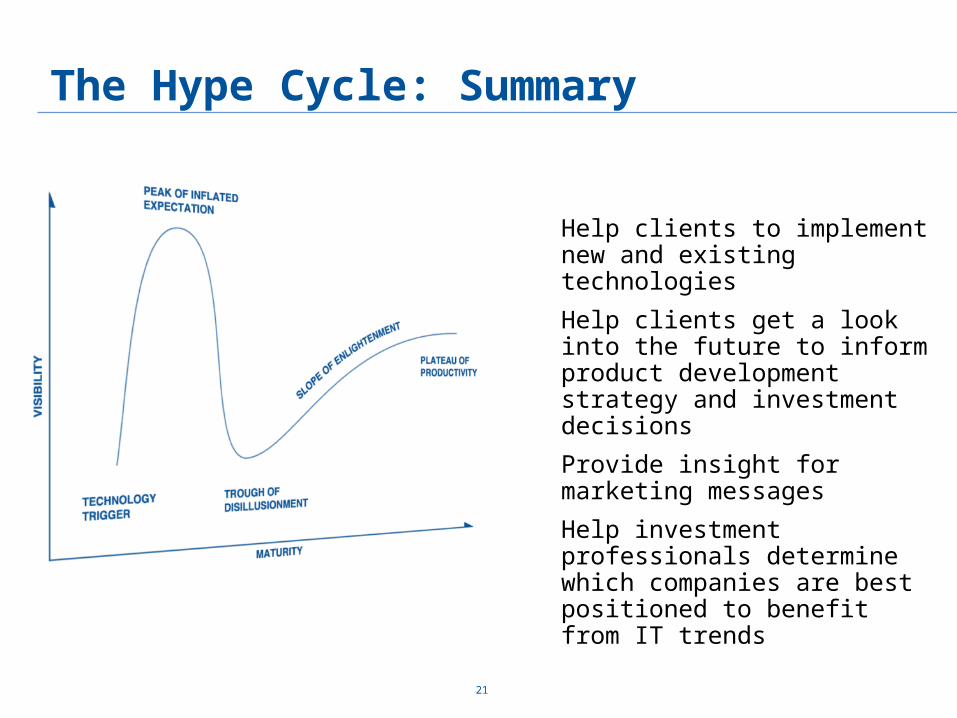
The Hype Cycle: Summary
Help clients to implement new and existing technologies
Help clients get a look into the future to inform product development strategy and investment decisions
Provide insight for marketing messages
Help investment professionals determine which companies are best positioned to benefit from IT trends
21
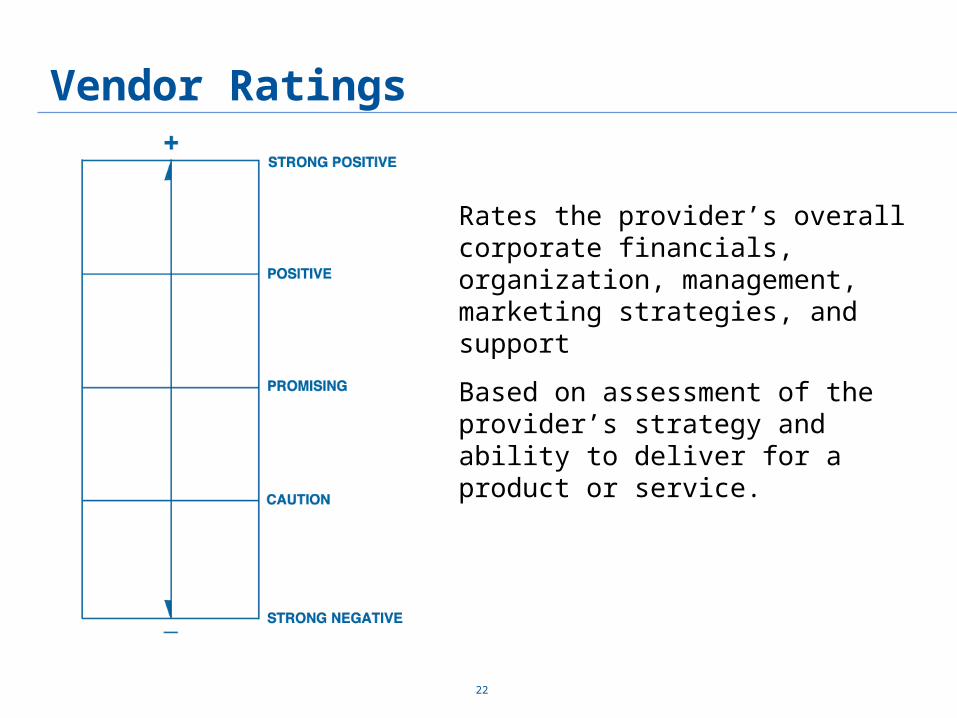
Vendor Ratings
22
Rates the provider’s overall corporate financials, organization, management, marketing strategies, and support
Based on assessment of the provider’s strategy and ability to deliver for a product or service.
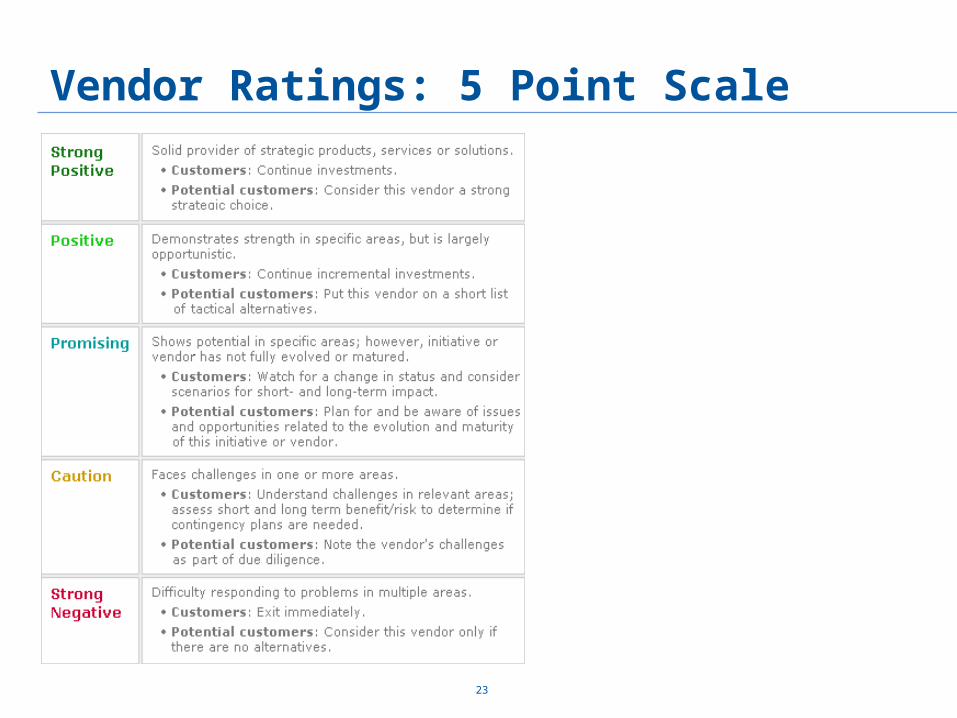
Vendor Ratings: 5 Point Scale
23
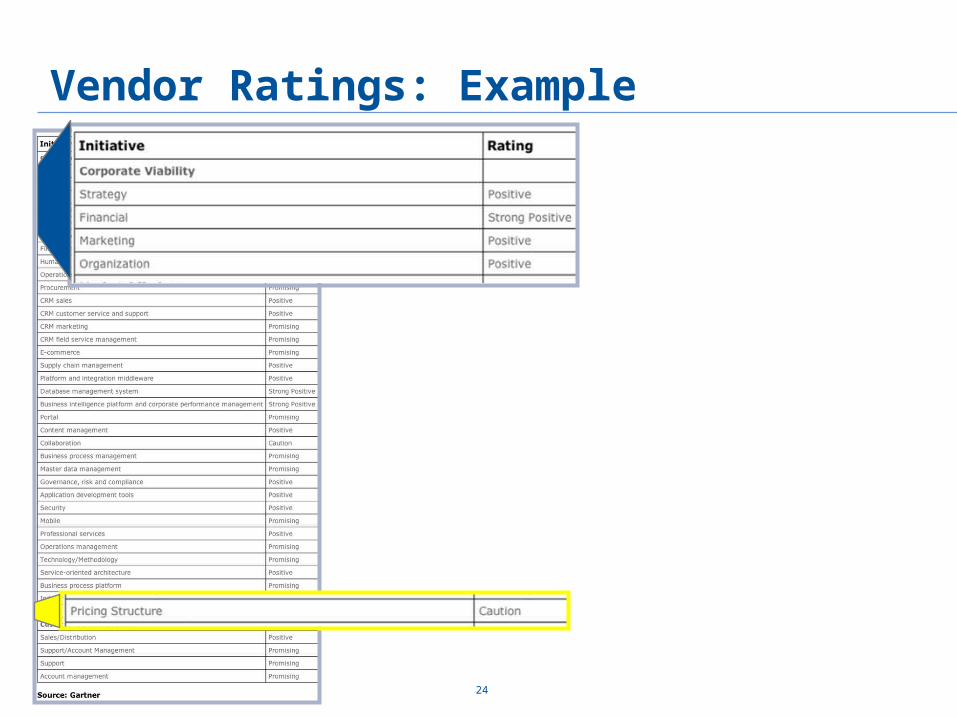
Vendor Ratings: Example
24
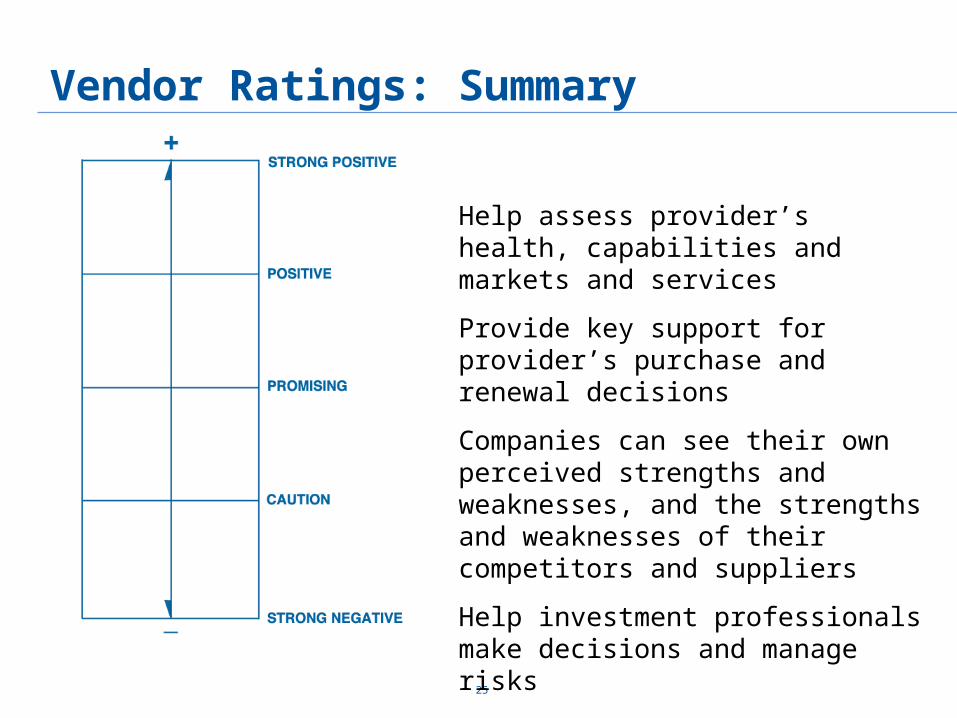
Vendor Ratings: Summary
25
Help assess provider’s health, capabilities and markets and services
Provide key support for provider’s purchase and renewal decisions
Companies can see their own perceived strengths and weaknesses, and the strengths and weaknesses of their competitors and suppliers
Help investment professionals make decisions and manage risks
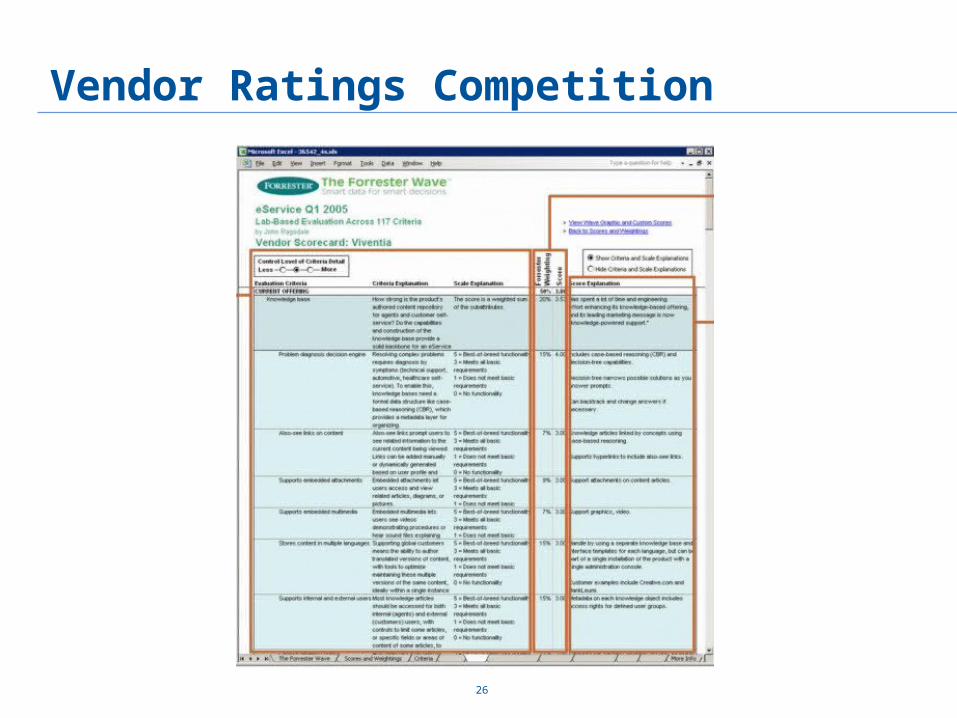
Vendor Ratings Competition
26
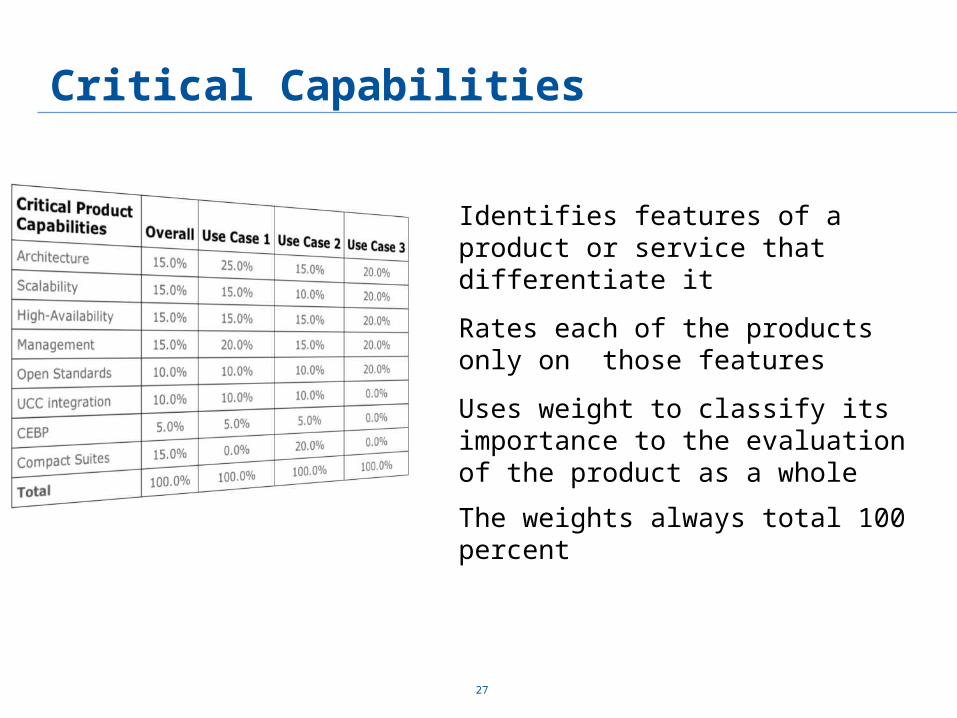
Critical Capabilities
27
Identifies features of a product or service that differentiate it
Rates each of the products only on those features
Uses weight to classify its importance to the evaluation of the product as a whole
The weights always total 100 percent
SWOT Analysis
28
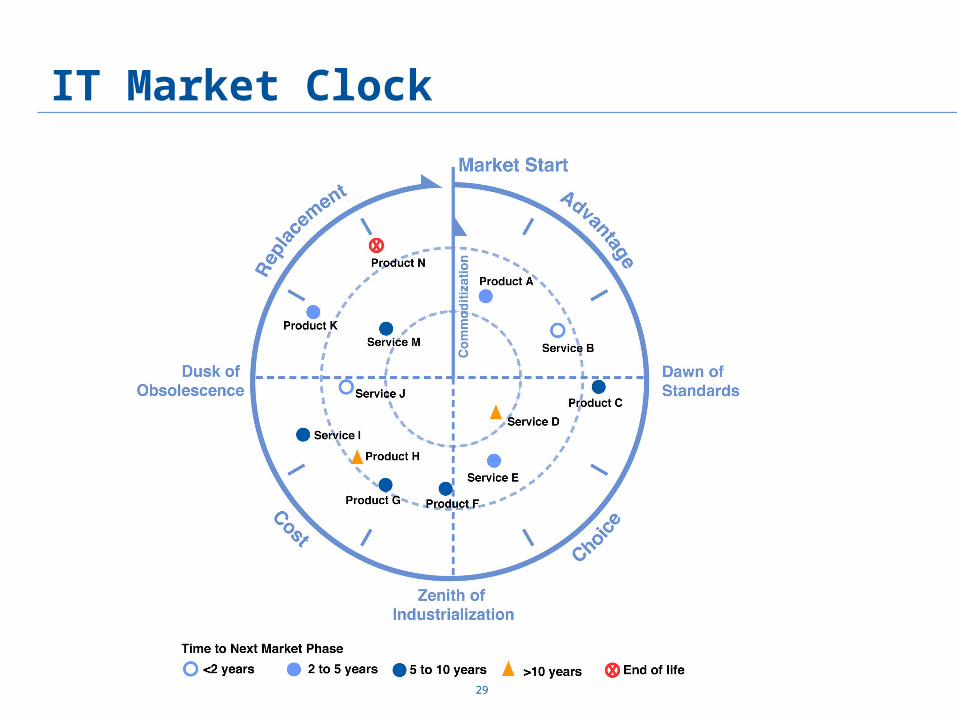
IT Market Clock
29
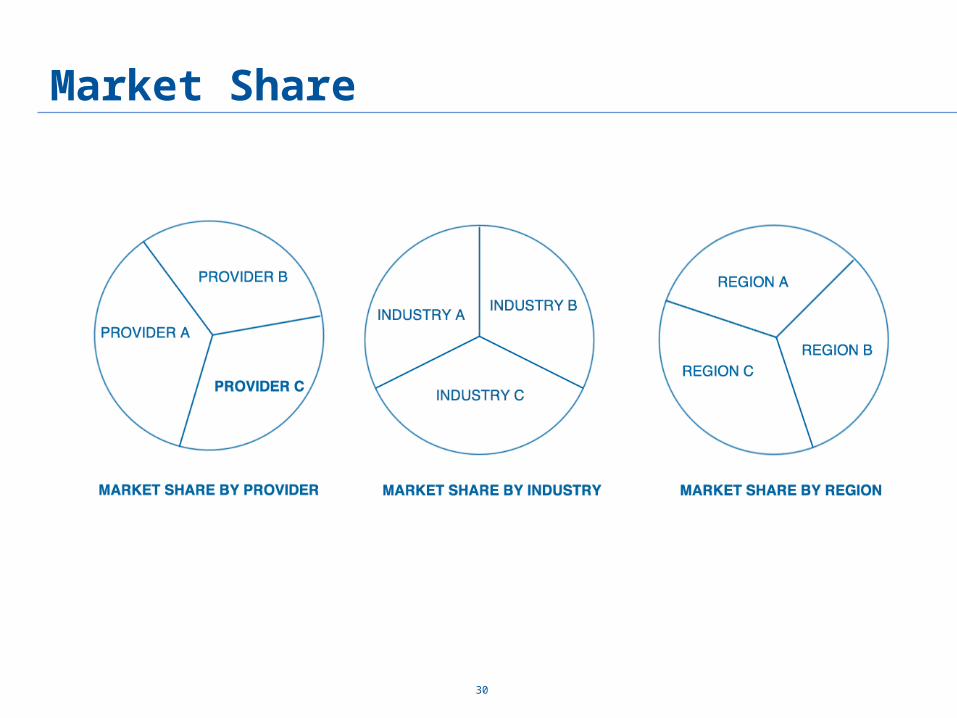
Market Share
30
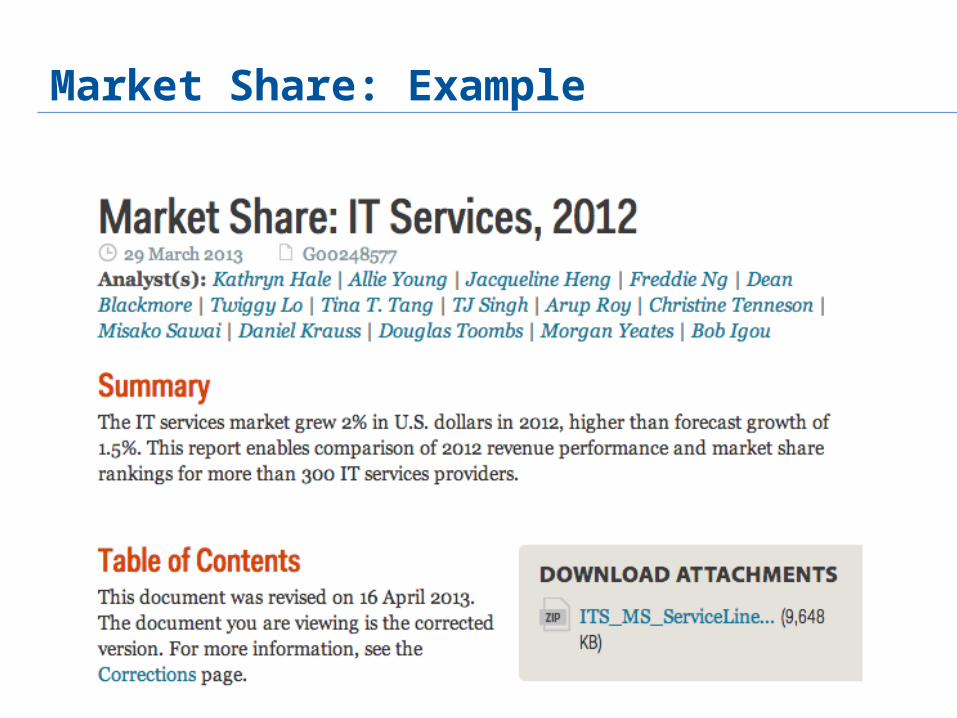
Market Share: Example
31
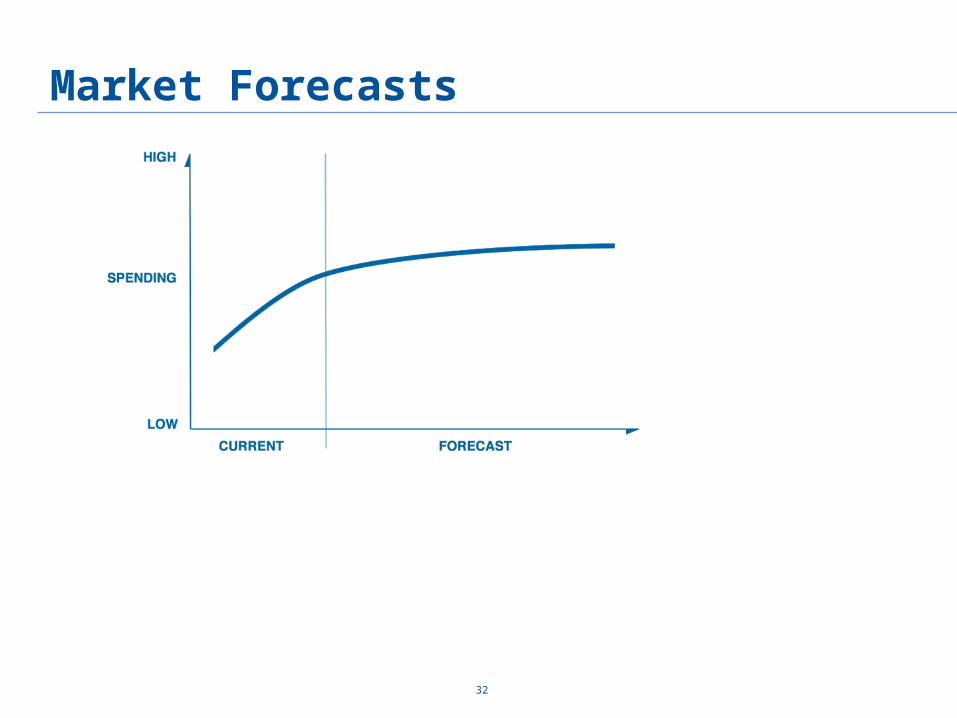
Market Forecasts
32
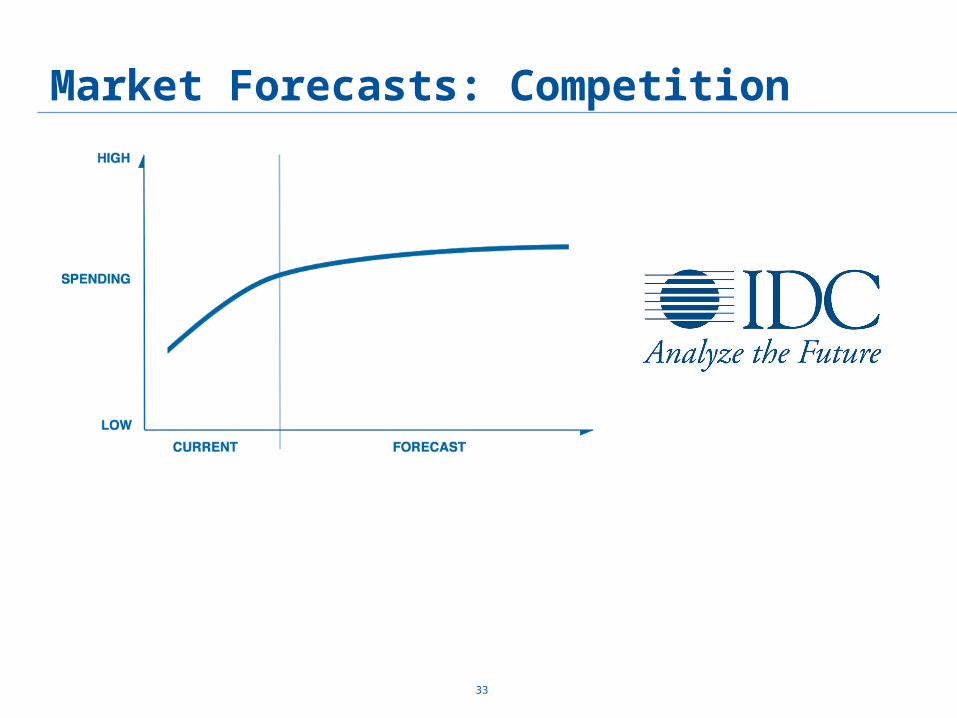
Market Forecasts: Competition
33
34
How can research methodologies help you in the sales process?
Use Gartner methodologies differentiate from competitors
Learn your client’s business concerns and walk them through a relevant methodology report
Show how analysis can help them reach the right decision
Research methodologies are a great tool to better understand your prospect
Sales Process