mystic - final report · project st-97-sc.2101 author: pdc, peter davidson consultancy (gb) ... ses...
TRANSCRIPT

Final Report for Publication
MYSTIC Towards Origin – Destination Matrices for Europe
Project ST-97-SC.2101
Author: PDC, Peter Davidson Consultancy (GB)
Project Coordinator: PDC, Peter Davidson Consultancy (GB)
Partners:
Sub Consultants
PDC, Peter Davidson Consultancy (GB) Co-ordinators
AGDER, Research Foundation (NO)
BEL, Baxter Eadie Limited (GB)
CBS, Statistics Netherlands (NL)
CNS, Community Network Services Limited (GB)
INRETS, Institute National de Recherche sur les Transports et leur Securite (FR)
IVT, IVT Heilbronn (DE)
IVV, Ingenieurgruppe IVV-Aachen (DE)
NEA, Transport Research and Training Foundation (NL)
NTUA, National Technical University of Athens (GR)
SES, Ministry of Transport and Tourism (FR)
DETR, Department of the Environment, Transport and the Regions (GB)
TTR, Transport and Travel Research (GB)
Project Duration: January 1998 – September 1999
Date: August 2000
Project Funded by the European Commission Under the Transport RTD Programme of the 4th Framework Programme

- 2 -
Contents 1. THE MYSTIC PARTNERS ....................................................................................................................4
2. EXECUTIVE SUMMARY.......................................................................................................................7
2.1 INTRODUCTION ........................................................................................................................................7
2.2 THE DEVELOPMENT OF THE PASSENGER O - D MATRICES ..........................................................7
2.3 THE INVESTIGATION OF FREIGHT SURVEY STRATEGY....................................................................9
2.4 RECOMMENDATIONS ON THE WAY FORWARD................................................................................11
3. OBJECTIVES OF THE PROJECT..........................................................................................................13
3.1 PASSENGER OBJECTIVES......................................................................................................................13
3.2 FREIGHT EDI S URVEY OBJECTIVES ...................................................................................................13
3.3 FREIGHT SHIPPERS S URVEY OBJECTIVES ........................................................................................14
4. ACHIEVEMENT OF THE OBJECTIVES ......................................................................................16
4.1 INTRODUCTION ......................................................................................................................................16
4.2 BACKGROUND ........................................................................................................................................16
4.3 AIM OF THE MYSTIC P ROJECT .........................................................................................................17
4.4 THE FRAMEWORK .................................................................................................................................18
4.5 KEY ISSUES ............................................................................................................................................20
4.5.1 Data Owners Confidentiality ..................................................................................................20
4.5.2 The Treatment of Air Passengers........................................................................................21
4.6 PASSENGER AND FREIGHT O -D MATRICES......................................................................................22
4.6.1 The Use of EDI to Gather Freight Data .............................................................................23
4.6.2 Producing an OD Transport Chain Freight Matrix.........................................................23
5. TECHNICAL DESCRIPTION OF THE PROJECT.....................................................................25
5.1 INTRODUCTION ......................................................................................................................................25

- 3 -
5.2 INCEPTION REPORT AND MODELLING FRAMEWORK (WP2) ........................................................25
5.3 PASSENGER ACTIVITIES (WP3 AND WP4) .....................................................................................26
5.3.1 Results Achieved .......................................................................................................................35
5.3.2 Presentation Software .............................................................................................................43
5.4 ELECTRONIC DATA PROCESSING (WP5) ........................................................................................43
5.5 SHIPPERS SURVEY (WP6)..................................................................................................................50
6. CONCLUSIONS AND RECO MMENDATIONS ...........................................................................64
6.1 OVERALL CONCLUSIONS : FREIGHT.................................................................................................64
6.2 OVERALL CONCLUSIONS: PASSENGERS..........................................................................................67
6.3 PROPOSED METHODOLOGY FOR BUILDING THE PAN-EUROPEAN PASSENGER MATRIX .......68
6.4 THE WAY FORWARD .............................................................................................................................70
6.5 WHAT WILL THIS PROVIDE?...............................................................................................................71
7 REFERENCES ................................................................................................................................................73
ANNEX 1: PUBLICATIONS, CONFER ENCES AND PRESENTATIONS .................................75
ANNEX 2: DESIRE LINES ..........................................................................................................................77

- 4 -
1. The MYSTIC Partners
Peter Davidson Consultancy – Partner & Project Co-ordinator
PDC is a private sector consultancy with particular expertise in the areas of transportation
planning, software development and market research, including the use of stated preference
analysis techniques. The consultancy has undertaken work at all spatial levels: urban;
interurban; regional; national and trans-national. Its clients include infrastructure authorities,
government agencies and major financial institutions.
AGDER - Partner
As a regional independent and non-profit organisation, AGDER is one of the largest research
institutions in Norway and also comprises a Transport Studies Group. In the transport arena,
AGDER’s main activities comprise of analysis of transport demand and supply, forecasting
scenarios of transport activities and transport policy assessment and analysis.
AGDER has 10 years experience in local, national and Europe-wide projects including freight
demand for the Nordic link corridor, establishment of OD matrices in Southwest Norway as
well as IN FOSTAT and MESUDEMO for the EU.
Baxter Eadie – Partner
Baxter Eadie is a transport consultancy with specialist expertise in Ports & Shipping,
Insurance and Finance, Economics and Statistics, Intermodal and Landside Transport.
Particular interests of the consultancy include shipping, containerisation, marine insurance,
development banking and road/rail transport. Additional specialists from related disciplines
are also associated with the company, providing a wide-ranging area of expertise. Recent
European work has included STEMM and INSPIRE.
CBS – Partner
As the Central Bureau of Statistic of the Netherlands, CBS is tasked to provide official
statistical information and economic statistics. CBS provides all the official statistics of the
Netherlands, and its work programme is comprehensive. Statistics available include all
economic sectors, national accounts, consumer and producer price indices and
environmental statistics.
Community Network Services Ltd – Partner
CNS provides customised, managed solutions to serve the information needs of communities
with a common requirement for the electronic exchange of information. CNS creates and
develop advanced port community systems for simplified customs clearance throughout the

- 5 -
UK. CNS is experienced in web portals, such as the Southampton Port Information Network
(SPIN) and Port Automated Cargo Environment (PACE). Other services include value added
managed network service and website design/hosting. CNS has also been partners in the
3Snet, POSEIDON and FINE European projects.
Institute National de Recherche sur les Transports et leur Securite – Partner
INRETS is a French public research institute specialising in the field of transportation, under
the patronage of the Ministries of Transport, Industry and Research. It’s activities cover
technological and socio-economical research, and INRETS has recently developed a strong
involvement in European fourth and fifth framework projects.
IVT Helibronn – Partner
IVT is a small private research institute based in Germany. The main areas of work for IVT
are transport statistics, statistical methodology for transport studies, design and analysis of
transport and travel surveys, empirical mobility and transport studies, travel forecasting,
quality management in both public and freight transport and data analysis.
Ingenieurgruppe IVV Aachen – Partner
A private consultancy based in Germany, IVV is a highly experienced European project
agency. IVV specialises in transport research and analysis, urban and regional planning,
network studies and software development.
IVV has been responsible for projects on all spatial levels from local to European wide
including CAMPARI, INFOSTAT, Federal highway master plans, modal split surveys and park
& ride Studies.
National Technical University of Athens – Partner
The main activity of the National Technical University of Athens (NTUA) is obviously one of
education, but the Telecommunications Laboratory, a division of NTUA has a wide range of
experience in computer networks, mobile telecommunications, network management and
conformance testing.
The laboratory has a history of working in European transport projects including
EUROSCOPE, THERMIS and INFOSTAT where it provided support relating to advanced
information management systems, decision support systems and applications of second
generation GIS.
NEA, Transport Research and Training Foundation – Partner

- 6 -
NEA is an independent organisation specialising in research, consultancy and training
services in the field of transport and logistics. NEA’s employees include economists,
econometrists, engineers, EDP personnel and educationalists.
NEA’s activities cover a broad range of transport related topics. These include modelling,
forecasting and database construction, market evaluation, policy support, cost/benefit and
feasibility studies. NEA’s econometric analyses are supported by databases of transport
flows and infrastructure.
Previously, NEA has worked on a number of European Commission projects including
INFOSTAT, the SPREAD working group and has constructed European regional trade
models.
Service Economique et Statistique – Partner
SES is part of the Directorate for Economique and International Affairs (DAEI) within the
French Ministry of Equipment, Transport and Housing. It is respons ible for public statistics
and economic studies for the Ministry. SES operates as a branch of INSEE, the National
Statistical Institute, and is also the French correspondent for EUROSTAT.
DETR – Sub Consultant
The Department of Environment, Transport and the Regions is a national government
department in the United Kingdom. Its role in the MYSTIC project was as a sub-consultant
and provided expert technical assistance in the matrix development process. The DETR
were co-funders of the United Kingdom’s contribution to the MYSTIC project.
Transport and Travel Research – Sub Consultant
Based in the United Kingdom, TTR is a transport consultancy offering specialist research and
consulting services to both public and private sector organisations throughout Europe.
TTR’s main activities include transport policy, energy and the environment studies, transport
telematics, public transport, market and social research and project management.
TTR offer advice and services from initial concept through to implementation and appraisal.
This covers qualitative surveys, proposal preparation, system specification, evaluation of
systems and schemes, project and programme planning, policy analysis and public
consultation.

- 7 -
2. Executive Summary
2.1 Introduction
The MYSTIC project set out to address the issue of how to build origin-destination passenger
and freight matrices for Europe from currently available data and to chart a path which could
lead to a continuous process of matrix development. Such matrices and the information they
contain are essential for the development of the Trans European Transport Network (TEN),
as well as the linkages that feed into it. They are essential for the development and
justification of the Common Transport Policy (CTP) and vital for effective decision-making.
They underpin the actions of Government and are needed to maintain the infrastructure and
to regulate the transport system equitably. Transport operators and infrastructure providers
are desperately in need of a European origin-destination matrix – with a detailed knowledge
of where people and freight come from and go to, they can optimise their service provision so
as to make their services more attractive and capture new markets (e.g. from road) with the
confidence in knowing that the business investment decisions they are making, will give them
the return on investment that they have planned for.
The project has been carried out through a total of seven work packages which have broadly
covered co-ordination, preparation of an Inception Report, the development of new
methodologies for data analyses, the development of the passenger matrices, the
development of procedures for the collection of freight data through electronic methods, the
development of freight shippers surveys and preparation of progress, work package and final
reports.
This report details what has been achieved in relation to the objectives that were set.
2.2 The Development of the Passenger O - D Matrices
The objective of the passenger component of MYSTIC was to develop a methodology for
building a pan-European origin – destination matrix and to test it using two case studies, as
follows:
1. The European case study merged the existing origin-destination data sets for seven
countries together to produce a European origin-destination matrix covering road and
rail. The objective, to develop the tools and techniques for merging different datasets
and to show how they could be used to produce a European trip matrix, was
successfully achieved and produced a useful matrix.

- 8 -
2. The UK case study assembled the major detailed datasets in the UK and showed how
different detailed datasets could be held in a detailed National database suitable for
building detailed trip matrices for infrastructure design, operation and assessment. This
database is currently in use by the UK Government for its programme of major multi -
modal studies covering eleven key locations throughout the UK.
The case studies demonstrated that the overall approach outlined here can be used to build
the trip matrix and that existing data can make a valuable contribution to producing the pan
European passenger origin-destination trip matrix which has the following components:
A major new pan-European passenger screen line origin-destination survey: (see
below)
Existing origin-destination datasets: e.g. household o-d interviews, on-system o-d
interviews (i.e. at roadside, on-train and at-airport), already-constructed o-d matrices: The
study showed that these existing data sources could make a valuable contribution to the
matrix.
Existing non origin-destination data: e.g. count data, population and demographic
data: This data would be used in conjunction with the matrix improving methodology to
improve the resulting matrix.
Existing ticket sales data: The methodology developed for the UK case study can be
used to derive air and rail origin-destination passenger trip matrices from ticket sales data.
Connect to Transport Operators Databases: Transport operators collect origin-
destination data and it is important to elicit the support of all data owners to contribute data
and make use of the matrix. This would involve tackling the important issue of data
confidentiality for which MYSTIC shows the way forward.
Research into Methodology: The methodological advances made by MYSTIC can be
used and built upon to improve the matrix. The methodology itself can be improved with
further research so as to incorporate a wider range of data types with modelling.
The study showed the importance of establishing an organisational structure, which secures
sensitive data and provides as free a flow of information as possible within the constraints that
data owners place upon the use of their data by others. The database approach provides a
framework within which this can be organised optimally, providing the continuity of keeping
the pan-European passenger origin-destination trip matrix as a working tool. In the database
approach, the data is held in a database, which can be added to as data becomes available
and matrices can be built from it – matrices which can be used at both a detailed scheme
appraisal level and at a pan-European level for policy analysis.
- 9 -
The case studies also showed the use and limitations of existing data and highlighted the
need to collect a consistent set of new data with which to both harmonise existing data and to
add valuable additional information. This led to the need for and specification of, a new pan-
European passenger screen line origin-destination survey so as to complete the survey
picture for matrix building. This new survey would mean identifying a set of screen lines
throughout Europe which intercepted the major international flows and surveying them with
roadside, on-train and at airport personalised origin-destination interviews on a rolling
programme and using the data for enriching and infilling the matrix with better and better data
over time. For road this could mean undertaking a series of roadside interview sites along the
major screen lines. For rail this would mean interviewing on-train on routes that cross the
screen line. For air this would mean interviewing at airports for flights that cross the screen
line. The survey design would need to give careful attention to sampling ensuring that the
sample can be expanded to represent all travel that crossed the screen line. The data needs
to be collected to a structured and consistent way particularly with regard to the origin and
destination addresses, which need to be collected with sufficient precision at a European level
and so that they can be used at a detailed level for scheme appraisal.
The new pan-European passenger screen line origin-destination survey would provide a
robust and consistent data source to help provide information missing in the current data sets.
This would be best undertaken in conjunction with the initiatives in member countries as we
are aware that at least one country is planning (and maybe already undertaking) a roadside
interview survey for national matrix building. It is envisaged that the first phase would require
about 250 sites to be surveyed, costing about 3m euro for fieldwork address coding and data
processing.
2.3 The Investigation of Freight Survey Strategy
Until recently customs records have provided a data source suitable for compiling origin-
destination flows of freight commodities between member countries which with the help of
additional surveys, could provide enough information from which to compile the statistics
needed by member countries including detailed matrices of freight flows (e.g. tonnes lifted,
tonne kilometres and freight commodity value). This valuable data source disappeared with
the disappearance of customs duty between EU member countries. The MYSTIC project
therefore investigated freight data collection strategy with two possible candidate
methodologies for collecting freight origin-destination data. They were as follows:
1. The freight shippers survey sampled shipments of freight and traced the shipment
through each organisation that handled the goods with telephone interviews until it was
traced to its final destination. This method involved a series of telephone calls to each
company involved in the shipment chain asking detailed information including
behavioural information about the alternatives that the company could have used.

- 10 -
2. The freight EDI survey sought to investigate the possibility of intercepting the Electronic
Data Interchange (EDI) messages, which pass over the Internet from one company to
the next in the freight commodity chain, in advance of the goods reaching them.
The EDI survey showed that the information required (i.e. origin, destination and other data
items) did indeed exist in the computer systems of the originator of the consignment although
the data items required usually spanned more than one organisation and spanned more than
one computer system which made automating the process difficult to achieve in the short
term.
However the opportunity should be taken to introduce a EU wide standardised data collection
format now - because the timing is optimum. The industry (particularly that associated with
the logistics operator and with just-in-time manufacture) is undergoing rapid change and in
response software suppliers are redesigning their software. The opportunity now arises, if an
EU-wide standard is introduced, that EDI software suppliers would design-in the new
standard so that future releases would have the new standard embedded. If the standard was
so designed this could provide the platform needed for the full-scale automation of freight
origin-destination data collection with EDI.
The shippers survey successfully found a methodology for tracing freight shipments from
origin to destination through each link of the transport chain so that a matrix could be built for
each commodity flow. This is a significant finding because such a methodology had hitherto
eluded researchers.
The ‘shippers’ survey methodology can also be used to elicit a wealth of other detail including:
the origin-destination characteristics of the chain, sequence of modes, intermodal platform,
physical dimension of the commodity flow, behavioural data, costs and tariffs, as well as an
in-depth investigation of the logistic organisation of the shipper, thereby considerably
improving our ability to understand and forecast the movements of goods and their modal
split. Eliciting this full set of information can be costly and if the objective is the origin-
destination matrix then slimming the interview down to the essential data items can further
reduce costs. For behavioural and other data an additional questionnaire can be administered
to a sub sample.
The survey methodology could be scaled-up so as to elicit enough information from which to
build a freight origin-destination transport chain matrix for Europe. Additional benefit would be
gained by undertaking the survey at the European scale for several reasons. For example as
a transport chain may have links in several member countries, shippers could be interviewed
by their own Nationals – increasing the success rate and reducing the cost per interview.
It is therefore recommended that the Commission undertake a pan-European freight
‘shippers’ origin-destination survey so as to build the European freight transport chain origin-

- 11 -
destination matrix. The cost of the complete survey is likely to be high and would need to be
set up as a rolling programme with Eurostat taking the lead - although due to the initial
research nature of the survey it would be best to instigate the survey as part of the European
research programme. The fieldwork should be phased with an initial one-third coverage that
could cost in the region of 3.5m euro including fieldwork, survey design and analysis costs.
The first phase should be combined with the recommended passenger research project (see
below). The rolling programme could cover the other two thirds over the rest of a ten-year
period under the auspices of Eurostat. The survey should be sponsored by member
governments who should provide visible backing for the survey – shippers are reluctant to
respond to non-governmental initiatives.
The data would be put into the origin-destination database and the organisational framework
put in place to provide information for government and maintain, market and offer users the
service of supplying extracts from the data, matrices and tools. The organisational framework
needs to be set up with great care so as to safeguard the data and maintain the high quality
standard of the data required by member governments.
2.4 Recommendations on the Way Forward
We recommend the Commission organise a research project to design, set up and initiate the
first four-year phase of a rolling programme of passenger screen line origin-destination
surveys and freight ‘shippers’ origin-destination surveys, put this data into a European origin-
destination database and build the passenger and freight matrix. The surveys could
subsequently be taken over by Eurostat and undertaken as a ten year rolling programme so
as to keep the matrices reasonably up to date. The two new surveys are pan-European and
are as follows:
A new passenger screen line origin-destination survey: so as to provide the core of the
passenger matrix. It would cover major international and European passenger flows by
interviewing passengers at the roadside, on train and at airports on transport links that cross
optimally located screen lines across Europe.
A new freight ‘shippers’ origin-destination survey so as to provide the core data for the
freight matrix. The survey methodology would draw upon the results of MYSTIC suitably
adapted for the different member countries with a questionnaire that just elicited the
information needed for matrix building. The survey would cover all countries with about a one
third coverage
The research project could also set up the combined passengers and freight European origin-
destination database together with the service to supply information to government (and
others), set up the database maintenance, marketing and support as well as providing a
general service of supplying matrices and tools to users. The origin-destination database

- 12 -
could comprise the new survey origin-destination data together with pan-European household
travel diary origin-destination survey data, rail and air ticket sales data, counts and other non
origin-destination data. The project could use the origin-destination database to build the pan-
European passenger and freight origin-destination matrix as described above. Operating the
database could become a near self-financing service, run on a five year rolling contract from
the Commission with the organisation undertaking analysis for the Commission and acting as
a focus for data supply to others.
The research project could encourage and help member governments build their national
origin-destination database. It could develop computer linkages with other databases (e.g.
transport operators) providing exchange of data with them and so that the data can be used
to improve the matrix. It could provide a focus of expertise for origin-destination data and its
uses and support the activities of researchers, analysts and modellers. It could research
methodologies for matrix merging, combining and improving and develop the tools that could
be made available to member governments and data contributing organisations. It could also
cover collation of other data and the passenger survey design and analysis.
The new passenger screen line origin-destination survey is likely to cost 3m euro including
fieldwork, address coding and data processing (but excluding the survey design and analysis
costs which would be part of the main research project). The new freight ‘shippers’ origin-
destination survey could cost 3.5m euro including fieldwork, survey design and analysis costs.
The research project itself is likely to cost in excess of 1.5m euro, which with the surveys
could give a total project cost of 8m euro. The research project should deliver a pan-
European passenger and freight origin-destination matrix using the above methodology. It
should instigate a rolling programme of passenger and freight origin-destination surveys
covering a ten-year period, which should be repeated so that the matrix is never more than
ten years out of date.

- 13 -
3. Objectives of the Project
3.1 Passenger Objectives
The purpose of the passenger part of the MYSTIC project was to develop a methodology for
building a pan-European passenger o-d matrix. The detailed objectives to be achieved were
as follows:
To bring together heterogeneous data sets from a number of European countries and
merge them into a pan-European o-d matrix covering road and rail
To develop a detailed UK based o-d matrix to show how datasets could be held in a
database for use in infrastructure scheme design and development
To develop mathematical and statistical tools and techniques that would be used by the
case studies,
To develop software tools that could be used for both analytical and presentational
purposes.
The methodological developments, the two case studies, mathematics and software
development when taken together succeeded in developing a methodology for building the
pan-European passenger o-d matrices which could be used both at a strategic pan- European
level for policy and strategy hypothesis testing and at a very detailed level for scheme
assessment and design – the same database technology and tools being used at a range of
levels of spatial detail and extent of the study areas.
The project demonstrated the efficacy of the recommended methodology with two case
studies: one aimed at the pan-European policy level and another at the detailed transport
planning and infrastructure appraisal level (the UK case study). The pan-European Merged o-
d matrix this study produced may be useful for research purposes but has weaknesses that
make it unsuitable for use in policy analysis. If it is used then the user should take full account
of the construction of the matrix, because, for example, certain types of trip may be omitted
(e.g. short distance trips or trips from non-Nationals of the country concerned) in addition to
the weaknesses inherent in the datasets used to com prise the matrix cells concerned
3.2 Freight EDI Survey Objectives
Background Information about origins and destinations of transport flows is an essential
requirement for assessing needs for transport infrastructure provision, for analysis of internal
and external costs and benefits of such transport activity, and for development of policy

- 14 -
initiatives to influence and provide facilities for these activities. Statistics describing patterns
of origin – destination distributions are of value to operators and economic actors within the
transport industry, for purposes of marketing, development of facilities, and planning of
operations.
Sample surveys to collect such statistics have been carried out on a comprehensive national
basis since 1974 in the U.S.A, since 1978 in the United Kingdom, and during the 1980s and
1990s in France, Germany and the Netherlands, for international trade flows. Because of the
expense involved in the large surveys required, these studies have been generally been
carried out at intervals of five years or longer. Efficient sample design is essential to
minimise costs, and in turn requires a comprehensive sample frame of consignments. In the
United Kingdom Customs provided a complete frame of consignments until 1993. Since the
introduction of the Single Market this frame has not been available for intra-European trade.
An alternative methodology with ship manifests as a sample frame was used to survey United
Kingdom – Continent transport flows during 1996, within the STEMM project, but was only
partially successful because of incompleteness of the sample frame.
The questions that have been addressed by this study are “Can complete census information
be collected easily from transport operators with electronic control systems?” and “How does
information from these operators relate to overall transport patterns?”
The Work Plan objectives of Work Package 5, the EDI study, were therefore to:
Assess the extent of computer based control systems among transport operators;
Find out the content of these systems;
Develop and evaluate statistical procedures to compile statistical descriptions of all
transport chains in the overall origin-destination flows.
3.3 Freight Shippers Survey Objectives
The specific problem, which Work Package 6 of MYSTIC addressed, was to establish policy-
oriented information on the flows of goods in Europe. To do that the project developed an
approach based on a survey of shippers’ international related activities. The survey of
shippers was seen to be the basis for understanding and measuring the relationship between
organisational and economic factors of the firm on the one hand, and the modal choice
behaviour on the other hand. This information is essential for transport policy.
The objective of this aspect of the MYSTIC project was to show the technical possibilities for
applying the transport chain concept developed by the INFOSTAT project. In doing so it

- 15 -
contributed to a better understanding of the organisation of the transport chain for
international trade and particularly a better understanding of the modal organisation.
In addition, Work Package 6 had an objective to develop methodologies for building up
matrices of freight flows along the transport chains.
The research tasks attributed to the Shippers surveys part of MYSTIC had two objectives:
To develop a behavioural analysis of the modal choice for international transport chains
To produce a methodology for estimating Origin/Destination international transport chain
freight matrices.
The research task of the behavioural survey can be stated as follows: Develop a behavioural
analysis of the organisation of a transport chain and subsequently develop new statistical
methods aiming at building up transport chain matrices of good flows.
Parallel to the behavioural shipper survey, the O/D shipper survey was carried out in order to
estimate the level of trade by activity and on a region-to-region basis.
By undertaking in-depth surveys on selected corridors and segments, the MYSTIC freight
study has aimed at the possibility of developing an innovative approach of complex problems
that could be applied to the EU as a whole.

- 16 -
4. Achievement of the Objectives
4.1 Introduction
The MYSTIC project was launched at a time when
transport modelling was gaining rapidly in sophistication,
integrated and comprehensive transport models were used for national planning in many
European countries based on detailed national zoning systems, but normally with few or no
foreign zones added,
several international transport corridor studies had been carried out based on statistics
compiled, processed and adapted specially for those projects,
the European Union (EU) had in the Framework Programs financed the development of
integrated and comprehensive transport models experiencing problems of data shortage,
available algorithms, iteration procedures and computer capacity were rapidly getting
more powerful,
European transport policy was putting high priority on the Pan-European dimension,
exemplified by Trans -European Transport Network (TEN-T) by the EU,
generally available transport databases to supply the necessary statistical information for
modelling, planning and policy purposes were shrinking in scale and scope.
4.2 Background
The conceptual framework for Pan-European transport planning has been produced in the
Fourth Framework RTD (Research and Technical Development) project INFOSTAT and has
been termed ETIS (European Transport Policy Information System). In INFOSTAT (1998)
Final Report for Publication indicators and variables are presented in a systematic way
relevant for transport modelling, planning and policy issues. Under the heading of "Passenger
transport demand indicators" is found "Total annual interzonal passenger transport flow by trip
purpose, mode (or combination of modes) and type of trip chain." Similarly under the heading
of "Freight transport demand indicators" is found "Total annual interzonal freight transport flow
by commodity group, mode (or combination of modes) and type of transport chain." Both
indicator groups are to be specified on a relevant origin/destination (o-d) base and have been
given the highest priority in the report (fundamental in the terminology of the report).

- 17 -
In integrated and comprehensive transport modelling, such as the four-stage transport model,
the two first stages deal with transport generation/attraction and the distribution between
zones before transport mode distribution and transport route assignment are solved.
Transport between zones or as it is most frequently denoted origin/destination (o-d) flows are
basic to integrated and comprehensive transport planning.
Some remarks on the production of o-d matrices synthetically might be appropriate at this
stage. Transport models can create such matrices based on the particular model structure,
the model input and the model maximisation attributes. If there is no external database to
confront the model output with, there is no way of knowing how reliable the o-d matrices might
be, and models cannot be calibrated to achieve better fit to reality.
So there are good reasons why o-d transport matrices should be produced empirically for
some base years. From these base years the matrices can be updated by various techniques
to any recent year relevant for model input and output confrontation. In this manner there
could be a fruitful interplay between relevant transport data and transport models.
Today, however, no comprehensive and generally available set of Pan-European o-d
matrices exists for any base year. This applies both for
transport modes,
commodities (freight),
trip purposes (passengers),
transport chains,
countries and international regions.
4.3 Aim of the MYSTIC Project
The overall aim of the MYSTIC project, as indicated above, has been to develop methodology
and corresponding software to produce (estimate) origin/destination (o-d) matrices for both
passenger and freight transport at the European level. Although the overall aim is the Pan-
European country-to-country flows, a regional specification (NUTS 2 or more detailed
specification) at both ends of the flow is desirable as well as some commodity specification for
freight transport and travel purpose for passenger transport. The o-d matrices should be
produced for those single transport modes being in the most keen competition with each other
and for the most important transport mode combinations (transport chains) as has been
explicated in chapters 2 -4 above.

- 18 -
The methodologies for o-d matrix estimation to be developed in the MYSTIC project as has
already been underlined above, have to be suitable for application to typical Pan-European
transport modelling, planning and policy problems. In addition the o-d matrix estimation
methodologies developed must cover both current conditions when ETIS is not yet available
as a total database and a future situation when ETIS may be established.
The current data situation is even so problematic that available past data for the base
(reference) years are so old that o-d matrices have to be estimated (calibrated) for more
recent years to be really useful for policy and analytic purposes. Although the MYSTIC project
deals with o-d matrix estimation for the past, the project is closely related to forecasting
issues as mentioned above. Models to be used for o-d flow forecasting at the European level
are significantly influenced by the kind of data that are available. On the path to the future
ETIS the MYSTIC project has, therefore, analysed and proposed several methodologies,
procedures and techniques and corresponding software. This chapter presents the framework
for these proposals.
4.4 The Framework
Relevant data that might be exploited for the production of Pan-European o-d matrices are
regularly compiled by The European Conference of Ministers of Transport (ECMT), the United
Nations Economic Commission for Europe (ECE) and EUROSTAT of the EU both in
conjunction with each other and separately. EUROSTAT compiles both foreign trade statistics
and transport statistics as a consequence of several directives. Many European countries
produce trade and transport sta tistics and national travel and freight surveys more or less
regularly. Roadside traffic counts are numerous and the various transport modes (companies
and national as well as international organisations) might have data sufficient for detailed o-d
matrices for some past years. So the situation is not completely bleak, but offer a great
challenge for the maximum use of existing data and knowledge.
One disturbing problem is the increasing tendency for transport companies and organisations
to keep transport data confidential even when such data are only intended for statistical
purposes. In the MYSTIC project an appeal was made with the help of Directorate General
(DG) VII, to a number of countries to make existing data on passenger transport available for
the project. This has on the one hand created value added by exploiting and combining
existing data from responding countries into the beginning of Pan-European o-d passenger
transport matrices for road and rail transport, and on the other hand paved the way for a
continuing improvement, updating and extending of the matrices. Further success will depend
upon co-ordinated co-operation from many countries, and therefore it is important to build
relations with the data holders.

- 19 -
Within the given cost and time budget constraints the MYSTIC project has worked under the
aim to come up with cost-effective procedures for statistical sound data compilation and
processing in relation to Pan-European o-d matrices. The constraint necessitates, however, a
focus on those procedures that promise an answer within reasonable time and costs.
The MYSTIC project seeks to derive in a sense a best-estimate o-d pattern with as recent
data sets as possible, to specify the need for collecting new data sets so as to complete the
o-d pattern together with developing compatible methodologies for modelling the transport
mode choice.
The project deals with new statistical and computing methodologies, which are available and
beginning to be applied to transport. In general terms the project addresses issues such as:
merging different data sets, with different levels of precision and different levels of
confidence and still providing some best-estimate base year o-d matrices;
improving existing and developing new survey methods for collecting better data for o-d
matrix estimation.
The MYSTIC project has produced a framework within which the different passenger and
freight o-d transport chain matrix building procedures have been fitted. It comprises Pan-
European survey methodology, framework for the analysis of such data and storage within
the ETIS, and framework for connecting together existing data sets from European countries
so as to build matrices comprising the whole of Europe. This demanding challenge the
MYSTIC project has answered somewhat differently for passenger and freight transport due
to a different database situation.
For passengers the work in the MYSTIC project has shown due to information gathered from
several countries, that it might be possible to produce matrices approximating First
Generation Pan-European o-d Passenger Matrices.
To arrive at the conclusion relating to passenger transport the MYSTIC project has studied
and exploited transport models, algorithms and available data sets from several countries
both for their usage in producing o-d matrices and for proposing methodologies for future
usage.
Within the MYSTIC project work has been carried out to find methods and models usable for
data analysis and data production relevant for the project and exploit some of them. With in
the framework context of this chapter can be mentioned efforts to:
identify and use methods to harmonise and merge o-d matrices from different sources,

- 20 -
identify and use methods to transform limited information such as link counts into relevant
o-d information,
study scope and limitation of transport models to generate o -d relevant information,
exploit transport models and case studies for their ability to create o-d relevant
information,
assess statistical precision in the o-d data and data production procedures.
The classical transport planning model has been extensively used as tool in creating master
plans for urban areas. Efforts have also been put into using the model for regional planning,
but only more recently has the model been applied to nations. Few attempts have been made
to use it on a Pan-European scale. Thus there is a very limited volume of data available in
Europe on border crossing travel, and in the MYSTIC project the consortium have had to
make maximum use of national data, lacking data on travel between countries.
Most efforts put into the MYSTIC project on the passenger side was related to the task of
developing methodology for building Pan-European passenger o-d observed matrices from
different data sets and sources. The study has developed passenger o-d matrices for Europe
in the most complete form possible recognising the current data and modelling constraints.
In relation to o-d passenger database generation the MYSTIC project has been able to get
and process information from eight countries: Denmark, Finland, France, Germany, Great
Britain, Netherlands, Norway and Sweden. So far no Central and Eastern European countries
(CEEC) are included. Focus has been on producing Pan-European o-d matrices for the rail
and road transport modes.
4.5 Key Issues
4.5.1 Data Owners Confidentiality
We found that some data owners were willing to make their data available to us in its entirety.
However there was also the opposite - a distinct reluctance by data owners to give their data.
This is not a new problem and we had to address it in detail – and solve it - if we were to
develop a methodology for building the pan European o-d matrix using existing data. The
database approach offered us a way to ameliorate the impact of at least some, of the
concerns of data owners.
In some cases data is increasingly being seen as a commodity of value and some data
owners are reluctant to ‘give’ their data to others – especially if they gain nothing in return.

- 21 -
The database approach allows them to retain control of their data. In this way data does not
need to be given to the database system and the data is clearly under the control of the data
owner. There would need to be some contractual arrangement between the data owner and
the operator of the database system that could be a normal commercial arrangement (or can
be free). This project sought to use the case study to assess these aspects for suitability to
see whether they could contribute to the o-d database part of the ETIS.
We found that some data owners were willing to make their data available to us in its entirety
but this could well become increasingly unlikely especially for the more powerful datasets. It is
also increasingly important for data to be maintained – preferable at its source. The idea of
the database approach was that data owners, who generally had a vested interest in making
sure that the data was correct and well maintained, should hold the source data. In the
database approach the database system would connect to the source database and draw an
extract from it, which it would use for matrix building. As more source data is added to the
source database the data owner would undertake the necessary processing tasks and
maintain the integrity of the source data and keep it up-to-date. This is not a task that the
database system would wish to undertake and is best undertaken by the data-owning
organisation itself anyway. In the database approach the important point is that the
connection or linkage to the source data should be maintained as part of the database system
so that as further data is added to the source data future extracts are easy. It could be that
the source data is corrected or updated or data is added in some way, in which case a better
version of the source data can be accessed and a n extract taken for matrix building.
The database approach to matrix building could provide an effective solution to this problem if
the case studies were successful. This view is endorsed by the success of the DETR
research project, which successfully negotiated the use of highly confidential rail ticket sales
data for use by MYSTIC and others.
4.5.2 The Treatment of Air Passengers
The derivation of the pan-European o-d matrix for air passengers was thought to be important
and to be a question that MYSTIC should address. It was considered that analysing the road
and rail o-d matrices from the case studies and using the results to draw relevant conclusions
could address the problems of deriving an air passenger o-d matrix. One of the richest data
sources for air passenger o-d movements is that obtained from accumulating the individual air
ticket sales. These data are collected and could possibly be used for o-d matrix building
although there are some organisational problems (e.g. several organisations are involved in
the data) and logistical problems (e.g. that they span several computer systems) to be solved.
At the commencement of the project the European Commission were investigating the
possibility of assembling the air ticket sales data into their own database and it was felt to not
be part of this project to repeat this exercise (or even part of it).

- 22 -
However the issue of using air ticket sales data centres on the problem of relating the airport-
to-airport nature of a ticket to the ultimate origin and destination of the person using the ticket.
Consider the case of a single stage trip from origin zone to origin airport to destination airport
to destination zone. The use of airport-to-airport ticket data translates into finding the
travellers origin zone when the boarding airport is known and finding the destination zone
when the alighting airport is known. This problem is more complex when two or more aircraft
are to be used depending upon whether there is one (or more) ticket(s) for whole trip (i.e.
from the first airport visited to the last airport visited). The problems associated with using
ticket sales data for air are similar to those using rail where the ticket sale relates to the
boarding station to alighting station and it is required to infer the origin zone to destination
zone. They also exist for other public transport modes. The use of ticket sales data could be
analysed using rail and during the course of this project we (and others) were asked by DETR
to develop origin-destination matrices for rail passengers using ticketing data as part of
another exercise. MYSTIC used the UK rail passenger o-d matrices developed under this
exercise and we were able to analyse the rail methodology and understand how it could be
applied to air. This could provide a suitable methodology for developing pan European air
passenger matrices.
4.6 Passenger and Freight o-d Matrices
In the MYSTIC project dealing with passengers, 1997 was chosen as base year.
The main problems encountered, to turn the limited information available into approximations
to Pan-European rail and road o -d matrices for the selected countries can be summarised as:
turning information from years other than 1997, frequently as far back in time as
1992/1993 into 1997 data,
turning national travel surveys and other information giving little or no data on foreign
travels into international specification on countries and international zones in the NUTS
administrative system,
turning national roadside link counts on average annual daily traffic (aadt) and other
partial information into relevant Pan-European o-d information,
releasing and transforming railway information into relevant Pan-European o-d
information,
transforming national travel surveys covering resident population between certain age
groups into travels by all people irrespective of age groups and nationality,

- 23 -
distinguishing between more infrequent long-distance Pan-European travels and the
more frequent short-distance border-crossing shopping and leisure trips,
getting estimates on the use of transport chains by travellers between zones.
For freight the project is based on alternative approaches.
4.6.1 The Use of EDI to Gather Freight Data
At the more micro level the MYSTIC project have tried out a few approaches to o-d
estimation. One such approach has been the possible use of stored data in the computer
system of operators, another a shippers survey and developing methodology for estimating o-
d international transport chain freight matrices and for understanding behaviour in modal
choice.
In the first of the above-mentioned approaches the MYSTIC project wanted to:
assess the extent of computer based control systems among transport operators;
find out the content of these systems,
develop and evaluate statistical procedures in order to compile statistical descriptions of
all transport chains in the overall o-d flows.
The study has been based on interviews with operators in two countries. If the aims of the
study were fulfilled, this approach could be used to get information on o-d freight flows from
operators. To find out the potential of this source of information, the MYSTIC project had
divided the study into some distinct tasks, as follows:
data description of the elements of interest,
enumeration and classification of a frame of transport operators,
interview programme,
pilot electronic data interchange (EDI) collection,
methodology description and report preparation.
4.6.2 Producing an OD Transport Chain Freight Matrix
The other freight transport study mentioned above was focused on transport chains and dealt
with developing:

- 24 -
new statistical methods of registering flows aiming at building up o-d transport chain
matrices of freight flows,
a behavioural model of the organisation of a transport chain.
The objective of the work has been to give a basis for the necessary future data collection
with focus on getting a method for producing an o-d transport chain matrix on a regular basis.
The sub-task dealing with behavioural analysis was considered important because it would
provide insight in the significant factors that play a role in the decision process of modal
choice.
The shippers' survey have been based on interviews with shippers in France and the
Netherlands and renders regionalized o-d information specified on commodity, type of
transport chain and mode combination to the extent it is possible to gather information from
shippers in such a way that it represents all flows. Estimating o-d single mode matrices is also
possible by decomposing transport chains. By this it may be possible to study the probability
of using unimodal transport or a multimodal transport chain, including applying mathematical
models in order to predict the choice of the transport chain.
The MYSTIC project has shown the technical possibility to apply the transport chain concept
developed by the INFOSTAT project. As such the behavioural analysis has contributed to
identify and to measure some of those explanatory variables that are required in the ETIS
system as instrument of policy decisions.

- 25 -
5. Technical Description of the Project
5.1 Introduction
As indicated in section 2 the overall aim of the MYSTIC project was to develop a methodology
or set of methodologies for building origin-destination matrices of passengers and freight
movements and to build a pan European matrix or matrices of passenger movements based
on the available data.
This latter objective was introduced to the project in late April 1998, some three months after
the project had begun and it involved a change in the direction of the project that meant that
efforts in the first stage of the project were misdirected.
The project was divided neatly into two major streams of work - passengers and freight, and
within the freight section there was a further subdivision into firstly an examination of the use
of Electronic Data Processing for collecting data on the movement of freight around Europe,
and secondly on the use of a shippers’ survey to identify the movement of freight.
The Project was divided into 7 work packages - WP1 and WP7 were for coordination and
reporting respectively and WP2 was concerned with the production of an Inception Report
and the development of an overall modelling framework. The passenger work was divided
between WP3 and WP4, the EDP part of the project was addressed in WP5 and the shippers
Survey in WP6. The progress of these work packages and the results achieved are
described in more detail in the following paragraphs.
5.2 Inception Report and Modelling Framework (WP2)
As the first deliverable from the MYSTIC project, an Inception Report was submitted to the
European Commission on 12th May 1998. This report contained an outline description of the
work to be undertaken in the project and described the links between the different subtasks
within work packages and between the work packages.
The Inception Report contained modifications to the distribution of individual partners’ work
allocations between the different work packages as more was learned about the way forward
for the project. It also contained detailed specifications of the work plans and sub-task
descriptions for the three major streams of work. The production of the report was carried out
principally by AGDER, though the project coordinator PDC undertook the final editing.

- 26 -
The Inception Report constituted the first Deliverable (D1) of the project, outlining the work to
be undertaken and describing the links between the different sub-tasks within each work
package, the links between the work packages, and the links between MYSTIC and other
related projects in more detail than was possible in the Technical Annex. The Inception
Report also serves as a document of reference for the partners throughout the lifespan of the
project.
It outlined in detail the processes and deliverables of the project. The Technical Annex
constituted the scientific aspect, and is what the end product will be evaluated against. The
primary purpose of the Inception Report was to refine the link between the Technical Annex
and the research to be undertaken, by developing and establishing an ex ante overall
methodological framework for the project. Secondly, the document contained outlines of the
work to be undertaken in the individual Work Packages, the so-called Work Programmes that
are important guiding instruments for the accomplishment of the research. This was seen as a
continuous process starting with the initial thinking around the proposal and leading to
recommendations of the project
5.3 Passenger Activities (WP3 and WP4)
These two work packages were closely interlinked and are described together. The general
objective of WP3 was to develop new methodologies for data analyses to support, in
particular WP4, and WP6 also.
The following flowchart describes the MYSTIC methodology. MYSTIC was intended to deliver
a ‘process methodology’ - that can be then be used in the future.

- 27 -
MYSTIC Passenger O-D database: Architecture
Comprises data and processes
Raw O-D dataN, S, DK, NE, FR, DE, UK
Synthetic matrices e.g. STREAMS
Harmonised O-D database by country
Available data O-D matrices
HARMONY.DB
HARMONY.DB
Matrix buildingprocedure
BUILD.PR
Validation & sensitivityanalysis
RAW.DB
BUILD.PR
Harmonisation procedures
The sub tasks for WP3 were focussed on the following subjects
ST1: development of a methodology for describing national O - D raw data sets in a
standardised way
ST2 target definition of the pan - European O - D matrix to be built

- 28 -
ST3 methodology for harmonising national O - D data sets
ST4 methodology of merging and combining O - D matrices
The results of these research activities serve as tools for the WP4 European
Passenger Matrix
ST5 raw data description guidelines
ST6 O - D data harmonisation guidelines
ST7 merging procedures for O - D matrices
ST8 combination procedures for O - D matrices
From a statistical viewpoint both the merging and combining of O-D matrices required
complex mathematical procedures. Only the ‘classical’ merging problem where all O - D
matrices refer to the same zoning system and where variances are known can use traditional
methods. In the MYSTIC project however O - D matrices from different countries use different
zoning systems (grouping of cells in external areas) that gave rise to the ‘combination’ rather
than ‘merging’ problem. Moreover, since national O - D matrices are partly synthetic
variances of O - D matrix elements are frequently unknown. As a consequence demanding
mathematical work had to be done in WP3 but this resulted in the development of new
methodologies for matrix merging and combining.
The Passenger Working Group in its initial meetings formulated a set of sub-tasks for WP4
that were incorporated into the Inception Report. Further meetings following the submission of
the Inception Report expanded the list of sub-tasks to the following:
ST 1 Definition of scope and detail
ST 2 Collect raw O-D datasets
ST 3 Produce harmonised O -D datasets
ST 4 Develop and build matrices
ST 5 Merge Europe – wide road and rail O – D matrices
ST 6 Enhance matrices with synthetic data
ST7 Validate assembled matrices
ST8 Report and recommendations

- 29 -
Tasks 1 and 2 - Definition of Scope and Collection of Raw Data
The initial element of WP4 was to identify those countries and data sources that could
contribute significantly to the required data sets. A core of countries was identified from which
data would be central to the project and other countries from which data would be sought to
support the dataset coverage. The core countries were:
UK Sweden
NL Denmark
German Finland
French Norway
‘Supporting countries’ comprise the following:
Austria Italy
Belgium Luxembourg
Denmark Portugal
Greece Spain
Ireland Switzerland
Data was received from all the core countries listed above. In the case of the UK the data set
was particularly rich and considerable effort was spent on the merging and harmonisation
processes.

- 30 -
Table 5—1 Summary of Data Sources and Types
Country Mode Base
year Source
Number
of
zones
Geographical
area
National
or Inter-
national
Institution
data holder
Rail 1992 Ticket sales Road
Administration
Road 1992
Roadside
interviews, car
ownership
register
1000
Parishes and
groups of
parishes
Inter-
national Rail
Administration
Denmark
Air 1997
Airports Internation
al
Copenhagen
airport
authorities
Rail 1992 NTS
450 Municipalities national Road
Administration
Road 1992 NTS
450 Municipalities national Road
Administration
Finland
Air 1992 NTS
450 Municipalities national Road
Administration
Road
Rail
France
A7ir
1993
Enquete
Transport
Departements
NUTS3/NUTS
2
National
and Inter-
national
Service
Economique et
Statistique
Road 1991 RSI, modelling 453 NUTS 3
Rail 1991 Tickets,
Modelling 453
NUTS 3
Germany
Air 1991 Counts,
Modelling 194
NUTS 2
Inter-
national
Ministry of
Transport

- 31 -
Country Mode Base
year Source
Number
of
zones
Geographical
Area
National
or Inter-
national
Institution
Data Holder
Road 1981-
1991
RSI, IPS, 3000
Study specific
zones
Rail 1997 Tickets,
modelling 11,000
Wards
(NUTS5/6)
Grt Britain
Air 1995 CAA
Inter-
national
DETR
Rail 1995 Ticket sales,
counts 435
municipalities TOI, State
Railways
Rail 1997 Ticket sales 19 Counties State Railways
Road 1995 Car ownership
register, counts 435
municipalities
Air 1995 Travel survey,
airport statistics
National
TOI
Norway
Air 1997
National/in
ternational
Directorate for
Aviation
Rail
Road
Air
1993
NTS 668
sams
National
Rail
Administration
Sweden
Rail 1992
Tourist data-
base, counts,
hotel statistics
300
Eurostat,
Regions 1989
Inter-
national
Transek AB/
Swedish
Railways
Task 3. Produce harmonised o – d datasets
In Task 3 there was a requirement for software to be available to translate and transform the
different datasets into the harmonised form. Harmonisation is concerned with ensuring that
the data from the different countries is to a consistent specification. This included, for example

- 32 -
transforming the geo-referencing details on the data to a common zonal system (NUTS),
transforming modes and purposes to a common definition and adjusting the data to a
common base year. The following diagram illustrates the harmonisation process
Task 4. Develop and build matrices
Task 4 also required software to merge the different datasets and to ensure their statistical
specification. In the United Kingdom, the DETR commissioned a program called ERICA for
their regional models and PDC worked on developing that software to bring it up to date with
modern computing standards (e.g. 32 bit processing rather than 16 bit) and have been testing
it on the UK data. The data generally came with expansion factors so as to expand the data
up to represent a full days (or month’s or year’s) worth of travel. The data were then built into
o-d matrices by accumulating the expanded numbers of trips recorded between each pair of

- 33 -
zones. Generally the zone system to which each trip origin and destination was recorded as
going to (or coming from) was generally particular to that particular survey. Within the country
of origin, the trips were generally recorded to a zone system that accorded with the NUTS
system. However outside the country, trip origins and destinations were generally aggregated
sometimes to a zone system that bore little resemblance to NUTS. Differing external zone
systems were accounted for in the merging process whereby a zone was split up into the
NUTS system (generally at NUTS2) using demographic data.
A similar situation occurred with the UK datasets where the external zones were rather too
coarse than the consistent NUTS3 level required for the matrix building, and the zone splitting
was undertaken for the UK datasets too.
Many of the datasets were supplied to us as o-d matrices and in this case they by-passed the
matrix-building task. In some cases the harmonisation factors were applied after building the
matrices and in some cases it was best undertaken beforehand.
Task 5. Merge Europe – wide road and rail O – d matrices
The matrices built from each dataset were merged together so as to produce one Merged
matrix covering those countries for which we had o-d data. Country to country movements,
where we had only one observation from one dataset, were put directly into the Merged
matrix. Country to country movements where we had more than one observation from
different datasets were merged according to the merge methodology which usually meant
taking the average. Where variances had been calculated for both datasets then the
averaging could use variance weighting. In certain circumstances some datasets did not
contain all the trips (this was generally either due to the long distance cut-off or because the
dataset was from a household survey and therefore omitted trips from foreigners) and in this
case if there was an estimate with all the trips it was taken in preference to the former.
Splitting the external zones for a dataset was undertaken on the basis of population data for
the zones concerned. It was applied before the merging process.
When merging the matrices from the individual datasets, the merge conditions were set
according to the table given below. The merging process was undertaken in pairs of matrices
and matrices were merged by concatenating one dataset matrix into the result from the
previous merge. The two matrices being merged are given in the left hand columns and
“Result” means the result of the previous merges. Internal refers to a zone within the country
whose matrix is being merged and External refers to a zone in neither country.

- 34 -
From Internal A Internal B External
Matrix A Matrix B To Int A Int B External Int A Int B External Int A Int B External
Variance
Germany Denmark TA AV TA AV TB TB TA TB Max Default
Result Holland TA AV TA AV TB TB TA TB Max Default
Result UK IPS TA AV TA AV TB TB TA TB Max Default
Result Rest of
UK
TA AV TA AV TB TB TA TB Max Record
Variance
Result Norway TA TA TA TA TB TB TA TB Max Default
Result Sweden TA TA TA TA TB TB TA TB Max Default
Result Denmark TA TA TA TA TB TB TA TB Max Default
Result France TA TA TA TA TB TB TA TB Max Default
Key
TA Take Matrix A Value
TB Take Matrix B Value
AV Take average of the two values
Max Take the larger of the two values
Task 6. Enhance matrices with synthetic data
The merged matrix only contained an estimate of the origin-destination movements for those
zone pairs for which we had data (i.e. was included in one of the datasets listed above).
Those countries where we did not have any data, we took synthesised matrix cell estimates
from the STREAMS EC project. This included such countries as Spain, Portugal, Belgium,
Austria, Italy, Greece, and Ireland. The origin to destination matrix cells concerned were
simply replaced with the synthesised matrix cells.
Task 7. Validate assembled matrices
Details of the results achieved with the validation procedure are given in section 5.3.1 below.

- 35 -
Task 8. Report and recommendations
We have recommended the Commission organise a research project to design, set up and
initiate the first phase of a rolling programme of passenger screen line o-d surveys. The
project would also set up the passenger (and freight) o-d database together with the service
to supply information to government (and others), set up the database maintenance,
marketing and support as well as providing a general service of supplying matrices and tools
to users. Operating the database could become a near self-financing service, run on a five
year rolling contract from the commission with the organisation undertaking analysis for the
Commission and acting as a focus for data supply to others. The project should deliver a pan
European passenger and freight o-d matrix using the methodology developed in the tasks set
out above. It was further recommended that the Commission should instigate a rolling
programme of passenger and freight o-d surveys covering a ten-year period, which should be
repeated so that the matrix is never more than ten years out of date.
5.3.1 Results Achieved
In terms of the UK case study the results achieved show the merging of many different data
sets has been accomplished. There is a reasonably equal spread of trips over the areas from
which the data has been taken and that areas where there is most likely to be more trips, i.e.
London and Manchester, do attract more trips. It must be noted that this matrix is only
complete for trips within and to/from the four areas where the survey data has been used, i.e.
South East, Manchester/Yorks, Birmingham and Scotland. Parts of the Matrix starting and
finishing in places other than these are partial and do not contain all the trips.
The case study has shown a methodology that successfully merges data from different
roadside and other interview surveys. Many completely different datasets have been
combined to produce a single matrix that represents trip movements within and between the
locations where the surveys were undertaken. The success of this study stems from the
methodology and merging software being flexible enough to adapt to very different datasets.
The complete UK matrix is given as Annex 2.
On the European level the results of the study have also been successful in showing the
feasibility of producing a harmonised and merged matrix from different data sources. The
following tables illustrate the type of data the study has been able to produce.
The first table is a summary of some of the key o-d flows from five EU countries, measured in
000’s of passengers per annum for the year 1997 by road and rail combined, for trips over a
threshold distance of 50km to 100 km depending upon the dataset. They show that of these
countries, the highest flow is between France and Germany with around 57 million two-way
passenger trips per year; followed closely by trips between the Netherlands and Germany
with just over 48 million two-way passenger trips per year. After this come the flows between

- 36 -
Denmark and Germany (just over 32 million two-way passenger trips per year) and between
France and the UK (just over 26 million two-way passenger trips per year). There is a clear
gap then to the next highest flows between the Netherlands and the UK (6 million) and
between Denmark and France (4 million). The flows between Denmark and the Netherlands
and between France and the Netherlands were about 1 million two-way passenger trips per
year and between Denmark and the UK they were about a half a million two-way passenger
trips per year.
Destinations
Denmark France Netherlands UK Germany
Denmark 0 2208 639 233 16353
France 2043 0 638 13381 28880
Netherlands 561 636 0 2820 23982
UK 240 13381 2820 0 3149
Origins
Germany 16454 29567 23024 2996 0
Source: MYSTIC. These figures were obtained from merging different data sets that had different definitions e.g. some data sets
excluded trips less than 100km., some 80km., some 50km., and some were for country residents only. See Chapter 4, section 4.3
Harmonisation
Turning to the proportion of trips by mode, car or rail, for the above five countries, car carries
the most trips, with in all 93% of the market share (172 million two-way passenger trips per
year between the countries) with rail carrying the remaining 7% (13 million two-way
passenger trips per year between the countries). The following table show the market share
by country measured in terms of 000s of two-way trips in 1997.
Market Share by Country (000s of trips per year)
Denmark France Netherlands UK Germany All
Road 18.795 40.074 26.820 19.225 66.629 171.543
Rail 0.638 4.868 1.179 0.365 5.412 12.462
19.433 44.942 27.999 19.590 72.041 184.005

- 37 -
Source: MYSTIC. These figures were obtained from merging different data sets that had different definitions e.g. some data sets
excluded trips less than 100km., some 80km., some 50km., and some were for country residents only. See Chapter 4, section 4.3
Harmonisation
It is also important to consider the extent to which the outputs can be considered ‘validated’
The aim of a validation procedure is to ensure the data delivered in the merged / combined
matrices are on the one hand complete and consistent with respect to the input data and zone
representation (technical validation) and on the other hand to check the plausibility of the data
("quality" validation). In theory, there are many techniques conceivable to perform a matrix
validation however the procedures and the results of the validation process in MYSTIC can be
summarised as follows:
The technical validation was mainly performed by analysing the desire-lines and the data of
the intermediate results of the merging and combination process. Here, the technical
problems caused e.g. by different formats of the input data especially with respect to the
handling of border crossing trips have been revealed and have been solved. The technical
validation process illustrated how “good” the matrix was.
The following tables present some results of the quality comparison of the MYSTIC case
study data. As already described in the previous chapters, the emphasis of the MYSTIC -
project lay on the development of methodologies to merge and combine existing data. Thus
the project had to rely on the data available and did not have the possibility to influence the
quality of the input data. Therefore, a big variety of data had to be taken into account in the
case study that lead to divergent results if one compares the data country by country. The
table below shows the average number of trips per inhabitant and year for the different
countries in the MYSTIC Case Study Road Matrix.
In general it becomes obvious, that a border-crossing trip is a very infrequent event (in
average only a few trips per inhabitant and year!). Therefore, all methods relaying on
interviews of people face the problem of a scattered / diffuse data set needing very big
expansion factors to reveal total trips.

- 38 -
Trips per Inhabitant Country
Border crossing Internal
1 Austria * 4,80 0,00
2 Belgium * 3,14 0,00
3 Germany * 2,25 20,00
4 Denmark * 5,38 0,00
5 Spain * 0,05 0,00
6 Finland * 0,03 77,12
7 France * 0,80 3,85
8 Greece * 0,10 0,00
9 Ireland * 0,36 0,00
10 Italy * 0,22 0,00
11 Luxembourg * 13,45 0,00
12 The Netherlands 2,68 143,19
13 Portugal * 0,06 0,00
14 Sweden * 0,73 10,13
15 Great Britain * 0,46 60,49
* Denotes partial or inconsistent data
Trips per inhabitant per country in the MYSTIC Case Study matrix
The following table shows the average zone size per country for the NUTS2 and the NUTS3
levels. The table reveals considerable differences even for those countries with similar
regional structure. This means that due to the big differences of zone sizes the share of
intrazonal trips – trips that have origin and destination in the same zone – differs very much
between countries. The problem of intrazonal trips cannot be neglected, especially in the case
when no distance thresholds are considered. Thus, as intrazonal trips are not represented in
a trip-matrix, it cannot be recommended to use different zone sizes for presenting matrices
with no distance threshold! This is a fundamental problem (which occurs not in this extent on
a national or regional scale) and should be taken into account when a future ETIS is to be
made operational.

- 39 -
Consequently, the different size of NUTS zones is a fundamental topic when investigating
comparable data sets from different countries. Taking for example the trips within the
Netherlands and Finland. Although, both data sets have no distance threshold, the figures
'trips/inhabitant' are much higher in the Netherlands than in Finland not least due to the big
differences in the average zone size.
Area NUTS 2 NUTS 3
[km2] (number) [km 2/zone] (number) [km 2/zone]
Austria 83.858,3 9 9.317,6 35 2.396,0
Belgium 30.518,1 11 2.774,4 43 709,7
Germany 357.020,8 38 9.395,3 445 802,3
Denmark 43.094,4 1 43.094,4 15 2.873,0
Spain 504.790,0 18 28.043,9 52 9.707,5
Finland 338.147,0 6 56.357,8 19 17.797,2
France 543.964,6 26 20.921,7 100 5.439,6
Greece 131.625,0 13 10.125,0 51 2.580,9
Ireland 70.273,1 1 70.273,1 8 8.784,1
Italy 301.316,0 20 15.065,8 103 2.925,4
Luxembourg 2.586,4 1 2.586,4 1 2.586,4
The Netherlands 41.028,5 12 3.419,0 40 1.025,7
Portugal 91.905,0 7 13.129,3 30 3.063,5
Sweden 410.934,2 8 51.366,8 24 17.122,3
Great Britain 241.751,0 35 6.907,2 65 3.719,2
Total 3.192.812,4 206 15.499,1 1.031 3.096,8
Average zone size per country
Moreover, different zone sizes must also be taken into account when analysing pictures
representing desire-lines between zones. Naturally, the flow to one big zone is bigger than
each single sub-flow to three zones having together the same size as the one big zone. This
occurs for example for Denmark, which "unfortunately" represents on NUTS2-level only one
zone.

- 40 -
From the above tables it is clear that,
the distance threshold plays an important role, e.g. comparing the internal data for Germany (only trips longer 100 km) with the data from the Netherlands (all trips),
the zone size plays a role as well,
however, people in very small countries like Luxembourg make more border crossing 'trips/inhabitant' because the country is so small that more trips are likely to go across the border,
there are also other reasons for an unbalance of national data: Taken as an example France it is obvious that here is another fact responsible for the considerable low demand data (e.g. in this case the fact that the household data consider only French residents),
the countries with zero figures in internal data did not contribute to the MYSTIC case study and received the border crossing trips from other data sets.
Altogether, the validation of the MYSTIC European case study data showed that from the
technical point of view the methods applied worked and produced solid trip-matrices.
However, due to the disperse situation of the national data feeding the process (data with and
without distance thresholds, data generated from household and roadside interviews or
modelled data, consideration of residents only or of all travellers, etc.) it cannot be
recommended to use the Case Study Matrix for practical planning processes on the European
level. This is also true for the combined matrices containing the MYSTIC case study and the
STREAMS data. Here the same shortfalls apply.
However, the national data as such can be used separately, especially due to the fact that
they are tailored to the NUTS3 level. The following maps show for exa mple the results of the
validation of the German Data by performing assignments. The maps present the link loads
on the German road network for a total matrix including all trips between NUTS3 zones. The
tables above show the results of an assignment of the German input data for MYSTIC
(harmonised to 1997, 100 km distance threshold applied). Although there are differences in
the total level of trips it can be seen that the MYSTIC data represent the flows on the German
autobahn-network (often TERN elements) in a proper way. Only the trips in conurbations or
big cities show big differences due to the short distances applied.

- 41 -
Map1: Trips on the German Road Network – NUTS3 – no distance threshold

- 42 -
Map 2: Trips on the German Road Network – NUTS3 – distance threshold >100km

- 43 -
5.3.2 Presentation Software
An important part of the passenger side of the MYSTIC project was the also development of
the presentation software that was seen as an essential part of the dissemination and use of
the MYSTIC outputs.
The objective of the presentation software was to present the output of the passenger part of
the MYSTIC project in such a way that would be user friendly and easy to understand. It was
designed to allow the user to access the MYSTIC European matrix either in a non-graphical
way, by calculating number of trips between selected zones or in a graphical way with the
help of a GIS system. Moreover, this software was aimed at providing the documentation
corresponding to OD information on the data sources, the data sets and the methodology
used for the computation of the flows.
The presentation software was designed to serve two kinds of users. These who want to have
a friendly presentation of selected data e.g. collapsed tables, desire lines and those who want
to use the OD information (the tables themselves) e.g. transport experts. Both groups of users
need to have clear documentation on the data sources, data sets, and access to the MYSTIC
methodologies and this will be completed in the next period as part of the Final Report. A
CD-ROM will be produced for disseminating the software.
5.4 Electronic Data Processing (WP5)
The collection of complete chain origin and destination data by conventional questionnaire-
based means is now proving very difficult because of the loss of the detailed Customs
database from which to select a sample. The object of this work package is therefore to
ascertain whether statistics of complete origin and destination chains could alternatively be
obtained from the computer records of transport operators.
This Work Package was subdivided into 5 tasks as follows:
ST 1 Data description of the elements of interest
ST 2 Enumeration and classification of a frame of transport operators
ST 3 Interview programme
ST 4 Pilot EDI collection
ST 5 Methodology description and report preparation
The following paragraphs describe this Work Package in more detail.

- 44 -
Task 1 – Data Description of the Elements of Interest
The work package partners created a detailed list of relevant elements with definitions. This
was intended as a basis on which to describe freight movements, and forms the main input to
the Interview Questionnaire as required for Task 3. Task 1 was completed in March 1998
although the list and description of elements was not set in stone. It was left open to make
adjustments as may be required when other tasks in this work package progressed.
The conclusions derived from this activity were that the origin and destination of transport
chain, associated with description of the consignment being moved, are core elements of any
data collection to describe transport chains. This obvious statement is reflected in the
frequent separation of these data from other chain descriptors within and between logistics
operators’ electronic systems. Development of electronic systems for logistics (i.e. door-to-
door) operations is at an early stage, and expanding rapidly. To ensure availability of data
elements for statistical purposes, it is essential that official statisticians specify what
information is going to be required, and discuss with industry trade associations and software
suppliers how best to integrate these requirements into new systems, before these systems
are designed and implemented.
Task 2 – Enumeration and Classification of a Frame of Transport Operators.
The aims of the work package were:
to find out if transport operators’ information systems contain data describing transport
chains from origin to destination.
to evaluate if statistics describing the transport chain patterns can be compiled from these
systems using electronic means, and with a small or negligible burden on the operators.
to estimate what proportion of operators has such a systems.
to estimate what proportion of total traffic is covered by operators with such systems.
to estimate if the transport chain patterns of the subgroup from whom statistics are
collected is representative of the transport chain patterns of the whole population.
to estimate the quality of coverage of total transport obtainable with statistics compiled
from these systems.
to specify a methodology for compiling these statistics.
to specify methodology for improving the overall quality of statistics produced.

- 45 -
Therefore interviews were conducted with a sample of companies, from which o-d database
systems can provide information to compile statistics describing transport trips. The following
questions needed to be answered:
how representative are the interviewees of the group from which they are selected?
what proportion of the group would be able to provide information for statistical
compilation?
what will the sampling errors are in using results from those able to provide data as
representative of the whole group?
is the transport activity of the group from which interviewees are selected typical of the
transport activity of the whole population?
if not, for what sub-group is the sample representative?
how will the collected statistics of o-d patterns be scaled up to the group total?
what proportion of total traffic does this group cover?
what possible methods might be used to obtain statistics for the remaining parts of the
total population?
In order to answer these questions, a clear definition of the frame of organisations with which
we are concerned was enumerated. It was intended that groups of organisations in scope for
this study were:
Road transport operators.
Marine transport operators
Freight forwarders
Logistics operators
Inter-modal operators
Industrial and commercial companies carrying out their own logistics operations.

- 46 -
The first five categories were straightforward, and lists were compiled reasonably
satisfactorily. The last group presents more difficulties of identification. Initial suggestions
were that retail supermarkets should be included, since it is known that they do their own
account logistics organisation. But such an ad hoc definition provides no information about
the total extent of their own-account operations.
To avoid overlap and to enable this task to yield some estimate of the o-d activity as a whole,
based on a surveyed sample, it was felt that the highest level of operator would be the most
appropriate target. The focus would therefore be on (4) and (6) above. To that end, a
Logistics Operator for the purposes of this study was defined as follows:
A Logistics Operator/Manager is concerned with the provision of complete supply chain
solutions. As such, his activities will include the management or direct supply of the following
services: warehousing, consolidation, groupings, packing, transporting, unpacking, storage,
distribution and local delivery. It may also include ancillary value-added services such as
stock control, just-in-time management, pricing and repackaging for customer presentation.
Task 3 – The Interview Programme
On launch of this task within Work Package 5, it was decided at an early stage that the
questionnaire would consist of two sections: an initial brief section, known as the "pilot
interview", which will be precise but simple, and a second section which will be in more detail
and which will determine the data availability as required for this task.
The "pilot interview" will be with the managing director or the relevant department head of the
target Logistics Operator (LO). This interview is to determine general background data of th is
operator, nature, extent and names of sub-contractors, total activity in throughput and
estimated market share. The "main" interview will be conducted with the person responsible
for data processing (this could be the same person for a smaller operator). This will gather
information on data systems, nature of inputs, and aggregation of information and possible
outputs as required for this work package. The potential output data will be compared with
the parameters enumerated in Task 1 to determine if such data could indeed describe a
complete supply chain for the purposes of the MYSTIC project.
The questionnaire will therefore be along the lines noted below. It is structured on the basis
that the only interest is in those operators who have an electronic database. However, not all
questions are always relevant for all operators. Once the details of the questionnaire were

- 47 -
agreed, this was formatted into a numerical, logical-flow structure with blank boxes on the
right hand side to allow for varying lengths of answers.
It was agreed by work package partners that each interview would be initiated with a letter
explaining the purpose and objectives of the interview. For the United Kingdom, this letter
came from the DETR and was addressed directly to the managing director or department
head of the targeted company. The letters were sent out in three tranches and a period of up
to two weeks elapsed before follow-up telephone calls were made. Of the original 60-
targeted companies in the six sectors, 30 were finally interviewed.
Interviewing was carried out in the period from January 1999 to June 1999. Considerable
initial effort was needed to arrange the interviews. Having decided which companies to
interview it was necessary to telephone them to establish the name of the most suitable
contact. In some cases this took little time, but in others it took several calls to establish the
correct person. Two people both arranged and carried out the interviews. Arranging
interviews was also time consuming because it could sometime take several calls before the
potential interviewee was there to receive the call. Most companies were willing to take part,
although there were some refusals. On average interviews took about an hour, but when
travelling was taken into account the whole process could take several hours. It was often
difficult to get all the information required from one person. Sometimes they could give partial
or estimated answers. At other times it was necessary to speak to somebody else, or
because of the expense of carrying out a second interview to leave the question unanswered.
In most cases however enough basic information could be obtained in order to understand
the practicalities of getting supply chain information from company computer systems.
The broad conclusions from UK survey were that the results demonstrated that the data
required were available but, particularly for international shipments, not necessarily all in one
computer system. To monitor each complete supply chain it would ofte n therefore be
necessary to extract data from more than one system, especially when subcontracting was
involved. Considerable resources would therefore be needed to set up a data extraction and
analysis system.
The UK survey mainly covered the larger companies within the sectors covered. One way
forward might be to set up an electronic collections system for these larger companies, whilst
still using conventional paper-based methods for others. The burden on companies providing

- 48 -
data could however be significant at the set up stage and they would need to be sure that
they were going to see some major benefit.
At the UK interviews companies gave estimates of market share and through put in a variety
of units e.g. revenue, units of production, pallets, journeys. It would be necessary to establish
that a standard unit of measure existed that could be used for grossing to population totals.
Conclusions from the Netherlands surveys were that to undertake a survey in order to collect
information about the level of use of electronically means was very useful for Statistics
Netherlands. The outcome was more positive than thought beforehand.
In case a similar regular survey should be held, the frame should be defined properly. This
should be done for weighting purposes afterwards. It should be possible to produce results
for all Dutch enterprises.
It should be studied how this survey could be combined with existing obliged surveys.
Information about the level of electronically data exchange could lead to more integrated data
collection procedure. In this case more information could be collected at one time. This
would very much decrease the response burden for the enterprises and also speed up the
production of figures. It was also concluded that is certainly worth to study a pan-European
enlargement of the survey.
Task 4 - Pilot EDI Data Collection
The questionnaire was designed as follow up to the initial sample in particular to test some of
the initial responses against the reactions of the respondents' IT department and to explore
details of the data capture potential.
Although much of the core data is available in company systems it is not structured in the
manner envisaged by the initial questionnaire. For example for statistical purposes some
goods movements can be viewed as a chain with each multi-modal element being regarded
as a link, while commercial records only show it as a rope only recording the total movement.
Equally statistically a set of deliveries from a depot is seen as a circle statistically (with a+b+c

- 49 -
travelling from the depot to A, b+c from A to B etc) while commercially the movements are
recorded as a star pattern (i.e. Depot to A, depot to B etc.)
Information is scattered across systems, companies, countries and even continents. Fo r
example one organisation was only responsible for exports, others in the group were
responsible for internal distribution, imports and supplies of raw materials. Equally it was
common for data to be split across a manufacturer’s systems and those of its haulers and
between operational and accounting databases - in some cases in different IT centres. In
some cases a fuller high-level picture may be available from International Head Offices, but
the difficulty of obtaining this sort of information from for example American or Japanese – let
alone “flag of Convenience” operators is well known.
There were no common messages structures in use that would allow extraction of the core
data. In many cases even where "standard" EDIFACT messages were in use the comment
was that every customer used a slightly different version so in effect each message was
bespoke.
The conclusions from this task were that there is a willingness on the part of United Kingdom
industry to participate; however the data is not easily ava ilable from the systems sampled.
Once the information is received in a suitable format there is no difficulty in creating a suitable
database and then designing enquiries to answer statistical questions. The major problem is
collecting the data in an appropriate single structure since commercial organisations,
understandably, hold the information the information in a manner appropriate to their
operational and accounting requirements rather than for the benefit of European Statistics.
The only organisation that may have know of the complete movement from origin to final
destination appears to be the Originator (the Exporter or Manufacturer), however unless they
are also the Transport Operator they almost certainly will not have full details of the multi-
modal movement (For example they may well not know details of ferries, depot reorganisation
of loads and will certainly not be aware of co-loaders when the movement is a part load).
It appears that there may be a need to collect partial information about the Transport Chain
from several organisations and for the Collecting Authority to collate this with all the
complication of achieving Unique Consignment References and eliminating double reporting.
Existing systems have difficulty in supplying the information in the structure required. It may
well be that the best solution is for the European Statistical authorities to define the minimum
data set needed for planning, and then to discuss the requirement with European and
National Trade bodies, with a view to obtaining Memoranda of agreement that individual
organisations will include the requirements as they redesign and replace their internal

- 50 -
systems over the next decade or so. However, this does not solve the immediate statistical
gathering problem.
Task 5 - Methodology Description
The methodology proposed for the collection of complete transport chain data is set out in the
following paragraphs.
The sample frame should be a list of industrial companies generating consignments. This
frame should be stratified by sector, since the characteristics and complexity of transport
chains used is significantly different between sectors. The frame can be compiled from
business registers classified to industrial nomenclature, supplemented by information from
trade associations. Standard register data needs to be expanded by information about use
of electronic systems for control of transport and logistics operations. Such additional
information will require a preliminary survey enquiry to identify those companies from whom
data can potentially be collected electronically. This preliminary simple survey will identify
those using electronic systems to control logistics, and those using third party logistics
companies. At this stage, it may be necessary to obtain information about the volume of
transport carried out for each company, to be used as part of estimation of the total transport
characteristics.
Collection of data electronically from company systems implies expenditure in setting up the
collection process and links. If this expenditure of resources and/or money is by the
collection agency, then it may be possible to select a fractional sample of the population from
which the total picture can be estimated. However, the concept is that data on all transport
chains used by each company will be collected. Even if the costs are met by the collecting
agency, some companies are likely to be reluctant that only their data be used to represent
the whole sector. If set-up and collection costs are to be met by the companies, this
reluctance will be reinforced.
A separate set-up is likely to be required for each company, taking account of the technical
difficulties. Once in place, electronic data collection will then be straightforward. Validation
and correction procedures will be required, although the setting up process should enable
standardisation of data collected. The reason the process is expensive is because the basic
information is not in a standard form.
5.5 Shippers Survey (WP6)
As indicated in Section 2 of this report the research tasks attributed to the Shippers surveys
part of MYSTIC had two objectives:

- 51 -
To develop a behavioural analysis of the modal choice for international transport chains
To produce a methodology for estimating Origin/Destination international transport chain
freight matrices.
To fulfil these objectives, two surveys were carried out: an in-depth survey of shippers in
France and in the Netherlands in relation with their exporting activities, another one devoted
to the volume of international trade. Most resources wee spent on the first survey in order to
fix the behavioural organisation of shippers.
In many aspects the shippers surveys in MYSTIC were very innovative. Not only did they
provide a deep and new source of information on the transport chain organisation of
international flows of these two countries, but also they constituted a basis for a wide
approach of freight transport of other countries. The question arises at the end how the
experience built up to develop the following orientations in the shippers surveys in MYSTIC,
could serve to expand the approach on a European scale:
Testing the feasibility of tracing international flows and capturing intermodal chains
through dedicated shippers’ surveys
Understanding the influence of the organisation of the transport chain on the physical
flows
Identifying the logistic determinants of the freight transport
Experimenting with methods to combine shippers’ surveys quantitative results with
traditional customs and modal data to produce the real o-d matrices region to region
The behavioural research task was therefore to develop an analysis of the organisation of a
transport chain and subsequently develop new statistical methods aiming at building up
transport chain matrices of fl ows. Parallel to the behavioural shipper survey, the o-d shipper
survey was held in order to estimate the level of trade by activity and on a region-to-region
basis. The focus lies on the France – The Netherlands flows and shippers were surveyed in
the Netherlands. The objective was to fix whether and to what extent a limited survey among
firms might be an instrument of estimation of total international demand for transport on a
regional level. If successful it would be a promising method, helping to fill current and growing
statistical gaps. Combined with the behavioural model and possibly other sources and
methods, it might offer a tool for building up a multimodal European database of freight flows.
As detailed in the Inception Report, the Shipper Survey has been divided into 10 sub tasks as
follows
ST 1 Lessons of the past and effects for MYSTIC

- 52 -
ST 2 Lessons of other RTD projects
ST 3 Preparation of the sample
ST 4 Selection of survey method
ST 5 Methodological approach of the behavioural problem
ST 6 Establishment questionnaire and test
ST 7 Actual surveying
ST 8 Analysis of results
ST 9 Development of an OD method
ST 10 Development of a behavioural model
A summary of those sub tasks are described in the Inception Report:
The following paragraphs describe progress with the Work Package in more detail
Tasks 1 and 2 Lessons of the past and effects for MYSTIC and lessons of other RTD
projects
Task 1 was completed with the production of a report by INRETS on “Lessons of the past -
the French experience” which drew upon past shippers surveys carried out in France to
identify where changes should be made and where ideas could be carried forward. A draft of
a report for Task 2 (“Lessons of other RTD projects”) was produced by AGDER. Two
shippers' surveys were described in detail for Task 1
Large-scale Dutch shippers survey 1987
French shippers survey 1988
Also three other surveys were described in less detail:
Shippers survey port choice model 1989
Shippers survey mode choice 1990
NIPO survey 1996 (NIPO is a Dutch market research institute)
From the literature study it appeared that the Dutch surveys were seldom used (for various
reasons) for modelling or a more in-depth analysis. On the other hand, the French survey was

- 53 -
used in a large number of projects. The success of the 1988 French survey in the past was
one of the reasons for using this approach in the MYSTIC survey.
Tasks 3 and 4 Preparation of the Sample and Selection of Survey Method
In order to assist the design of the MYSTIC shippers survey for tasks 3 and 4, the following
were obtained:
translation into English of the questionnaire from the Nord Pas de Calais shippers survey which is a project which has begun with shippers in that region who have international chains
the production of an economic typology and a transport typology of shippers in the Netherlands by NIPO;
the production of international road transport flows by region in the Netherlands and France by CBS;
a synergy typology analysis NIPO / CBS: common definition of sectors of activities and CBS tables of number of firms per SBI sector
a comparison of O - D analysis issued from the NEAC system with French custom information by INRETS;
analysis of Kompass business data by INRETS;
an approach to the INSEE economic database by INRETS.
For task 4 much work was done on the typology of the shippers in relation to the constitution
of the matrices on a regional level. It was concluded that a two-step approach would be taken,
separating the problem of total transport demand (economy related) from the question of the
type of transport chain (transport related). This would lead to an O - D matrix of the total
volume of exchanges between regions by sector of activity / type of goods and a separate
register of the organisation of the transport of the exchange of these goods.
Task 5. Methodological Approach of the Behavioural Problem
The structure of the survey allows three main levels of investigation, each one including one
or several types of questionnaire forms:
The establishment level with the pre-interview and the establishment forms,
The shipment level with 3 selected shipments by establishment,

- 54 -
The transport chain level by questioning all the operators who are involved in the
transport process of the shipm ent (operator questionnaire) and describing the provided
transport services (journey leg questionnaire).
Structure of the survey
Task 6. Establishment Questionnaire and Actual Survey
These two tasks were the major part of WP6 and covered the survey process. This covered a
number of discrete steps as detailed below:
In the case of the pre-questionnaires and establishment questionnaires the first step
concerned questions about the economic and logistical characteristics of the firm. This part
was filled in with the director or the representative of the logistics and transport department to
whom a pre-questionnaire has been previously sent by mail.
The surveys carried out in the past did not include such pre-questionnaires. This preliminary
step was introduced in order to collect into the same form the main requested figures
concerning the firms activity. The idea was to let the respondent know about the approach
followed in the survey and to gather the required figures prior to the interview. It was also to
reduce the total time of the face-to-face interview. The questions covered
The yearly volumes the establishment has shipped
The shipments distribution by weight
The shipments geographic breakdown by large destination zones

- 55 -
The organisation mode of the shipments and the relation between the used transport
means and the large destination regions
The availability of container handling equipment and vehicles or containers on own
account.
In the face-to-face questionnaire, the previous questions were completed by information on:
Firms activity and size
Regularity of the sales along the year, and months of full activity for sales
Storage conditions
Trading partners with number of customers accounting for 80% at least of the turn-over
Accessibility and distance to different transport means
In relation with the WP5 aims, use of computerised information system recording the
transport movements
The second level of investigation referred to the shipments. The process was to select at
random three shipments among a list of ten.
The common questionnaire for all shipments asked the following types of questions:
The departure time of the shipment
The destination location and the nature of the customer
The yearly shipped volumes to this customer, in tons and in number of shipments
The modalities of the order
The product constituting the main shipment's weight and the eventual special transport
features as hazardous goods, controlled temperature, fragile products
The value of the shipment
The weight of the shipment
The conditions of departure
The mode of appearance of the shipment or load

- 56 -
The transport « exchange terms » determining who was contractually in charge of the
transport operation.
The procedure of identification of the different operators involved in the transport of the
shipment is one of the key-dimensions of the survey. The procedure (the same as used with
success in the last 1988 French survey) consisted of identifying the operators according to
the logic of contacting-contacted. Each interviewed person is asked to give the address of
those that he or she has contacted to organise the transport of the shipment, from one
operator to another, up to the complete reconstitution of the chain.
The final component is the reconstitution (operator questionnaire) and physical chain
(journey leg questionnaire). The survey was carried out by phone, among all the identified
operators. The questionnaires were related to the different profiles of operators: customer,
carrier or transport auxiliary, other shipper establishment or specific cases as the carrier of
the empty combined unit.
The first aspect of the operator questionnaire, the customer or consignee questionnaire, the
first question allows checking whether the customer has ordered for its own establishment or
for another one. In the last case, when the customer appears as a central buying office, only
the information related to his part in the transport was collected. This concerns the gathering
of the name and address of possibly contracted carriers and of the establishment for which
the order has been given and which will be surveyed next as the final consignee.
For other customers or final consignees, the collected information related to:
The main activity of the firm, its nature (production unit, warehouse, wholes ale or retail
shop) and its size (number of employees of the establishment and of the company it belongs
to),
The conditions of access to the main transport facilities,
The arrival time of the shipment, the agreed schedule upon this arrival time and the
possible shipment delay.
The particular case when the consignee is not a customer but a logistical operator was also
taken into account, including the identification of the principal (i.e. the agent who has given
the order of transport, generally either the shipper or his customer). Furthermore the type of
services which are provided are described: operations on goods as packing, labelling, or
products fitting, warehousing, dispatching on other destinations at local, regional, national or
international levels.

- 57 -
In the remaining part of the questionnaire the customer was asked the same questions as the
shipper on the division of the transport operation. If the customer had no part in this transport,
the questionnaire ended. In other cases he was questioned about his role in the shipment:
Type of transport (on own account or hired transport),
Carriers and third parties contacted,
Criteria for choosing the transport,
Transport price paid by the customer or consignee.
In the case of carrier or transport questionnaire these operators are questioned about the
characteristics of their firm with information notably on their nationality, the number of
employees of the establishment and their belonging to a multi-establishment company or to
an international group or network. The rest of the questionnaire allowed identification of the
place of the operator in the whole organisational and decisional chain with:
The identification of the principal:
The nature of the economic links with this principal;
The intervention of the carrier in the choice of the transport and his choice criteria;
And, as for all operators, the appeal to third parties with the identification of the operators
to which they have subcontracted the totality or a part of the operations they were in charge
of.
This information was completed by the already obtained information concerning the charge
split between the shipper and the customer and their role in the transport organisation. It then
allowed building chain variables that described:
Who is at the origin of the chain;
To how many carriers the shipment has been entrusted (operators of first level);
The appeal to subcontracting relations;
The type of this subcontracting:
- Simple subcontracting when the operators subcontract to only another one,
- Multiple subcontracting when they subcontract to several others,
- Subcontracting in line when there are several successive subcontracts.

- 58 -
The last part of the questionnaire concerns the price that the carriers or transport auxiliaries
invoiced for their services. With regard to the breakdown of this price for maritime shipments
between the different inland, port and maritime parts and additional data on the type of
maritime transport, and the criteria of choice of the loading port.
In the case of the shipper company questionnaire this questionnaire identifies the cases of
intervention of operators who are not transport professionals: other establishments of the
shipper's company which are involved in the organisation of the shipment or its carriage on
own account, or other shippers supplying transport on own account ("disguised" hired
transport).
Finally, in the case of the empty combined unit questionnaire the questionnaire concerns the
combined shipments departing from the establishment and for which the carrier who has
brought the empty unit is also surveyed. This questionnaire is very short and deals only with
the nature of the principal who ordered the transport for this unit and the place where the unit
was warehoused. The carrier is also asked whether he has made the carriage of the shipment
and in this case the interview goes on with the usual carrier questionnaire.
As referred to in above there is also a journey leg questionnaire. Each operator who has been
involved in a transport is questioned about the number of journey-legs he has undertaken,
counting as many legs as needed stops either to change vehicle or transport mode or to
operate on the goods for consolidation, stuffing, packing, etc.
The collected information allows describing:
The origin and destination of each journey- leg, the nature of these intermediate platforms
and their access to transport facilities
The time of departure and arrival which enables to know both the transport time and the
immobilisation time for logistics operations
The provided services
The transport mode used and the type of vehicle,
The characteristic of the line
The total weight of the load and the corresponding number of customers
It is then possible to describe the physical chains: the combination of modes or vehicles, the
number of legs, and all other characteristics as consolidation, containerisation or various
logistical services provided.

- 59 -
Task 8 Analysis of results
The procedures described above result in two matrices for the sum of all transport modes. A
separate harmonising procedure can adjust the two sets by some averaging method. The
overall fit between the two matrices was good and in view of the exploratory nature of the
MYSTIC project, no harmonising of the two sets of matrices was carried out.
To highlight implications of the calculations, tonnes were summed to four levels in the macro
presentation below:
Intra-EEA, CH area (European Economic Area and Switzerland),
Intra-CEEC (Central and Eastern European countries),
Deliveries from EEA, CH to CEEC,
Deliveries from CEEC to EEA, CH.
All Intra-European goods transport (1000 tonnes) 1997
GDP and
foreign trade
The sum of
transport
modes
Difference in
per cent
1 Intra-EEA, CH 1 431 881 1 432 465 -0.0
2 Intra-CEEC 56 944 58 678 -3.0
3 1 – 2 72 391 73 314 -1.3
4 2 – 1 122 561 121 610 +0.8
5 TOTAL 1 683 777 1 686 067 -0.1
The close results generated by the two approaches do not mean that the actual observable
result in the end might not be different from the projected one in the MYSTIC project. When
the ECMT has produced statistics for 1995 and 1996 by the end of 1999, a follow -up
procedure might adjust factors to this new information that probably will affect the coefficients
used and the contents of the matrices.

- 60 -
The following survey shows the overall Pan-European freight transport development
calculated in the MYSTIC project and combined with matrices produced in the INFOSTAT
project.
All Intra-European goods transport (1000 tonnes)
1989 1990 1991 1992 1994
1 Intra-EEA,
CH
1 094
229
1 117
962
1 140
306
1 178
292
1 256
552
2 Intra-CEEC 29 513 19 343 17 780 25 088 46 716
3 1 - 2 31 294 33 730 36 736 45 748 57 561
4 2 - 1 70 950 63 301 76 175 86 462 100 217
5 TOTAL 1 225
986
1 234
336
1 270
997
1 335
590
1 461
046
The two surveys presented above show the dominating role of transport between countries in
the EEA, CH area. Gross domestic product (GDP) in this area grew at a decreasing rate
between 1989 and 1992 while the level of tonnes transported between the countries was
maintained and even grew much more than GDP between 1991 and 1992. Average elasticity
between tonnes and GDP was about 1.5 in these years.
Between 1992 and 1994 growth in tonnes was above 3 per cent per year and growth in GDP
just above 1 per cent per year. Even though growth in tonnes might have been somewhat
overvalued in 1994 due to the change of statistical regime with the introduction of the Single
Market in 1993, growth in tonnes has to be down by 1.5 per cent if the implicit elasticity
should be as low as the one observed for 1989-1992. The most likely conclusion seems to be
that still overall growth in goods transport between countries in the EEA, CH area was higher
than growth in the overall GDP.
Between 1994 and 1997 transport volumes in trade between countries in the EEA, CH area
accelerated compared to 1992-1994. However, the growth rate of GDP also accelerated and
was on average 2 per cent per year between 1994 and 1997. The implied elasticity between
tonnes and GDP was 2.25 in the period.
- 61 -
Between 1994 and 1997 transport volum es in trade between countries in the EEA, CH area
accelerated compared to 1992-1994. However, the growth rate of GDP also accelerated and
was on average 2 per cent per year between 1994 and 1997. The implied elasticity between
tonnes and GDP was 2.25 in the period.
Trade between CEEC countries decreased for some years after 1989, but seems now to be
increasing. The same tendency has applied to exports from the CEEC countries to countries
in the EEA, CH area. Exports from the EEA, CH area to the CEEC countries may have grown
all the time, but the level of exports is less than the level of imports from the CEEC countries.
Task 9 Development of an OD method
The goal of the origin-destination (o-d) survey is to test whether it is possible to collect a
reliable o-d matrix of the total volume of exchanges between regions (by commodity group
and by mode of transport) on international relationships, using a short questionnaire.
The reason such an approach is tested is that it becomes more difficult to retrieve reliable o-d
data caused by the implementation of the internal free market within the European Union.
Information that used to be known is missing because the registration of some variables has
been shifted from the member-state border to the community border. In general no
international o-d information on regional level is available. According to the new directive on
road transport, interregional transport information will be collected, however not on the initial
origin and final destination of the good transported if different from the points of loading and
unloading, respectively. Therefore, alternative methods have to be found to fill these gaps in
information.
The shipper survey is an opportunity to test the approach. Appointments have been made
with shippers and they had to answer a (large) number of questions. Therefore, it requires a
relatively small effort to introduce a few extra questions. No specific shippers have been
selected for the o-d survey, all shippers exporting or importing to or from France that were
questioned in the large shipper survey were also questioned for the o-d survey.
The o-d survey is carried out amongst Dutch shippers in the shipper survey. This has been
done because in the Netherlands information is available for the total population of exporting
and importing Dutch firms in relation with France. This information is not available for French
firms. The availability of this information is crucial in order to raise the sample to a total for the
population on the o-d-relation.
The following information is gathered for the o-d relations:
Origin region (place of the establishment; from the shipper survey)

- 62 -
Destination region
Commodity group
Mode of transport
Total yearly weight (in tons)
Total yearly value
Activity of the Dutch establishment (from the shipper survey)
Number of employees from the Dutch establishment (from the shipper survey)
Task 10 Development of a behavioural model
Not only the MYSTIC project can show the technical possibility to apply the transport chain
concept developed by INFOSTAT, but it will also contribute to a better understanding of the
organisation of this transport chain inside international trade and particularly of the modal
choice. As such the behavioural analysis will contribute to identify and to measure those
explanatory variables that are required in the future European Transport policy Information
System (ETIS) as instruments of policy decisions.
The period January to June 1999 was used to hold the surveys in France and in the
Netherlands. A maximum of 300 exporting firms and 3 shipments by firms have been
surveyed in France and in The Netherlands, in a number of regions and activities. Destination
of the shipment might be all over in the world, depending upon the type of transport chain,
which is used.
The principle of the survey was to trace the logistic/transport organisation from the production
place to the destination, surveying also the transport legs that are used. The questionnaire
included 5 parts:
F1 pre-interview
F2 plant questionnaire
F3 shipment questionnaire
F4 operator questionnaire
F5 transport leg

- 63 -
F1 to F3 were face to face, whilst F4 and F5 were telephone interviews. Attention was paid to
the complexity of transport chains in international transport (compared to domestic flows).
Such surveys as just achieved by MYSTIC are quite innovative and complex. For this reason
in the previous period a test phase of the questionnaire and the clustering of the firms in
France and the Netherlands took place.
.

- 64 -
6. Conclusions and Recommendations
6.1 Overall Conclusions: Freight
The shippers survey successfully found a methodology for tracing freight shipments from
origin to destination through each link of the transport chain so that a matrix could be built for
each commodity flow. It could also be used for collecting behavioural data about freight. This
is a significant finding because such a methodology had hitherto elided researchers.
Suitably amended, the survey methodology could be scaled-up so as to elicit enough
information from which to build a freight origin-destination transport chain matrix for Europe.
The amendments include reducing the length and scope of the questionnaire so as to only
collect those items of information needed for the matrix. This would reduce the cost per
interview and improve the success rate. In view of the differences in response rate found in
France to that in the Netherlands the survey methodology would need to be adapted to suit
individual countries. It was found to be absolutely essential that the member government
should sponsor the survey. They should provide visible backing for the survey, as shippers
are reluctant to respond to non-governmental initiatives. If behavioural data were also
required then a sub sample could be given an additional questionnaire. Additional benefit
would be gained by undertaking the survey at the European scale for several reasons. For
example as a transport chain may have links in several member countries, shippers could be
interviewed by their own Nationals – increasing the success rate and reducing the cost per
interview.
For a pan European freight survey, some details would need to be worked out during the
piloting stages especially to adapt the questionnaire to local circumstances. The cost of the
complete survey is likely to be high and would need to be set up as a rolling programme with
Eurostat taking the lead - although due to the initial research nature of the survey it would be
best to instigate the survey as part of the European research programme. Based on the
French experience the fieldwork cost per country could be in the region of 0.5m euro for more
or less complete coverage and for 15 countries with initially one-third coverage this could cost
in the region of 2.5m euro. To this should be added the survey design and analysis costs that,
if combined with the recommended passenger research project (see below), could cost about
1m euro bringing the Freight costs to 3.5m euro for the freight component. The rolling
programme could cover the other two thirds over the rest of a ten-year period under the
auspices of Eurostat.
The data would be put into the o-d database and the organisational framework put in place to
provide information for government and maintain, market and offer users the service of
supplying extracts from the data, matrices and tools. The organisational framework needs to

- 65 -
be set up with great care so as to safeguard the data and maintain the high quality standard
of the data required by member governments. This could be initiated with a research project,
which could subsequently be taken over by Eurostat as a service for member governments,
transport operators and private clients.
The EDI survey showed that the information required (i.e. origin, destination and other data
items) did indeed exist in the computer systems of the originator of the consignment although
the data items required usually spanned more than one organisation and spanned more than
one computer system which made automating the process difficult to achieve in the short
term. The availability of the data would lend itself to adopting paper-based interview methods
to elicit o -d freight flow information.
When taken together the shippers survey and the EDI results show that paper based
interview methods with a short interview, referencing the company’s computer systems (if
they are exist), could be an effective basis for a methodology for estimating the pan European
freight commodity o-d matrix.
However the opportunity should be taken to introduce a EU wide standardised freight data
collection format now - because the timing is optimum. The industry (particularly that
associated with the logistics operator and with just-in-time manufacture) is undergoing rapid
change and in response software suppliers are redesigning their software. The opportunity
now arises, if an EU-wide standard is introduced, that EDI software suppliers would design-in
the new standard so that future releases would have the new standard embedded. If the
standard was so designed this could provide the platform needed for EDI to be successful.
It is possible to set out specific recommendations for a common Europe-wide electronic data
exchange standard that could then be taken up by the IT industry, along the lines of the
essential data inputs set out in Deliverable 5. These can be summarised as follows:
What? (describes the object being transported)
Commodities as defined, and by:
Weight
Volume
(consider floor space)
Type (see below)
Hazardous/Non-hazardous
Temperature Control (if applicable)

- 66 -
Value
Tariff (cost of transport)
Fragility
How? (identify all links and modes of the total chain of transport)
For each link:
Mode of Transport (Road, Rail, Sea, Air), and by:
Origin
Type of Packaging
Unit
Carrier (i.e. means of transport)
Shipping Document
Liability Convention
Terms of Sale
Start Time
Planned Finish Time
Actual Finish Time
Transhipment (if relevant), including:
Point of transfer
Environment
Method
Intermediate Destination (Repeat as necessary ...)
For Whom?
Shipper/Consignee
Name

- 67 -
Company structure
Domicile
Final Destination
By Whom? (identify the nature of the carrier(s) for each link defined under “How”)
Company
Name
Company structure
Domicile
Means of Communication
Appendix 1 of Deliverable 5 provides more detail.
6.2 Overall Conclusions: Passengers
The study was successful and our ideas about the methodology required to produce a pan
European passenger o-d trip matrix were honed-up into a workable methodology that is
outlined below. The case studies demonstrated that the overall approach outlined here can be
used to build a the trip matrix and that existing data can make a valuable contribution to
producing the pan European passenger o-d trip matrix. The study showed the importance of
establishing an organisational structure, which secures sensitive data and provides as free a
flow of information as possible within the constraints that data owners place upon the use of
their data by others. The database approach provides a framework within which this can be
organised optimally.
The continuity of keeping the pan European passenger o-d trip matrix as a working tool was
successfully addressed with the database approach whereby the data is held in a database
which can be added to as data becomes available and matrices can be built from it – matrices
which can be used at both a detailed scheme appraisal level and at a pan European level for
policy analysis.
The case studies highlighted additional problems and showed the way they could be
overcome. They showed the use and limitations of using existing data and highlighted the
need to collect a consistent set of new data with which to both harmonise existing data and to
add valuable additional information (e.g. about trip lengths, frequency, market segmentation,
spatial detail etc).

- 68 -
In summary, therefore, the passenger component of the MYSTIC project has provided a
comprehensive ‘toolbox’ consisting of a methodology for merging heterogeneous datasets
plus the software for actually carrying out the processes. The project has achieved its
purpose in developing a methodology for creating a pan-European passenger o-d matrix. It
has also successfully achieved its detailed objectives that were as follows;
To bring together heterogeneous data sets from a number of European countries and
merge them into a pan-European o-d matrix covering road and rail
To develop mathematical and statistical tools and techniques that would be used by the
case studies,
To develop a detailed UK based o-d matrix to show how datasets could be held in a
database for use in infrastructure scheme design and development
To develop a strategic pan-European o-d matrix using existing data to determine the
contribution existing data can make to the overall pan-European matrix
6.3 Proposed Methodology for building the Pan-European Passenger Matrix
The success of the UK case study in scaling-up the regional on-system o-d database and
matrix building methodology to a national scale gave confidence that it could also be applied
to help produce the pan-European passenger o-d matrix. The overall components of the
methodology for producing this trip matrix are set out in the following paragraphs
Existing o-d datasets: e.g. household o-d interviews, on-system o-d interviews (i.e. at
roadside, on-train and at-airport), already-constructed o-d matrices: The study showed that
these existing data sources could make a valuable contribution to the matrix. Other data is
needed to harmonise individual data sets into a common specification.
A new Pan European household travel diary survey: This is a survey of all long-distance
travel that a sample of households make in a predefined period. It should be sampled so as to
provide a complete representative cross section of travel. The data provides valuable
information that is consistent across all modes. It could be used to provide matrix cells, to
harmonise other data, to help with synthesising and to provide a consistent market
segmentation schema.
A new Pan European passenger roadside and on-system interview o-d survey: This
would be a major new survey undertaken in association with member governments, instigated
with an EC research project which would design and undertake the first phase of a rolling
programme of surveys which could be handed over to Eurostat to continue as a rolling
programme. The on-system interviews would comprise roadside, on-train and at-airport
interviews at locations where major international transport links cross a particular screen line

- 69 -
e.g. at a natural barrier. We recommend undertaking an initial 250 interview sites on important
road, rail and air links at major European screen lines. Subsequent phases in the rolling
programme would address other screen lines over a ten-year period. Typical sample fractions
would be 10% of all travellers crossing the screen line. The data from this would provide
robust estimates of all cells that traverse the screen line and as such builds -in to the matrix a
relatively high level of reliability.
Encourage National Governments to build national o-d databases: A Government
collects on-system o-d data for planning new transport infrastructure and services. This data
is often not held centrally and can be much more useful assembled into a National database
for matrix building. The MYSTIC toolbox can help member governments in this process and
can help in connecting National o-d databases together.
Assemble other o-d data: Transport operators and others collect o-d data for planning new
transportation and operating their services. This data can be used to build the matrix and it is
important to elicit the support of all data owners to contribute data and make use of the
matrix. Existing ticket sales data would also be included. This would help derive rail and air
o-d matrices. The air ticket sales data can be treated with the methodology developed for the
UK case study to derive origin-destination passenger trip matrices in conjunction with the
European household travel diary survey.
Merging and combining the above different types of o-d data: The methodological
advances made by MYSTIC can be used and built upon to improve the matrix. The
methodology itself can be improved with further research
The data would be put into an o-d database and the organisational framework put in place to
maintain, market and offer users the service of supplying extracts from the data, matrices and
tools. The organisational framework needs to be set up with great care so as to safeguard the
data. This could be initiated with a research project, which could subsequently be taken over
by Eurostat as a service for member governments, transport operators and private clients.
The service is unlikely to cost a lot to operate (provided the new data collection costs are
excluded) and if successful could be self financing.
It may be that certain member governments want to set up and operate their own o-d
database that should be welcomed. In these cases Eurostat would need to set up data
linkages with the organisational framework to support it so that data could be swapped with
ease.

- 70 -
6.4 The Way Forward
We recommend the Commission organise a research project to design, set up and initiate the
first phase of a rolling programme of passenger screen line o-d surveys and freight ‘shippers’
o-d surveys. The project would also set up the combined passengers and freight o-d
database together with the service to supply information to government (and others), set up
the database maintenance, marketing and support as well as providing a general service of
supplying matrices and tools to users. Operating the database could become a near self-
financing service, run on a five year rolling contract from the commission with the organisation
undertaking analysis for the Commission and acting as a focus for data supply to others.
The o-d database could comprise the new survey o-d data together with the pan European
household travel diary o-d survey data, rail and air ticket sales data, counts and other non o-d
data. The project could use the o-d database to build the pan European passenger and freight
o-d matrix as described above. To support this activity the project would need to research
methodologies for matrix merging, combining and improving and develop the tools which
could be made available to member governments and data contributing organisations. The
project could develop computer linkages with other databases proving exchange of data with
them and so that the data can be used to improve the matrix. The project should provide a
focus of expertise for o-d data and its uses and support the activities of researchers, analysts
and modellers.
Against a background of increasing competition and privatisation, it can take considerable
time to gain the support and confidence of some organisations. In order to provide optimal
chances for success it would be best if the timescale for the project were of sufficient length to
help achieve its objectives. The surveys are likely to take three years to plan, execute and
integrate with the other data to produce matrices. It could be preferable to extend this to four
years so as to gain the support of as many organisations as possible. The project could set
up the system in such a way as to effect a smooth handover to Eurostat after the four years.
The main part of the research project would need to cover the other components listed above:
collation of other data (existing o-d datasets, ticket sales data, household travel diary data,
non o-d data), methodological research (into matrix building and improving) as well as
building the database (passengers as well as freight) and matrix (including harmonisation,
building, combining, merging and improving). It would also need to cover the passenger
survey design and analysis. This is likely to cost in excess of 1.5m euro.
The new passenger screen line o-d survey is likely to cost 3m euro including fieldwork,
address coding and data processing (but excluding the survey design and analysis costs
which would be part of the main research project). The new freight ‘shippers’ o-d survey could
cost 3.5m euro including fieldwork, survey design and analysis costs. The main research

- 71 -
project is likely to cost 1.5m euro that with the surveys could give a total project cost of 8m
euro. The project should deliver a pan European passenger and freight o-d matrix using the
above methodology. It should instigate a rolling programme of passenger and freight o-d
surveys covering a ten-year period, which should be repeated so that the matrix is never
more than ten years out of date.
6.5 What Will This Provide?
The pan European passenger and freight o-d matrix would be invaluable in a whole raft of
ways – ways vital to the success of Europe plc, and European commerce and welfare as well
as to the European transport system. It could provide valuable base statistics so as to help
governments plan both their economies and their transport policy. It could help governments
improve the quality of their trade statistics and help plan the freight distribution systems so as
to provide the best balance between being both effective and environmentally friendly. It could
provide information about the demand for travel and allow inter country comparisons of
mobility, trip patterns, trip length, trips per citizen etc so that policies can be targeted at
locations where they are most needed. It could support modelling, which could open up the
whole field of forecasting and allow analysis of what-if scenarios, alternative -pricing
mechanisms etc to show their impacts on the transport networks.
The o-d matrices at member government level would fit together at country borders so that
countries themselves can plan their transport system knowing that the data fits together with
that of their neighbours. This is particularly important for those countries that have problems
with transit traffic.
Infrastructure providers could use the o-d matrices to help plan their schemes, services and
operations. This is as important for appraisal of the TEN’s as it is for the other parts of the
transport network.
European rail transport is key to maintaining mobility in Europe in the long term. However
train operators are faced with the need to capture new markets from road when at present
they have no idea how big this market is, where it wishes to travel to, its detailed market
segmentation and how to influence it. The o-d matrix together with its supporting database
could help understand these markets for them and play a key role in capturing road travel,
passengers and freight.
The o-d database could provide a consistent set of data, matrices and tools for European
policy analysis, member Government policy analysis, infrastructure appraisal, transport
planning and network operational optimisation. The consistency of the database will help

- 72 -
ensure that differences of view are not based on differences in the information used to
support them.
O-d data is very expensive to collect and is a valuable resource. In many cases this valuable
resource is simply thrown away. It should be assembled, stored in a database as a resource
for the future - and used. The recommended approach of assembling a pan European o-d
database could provide a fundamental and valuable resource for the future – for everyone

- 73 -
7 References
Beardwood, J.E. (1980) Sub-sample and Jack-knife: A general technique for the estimation
of sampling errors, with applications and examples in the field of transport planning.
Transportation Research, 24A, pp 211-215.
Cascetta, E. (1984) Estimation of trip matrices from traffic counts and survey data: a
generalised least squares estimator. Transportation Research, 18B, pp289-299.
Cascetta, E. and Nguyen, S. (1988) A unified framework for estimating or updating
origin/destination matrices from traffic counts. Transportation Research, 22B, pp437-455.
Clavering, J., Watson, S., Collop, M. and Hyman, G. (1997) Removing double counting
from RSI databases. Proc. 25th European Transport Forum, Seminar F. PTRC, London.
Department of Transport. (1981) Traffic Appraisal Manual. Department of Transport,
London.
Department of Transport (1982) Trip Matrix Building and Validation Program Suite, User
Documentation. HECB/R/27. Department of Transport, London.
DETR. (1997) Removing double counting from RSI databases, Final Report. Department of
the Environment, Transport and the Regions, London.
Gaudry, M. (1999) SPQR – The Four Approaches to Origin – Destination Matrix Estimation:
Some considerations for the MYSTIC Research Consortium. Montreal: University of Montreal
Gunn, H.F. and Whittaker, J.C. (1981) Estimation errors for well-fitting gravity models. ITS
Working Paper 149. Institute for Transport Studies, University of Leeds, Leeds.
Gunn, Mijer, Lindvelt and Hofman (1997) Estimating base matrices: the combined
calibration method. Proc. 25th European Transport Forum, Seminar E. PTRC, London.
Hajek (1977) Optimal sample size of roadside interview origin-destination surveys. Report
RR208. Ministry of Transport and Communications, Ontario.
Kirby, H.R. and Murchland, J.D. (1981) Gravity model fitting with both origin-destination
data and modelled trip-end estimates. Proc. 8th Int. Symp. on Transportation and Traffic
Theory, pp 348-375.
Kuwahara, M. and Sullivan, E.C. (1987) Estimating origin-destination matrices from
roadside survey data. Transportation Research, 21B, pp233-248.

- 74 -
Logie, M. and Hynd, A. (1990) MVESTM matrix estimation. Traffic Engineering and Control,
31, pp 454-459, 534-537 and 541-544.
Maher, M.J. (1983) Inferences of trip matrices from observations on link volumes: a Bayesian
statistical approach. Transportation Research, 17B, pp 435-447.
MVA Consultancy (1993) Deriving best estimates of trips from the RSI database. LATS
Report XV4.01. The MVA Consultancy, London
Spiess, H. (1987) A maximum likelihood for estimating origin-destination matrices.
Transportation Research, 21B, pp 395-412.

- 75 -
ANNEX 1: PUBLICATIONS, CONFERENCES AND
PRESENTATIONS
The following list covers the key events:
Publications:
Gaudry. M. SPQR – The Four Approaches to Origin – Destination Matrix Estimation: Some
Considerations for the MYSTIC Research Consortium. 23 pgs. September 1999, publication
CRT-99-35, Centre de Recherche sur les Transports, University of Montreal
Conferences
November 1999, European Transport Research Conference, Lille. The MYSTIC project was
demonstrated with the aid of an aid of a laptop slide presentation and brochures at a stand in
the main exhibition hall.
September 2000, Association of European Transport, Cambridge. Proposed presentation of
MYSTIC
Presentations
September 9th 1999. Presentation of the MYSTIC results and developments in methodology
to the UIC conference, Paris
September 20 th 1999. Presentation of the MYSTIC results and developments in methodology
to the EUROSIL multimodal workshop, Athens
September 25 th 1999. Presentation of the MYSTIC results and developments in methodology
to the MESUDEMO conference
September 28th 1999. Workshop at EUROSTAT, Luxembourg. This was a formal
presentation by each of the MYSTIC partners about the overall results and conclusions of the
project.
The results and conclusions from the EDI survey have been separately presented at the
following meetings:
February 2000, Automated Customs and International Trade association, Annual Meeting,
London
March 2000. Transport Statistics User Group, London

- 76 -
June 2000. European Commission Concerted Action Meeting on Intermodal Transport,
Brussels (at this meeting the results and conclusions of the shippers survey were also
presented)

- 77 -
ANNEX 2: THE DESIRE LINES
Figure 4.3: Mystic Case Study – Road – NUTS0 – no presentation threshold

- 78 -
Figure 4.4: Mystic Case Study – Road – NUTS2 – no threshold

- 79 -
Figure 4.5: Mystic Case Study – Road – NUTS2 – presentation threshold: >100000 Trips per
year

- 80 -
Figure 4.6: Mystic Case Study – Road – NUTS2 – presentation threshold: >200000 Trips per
year

- 81 -
Figure 4.7: Mystic Case Study combined with STREAMS – Road – NUTS0 – no presentation
threshold

- 82 -
Figure 4.8: Mystic Case Study combined with STREAMS – Road – NUTS2 – presentation
threshold: >200000 Trips per year
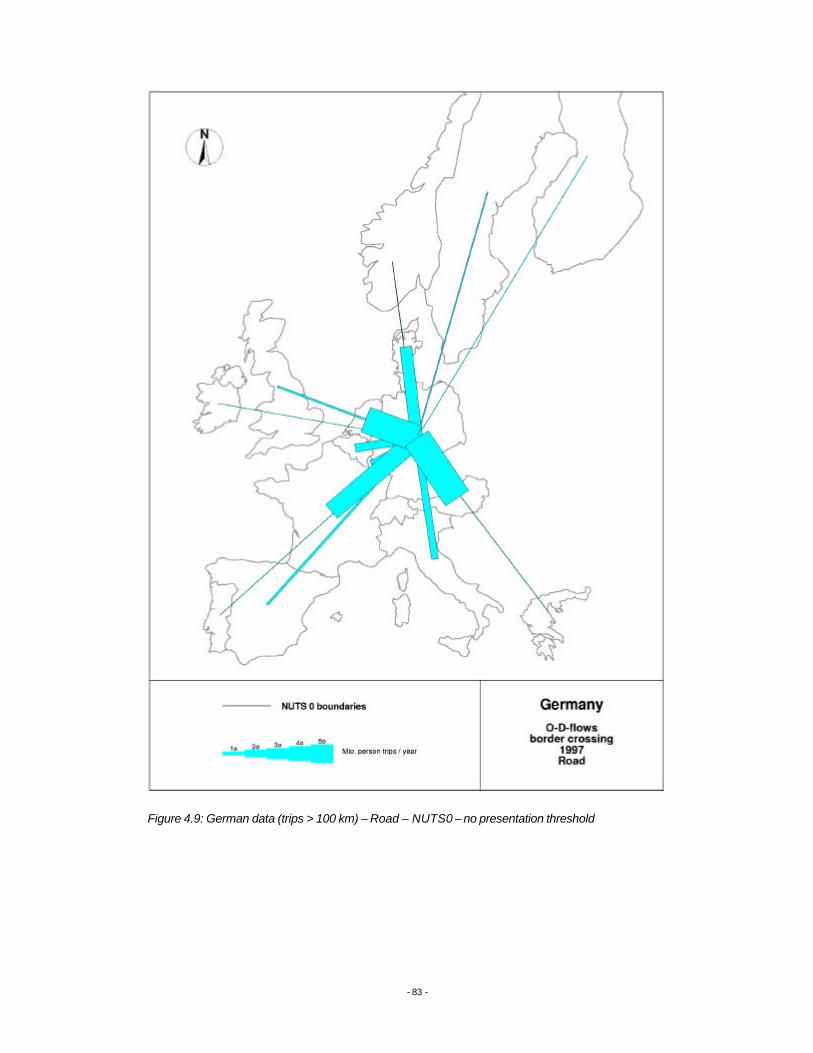
- 83 -
Figure 4.9: German data (trips > 100 km) – Road – NUTS0 – no presentation threshold

- 84 -
Figure 4.10: German data (trips > 100 km) – Road – NUTS2 – presentation threshold:
>200000 Trips per year