national report - moe
TRANSCRIPT

Ministry of Education
National Education Research and Evaluation Centre (NEREC)
Financed by:
World Bank-funded Transforming the School Education System as the Foundation of a Knowledge Hub Project (TSEP)
May 2015
National Report
National Assessment of Achievement of Students Completing Grade 8 in Year 2014 in Sri Lanka

National Report
National Assessment of Achievement of Students Completing Grade 8 in Year 2014 in Sri Lanka
Ministry of Education
National Education Research and Evaluation Centre (NEREC)
Financed by:
World Bank-funded Transforming the School Education System as the Foundation of a Knowledge Hub Project (TSEP)
May 2015

ii
© Ministry of Education, Sri Lanka and
National Education Research and Evaluation Centre (NEREC)
Faculty of Education, University of Colombo, Sri Lanka
ISBN 978- 955-1187-26-2
First Published May 2015
Writers: W. Chandradasa
Lakshman Wedikkarage
Sample Selection: Jude Nonis
Data Analysis: W. Chandradasa
Nishara Fernanado
Proof Reading: Jeevani Herath
Data Processing: Nayanie Gamaethige
M.H.S.F. Mahsanie
Nadee Gamaethige
Anuradha S. Seneviratne
Varuni Gurugamage
K.P. Ganga Udeshika
K.M. Kanishka Karunanayake
Devinda Wijethunga
Jayathu Amarasinghe

iii
Acknowledgements
First, I wish to express my sincere thanks to the Ministry of Education for
commissioning the National Assessment of Achievement of Students Completing Grade
8 in Year 2014. I must thank Hon. Akila Viraj Kariyawasm, Minister of Education for his
guidance. I am also thankful to Mr. Upali Marasinghe, Secretary, Ministry of Education
for his kind cooperation during various stages of this study. Furthermore, I must thank
Mr. S.U. Wijerathna (Additional Secretary - Policy, Planning and Performance Review),
Dr. (Mrs.) Madura Wehella (Director of Education – Policy and Planning), Dr. Jayantha
Balasooriya (Deputy Director of Education – Policy and Planning) of the Ministry of
Education and Ms. Gayathri Abeygunasekara (Commissioner of Examinations –
Research and Development, Department of Examinations) for their generous support.
I am grateful to the World Bank for financing the “National Assessment of Achievement
of Grade 8 students in Sri Lanka - 2014”. The immense support rendered by
Dr. Harsha Aturupana (Lead Education Specialist, World Bank), Ms. Mari Shojo
(Education Specialist, World Bank) and Professor Upul Sonnadara (University of
Colombo- Consultant to the World Bank) to make this study a success, is highly
appreciated.
I am also thankful to Prof. Lalitha Mendis, Acting Vice-Chancellor of the University of
Colombo for her cooperation and Dr. Kumara Hirimburegama, the former Vice
Chancellor of the same for granting permission to implement the research project,
Professor W. Chandradasa, Dean, Faculty of Education for his guidance throughout the
research.
I am also deeply indebted to all the other members of the research team, namely,
Prof. Marie Perera, Prof. M. Karunanithy, Mr. Jude Nonis, Ms. R.D.C. Niroshinie,
Ms. Kumudu Seneviratne, Ms. Sulochana Neranjani and Ms. Jeevani Herath for their
valuable contribution to the research study.
I must thank Mr. Ariyadasa Edirisinghe (former Commissioner of Examinations –
Department of Examinations) for his assistance in administering the all-island
assessments. My gratitude also goes to all the examination coordinators, school

iv
coordinators all over the country who participated in test administration and all other
professionals at provincial, zonal and school levels who contributed in numerous ways
to carry out this study.
Last but not least, the support extended by Ms. Nayanie Gamaethige (Office Manager-
NEREC), Mr. K.M. Kanishka Karunanayake, Mr. Sudath Wickramathilaka, the other
members of NEREC, the services provided by Research Management Unit of the
University of Colombo and other various personnel who contributed to this study in
many ways are also very much appreciated.
Dr. Lakshman Wedikkarage
Acting Director
National Education Research and Evaluation Centre (NEREC)

v
Message from the Secretary, Ministry of Education
It is my pleasure and privilege to write this message as the Secretary of Ministry of
Education on the ‘National Assessment of Achievement of Students Completing Grade 8
in Year 2014 in Sri Lanka’. Conducting periodical national assessments is one of the
major activities of the Education Sector Development Framework and Programme
(ESDFP) (2012-2016). This is an important practice which is exercised to reveal the
achievement levels of students in various grades. While it enables teachers to
understand the levels of achievement of students, it also provides an opportunity to
policy-makers to determine the performance of the education system through learning
outcomes, to what extent the educational development programmes and investments
have been successful and what steps should be taken further to upgrade the
performance. In Sri Lanka, recommendations and suggestions of the national
assessments are predominantly used for policy-making purposes and also designing
quality development programmes. Considering the importance of this exercise, the
Ministry of Education (MoE) has planned to continue these assessments periodically
and effectively.
The Ministry of Education, with the financial assistance of the World Bank, has
commissioned the National Education Research and Evaluation Center (NEREC) of the
Faculty of Education, University of Colombo to conduct a series of national assessments
to determine the levels of achievement of students in grades 4 and 8, during the past
several years. Its latest national assessment reveals factors that are particularly
significant in order to enhance teaching and learning, analysed by various aspects such
as types of schools, gender, and medium of instruction, location and competency levels
of students who completed grade 8 in the year 2014.
I wish to extend my sincere gratitude to Hon. Akila Viraj Kariyawasam, Minister of
Education for providing guidance to implement this type of activities which have a
national importance. Further, I also wish to thank Dr. Harsha Aturupane, Lead
Education Specialist, Education Global Practice of the World Bank for providing
technical guidance to carry out this assessment and appreciate the financial assistance
extended by the World Bank though the ‘Transforming School Education Project
(TSEP)’ for this purpose. I also appreciate the NEREC research team for their academic

vi
contributions, hard work and time taken to conduct and complete this study on time.
Finally, I thank Mr S. U. Wijeratne, Additional Secretary, Policy, Planning and
Performance Review Division, Dr. (Mrs.) Madura M. Wehella, Director of Education,
Policy and Planning Branch and Dr. Jayantha Balasooriya, Deputy Director of Education
of the Ministry of Education for their academic and technical contributions and
coordination with NEREC in making this exercise a success.
Upali Marasinghe
Secretary
Ministry of Education

vii
Research Team
W. Chandradasa
Marie Perera
M. Karunanithy
Jeevani Herath
Jude Nonis
R.D.C. Niroshini
Kumudu Seneviratne
Lakshman Wedikkarage - Coordinator

viii
Contents
Acknowledgements iii
Message from the Secretary, Ministry of Education v
Research Team vii
Contents viii
List of Tables xii
List of Figures xv
Abbreviations xviii
Executive Summary xix
Chapter 1 – Introduction to the Study
1.1 Background 1
1.2 What is a National Assessment of Education? 2
1.3 Equity and Excellence 3
1.4 National Assessment Studies Conducted in Sri Lanka 5
1.5 Rationale for the Present Study 5
1.6 National Assessment of Learning Outcomes- 2014 6
1.7 Summary 6
Chapter 2 – Methodology
2.1 Introduction 7
2.2 Objectives of the Study 7
2.2.1 Specific Objectives of the Study 7
2.3 Sampling Methodology 7
2.3.1 Target Population 8
2.3.2 Sampling Frame and Elements of the Sampling Frame 8
2.3.3 Sample Design – Procedure 9
2.4 Framework for the National Assessment 11
2.5 Achievement Tests 12
2.6 Procedures in Administration of the National Assessment 2014 12
2.6.1 Test Coordinators 12
2.6.2 Training Workshop for Coordinators 13
2.6.3 Return of Answer Scripts and Other Documents 13
2.7 Analysis of Data 14
2.8 Summary
14

ix
Chapter 3 - Patterns in Achievement: Mathematics 2014
3.1 Introduction 15
3.2 Achievement Levels in Mathematics at All Island and Provincial
Levels
15
3.3 Distribution of Test Scores of Mathematics 17
3.4 Disparities in Achievement in Mathematics 20
3.4.1 Disparities in Achievement in Mathematics in Relation to
School Type
21
3.4.2 Disparities in Achievement in Mathematics in Relation to
Gender
23
3.4.3 Disparities of Achievement in Mathematics in Relation to
Medium of Instruction
25
3.4.4 Disparities in the Achievement of Mathematics in Relation
to Location of School
27
3.5 Achievement of Mathematics by Competency Levels 31
3.5.1 Achievement of Competency Levels Related to Knowledge
and Skills
32
3.5.2 Achievement of Competency Levels Related to
Communication
34
3.5.3 Achievement of Competency Levels Related to
Relationship, Reasoning and Problem-Solving
35
3.6 Summary 36
Chapter 4 - Patterns in Achievement: Science 2014
4.1 Introduction 37
4.2 Achievement Levels in Science at All Island and Provincial Levels 37
4.3 Distribution of Test Scores of Science 39
4.4 Disparities in Achievement in Science 42
4.4.1 Disparities in Achievement in Science in Relation to
School Type
42
4.4.2 Disparities in Achievement in Science in Relation to
Gender
44
4.4.3 Disparities in Achievement in Science in Relation to
Medium of Instruction
46
4.4.4 Disparities in Achievement in Science in Relation to
Location of School
49
4.5 Achievement of Science by Competency Levels 52
4.5.1 Achievement of Competency Levels Related to Biology 53
4.5.2 Achievement of Competency Levels Related to Chemistry 54
4.5.3 Achievement of Competency Levels Related to Earth
Science
55

x
4.5.4 Achievement of Competency Levels Related to Physics 56
4.6 Summary 57
Chapter 5 - Patterns in Achievement: English Language 2014
5.1 Introduction 59
5.2 Achievement Levels in English Language at All Island and
Provincial Levels
59
5.3 Distribution of Test Scores of English Language 61
5.4 Disparities in Achievement in English Language 64
5.4.1 Disparities in Achievement in English Language in
Relation to School Type
65
5.4.2 Disparities in Achievement in English Language in
Relation to Gender
67
5.4.3 Disparities in Achievement in English Language in
Relation to Medium of Instruction
68
5.4.4 Disparities in Achievement in English Language in
Relation to Location of School
70
5.5 Achievement of English Language by Competency Levels 74
5.6 Summary 77
Chapter 6 - Conclusion
6.1 Introduction 79
6.2 Conclusions Based on the Findings on the National Assessment
2014
79
6.2.1 Achievement Level of Students 79
6.2.2 Distribution of Marks in Achievement 80
6.2.3 Disparities in Achievement 80
6.2.4 Achievement of Competencies 81
6.2.5 Achievement at Provincial Level 82
6.3 Suggestions for Future Action 82
6.3.1 National Level Solutions 83
6.3.2 Provision of Equal Educational Opportunities 83
6.3.3 Quality Development of Teachers 83
6.3.4 Revisiting the Curriculum 84
6.3.5 Incentive Program for Teachers 84
6.3.6 Low-Stakes Testing 84
6.3.7 Scrutiny of Quality Improvement in 1C and Type 2
Schools
84
6.3.8 Gender Disparity 85

xi
6.3.9 The Question of Medium 85
6.3.10 Revisiting Competencies 85
References 87
Series of National Assessments 89

xii
List of Tables
Chapter 2
Table 2.1: Target population 9
Table 2.2: Calculated student sample and school sample per province 10
Table 2.3: Calculated, allocated and achieved student sample per each province 11
Chapter 3
Table 3.1: All island and provincial achievement in mathematics 2014 –
Summary statistics
16
Table 3.2: Distribution of all island achievement marks of mathematics 18
Table 3.3: Mathematics achievement marks according to school type 21
Table 3.4: Distribution of mathematics achievement marks according to school
type
22
Table 3.5: Mathematics achievement marks according to the gender 23
Table 3.6: Distribution of mathematics achievement marks according to gender 24
Table 3.7: Mathematics achievement marks according to medium of instruction 25
Table 3.8: Distribution of mathematics achievement marks according to
medium of instruction
26
Table 3.9: Mathematics achievement marks according to location 27
Table 3.10: Distribution of mathematics achievement marks according to
location
29
Table 3.11: Mathematics achievement mark according to location - Urban /Rural 30
Table 3.12: Distribution of mathematics achievement marks according to
location – Urban/Rural
31
Table 3.13 : Achievement of competency level related to knowledge and skills 32
Table 3.14: Achievement of competency levels related to communication 34
Table 3.15: Achievement of competency levels related to relationships,
reasoning and problem solving 35
Chapter 4
Table 4.1: All island and provincial achievement in science 2014 – Summary
statistics
38
Table 4.2: Distribution of all island achievement marks of science 40
Table 4.3: Science achievement marks according to school type 43
Table 4.4: Distribution of science achievement marks according to school type 44

xiii
Table 4.5: Science achievement marks according to gender 45
Table 4.6: Distribution of science achievement marks according to gender 46
Table 4.7: Science achievement marks according to medium of instruction 47
Table 4.8: Distribution of science achievement marks according to medium of
instruction
48
Table 4.9: Science achievement marks according to location 49
Table 4.10: Distribution of science achievement marks according to location 50
Table 4.11: Science achievement marks according to location - Urban/Rural 51
Table 4.12: Distribution of science achievement marks according to location –
Urban/Rural
52
Table 4.13: Achievement of competency levels related to biology 53
Table 4.14: Achievement of competency levels related to chemistry 54
Table 4.15: Achievement of competency levels related to earth science 55
Table 4.16: Achievement of competency levels related to physics 56
Chapter 5
Table 5.1: All island and provincial achievement in English language 2014 –
Summary statistics
60
Table 5.2: Distribution of all island achievement marks of English language 62
Table 5.3: English language achievement marks according to school type 65
Table 5.4: Distribution of English language achievement marks according to
school type
66
Table 5.5: English language achievement marks according to gender 67
Table 5.6: Distribution of English language achievement marks according to
gender
68
Table 5.7: English language achievement marks according to medium of
instruction
69
Table 5.8: Distribution of English language achievement marks according to
medium of instruction
70
Table 5.9: English language achievement marks according to location 71
Table 5.10: Distribution of English language achievement marks according to
location
72
Table 5.11: English language achievement marks according to location - Urban
/Rural
73
Table 5.12: Distribution of English language achievement marks according to
location – Urban/Rural 74

xiv
Table 5.13: Achievement of competency levels – English language 75
Table 5.14: Performance in writing a brief note 76
Table 5.15: Performance in writing a guided short story 76

xv
List of Figures
Chapter 3
Figure 3.1: Mean values and median values of mathematics marks 17
Figure 3.2: All island achievement in mathematics –distribution of marks 17
Figure 3.3: Provincial-wise distribution of marks – Mathematics 19
Figure 3.4: Mathematics marks representation using boxplot and whisker plot 20
Figure 3.5: Mean values of mathematics marks according to school types 22
Figure 3.6: Distribution of mathematics achievement marks according to school
type
23
Figure 3.7: Mean values of mathematics marks according to gender 24
Figure 3.8: Distribution of mathematics achievement marks according to gender 25
Figure 3.9: Mean values of mathematics marks according to medium of instruction 26
Figure 3.10: Distribution of mathematics achievement marks according to medium of
instruction
27
Figure 3.11: Mean values of mathematics marks according to location 28
Figure 3.12: Distribution of mathematics achievement marks according to location 29
Figure 3.13: Mean values of mathematics marks according to location – Urban/Rural 30
Figure 3.14: Distribution of mathematics achievement marks according to location –
Urban/Rural
31
Figure 3.15: Achievement of competency levels related to knowledge and skills 33
Figure 3.16: Achievement of competency levels related to communication 35
Figure 3.17: Achievement of competency levels related to relationships, reasoning
and problem solving
36
Chapter 4
Figure 4.1: Mean values and median values of science marks 39
Figure 4.2: All island achievement in science –distribution of marks 39
Figure 4.3: Provincial-wise distribution of marks – Science 41
Figure 4.4: Science marks representation using boxplot and whisker plot 42
Figure 4.5: Mean values of science marks according to school type 43
Figure 4.6: Distribution of science achievement marks according to school type 44

xvi
Figure 4.7: Mean values of science marks according to gender 45
Figure 4.8: Distribution of science achievement marks according to gender 46
Figure 4.9: Mean values of science marks according to medium of instruction 47
Figure 4.10: Distribution of science achievement marks according to medium of
instruction
48
Figure 4.11: Mean values of science marks according to location 49
Figure 4.12: Distribution of science achievement marks according to location 50
Figure 4.13: Mean values of science marks according to location – Urban/Rural 51
Figure 4.14: Distribution of science achievement marks according to location –
Urban/Rural
52
Figure 4.15: Achievement of competency levels related to biology 54
Figure 4.16: Achievement of competency levels related to chemistry 55
Figure 4.17: Achievement of competency levels related to earth science 56
Figure 4.18: Achievement of competency levels related to physics 57
Chapter 5
Figure 5.1: Mean values and median values of English language marks 61
Figure 5.2: All island achievement in English language –distribution of marks 61
Figure 5.3: Provincial-wise distribution of marks – English language 63
Figure 5.4: English language marks representation using boxplot and whisker plot 64
Figure 5.5: Mean values of English language marks according to school type 65
Figure 5.6: Distribution of English language achievement marks according to school
type
66
Figure 5.7: Mean values of English language marks according to gender 67
Figure 5.8: Distribution of English language achievement marks according to
gender
68
Figure 5.9: Mean values of English language marks according to medium of
instruction
69
Figure 5.10: Distribution of English language achievement marks according to
medium of instruction
70
Figure 5.11: Mean values of English language marks according to location 71

xvii
Figure 5.12: Distribution of English language achievement marks according to
location
72
Figure 5.13: Mean values of English language marks according to location-
Urban/Rural
73
Figure 5.14: Distribution of English language achievement marks according to
location – Urban/Rural
74
Figure 5.15: Achievement of competency levels – English language 75

xviii
Abbreviations
EFA Education for All
ESDFP Education Sector Development Framework and Programme
ESS Effective Sample Size
IEA International Association for the Evaluation of Educational Achievement
NEREC National Education Research and Evaluation Centre
PPS Probability Proportional to Size
roh Rate of homogeneity
SD Standard deviation
TIMSS Trends in International Mathematics and Science Study

xix
Executive Summary
National Assessment of Achievement is generally considered as an important
investigation of schools and students (and sometimes teachers) that is designed to
provide evidence about students’ achievements at a particular stage of education, in
identified curriculum areas such as, reading or writing, English language,
mathematics or science. National assessments can play a critical role in
demonstrating the efficiency or otherwise of all other investments in education.
NEREC has conducted National Assessments of Learning Outcomes both at primary
and secondary levels. At secondary level, National Assessments of Learning
Outcomes were conducted for Grade 8 in 2005, 2008 and 2012. This report
presents the findings of the National Assessment conducted in grade 8 for English,
mathematics and science in the year 2014.
The National Assessment conducted in 2012 used new instruments and as such a
comparison of achievement levels with previous years was not possible. It served as
a starting point for monitoring the level and distribution of learning outcomes
overtime. The National Assessment of Achievement of 2014 used the same
instruments that were used in 2012 to test cognitive skills in English, mathematics
and science in keeping with the new competency based curriculum which was
introduced to grade 8 in 2009.
The present National Assessments covered the entire country and the sample was
drawn to enable analysis by type of school, gender, medium of instruction and
location of schools. Patterns in learning achievement were discussed using mean,
median, skewness of the distribution, cumulative percentages and percentile ranks.
Furthermore, graphs including frequency polygons and box plots were also used.
Data gathered through the achievement tests were analyzed on national and
provincial bases in relation to school type, gender, medium of instruction and
school location.
Moreover, to test the generalizability of results, statistical tests such as t-tests and
F-tests were conducted. Findings of the National Assessment in 2014 revealed that

xx
the achievement level of students completing grade 8 in 2014 is above 35 marks in
all three subjects.
Further to the above, the findings revealed that there is disparity in achievement in
all the three subjects in relation to school location, gender, medium of instruction
and school type.
Differences in achievement of competencies related to the three subjects tested can
also be seen in varying degrees.

1
Introduction to the Study
1.1 Background
The World Conference on Education for All (EFA) held in Jomtien in 1990, an extended
vision for meeting learning needs was outlined. This included the requirement to
improve and assess learning achievement (UNESCO, 1990). Hence, a worldwide
emphasis on the need for timely and credible data on student learning, that may inform
the design of effective mechanisms to improve educational outcomes, rather than only
on education inputs has become a primary concern among educationists.
In the year 2000, The World Education Forum held in Dakar placed special emphasis on
the quality of Education. This is mentioned in goal no. 6 which states “improving all
aspects of the quality of education and ensuring excellence of all so that recognized
and measurable learning outcomes are achieved by all, especially in literacy,
numeracy and essential life skills” (UNESCO 2000: iv, 7). As observed by economists,
education systems can provide pathways to economic advancement (Ross, Paviat &
Gnevois, 2006). It is often argued that good quality education in terms of increased
learning outcomes ‘in literacy, numeracy and life skills can contribute to increased work
productivity, higher individual income levels, economic and social growth,
improvement in health, and the generation of innovative ideas’ (Saito & Cappelle, 2010:
p5). As a result, there has been an increased global growth in the use of learning
assessments (Kamens & McNeely, 2010).
This is evident in Sri Lanka as well. Being a member country agreed on the World
Declaration on Education for All, it strives to enhance the quality of education by
implementing procedures that will provide information on students’ learning. One such
measure adopted was monitoring student achievement through national assessments at
different Grade levels conducted by the National Education Research and Evaluation
Centre (NEREC).
Chapter One

Chapter One – Introduction to the study
2
1.2 What is a National Assessment of Education?
A national assessment “is designed to describe the achievement of students in a
curriculum area aggregated to provide an estimate of the achievement level in the
education system as a whole at a particular age or grade level” (Kellaghan, Greaney and
Murray. 2009, p.xi). It is an investigation of schools and students (and sometimes
teachers) that is designed to provide evidence about students’ achievements at a
particular stage of education, in identified curriculum areas such as, reading or writing,
English language, mathematics or science. The resolve of a national assessment, in
addition to determining the realization of objectives of learning and how far learning
outcomes have been achieved, is to convey such information to relevant authorities so
that it could lead to improvement in future student achievement thereby contributing to
the decision making process. In other words, the ultimate objective of a national
assessment while determining the achievement levels is to contribute to the expansion
of the quality of students’ learning. According to Kellaghan, Greaney and Murray (2009),
national assessment can throw light on the following issues in education.
Access Obstacles to attending school, such as limited availability of places or distance of
students’ homes from school (or the type of school).
Quality The quality of inputs to and outputs of schooling, such as the resources and
facilities available to support learning (responsive curricula, teacher competence,
textbooks); instructional practices; learner-teacher interactions; and student learning.
Efficiency Optimal use of human and financial resources, reflected in pupil-teacher
ratio, and grade repetition rates.
Equity Provision of educational opportunities to students and attainment of parity of
achievement for students, irrespective of their characteristics, such as gender, language
or ethnic group membership, and geographic location
Chapter One – Introduction to the study
3
Furthermore, according to Kellaghan, Greaney and Murray (2009), all national
assessments seek answers to one or more of the following questions:
• How well are students learning in the education system (with reference to
general expectations, aims of the curriculum, preparation for further learning, or
preparation for life)?
• Does evidence indicate particular strengths and weaknesses in students’
knowledge and skills?
• Do particular subgroups in the population perform poorly? Do disparities exist,
for example, between the achievements of (a) boys and girls, (b) students in
urban and rural locations, (c) students from different language or ethnic groups,
or (d) students in different regions of the country?
• What factors are associated with student achievement? To what extent does
achievement vary with characteristics of the learning environment (for example,
school resources, teacher preparation and competence, and type of school) or
with students’ home and community circumstances?
• Are government standards being met in the provision of resources (for example,
textbooks, teacher qualifications, and other quality inputs)?
• Do the achievements of students change over time? This question may be of
particular interest if reforms of the education system are being undertaken.
Answering the question requires carrying out assessments that yield comparable
data at different points in time?
(Kellaghan and Greaney, 2008, p.9).
1.3 Equity and Excellence
It is generally argued that minimizing inequalities among individuals could be achieved
through general acquisition of education. This will, in turn, lead to reduce inequalities
within and among nations (Farrel, 2002). Theories such as ‘Human capital Theory’ and
different interpretations of them became the bases of increased expenditures on
education around the world in relation to access and equality. Findings of national
assessments in this regard play an important role in informing policy planners of the
quality of education received by students at a given time so that necessary changes to
certain educational practices could be adjusted (World Bank, 2007).

Chapter One – Introduction to the study
4
Over the years, various steps have been taken to enhance the provision of equity in
order to achieve excellence in Sri Lanka. One example is the widening of access to
education through Kannangara reforms which were introduced as far back as 1944 with
a view to providing equity in education irrespective of race, caste or ethnicity
(Sumathipala, 1968). Therefore, one can see that promoting “equity” and “excellence”
and reducing disparities in the education system has been a primary concern of the
Governments of Sri Lanka. In this regard, a comprehensive medium term Education
Sector Development Framework and Programme (ESDFP) from 2006–2010 was
developed (Ministry of Education, 2011). One of the Major areas identified in this
framework is “improving the quality of basic and secondary education” and “increasing
equitable access to basic and secondary education” (p.2) This Framework further
emphasizes, the meaning of equitable access as “each child can access an education
appropriate to his /her individual learning potential and needs” (Pg.4). The plan for the
second stage of the ESDFP for the period 2012 -2017 is an extension of the policy
framework which comprises three policy themes as follows (Ministry of Education,
2013).
Theme 1: Increase equitable access to primary and secondary education
Theme 2: Improve the quality of primary and secondary education
Theme 3: Strengthen governance and service delivery of education
In addition, it provides a foundation theme and a crosscutting activity to ensure the
achievement of policy themes related results and outcomes.
The foundation: Overarching education sector development rolling plan : and
Crosscutting activity: Results – based monitoring and evaluation. (p.1)
Under theme 2 – Improving Quality of primary and secondary education, National
Assessment of Learning Outcomes are expected to be utilized for program
development.

Chapter One – Introduction to the study
5
1.4 National Assessment Studies Conducted in Sri Lanka
National Assessment of Learning Outcomes has become an important component of
education policy analysis and program monitoring in Sri Lanka. The Ministry of
Education in Sri Lanka has commissioned such studies to The National Education
Research and Evaluation Centre (NEREC) of the Faculty of Education, University of
Colombo with the kind patronage of the World Bank.
NEREC has conducted National Assessments of Learning Outcomes both at primary and
secondary levels. At primary level, assessments were conducted for Grade 4 in 2003,
2007, 2009 and 2013 respectively. At secondary level, National Assessment of Learning
Outcomes were conducted for Grade 8 in 2005, 2008 and 2012. The results from these
studies, it is claimed provide “useful information for analysis of policy and the
monitoring of the progress of the education system” (Aturupana, 2009, p.31).
1.5 Rationale for the Present Study
The national assessments conducted in grade 8 in 2005, 2008 and 2012 reveal that on
average there is an improvement in achievement levels of Grade 8 students in Science
and Mathematics. The achievement of the English language, which is the second
language of the students was not assessed in 2008. While there was an improvement in
the achievement of learning outcomes, it was also revealed that there are inequalities in
provision of education in relation to provinces, gender, medium of instruction and
locality (NEREC, 2008). Although, there is a substantial increase in achievement over
the period, the need “for these findings to be supported by further national assessments
in the future, in order to reach a reliable and robust conclusion about the magnitude of
improvement” (Aturupane, 2009, p.33) has been stressed.
Besides, a new competency based curriculum was introduced to grade 8 in 2009.
Therefore, the need to find out in what way the introduction of the new curriculum had
an impact on the learning outcomes was evident. Hence, the national assessment
conducted in 2012 used various competency levels as indicators of achievement in
English, Mathematics and Science. The analysis was done based on percentages of
students who had achieved such competencies in varying degrees. The national

Chapter One – Introduction to the study
6
assessment results in 2012 indicated that ‘there were inter and intra disparities among
provinces, school types, ethnic groups and to a certain extent between genders’ (NEREC,
2013). This report presents the findings of the national assessment of achievement of
students completing grade 8 in year 2014 for English, Mathematics and Science.
1.6 National Assessment of Learning Outcomes- 2014
As mentioned elsewhere, the National Assessment of Learning Outcomes of 2012 used
new instruments to test cognitive skills in English, Mathematics and Science in keeping
with the new curriculum. In 2012, it served as a starting point for monitoring the level
and distribution of learning outcomes overtime. Thus, a comparison of learning
outcomes was not possible. However, a comparison would have been possible if there
had been a repetition of the same test. Therefore, the National Assessment of 2014 used
the same instruments used in 2012 to determine the achievement levels of the students
in English, Mathematics and Science.
The national assessment in 2014 covered the entire country and the sample was drawn
to enable analysis by province, type of school, gender and medium of instruction. This
report presents the analysis of the achievement of learning outcomes related to
cognitive skills. Chapter 2 of this report will discuss the methodology of the study.
Chapters 3-5 will focus on the findings pertaining to the achievement of cognitive skills
in Mathematics, Science and English respectively. The final chapter will emphasize on
the areas that require attention by the educational planners based on the findings of
this study.
1.7 Summary
This chapter discussed the nature of national assessments with particular references to
their aims and objectives in improving the quality of education. Having introduced the
rationale for the present study, it also presented why national assessments are
important in the Sri Lankan context and how useful they are in determining the
achievement levels of students in various subjects in relation to various aspects such as
school type, gender, medium of instruction and school location among many other
determinants.

7
Methodology
2.1 Introduction
In chapter 1, background to the National Assessment of Grade 8 students of 2014 and
the aims and objectives of a national assessment with particular relevance to Sri Lanka
were discussed. This chapter elaborates the methodology used to conduct the present
study in 2014.
2.2 Objectives of the Study
In accordance with the Education Sector Development Framework Programme (ESDFP
2012-2016) and the education sector development plan through sector-wide approach,
the main objective of the study was to determine the achievement of the learning
outcomes of students completing grade 08 in 2014.
2.2.1 Specific Objectives of the Study
I. Assess the extent to which the expected learning outcomes have been
achieved by students.
II. Identify the areas of strengths and weaknesses of student achievement in
relation to subject content and related skills.
III. Examine whether there are disparities in achievement in relation to school
type, gender, medium of instruction, and school location.
2.3 Sampling Methodology
The sampling methodology used for this study was the same as the one used in national
assessment of 2012. It was based on an instructional manual designed by the Statistical
Consultation Group, Statistics Canada in Ottawa. This has been recommended by the
World Bank in its series, Assessment of Educational Achievement in Developing
Countries and has been used for evaluation purposes since 2007 in international studies
Chapter Two

Chapter Two - Methodology
8
such as the IEA Study of Reading Literacy, the IEA Progress in International Reading
Study (PIRLS), and Trends in International Mathematics and Science Study (TIMSS).
Selection of the sample of schools and the sample of students are given below
2.3.1 Target Population
The target population of the study has grade-based definition. Therefore, students who
have completed eighth grade in the year 2014 in the education system of Sri Lanka were
considered as the desired target population for this study.
2.3.2 Sampling Frame and Elements of the Sampling Frame
Sampling frame is the list of ultimate sampling entities. Latest updated school database
available at the Ministry of Education, Sri Lanka (the school database for the year 2013
June) was the sampling frame used for the study.
Private schools also provide primary and secondary education. However, they are not
regulated by the Ministry of Education in Sri Lanka. Some private schools follow the
local curriculum while some of them teach both local and international curricular.
International schools, another variety of private schools in Sri Lanka, follow only
international curricular. The medium of instruction of these private schools is either
Sinhala or Tamil or English. These private schools were not included in the sampling
frame. Accordingly, as Table 2.1 indicates the desired target population of the study was
315,547 pupils who completed grade eight in 2014 from 6,574 government schools.

Chapter Two - Methodology
9
Table 2.1: Target population
Province Number of
Schools
Number of
classes Number of Students
1. Western 976 2,188 74,039
2. Central 937 1,557 41,896
3. Southern 788 1,357 38,496
4. Northern 520 837 20,085
5. Eastern 645 1,130 31,418
6. North Western 915 1,435 38,471
7. North Central 454 738 21,659
8. Uva 597 889 21,262
9. Sabaragamuwa 742 1,097 28,221
Total 6,574 11,228 315,547
2.3.3 Sample Design – Procedure
The sample procedure of this study has a multi-stage approach, a strategy used to select
the final sample through a series of stages.
In the first stage, schools were selected for the sample. Schools were selected within
strata with Probability Proportional to Size, without replacements. Probability
Proportional to Size Sampling (PPS) is a sampling technique, commonly used in
multistage cluster sampling, in which the probability that a particular sampling unit is
selected in the sample is proportional to some known variable (Ross, K., 2005). In the
second stage, a group of students was selected from the sampled schools using cluster
sampling approach thereby an entire grade 08 class from each sampled school was
selected.
In selection of the sample, in the present study, as in the three previous studies,
‘province’ was taken as the main stratum (explicit stratum) because in the Sri Lankan
context, education being a devolved subject, Provincial Ministries of Education have a
key role in planning, implementing and monitoring educational plans. Medium of
instruction (Sinhala and Tamil) and type of school have been considered as implicit

Chapter Two - Methodology
10
strata, because in Sri Lanka it is used to report students' achievement by medium of
instruction and type of school. Accordingly results will be reported for provinces.
Table 2.2 illustrates student sample and school sample per province with other
important values which decide the size of sampling error, such as roh, ESS and design
effect. Design Effect is the ratio of the variance of the sample mean for a complex
sample design to the variance of a simple random sample.
Table 2.2: Calculated student sample and school sample per province
Province
Data
Total
MOE
(average
class size)
roh
Design
effect
ESS=178
School
sample
Student
sample
calculated
Western students 74,039 34 0.25 9 1,639 48
classes 2,188
Central students 41,896 27 0.25 7 1,331 49
classes 1,557
Southern students 38,496 28 0.25 8 1,396 49
classes 1,357
Northern students 20,085 24 0.25 7 1,201 50
classes 837
Eastern students 31,418 28 0.25 8 1,371 49
classes 1,130
North Western students 38,471 27 0.25 7 1,327 49
classes 1,435
North Central students 21,659 29 0.25 8 1,439 49
classes 738
Uva students 21,262 24 0.25 7 1,198 50
classes 889
Sabaragamuwa students 28,221 26 0.25 7 1,278 50
classes 1,097
Total 12,180 443
Table 2.3 illustrates calculated student sample, allocated student sample and achieved
student sample by provinces.

Chapter Two - Methodology
11
Table 2.3: Calculated, allocated and achieved student sample per each province
Province
Calculated
Student
Sample
Allocated Student Sample as MOE
School Census Database
Achieved Student Sample
Science Mathematics English
Western 1,639 1,806 1,352 1,273 1,279
Central 1,331 1,719 1,443 1,477 1,482
Southern 1,396 1,829 1,562 1,556 1,557
Northern 1,201 1,391 1,238 1,245 1,245
Eastern 1,371 1,530 1,385 1,386 1,386
North Western 1,327 1,652 1,467 1,465 1,463
North Central 1,439 1,678 1,562 1,562 1,551
Uva 1,198 1,637 1,422 1,417 1,417
Sabaragamuwa 1,278 1,871 1,559 1,550 1,553
Total 12,180 15,113 12,990 12,931 12,933
The sampling frame was explicitly stratified by province. With stratification, sample
student size can be calculated in advance of sampling procedure so that it will meet the
desired level of precision, by each stratum. This ensures that the target population is
represented adequately in the sample. Study team was satisfied with 178 as Effective
Sample Size (ESS). This would be an accuracy of plus or minus 7.5% at the error limit at
the province level. Rate of homogeneity, (roh) 0.25 was calculated from the previous
grade 4 assessment study data. Maximum value of roh at the province level was taken
for the calculation of the student sample for each province. Assigning a weight to each
sampled unit was calculated within the explicit strata.
2.4 Framework for the National Assessment
In assessing the achievement of students, three achievement tests which, were
constructed and validated for the previous grade 8 study in 2012, were used in this
study. These achievement tests were developed to determine the achievement level of
learning outcomes of grade 8 students in 2012. The learning outcomes were the
competency levels of each subject expected to be achieved by the students. Therefore, to
assure the content validity of test papers, a table of specifications similar to the one
given below was used.

Chapter Two - Methodology
12
Example of a skeleton table of specification:
Competency Competency
Level
Content domain Cognitive
domain
Question
numbers
2.5 Achievement Tests
The tests in mathematics, science and English Language were designed based on the
above framework for each subject. Mathematics paper consisted only selective type
questions, while the English language and science papers consisted of both selective and
supply type items.
Mathematics test consisted of 40 multiple choice questions with four options. Science
paper consisted of 20 multiple choice questions carrying 40 marks and questions
requiring short answers carrying 60 marks. The English Language paper consisted of 37
items of different types such as multiple choice, matching activities, completion of
sentences and writing simple sentences.
2.6 Procedures in Administration of the National Assessment 2014
National Assessment of Grade 08 students were conducted island-wide on the 2nd and
3rd of December, 2014. It was possible to conduct the test in all 443 schools on the same
stipulated dates.
2.6.1 Test Coordinators
Coordinators to administer the test from the sample schools were appointed from
among Lecturers of the Faculty of Education, University of Colombo and students who
follow Master of Philosophy, Master of Education and Post Graduate Diploma in
Education courses. Furthermore, lecturers and trainee teachers from National Colleges
of Education and Project officers from National Institute of Education were also selected
for this task. Senior teachers from the schools, where the tests were administered, were
appointed to assist the coordinators with the consent of principals.

Chapter Two - Methodology
13
2.6.2 Training Workshop for Coordinators
Training workshops for coordinators were organized in two phases. During the first
phase, a team representing NEREC visited North Central, Northern, Eastern, Southern
and Uva provinces and conducted workshops at Anuradhapura, Polonnaruwa,
Vavuniya, Killinochchi, Jaffna, Trincomalee, Batticaloa, Ampara, Monaragala,
Bandarawela, Galle and Hambathota from 24th to 28th of November 2014. Test papers
and other relevant documents were handed over to all coordinators with necessary
instructions in the above centers during the workshops.
The second phase of the training workshops was organized at the NEREC on the 27th
and 28th of November, 2014.
Coordinators from Central, Western, North Western, and Subragamuwa Provinces
participated in these sessions. Test papers and other relevant documents with
necessary instructions were handed over to them during these workshops. All
coordinators were advised to meet the principals and the school coordinators of sample
schools on 01st of December 2014 to make prior arrangements concerning the test.
Given below are some of the measures that were adopted in the 2014 study which were
expected to increase the reliability of the assessment.
• The tests were administered on weekdays (2nd and 3rd of December 2014)
• In order to better monitor the administering of the tests, in the 2014 study 443
independent coordinators were appointed to the 443 examination centers.
• The coordinators were expected to complete a journal in which they had to
provide information regarding the conduct of the examination.
2.6.3 Return of Answer Scripts and Other Documents
Coordinators from Central, Western, North Western, and Sabragamuwa Provinces
handed over the answer scripts and other documents to the NEREC office from 06th to
10th December 2014. A team from NEREC visited the North Central, Northern, Eastern,
Southern and Uva provinces to collect answer scripts and other documents from 9th to
16th December 2014.

Chapter Two - Methodology
14
2.7 Analysis of Data
Data gathered through the achievement tests were analyzed on a national and
provincial basis. Since samples were selected on provincial basis data were weighted.
Patterns in learning achievement were presented using mean, standard deviation,
standard error of mean, skewness, cumulative percentages and percentile ranks. In
addition to these, graphs such as frequency polygons, box plots, whisker plots and bar
graphs were also used to present the data visually.
2.8 Summary
This chapter presented the specific objectives of the study, sampling procedures and the
framework of the national assessment of achievement of Grade 8 in 2014. As mentioned
earlier, the National Assessment of Achievement of Grade 08 Students of Sri Lanka in
the year 2014 was conducted with the main objective of examining how far the
expected learning outcomes have been achieved by such students. The findings are
expected to provide important insights into areas that play a central role in providing
equality to students receiving compulsory education. The next three chapters will
present the data pertaining to student achievement in relation to the three subjects,
mathematics, science and English language.

15
Patterns in Achievement –
Mathematics 2014
3.1 Introduction
In this chapter, achievement levels as well as disparities in achievement of students in
mathematics are discussed. Students’ achievement levels concerning mathematics are
presented in relation to such factors as school type, gender, medium of instruction and
location of school. Furthermore, strengths and weaknesses of students’ achievement are
analyzed against various skills and subject contents of mathematics. The present
National Assessment is the second study conducted on Grade 8 mathematics syllabus
since the new competency based curriculum was introduced in Sri Lanka in 2007. The
first study on the same was conducted by NEREC in 2012.
3.2 Achievement Levels in Mathematics at All Island and Provincial
Levels
The mean value of the achievement level of students stands as 50.87 at all island level.
However, the median value is 47.51 indicating that half of the student population has
scored below 47.51. Furthermore, 25 percent of students have scored below 35.02
marks while 75 percent of them have scored below 67.51 marks. Table 3.1 below
further illustrates the achievement levels at provincial as well as all island levels.
Chapter Three

Chapter Three– Patterns in Achievement: Mathematics 2014
16
Table 3.1: All island and provincial achievement in mathematics 2014 –Summary statistics
Province
Me
an
Ra
nk
Sta
nd
ard
De
via
tio
n
Sta
nd
ard
Err
or
of
Me
an
Pe
rce
nti
le
(p2
5)=
Q1
Me
dia
n
(p5
0)=
Q2
Pe
rce
nti
le
(p7
5)=
Q3
Sk
ew
ne
ss
Western 55.49 1 20.73 0.08 37.61 55.00 72.52 0.00
Southern 53.66 2 21.44 0.11 35.02 52.51 72.62 0.21
Sabaragamuwa 52.35 3 19.46 0.11 37.42 50.02 67.51 0.18
North Western 50.99 4 19.58 0.10 35.02 47.53 65.21 0.31
Eastern 49.28 5 20.28 0.11 32.41 45.21 65.35 0.29
North Central 48.98 6 19.17 0.13 35.05 45.31 62.21 0.42
Uva 47.95 7 18.80 0.13 32.51 45.05 60.42 0.43
Northern 46.05 8 19.55 0.14 30.12 42.52 60.14 0.57
Central 44.96 9 18.77 0.09 30.02 40.01 57.51 0.68
All Island 50.87 20.29 0.04 35.02 47.51 67.51 0.29
When considering the provincial level achievement, mean values of Western, Southern,
Sabaragamuwa and North Western Provinces are 55.49, 53.66, 52.35 and 50.99
respectively. While these values are above fifty, Western Province, according to this
study, ranks number one in terms of achievement levels of mathematics. Yet, when one
looks at the median of the same provinces, one can see that only Western, Southern and
Sabaragamuwa show values that are above 50. Although the mean values of the other
provinces show levels that are below 50, the lowest is 44.96. Achievement levels in
mathematics are further illustrated by the Figure 3.1 below.

Chapter Three – Patterns in Achievement: Mathematics 2014
17
.33.8
15.1
19.4
16.5
13.111.8
10.5
7.8
1.7.0
5.0
10.0
15.0
20.0
25.0
0-1
0
11
to
20
21
to
30
31
to
40
41
to
50
51
to
60
61
to
70
71
to
80
81
to
90
91
to
10
0
Stu
de
nt
Pe
rce
nta
ge
Class Interval
55
.49
53
.66
52
.35
50
.99
49
.28
48
.98
47
.95
46
.05
44
.96 50
.87
55
.02
52
.51
50
.02
47
.53
45
.21
45
.31
45
.05
42
.52
40
.01 4
7.5
1
0
10
20
30
40
50
60
70
Mar
ks
Province
Mean
Median
Figure 3.1: Mean values and median values of mathematics marks
3.3 Distribution of Test Scores of Mathematics
Standard deviation of marks (SD) which describes how scores are scattered around the
mean value is 20.3 at all island level. If the marks are normally distributed nearly 68
percent of students fall between 71.16 (50.87+20.29) and 30.58 (50.87-20.29).
However, mathematics scores have a positively skewed distribution (skewness = 0.29),
which indicates that the majority of students are low achievers in mathematics. This can
be further observed in the Figure 3.2 and Table 3.2 given below.
Figure 3.2: All island achievement in mathematics –distribution of marks
Skewness = 0.29
Mean = 50.87
Median = 47.51

Chapter Three– Patterns in Achievement: Mathematics 2014
18
Table 3.2 : Distribution of all island achievement marks of mathematics
Class Interval Student % Cumulative %
00 to 10 .3 .3
11 to 20 3.8 4.1
21 to 30 15.1 19.2
31 to 40 19.4 38.6
41 to 50 16.5 55.1
51 to 60 13.1 68.2
61 to 70 11.8 80.0
71 to 80 10.5 90.6
81 to 90 7.8 98.3
91 to 100 1.7 100.0
Total 100.0
One important phenomenon is that the percentage of highest frequency of students,
which is 19.4, belongs to the marks category of 31-40. If conventionally viewed, this
development may be seen as undesirable as the highest percentage of students have
scored less than 40 marks for mathematics. Moreover, there is a clear indication that the
percentages of students belonging to higher marks intervals are very low.
Positive skewness found in the distribution of mathematics marks can be seen in almost
all the provinces. It is shown by Figure 3.3. According to the figure, only in Western,
Sabaragamuwa and Southern Provinces positive skewness of the distribution of score is
somewhat low. Furthermore, these distributions are bimodal distributions. It can be
clearly seen in Western, Southern, Eastern and North Western Provinces.

Chapter Three – Patterns in Achievement: Mathematics 2014
19
.0
5.0
10.0
15.0
20.0
25.0
0-1
0
11
to
20
21
to
30
31
to
40
41
to
50
51
to
60
61
to
70
71
to
80
81
to
90
91
to
10
0
Student
%
Marks
Western Province
.0
5.0
10.0
15.0
20.0
25.0
0-1
0
11
to
20
21
to
30
31
to
40
41
to
50
51
to
60
61
to
70
71
to
80
81
to
90
91
to
10
0
Student
%
Marks
Southern Province
.0
5.0
10.0
15.0
20.0
25.0
0-1
0
11
to
20
21
to
30
31
to
40
41
to
50
51
to
60
61
to
70
71
to
80
81
to
90
91
to
10
0
Student
%
Marks
Northern Province
.0
5.0
10.0
15.0
20.0
25.0
0-1
0
11
to
20
21
to
30
31
to
40
41
to
50
51
to
60
61
to
70
71
to
80
81
to
90
91
to
10
0
Student
%
Marks
Eastern Province
.0
5.0
10.0
15.0
20.0
25.0
0-1
0
11
to
20
21
to
30
31
to
40
41
to
50
51
to
60
61
to
70
71
to
80
81
to
90
91
to
10
0
Student
%
Marks
North Western Province
.0
5.0
10.0
15.0
20.0
25.0
0-1
0
11
to
20
21
to
30
31
to
40
41
to
50
51
to
60
61
to
70
71
to
80
81
to
90
91
to
10
0
Student
%
Marks
North Central Province
.0
5.0
10.0
15.0
20.0
25.0
0-1
0
11
to
20
21
to
30
31
to
40
41
to
50
51
to
60
61
to
70
71
to
80
81
to
90
91
to
10
0
Student
%
Marks
Uva Province
.0
5.0
10.0
15.0
20.0
25.0
0-1
0
11
to
20
21
to
30
31
to
40
41
to
50
51
to
60
61
to
70
71
to
80
81
to
90
91
to
10
0Student
%
Marks
Sabaragamuwa Province
.0
5.0
10.0
15.0
20.0
25.0
0-1
0
11
to
20
21
to
30
31
to
40
41
to
50
51
to
60
61
to
70
71
to
80
81
to
90
91
to
10
0
Student
%
Marks
Central Province
Figure 3.3: Provincial-wise distribution of marks – Mathematics

Chapter Three– Patterns in Achievement: Mathematics 2014
20
According to Table 3.1 the differences of SD value of marks among different provinces
are minimal. The highest value, which is 21.44, is in the Southern Province while the
lowest value, which is 18.80, is seen in both Central and Uva Provinces. However, the
skewness of the distribution of scores of various provinces show noticeable variations.
While Western province has a negligible skewness (.00), Central Province has a very
high skewness (.68). Central, Northern, Uva and North Central Provinces have a very
high positive skewness indicating the fact that low achievers are very high. While
Southern, Sabaragamuwa, and Eastern Provinces have a comparably low skewness
indicating that low achievers are not many in these provinces when compared with
other provinces. This skewness is indicated by the box-plot chart in Figure 3.4 given
below.
Figure 3.4 : Mathematics marks representation using boxplot and whisker plot
3.4 Disparities in Achievement in Mathematics
Over the years various efforts have been made to provide equal opportunities for school
education in Sri Lanka. Yet, disparities in achievement in mathematics in different
groups can still be seen owing to different factors. In this section, in what way the school
type, gender, medium of instruction and school location have an influence on these
disparities are discussed.

Chapter Three – Patterns in Achievement: Mathematics 2014
21
3.4.1 Disparities in Achievement in Mathematics in Relation to School Type
Indicators of achievement levels of mathematics according to school type are given in
Table 3.3 below.
Table 3.3: Mathematics achievement marks according to school type
School
Type
Mean Standard
Deviation
Median Skewness F P
1AB 58.70 20.01 60.21 -0.11 31,747.29 .000
1C 42.37 16.42 40.01 0.63
Type 2 41.54 17.08 37.54 0.76
All Island 50.87 20.29 47.51 0.29
According to Table 3.3, students in 1AB schools have shown the highest performance.
The mean is 58.70 and median is 60.21, which can be considered as a satisfactory level.
Another positive feature is that the distribution of marks of 1AB schools is negatively
skewed, with a skewness value of -0.11. This indicates that the majority of students
have shown a considerable high performance in mathematics in these schools. When 1C
schools are considered, performance levels are lower than 1AB schools. Their mean is
42.37 and their median is 40.01. Their marks distribution is positively skewed, with a
skewness value of 0.63 in 1C schools.
Type 2 schools show the lowest performance in mathematics. Their mean is 41.54 while
the median is 37.54. This cannot be considered as a satisfactory level. It is a level which
is below 50 marks. Another unsatisfactory feature is that the marks distribution in these
schools is positively skewed which is 0.76. However, there is no conspicuous difference
between the achievement levels of 1C and Type 2 schools. In both 1C and Type 2
schools, the skewness is positive while the skewness of 1AB schools is negative. This is
further illustrated by Figure 3.5 below.

Chapter Three– Patterns in Achievement: Mathematics 2014
22
58
.70
42
.37
41
.54 5
0.8
760
.21
40
.01
37
.54 4
7.5
1
0.00
10.00
20.00
30.00
40.00
50.00
60.00
70.00
1AB 1C Type 2 All Island
Ma
rks
School Type
Mean
Median
Figure 3.5: Mean values of mathematics marks according to school types
In addition to Table 3.3 above, Table 3.4 and Figure 3.6 also show the nature of the
distribution of mathematics marks of students according to school type. This too shows
that mathematics marks of 1C and Type 2 schools are positively distributed. Meanwhile,
mathematics marks of 1AB schools are distributed with a negative skewness showing a
satisfactory situation.
Table 3.4: Distribution of mathematics achievement marks according to school type
Class
Interval
1AB
Student %
Cumulative
%
1C
Student %
Cumulative
%
Type 2
Student %
Cumulative
%
00-10 0.13 0.13 0.43 0.43 0.46 0.46
11-20 1.57 1.70 5.73 6.16 7.42 7.88
21-30 8.24 9.94 22.34 28.50 23.49 31.37
31-40 13.40 23.34 25.86 54.36 26.48 57.85
41-50 14.99 38.33 18.98 73.34 17.04 74.89
51-60 14.36 52.69 12.19 85.53 10.72 85.62
61-70 15.34 68.03 8.32 93.85 7.25 92.86
71-80 16.29 84.32 4.04 97.89 4.18 97.04
81-90 12.76 97.08 1.96 99.85 2.58 99.62
91-100 2.92 100.00 0.15 100.00 0.38 100.00
Total 100.00 100.00 100.00

Chapter Three – Patterns in Achievement: Mathematics 2014
23
0
5
10
15
20
25
30
Pe
rce
nta
ge
of
Stu
de
nts
Marks
1AB
1C
Type 2
Figure 3.6: Distribution of mathematics achievement marks according to school type
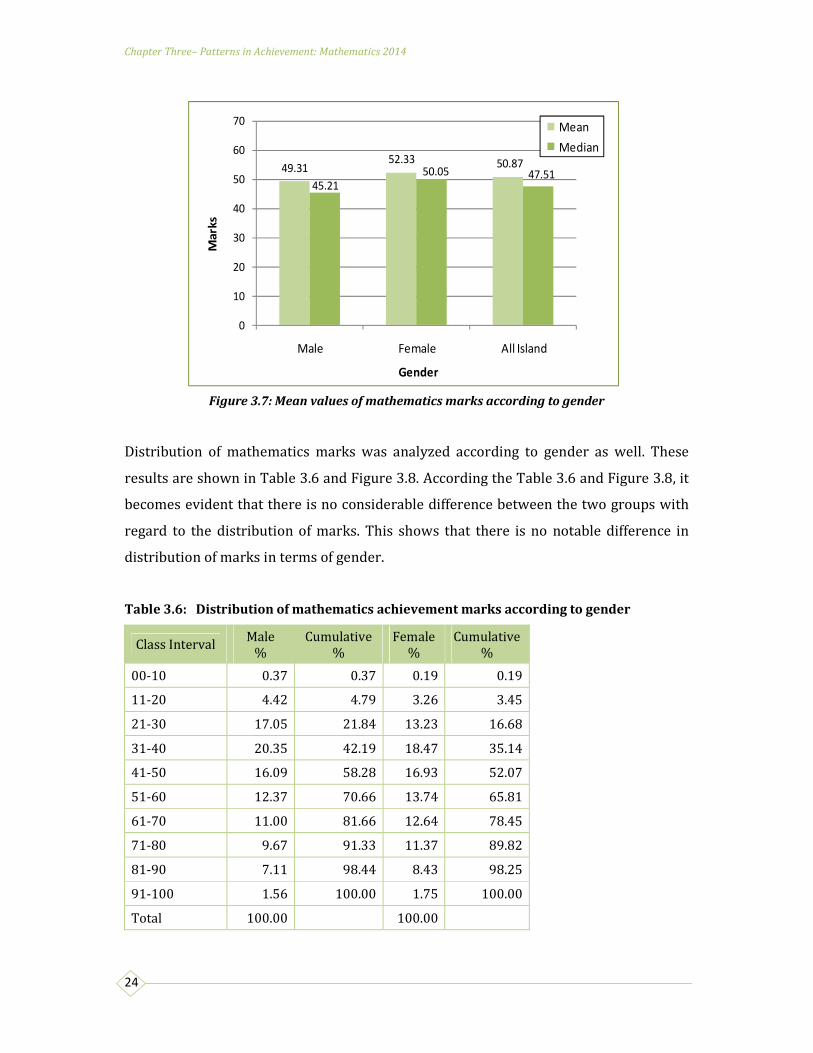
3.4.2 Disparities in Achievement in Mathematics in Relation to Gender
Disparities in achievement of students were observed in relation to gender in previous
grade 4 and 8 studies conducted by the NEREC. In the present study too, disparities of
achievement related to gender were seen. According to Table 3.5 given below, there is a
difference between the achievement levels of girls and boys. The mean value of the test
scores of boys is 49.31 while the mean value of the test score of girls is 52.33.
Table 3.5: Mathematics achievement marks according to gender
Gender Mean Standard
Deviation
Median Skewness F P
Male 49.31 20.30 45.21 0.36 1,753.05 .000
Female 52.33 20.17 50.05 0.23
All Island 50.87 20.29 47.51 0.29
With regard to median also this difference can be seen. As such, it is evident in
mathematics, performance of girls is better than that of boys. However, the standard
deviation which indicates dispersion of marks is almost the same for two groups. This
disparity in the achievement level in mathematics is further illustrated by Figure 3.7.
Chapter Three– Patterns in Achievement: Mathematics 2014
24
49.3152.33 50.87
45.21
50.05 47.51
0
10
20
30
40
50
60
70
Male Female All Island
Ma
rks
Gender
Mean
Median
Figure 3.7: Mean values of mathematics marks according to gender
Distribution of mathematics marks was analyzed according to gender as well. These
results are shown in Table 3.6 and Figure 3.8. According the Table 3.6 and Figure 3.8, it
becomes evident that there is no considerable difference between the two groups with
regard to the distribution of marks. This shows that there is no notable difference in
distribution of marks in terms of gender.
Table 3.6: Distribution of mathematics achievement marks according to gender
Class Interval Male
% Cumulative
% Female
% Cumulative
%
00-10 0.37 0.37 0.19 0.19
11-20 4.42 4.79 3.26 3.45
21-30 17.05 21.84 13.23 16.68
31-40 20.35 42.19 18.47 35.14
41-50 16.09 58.28 16.93 52.07
51-60 12.37 70.66 13.74 65.81
61-70 11.00 81.66 12.64 78.45
71-80 9.67 91.33 11.37 89.82
81-90 7.11 98.44 8.43 98.25
91-100 1.56 100.00 1.75 100.00
Total 100.00 100.00

Chapter Three – Patterns in Achievement: Mathematics 2014
25
0
5
10
15
20
25
30
Pe
rce
nta
ge
of
Stu
de
nts
Marks
Male
Female
Figure 3.8: Distribution of mathematics achievement marks according to gender
3.4.3 Disparities in Achievement in Mathematics in Relation to Medium of
Instruction
Either Sinhala or Tamil is the medium of instruction in almost all the schools in Sri
Lanka. Those whose native language is Tamil normally study in Tamil medium while
those whose native language is Sinhala generally study in Sinhala. Though both groups
do their studies in their mother tongue, a difference can be observed in the achievement
level in mathematics. The mean value of marks in the achievement of Sinhala medium
students is 53.13 while it is 44.37 for the Tamil medium students. It is a noticeable
difference. The median values also show the same. The median value of Sinhala medium
students is 50.05 while the median value of the Tamil medium students is 40.21. This
difference in achievement is further illustrated by Figure 3.9.
Table 3.7: Mathematics achievement marks according to medium of instruction
Medium of Instruction
Mean Standard Deviation
Median Skewness F P
Sinhala 53.13 20.34 50.05 0.18 23,597.05 .000
Tamil 44.37 18.69 40.21 0.64
All Island 50.87 20.29 47.51 0.29

Chapter Three– Patterns in Achievement: Mathematics 2014
26
53.13
44.37
50.8750.05
40.21
47.51
0
10
20
30
40
50
60
70
Sinhala Tamil All Island
Ma
rks
Medium
Mean
Median
Figure 3.9: Mean values of mathematics marks according to medium of instruction
The analysis of the distribution of marks according to medium of instruction is given
below in Table 3.8 and further illustrated by Figure 3.10. According to the results shown
in Table 3.8 and Figure 3.10, it is apparent that the achievement of Sinhala medium
students is more satisfactory than that of Tamil medium students. Although the
skewness of distribution of marks is positive for Sinhala and Tamil medium groups, for
Tamil medium students, it is considerably higher.
Table 3.8: Distribution of mathematics achievement marks according to medium of
instruction
Class Interval
Sinhala%
Cumulative %
Tamil %
Cumulative %
00-10 0.21 0.21 0.45 0.45
11-20 3.20 3.42 5.62 6.06
21-30 12.40 15.81 22.77 28.83
31-40 18.07 33.88 23.13 51.96
41-50 16.50 50.38 16.57 68.53
51-60 13.69 64.07 11.34 79.87
61-70 12.87 76.95 8.91 88.78
71-80 11.99 88.94 6.41 95.18
81-90 9.07 98.01 4.09 99.27
91-100 1.99 100.00 0.73 100.00
Total 100.00 100.00

Chapter Three – Patterns in Achievement: Mathematics 2014
27
0
5
10
15
20
25
30
Pe
rce
nta
ge
of
Stu
de
nts
Marks
Sinhala
Tamil
Figure 3.10: Distribution of mathematics achievement marks according to medium of
instruction
3.4.4 Disparities in Achievement of Mathematics in Relation to Location of
School
Different governments that came into power have taken numerous efforts to provide
equal opportunities to every student studying in public schools irrespective of the
location. However, the location of the school has been a leading factor affecting
achievement. In this study the achievement level in mathematics of students attending
schools located in Municipal Council areas, Urban Council areas and Pradeshiya Sabha
areas were analyzed. Such analyzed data are given in Table 3.9 below.
Table 3.9: Mathematics achievement marks according to location
Location Mean Standard
Deviation
Median Skewness F P
Municipal
Council 59.86 21.89 62.53 -0.18 13,649.47 .000
Urban Council 57.10 19.50 57.34 -0.15
Pradeshiya
Saba 46.79 18.65 42.52 0.48
All Island 50.87 20.29 47.51 0.29

Chapter Three– Patterns in Achievement: Mathematics 2014
28
59
.86
57
.10
46
.79
50
.87
62
.53
57
.34
42
.52
47
.51
0.00
10.00
20.00
30.00
40.00
50.00
60.00
70.00
Municipal Council
Urban Council Pradeshiya Saba
All Island
Ma
rks
Location
Mean
Median
The above table clearly shows that the performance level of students attending schools
located in Municipal Council areas is the highest (Mean=59.86) while performance level
of students attending schools located in Predeshiya Sabha areas is the lowest
(Mean=46.79).
Though the achievement level of students in Urban Council areas is lower than that of
Municipal Council areas, the difference is not relatively high when compared with the
difference between Municipal Councils and Pradeshiya Sabhas. This is further
illustrated by Figure 3.11.
Figure 3.11: Mean values of mathematics marks according to location
This pattern of difference is further confirmed when the values of median are
compared. It is an important finding to be considered when providing learning
opportunities to students studying in schools located in different areas.
Distribution of marks in mathematics was analyzed according to the location of school.
Data are presented in Table 3.10. Further it is illustrated in Figure 3.12. Analysis shows
that the distribution of marks belonging to Municipal and Urban council areas is
negatively skewed indicating a positive sign with regard to the achievement of students.
However, in Pradeshiya Saba areas, score distribution is positively skewed which shows
that the majority of students are in lower marks categories.

Chapter Three – Patterns in Achievement: Mathematics 2014
29
0
5
10
15
20
25
30
Pe
rce
nta
ge
of
Stu
de
nts
Marks
Municipal Council
Urban Council
Pradeshiya Saba
Table 3.10: Distribution of mathematics achievement marks according to location
Class Interval
Municipal Council %
Cumulative %
Urban Council %
Cumulative %
Pradshiya Saba %
Cumulative
%
00-10 0.22 0.22 0.08 0.08 0.33 0.33
11-20 2.48 2.70 2.32 2.40 4.56 4.89
21-30 9.56 12.26 8.57 10.97 18.14 23.02
31-40 12.58 24.84 14.76 25.73 22.44 45.46
41-50 13.64 38.48 14.04 39.77 17.93 63.39
51-60 11.32 49.80 14.42 54.19 13.35 76.74
61-70 12.63 62.43 17.41 71.60 10.45 87.20
71-80 15.82 78.25 16.74 88.34 7.63 94.83
81-90 17.26 95.51 9.91 98.26 4.41 99.23
91-100 4.49 100.00 1.74 100.00 0.77 100.00
Total 100.00 100.00 100.00
Figure 3.12: Distribution of mathematics achievement marks according to location
Further to the above analysis, Table 3.11 indicates the summary statistics considering
the locality as urban and rural. In this analysis both urban council and municipal council
schools have been considered as urban while Pradeshiya Saba schools as rural. Data
given in the Table 3.11 indicates clearly that the performance of mathematics of
students attending the schools situated in urban areas is very high when compared with
the performance of students attending schools in rural areas. This is further illustrated
by Figure 3.13.

Chapter Three– Patterns in Achievement: Mathematics 2014
30
58.75
46.7950.87
60.51
42.55
47.51
0
10
20
30
40
50
60
70
Urban Rural All Island
Ma
rks
Medium
Mean
Median
Table 3.11: Mathematics achievement mark according to location- Urban /Rural
Location Mean Standard
Deviation Median Skewness F P
Urban 58.75 21.01 60.51 -0.15 26,735.6 .000
Rural 46.79 18.65 42.55 0.48
All Island 50.87 20.29 47.51 0.29
Figure 3.13: Mean values of mathematics marks according to location – Urban/Rural
Distribution of marks was analyzed according to the above categorization of schools and
is given in Table 3.12 and Figure 3.14 below. This analysis shows that the marks of
students in urban areas are negatively distributed while the distribution of marks in
rural areas is seen with a positive skewness. As generally seen in educational studies,
here too the achievement of students studying in urban schools is higher than that of
those studying in rural schools.

Chapter Three – Patterns in Achievement: Mathematics 2014
31
0
5
10
15
20
25
30
Pe
rce
nta
ge
of
Stu
de
nts
Marks
Urban
Rural
Table 3.12: Distribution of mathematics achievement marks according to location –
Urban/Rural
Class
Interval
Urban
% Cumulative
%
Rural
% Cumulative
%
00-10 0.16 0.16 0.33 0.33
11-20 2.41 2.58 4.56 4.89
21-30 9.17 11.75 18.14 23.02
31-40 13.45 25.20 22.44 45.46
41-50 13.80 39.00 17.93 63.39
51-60 12.56 51.56 13.35 76.74
61-70 14.54 66.10 10.45 87.20
71-80 16.19 82.29 7.63 94.83
81-90 14.32 96.61 4.41 99.23
91-100 3.39 100.00 0.77 100.00
Total 100.00 100.00
Figure 3.14: Distribution of mathematics achievement marks according to location –
Urban/Rural
3.5 Achievement of Mathematics by Competency Levels
As mentioned in the second chapter, tests used to assess the achievement level of
students in the present study were based on the competencies and competency levels
expected to be achieved in each subject. In mathematics, 40 competency levels related
to four areas of cognitive abilities, namely, knowledge and skills, communication,
relationship, problem solving and reasoning were tested. Results are discussed below.

Chapter Three– Patterns in Achievement: Mathematics 2014
32
3.5.1 Achievement of Competency Levels Related to Knowledge and Skills
Percentages of students who have achieved expected competency levels related to
knowledge and skills are given in Table 3.13.
Table 3.13: Achievement of competency levels related to knowledge and skills
Competency Level Question
numbers Percentage
1.1 Inquires into the relationships between the whole numbers. 2 56.5
1.2 Manipulates directed numbers under the basic mathematical
operations 1 38.8
2.1 Builds relationships between the terms of number patterns by
investigating various properties 7 44.3
3.1 Manipulates units and parts under multiplication 3 66.7
5.1 Develops the relationship between fractions, ratios and
percentages 8 34.9
7.1 Satisfies various requirements by investigating the perimeter of
rectilinear plane figures 20 38.8
9.1 Facilitates daily work by investigating large masses 18 51.3
10.1 Determines for daily needs, the space that is taken up by
various solids 15 59.6
11.1 Facilitates daily work by investigating the capacity of liquid
containers 21 25.4
12.1 Investigates the rotation of earth and inquires into its results 19 58.3
12.2 Investigates the difference in time between countries and finds
their relative positions 23 39.0
13.1 Indicates the direction of a location using angles 24 34.1
15.1 Factorizes algebraic expressions 26 38.0
20.2 Illustrates the behavior of a variable pictorially 31 35.1
20.3 Represents location on a Cartesian Plane 30 46.5
21.1 Examines the angles made by various straight lines 35 45.1
21.2 Performs calculations using the relationships between various
angles 36 40.0
22.1 Created solids and confirms the relationships between
properties related circles 34 63.7
23.1 Inquires into the relationships between the various angles of
rectilinear plane figure 33 35.5
24.1 Inquiries into the special properties related to circles 32 72.0
25.1 Inquires into the results of a rotation that are based on symmetry
37 52.9

Chapter Three – Patterns in Achievement: Mathematics 2014
33
56
.5
38
.8 44
.3
66
.7
34
.9 38
.8
51
.3
59
.6
25
.4
58
.3
39
34
.1 38
35
.1
46
.5
45
.1
40
63
.7
35
.5
72
52
.9
69 7
2.3
67
.6
0
10
20
30
40
50
60
70
80
2 1 7 3 8 20 18 15 21 19 23 24 26 31 30 35 36 34 33 32 37 11 12 13
Pe
rce
nta
ge
Question Number
Competency Level Question
numbers Percentage
27.1 Compares varies movements with the basic foci 11 69.0
29.1 Inquires into numerical representative values of a group of data 12 72.3
31.1 Determines the likelihood of an event occurring by
investigating the various methods of finding a suitable value 13 67.6
Average 49.4
According to Table 3.13, the competency level 29.1 (‘Inquires into numerical
representative values of a group of data’) was achieved by the highest percentage of
students which is 72.3 percent. The competency level 11.1 (‘Facilitates daily work by
investigating the capacity of liquid containers’) was achieved by the lowest percentage
of students which is 25.4 percent. According to the data in Table 3.13, 11 competency
levels out of 24 (nearly half of the tested competency levels) have been achieved by
more than 50 percent of students. However, average percentage of students who
achieved the competencies related to knowledge and skills areas is 49.4. Percentage of
students achieved the competency levels related to knowledge and skills are further
illustrated in Figure 3.15 below.
Figure 3.15: Achievement of competency levels related to knowledge and skills

Chapter Three– Patterns in Achievement: Mathematics 2014
34
3.5.2 Achievement of Competency Levels Related to Communication
Another important area with regard to cognitive abilities in mathematics is
communication. Ten competency levels were tested related to this area. The percentage
of students who achieved these competencies are given in Table 3.14.
Table 3.14: Achievement of competency levels related to communication
Competency level Question
No. Percentage
3.2 Manipulates units and parts of units under division 9 27.9
3.3 Manipulates decimal numbers under the mathematical operations
of multiplication and division. 4 72.5
6.2 Expands a power of a negative integer and finds the value 5 65.6
8.2 Fulfils daily needs by investigating the surface area of various solids 16 18.5
13.2 Describes various locations in the environment using scale
drawings 22 65.6
14.1 Simplifies algebraic expressions by removing brackets and finds the
value by substitution. 25 48.3
18.1 Uses the relationships between two quantities that can be used to
enhance beauty. 28 52.5
20.1 Uses a number line to represent fractions and decimal numbers 29 36.8
26.1 Studies shapes by creating various patterns that can be used to
enhance beauty. 39 59.4
30.1 Analyze the various relationships related to sets. 40 64.6
Average 51.2
The competency level related to communication achieved by the highest percentage
(72.5) of students is ‘Manipulates decimal numbers under the mathematical operations
of multiplication and division’ while the competency level achieved by the lowest
percentage (18.5) of students is ‘Fulfils daily needs by investigating the surface area of
various solids’. As a whole, average percentage of students who achieved the
competency levels related to communication is 51.2. Percentage of students who have
achieved the above mentioned competency levels are given in Figure 3.16

Chapter Three – Patterns in Achievement: Mathematics 2014
35
27.9
72.5
65.6
18.5
65.6
48.352.5
36.8
59.4
64.6
0
10
20
30
40
50
60
70
80
9 4 5 16 22 25 28 29 39 40
Pe
rce
nta
ge
Question Number
Figure 3.16: Achievement of competency levels related to communication
3.5.3 Achievement of Competency Levels Related to Relationship,
Reasoning and Problem-Solving
Competency levels achieved by the students related to relationship, reasoning and
problem-solving are given in Table 3.15
Table 3.15: Achievement of competency levels related to relationships, reasoning and
problem solving
Standard Competency Level Question
No. Percentage
Relationships
4.1 Uses ratios in day to day activities 6 59.2
4.2 Solves problems constructing relationships
between two ratios 10 50.0
Problem
solving
8.1 Finds the area of a compound plane figure in
the environment and has an awareness of the space allocated for them.
17 57.3
17.1 Uses linear equations to solve problems 27 39.6
Reasoning
27.2 Constructs triangles 38 63.2
28.1 Represents data such that comparison is
facilitated 14 68.3

Chapter Three– Patterns in Achievement: Mathematics 2014
36
59.2
50
57.3
39.6
63.268.3
0
10
20
30
40
50
60
70
80
6 10 17 27 38 14
Pe
rce
nta
ge
Question Number
It is clear that the percentage of students who achieved competency level related to
reasoning is significantly high. It is 65.7 percent. Competency level related to
relationship has also been achieved by the majority of students (54.6%). However,
competency levels related to problem solving have been achieved by the lowest
percentage of students. Average percentage is 48.45. This is not particularly
encouraging because problem solving is a very important ability students should have
developed, especially in mathematics. These results of competency level achievement
are further illustrated in Figure 3.17.
Figure 3.17: Achievement of competency levels related to relationships, reasoning and
problem solving
3.6 Summary
In this chapter, achievement levels as well as disparities in achievement of students in
mathematics were discussed. Average achievement of mathematics is above 50. The
majority of the students belong to low marks categories. Disparities in achievement
levels can be seen in terms of type of school, gender, medium of instruction and location
of school.

37
Patterns in Achievement –
Science 2014
4.1 Introduction
This chapter presents the achievement levels of science which is one of the core subjects
in grade 8 curriculum and tested in national assessment of achievement of grade
completing grade 8 in year 2014. In 2007, a competency based curriculum was
introduced for science as well. The present National Assessment is the second study
conducted on the Grade 8 science curriculum since the new curriculum was introduced.
The first one was conducted in 2012. In this chapter, firstly achievement levels in
science at national and provincial levels are addressed followed by a discussion of
distribution of marks in science. Afterwards, disparities in achievement levels with
regard to the type of the school, gender, location of the school and the medium of
instruction have been analyzed. Achievement levels of different competencies and
competency levels in this subject are also examined.
4.2 Achievement Levels in Science at All Island and Provincial Levels
Mean value of science marks at all island level is 41.16. Although 41.16 is not a high
mark, it may be desirable. Yet, it is below 50 marks. Even when the median is concerned
it is nearly 40.
These values at all island level as well as provincial levels are given in Table 4.1 below.
Chapter Four

Chapter Four– Patterns in Achievement: Science 2014
38
Table 4.1: All island and provincial achievement in science 2014 – Summary statistics
Province
Me
an
Ra
nk
Sta
nd
ard
De
via
tio
n
Sta
nd
ard
Err
or
of
Me
an
Pe
rce
nti
le
(p2
5)=
Q1
Me
dia
n
(p5
0)=
Q2
Pe
rce
nti
le
(p7
5)=
Q3
Sk
ew
ne
ss
Southern 46.95 1 22.58 0.12 28.21 44.21 65.10 0.29
Sabaragamuwa 44.02 2 19.97 0.12 29.34 43.42 59.22 0.17
Western 43.76 3 22.08 0.08 25.25 41.51 62.32 0.25
North Western 42.78 4 20.09 0.10 27.41 40.70 57.41 0.37
North Central 41.15 5 19.44 0.13 26.61 38.51 55.61 0.45
Uva 39.41 6 19.31 0.13 24.21 37.42 52.71 0.52
Eastern 37.44 7 19.64 0.11 22.70 33.35 50.82 0.60
Central 34.91 8 18.96 0.09 20.61 30.81 47.51 0.76
Northern 34.15 9 18.78 0.13 20.50 29.27 46.31 0.73
All Island 41.16 20.92 0.04 25.21 40.05 58.21 0.44
Achievement level of students is indicated by both mean and median values. In a
situation where scores are distributed with a high skewness, like in the present study,
median value gives a better picture about the achievement level of students. In the
present study, mean value of science marks at all island level is 41.16. It is not a high
mark. Yet, it may be as satisfactory. The median value of the same subject is 40.05. This
too is a low mark. It means that half of the students have scored below 40.05. The value
of Q1 is 25.21. It indicates that 25 percent of students in grade has scored below 25.21.
Meanwhile, according to the above table 75 percent of students are below 58.21. When
standard deviation is concerned (SD=20.92), a considerably high dispersion of marks
can be seen at all island level.
This is further illustrated by Figure 4.1

Chapter Four – Patterns in Achievement: Science 2014
39
3.2
15
19.3
16.4
13.7
11.29.8
6.9
3.6
0.7
0
5
10
15
20
25
0-1
0
11
to
20
21
to
30
31
to
40
41
to
50
51
to
60
61
to
70
71
to
80
81
to
90
91
to
10
0
Stu
de
nt
Pe
rce
nta
ge
Class Interval
46
.95
44
.02
43
.76
42
.78
41
.15
39
.41
37
.44
34
.91
34
.15 41
.16
44
.21
43
.42
41
.51
40
.70
38
.51
37
.42
33
.35
30
.81
29
.27
40
.05
0
10
20
30
40
50
60
70
Ma
rks
Province
Mean
Median
Figure 4.1: Mean values and median values of science marks
4.3 Distribution of Test Scores of Science
The manner in which science test scores are distributed is shown by Figure 4.2.
Figure 4.2: All island achievement in science –distribution of marks
Skewness = 0.44
Mean = 41.16
Median = 40.05

Chapter Four– Patterns in Achievement: Science 2014
40
According to the graph, the distribution of marks is positively skewed. The value of the
skewness is 0.44. This skewness is further illustrated by Table 4.2.
Table 4.2: Distribution of all island achievement marks of Science
Class Interval Student
%
Cumulative
%
00 to10 3.2 3.2
11 to 20 15.0 18.3
21 to 30 19.3 37.6
31 to 40 16.4 54.0
41 to 50 13.7 67.8
51 to 60 11.2 79.0
61 to 70 9.8 88.8
71 to 80 6.9 95.7
81 to 90 3.6 99.3
91 to 100 0.7 100
Total 100.0
According to Table 4.2, most of the students belong to low level mark categories. Nearly
38 percent of students have scored 30 or less than 30 marks and nearly 68 percent of
the students have scored 50 or less than 50 marks. If the students have been able to
display predicted learning outcomes, distribution of marks must be negatively skewed.
However, that doesn’t appear in the said distribution of marks of science. This
negatively skewed distribution of marks can be seen in almost all the provinces. This is
shown in Figure 4.3. According to this figure, Western and Sabaragamuwa Provinces do
not seem to have a highly positively skewed mark distribution. Meanwhile, Northern
and Central Provinces have a very high positively skewed distribution of marks.
Another important feature that can be seen in Figure 4.3 is that in most of the provinces
distributions of science marks are bimodal. This indicates that there are two main
groups of student in the population.

Chapter Four – Patterns in Achievement: Science 2014
41
.0
5.0
10.0
15.0
20.0
25.0
30.00
-10
11
to
20
21
to
30
31
to
40
41
to
50
51
to
60
61
to
70
71
to
80
81
to
90
91
to
10
0
Student
%
Marks
Western Province
.0
5.0
10.0
15.0
20.0
25.0
30.0
0-1
0
11
to
20
21
to
30
31
to
40
41
to
50
51
to
60
61
to
70
71
to
80
81
to
90
91
to
10
0
Student
%
Marks
Central Province
.0
5.0
10.0
15.0
20.0
25.0
30.0
0-1
0
11
to
20
21
to
30
31
to
40
41
to
50
51
to
60
61
to
70
71
to
80
81
to
90
91
to
10
0
Student
%
Marks
Southern Province
.0
5.0
10.0
15.0
20.0
25.0
30.0
0-1
0
11
to
20
21
to
30
31
to
40
41
to
50
51
to
60
61
to
70
71
to
80
81
to
90
91
to
10
0
Student
%
Marks
Northern Province
.0
5.0
10.0
15.0
20.0
25.0
30.0
0-1
0
11
to
20
21
to
30
31
to
40
41
to
50
51
to
60
61
to
70
71
to
80
81
to
90
91
to
10
0
Student
%
Marks
Eastern Province
.0
5.0
10.0
15.0
20.0
25.0
30.0
0-1
0
11
to
20
21
to
30
31
to
40
41
to
50
51
to
60
61
to
70
71
to
80
81
to
90
91
to
10
0
Student
%
Marks
North Western Province
.0
5.0
10.0
15.0
20.0
25.0
30.0
0-1
0
11
to
20
21
to
30
31
to
40
41
to
50
51
to
60
61
to
70
71
to
80
81
to
90
91
to
10
0
Student
%
Marks
North Central Province
.0
5.0
10.0
15.0
20.0
25.0
30.0
0-1
0
11
to
20
21
to
30
31
to
40
41
to
50
51
to
60
61
to
70
71
to
80
81
to
90
91
to
10
0
Student
%
Marks
Uva Province
.0
5.0
10.0
15.0
20.0
25.0
30.0
0-1
0
11
to
20
21
to
30
31
to
40
41
to
50
51
to
60
61
to
70
71
to
80
81
to
90
91
to
10
0
Student
%
Marks
Sabaragamuwa Province
Figure 4.3: Provincial-wise distribution of marks – Science

Chapter Four– Patterns in Achievement: Science 2014
42
Nature of the distribution of science marks is further elaborated by the box and whisker
plots in Figure 4.4. One important thing is that a group of student who scored very high
marks can be seen in Central and Northern provinces. These are the lowest performing
provinces. This is a situation to be studied further.
Figure 4.4: Science marks representation using boxplot and whisker plot
4.4 Disparities in Achievement in Science
Over the years various efforts have been made to provide equal opportunities for school
education in Sri Lanka. Yet, disparities in achievement of students in science in different
groups can still be seen owing to different factors. In this section, in what way the school
type, gender, medium of instruction and school location have an influence on these
disparities are discussed.
4.4.1 Disparities in Achievement in Science in Relation to School Type
Indicators of achievement levels of science according to the school type are given in
Table 4.3 which is given below.

Chapter Four – Patterns in Achievement: Science 2014
43
49
.18
32
.95
31
.24 4
1.1
649
.01
30
.22
28
.53
40
.05
0
10
20
30
40
50
60
70
1AB 1C Type 2 All Island
Ma
rks
School Type
Mean
Median
Table 4.3: Science achievement marks according to school type
School
Type Mean Standard
Deviation Median Skewness F P
1AB 49.18 20.99 49.01 0.07 30,719 .000
1C 32.95 16.74 30.22 0.74
Type 2 31.24 17.05 28.53 0.86
All Island 41.16 20.92 40.05 0.44
According to this table, lowest performance can be seen in Type 2 schools. Mean and
median values of these schools are 31.24 and 28.53 respectively. Meanwhile 1AB
schools show the highest performance levels. According to the F test, differences in
performance levels in three types of schools are statistically significant (p=0.00).
However, the difference between the achievement levels of students in Type 2 schools
and those of 1C schools is not so high. This is an indication of the commonality of factors
affecting achievement of students attending these two types of schools. This is
illustrated by both mean and median values. Mean values for 1C and Type 2 schools are
32.95 and 31.24 while median values are 30.22 and 28.53 for the same two types of
schools. Nevertheless, mean and median values of 1AB schools are respectively 49.18
and 49.01. These differences are further illustrated by Figure 4.5 below.
Figure 4.5: Mean values of science marks according to school type
Distribution of marks in achievement in science was analyzed in relation to school type.
This is given in Table 4.4 below and further illustrated by Figure 4.6. Both the table and
the figure show a highly positively skewed distribution of scores in 1C and Type 2
schools. Concerning 1AB schools scores are distributed with a positive skewness.

Chapter Four– Patterns in Achievement: Science 2014
44
0
5
10
15
20
25
30
Pe
rce
nta
ge
of
Stu
de
nts
Marks
1AB
1C
Type 2
However this skewness is very low when compared with 1C and Type 2 schools. This
indicates that the majority of students belonging to 1C and Type 2 schools have shown a
poor performance.
Table 4.4: Distribution of science achievement marks according to school type
Class
Interval
1AB
Student %
Cumulative
%
1C
Student %
Cumulative
%
Type 2
Student %
Cumulative
%
00-10 1.29 1.29 4.78 4.78 6.43 6.43
11-20 8.04 9.33 21.06 25.84 25.61 32.03
21-30 13.75 23.08 26.01 51.85 24.71 56.74
31-40 14.63 37.71 19.48 71.33 16.64 73.38
41-50 14.84 52.55 12.82 84.15 12.06 85.44
51-60 14.32 66.87 7.91 92.06 7.37 92.81
61-70 14.59 81.46 4.90 96.96 3.86 96.67
71-80 11.02 92.48 2.34 99.30 2.60 99.27
81-90 6.29 98.77 0.70 100.00 0.62 99.89
91-100 1.23 100.00 0.00 100.00 0.11 100.00
Total 100.00 100.00 100.00
Figure 4.6: Distribution of science achievement marks according to school type
4.4.2 Disparities in Achievement in Science in Relation to Gender
Gender has been an important area of disparities in the achievement levels of students
according to previous national assessment studies (Grade 4 and Grade 8) conducted by
NEREC. Table 4.5 shows indicators of achievement levels of boys and girls separately.

Chapter Four – Patterns in Achievement: Science 2014
45
39.4142.80 41.16
36.6140.52 40.05
0
10
20
30
40
50
60
70
Male Female All Island
Ma
rks
Gender
Mean
Median
Table 4.5: Science achievement marks according to gender
Gender Mean Standard
Deviation Median Skewness F P
Male 39.41 21.14 36.61 0.49 2,087 .000
Female 42.80 20.58 40.52 0.41
All Island 41.16 20.92 40.05 0.44
It is clear that achievement levels of girls is slightly higher than that of boys. The mean
value is 42.80 while the mean value of boys 39.41. This difference is further illustrated
by Figure 4.7.
Figure 4.7: Mean values of science marks according to gender
Further to the mean value, values of the median show this. The value of the median for
girls is 40.52 while the median value for boys is 36.61. However, this difference is not
very high compared with the differences related to school type, location of school and
medium of instruction.
The analysis of distribution of marks in science in relation to gender is given in Table
4.6 and further more it is shown in Figure 4.8. This analysis does not show a
considerable difference with regard to the distribution of marks in relation to male and
female. Both distributions are positively skewed. This indicates that the majority of
students in both groups belongs to lower level mark categories.

Chapter Four– Patterns in Achievement: Science 2014
46
0
5
10
15
20
25
30
Pe
rce
nta
ge
of
Stu
de
nts
Marks
Male
Female
Table 4.6: Distribution of science achievement marks according to gender
Class Interval Male
%
Cumulative
%
Female
%
Cumulative
%
00-10 4.59 4.59 1.99 1.99
11-20 17.71 22.30 12.55 14.54
21-30 19.44 41.73 19.25 33.79
31-40 15.34 57.08 17.43 51.22
41-50 13.15 70.23 14.30 65.52
51-60 10.31 80.54 11.99 77.51
61-70 9.28 89.83 10.28 87.79
71-80 6.21 96.03 7.63 95.42
81-90 3.42 99.45 3.81 99.22
91-100 0.55 100.00 0.78 100.00
Total 100.00 100.00
Figure 4.8: Distribution of science achievement marks according to gender
4.4.3 Disparities in Achievement in Science in Relation to Medium of
Instruction
In the present study, medium of instruction was taken into consideration as a factor that
apparently affect the achievement levels of students in science. Relevant statistics are
displayed in Table 4.7.

Chapter Four – Patterns in Achievement: Science 2014
47
44.30
32.38
41.1642.73
28.11
40.05
0.00
10.00
20.00
30.00
40.00
50.00
60.00
70.00
Sinhala Tamil All Island
Ma
rks
Medium
Mean
Median
Table 4.7: Science achievement marks according to medium of instruction
Medium Mean Standard
Deviation Median Skewness F P
Sinhala 44.30 20.98 42.73 0.30 21,188 .000
Tamil 32.38 10.09 28.11 0.87
All Island 41.16 20.92 40.05 0.44
According to the above table the performance level of students who study in Sinhala is
considerably higher than that of the students whose medium of instruction is Tamil.
While the mean value of Sinhala medium students is 44.30, the mean value of Tamil
medium students is 32.38. Furthermore, the median value of the Sinhala medium
students is 42.73 and the median value of the Tamil medium students is 28.11. This
difference is further shown by Figure 4.9 given below.
Figure 4.9: Mean values of science marks according to medium of instruction
One important thing is that though the medium of instruction for the two groups is
different, more often the two languages in which they study are their mother tongues.
When compared with the differences of achievement levels related to school type,
gender and the location of school, the difference concerning the medium of instruction
seems to be the highest. However, this can be due to some other factors associated with
these two different kinds of schools where the medium of instruction is different.

Chapter Four– Patterns in Achievement: Science 2014
48
0
5
10
15
20
25
30
Pe
rce
nta
ge
of
Stu
de
nts
Marks
Sinhala
Tamil
Distribution of marks of student achievement was analyzed for both Sinhala and Tamil
medium students. Such data are given in Table 4.8 below. For both groups, the
distributions of marks show a positive skewness. This skewness is very high for Tamil
medium students when compared with that of Sinhala medium students. This difference
in skewness in marks is once again illustrated in Figure 4.10. This indicates that the
majority of Tamil medium students who are in lower mark categories are higher than
those of Sinhala medium.
Table 4.8: Distribution of science achievement marks according to medium of instruction
Class
Interval
Sinhala
% Cumulative
%
Tamil
% Cumulative
%
00-10 2.25 2.25 6.00 6.00
11-20 11.58 13.83 24.74 30.74
21-30 17.42 31.25 24.73 55.46
31-40 16.43 47.68 16.42 71.89
41-50 14.62 62.30 11.29 83.18
51-60 12.62 74.92 7.14 90.32
61-70 11.42 86.34 5.26 95.58
71-80 8.31 94.65 3.11 98.69
81-90 4.45 99.10 1.29 99.98
91-100 0.90 100.00 0.02 100.00
Total 100.00 100.00
Figure 4.10: Distribution of science achievement marks according to medium of instruction

Chapter Four – Patterns in Achievement: Science 2014
49
49
.19
46
.50
37
.67
41
.1648
.71
46
.14
34
.38
40
.05
0
10
20
30
40
50
60
70
Municipal
Council
Urban Council Pradeshiya
Saba
All Island
Ma
rks
Location
Mean
Median
4.4.4 Disparities in Achievement in Science in Relation to Location of School
Location of the school is considered as one significant factor that could be influential for
the achievement levels of students in science. Table 4.9 show the differences in such
achievement levels of students in schools located in Municipal Council area, Urban
Council areas and Pradeshiya Saba areas.
Table 4.9: Science achievement marks according to location
Location Mean Standard
Deviation Median Skewness F P
Municipal Council 49.19 23.24 48.71 0.09 9,486 .000
Urban Council 46.50 21.34 46.14 0.07
Pradeshiya Saba 37.67 19.13 34.38 0.55
All Island 41.16 20.92 40.05 0.44
According to the indicators of achievement level given in Table 4.9, the highest
achievement level can be seen in schools located in Municipal Council areas. The mean
value of the achievement marks of students in schools that come under Municipal
council areas is 49.19. Meanwhile, the lowest achievement level recorded by schools
that come under Pradesiya Sabas shows a mean value of 37.67. The gap between these
mean values is noticeably high. Nonetheless, the difference between the achievement
levels of schools located in Municipal and Urban Council areas is not so high. The mean
value of achievement of students in science in schools located in Municipal Council
areas is 49.19 while the mean value of achievement in science in schools located in
Urban Council areas is 46.50. This is further shown by Figure 4.11.
Figure 4.11: Mean values of science marks according to location

Chapter Four– Patterns in Achievement: Science 2014
50
0
5
10
15
20
25
Pe
rce
nta
ge
of
Stu
de
nts
Marks
Municipal Council
Urban Council
Pradeshiya Saba
An analysis of the distribution of marks based on the location of school relating to
Municipal, Urban and Pradeshiya Saba areas were conducted. Data are presented in
Table 4.10 and further illustrated by Figure 4.12. It shows that there is no significant
difference between the distributions of marks in schools belonging to Municipal and
Urban Council areas. Concerning the Paradeshiya Saba schools distribution of marks is
highly positively skewed. One important finding according to this analysis is that that
the skewness of the distribution of marks in Municipal and Urban Council areas is
significantly lower than that of Pradeshiya Saba areas. This shows that the performance
of students in schools located in Municipal and Urban Council areas is more satisfactory
than that of Pardeshiya Saba areas.
Table 4.10: Distribution of science achievement marks according to location
Class
Interval
Municipal
Council %
Cumulative
%
Urban
Council %
Cumulative
%
Pradeshiya
Saba %
Cumulative
%
00-10 2.20 2.20 2.39 2.39 3.73 3.73
11-20 10.24 12.44 11.76 14.15 17.14 20.87
21-30 14.88 27.32 14.05 28.20 21.76 42.63
31-40 12.90 40.22 14.78 42.98 17.82 60.45
41-50 12.41 52.63 13.94 56.91 14.11 74.56
51-60 11.85 64.48 12.15 69.06 10.78 85.34
61-70 12.59 77.07 15.47 84.54 7.81 93.14
71-80 11.95 89.02 9.65 94.19 4.89 98.03
81-90 8.75 97.76 5.45 99.64 1.71 99.74
91-100 2.24 100.00 0.36 100.00 0.26 100.00
Total 100 100 100
Figure 4.12: Distribution of science achievement marks according to location

Chapter Four – Patterns in Achievement: Science 2014
51
48
.10
37
.67
41
.1647
.41
34
.31
40
.05
0.00
10.00
20.00
30.00
40.00
50.00
60.00
70.00
Urban Rural All Island
Ma
rks
Gender
Mean
Median
Table 4.11 shows science performance of students who attends to schools located in
urban areas and rural areas separately. It clearly shows that the performance level of
the students in urban areas (Mean = 48.10) considerably higher than that of the
students in rural areas (Mean = 37.67). This is further illustrated by Figure 4.13.
Table 4.11: Science achievement marks according to location - Urban/Rural
Location Mean Standard
Deviation Median Skewness F P
Urban 48.10 22.54 47.41 0.10 18,500.96 .000
Rural 37.67 19.13 34.31 0.55
All Island 41.16 20.92 40.05 0.44
Figure 4.13: Mean values of science marks according to location – Urban/Rural
Further to the above analysis, distribution of scores was analyzed based on urban and
rural categorizations. Analyzed data are given in Table 4.12 Findings show that the
distribution of marks of students belonging to rural areas is highly positively skewed
while the distribution marks of students in urban areas are slightly positively skewed.
This again confirms the unsatisfactory achievement in rural areas.

Chapter Four– Patterns in Achievement: Science 2014
52
0
5
10
15
20
25
30
Pe
rce
nta
ge
of
Stu
de
nts
Marks
Urban
Rural
Table 4.12: Distribution of science achievement marks according to location –
Urban/Rural
Class
Interval
Urban
%
Cumulative
%
Rural
%
Cumulative
%
00-10 2.28 2.28 3.73 3.73
11-20 10.86 13.13 17.14 20.87
21-30 14.54 27.67 21.76 42.63
31-40 13.66 41.33 17.82 60.45
41-50 13.03 54.36 14.11 74.56
51-60 11.97 66.33 10.78 85.34
61-70 13.76 80.09 7.81 93.14
71-80 11.02 91.11 4.89 98.03
81-90 7.41 98.52 1.71 99.74
91-100 1.48 100.00 0.26 100.00
Total 100.00 100.00
Figure 4.14: Distribution of science achievement marks according to location – Urban/Rural
4.5 Achievement of Science by Competency Levels
It is important to see to what extent, students have been able to achieve the expected
competencies related to science in Grade 8. The test which was administered to assess
the achievement level of science was principally based on competencies and
competency levels in science. The percentage of students who achieved the expected
competency levels according to the results of the test was analyzed. This was done for
four areas in science separately. They are biology, chemestry, earth science and physics.

Chapter Four – Patterns in Achievement: Science 2014
53
4.5.1 Achievement of Competency Levels Related to Biology
Percentages of students who achieved different competency levels related to biology
ware analyzed and are given in Table 4.13 below.
Table 4.13: Achievement of competency levels related to biology
Content Competency Level Percentage
Biology
1.1 Discovers the diversity of the natural environments 42
1.2 Investigates the advantages/disadvantages of the built
environments 40
1.3 Focuses attention on the venomous animals that are
harmful to man 68
1.4 Acquires the ability to use international scientific symbols 59
3.1 Observes the interactions based on life cycles 36
3.3 Explains the importance of use of cultivations under specific conditions
62
3.4 Investigates the biotic factors affecting the perpetuation of
the environment. 45
6.1 Conducts explorations to identify the morphological
diversity of leaves 8
6.3 Investigates the functions related to the diversity of roots. 33
6.4 Uses plant related products with a scientific attitude 40
Average 43
According to the above Table, the competency level 1.3, (‘focuses attention on the
venomous animals that are harmful to the man’) has been achieved by the highest
percentage of students which is 68. On the other hand, competency level 6.1, (‘Conducts
explorations to identify the morphological diversity of leaves’) has been achieved by
eight percent of the students and it is the lowest percentage according to the Table.
Another significant finding is that more than 50 percent of students have been able to
achieve only 3 competency levels out of the 10 competency levels which were tested. As
a whole, only 43 percent of students have been able to achieve expected competency
levels. This is further illustrated by Figure 4.15.

Chapter Four– Patterns in Achievement: Science 2014
54
42 40
68
59
36
62
45
8
33
40
0
10
20
30
40
50
60
70
80
1.1 1.2 1.3 1.4 3.1 3.3 3.4 6.1 6.3 6.4
Pe
rce
nta
ge
Competency Level
Figure 4.15: Achievement of competency levels related to biology
4.5.2 Achievement of Competency Levels Related to Chemistry
Table 4.14: Achievement of competency levels related to chemistry
Content Competency Level Percentage
Chemistry
2.1 Inquires into the properties of matter 50
2.2 Inquires into the standard symbols used for elements 47
2.3 Display the ability to use the differences in density of
substances in day today life. 41
2.4 Uses the expansion of solids, liquids and gases in day
today life effectively. 8
2.5 Inquires into the usages of compounds according to
their properties. 25
2.6 Inquires into the domestic uses of chemicals 21
2.7 Uses parallel and serial connections of electrical appliances in human needs.
44
2.8 Uses magnets in day today life 53
Average 36
Analysis related to chemistry shows that highest percentage of students (53) have been
able to achieve the competency level 2.8, (Uses magnets in day today life). On the other
hand, the lowest percentage of students (8) has achieved the competency level 2.4 (Uses
the expansion of solids, liquids and gases in day today life effectively).

Chapter Four – Patterns in Achievement: Science 2014
55
55
.7
37
.8 42
.1
65
35
.6
38
.5
50
.1
58
.5
0
10
20
30
40
50
60
70
2.1 2.2 2.3 2.4 2.5 2.6 2.7 2.8
Pe
rce
nta
ge
Competency Level
According to the above analysis, only 2 competency levels out of the tested 10 have
been achieved by majority of students. These two, however, are related to knowledge.
They are, ‘inquiries into the properties of matter’ and ‘uses magnets in day today life’. In
general, 36 percent of the students have been able to achieve the expected
competencies which were tested in the study.
Figure 4.16: Achievement of competency levels related to chemistry
4.5.3 Achievement of Competency Levels Related to Earth Science
Table 4.15: Achievement of competency levels related to earth science
Content Competency Level Percentage
Earth science
4.1 Investigates the constituents of the atmosphere 32
4.2 Acts to maintain optimum composition of the
atmosphere 38
4.3 Uses natural resources obtained from the earth
effectively 47
Average 39
The highest percentage of students has achieved the competency 4.3 (uses of natural
resources obtained from the earth effectively) while the least percentage (32%) has
been able to achieve the competency level 4.1 (investigates the constituents of the
atmosphere). Thus according to the above table, the majority of the students have not
been successful in achieving any one of the competencies. The overall percentage of the
students who achieved the expected competency levels is 39. This is also less than 50
and may be viewed as an undesirable situation.

Chapter Four– Patterns in Achievement: Science 2014
56
32
38
47
0
5
10
15
20
25
30
35
40
45
50
4.1 4.2 4.3
Pe
rce
nta
ge
Competency Levle
Figure 4.17: Achievement of competency levels related to earth science
4.5.4 Achievement of Competency Levels Related to Physics
Table 4.16: Achievement of competency levels related to physics
Content Competency Level Percentage
Physics
5.1 Inquires into the application of the concept “pressure” in day
today needs 22
5.2 Inquires into the effect of Center of Gravity on the equilibrium of
an object in relation to life experiences 58
5.3 Uses work, energy and power in human concerns/needs 31
7.1 Uses properties of light in human needs 21
7.2 Uses generation and propagation of sound in musical instruments 17
7.3 Explores the scientific basis of modern communication equipment 31
8.1 Contribute to minimize the risks associated with cyclones 44
8.2 Contribute to minimize the risks associated with lightning and
thunder 59
Average 35
Compared to the overall percentages of each branch in Science, students have achieved
the lowest for Physics (35%). Analysis by competency level shows that highest
percentage of the students possesses the required knowledge in minimizing the risks
associated with lightning and thunder (59%) and effect of Center of Gravity on the
equilibrium of an object in relation to life experiences (58%). Thirty percent of students
have achieved the competency in applying scientific concepts of work; energy and
power in human concerns/needs, while a similar percentage has the knowledge in
relation to the scientific basis of modern communication equipment. However, the

Chapter Four – Patterns in Achievement: Science 2014
57
22
58
31
2117
31
44
59
0
10
20
30
40
50
60
70
5.1 5.2 5.3 7.1 7.2 7.3 8.1 8.2
Pe
rce
nta
ge
Competency Level
above table indicates that the lowest percentage (17%) of students has achieved the
competency in applying skill in relation to ‘uses generation and propagation of sound in
musical instruments’. It also reveals that applying scientific knowledge in real world
situations in relation to pressure as well as properties of light is not satisfactory.
Figure 4.18: Achievement of competency levels related to physics
4.6 Summary
This chapter presented the achievement levels of science. The average achievement of
science is 41.16. The majority of students belong to low marks category. There are
disparities in achievement in science with regard to school type, gender, medium of
instruction and location of school. Achievement level of the students of 1AB schools is
higher than that of 1C and Type 2 schools. Girls’ performance is higher than that of boys.
Achievement level of Sinhala medium students is also higher than that of Tamil medium
students. A significant disparity in the achievement level of competencies related to
biology, chemistry, physics and earth sciences tested under the general term ‘science’ is
not noticed.

Chapter Four– Patterns in Achievement: Science 2014
58

59
Patterns in Achievement –
English Language 2014
5.1 Introduction
The achievement of English language based on the marks of the English language test
which was administered to students completing grade 8 in year 2014 will be discussed
in this chapter. First the achievement levels of students and the nature of the
distribution of marks are analyzed. Next, disparities in achievement levels in relation to
school type, gender, medium of instruction and location of school are presented.
Differences in achievement pertaining to various provinces are also analyzed. English
language achievement too is assessed by various competencies and competency levels.
5.2 Achievement Levels in English Language at All Island and
Provincial Levels
Based on the mean and the median values of the test marks, the achievement levels are
discussed. These are the indicators normally used to assess the level of performance
especially, median can be used as a representative value of a set of data when the
distribution of values is considerably skewed. Those values related to English language
results are given in Table 5.1 below.
Chapter Five

Chapter Five – Patterns in Achievement: English Language 2014
60
Table 5.1: All island and provincial achievement in English language 2014 –
Summary statistics
Province
Me
an
Ra
nk
Sta
nd
ard
De
via
tio
n
Sta
nd
ard
Err
or
of
Me
an
Pe
rce
nti
le
(p2
5)=
Q1
Me
dia
n
(p5
0)=
Q2
Pe
rce
nti
le
(p7
5)=
Q3
Sk
ew
ne
ss
Western 41.04 1 20.86 0.08 26.41 34.51 56.71 0.73
Southern 37.27 2 19.75 0.10 24.21 30.71 46.61 1.11
North Western 35.11 3 17.76 0.09 22.11 30.05 44.41 1.12
Sabaragamuwa 34.87 4 16.60 0.10 22.61 30.21 44.71 1.03
Central 33.82 5 17.82 0.09 22.21 30.41 42.31 1.23
Uva 31.86 6 15.79 0.11 22.35 28.61 75.21 1.29
Eastern 31.28 7 14.27 0.08 22.50 28.21 38.01 1.01
North Central 29.81 8 13.32 0.09 20.87 28.35 34.51 1.29
Northern 29.24 9 15.87 0.11 18.21 24.41 34.41 1.65
All Island 35.23 18.32 0.03 22.31 30.05 44.31 1.13
According to Table 5.1, all island mean value of achievement test marks is 35.23. This
cannot be taken as a satisfactory level. On the other hand, the median value is 30.05
which can be considered as another representative value of achievement level. This
value further confirms the unsatisfactory level of the achievement of English language.
Dispersion of marks also seems to be considerably high. Standard deviation is 18.32.
This is indicative of the fact that disparities in student achievement are very high.
All island and provincial level achievement further presented by Figure 5.1 below.
The mean values of marks related to achievement in English language of Central
Province, Northern Province, Eastern Province, North Central Province, Uva Province
and Sabaragamuwa Province are below 35. The median values of these provinces are
also below 35. The mean values of the other provinces are above 35. However, the
median values of these provinces also are below 35. On the other hand, in all the
provinces mean values and median values are below 40 except Western Province where
the mean value is 41.04. This indicates that achievement levels of students in English
language are not satisfactory.

Chapter Five – Patterns in Achievement: English Language 2014
61
1.5
19.5
32.8
17.9
9.9
7
4.4 4.12.6
0.30
5
10
15
20
25
30
35
0-1
0
11
to
20
21
to
30
31
to
40
41
to
50
51
to
60
61
to
70
71
to
80
81
to
90
91
to
10
0
Stu
de
nt
Pe
rce
nta
ge
Class Interval
41
.04
37
.27
35
.11
34
.87
33
.82
31
.86
31
.28
29
.81
29
.24 35
.23
34
.51
30
.71
30
.05
30
.21
30
.41
28
.61
28
.21
28
.35
24
.41
30
.05
0
10
20
30
40
50
60
70
Ma
rks
Province
Mean
Median
Figure 5.1: Mean values and median values of English language marks
5.3 Distribution of Test Scores of English Language
The nature of the distribution of test scores of the English language is presented by
Figure 5.2 and Table 5.2.
Figure 5.2: All island achievement in English language –distribution of marks
Skewness = 1.13
Mean = 35.23
Median = 30.05

Chapter Five – Patterns in Achievement: English Language 2014
62
Table 5.2: Distribution of all island achievement marks of English language
Class Interval Student
%
Cumulative
%
00 to 10 1.5 1.5
11 to 20 19.5 21.0
21 to 30 32.8 53.9
31 to 40 17.9 71.8
41 to 50 9.9 81.7
51 to 60 7.0 88.7
61 to 70 4.4 93.1
71 to 80 4.1 97.1
81 to 90 2.6 99.7
91 to 100 0.3 100.0
Total 100.0
According to Figure 5.2, it can clearly be seen that the marks are positively skewed
(SK=1.13). This indicates that majority of students tends to be lower achievers in
English language. In addition, Table 5.2 shows that most of the students belong to score
categories of lower levels. Nearly 82 percent of the total number of students belongs 50
or less than 50 marks categories. Almost 70 percent of students belong to 11-40 mark
category.
Positively skewed marks distribution, can be seen in all the provinces with a slight
variations in the skewness. This is shown by Figure 5.3
This highly positive distribution of marks is not a satisfactory situation regarding
achievement levels. It carries the need to rethink the effort made to enhance the
achievement level of English language of students in this grade.

Chapter Five – Patterns in Achievement: English Language 2014
63
.0
5.0
10.0
15.0
20.0
25.0
30.0
35.0
40.0
0-1
0
11
to
20
21
to
30
31
to
40
41
to
50
51
to
60
61
to
70
71
to
80
81
to
90
91
to
10
0
Student
%
Marks
Western Province
.0
5.0
10.0
15.0
20.0
25.0
30.0
35.0
40.0
0-1
0
11
to
20
21
to
30
31
to
40
41
to
50
51
to
60
61
to
70
71
to
80
81
to
90
91
to
10
0
Student
%
Marks
Central Province
.0
5.0
10.0
15.0
20.0
25.0
30.0
35.0
40.0
0-1
0
11
to
20
21
to
30
31
to
40
41
to
50
51
to
60
61
to
70
71
to
80
81
to
90
91
to
10
0
Student
%
Marks
Southern Province
.0
5.0
10.0
15.0
20.0
25.0
30.0
35.0
40.0
0-1
0
11
to
20
21
to
30
31
to
40
41
to
50
51
to
60
61
to
70
71
to
80
81
to
90
91
to
10
0
Student
%
Marks
Northern Province
.0
5.0
10.0
15.0
20.0
25.0
30.0
35.0
40.0
0-1
0
11
to
20
21
to
30
31
to
40
41
to
50
51
to
60
61
to
70
71
to
80
81
to
90
91
to
10
0
Student
%
Marks
Eastern Province
.0
5.0
10.0
15.0
20.0
25.0
30.0
35.0
40.0
0-1
0
11
to
20
21
to
30
31
to
40
41
to
50
51
to
60
61
to
70
71
to
80
81
to
90
91
to
10
0
Student
%
Marks
North Western Province
.0
5.0
10.0
15.0
20.0
25.0
30.0
35.0
40.0
45.0
0-1
0
11
to
20
21
to
30
31
to
40
41
to
50
51
to
60
61
to
70
71
to
80
81
to
90
91
to
10
0
Student
%
Marks
North Central Province
.0
5.0
10.0
15.0
20.0
25.0
30.0
35.0
40.0
0-1
0
11
to
20
21
to
30
31
to
40
41
to
50
51
to
60
61
to
70
71
to
80
81
to
90
91
to
10
0
Student
%
Makrs
Uva Province
.0
5.0
10.0
15.0
20.0
25.0
30.0
35.0
40.0
0-1
0
11
to
20
21
to
30
31
to
40
41
to
50
51
to
60
61
to
70
71
to
80
81
to
90
91
to
10
0
Student
%
Makrs
Sabaragamuwa Province
Figure 5.3: Provincial-wise distribution of marks – English language

Chapter Five – Patterns in Achievement: English Language 2014
64
Patterns of achievement of English language are further elaborated by the box and
whisker plots in Figure 5.4 below. Small circles in the figure represent the students who
have taken extremely high marks (outliers). The figure clearly shows that in almost all
the provinces, there is a small group of students who shows extremely high
achievement levels although the achievement in general is low in all these provinces
except in Western Province. This is an important phenomenon to be investigated
further.
Figure 5.4: English language marks representation using boxplot and whisker plot
5.4 Disparities in Achievement in English Language
Under the disparities in achievement four particular aspects of disparities are
discussed. Disparities in relation to school type, gender, medium of instruction and
school location are analyzed in this way.

Chapter Five – Patterns in Achievement: English Language 2014
65
41
.64
28
.28
27
.58 35
.23
36
.27
26
.51
24
.64
30
.05
0
10
20
30
40
50
60
70
1AB 1C Type 2 All Island
Ma
rks
School Type
Mean
Median
5.4.1 Disparities in Achievement in English Language in Relation to School Type
It is well known that various efforts and strategies have been taken to provide equal
opportunities for students irrespective of the type of school which they attend.
However, according to the Table 5.3, and Figure 5.5, there are noticeable discrepancies
in levels of achievement of students attending different types of schools.
Table 5.3: English language achievement marks according to school type
School
Type
Mean Standard
Deviation
Median Skewness F P
1AB 41.64 20.28 36.27 0.71 25,252 .000
1C 28.28 11.90 26.51 1.27
Type 2 27.58 12.94 24.64 1.45
All Island 35.23 18.32 30.05 1.13
Figure 5.5: Mean values of English language marks according to school type
The achievement levels of students attending 1AB schools seem to be higher (mean-
41.64) than that of those who are attending 1C schools (mean=28.28) and Type 2
schools (mean=27.58). However, there is no considerable disparity in achievement
levels of students attending 1C and Type 2 schools. Meanwhile it clearly shows that the
dispersion of marks of the students attending 1AB schools is very high when compared
with other schools.

Chapter Five – Patterns in Achievement: English Language 2014
66
0
5
10
15
20
25
30
35
40
45
Pe
rce
nta
ge
of
Stu
de
nts
Marks
1AB
1C
Type 2
In addition to the analysis conducted to see the disparities in English language
achievement pertaining to school type, the distribution of marks of the same is given
below in Table 5.4. It shows that the same pattern of distribution can be seen with regard
to 1C and Type 2 schools. In other words, distribution of marks is highly positively
skewed. This distribution shows low achievement of students in these schools. However,
distribution of marks related to 1AB schools shows somewhat satisfactory level of
achievement when compared with those of the other two types of schools. These patterns
can be observed in Figure 5.6.
Table 5.4: Distribution of English language achievement marks according to school type
Class
Interval
1AB
Student
%
Cumulative
%
1C
Student
%
Cumulative
%
Type 2
Student
%
Cumulative
%
00-10 0.65 0.65 1.88 1.88 3.49 3.49
11-20 12.33 12.98 26.00 27.88 30.34 33.83
21-30 26.15 39.13 41.73 69.61 38.15 71.97
31-40 19.13 58.26 17.33 86.95 15.20 87.17
41-50 12.73 70.99 6.98 93.93 6.06 93.23
51-60 9.92 80.91 3.81 97.74 3.55 96.78
61-70 6.67 87.58 1.61 99.35 2.32 99.10
71-80 7.06 94.64 0.62 99.97 0.75 99.85
81-90 4.76 99.40 0.03 100.00 0.15 100.00
91-100 0.60 100.00 0.00 100.00 0.00 100.00
Total 100.00 100.00 100.00
Figure 5.6: Distribution of English language achievement marks according to school type

Chapter Five – Patterns in Achievement: English Language 2014
67
32.40
37.8735.23
28.3132.15
30.05
0.00
10.00
20.00
30.00
40.00
50.00
60.00
70.00
Male Female All Island
Ma
rks
Gender
Mean
Median
5.4.2 Disparities in Achievement in English Language in Relation to Gender
Confirming the general trend in other research findings conducted by NEREC, this study
too shows that the achievement levels in English of girls are higher than that of boys.
The mean value of test marks of girls is 37.87 and for boys it is 32.40. This tendency can
be seen even by comparing the median values. The median value related achievement of
girls is 32.15. And for the boys it is 28.31. Table 5.5 and Figure 5.7 show this.
Table 5.5: English language achievement marks according to gender
Gender Mean Standard
Deviation
Median Skewness F P
Male 32.40 16.89 28.31 1.34 7,168.95 .000
Female 37.87 19.18 32.15 0.95
All Island 35.23 18.32 30.05 1.13
Figure 5.7: Mean values of English language marks according to gender
Distribution of marks in English language was analyzed according to gender as well.
Such data are given in Table 5.6 and further highlighted in Figure 5.8. According to both
the table and the figure, distribution of marks of both male and female students is
positively skewed. It further shows that girls’ performance is better than that of boys.
Similar observations were made in distribution of marks concerning science and
mathematics as well.

Chapter Five – Patterns in Achievement: English Language 2014
68
0
5
10
15
20
25
30
35
40
Pe
rce
nta
ge
of
Stu
de
nts
Marks
Male
Female
Table 5.6: Distribution of English language achievement marks according to gender
Class Interval Male
% Cumulative
% Female
% Cumulative
%
00-10 2.08 2.08 0.98 0.98
11-20 23.21 25.29 16.09 17.08
21-30 35.56 60.85 30.31 47.39
31-40 17.12 77.97 18.64 66.03
41-50 8.12 86.09 11.49 77.51
51-60 5.64 91.74 8.27 85.79
61-70 3.47 95.21 5.30 91.09
71-80 3.07 98.28 4.96 96.05
81-90 1.46 99.74 3.58 99.63
91-100 0.26 100.00 0.37 100.00
Total 100.00 100.00
Table 5.8: Distribution of English language achievement marks according to gender
5.4.3 Disparities in Achievement in English Language in Relation to
Medium of Instruction
According to the Table 5.7 which is given below, considerable difference of achievement
can be seen in relation to medium of instruction. The mean value of achievement of
English language in students studying in Tamil medium is lower (28.58) than that of
Sinhala medium students (37.49). This difference can be observed even when the values
of median of both groups are compared as well.

Chapter Five – Patterns in Achievement: English Language 2014
69
37.49
28.58
35.2332.71
26.15
30.05
0
10
20
30
40
50
60
70
Sinhala Tamil All Island
Ma
rks
Medium
Mean
Median
Table 5.7: English language achievement marks according to medium of instruction
Medium of
Instruction Mean Standard
Deviation Median Skewness F P
Sinhala 37.49 19.26 32.71 0.98 14,772 .000
Tamil 28.58 13.08 26.15 1.36
All Island 35.23 18.32 30.05 1.13
Figure 5.9: Mean values of English language marks according to medium of instruction
Disparities in achievement of students in both Sinhala and Tamil media were studied by
analyzing the nature of the distribution of marks in English language. Both distributions
are positively skewed. However, skewness of the distribution of marks of Tamil medium
students is somewhat higher than that of the Sinhala medium students. This shows that
the achievement in English of Tamil medium students is not so satisfactory when
compared with Sinhala medium students. Data are given in Table 5.8 and in Figure 5.10.

Chapter Five – Patterns in Achievement: English Language 2014
70
0
5
10
15
20
25
30
35
40
Pe
rce
nta
ge
of
Stu
de
nts
Marks
Sinhala
Tamil
Table 5.8: Distribution of English language achievement marks according to medium of
instruction
Class
Interval
Sinhala
% Cumulative
%
Tamil
% Cumulative
%
00-10 1.21 1.21 2.37 2.37
11-20 16.99 18.20 26.75 29.12
21-30 31.13 49.33 37.79 66.91
31-40 18.56 67.90 16.12 83.03
41-50 10.61 78.51 7.77 90.80
51-60 8.03 86.54 4.06 94.86
61-70 5.07 91.61 2.59 97.45
71-80 4.73 96.33 2.09 99.54
81-90 3.24 99.57 0.46 100.00
91-100 0.43 100.00 0.00 100.00
Total 100.00 100.00
Figure 5.10: Distribution of English language achievement marks according to medium of
instruction
5.4.4 Disparities in Achievement in English Language in Relation to
Location of School
Achievement disparities can be observed in relation to the locations of schools as well.
Schools belonging to areas that come under Municipal Councils show higher
achievement levels (mean=47.17) than those belonging to Urban Council areas
(mean=40.01) and Pradeshiya Sabas (mean=30.52). Schools belonging to Pradeshiya

Chapter Five – Patterns in Achievement: English Language 2014
71
47.17
40.01
30.5235.23
42.22
36.71
28.15 30.05
0
10
20
30
40
50
60
70
Municipal
Council
Urban
Council
Pradeshiya
Saba
All Island
Ma
rks
Location
Mean
Median
sabas show lower achievement than those belonging to Urban Councils. This can be
seen in Table 5.9.
Table 5.9: English language achievement marks according to location
Location Mean Standard
Deviation
Median Skewness F P
Municipal
Council 47.17 23.17 42.22 0.36 25,691 .000
Urban Council 40.01 18.07 36.71 0.65
Pradeshiya
Saba 30.52 14.25 28.15 1.32
All Island 35.23 18.32 30.05 1.13
Figure 5.11: Mean values of English language marks according to location
Considering location of Sri Lankan schools belonging to every province, these
disparities are universal.
Disparities in achievement of students in English language with regard to the location of
school can be seen when the distribution of marks is analyzed. The highest positive
skewness in the distribution of marks can be seen in students in Pradeshiya saba areas
while the lowest is seen in Municipal council areas. This is shown in Table 5.10 and in
Figure 5.12. This shows that the achievement of students in Municipal Council areas is
better than those of the other two areas and the achievement of students in Urban
Council areas is better than that of the Pradeshiya Saba areas.

Chapter Five – Patterns in Achievement: English Language 2014
72
0.00
5.00
10.00
15.00
20.00
25.00
30.00
35.00
40.00
Pe
rce
nta
ge
of
Stu
de
nts
Marks
Municipal Council
Urban Council
Pradeshiya Saba
Table 5.10: Distribution of English language achievement marks according to location
Class
Interval
Municipal
Council %
Cumulative
%
Urban
Council %
Cumulative
%
Pradeshiya
Saba %
Cumulative
%
00-10 0.91 0.91 0.77 0.77 1.85 1.85
11-20 11.09 12.00 11.83 12.60 23.75 25.60
21-30 21.45 33.45 26.39 38.99 37.73 63.33
31-40 15.67 49.12 20.27 59.26 18.12 81.45
41-50 10.81 59.93 13.69 72.94 8.78 90.22
51-60 9.54 69.47 12.56 85.51 5.06 95.29
61-70 8.35 77.83 7.10 92.61 2.64 97.92
71-80 11.26 89.09 5.24 97.85 1.56 99.48
81-90 9.60 98.69 2.11 99.96 0.45 99.94
91-100 1.31 100.00 0.04 100.00 0.06 100.00
Total 100 100 100
Figure 5.12: Distribution of English language achievement marks according to location
English language performance level of students who attends to schools in urban areas is
considerably high (Mean =44.32) compared with the achievement level of students
attending to schools located in rural areas (Mean =30.53). Figure 5.13 shows this
clearly.

Chapter Five – Patterns in Achievement: English Language 2014
73
44.32
30.53
35.2338.41
28.32 30.05
0
10
20
30
40
50
60
70
Urban Rural All Island
Ma
rks
Gender
Mean
Median
Table 5.11: English language achievement marks according to location - Urban /Rural
Location Mean Standard
Deviation Median Skewness F P
Urban 44.32 21.57 38.41 0.52 46,122.52 .000
Rural 30.53 14.26 28.32 1.32
All Island 35.23 18.32 30.05 1.13
Figure 5.13: Mean values of English language marks according to location- Urban/Rural
When schools are classified according to urban and rural categories, a difference
between the distribution of marks of schools belonging to urban and rural areas can be
seen. With regard to the nature of the distribution of marks of students in both urban
and rural areas, a positive skewness is seen. However, the skewness is higher
concerning rural areas. This further highlights low achievement of students in English
language in rural areas. These are shown in Table 5.12 and in Figure 5.14.

Chapter Five – Patterns in Achievement: English Language 2014
74
Table 5.12: Distribution of English language achievement marks according to location –
Urban/Rural
Class
Interval
Urban
%
Cumulative
%
Rural
%
Cumulative
%
00-10 0.85 0.85 1.85 1.85
11-20 11.39 12.24 23.75 25.60
21-30 23.42 35.66 37.73 63.33
31-40 17.50 53.16 18.12 81.45
41-50 11.96 65.12 8.78 90.22
51-60 10.75 75.87 5.06 95.29
61-70 7.85 83.72 2.64 97.92
71-80 8.86 92.58 1.56 99.48
81-90 6.61 99.20 0.45 99.94
91-100 0.80 100.00 0.06 100.00
Total 100.00 100.00
0
5
10
15
20
25
30
35
40
Pe
rce
nta
ge
of
Stu
de
nts
Marks
Urban
Rural
Figure 5.14: Distribution of English language achievement marks according to location –
Urban/Rural
5.5 Achievement of English Language by Competency Levels
Learning outcomes of English language were assessed based on different competencies
and competency levels. Competencies related to four areas were especially tested. They
are writing, grammar, reading and vocabulary. The percentages of students who
achieved different competency levels are given in Table 5.13 and they are further
illustrated by Figure 5.15

Chapter Five – Patterns in Achievement: English Language 2014
75
49.6
40.4
54.3
35.72
46.54 45.4 44.4747.3
0
10
20
30
40
50
60
4.4 4.5 4.6 5.4. 5.5. 6.2. 6.6. 2.4
Vocabulary Reading Grammar Writing
Pe
rce
nta
ge
Competency Level
Table 5.13: Achievement of competency levels – English language
Competency Competency Level Percentage
Average
Percentage
Vocabulary
4.4 Uses English words in the proper contexts 49.6
48.1 4.5 uses the dictionary effectively 40.4
4.6 uses visual clues and contextual clues to derive the meaning of words
54.3
Reading 5.4. Transfers information into other forms 35.7
41.1 5.5. Extracts the general idea of a text 46.5
Grammar
6.2. Analyze the grammatical relations within a sentence
45.4
44.9 6.6.Construct complex sentences through the process of subordination
44.4
Writing
2.4 Uses commas with understanding 47.3
7.5. Writes short stories 10.5
7.6. writes brief notes 0.7
Figure 5.15: Achievement of competency levels – English language
In relation to vocabulary, out of the three competency levels that were tested, only one
has been achieved by the majority of students. That is the ability to ‘use visual clues and
contextual clues to derive the meaning of words’. This has been achieved by 54.3
percent of the students. The average percentage of students who achieved the expected
competency levels in vocabulary is 48.1 percent.

Chapter Five – Patterns in Achievement: English Language 2014
76
With regard to competencies in reading, 41.1 percent of students have achieved the
expected competency levels. In this regard, the students are able to ‘transfers
information into other forms and extract the general idea of a text’. Concerning
grammar, the percentage of students who have been able to achieve expected
competency levels is 44.9. Two competency levels assessed in this area were to ‘analyze
the grammatical relations within a sentence’ and ‘construct complex sentences through
the process of subordination’. These have been achieved by 45.4 and 44.4 percentage of
students respectively.
The poorest achievement is shown in the skill ‘writing’. Most of the students have not
attempted to answer the given questions related to writing task. Table 5.14 shows the
performance indicated by the marks obtained for writing a brief note.
Table 5.14: Performance in writing a brief note
Not
Attempted
Attempted
Marks 0 1 2 3 4 5 Total
% 60 7.7 3.9 5.3 6.9 6.4 10.5 100
According to Table 5.14, only a very small percentage of students have been able to
achieve the expected level in writing a brief note. Only 10.5 % of the students have been
able to score the highest mark for this writing task. Writing a guided short story was
another question to assess the competencies that relate to the skill, writing.
Performance achieved in this regard denoted by the marks obtained is given in Table
5.15.
Table 5.15: Performance in writing a guided short story
Not
Attempted
Attempted
Marks 0 1 2 3 4 5 6 7 8 9 10 Total
% 75 10 2.2 2.5 1.7 2.1 2.6 2 1.8 1.8 1.4 0.7 100
In this task too, majority of the students has not attempted to answer the question.
According to Table 5.15 achievement level in this task is not satisfactory. Only 0.7
percent of the students have been able to score the total marks for this question. In
general, achievement of competency levels with regard to writing is not satisfactory.

Chapter Five – Patterns in Achievement: English Language 2014
77
5.6 Summary
The achievement of English language test which was administered to students
completing grade 8 in year 2014 was discussed in this chapter. The average
achievement of English language is 35.23. The distribution of marks of English Language
is highly positively skewed indicating that the majority of students belong to low marks
category. There are disparities in achievement pertaining to school type, gender,
medium of instruction and location. Competency levels related to writing show less
achievement.

Chapter Five – Patterns in Achievement: English Language 2014
78

79
Conclusion
6.1 Introduction
This concluding chapter will focus on key patterns in achievement unearthed through
the National Assessment of Achievement of Students Completing Grade 8 in Year 2014.
It presents an overall evaluation of findings in relation to various patterns identified
through the study. It analyzes the key patterns recognized against the objectives of the
national study. The chapter ends with a discussion on additional action to be taken at all
island level to maximize more equitable provision of education.
6.2 Conclusions Based on the Findings on the National Assessment
2014
6.2.1 Achievement Level of Students
The achievement of mathematics (mean=50.87 and median=47.51) is relatively more
satisfactory when compared with those of science and English language. The
achievement of science (mean=41.16 and median=40.05) is lower than that of
mathematics. Achievement of English language is the lowest of all three subjects with a
mean of 35.23 and median of 30.05 respectively. For all three subjects, the achievement
level is above 35 while the mean value for overall achievement in mathematics is above
50. This shows that at this national assessment, mathematics, despite being a difficult
subject for students, has recorded the highest performance against the other two
subjects.
Chapter Six

Chapter Six – Conclusion and the Way Forward
80
6.2.2 Distribution of Marks in Achievement
The nature of the distribution of marks can be considered as an indicator of the
performance levels of students. The overall distribution of marks of mathematics is
positively skewed. Yet, this skewness is quite marginal. On the other hand, the skewness
of the distribution of marks of English as well as science, which is positive, is
conspicuously higher than those of the other two subjects. Nevertheless, one noticeable
finding is that 1AB schools belonging to Municipal and Urban Council areas show either
negatively or very low positively skewed distribution indicating somewhat satisfactory
performance in all three subjects while 1C and Type 2 schools and schools belonging to
Pradeshiya Sabha areas show a highly positively skewed score distribution which
indicate an unsatisfactory achievement pattern. When examining the provincial marks,
the same trend can be seen. Yet, in some provinces such as Western and Southern, this
skewness is negligibly low showing a satisfactory pattern of achievement.
6.2.3 Disparities in Achievement
Disparities in achievement are visible among students belonging to different groups.
Achievement of students who study in 1AB schools is higher in all three subjects tested
than that of 1C and Type 2 schools. The lowest performance is seen in students
attending Type 2 schools. However, the difference between the performance level of
students attending 1C and Type2 schools is not significantly high. Performance of
students studying in 1AB schools is substantially high when compared with the other
two types of schools. This trend can be seen in all the provinces. This is an indication
that there can be distinct factors common to both 1C and Type 2 schools affecting their
overall performance.
Gender has also played a notable role in terms of performance in all three subjects in
the national assessment. The performance of girls is higher than that of boys. This
phenomenon was found in previous studies conducted by the NEREC as well.
Medium of instruction is yet another factor that has affected the achievement of
students. Students studying in Sinhala medium show higher achievement levels than

Chapter Six – Conclusion and the Way Forward
81
those who study in Tamil medium. Once again this can be observed in the achievement
of all three subjects tested in the current study.
However, one noticeable phenomenon is that though these two groups use different
languages of instruction, these languages are primarily their mother tongues. Therefore,
one may argue that the discrepancies of achievement may not have been caused by the
medium of instruction alone. There can be different factors that play an influential role
on achievement concerning this phenomenon. Further investigations to uncover why
this phenomenon recurs in every national assessment should follow.
The location of the school where one learns, according to this study (and in previous
studies undertaken by the NEREC too), has also acted as a key factor on the
achievement of students. The study reveals that students attending schools in Municipal
Council areas show the highest achievement while those who study in schools located in
Pradeshiya Sabha areas display the lowest. Again this propensity is seen in all three
subjects which were tested. As mentioned previously, same disparities were identified
in previous NEREC studies conducted for Grade 4 and 8. When the data were analyzed
according to rural urban categorization, performance of students belonging to urban
areas is higher than that of rural areas.
6.2.4 Achievement of Competencies
In the present national assessment, in determining the achievement, competencies and
competency levels were assessed using only questions that require written answers.
Consequently, it was not possible to test some competencies. For example, certain
competencies related to ‘speaking skill’ in English language were not possible to be
assessed. Therefore, based on the written responses to the questions in the test papers
in all three papers, the achievement of the students was measured. The study revealed
that the majority of students have not been able to display satisfactory achievement of
the competency levels expected to be achieved by them in the said subjects. This
development is seen in all three subjects but it is particularly poignant in English
language where the achievement of competency levels associated with questions
concerning writing tasks is not desirable. Yet, in mathematics nearly half of the
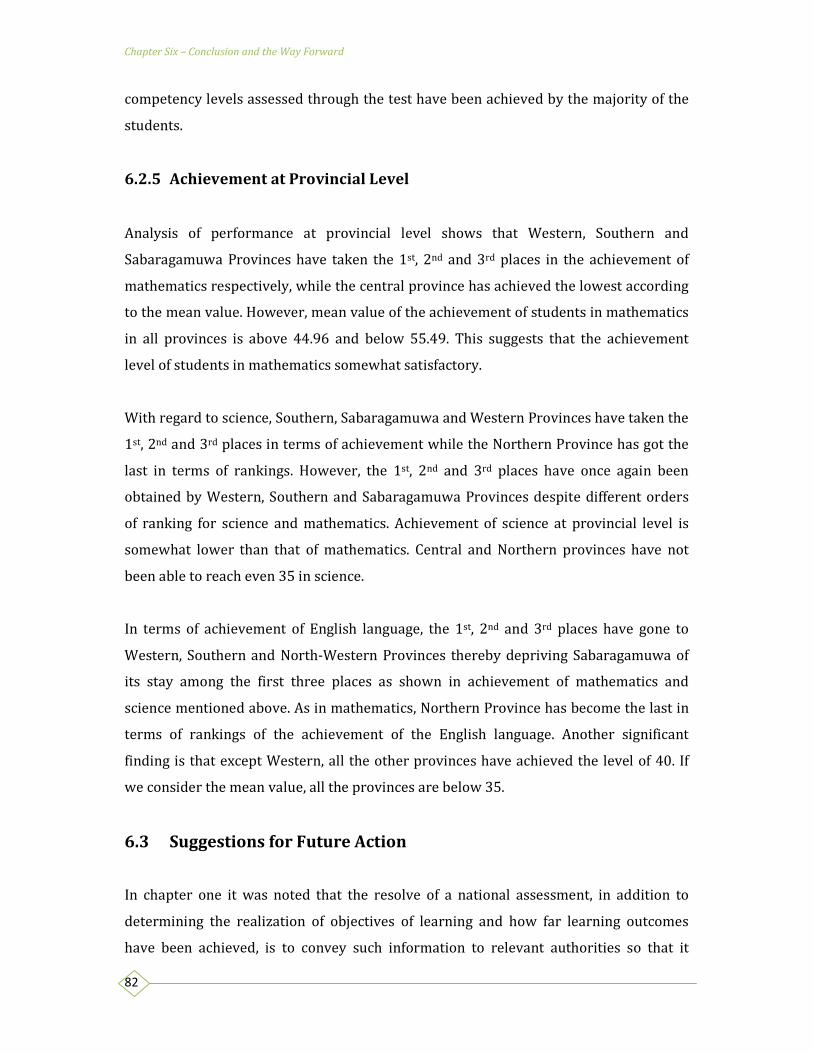
Chapter Six – Conclusion and the Way Forward
82
competency levels assessed through the test have been achieved by the majority of the
students.
6.2.5 Achievement at Provincial Level
Analysis of performance at provincial level shows that Western, Southern and
Sabaragamuwa Provinces have taken the 1st, 2nd and 3rd places in the achievement of
mathematics respectively, while the central province has achieved the lowest according
to the mean value. However, mean value of the achievement of students in mathematics
in all provinces is above 44.96 and below 55.49. This suggests that the achievement
level of students in mathematics somewhat satisfactory.
With regard to science, Southern, Sabaragamuwa and Western Provinces have taken the
1st, 2nd and 3rd places in terms of achievement while the Northern Province has got the
last in terms of rankings. However, the 1st, 2nd and 3rd places have once again been
obtained by Western, Southern and Sabaragamuwa Provinces despite different orders
of ranking for science and mathematics. Achievement of science at provincial level is
somewhat lower than that of mathematics. Central and Northern provinces have not
been able to reach even 35 in science.
In terms of achievement of English language, the 1st, 2nd and 3rd places have gone to
Western, Southern and North-Western Provinces thereby depriving Sabaragamuwa of
its stay among the first three places as shown in achievement of mathematics and
science mentioned above. As in mathematics, Northern Province has become the last in
terms of rankings of the achievement of the English language. Another significant
finding is that except Western, all the other provinces have achieved the level of 40. If
we consider the mean value, all the provinces are below 35.
6.3 Suggestions for Future Action
In chapter one it was noted that the resolve of a national assessment, in addition to
determining the realization of objectives of learning and how far learning outcomes
have been achieved, is to convey such information to relevant authorities so that it

Chapter Six – Conclusion and the Way Forward
83
could lead to improvement in future student achievement thereby contributing to the
decision making process. Therefore, a national assessment is undertaken with a
determination to allocate resources and reform education in the light of its findings
(Kellaghan, Bethell & Ross, 2012). World Bank (2011) too highlights that the findings of
national assessments of learning outcomes should be better utilized for policy purposes
(World Bank, 2011).
6.3.1 National Level Solutions
According to the analysis of the achievement of students in all 3 subjects, common
pattern can be seen in all the provinces; low achievement level, positively skewed
marks distribution, low performance of boys, low performance of Tamil medium
students, low performance of students in rural areas, low performance of students
belonging to 1C and Type 2 schools. Therefore, remedial measures should be taken at
national level rather than at provincial level.
6.3.2 Provision of Equal Educational Opportunities
The study shows that the overall achievement in all subjects at all island level is not
satisfactory. This proves that this low achievement is predominantly a national issue
and not particularly a provincial one. It is, therefore, suggested that this phenomenon
should be addressed at a national level rather than at provincial level. Hence, priority
should be given to common factors associated with achievement of learning outcomes.
In this regard, action pertaining to following areas is suggested.
6.3.3 Quality Development of Teachers
Increased achievement levels of students are the result of increased quality in teaching.
In this respect, the role the teachers play in the teaching learning process is
unmistakably important. Attention must be paid to various training requirements of
teachers irrespective of the type of appointment they have. It is vital to observe whether
the teachers are equipped with necessary skills to handle the competency-based
curriculum in use.

Chapter Six – Conclusion and the Way Forward
84
6.3.4 Supervision and Monitoring
For smooth functioning of proper guidance to students, a continuous mechanism to
monitor and supervise the teaching learning process at both national and provincial
levels is required. This can ensure that what should be applied to maximize the teaching
learning is actually taking place within the classroom and elsewhere as well.
6.3.5 Revisiting the Curriculum
It is well-known that the subject contents in the Sri Lankan secondary school
curriculum are heavier than those in the curricular of some of well developed countries
such as Finland and Denmark whose educational achievement tops the world rankings.
It will be noteworthy to examine the suitability and thereby the mastery of the contents
in given syllabi while identifying proper delivery methods of the same.
6.3.6 Incentive Program for Teachers
Incentive programs are good motivators to get the best performances of teachers. China
in preparing her students for the 21st century rewards the teachers who produce
outstanding performances of students (Asia Society, 2005). This may be difficult
depending on the context due to various reasons. Yet, it will be important to explore
some program to reward teachers who bring about excellent results which eventually
contribute to achievement of students.
6.3.7 Low-Stakes Testing
Another possible reason for low achievement could be the particular grade (in this case
Grade 8) at which the national assessment is conducted. Furthermore, the results are
particularly used by policy makers and teachers. At this grade students are not
preparing for a national or a competitive examination and as such they may not be using
their maximum strength to sit for standardized tests. The assessment was conducted
after the final day of the 3rd term test of the year 2014. Students are aware that this kind
of testing does not provide them with either a certificate or a grade. Thus, this feeling of
relaxation alone can act as a barrier for them to display their maximum performance.

Chapter Six – Conclusion and the Way Forward
85
6.3.8 Gender Disparity
As noticed in the previous chapters, the achievement of girls is higher than that of boys
in all three subjects. This is a positive feature in terms of gender equity. Girls have
surpassed boys in terms of achievement of learning outcomes. But, it is needed to find
out why boys’ performance is less than that of girls. The reason for low achievement by
boys may be found in the teaching-learning process adopted by teachers. It is possible
that this process may suit well for girls but boys. On the other hand, the assessment
mechanisms could be more favorable for girls than boys. Furthermore, the attitude of
boys towards education may have changed over the years and they may not be pleased
with the curriculum, and the knowledge and skills promoted by it. Their thinking
towards education may have taken a revolutionary turn where they question the
relevance of cleverness expected to be achieved through school education to a
competitive labor market. Whatever the case may be, further investigations in order to
determine why boys’ performance less must be conducted.
6.3.9 The Question of Medium
Performance of students in Tamil medium is lower in all three subjects. There can be a
number of reasons related to this phenomenon. Years of disruption to continuous
general education due to various reasons such as war and destruction particularly in
the North and the East could hold back smooth functioning of learning. Thus one may
say there can be social and cultural factors which can affect general achievement levels
of such students. This needs further investigation.
6.3.10 Revisiting Competencies
The national assessment in 2014 shows that the percentages of achievement of all
competencies in general are low. In English, achievement of competency levels is below
basic level. A comprehensive study examining the competency levels and the tasks
attached to each competency must be carried out. The achievement of higher order
cognitive abilities cannot be viewed as satisfactory. The teachers should be made aware
of the need to develop higher order cognitive skills in problem solving in mathematics

Chapter Six – Conclusion and the Way Forward
86
and application of proper use of grammar in the English language. In English language,
competencies related to the skill ‘writing’ have been achieved by a very small
percentage of students. As suggested elsewhere, programs to compensate the training
requirements of teachers so that they will be better equipped with most effective
methodologies to teach the specific competencies must be introduced.

87
Asia Society (2005). Education in China, Lessons for US Educators. New York : Asia Society
Aturupane, H. (2009). The Pearl of Great Price: Achieving equitable Access to Primary and
Secondary Education and Enhancing Learning in Sri Lanka. UK: CREATE.
Farrel, J.P (2002) Equality of Education: A Half Century of Comparative Evidence Seen
from a New Millennium in R.F Arnov and C.L. Torres (eds.), Comparative Education: The
Dialectic of the Global and the Local. Rowman & Little Field Publishers: New York. pp.
146-175.
Kamens, D. H. & McNeely, C. L. (2010). Globalization and the growth of international
educational testing and national assessment. Comparative Education Review, 54(1), 5-
25.
Kellaghan, T. & Greaney, V. (2008). Assessing National Achievement Levels in Education.
Washington: World Bank.
Kellaghan, T., Greaney, V. & Murray, S. (2009). Using the Results of a National Assessment
of Educational Assessment. Washington: World Bank.
Kellaghan, Bethell & Ross (2012). National and international assessments of student
achievement. London: Department for International Development.
Ministry of Education (2011). The National Strategic Plan for the General Education
Sector. Education Sector Development Framework and Programme (ESDFP) 2012 -2016.
Colombo, Sri Lanka.
Ministry of Education (2013). The National Strategic Plan for the General Education
Sector. Education Sector Development Framework and Programme (ESDFP) 2013-2017.
Colombo, Sri Lanka.
NEREC (2008). National Assessment of Achievement of Grade 8 Students of 2007 in Sri
Lanka. Colombo: NEREC.
NEREC (2013). National Assessment of Achievement of Students Completing Grade 8 in
Year 2012. Colombo: NEREC.
Ross, K. (eds.) (2005). Sample design for educational survey research. Paris: IIEP,
UNESCO.
References

References
88
Ross, K.N., Paviat, L., & Genevois, I, J. (2006) Chapter 1; Introduction: The origins and
Contents of the Policy Forum. In: K. Ross & I. J. Genevois (Eds), Cross-national studies of
the Quality of Education. (pp. 25-36. Paris: UNESCO IIEP.
Saito, M., Cappelle, F. V. (2010) Monitoring the Quality of Education: Exploration of
Concept, Methodology, and the Risk between Research and Policy The Impact of
International Achievement Studies on National Education Policy Making International
Perspectives on Education and Society 13, 3-4.
Sumathipala, K.H.M. (1967) History of Education in Ceylon (1795-1965). Dehiwala:
Thisara Publishers.
UNESCO (2000). The Dakar Framework for Action: Education for All – Meeting Our
Collective Commitment. Paris: UNESCO.
World Bank Independent Evaluation Group. (2007). Facts about Primary Education.
Available at http://www.worldbank.org/oed/education/facts_figures.html. Retrieved
on April 25 2015.
Word Bank (2011). Transforming School Education in Sri Lanka. Washington, D.C.: World
Bank.

89
National Assessment of Achievement of Grade 4 Pupils in Sri Lanka. (2004)
National Assessment of Achievement of Grade 8 and 10 Students in Sri Lanka. (2005)
National Assessment of Achievement of Students Completing Grade 4 in Year 2006
in Sri Lanka.
National Assessment of Achievement of Students Completing Grade 8 in Year 2007
in Sri Lanka.
National Assessment of Achievement of Students Completing Grade 4 in Year 2008
in Sri Lanka.
National Assessment of Achievement of Students Completing Grade 8 in Year 2012
in Sri Lanka.
National Assessment of Achievement of Students Completing Grade 4 in Year 2013
in Sri Lanka.
Series of National Assessments