natural gas markets, mechanisms - platts gas markets, structures, and ... you may use the prices,...
TRANSCRIPT

NATURAL GAS MARKETS, STRUCTURES, AND MECHANISMS Mitchell DeRubis, Senior Energy Analyst Bob Yu, Senior Energy Analyst
• Restrictions on Use: You may use the prices, indexes, assessments and other related information (collectively, “Data”) in this presentation only for your personal use. You may not publish, reproduce, distribute, retransmit, resell, create any derivative work from and/or otherwise provide access to Data or any portion thereof to any person (either within or outside your company including, but not limited to, via or as part of any internal electronic system or Internet site), firm or entity. Disclaimer: Platts, its affiliates and all of their third-party licensors disclaim any and all representations and warranties, express or implied, including, but not limited to, any warranties of merchantability or fitness for a particular purpose or use as to the data, or the results obtained by its use or as to the performance thereof. Limitation of Liability: In no event whatsoever shall Platts, its affiliates or their third-party licensors be liable for any indirect, special, incidental, punitive or consequential damages, including but not limited to loss of profits, trading losses, or lost time or goodwill, even if they have been advised of the possibility of such damages, whether in contract, tort, strict liability or otherwise. The Data is provided on an “as is” basis and your use of the Data is at your own risk. Copyright © 2016 by Platts, McGraw Hill Financial, Inc. All rights reserved. No portion of this publication may be photocopied, reproduced, retransmitted, put into a computer system or otherwise redistributed without prior authorization from Platts. Platts is a trademark of McGraw Hill Financial.
NATURAL GAS MIDSTREAM FUNDAMENTALS
Mitchell DeRubis, Senior Energy Analyst

Production Demand
Supply Demand
Where it’s needed, when it’s needed

From Wellhead
Producing Basin
Processing Gathering
Source: EIA
Benposium 2017

To Burner-Tip
Storage
LDC
Industrial
Power
Industrial
Power
Res/Comm
Benposium 2017
Storage

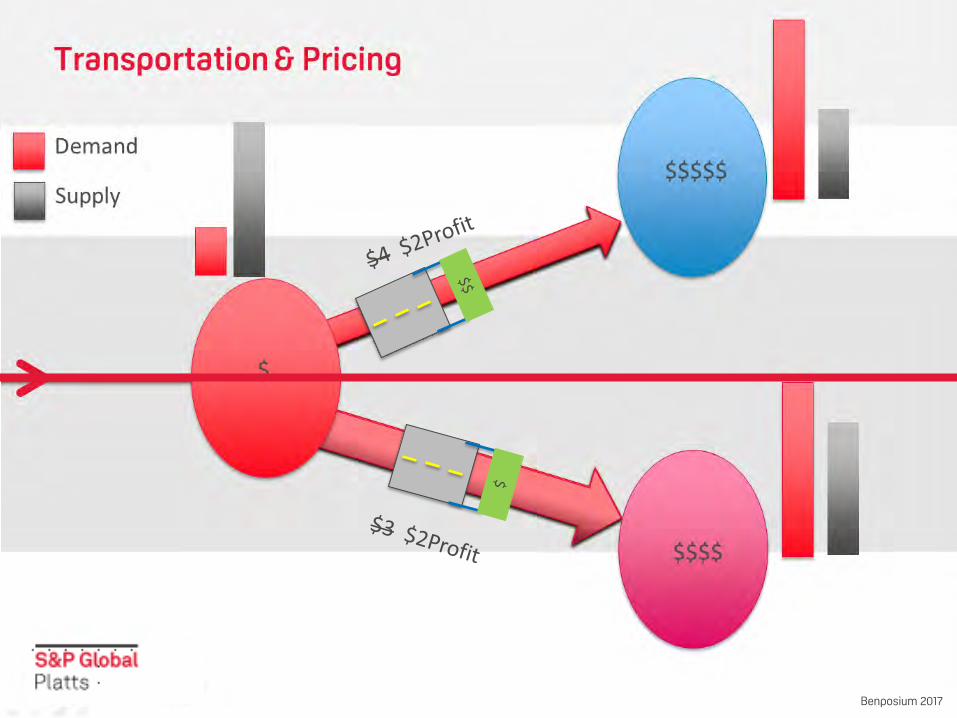
Transportation & Pricing
Demand
Supply $$$$ $$$$$
Hub $
$ $
$
$
$
$
$
$
$
Surp
lus
Sho
rtage
Sho
rtage
$
$
$
$$
$$$$ $$$
$$$
$$$
Prices reflect Supply/Demand Balance
Benposium 2017

Benposium 2017
• Firm • Reserved • Reservation rate (fixed) + variable costs
• Interruptible • Variable costs only

Quick Microeconomics Refresher
P
Q
ATC
AVC
MC
P = MR PROFIT
LOSS
FC
AFC
Benposium 2017
P = Price, Q = Quantity, MR = Marginal Revenue, MC = Marginal Cost, ATC = Average Total Cost, AVC = Average Variable Cost

How Does This Apply to Pipeline Economics?
P
Q
MC
MR = D
ATC

Benposium 2017
Benposium 2017
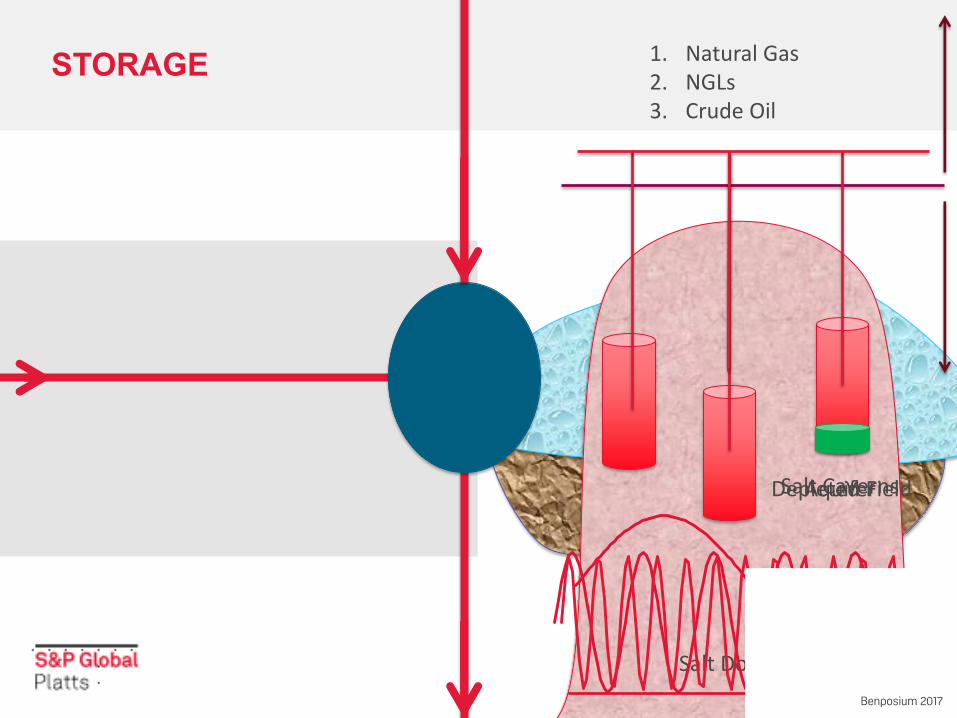
STORAGE
Salt Dome
Salt Caverns Aquifer Depleted Field
1. Natural Gas 2. NGLs 3. Crude Oil
Benposium 2017
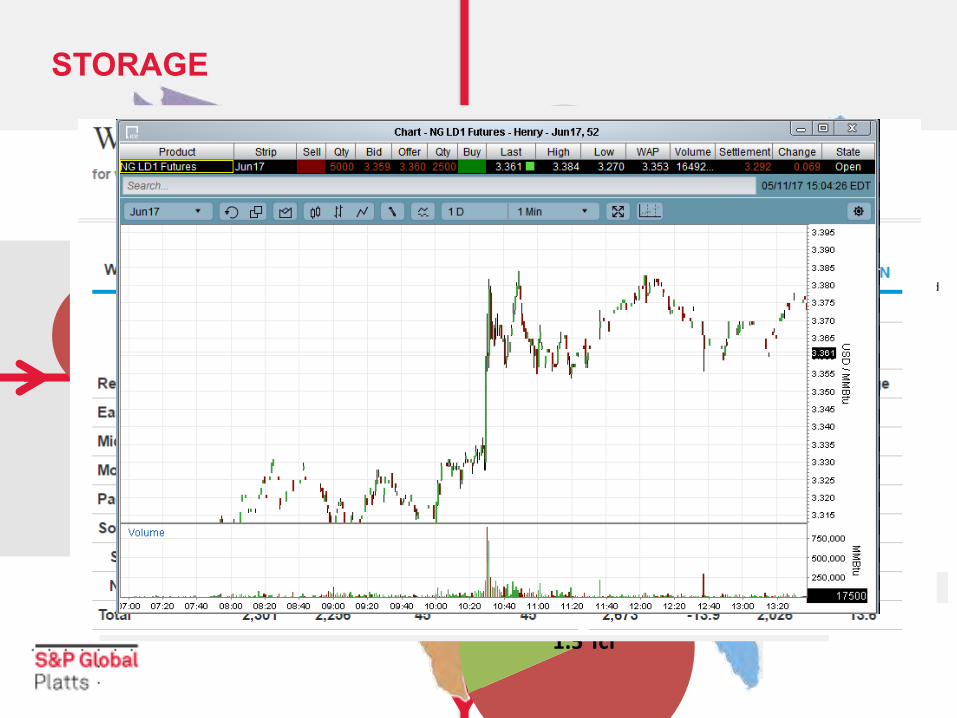
STORAGE
Benposium 2017
1 Tcf Aquifer
Depleted Field
Salt Dome
1.2 Tcf
461 Bcf
416 Bcf
1.5 Tcf
0
500
1,000
1,500
2,000
2,500
3,000
3,500
4,000
4,500
01-Jan-10 01-Jan-11 01-Jan-12 01-Jan-13 01-Jan-14 01-Jan-15 01-Jan-16 01-Jan-17
Bcf
US Inventories
$2.00
$2.20
$2.40
$2.60
$2.80
$3.00
$3.20
$3.40
$3.60
$/M
MB
tu Henry Hub Futures
Intrinsic Value
$-
$1.00
$2.00
$3.00
$4.00
$5.00
$6.00
$7.00
(1,500)
(1,000)
(500)
-
500
1,000
1,500
$/M
MB
tu
Bcf
Henry Hub Vs. Rolling 5-Year Storage Surplus/Deficit
Historic Surplus/Deficit Henry Hub Cash
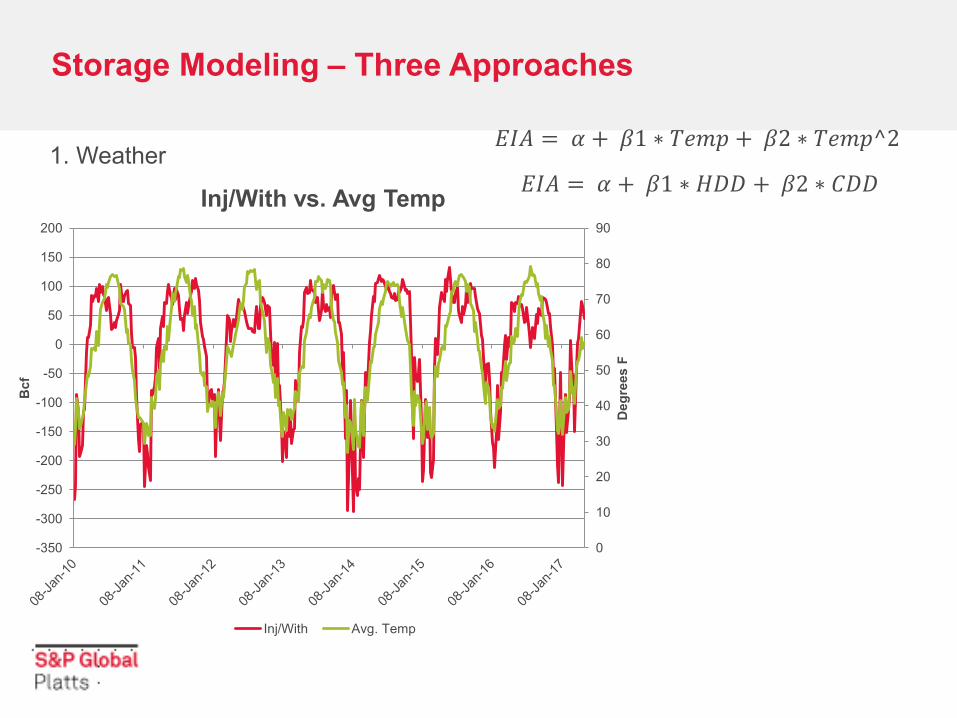
Storage Modeling – Three Approaches
1. Weather
0
10
20
30
40
50
60
70
80
90
-350
-300
-250
-200
-150
-100
-50
0
50
100
150
200
Deg
rees
F
Bcf
Inj/With vs. Avg Temp
Inj/With Avg. Temp
𝐸𝐼𝐴 = 𝛼 + 𝛽1 ∗ 𝑇𝑒𝑚𝑝 + 𝛽2 ∗ 𝑇𝑒𝑚𝑝^2
𝐸𝐼𝐴 = 𝛼 + 𝛽1 ∗ 𝐻𝐷𝐷 + 𝛽2 ∗ 𝐶𝐷𝐷

Storage Modeling – Three Approaches
2. Supply/Demand Implied
Total Supply
Total Demand
𝐸𝐼𝐴 = 𝑇𝑜𝑡𝑎𝑙 𝑆𝑢𝑝𝑝𝑙𝑦 − 𝑇𝑜𝑡𝑎𝑙 𝐷𝑒𝑚𝑎𝑛𝑑
Total Supply = 496 +41 +3 = 540 Bcf
Total Demand = 29 + 15 + 446 = 490 Bcf
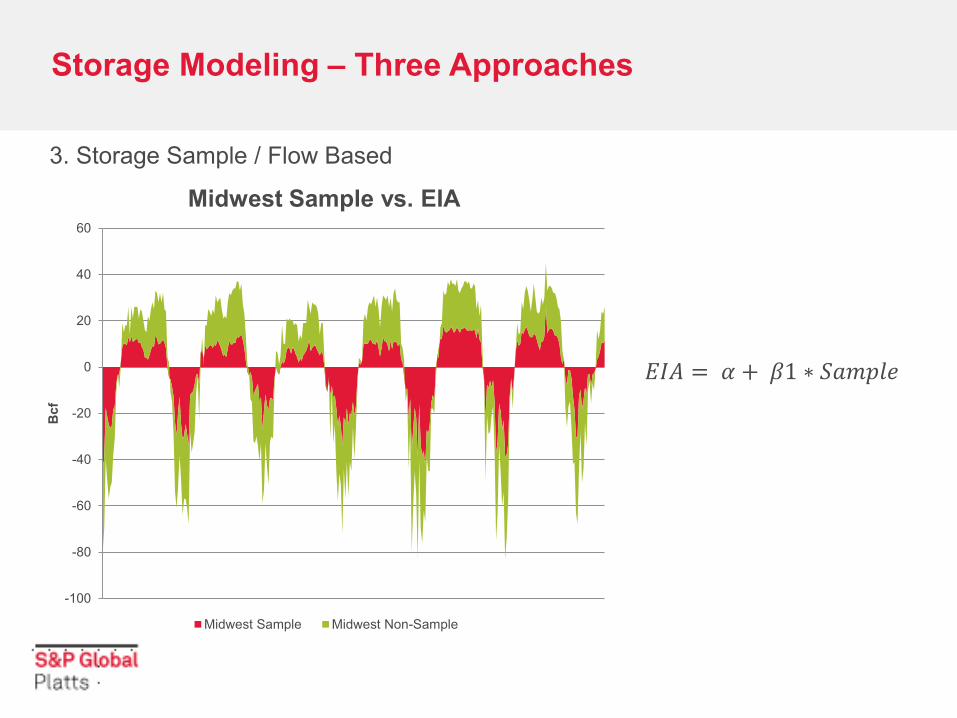
Storage Modeling – Three Approaches
3. Storage Sample / Flow Based
-100
-80
-60
-40
-20
0
20
40
60
Bcf
Midwest Sample vs. EIA
Midwest Sample Midwest Non-Sample
𝐸𝐼𝐴 = 𝛼 + 𝛽1 ∗ 𝑆𝑎𝑚𝑝𝑙𝑒

NATURAL GAS DOWNSTREAM FUNDAMENTALS
Bob Yu, Senior Energy Analyst
No content below the line No content below the line
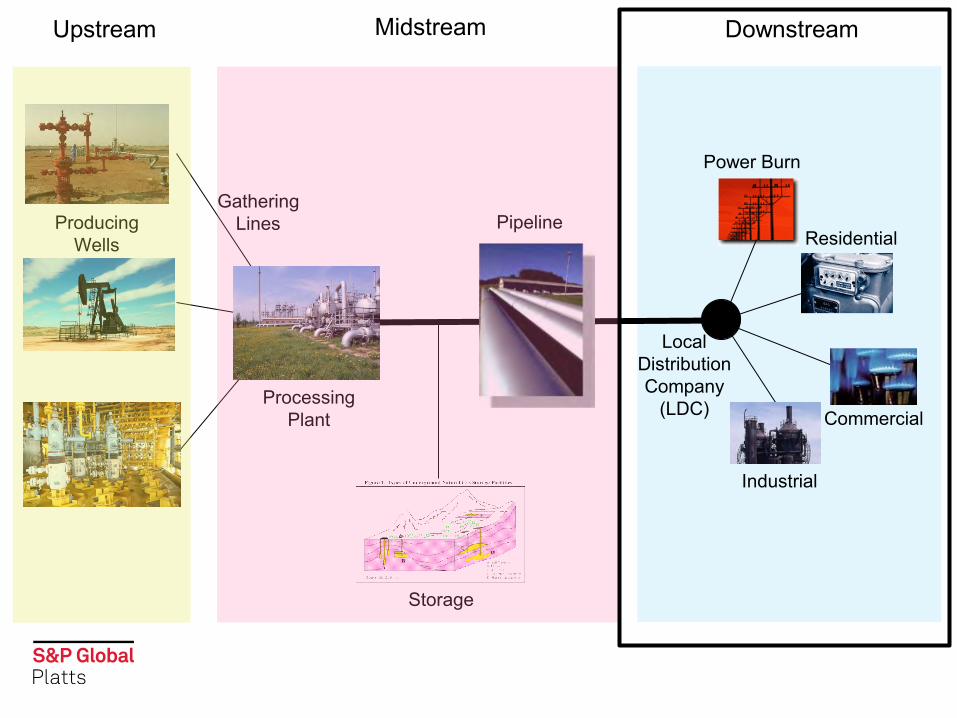
Gathering Lines
Upstream
Pipeline Producing Wells
Storage
Local Distribution Company
(LDC) Processing Plant
Industrial
Residential
Power Burn
Commercial
Midstream Downstream

No content below the line No content below the line
Natural Gas
19
• Introduction to natural gas demand sources
• Drivers of natural gas demand – how do we quantify the effects?
• Long term trends affecting demand growth
Agenda

No content below the line No content below the line
Natural Gas
20
Sources of Natural Gas Demand
Residential Commercial
Industrial Power Burn

No content below the line No content below the line
Natural Gas
21
42%
18%
8%
32%
Commercial End Use
Space Heating Water Heating Cooking Other
Space Heating Drives ResComm Demand
36%
36%
25%
3%
Residential End Use
Source: EIA

No content below the line No content below the line
Natural Gas
22
Sources of Natural Gas Demand
Residential Commercial
Industrial Power Burn

No content below the line No content below the line
Natural Gas
23
39%
16% 10%
10% 1%
1%
0%
0%
0%
1%
7%
1%
2% 5% 3%
1%
1%
1%
2%
0% 0%
Industrial Sector
Chemicals
Petroleum and Coal Products
Food
Primary Metals
Beverage and Tobacco Products
Textile Mills
Textile Product Mills
Apparel
Leather and Allied Products
Wood Products
Paper
Printing and Related Support
Plastics and Rubber Products
Nonmetallic Mineral Products
Fabricated Metal Products
The Many Sectors of Manufacturing
Source: EIA
No content below the line No content below the line
Natural Gas
24
-
500
1,000
1,500
2,000
2,500
3,000
Chemicals Primary Metals Other Sectors
Bcf
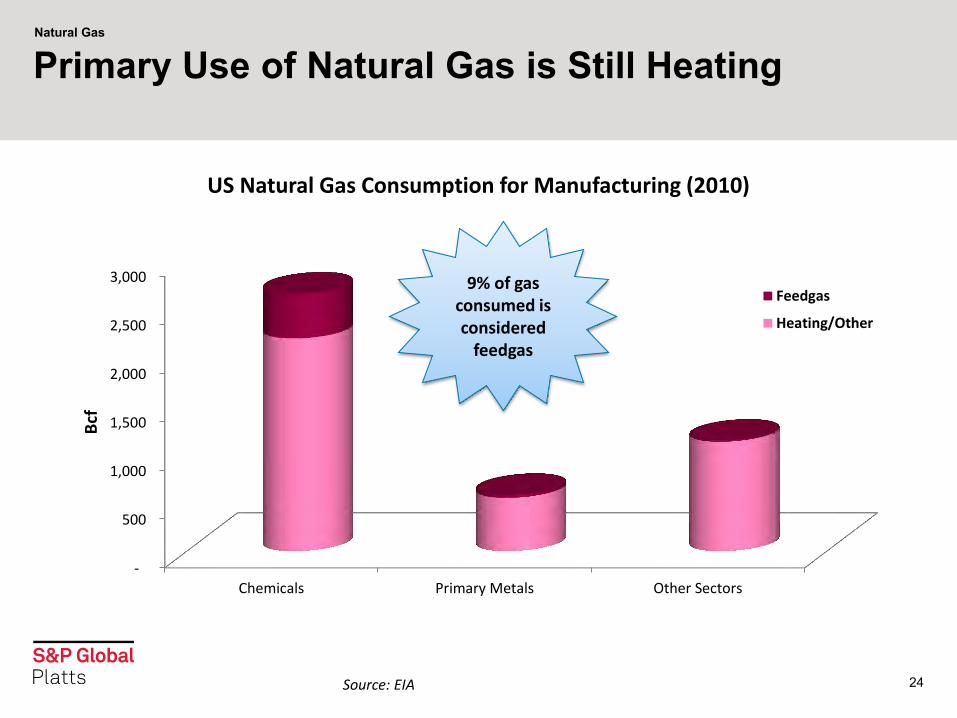
US Natural Gas Consumption for Manufacturing (2010)
Feedgas
Heating/Other
Primary Use of Natural Gas is Still Heating
9% of gas consumed is considered
feedgas
Source: EIA

No content below the line No content below the line
Natural Gas
25
Sources of Natural Gas Demand
Residential Commercial
Industrial Power Burn
No content below the line No content below the line
Natural Gas
26
-
500,000
1,000,000
1,500,000
2,000,000
2,500,000
3,000,000
3,500,000
4,000,000
4,500,000
20
03
20
04
20
05
20
06
20
07
20
08
20
09
20
10
20
11
20
12
20
13
20
14
20
15
20
16
Mill
ion
KW
h
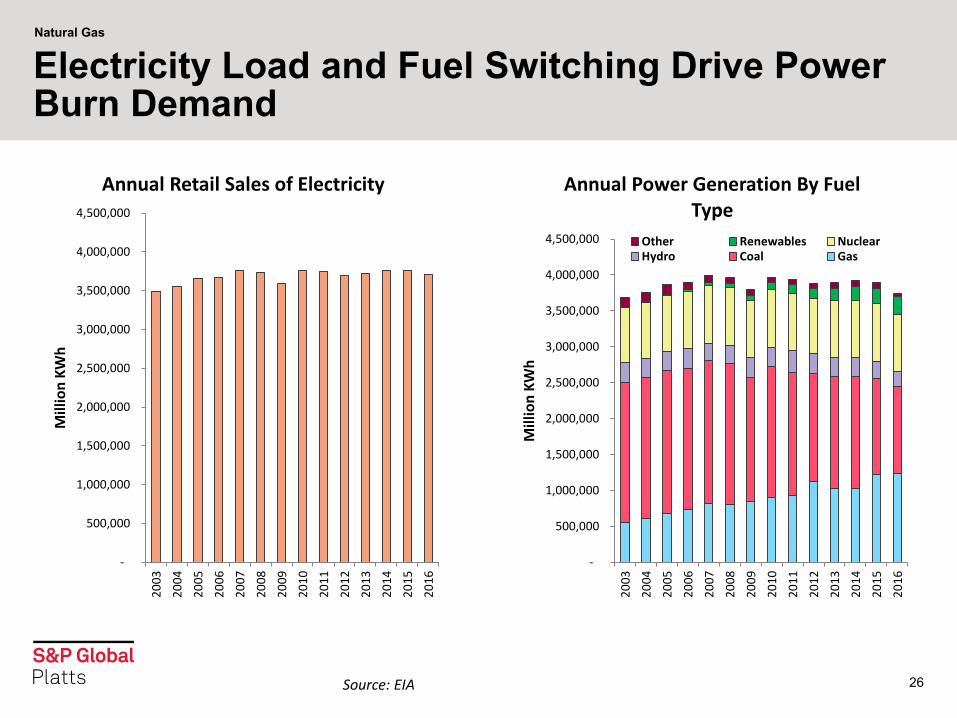
Annual Retail Sales of Electricity
-
500,000
1,000,000
1,500,000
2,000,000
2,500,000
3,000,000
3,500,000
4,000,000
4,500,000
20
03
20
04
20
05
20
06
20
07
20
08
20
09
20
10
20
11
20
12
20
13
20
14
20
15
20
16
Mill
ion
KW
h
Annual Power Generation By Fuel Type
Other Renewables NuclearHydro Coal Gas
Electricity Load and Fuel Switching Drive Power Burn Demand
Source: EIA
No content below the line No content below the line
Natural Gas
27
-
10
20
30
40
50
60
70
80
Bcf
/d
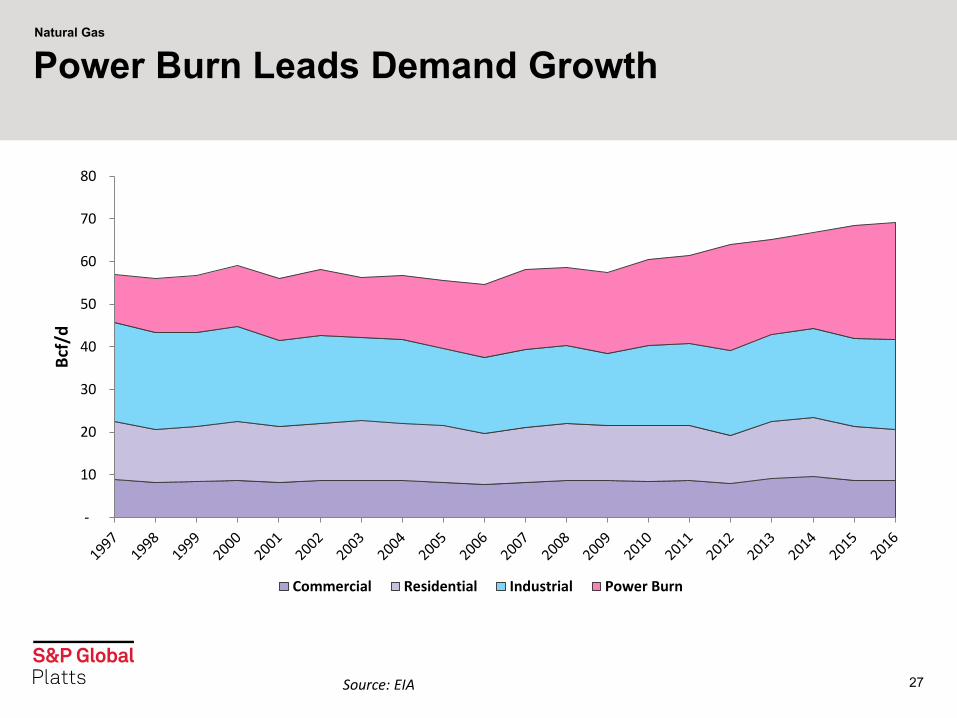
Commercial Residential Industrial Power Burn
Power Burn Leads Demand Growth
Source: EIA

No content below the line No content below the line
Natural Gas
-
5
10
15
20
25
30
-
10
20
30
40
50
60
70
80
90
100
De
gre
e D
ays
Bcf
/d
Historic Demand Vs. Normal Weather
ResComm Industrial Power Burn Heating Degree Days Cooling Degree Days
Weather is the Primary Driver of Demand
Source: Platts Bentek CellModel 28

No content below the line No content below the line
Natural Gas
29
-
500
1,000
1,500
2,000
2,500
3,000
3,500
4,000
52
54
56
58
60
62
64
66
68
70
Deg
ree
Day
s
Bcf
/d
Heating Demand Vs. HDDs
ResComm and Indutrial Demand Total HDDs
Weather is the Primary Driver of Demand
-
200
400
600
800
1,000
1,200
1,400
1,600
1,800
-
5
10
15
20
25
30
35
Deg
ree
Day
s
Bcf
/d
Cooling Demand Vs. CDDs
Power Burn Demand Total CDDs
Source: Platts Bentek CellModel, CustomWeather

No content below the line No content below the line
Natural Gas
30
5
10
15
20
25
30
15 25 35 45 55 65 75 85 95
Bcf
/d
Degrees Fahrenheit
US Power Plant Nominations Vs. Population-Weighted Temperature
Sample (2014 - Present)
US Power Burn Nominations Vs Temperature
Source: Platts Bentek Power Burn Report

No content below the line No content below the line
Natural Gas
31
5
10
15
20
25
30
15 25 35 45 55 65 75 85 95
Bcf
/d
Degrees Fahrenheit
US Power Plant Nominations Vs. Population-Weighted Temperature
2014 2015 2016 2017 YTD
US Power Burn Nominations Vs Temperature
Source: Platts Bentek Power Burn Report

No content below the line No content below the line
Natural Gas
32
-
5
10
15
20
25
30
Gas
Eq
uiv
ale
nt
Qu
anti
ty (
Bcf
/d)
Gas Equivalent Price
Cumulative Price by Volume Chart
Southeast Northeast Midwest Texas Southwest Rockies
Commodity Prices Dictate Market Share
Source: EIA 923

No content below the line No content below the line
Natural Gas
33
5
10
15
20
25
30
15 25 35 45 55 65 75 85 95
Bcf
/d
Degrees Fahrenheit
US Power Plant Nominations Vs. Population-Weighted Temperature
2014 2015 2016 2017 YTD $0.00 - $2.50 $2.50 - $3.50 Above $3.50
US Power Burn Nominations Vs Temperature
Source: Platts Bentek Power Burn Report

No content below the line No content below the line
Natural Gas
34
-
20
40
60
80
100
120
GW
h
CAISO Hydro Generation
5 Year Range 2017 5 Year Average
-
50
100
150
200
250
300
350
400
GW
h
BPA Hydro Generation
5 Year Range 2017 5 Year Average
Other Factors Influence Power Burn as Well
Source: Platts Bentek Power Burn Report

No content below the line No content below the line
Natural Gas
35
Other Factors Influence Power Burn as Well
0
1
2
3
4
5
6
7
8
1-Jan 1-Feb 1-Mar 1-Apr 1-May 1-Jun 1-Jul 1-Aug 1-Sep 1-Oct 1-Nov 1-Dec
Bcf
/d
West Power Burn Demand
5 Year Range 2017 5 Year Average
Source: Platts Bentek Power Burn Report
No content below the line No content below the line
Natural Gas
36
$-
$20.00
$40.00
$60.00
$80.00
$100.00
$120.00
$140.00
$160.00
$180.00
$200.00
- 10,000 20,000 30,000 40,000 50,000 60,000 70,000 80,000 90,000 100,000
Var
iab
le O
&M
Co
sts
Cumulative Summer Capacity
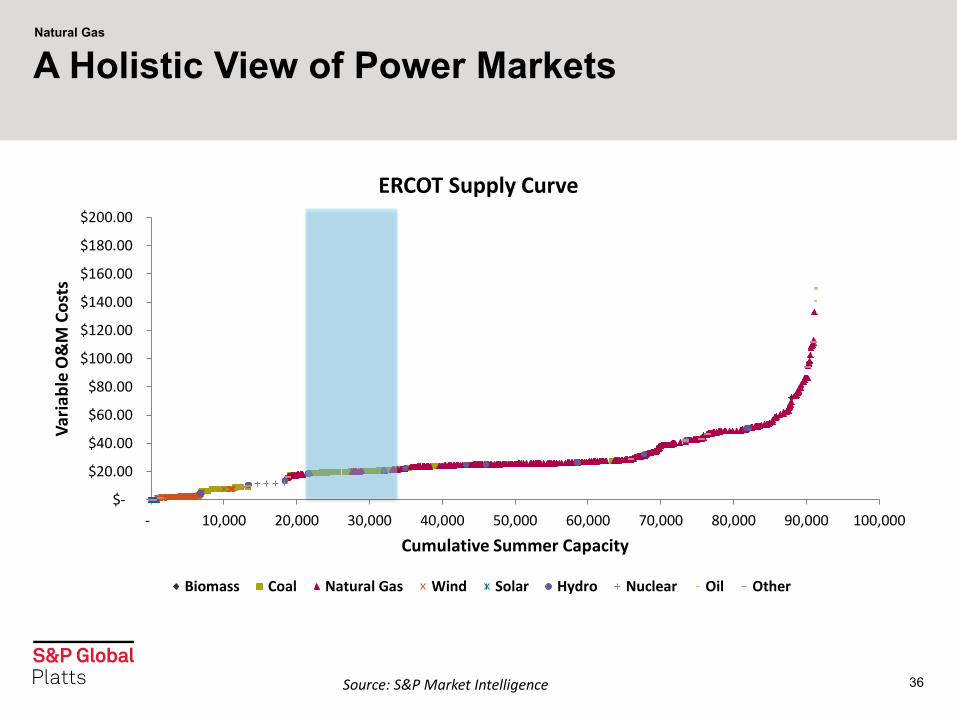
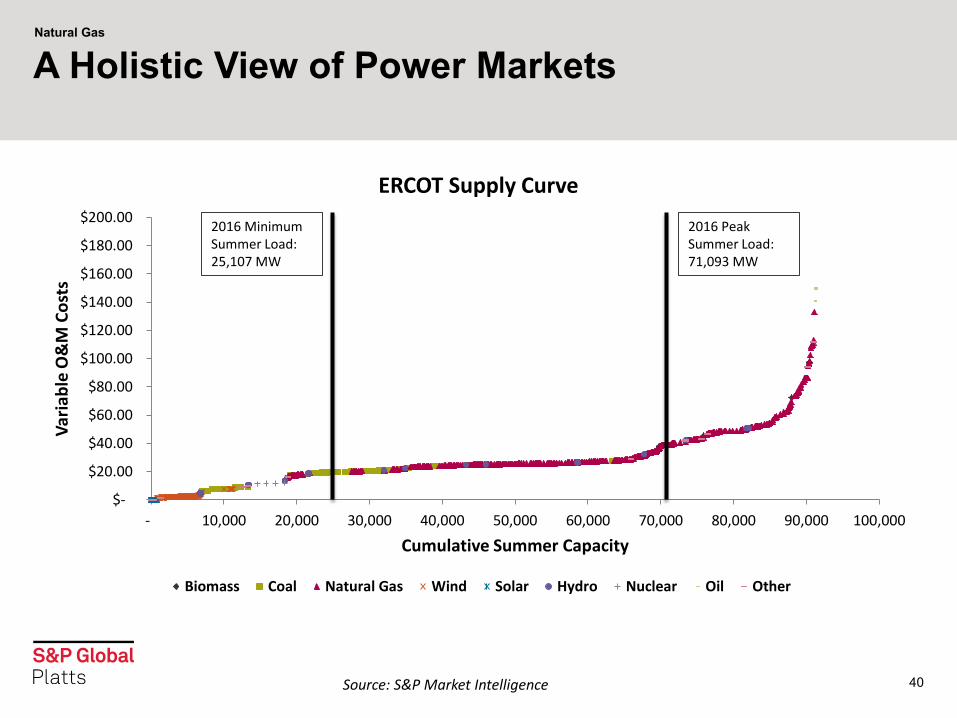
ERCOT Supply Curve
Biomass Coal Natural Gas Wind Solar Hydro Nuclear Oil Other
A Holistic View of Power Markets
Source: S&P Market Intelligence

No content below the line No content below the line
Natural Gas
37
A Holistic View of Power Markets
$-
$20.00
$40.00
$60.00
$80.00
$100.00
$120.00
$140.00
$160.00
$180.00
$200.00
- 10,000 20,000 30,000 40,000 50,000 60,000 70,000 80,000 90,000 100,000
Var
iab
le O
&M
Co
sts
Cumulative Summer Capacity
ERCOT Supply Curve
Biomass Coal Natural Gas Wind Solar Hydro Nuclear Oil Other
Cheaper Gas Prices
Source: S&P Market Intelligence

No content below the line No content below the line
Natural Gas
38
A Holistic View of Power Markets
$-
$20.00
$40.00
$60.00
$80.00
$100.00
$120.00
$140.00
$160.00
$180.00
$200.00
- 10,000 20,000 30,000 40,000 50,000 60,000 70,000 80,000 90,000 100,000
Var
iab
le O
&M
Co
sts
Cumulative Summer Capacity
ERCOT Supply Curve
Biomass Coal Natural Gas Wind Solar Hydro Nuclear Oil Other
Source: S&P Market Intelligence
No content below the line No content below the line
Natural Gas
39
A Holistic View of Power Markets
$-
$20.00
$40.00
$60.00
$80.00
$100.00
$120.00
$140.00
$160.00
$180.00
$200.00
- 10,000 20,000 30,000 40,000 50,000 60,000 70,000 80,000 90,000 100,000
Var
iab
le O
&M
Co
sts
Cumulative Summer Capacity
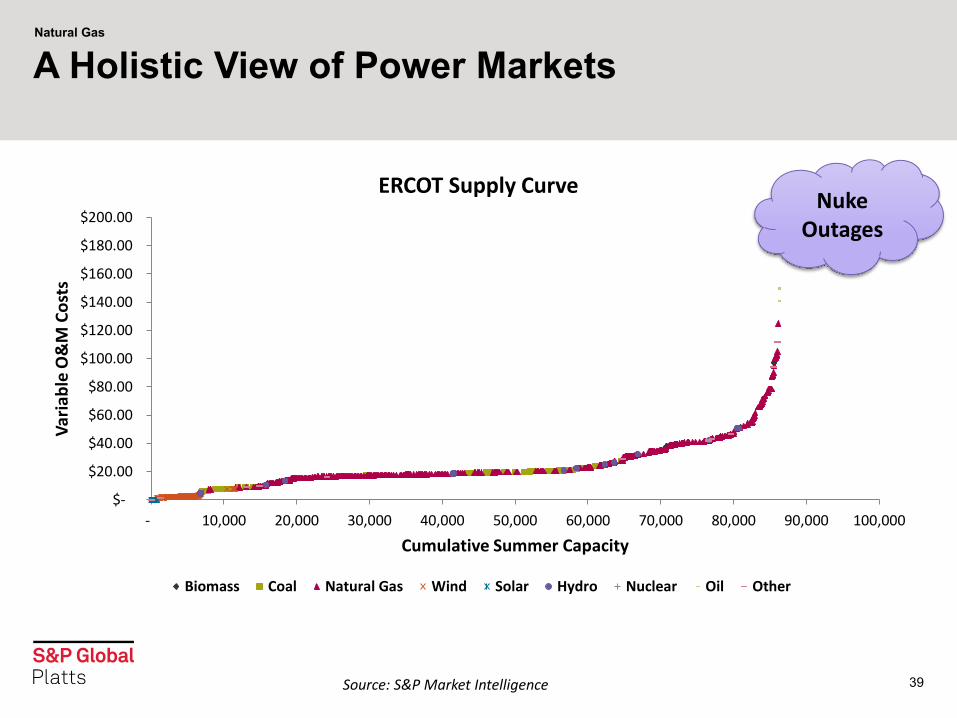
ERCOT Supply Curve
Biomass Coal Natural Gas Wind Solar Hydro Nuclear Oil Other
Nuke Outages
Source: S&P Market Intelligence
No content below the line No content below the line
Natural Gas
40
$-
$20.00
$40.00
$60.00
$80.00
$100.00
$120.00
$140.00
$160.00
$180.00
$200.00
- 10,000 20,000 30,000 40,000 50,000 60,000 70,000 80,000 90,000 100,000
Var
iab
le O
&M
Co
sts
Cumulative Summer Capacity
ERCOT Supply Curve
Biomass Coal Natural Gas Wind Solar Hydro Nuclear Oil Other
A Holistic View of Power Markets
2016 Minimum Summer Load: 25,107 MW
2016 Peak Summer Load: 71,093 MW
Source: S&P Market Intelligence

No content below the line No content below the line
41
Longer Term Trends and Risks to Natural Gas Demand Growth
No content below the line No content below the line
Natural Gas
42
-
100
200
300
400
500
600
700
GW
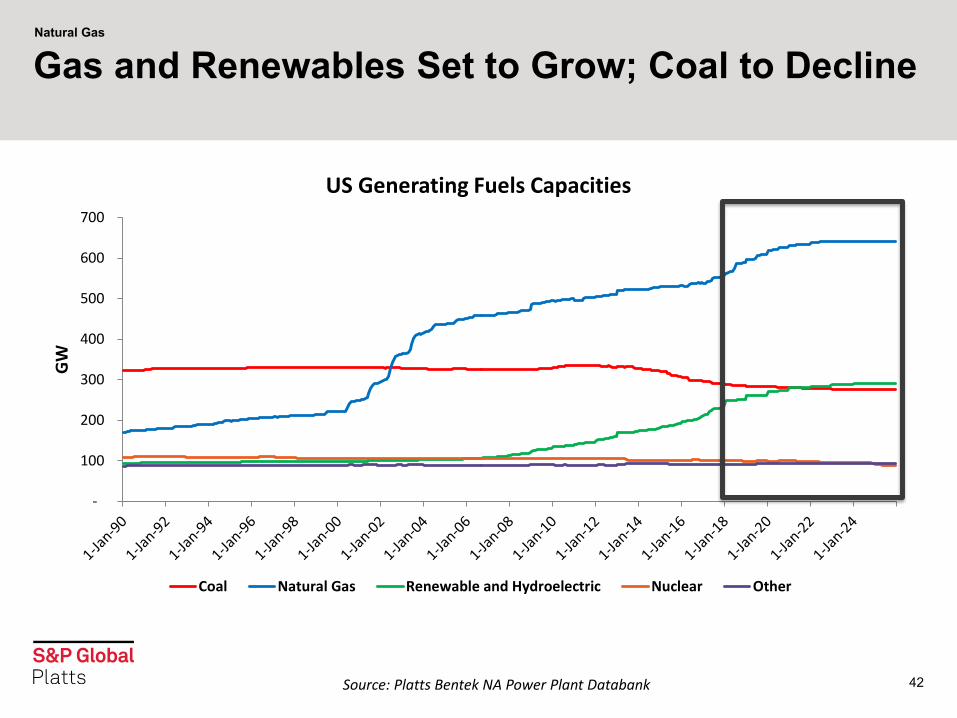
US Generating Fuels Capacities
Coal Natural Gas Renewable and Hydroelectric Nuclear Other
Gas and Renewables Set to Grow; Coal to Decline
Source: Platts Bentek NA Power Plant Databank

No content below the line No content below the line
Natural Gas
43
(40)
(20)
-
20
40
60
80
100
120
2018 2019 2020 2021 2022 2023 2024 2025 2026 2027 2028
GW
Natural Gas, Coal, and Renewable Generation Capacity Changes
New Gas Generation Capacity New Renewable Generation Capacity Coal Retirements
Gas and Renewables Set to Grow; Coal to Decline
Source: Platts Bentek NA Powerplant Databank

No content below the line No content below the line
Natural Gas
44
62%
63%
64%
65%
66%
67%
68%
69%
70%
71%
0%
1%
2%
3%
4%
5%
6%
7%
2003 2004 2005 2006 2007 2008 2009 2010 2011 2012 2013 2014 2015 2016
Foss
il Fu
el G
en
era
tio
n M
arke
t Sh
are
Re
new
able
Ge
ne
rati
on
Mar
ket
Shar
e
Fossil Fuel Vs. Renewable Generation Market Share
Renewable Market Share Fossil Fuel Market Share
Emerging Renewable Generation a Threat to Fossil Fuel
Source: EIA 923

No content below the line No content below the line
Natural Gas
45
-
10
20
30
40
50
60
70
80
GW
New Generation Capacity Additions by Year (Operating Power Plants)
Gas Coal Oil Nuclear Renewables Other
New Generation Capacity Additions by Year
Source: Platts Bentek NA Powerplant Databank

No content below the line No content below the line
Natural Gas
46
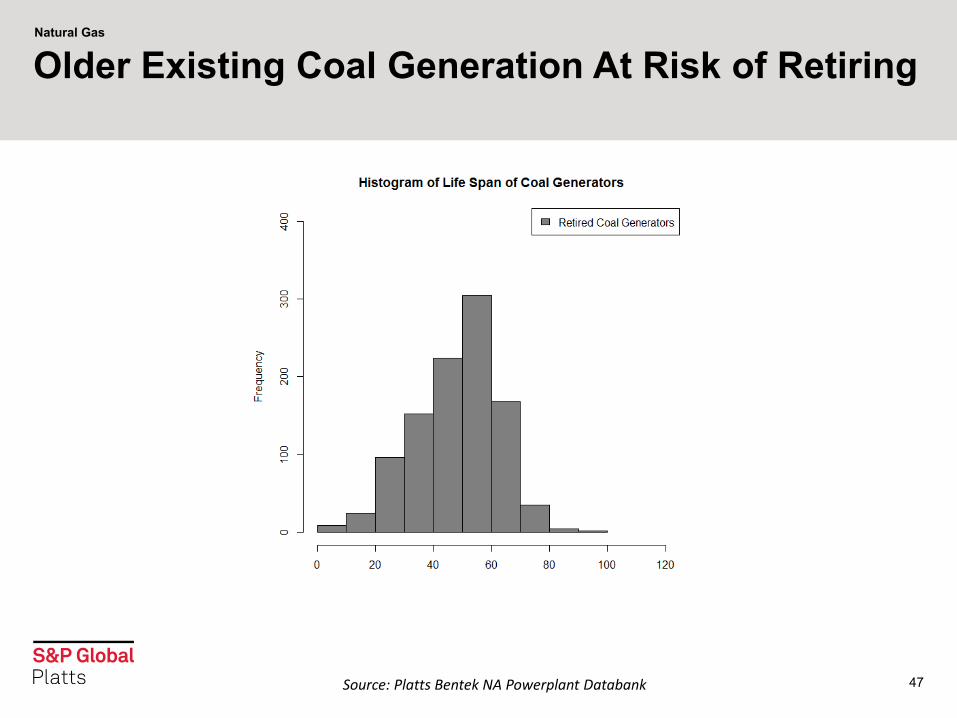
Older Existing Coal Generation At Risk of Retiring
Source: Platts Bentek NA Powerplant Databank
No content below the line No content below the line
Natural Gas
47
Older Existing Coal Generation At Risk of Retiring
Source: Platts Bentek NA Powerplant Databank

No content below the line No content below the line
Natural Gas
48
Older Existing Coal Generation At Risk of Retiring
Source: Platts Bentek NA Powerplant Databank

No content below the line No content below the line
Natural Gas
49
-
50
100
150
200
250
300
5 15 25 35 45 55 65 75 85
GW
Years
Cumulative Distribution of Operating Coal Capacity by Age
Older Existing Coal Generation At Risk of Retiring
150 GW of existing coal generators greater than 40 years old
Source: Platts Bentek NA Powerplant Databank

No content below the line No content below the line
Natural Gas
50
-
0.02
0.04
0.06
0.08
0.10
0.12
MM
cf/y
ear
Annual Household Natural Gas Consumption
Offsetting Trends in Residential Demand
Source: EIA

No content below the line No content below the line
Natural Gas
51
-
50
100
150
200
250
300
350
400
450
1950 1960 1970 1980 1990 2000 2010 2020 2030 2040 2050 2060
Mill
ion
s
US Population Continues to Grow
Historic Population Population Projection
Offsetting Trends in Residential Demand
Source: US Census Bureau
No content below the line No content below the line
Natural Gas
52
-
1
2
3
4
5
6
7
2005 2006 2007 2008 2009 2010 2011 2012 2013 2014 2015 2016 2017
Bcf
/d
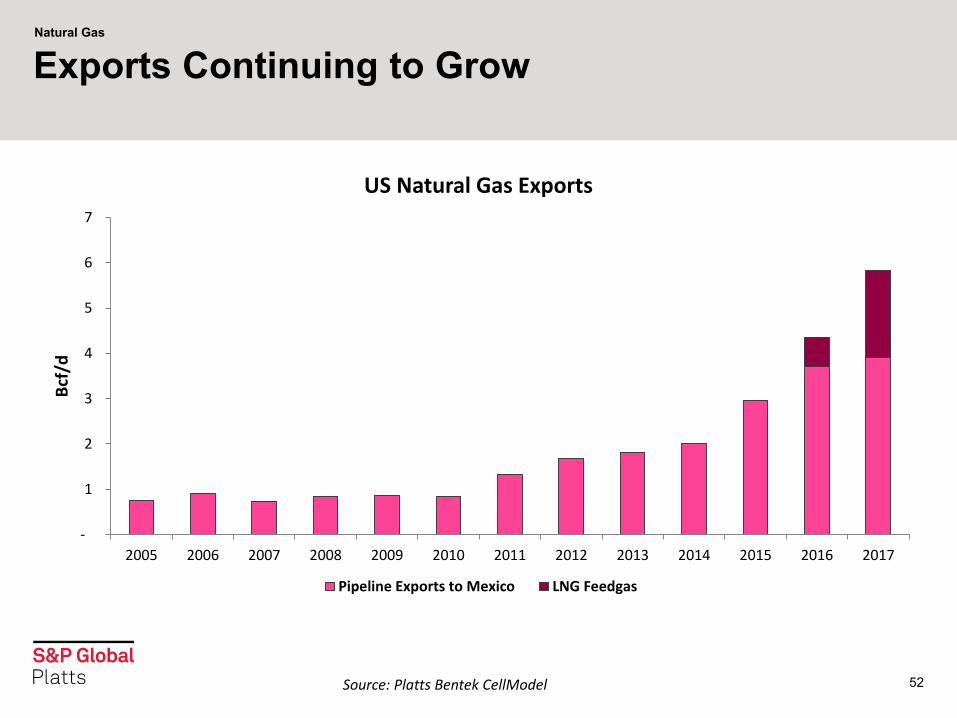
US Natural Gas Exports
Pipeline Exports to Mexico LNG Feedgas
Exports Continuing to Grow
Source: Platts Bentek CellModel

No content below the line No content below the line
Natural Gas
53
0%
2%
4%
6%
8%
10%
12%
14%
16%
18%
-
10
20
30
40
50
60
70
80
90
100
2005 2006 2007 2008 2009 2010 2011 2012 2013 2014 2015 2016 2017 2018 2019 2020 2021 2022
Pe
rce
nt
of
Tota
l De
man
d
Bcf
/d
US Natural Gas Demand History and Outlook
ResComm Industrial PowerBurn Exports Exports Percent
Exports Will Drive Demand Growth Going Forward
Source: Platts Bentek CellCAST

No content below the line No content below the line
Natural Gas
54
• Weather is the primary driver of natural gas demand. Residential and commercial buildings use natural gas primarily for space and water heating. In the summer months, warm temperatures increase electricity demand which boosts power burn.
• Power burn demand has been responsible for a large portion of the demand growth over the past decade. Cheaper gas prices and environmental regulations have allowed gas generation to compete with coal generation.
• While there will likely be continued domestic demand growth, exports will lead the demand charge.
Takeaways

No content below the line No content below the line
Thank you!
Platts Analytics Mitchell DeRubis [email protected] Bob Yu [email protected]
DISCLAIMER. THIS REPORT IS FURNISHED ON AN “AS IS”BASIS. BENTEK DOES NOT WARRANT THE ACCURACY OR CORRECTNESS OF THE REPORT OR THE INFORMATION CONTAINED THEREIN. BENTEK MAKES NO WARRANTY, EXPRESS OR IMPLIED, AS TO THE USE OF ANY INFORMATION CONTAINED IN THIS REPORT IN CONNECTION WITH TRADING OF COMMODITIES, EQUITIES, FUTURES, OPTIONS OR ANY OTHER USE. BENTEK MAKES NO EXPRESS OR IMPLIED WARRANTIES AND EXPRESSLY DISCLAIMS ALL WARRANTIES OF MERCHANT- ABILITY OR FITNESS FOR A PARTICULAR PURPOSE. RELEASE AND LIMITATION OF LIABILITY: IN NO EVENT SHALL BENTEK BE LIABLE FOR ANY DIRECT, INDIRECT, SPECIAL, INCIDENTAL, OR CONSEQUENTIAL DAMAGES (INCLUDING LOST PROFIT) ARISING OUT OF OR RELATED TO THE ACCURACY OR CORRECTNESS OF THIS REPORT OR THE INFORMATION CONTAINED THEREIN,WHETHER BASED ON WARRANTY, CONTRACT, TORT OR ANY OTHER LEGAL THEORY.
1800 Larimer Street in Denver, CO