northern mining: our past, our future mining: our past, our future mike vaydik general manager nwt...
TRANSCRIPT

Northern Mining: Our Past, Our Future
Mike VaydikGeneral ManagerNWT & Nunavut Chamber of Mines

NWT Mining History
Mining History
Mining & Infrastructure
Mining & the Community

History Overview
• Diverse Geology
• Various Staking Rushes
• Mines Built
• Infrastructure Improves
• Communities Affected


Mining / Exploration Activity
• 1899 Pine Point Base Metal • 1899 Treaty 8 signed• 1921 – Norman Wells Oil • 1922 – Treaty 11 signed• 1930 Great Bear Uranium Rush - Eldorado• 1938 YK Gold Rush - Rycon• 1943 YK Gold Rush - Giant• 1955 Ft. Rae Uranium – Rayrock• 1962 Pine Point Lead Zinc Rush – Pine Point • 1967 Coppermine Copper Rush • 1970s Keewatin Uranium • 1979 Contwoyto Gold - Lupin • 1991 Lac de Gras Diamond Rush – BHP, Diavik
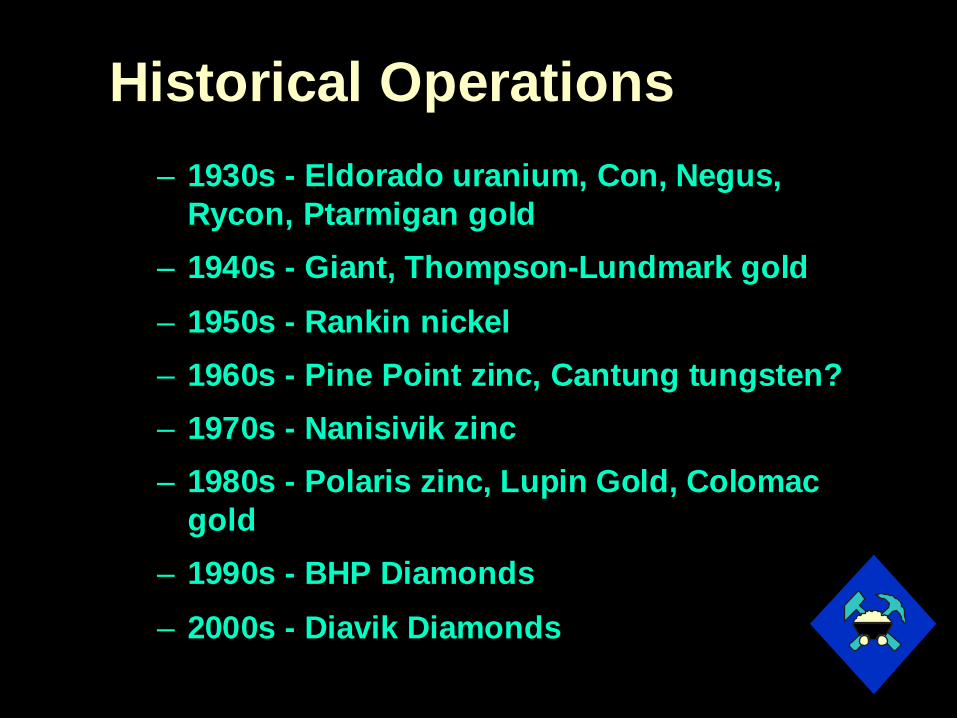
Historical Operations– 1930s - Eldorado uranium, Con, Negus,
Rycon, Ptarmigan gold– 1940s - Giant, Thompson-Lundmark gold – 1950s - Rankin nickel– 1960s - Pine Point zinc, Cantung tungsten? – 1970s - Nanisivik zinc– 1980s - Polaris zinc, Lupin Gold, Colomac
gold – 1990s - BHP Diamonds – 2000s - Diavik Diamonds

Gilbert Labine et al., Radium at Great Bear Lake,

Yellowknife Johnny - Burwash Gold Mine, 1934

Con Gold Mine, 1936-today

Giant Gold Mine, 1948

Rankin Nickel Mine, 1950s

Pine Point Zinc-Lead Mine, 1964-1990

Nanisivik Zinc-Lead Mine, 1976 - today

Nanisivik Zinc-Lead Mine, 1976 - today

Polaris Zinc-Lead Mine, 1982 - today

Polaris Zinc-Lead Mine, 1982 - today

Lupin Gold Mine, 1982 - today

Lupin Gold Mine, 1982 - today

Mining & Infrastructure
• Infrastructure Assisted Mining – River Boat – Bush plane – Cat Train – Ice Road

River boats used large rivers as highways

Post WW I, aircraft provided new opportunities – oil discovery, Norman Wells

Bush planes opened new, previously inaccessible areas


Early scheduled flights, flew ore & passengers - Port Radium to Alberta, 1930s

“Cat Trains” created early ice roads

Mining Supplied Infrastructure
– NTCL & Eldorado – Imperial Oil Refinery – Yellowknife Highway – Ice Road to Echo Bay – Scheduled Aircraft – Hydro-power - Con, Snare, Taltson– Railway to Pine Point– Nanisivik Marine Shipping - MV Arctic

NTCL “Radium Gilbert” Supply Boat – Eldorado Mine


Con Hydro Dam – Con Mine

Eldorado DC-4 – 1960s

Talston River Hydro Dam – Pine Point Mine

Pine Point Railway – 1960s - today

MV Arctic, Cargo/Ice breaker
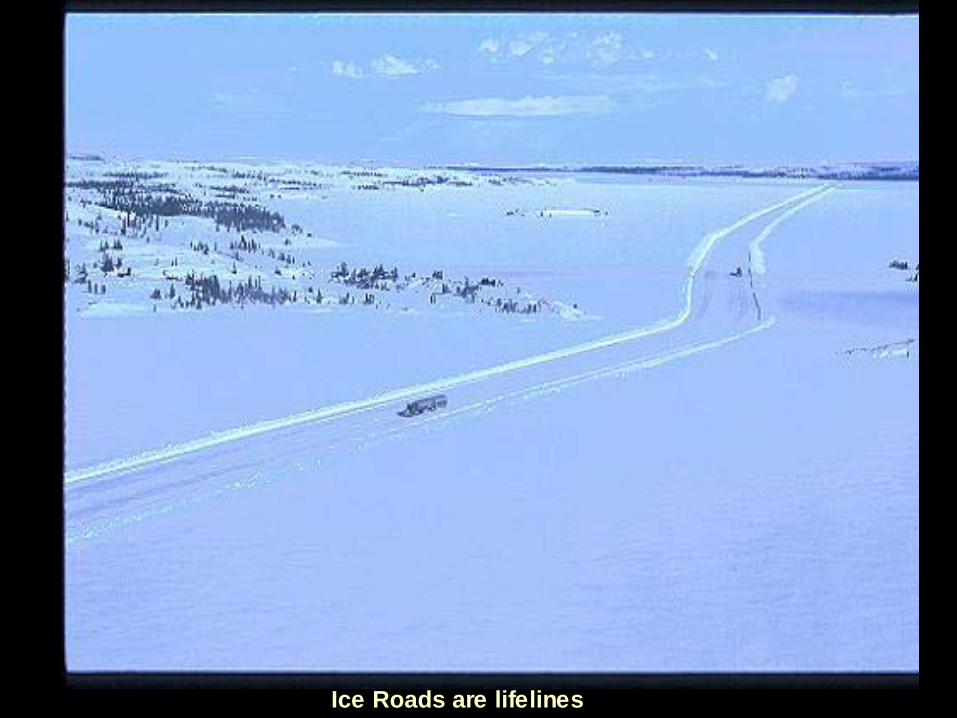
Ice Roads are lifelines

Mining & the Community
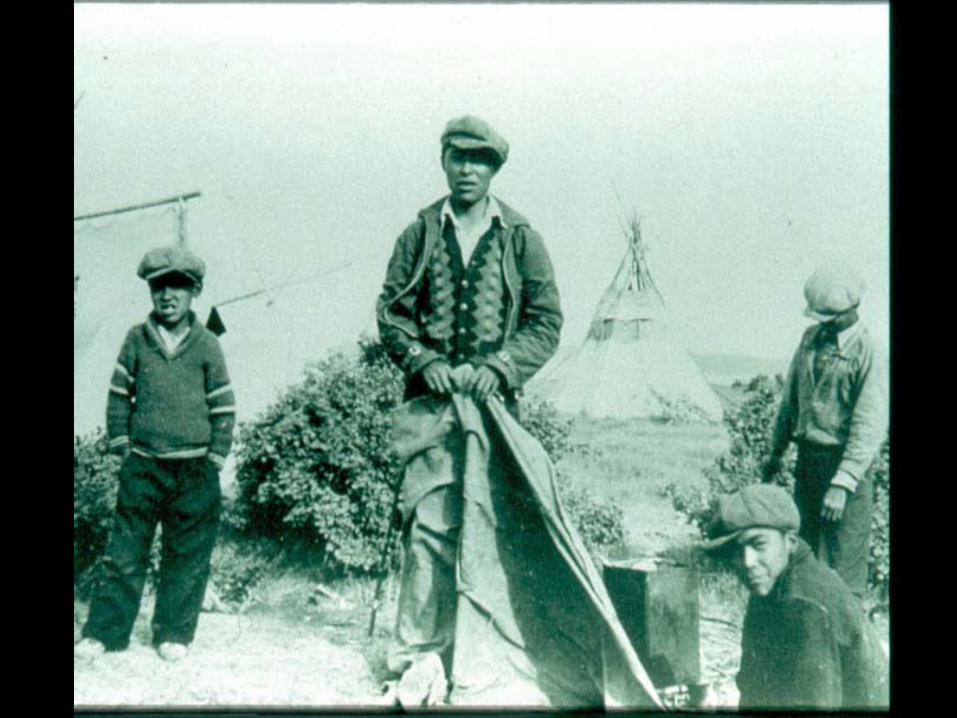
• Early Days - pre-1939 – Some Aboriginal People Benefited – Aboriginal People Helped Newcomers
• Burwash dock • wood cutters • meat suppliers


Mining & the Community
• 1939 - 1989 – Influx of Outsiders
• Transportation Services Improve (scheduled flights, all-weather roads)
• Government Services Improve - schools, hospitals • Communities Grow
– Newcomers become self-sufficient – Aboriginal People Largely Forgotten
• Some Aboriginal Training (Sir John, Rankin Nickel, Nanisivik)


Yellowknife Town Council – 1960s

Mining & the Community
• 1990 - Future– Legislation Recognizes Aboriginal Rights
• Land Claims provide subsurface/surface lands
– Companies Recognize Aboriginal People • Colomac, BHP, Diavik

Nanisivik – 1980s

Colomac – 1990s

Diavik Training Programs, 2000

Diamonds:The Creation of a New Canadian Industry
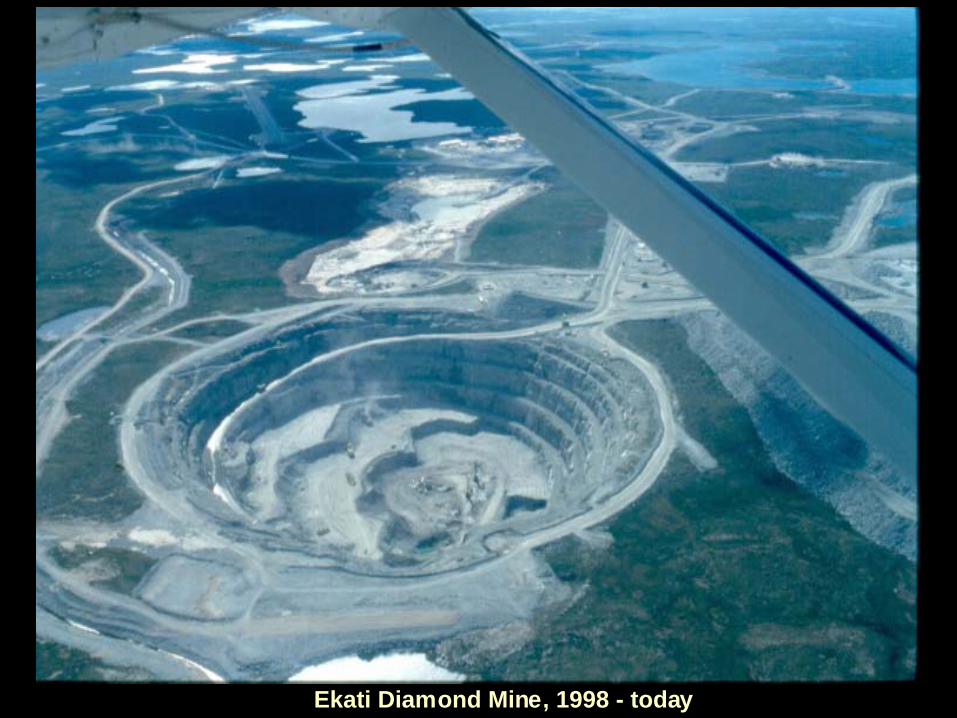
Ekati Diamond Mine, 1998 - today

Diavik Diamond Mine, 2003 - 2022

Chart 1: GDP at Basic Prices
0
500
1,000
1,500
2,000
2,500
3,000
1991
1992
1993
1994
1995
1996
1997
1998
1999
2000
2001
2002
Mill
ions
of D
olla
rs
Nunavut
NWT
GDP at Basic PricesGDP at Basic Prices

Chart 3: New Capital Investment in the NWT
0
200
400
600
800
1,000
1,200
1999 2000 2001 2002
Mill
ions
of D
olla
rs
Mining, Oil & Gas
Other Industries
Public Admin
Housing
New Capital Investment in the NWTNew Capital Investment in the NWT

Chart 4: Real Personal Income per Person
20,000
25,000
30,000
35,000
40,000
45,000
1991 1993 1995 1997 1999 2001
NWT
Nunavut
Canada
Real Personal Income per Person
Constant 2002 Dollars
NWT Nunav ut Canada
1991 27,376 23,733 26,089
1992 27,495 23,399 26,037
1993 29,766 26,499 25,801
1994 29,126 23,959 26,003
1995 28,617 23,662 26,195
1996 28,384 23,096 26,079
1997 29,400 23,944 26,459
1998 30,806 24,216 27,190
1999 35,308 27,809 27,736
2000 36,671 30,045 28,703
2001 38,902 31,658 28,806
2002 41,053 32,568 28,802
Change91-96 1,008 -637 -10
97-02 12,669 9,472 2,723
Real Personal Income Per PersonReal Personal Income Per Person

Chart 5: NWT and Canada Unemployment Rates 1991-2002
0.0
2.0
4.0
6.0
8.0
10.0
12.0
14.0
16.0
1991
1992
1993
1994
1995
1996
1997
1998
1999
2000
2001
2002
Perc
ent
NWT
Canada
Unemployment Rates(Percent)NWT Canada
1991 11.3 10.31992 12.5 11.21993 13.6 11.41994 14.8 10.41995 13.3 9.41996 11.7 9.61997 12.4 9.11998 13.0 8.31999 13.7 7.62000 11.4 6.82001 9.1 7.22002 5.9 7.7
NWT and Canada Unemployment RatesNWT and Canada Unemployment Rates

Chart 6: Real Retail Sales Per Person
5,000
6,000
7,000
8,000
9,000
10,000
11,000
12,000
13,000
1991 1993 1995 1997 1999 2001
Con
stan
t 200
2 D
olla
rs
NWT
Nunavut
Real Retail Sales Per PersonConstant 2002 Dollars
NWT Nunavut1991 7,370 6,0221992 7,839 6,3131993 7,864 6,2141994 8,232 6,3991995 7,927 6,1481996 8,293 6,3091997 8,919 6,7111998 9,169 6,6371999 9,710 6,8842000 10,197 7,0232001 10,930 7,0662002 12,260 7,251
Change91-96 924 28796-02 3,967 942
Real Retail Sales Per PersonReal Retail Sales Per Person

Chart 10: Annual Changes in Government Revenues per person From the Base Year 1999
-500
500
1,500
2,500
3,500
4,500
5,500
6,500
99-00 99-01 99-02
NWTNunavut
Total Real Territorial Government Revenues Per Person(Constant 2002 Dollars)
NWT Nunavut1999 21,541 33,0062000 25,566 33,2772001 27,557 32,9392002 23,556 33,368
Change99-00 4,026 27299-01 6,016 -6799-02 2,015 362
Annual Changes in Gov’tRevenuesAnnual Changes in Gov’tRevenues

Chart 11: Real Social Assistance Payments Per Person
0
200
400
600
800
1,000
1,200
1993 1994 1995 1996 1997 1998 1999 2000 2001 2002
Con
stan
t 200
2 D
olla
rs
Diamond
Yellowknife
Other NWT
Real Social Assistance Payments Per Person (Constant 2002 Dollars)
Diamond Yellow- knifeOther NWT
1993 938 100 3781994 966 168 3911995 1,031 233 4151996 935 205 3871997 683 183 4091998 649 199 4201999 607 216 3912000 604 187 2982001 487 150 2482002 515 149 223
Change93-96 -4 105 896-02 -419 -57 -163
Real Social Assistance PaymentPer PersonReal Social Assistance PaymentPer Person

Chart 17: Total Impact of Diamond Mining on NWT GDP at Basic Prices
0100
200300400
500600700
800900
1997 1998 1999 2000 2001 2002
Mill
ion
s of
Dol
lars
Indirect & Induced
Direct
Diamond Mining Contribution toNWT GDP at Basic Prices
($Millions)
Direct Indirect & TotalInduced
1997 98 63 1611998 151 76 2271999 474 39 5132000 405 122 5282001 534 175 7092002 591 185 776Total 2,254 660 2,914
Total Impact of Diamond Mining on NWTTotal Impact of Diamond Mining on NWT

Chart 18: Total Impact of Diamond Mining on NWT Employment
0
500
1,000
1,500
2,000
2,500
3,000
3,500
1997 1998 1999 2000 2001 2002
Pers
on Y
ears
Indirect & Induced
Direct
Diamond Mining Contribution to NWTEmployment (Person-Years)
Direct Indirect Total& Induced
1997 323 587 910
1998 473 585 1,058
1999 536 139 675
2000 827 586 1,413
2001 1,248 1,361 2,609
2002 1,414 1,560 2,975
Total 4,821 4,819 9,640
Average 804 803 1,607
Total Impact of Diamond Mining onNWT - EmploymentTotal Impact of Diamond Mining onNWT - Employment

Chart 23: Total Employment Income per Person by Community Type
90
100
110
120
130
140
150
1996 1997 1998 1999 2000
Inde
x 19
96 =
100
Total NWT
Other
Diamond
Yellow knife
Total Employment Income Per PersonTotal Employment Income Per Person

Chart 24: Dogribs Enrolled in Post-Secondary Education Programs
0
20
40
60
80
100
120
140
1994 1995 1996 1997 1998 1999 2000 2001 2002
Num
ber
Number1994 21995 31996 41997 51998 101999 152000 252001 502002 120
Dogribs Enrolled in Post –Secondary Education ProgramsDogribs Enrolled in Post –Secondary Education Programs

Conclusion
• High Northern Mineral Potential
• A Rich Mining Heritage
• Mining Impacts Infrastructure & Communities
• Today is History - Mining is finally becoming all northerners’ industry

For more information:
www. miningnorth.com