oil markets review - latest energy, metals & steel news, market
TRANSCRIPT

© 2013 Platts, McGraw Hill Financial. All rights reserved.
Jorge Montepeque, May 2013
Oil Markets Review

• Dated Brent reached 8 months high in first half of February, and then plummeted in mid April to lowest since beginning of July, 2012.
• Since then crude complex strengthened on the expected rate cut by European Central Bank, geopolitical concerns and strong US employment data.
• The unemployment rate in US is the lowest since December 2008 • Japan is continuing its QE, buying $70 bln in bonds, US Fed - $85 bln per
month • US showing positive signs, while EU and Japan still lag • Chinese GDP growth at 7.7% in Q1 2013, below widely expected 8% • Chinese manufacturing data weaker in April compared to March. • IMF downgraded its 2013 global growth forecasts by 0.2% to 3.3% • Policies pushed long term interest rates to record lows • Yields on US junk bonds on average fell below 5%, on more active search
by investors for higher yields.
Economic background
2

• Dated Brent reached 8 months high in first half of February, and then plummeted in mid April to near $100/bbl, the lowest since beginning of July, 2012
• WTI rises by nearly $10/bbl since mid April to above $95.00/bbl closing the gap with Brent to about $7.50/bbl
• Dubai and Oman both are hovering above the $100/bbl level • Platts launches quality premium system for Brent grades with deliveries of
Ekofisk and Oseberg for June contract • ICE announces position limits for legacy Brent futures contract, encourages
migration to NX Brent contract • Dated Brent is adopted in most areas of the world as benchmark • ICE Brent trading volumes rise above CME light crude futures • Dubai physical liquidity healthy, swaps futures volume rises to about 12-mil
bbl/day • Rising US production creates needs for price discovery, Platts launches Eagle
Ford and reviews other market areas
The world of benchmarks, assessments, swaps and futures
3

Bearish commodities markets
4 Source: FT

Dated Brent, $/b
Source: Platts
95
100
105
110
115
120
Dated Brent

BFOE monthly production
6
19,000,000
24,000,000
29,000,000
34,000,000
39,000,000
44,000,000
49,000,000
54,000,000
BFOE loading (bbl/month)
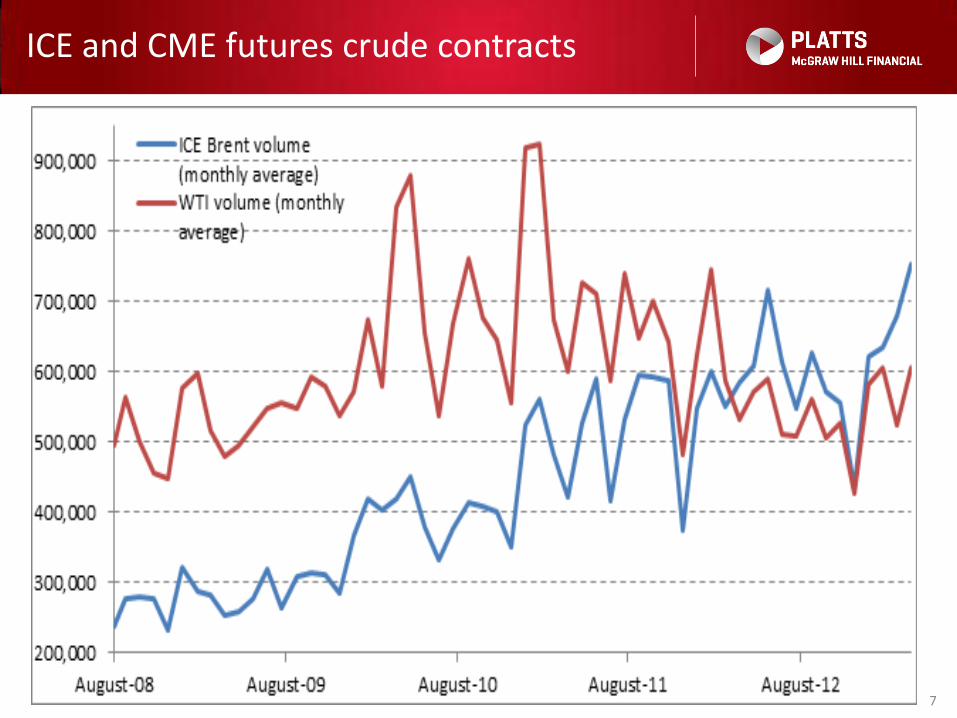
ICE and CME futures crude contracts
7
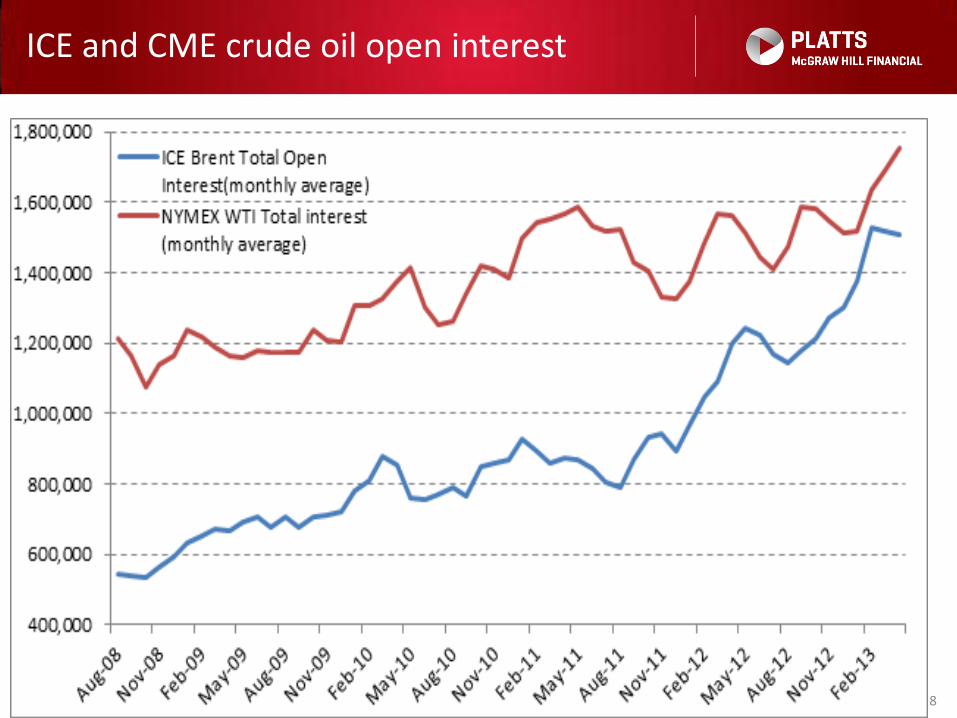
ICE and CME crude oil open interest
8

Brent/WTI, $/bbl
9 Source: Platts
0
2
4
6
8
10
12
14
16
18
20
22
24
26
Brent/WTI Spread Swap

WTI/Brent spread swaps for May 2013 – April 2016, $/bbl
10 Source: Platts
7.00
7.25
7.50
7.75
8.00
8.25
8.50
8.75
9.00
JUN
'13
JUL
'13
AU
G '1
3
SEP
'13
OC
T '1
3
NO
V '1
3
DEC
'13
JAN
'14
FEB
'14
MA
R '1
4
AP
R '1
4
MA
Y '1
4
JUN
'14
JUL
'14
AU
G '1
4
SEP
'14
OC
T '1
4
NO
V '1
4
DEC
'14
JAN
'15
FEB
'15
MA
R '1
5
AP
R '1
5
MA
Y '1
5
JUN
'15
JUL
'15
AU
G '1
5
SEP
'15
OC
T '1
5
NO
V '1
5
DEC
'15
JAN
'16
FEB
'16
MA
R '1
6
AP
R '1
6
May
'16
$/bbl

No. of Dubai partial trades each month for Jan 2012 – April 2013
11 Source: Platts

Global Oil Supply
12
Top oil producers in March 2013, mb/d
Country March 2013 2012 Change
Russia* 10.84 10.73 0.11
US** 9.91 9.14 0.77
Saudi Arabia 9.04 9.51 -0.47
China 4.24 4.18 0.06
Canada 3.96 3.76 0.20
Iran 2.68 3.00 -0.32
Iraq 2.96 2.95 0.01
* Including conventional crude oil, non-conventional crude oil, condensates, NGLs, **Including conventional crude oil, non-conventional crude oil, condensates, NGLs, biofuel
Source: IEA

• US total oil production (excluding NGLs) forecasting to exceed Saudi Arabia’s by 2017
• US would become virtually energy independent by 2035
• US oil production will increase to 11 mln b/d by 2020 and should allow US oil imports to decline to 4 million b/d from current 10 million b/d
• Eagle Ford and Bakken to yield 1.6 mln b/d by 2015
EIA: the US shale energy revolution
13 Source: EIA
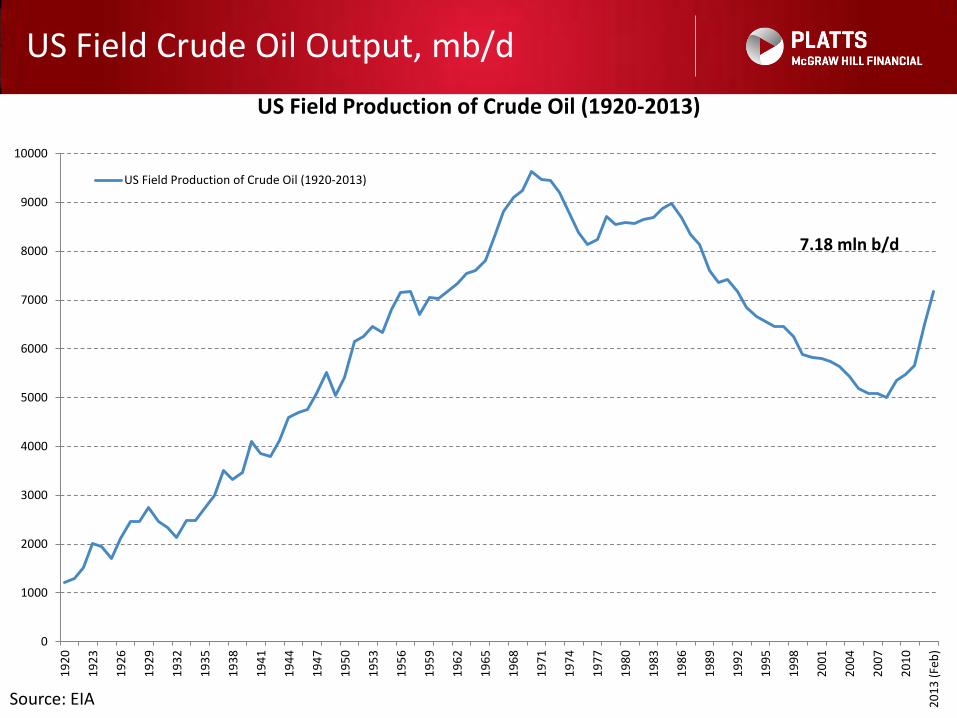
US Field Crude Oil Output, mb/d
Source: EIA
7.18 mln b/d
0
1000
2000
3000
4000
5000
6000
7000
8000
9000
10000
19
20
19
23
19
26
19
29
19
32
19
35
19
38
19
41
19
44
19
47
19
50
19
53
19
56
19
59
19
62
19
65
19
68
19
71
19
74
19
77
19
80
19
83
19
86
19
89
19
92
19
95
19
98
20
01
20
04
20
07
20
10
20
13
(Fe
b)
US Field Production of Crude Oil (1920-2013)
US Field Production of Crude Oil (1920-2013)

US Monthly Raw Natural Gas Liquids (NGLs)
15 Source: EIA
1,400
1,500
1,600
1,700
1,800
1,900
2,000
2,100
2,200
2,300
2,400
2,500
2,600
Feb
-200
7
Ap
r-2
00
7
Jun
-20
07
Au
g-2
00
7
Oct
-20
07
De
c-2
00
7
Feb
-200
8
Ap
r-2
00
8
Jun
-20
08
Au
g-2
00
8
Oct
-20
08
De
c-2
00
8
Feb
-200
9
Ap
r-2
00
9
Jun
-20
09
Au
g-2
00
9
Oct
-200
9
De
c-2
00
9
Feb
-201
0
Ap
r-2
01
0
Jun
-20
10
Au
g-2
01
0
Oct
-20
10
De
c-2
01
0
Feb
-201
1
Ap
r-2
01
1
Jun
-20
11
Au
g-2
01
1
Oct
-20
11
De
c-2
01
1
Feb
-201
2
Ap
r-2
01
2
Jun
-20
12
Au
g-2
01
2
Oct
-20
12
De
c-2
01
2
Feb
-201
3
MBPD
2,453 MBPD

US light sweet crude imports
16
0.00
0.25
0.50
0.75
1.00
1.25
1.50
1.75
2.00
2.25
2.50
19
86
19
87
19
88
19
89
19
90
19
91
19
92
19
93
19
94
19
95
19
96
19
97
19
98
19
99
20
00
20
01
20
02
20
03
20
04
20
05
20
06
20
07
20
08
20
09
20
10
20
11
20
12
20
13
(Ja
n-F
eb
)
US Light Sweet Crude Oil Imports (>35 API & <1.10 S%)
Source: EIA
MMBPD

US heavy crude oil imports
17
0.00
0.25
0.50
0.75
1.00
1.25
1.50
1.75
2.00
2.25
2.50
2.75
3.00
3.25
3.50
3.75
4.00
19
86
19
87
19
88
19
89
19
90
19
91
19
92
19
93
19
94
19
95
19
96
19
97
19
98
19
99
20
00
20
01
20
02
20
03
20
04
20
05
20
06
20
07
20
08
20
09
20
10
20
11
20
12
20
13
(Ja
n-F
eb
)
US Heavy Crude Oil Imports (<25 API & all S%)
Source: EIA
MMBPD

USGC crude prices follow global trends
18
95
100
105
110
115
120
Dated Brent
LLS @ St. James
Eagle Ford Marker

Investments into US shale oil
Foreign Domestic Amount
Partner Country Partner Shale Play ($B) Year
British Petroleum UK Chesapeake Woodford 1.70 2008
British Gas UK EXCO Marcellus 0.95 2009
StatoilHydro Norway Chesapeake Marcellus 3.38 2009
Reliance India Pioneer Eagle Ford 1.36 2010
Reliance India Atlas Marcellus 1.70 2010
Reliance India Carrizo Marcellus 0.39 2010
Total France Chesapeake Barnett 2.25 2010
CNOOC China Chesapeake Niobrara 0.57 2010
British Gas UK EXCO Haynesville 1.30 2010
Mitsui Japan Anadarko Marcellus 1.40 2010
CNOOC China Chesapeake Eagle Ford 1.08 2011
KNOC Korea Anadarko Eagle Ford 1.55 2011
Marubeni Japan Marathon Niobrara 0.27 2011
Mitsui Japan SM Energy Eagle Ford 0.68 2011
GAIL India Carrizo Eagle Ford 0.10 2011
Total France Chesapeake/EnerVest Utica 2.30 2012
Sinopec China Devon TMS, Niobrara,Utica 2.20 2012
Marubeni Japan Hunt Oil Eagle Ford 1.30 2012
Osaka Gas Japan Cabot Oil and Gas Pearsall(Eagle Ford) 0.25 2012
Sumitomo Japan Devon Midland-Wolfcamp 1.40 2012
Total…… 26.47
Source: EIA

20
Eagle Ford
-
200
400
600
800
1,000
1,200
1,400
1,600
1,800
2,000
2,200
2005 2006 2007 2008 2009 2010 2011 2012 2013 2014 2015 2016 2017 2018 2019 2020
MBPD
Source: Bentek Energy

Bakken expected production
21
-
100
200
300
400
500
600
700
800
900
1,000
1,100
1,200
1,300
1,400
1,500
1,600
1,700
1,800
1,900
2,000
2,100
2,200
2005 2006 2007 2008 2009 2010 2011 2012 2013 2014 2015 2016 2017 2018 2019 2020
Bakken Crude Oil Production Forecast
ND MT
MBPD
Source: Bentek Energy

Permian Basin Production Forecast
22
-
200
400
600
800
1,000
1,200
1,400
1,600
1,800
2,000
2,200
2005 2006 2007 2008 2009 2010 2011 2012 2013 2014 2015 2016 2017 2018 2019 2020
TX NM
MBPD
Source: Bentek Energy

• Enterprise Seaway Pipeline (400 kb/d) – reversed in May 2012 – a 50:50 joint venture between Enbridge and Enterprise -- ships crude oil from Cushing to Freeport through Jones Creek, northwest of Freeport, to Texas City
• TransCanada Keystone XL is to ship crude from the Athabasca oil sands in Canada to Cushing, Oklahoma (830 kb/d) and onward to the US Gulf Coast (591 kb/d)
• Energy Transfers Partners have proposed to convert a natural gas pipeline into a 400 kbd Trunkline crude oil line from Illinois to Texas
• Magellan Longhorn Segment Products Pipeline Conversed to Crude Oil (mid-April 2013) to ship 75,000 b/d crude movements from Crane, TX to Houston refineries. The pipeline will increase to the full 225,000 b/d capacity in Q3 2013 and will be expanded to 295,000 b/d later
• Sunoco Logistics Partners' Permian Express Pipeline - 150,000 b/d crude movements from Wichita Falls to Nederland/Beaumont, TX
US key pipeline projects
23

Pipelines to bring crude oil from Cushing to USGC
24 Source: Platts
Proposed pipeline projects for Cushing to US Gulf Coast
New Capacity
Completion date Status
Enterprise Seaway Pipeline 850,000 Q2 2014
Phase 1 Completed
TransCanada Keystone XL 591,000 4Q 2013
Under Construction
Energy Partners Trunkline 400,000 TBD
Regulatory Review
Cushing to USGC Capacity 1,841,000
Jan 22, 2013 – Keystone XL received approval from Nebraska governor, awaits approval from Obama administration

25
Permian Basin
Completion date
New/Expanded Capacity
Total Capacity
Destination Status
Magellan Longhorn Segment Reversal
1Q 2013 225,000 225,000 Houston Near Completion
BridgeTex (50/50 Oxy & Magellan)
Mid-2014 300,000 300,000 Houston Developmental Stage
Permian Express (Sunoco Logistics)
2H 2014 350,000 350,000 Beaumont Phase 1 Construction
Phase I 2H 2013 150,000 Beaumont
Phase II 2H 2014 200,000
Sunoco West Texas Gulf
1Q 2013 100,000 140,000 Beaumont Construction
Total 975,000

26
Rail terminals in North Dakota…
1
2
3
4
5
6
7
8 9
10
11
12
14
13
1) EOG Rail - Stanley, ND 8) Enbridge Rail - Berthold, ND
2) Rangeland COLT - Epping, ND 9) Plains - Ross, ND
3) Hess - Tioga, ND 10) Basin Transload - Zap, ND
4) Bakken Oil Express - Dickinson, ND 11) Dakota Plains - New Town, ND
5) Plains/USD - Van Hook, ND 12) Great Northern - Fryburg, ND
6) Musket Corp. - Dore, ND 13) Musket Corp. – Dickinson
7) Savage Rail - Trenton, ND 14) Centennial Energy - Donnybrook

27
Owner/Project Capacity (Mb/d) Start Date 1) EOG Rail - Stanley, ND 65 <2010
2) Rangeland COLT - Epping, ND 80 May-12
3) Hess - Tioga, ND 25 - 60 Mar-12 - Dec-12
4) Bakken Oil Express - Dickinson, ND 100 - 200 Oct-11 - Jun-12
5) Plains/USD - Van Hook, ND 35 - 65 Sep-12 - Jun-13
6) Musket Corp. - Dore, ND 10 - 60 <2010 - Jun-11
7) Savage Rail - Trenton, ND 90 May-12
8) Enbridge Rail - Berthold, ND 10 - 80 Sep-12 - Feb-13
9) Plains - Ross, ND 20 - 65 Jan-12 - Nov-12
10) Basin Transload - Zap, ND 10 - 40 <2010 - Jun-12
11) Dakota Plains - New Town, ND 20 - 40 <2010 - Mar-11
12) Great Northern - Fryburg, ND 60 Jan-13
Other Rail
13) Musket Corp. - Dickinson 8 2010
14) Centennial Energy - Donnybrook 10 2010
Total Rail Capacity 833
Rail capacity
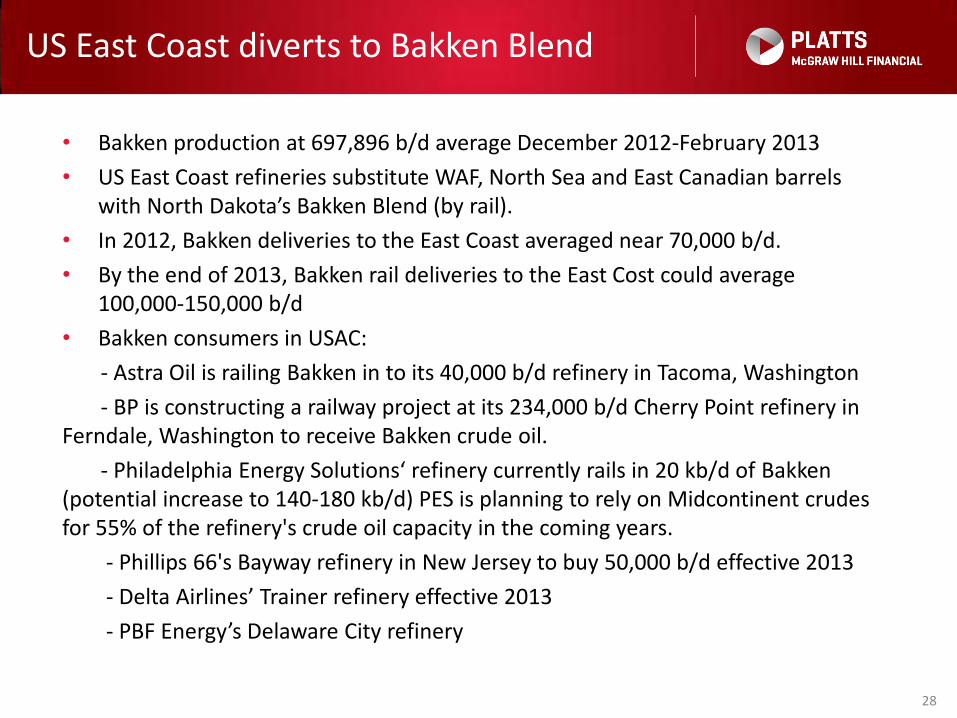
• Bakken production at 697,896 b/d average December 2012-February 2013
• US East Coast refineries substitute WAF, North Sea and East Canadian barrels with North Dakota’s Bakken Blend (by rail).
• In 2012, Bakken deliveries to the East Coast averaged near 70,000 b/d.
• By the end of 2013, Bakken rail deliveries to the East Cost could average 100,000-150,000 b/d
• Bakken consumers in USAC:
- Astra Oil is railing Bakken in to its 40,000 b/d refinery in Tacoma, Washington
- BP is constructing a railway project at its 234,000 b/d Cherry Point refinery in Ferndale, Washington to receive Bakken crude oil.
- Philadelphia Energy Solutions‘ refinery currently rails in 20 kb/d of Bakken (potential increase to 140-180 kb/d) PES is planning to rely on Midcontinent crudes for 55% of the refinery's crude oil capacity in the coming years.
- Phillips 66's Bayway refinery in New Jersey to buy 50,000 b/d effective 2013
- Delta Airlines’ Trainer refinery effective 2013
- PBF Energy’s Delaware City refinery
US East Coast diverts to Bakken Blend
28

• Eagle Ford oil production average at 340,000 b/d Jan-Nov 2012 • Eagle Ford condensate production average at 72,126 b/d Jan-Nov 2012 • Valero replaced all its foreign light oil imports with domestic crude at
its Gulf Coast and Memphis, Tennessee, plants in Q4 2012 • Valero is currently consuming a total of 140,000 b/d of Eagle Ford Shale
crude at its refineries (95,000 b/d Three Rivers refinery, 205,000 b/d Corpus Christie refinery, 90,000 b/d Houston refinery in Texas, 135,000 b/d Meraux in Louisiana)
• Canadian heavy crude oil flows push back import from Mexico and Venezuela
• LyondellBasell terminated shipments of Saharan Blend into USGC refineries
• Philadelphia Energy Solutions will ship Eagle Ford and other Gulf Coast crudes by Jones Act vessels when the arbitrage allows
• Petrobras' Pasadena Refining System Inc is also refining about 20,000-30,000 b/d of Eagle Ford
US Gulf Coast diverts to domestic crude oil
29

• Statoil exports US Bakken crude to Canada
• Valero received a one-year permit to export Eagle Ford to Eastern Canada
• BP received a permit summer 2012
• Shell applied for a permit
US is to export unwanted crude oil to Canada and possibly elsewhere
30

New crude is found elsewhere
31
Australia: 233 bln barrels found?
Permian basin in Texas: 1.2 mb/d
Bazhenov in Russia: 182 bln bbls recoverable reserves
Bazhenov size = Texas and Gulf of Mexico combined Bazhenov may provide 0.8-1.0 mln b/d by 2020
Developed by Rosneft jointly with ExxonMobil and Statoil
Lukoil Gazpromneft and Shell

• Kashagan oil field discovered in 2000 in the Caspian Sea.
• The production is expected to start in October 2013, according to Kazakhstan’s oil and gas minister.
• Expected to produce around 60-120 kb/d by the end of 2013 or early 2014. During 2014 to rise to 370 kb/d.
• Kashagan estimated to have 38 billion barrels of oil, including 13 billion of proven recoverable reserves, due to complicated structure of reservoir.
• Preliminary tests showed that crude is light (45 API) and 1% sulfur.
• Being developed by North Caspian Operating Consortium:
New Oil: Kashagan
32
ENI 16.81%
Shell 16.81%
ExxonMobil 16.81%
KMG 16.81%
Total 16.81%
Conoco 8.39%
Inpex 7.56%

• US dependence on OPEC members to decline • Light crude oil looking for markets • US role as a product exporter to increase • Low interest rates to continue to funnel capital to
producing areas • Demand in Europe and US to remain lacklustre • Some markets in the US to change from an import to an
export mode • Internal competition in the US to heighten between gas
and oil • Platts to monitor and launch new instruments in the US,
i.e. Eagle Ford, Permian and other domestic streams
Conclusion
33

twitter.com/plattsoil
The Barrel Blog
platts.com/BlogDetails/oilblog
EMEA Oil Events