operational recognition of high precipitation … · latitudes where the freezing level is often...
TRANSCRIPT

1. INTRO Oflooding hfatalities United Staevent isoccurrenctornadoesseveral nwith excmeteorolomoisture, interactionNon-meteor approxprimary rates, canis higher warnings In contraslead towawarning. especiallyNational contributelead to fahave othe Tnetwork ahas madeto forecasoccurred time rainfathat correrates. A conjunctiooften suffHowever, upon thealgorithmsinaccurateSmith 199
* CorrespoWeather SCross Blvted.ryan@n
P6.1
DUCTION
Over the lahas ranked associated
ates (NOAA).s different ce of other cos or large hnon-meteoroloessive rainfa
ogical factorsdrainage bas
n of runoff eorological faximated, but e
meteorologicn also occur.
than reality issued for ev
st, a rainfall eard a flash floo
Unwarned y counter to
Weather e toward a lacatalities or proerwise been phe deploymeacross the Ue substantial ist flash floodsbecause the all estimates
elate reflectivforecaster’s
on with short-ficient to antic this metho
e WSR-88D s, which e for a numb98).
onding author aService Forecvd, Fort Wnoaa.gov
ast few decas the leadiwith convec
. Anticipatingthan fore
onvective hazhail becauseogical factorsall rates. s include antsin characteri
with civil iactors are ofterrors in estimcal factor, A rainfall escan result i
vents which dstimate that iod event occu
flash floodthe core m
Service beck of awarenoperty damag
prevented or ment of the WSnited States mprovements
s (Polger et alWSR-88D pfrom comput
vity values touse of rainfal-term conveccipate a flashd places he
precipitationunfortunately
ber of reasons
address: Ted Rcast Office, 3
Worth, TX 76
OPERPRECIPIT
cades, flashing cause ofction in theg a flash floodecasting thezards such ase it requiress to coincideThese non-
tecedent soistics, and thenfrastructure
ften unknownmation of the
precipitationstimate whichn flash flooddo not occurs too low canurring with no events areission of the
ecause theyess and mayge that couldmitigated. SR-88D radarin the 1990s
s in the ability. 1994). Thisroduces real-ter algorithms
o precipitationl estimates in
ctive trends ish flood eventeavy reliancen estimationy can bes (Baeck and
Ryan, Nationa3401 Northern6137; e-mail
RATIONAL TATION EF
CENTROTed Rya
NOAA/Nat
h f
e d e s s e -l
e . n e n h d . n o e e y y d
r s y s -s n n s . e n e d
l n :
causoccathe undemicrwith examthe comtype to pcomreco 2. RAPRE
can the estimbe estimprecReflethe 6the stargedrop1993
is eqvolumEqua
can two o
RECOGNIFFICIENCYOID CONVEan* and Jeffrey
tional Weather
This resese of radar raasionally occu
United Serestimation ophysical prconvection
mination of sCentral and mon characof convectio
provide the oplete concep
ognition in a re
ADAR FUNDECIPITATION
To underbe responsibaccuracy
mation, a revaddressed.
mates utilizcipitation ratectivity perce6th power of square of theets and the ps as given b3).
Precipitatqual to the nme, and theiration 2.
R = So Ze an
be resolved of the form:
TION OF HY AND LOWECTION
Vitale
Service
earch will exainfall rate unurs over conStates.
results roperties typin tropical e
several flash Southern P
cteristics assn. The goal operational foptual model eal-time opera
DAMENTALS N PRODUCTIO
rstand why cble for a signof radar-baiew of radar
Radar-baze reflectivte in a sived by the rathe rain drop
e dielectric cdrop size d
by Equation 1
|K|2 Ntion rate (R), number of hyr fall velocity (
N0e − Λ D (d R have simgiving a rela
Z
HIGH W ECHO
xamine a spnderestimationtinental regioThis syste
from pically assocenvironments.
flood eventsPlains will idsociated with
of this reseaforecaster a
to aid in ational setting
AND ON PROCES
cloud microphnificant varianased precipi
meteorology ased precipivity to dscanned voadar (Ze) variplets' diameteconstant (K) odistribution o(Doviak and
N0e − Λ D D6dD on the other ydrometeors,(v[D]) as show
(πD3/6) v(D)dmilar functionation betwee
Ze = aRb
pecific n that
ons of ematic cloud ciated . An s over dentify h this arch is
more better g.
SSES
hysics nce in itation must
itation derive olume. ies by er (D), of the of the
Zrnic
(1) hand, their wn by
D (2) s that
en the
(3)

Where a and b depend on the type of precipitation which can have different Λ, K, N0 and v. Equation 3 (specifically the values of the constants a and b) is commonly referred to as the Z-R relationship. Several values for a and b have been derived for precipitation estimation use in different atmospheric regimes (Wilson and Brandes 1979). Using the correct Z-R relationship can result in reasonably accurate estimates. However, these Z-R relationships must be applied to the entire radar domain, and if precipitation is resulting from different microphysical processes in different locations, significant errors may arise. A simple example that illustrates the fundamental problem with using radar reflectivity to estimate rainfall rates can be shown by solving these three equations for two different drop size distributions (DSDs). Equation 1 states that Ze is proportional to the sixth power of the drop diameter, indicating that drop size, rather than number of drops in the sampled volume, is the heaviest weight in the calculation. For example, solving Eq. 1 for 729, 1 mm diameter drops per cubic meter will yield a Ze value of 29 dBZ, as will a single (1), 3 mm diameter drop in a cubic meter volume. If a size-appropriate fall velocity is used, the rainfall rate given by Eq. 2 for the 729 drop example is 5.6 mm (0.22 in) per hour, while the single drop example will only produce 0.25 mm (0.01 in) per hour (National Weather Service 2008). The current WSR-88D precipitation algorithm would use a reflectivity value, as estimated from backscattered energy, to derive a rainfall rate from Eq. 3. If both DSD examples were present in different cells across a single WSR-88D coverage area, no single Z-R relationship could be used to accurately estimate rainfall rates for both cells. While this example is improbable in the real atmosphere where DSDs are more homogeneous from cloud to cloud, it does show rather dramatically why for a given reflectivity many different values of rainfall rate are possible. In the real atmosphere different DSDs are generated as a result of differing precipitation production mechanisms (Marshall and Palmer 1948; Srivastava 1971; Bringi et al. 2003). Precipitation typically forms from one of two methods or a combination therein; collision-coalescence (commonly referred to as warm-rain or warm-cloud process) or the Bergeron process which involves water in the ice phase.
Convection relying upon collision-coalescence to produce rainfall is usually more efficient than the Bergeron process at converting available cloud water into precipitation (Lamb 2001). The collision-coalescence or warm-cloud method occurs in the absence of water in the ice phase and is very common at tropical latitudes where the freezing level is often greater than 4 km MSL (Battan and Braham 1956). In this process, cloud droplets suspended in the air interact with each other, either by colliding and bouncing off each other or by combining to form a larger droplet. Eventually the larger droplets become more massive and fall toward the surface due to gravity. The coalescing of water vapor to tiny water droplets is an exceedingly slow process, and most precipitation sized particles are formed as a result of the collision of large droplets “sweeping” up smaller droplets as they descend (Klett and Davis 1973). The Bergeron process involves ice nuclei and is a faster way to generate precipitation sized particles (Wallace and Hobbs 1977). This process generally begins at temperatures below -10°C when naturally occurring ice nuclei activate and allow ice crystals to form inside a cloud (Wallace and Hobbs 1977). Since saturation vapor pressure of air with respect to ice is lower than the saturation vapor pressure with respect to liquid water, ice crystals will grow at the expense of liquid water droplets in a mixed phase cloud. There is a natural tendency for DSDs produced by warm-cloud processes to be made of a large number of small diameter drops (Squires 1956). Precipitation from the Bergeron process has a DSD skewed toward a small number of large diameter drops. While the radar reflectivity signal may be identical for either case, the large number of small drops will produce quantitatively more rainfall (Ulbrich and Atlas 2008). Therefore knowing the mechanism that is producing precipitation allows for better Z-R approximations. The best way to determine the precipitation mechanism is to know when the atmosphere will be favorable for warm-cloud convection to occur. 3. SYNOPTIC REQUIREMENTS FOR WARM-CLOUD CONVECTION Identifying the atmospheric conditions that are favorable for convection where collision-

coalescence can be the dominant rainfall-producing mechanism is the first step toward recognizing the resulting convective signatures in real-time. Diagnosing the presence of ingredients that allow for high precipitation efficiency and excessive rainfall rates has been an effective flash flood forecast tool (Doswell et al., 1996). Similarly, an ingredients-based checklist of the atmospheric conditions required for warm-cloud convection would be an effective way to anticipate this type of convection. Many of the ingredients required for warm-cloud convection are similar to those needed to produce high precipitation efficiency. Excessive rainfall events from collision-coalescence processes require (Davis 2001):
*Deep warm-cloud layer *Weak and/or shallow updrafts *Limited cloud-layer wind shear *High relative humidity through a deep layer
Warm-cloud depth, defined as the layer from the Lifted Condensation Level (LCL) to the -10°C level, is the area of the cloud where the collision-coalescence process is allowed to occur. Obviously, a shallow warm-cloud layer will limit the time and space available for this process. In the case of a shallow warm-cloud layer, incoming cloud water vapor is more likely to be converted into ice in the cold parts of the clouds where it is comparatively less efficient at reaching the ground as precipitation (Lamb 2001). While there is no minimum value of warm-cloud depth, all of the excessive rainfall cases studied in section 5 had values greater than 4 km. The updraft characteristics are important for several reasons. Shallow updrafts, where the equilibrium level (EL) is below the -10°C level, ensure that the inefficient Bergeron process will not occur. In situations where the EL is above the -10°C level, the updraft must have slow vertical velocities through a deep warm-cloud layer. This is because collision-coalescence is a comparatively time consuming process, and a weak updraft gives raindrops the necessary time required to grow large enough to precipitate out before the updraft adiabatically cools below -10°C. The updraft characteristics can be diagnosed through a representative skew-T chart. A narrow or "thin" profile of Convective Available Potential Energy (CAPE)
on an observed or forecast skew-T diagram will provide an indication of slow updraft velocities. Strong wind shear in the cloud-layer will increase entrainment of presumably unsaturated environmental air into the updraft. Weak updrafts will not be able to persist in the presence of strong wind shear. Similarly, tilting an updraft can eject embryonic raindrops outside of the saturated cloud where evaporation reduces precipitation efficiency (Schoenberg et al. 1996). Relative humidity, both below the cloud base and within the mid and upper levels of the atmosphere, is likely the most important ingredient used to assess precipitation efficiency. The relative humidity below the base of the cloud (or LCL) determines the amount of sub-cloud evaporation that occurs. Similarly, a cloud will naturally entrain some quantity of environmental air (Doswell et al. 1996). Mid-level and sub-cloud evaporation can create negatively buoyant (cold) downdrafts, which severely hinder the ability of warm-cloud convection to produce excessive rainfall. This is because convection cannot sustain itself in the presence of cold downdrafts without cell motion or wind shear. As already noted, shear is detrimental to the weak updrafts required for warm-rain convection, and increasing cell motion has the effect of limiting the duration of heavy rainfall. In addition to an atmospheric environment that eliminates downdrafts caused by evaporation, the synoptic environment must reduce the potential that precipitation creates its own relative cold pool. A precipitation induced cold pool can develop during the day from differential heating between sunny and rainy areas. Immersed within weak shear environments, this cold pool, which behaves as a mesohigh beneath the cell, will either force cell motion or cell dissipation as low level divergence overpowers the weak updraft. It is no coincidence that all of the cases examined in section 5 either occurred at night or on the cool side of a front (where a saturated temperature inversion was present) thereby limiting or preventing any differential heating effects. 4. THE LOW ECHO CENTROID Many studies of excessive rainfall events often describe convection as having a

Low Echo Centroid (LEC) (Caracena et al. 1979; Smith et al. 1996; Baeck and Smith 1998). LEC is the term used to describe the vertical structure evident on a radar cross section of a cell, where the centroid (highest reflectivity) of the cell is located in the lower sections of the cloud that are typically above freezing. Unfortunately the definition of a LEC has remained vague since its inception by Caracena et al. in 1979 when it was used to describe the radar characteristics of the cell responsible for the Big Thompson Canyon flood of 1976. The reason why a mature warm-cloud cell will have this “bottom-heavy” reflectivity structure is due to the way raindrops develop with collision-coalescence. Raindrop growth in collision-coalescence tends to occur as the more massive droplets “sweep” up or collect smaller droplets on their descent through the updraft. Therefore the largest diameter raindrops will be found at the bottom of the cell, with the more embryonic raindrops located at progressively higher altitudes. The radar-reflectivity equation (Eq. 1) states these larger droplets will reflect considerably more signal back to the radar resulting in higher reflectivity values. Although the LEC definition is vague, it does address the fundamental radar signature that is associated with convection where the collision-coalescence process is responsible for the majority of the precipitation production. But just because the higher reflectivity is located in the lower portions of a cell, does not necessarily mean the collision-coalescence process is the cause. For instance, a radar scan of a cell with a descending hail core may also have an LEC appearance. Therefore additional guidelines on the definition of LEC signatures have been informally proposed. National Weather Service radar training material suggests the height of the 30 dBZ should remain below the environmental freezing level (National Weather Service 2008). Another informal rule suggest tracking the height of the 50 dBZ echo and ensuring it remains below the freezing level throughout a cell’s lifetime. Field experiments involving tropical maritime convection as a part of TOGA COARE showed that the average DSD associated with mature steady-state cells had raindrop diameters centered at approximately 2 mm (Atlas and Ulbrich 2000). Reflectivity values associated with this convection were approximately 47 dBZ. Raindrop diameters larger than 2 to 3 mm tend to be mechanically
unstable and break apart on descent (Ludlam 1951). Therefore, reflectivity values significantly higher than 47 dBZ would indicate large stable hydrometeor structures like ice crystals, graupel, or hail were present and that the Bergeron process was performing a pivotal role in precipitation production. Case studies where the LEC structure has been identified also noted an absence of cloud-to- ground lightning (Peterson et al. 1999). This can be attributed to a lack of large graupel and large vertical velocities from strong updrafts within a convective cell. Both of which are the fundamental ingredients that lead toward charge separation and lightning discharge (Lucas et al. 1994; Zipser and Lutz 1994). While these guidelines can help, the LEC signature remains ill-defined, difficult to recognize, and easy to overlook, especially in the presence of “ordinary” continental convection with a High Echo Centroid (HEC). The inability to identify the LEC structure in real-time has resulted in the occurrence of unwarned flash flood events during the last couple decades (Davis 2004). 5. CASE STUDIES OF EXCESSIVE RAINFALL EVENTS ASSOCIATED WITH LEC Six cases where convection with LEC signatures produced excessive rainfall and significant flash flooding were closely analyzed. Traits in the synoptic environment as well as real-time radar, satellite, lightning detection network, and surface observations data were compared to each other to find similarities. Rain gauge reports were used to critique radar estimates in order to find the cells where underestimation occurred. Systematic rainfall underestimation of anywhere from 50% to 200% was associated with LEC radar structures using standard convective Z-R relationship. Many of the cases had simultaneously occurring stratiform precipitation and “ordinary” continental convection with a HEC and were not underestimated. Because not all convection within a radar domain had LEC characteristics, using a different Z-R relationship would not have resulted in quantitatively better rainfall estimates. Since underestimation was associated with primarily LEC cells, it is reasonable to assume inaccuracies in rainfall estimation resulted from differing cloud

microphysics and not a different source of error such as beam blockage, inadequate sampling, or signal calibration. Kansas Turnpike On the evening of 30 August 2003, an isolated stationary LEC cell developed near Emporia, Kansas. Rainfall amounts within the Jacob Creek Basin averaged 16 to 20 cm (6 to 8 in) and were almost twice the radar estimate from KTWX between 0000 UTC and 0300 UTC. Jacob Creek overflowed its banks and submerged the northeast-bound lanes of Interstate 35 (Kansas Turnpike). Cars floated up against concrete median dividers which subsequently failed and sent a wall of water across the southwest-bound lanes, sweeping seven cars off the road and killing six people (Kelsch and Koehler 2005). Unfortunately, the flash flood event occurred before a flash flood warning was issued. The synoptic environment was favorable for the development of convection with LEC. A representative model skew-t chart from the RUC-II (Benjamin et al. 2004) is used to show the atmospheric environment in which this cell developed (Fig. 1). The warm-cloud depth was over 4 km and precipitable water was near 5.1 cm (2.0 in). The atmosphere was nearly saturated and unfavorable for the development of cold downdrafts. In addition, the event occurred to the north of a quasi-stationary front (Fig. 2). Further analysis of the model sounding shows weak instability as depicted by thin CAPE up through the EL at approximately 300 mb. A radar cross section of the cell that produced the heavy rainfall showed a LEC structure (Fig. 3). No lightning was detected with the cell responsible for the excessive rainfall, and satellite shows cloud tops remained warm, indicative of shallow convection (Fig. 4). Archer & Young County, TX Several hours of localized heavy rainfall resulted in flash flooding across Archer County and northern portions of Young County on the morning of 6 October 2005. The flash flood event occurred before a warning was issued, but unlike the Kansas Turnpike event, resulted in little property damage and no fatalities. Rainfall amounts between 16 and 20 cm (6 and 8 in) fell
between 0600 UTC and 1500 UTC and were underestimated by WSR-88D rainfall algorithms by a factor of two. The synoptic environment was favorable for the development of convection with LECs and met all of the requirements listed in section 3. A weak cold front had moved into North-Central Texas and stalled with the area of interest located on the cool side of the boundary. Precipitable water values were 4.1 cm (1.6 in) which are not significantly high or above climatological values for the region. A look at a skew-T chart from a rawinsonde taking during the excessive rainfall event at FWD, 140 km (80 mi) to the ESE of the flood provides further insight to the atmospheric environment (Fig. 5). A parcel lifted from 900 mb reached its EL before cooling to -10°C. Updraft velocities were presumably slow as suggested by the thin area of CAPE. Additionally, wind shear was very weak and the airmass was nearly saturated within the updraft layer. The warm-cloud depth was over 4.5 km. Periodic cross sections of the quasi-stationary cell during the event confirm a LEC structure (not shown). This cell retained this radar signature for several hours. Additionally, between 0700 UTC and 1500 UTC, no cloud to ground lightning strikes were detected. The IR satellite depicted cloud tops generally warmer than -25°C throughout this event (not shown). Fort Collins, CO As far as synoptic conditions, radar signatures, and areal coverage of the event, this case in Fort Collins, Colorado on 29 July 1997, was very similar to the previous two discussed. The flash flood which killed five people was caused by an isolated stationary convective cell with a LEC that produced over 25 cm (10 in) of rainfall in less than six hours. Through the use of a dual-polarmeteric radar and confirmation of LEC structure from a WSR-88D, it has been determined that the excessive rainfall was produced by a cell with precipitation processes being dominated by collision-coalescence. Cloud-to-ground lightning was limited, but did occasionally occur. Additionally, IR satellite cloud tops remained warmer than -40°C. For additional information the reader is referred to an excellent discussion of the event by Peterson et al. 1999.

Dallas, TX This event was characterized by widespread convection during the daytime hours of 19 March 2006. Numerous flash flood warnings were issued by the National Weather Service office, and excessive rainfall caused flash flooding over a large area affecting multiple counties. In addition, sporadic severe weather reports in the form of large hail also occurred in the region. The height of the flash flood event was between 1800 UTC and 2100 UTC over the greater Dallas metropolitan area where a 19 year old college student drowned after driving into floodwaters along a roadway. This event presented difficult challenges to the operational warning program with flash flooding and severe weather occurring simultaneously. As a result, radar based rainfall estimates were correct in some locations and significantly wrong in others at various times during the event. A high density network of rain gauges owned by the city of Dallas flood control district reported rainfall rates in excess of 7.6 cm (3 in) per hour were common, with rainfall totaling 15 to 20 cm (6 to 8 in). Radar rainfall estimates using the standard convective Z-R relationship were over 3 times lower than gauge data. A switch to Rosenfeld tropical Z-R relationship at 1900 UTC improved estimates, but still resulted in underestimation of 50% to 100% over the city of Dallas. Interestingly, the synoptic environment in this event supported severe thunderstorms in some locations but also was favorable for the development of LEC convection. Once again, a cold front was located to the south of region where the flooding occurred (Fig. 6). A rawinsonde observation from FWD approximately 3 hours after the flash flood event ended showed that conditions were marginally favorable for LEC storms (Fig. 7). The warm-cloud layer depth was approximately 4.1 km and the airmass was nearly saturated through the tropopause. A parcel lifted above the frontal inversion was weakly to moderately unstable with CAPE characteristics still thin, but not as thin as the previous examples. Wind shear was also stronger than the previous examples, with cloud layer shear values over 15 m s-1. Radar data during the event indicated both HEC and LEC convection occurring simultaneously in different regions. HEC
convection was responsible for the severe hail reports. Cell motion in this event was much faster than the prior cases discussed, but the ability for LEC convection to orient itself in a long training band compensated to produce high rainfall amounts. The convective elements within the band displayed LEC signatures for several hours (Fig. 8). This case, perhaps due to the greater instability, produced several cloud-to-ground lightning strikes with LEC convection. Satellite presentation was also unlike the previously discussed cases in that a large shield of very cold cloud tops (less than -75°C) developed and expanded during the peak of the excessive rainfall event (Fig. 9). These cloud tops were associated with the band of LEC convection and were several degrees colder than cloud tops produced by HEC convection. Lancaster, TX This catastrophic flash flood event occurred during the overnight hours of 28 July 2004, and primarily affected the Dallas, TX suburb of Lancaster. Widespread convection occurred for several hours and produced storm total rainfall amounts of almost 30 cm (12 in), with several rain gauges recording over 20 cm (8 in) of rain in just two hours. Almost $26 million in damage was incurred and over 120 high water rescues performed. Tragically, three fatalities occurred when persons drove across flooded roadways. This event was also unique in that large hail was reported in the vicinity of LEC convection. Accuracy of radar rainfall estimates fluctuated dramatically during the event as convective cells transitioned between HEC and LEC modes. High density rain gauge reports confirmed that rainfall with LEC cells was significantly underestimated by the radar, while rainfall estimates from HEC convection were accurate. The atmosphere during this event was weakly sheared and moderately unstable. High updraft velocities allowed for the development of severe hailstones at times. Analysis of the upper air observation from FWD three hours before the event occurred shows precipitable water at 53 mm (2.1 in) associated with a nearly saturated airmass (Fig. 10). The warm-cloud layer depth was over 6 km.

The excessive rainfall event primarily occurred between the hours of 0300 UTC and 0600 UTC when the convection across southern Dallas County transformed from HEC into LEC, and rainfall rates reached 10 cm (4 in) per hour. Figure 11 shows a cross section through the same region over the course of two hours and the transformation from HEC to LEC is seen. During this time radar rainfall estimates which were reasonably accurate, began to underestimate by a factor of two. Numerous CG lightning strikes were detected between 0300 UTC and 0400 UTC, primarily associated with the HEC high precipitation supercell, also dramatically diminished in frequency as the LEC transformation occurred (Fig. 12). Meanwhile, just like the 19 March 2006 case, IR satellite depicted an expanding shield of very cold cloud tops after 0300 UTC reaching -79°C (not shown). East Central MO The East Central Missouri case was very similar to the previous two events. Just to the southwest of the St. Louis, Missouri, metropolitan area during the overnight hours of 6 May 2000, widespread convection developed near a remnant convectively induced mesoscale vorticity center. The convective complex was quasi-stationary and produced over 30 cm (12 in) of rain in 9 hours and led to flash flooding that caused two fatalities and over $100 million in damage. A RUC-II skew-T diagram shows the atmosphere was weakly unstable and nearly saturated with a wam-cloud depth over 5.5 km (Fig. 13). Both LEC and HEC structures were evident on radar cross sections throughout the course of the event (not shown). Lightning strikes did occur, but were primarily associated with convection that had HECs. IR satellite depicted a large canopy of cold cloud tops. For additional information and images, refer to research completed by Glass et al. in 2001 or Schumacher and Johnson in 2008. 5.1 Discussion of case studies Some significant differences are apparent between the first three cases and the last three, despite occurring in very similar environments. These differences were apparent not only in the real-time remote sensing data,
but also in the size of the area where excessive rainfall occurred. The cases where little to no lightning was present and warm tops existed on IR satellite tended to produce localized flooding. Several lightning strikes were present with LEC cells in the last three cases, and satellite data showed large and expansive shields of very cold cloud tops. In these cases, radar confirmed that the convection was very tall and reached well into the upper troposphere. Because lightning discharges occurred, a combination of graupel and strong updraft velocities must have been present in the upper portions of the LEC cells. While the potential for unwarned flash flood events diminished for the last three cases, the magnitude of these episodes could easily be overlooked due to widespread underestimation of radar rainfall estimates. Despite the varying height of cell tops, all reflectivity for the investigated LEC cells from all six events did not contain values greater than 60 dBZ. This suggests that solid phase water was limited or confined to the tops of the cells where it did not contribute or interfere with collision-coalescence precipitation process. When lightning was present, CG flash rates were much lower in the LEC convection compared to nearby convection with HECs. We propose unique terminology to differentiate the primary physical processes occurring in the first three cases versus the last three. The first three cases, called pure warm-rain events, involved isolated convective cells where only collision-coalescence was contributing to precipitation. The second set, or last three cases, will be referred to as the warm-rain hybrid events. Collision-coalescence obviously dominated the precipitation production, but some elements of ordinary continental convection were also occurring. Specifically, the warm-rain hybrid cases were not shallow, had stronger updraft velocities, and were not devoid of quantities of ice within the upper portions of convective cells. 6. ENHANCEMENTS TO OPERATIONAL IDENTIFICATION METHODS By expanding on the definition of LEC convection, we hope to create a better conceptual model that will allow for better recognition in real-time in both the pure warm-rain and warm-rain hybrid cases.

The most important addition to the definition of LEC will be that no reflectivity higher than 60 dBZ is allowed anywhere in the cell. The cell should have increasing reflectivity as height decreases and exhibit no tilt in the vertical structure. Reflectivity values less than 35 dBZ above the -10°C level appear to be inconsequential to warm-cloud precipitation production. In all cases the LEC was identified primarily through the use of a cross section. While the cross section is an excellent tool in which to identify a cell with a LEC, it is not feasible to perform a cross section of all convective cells. We will demonstrate better techniques to identify LEC cells on a plan view, and reserve the use of cross sections as a final test on any suspect cells. Use of VIL density is a highly effective measure to determine LEC cells on a plan view. High VIL density has been used as a tool for severe hail diagnostics (Amburn and Wolf 1997). Using the same technique of comparing max VIL versus max echo top on LEC cells resulted in low values of VIL density. A VIL density chart is provided in Appendix I. All LEC convection in our cases had a VIL density at or lower than 2.0 kg m-3 and was an excellent way to screen out HEC or ordinary convective cells on a plan view. The Dallas 2006 case was an example where VIL density was very low (sometimes below 1.0 kg m-3) with LEC convection with severe convection having very large values in excess of 4.0 kg m-3 (Fig. 14). From the VIL density logic (and the fact convection is rarely taller than 60,000 ft), cells with a VIL greater than 35 kg m-2 would have a VIL density higher than 2.0 kg m-3 threshold. LEC cells with excessive rain rates usually displayed a steady-state maximum reflectivity between 45 and 55 dBZ on the composite reflectivity. Forecasters should be alert for cells that display a life cycle of maximum reflectivity values within this range. It is a signal that the drop size diameter in the DSD has reached its theoretical collision-coalescence maximum centered at 2 to 3 mm and will be severely underestimated by normal convective Z-R relationships. A word of caution: cells containing greater than 60 dBZ echoes may have large areas of 45 to 55 dBZ too, but the presence of large diameter hydrometeors suggests the DSD is characterized by a small number of large hydrometeors not produced by collision-coalescence. Using composite
reflectivity to find any indication of reflectivity greater than 60 dBZ within a cell will quickly eliminate convection with too much ice infused into the precipitation production process. In the cases examined, cells that had reflectivity greater than 60 dBZ produced high rainfall rates, but were adequately estimated by standard convective Z-R relationships. Having identical looking composite reflectivity and low level (or 0.5 deg) base reflectivity products was also an easy way to find LEC cells. The composite reflectivity is the maximum reflectivity scanned by the radar in that vertical column (Klazura and Imy 1993). If that maximum value is identical to the base reflectivity, it suggests a “bottom-heavy” structure with no tilted structure in the vertical. Tracking the height of the 50 dBZ echo to find LEC cells is an incomplete measure, and should not be used. This method ignores the fundamental reflectivity structure required and does not acknowledge whether reflectivity values greater than 60 dBZ exist. Lightning strikes occur with LEC convection especially in the warm-rain hybrid cases. Lightning strikes should be few in number compared to any surrounding “ordinary” convection with a HEC signature. IR satellite imagery can be used to key in on the hybrid case. A large area of expanding cold cloud tops may be indicative of a warm-rain hybrid event with widespread excessive rainfall rates occurring. Cold cloud tops have already been used to recognize excessive rainfall rates by the satellite hydro-estimator (Scofield and Kuligowski 2003). 7. CONCLUSION Six excessive rainfall events across the central United States were studied in order to identify common traits and characteristics of convective events where collision-coalescence dominates as the primary precipitation mechanism. Several atmospheric parameters must be favorable for this type of precipitation process to organize, yet in many cases the real-time radar, satellite, and lightning data must be analyzed for each cell to determine whether it is occurring. A few of the case study examples showed that a cell’s updraft characteristics can change the mechanism that produces the precipitation. Forecasters must be able to

quickly identify convection with LECs with real-time data sources in order to make accurate and timely warning decisions. The LEC definition has been enhanced to make recognition of the signature more robust for both the pure warm-rain and the warm-rain hybrid cases. Additional limitations on maximum reflectivity were added to the definition and it was shown that weak reflectivity values in sub-freezing parts of the storm are an acceptable characteristic. In order to make identification of these types of cells easier in real-time we’ve suggested use of VIL density and composite reflectivity products to be used in addition to reflectivity cross sections. It is the hope that this research will make recognition of convection with LEC signatures easier thereby reducing the potential for unwarned flash flood events. 8. APPENDIX I
9. REFERENCES
Amburn, S. A., and P. L. Wolf, 1997: VIL density as a hail indicator. Wea. Forecasting, 12, 473-478.
Atlas, D., and C.W. Ulbrich, 2000: An Observationally Based Conceptual Model of Warm Oceanic Convective Rain in the Tropics. J. Appl. Meteor., 39, 2165–2181.
Baeck, M.L., and J.A. Smith, 1998: Rainfall Estimation by the WSR-88D for Heavy Rainfall Events. Wea. Forecasting, 13, 416–436.
Battan, L.J., and R.R. Braham, 1956: A STUDY OF CONVECTIVE PRECIPITATION BASED ON
CLOUD AND RADAR OBSERVATIONS. J. Atmos. Sci., 13, 587–591.
Benjamin, S.G., D. Dévényi, S.S. Weygandt, K.J. Brundage, J.M. Brown, G.A. Grell, D. Kim, B.E. Schwartz, T.G. Smirnova, T.L. Smith, and G.S. Manikin, 2004: An Hourly Assimilation–Forecast Cycle: The RUC. Mon. Wea. Rev., 132, 495–518.
Bringi, V.N., V. Chandrasekar, J. Hubbert, E. Gorgucci, W.L. Randeu, and M. Schoenhuber, 2003: Raindrop Size Distribution in Different Climatic Regimes from Disdrometer and Dual-Polarized Radar Analysis. J. Atmos. Sci., 60, 354–365.
Caracena, F., R.A. Maddox, L.R. Hoxit, and C.F. Chappell, 1979: Mesoanalysis of the Big Thompson Storm. Mon. Wea. Rev., 107, 1–17.
Davis, R. S., 2001: Flash flood forecast and detection methods. Severe Convective Storms, Meteor. Monogr., No. 50, Amer. Meteor. Soc., 481–525.
Davis, 2004: The impact of tropical rainfall rates on flash flood detection. Preprints Twenty-second Conf. on Severe Local Storms, Amer. Meteor. Soc., Hyannis, MA.
Doswell, C.A., H.E. Brooks, and R.A. Maddox, 1996: Flash Flood Forecasting: An Ingredients Based Methodology. Wea. Forecasting, 11, 560–581.
Doviak, R. J. and D. S. Zrnic, Doppler Radar and Weather Observations, Academic Press. Second Edition, San Diego. al., 1993 p. 562.
Glass, F.H., J.P. Gagan, and J.T. Moore, 2001: The Extreme East-Central Missouri Flash Flood of 6-7 May 2000. Preprints, 1st Precipitation Extremes Conf. 81st AMS Annual Meetings, Albuquerque NM.
Kelsch, M., and R. Koehler: 2004: Flash Flood Warning Technology and Metrics. Preprints, 22nd Conference on Severe Local Storms, AMS, compact disk.
Klazura, G.E., and D.A. Imy, 1993: A Description of the Initial Set of Analysis Products Available from the NEXRAD WSR-88D System. Bull. Amer. Meteor. Soc., 74, 1293–1311.

Klett, J., and M. Davis, 1973: Theoretical Collision Efficiencies of Cloud Droplets at Small Reynolds Numbers. J. Atmos. Sci., 30, 107–117.
Lamb, D., 2001: Rain production in convective storms. C.A. Doswell, ed., Meteorological monographs: severe convective storms, American Meteorological Society, vol. 28, chap. 8, pp. 299 321.
Marshall, J., and W.M. Palmer, 1948: THE DISTRIBUTION OF RAINDROPS WITH SIZE. J. Atmos. Sci., 5, 165–166.
National Weather Service, 2008: WSR-88D FY08 Distance Learning Operations Course (DLOC), presented by Warning Decision Training Branch. Topic 7, Lesson 17, 231-239. (available at http://wdtb.noaa.gov/courses/dloc/outline.html)
NOAA, 1977-2006: Storm Data. [Available online at http://www4.ncdc.noaa.gov/ cgi-win/wwcgi.dll?wwEvent_Storms.]
Peterson, W. A., and Coauthors, 1999: Mesoscale and radar observations of the Fort Collins flash flood of 28 July 1997. Bull. Amer. Meteor. Soc., 80, 191–216.
Polger, P.D., B.S. Goldsmith, R.C. Przywarty, and J.R. Bocchieri, 1994: National Weather Service Warning Performance Based on the WSR-88D. Bull. Amer. Meteor. Soc., 75, 203–214.
Schoenberg, Ferrier, B., J. Simpson, and W.K. Tao, 1996: Factors Responsible for Precipitation Efficiencies in Midlatitude and Tropical Squall Simulations. Mon. Wea. Rev., 124, 2100–2125.
Schumacher, R.S., and R.H. Johnson, 2008: Mesoscale Processes Contributing to Extreme Rainfall in a Midlatitude Warm-Season Flash Flood. Mon. Wea. Rev., 136, 3964–3986.
Scofield, R. A., and R. J. Kuligowski, 2003: Status and outlook of operational satellite precipitation algorithms for extreme-precipitation events. Mon. Wea. Rev., 18, 1037-1051.
Smith, J. A., M. L. Baeck, M. Steiner, and A. J. Miller (1996), Catastrophic Rainfall from an Upslope Thunderstorm in the Central
Appalachians: The Rapidan Storm of June 27, 1995, Water Resour. Res., 32(10), 3099–3113.
Srivastava, R., 1971: Size Distribution of Raindrops Generated by their Breakup and Coalescence. J. Atmos. Sci., 28, 410–415.
Ulbrich, C.W., and D. Atlas, 2008: Radar Measurement of Rainfall with and without Polarimetry. J. Appl. Meteor. Climatol., 47, 1929–1939.
Wallace, J. M., and P. V. Hobbs, 1977: Atmospheric Science: An Introductory Survey. Academic Press, 350 pp.
Wilson, J.W., and E.A. Brandes, 1979: Radar Measurement of Rainfall—A Summary. Bull. Amer. Meteor. Soc., 60, 1048–1058.

Figure 1. RUC-II initialization skew-T diagram at 0000 UTC 31 August 2003 near Emporia, Kansas. The red line is the temperature while the green line is the dew point profile. The vertical scale on the left is in mb and the horizontal scale is in °C.
Figure 2. Surface analysis for 0000 UTC 31 August 2003. Isobars are solid black lines intervaled at 2 mb. The dashed black line indicates a trough and the alternating blue and red pips indicate a quasi-stationary front. The states of Kansas and Oklahoma are outlined and the location of the LEC cell is circled in red for reference.

Figure 3a. Reflectivity image at 0030 August 31 2003 centered on LEC cell. White line indicates the orientation of the cross section in Fig 3b.
Figure 3b. North to south cross section of 31 August 2003 LEC cell. Solid white line shows -10°C isotherm. Horizontal gray lines are drawn every 3048 m (10 Kft).
Figure 4. Enhanced GOES-IR satellite imagery for 0045 31 August 2003. The location of the LEC storm is indicated by the white circle. Cloud top color shading indicates temperatures warmer than -45°C.
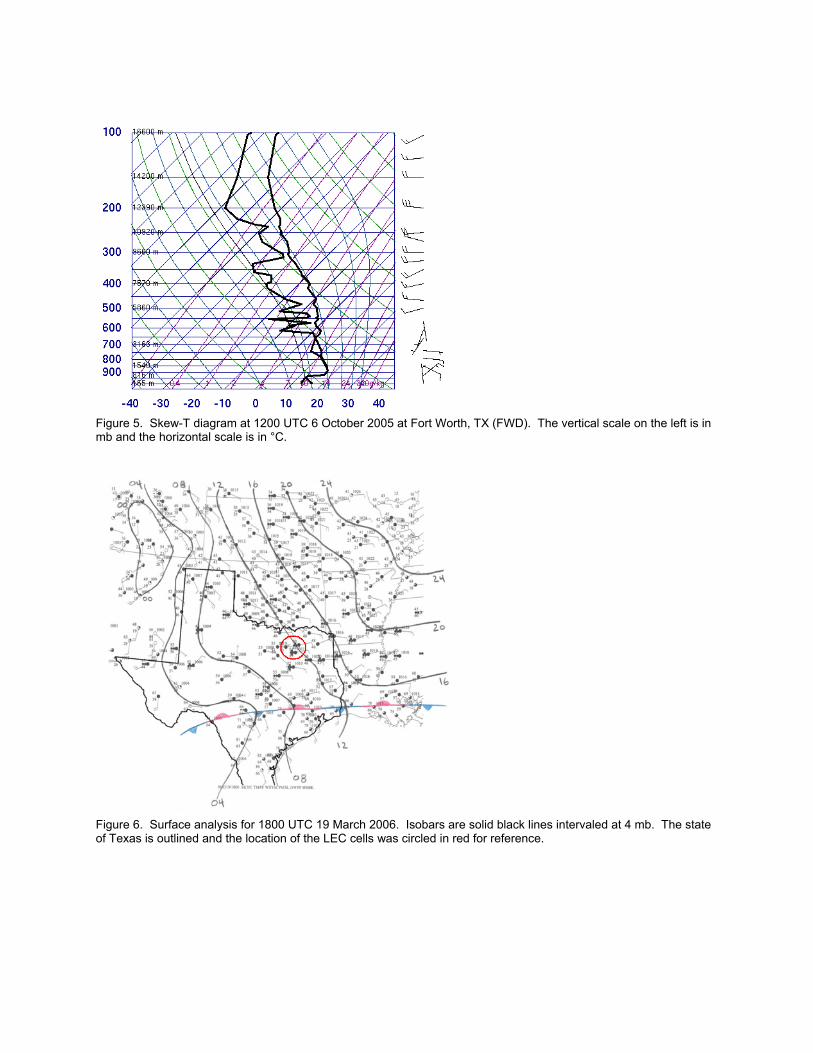
Figure 5. Skew-T diagram at 1200 UTC 6 October 2005 at Fort Worth, TX (FWD). The vertical scale on the left is in mb and the horizontal scale is in °C.
Figure 6. Surface analysis for 1800 UTC 19 March 2006. Isobars are solid black lines intervaled at 4 mb. The state of Texas is outlined and the location of the LEC cells was circled in red for reference.

Figure 7. Skew-T diagram at 0000 UTC 20 March 2004 at Fort Worth, TX (FWD). The vertical scale on the left is in mb and the horizontal scale is in °C.
Figure 8a. Reflectivity image at 2005 UTC 19 March 2006 centered on Dallas County. Cyan line indicates the orientation of the cross section in Fig 8b.
Figure 8b. SW to NE reflectivity cross section of Dallas county convection at 2005 UTC on 19 March 2006. Solid white line shows -10°C isotherm. Horizontal gray lines are drawn every 3048 m (10 Kft).

Figure 9. Enhanced GOES-IR satellite imagery for 1901 UTC 19 March 2006. Cloud top color shading of red indicates temperatures colder than -60°C.
Figure 10. Skew-T diagram on 0000 UTC 29 July 2004 at Fort Worth, TX (FWD). The vertical scale on the left is in mb and the horizontal scale is in °C.

Figure 11. West to East reflectivity cross section across southern Dallas County centered over Lancaster, Texas on 29 July 2004 at: a) 0340 UTC; b) 0410 UTC; c) 0440 UTC; d) 0510 UTC. The white line indicates the -10°C environmental temperature level. Notice the transition from tilted HEC structure with hail core in a) to classic LEC structure in c) and d).
Figure 12. Cloud-to-ground lightning strike totals per 15 minutes associated with Dallas County convection from 0300 UTC to 0600 UTC on 29 July 2004. By 0415 UTC CG flash rate had diminished to less than 200 per 15 minutes as the convection transitioned into LEC mode.
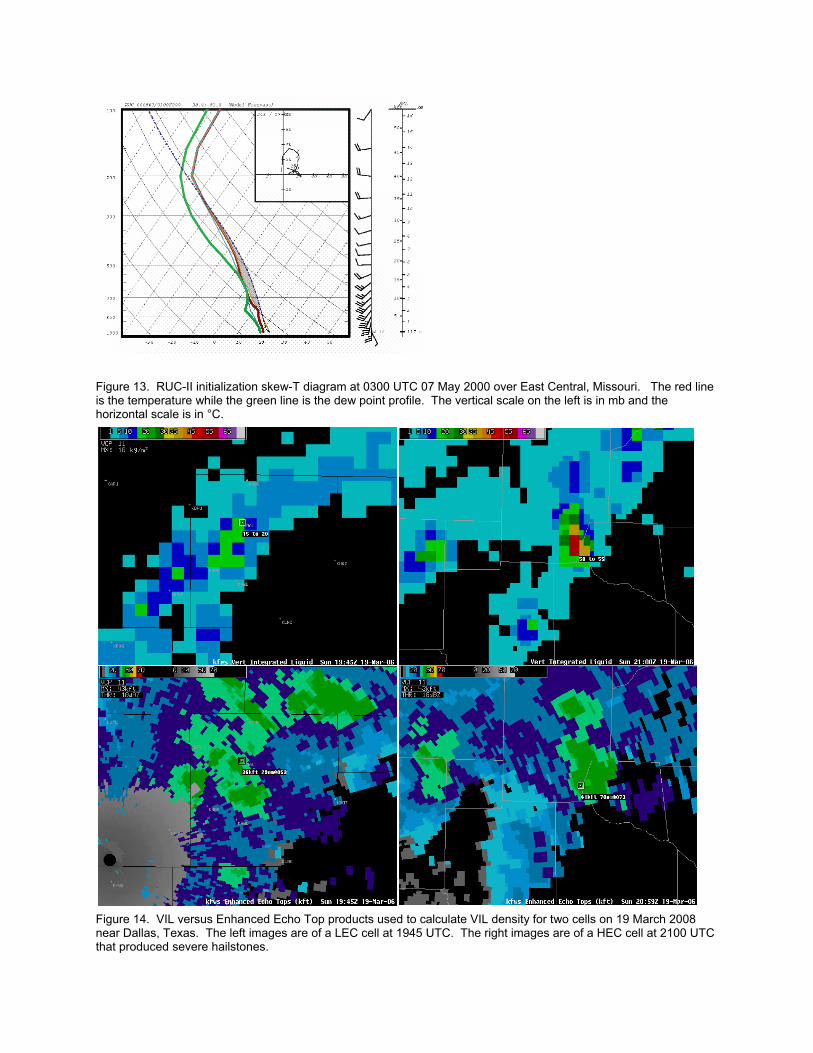
Figure 13. RUC-II initialization skew-T diagram at 0300 UTC 07 May 2000 over East Central, Missouri. The red line is the temperature while the green line is the dew point profile. The vertical scale on the left is in mb and the horizontal scale is in °C.
Figure 14. VIL versus Enhanced Echo Top products used to calculate VIL density for two cells on 19 March 2008 near Dallas, Texas. The left images are of a LEC cell at 1945 UTC. The right images are of a HEC cell at 2100 UTC that produced severe hailstones.